avinash kumar agarwal rashmi avinash agarwal tarun gupta
TRANSCRIPT

Green Energy and Technology
Avinash Kumar AgarwalRashmi Avinash AgarwalTarun GuptaBhola Ram Gurjar Editors
BiofuelsTechnology, Challenges and Prospects

Green Energy and Technology

More information about this series at http://www.springer.com/series/8059

Avinash Kumar AgarwalRashmi Avinash AgarwalTarun GuptaBhola Ram GurjarEditors
BiofuelsTechnology, Challenges and Prospects
123

EditorsAvinash Kumar AgarwalDepartment of Mechanical EngineeringIndian Institute of Technology KanpurKanpur, Uttar PradeshIndia
Rashmi Avinash AgarwalDepartment of ChemistryIndian Institute of Technology KanpurKanpur, Uttar PradeshIndia
Tarun GuptaDepartment of Civil EngineeringIndian Institute of Technology KanpurKanpur, Uttar PradeshIndia
Bhola Ram GurjarDepartment of Civil Engineering, Centrefor Transportation Systems (CTRANS)
Indian Institute of Technology RoorkeeRoorkee, UttarakhandIndia
ISSN 1865-3529 ISSN 1865-3537 (electronic)Green Energy and TechnologyISBN 978-981-10-3790-0 ISBN 978-981-10-3791-7 (eBook)DOI 10.1007/978-981-10-3791-7
Library of Congress Control Number: 2017930135
© Springer Nature Singapore Pte Ltd. 2017This work is subject to copyright. All rights are reserved by the Publisher, whether the whole or partof the material is concerned, specifically the rights of translation, reprinting, reuse of illustrations,recitation, broadcasting, reproduction on microfilms or in any other physical way, and transmissionor information storage and retrieval, electronic adaptation, computer software, or by similar or dissimilarmethodology now known or hereafter developed.The use of general descriptive names, registered names, trademarks, service marks, etc. in thispublication does not imply, even in the absence of a specific statement, that such names are exempt fromthe relevant protective laws and regulations and therefore free for general use.The publisher, the authors and the editors are safe to assume that the advice and information in thisbook are believed to be true and accurate at the date of publication. Neither the publisher nor theauthors or the editors give a warranty, express or implied, with respect to the material contained herein orfor any errors or omissions that may have been made. The publisher remains neutral with regard tojurisdictional claims in published maps and institutional affiliations.
Printed on acid-free paper
This Springer imprint is published by Springer NatureThe registered company is Springer Nature Singapore Pte Ltd.The registered company address is: 152 Beach Road, #21-01/04GatewayEast, Singapore 189721, Singapore

Preface
Current energy scenario clearly suggests that oil and gas reserves are finite and willlast only few more decades. Therefore, massive research efforts are underwayglobally for developing energy from resources with lower carbon footprint forsustainable development and environmental protection. In order to ensure energysecurity and to reduce impact of global and local pollution from fossil fuels,utilization of biofuels has been adopted as an immediate solution. Biofuels play animportant role in the future scientific research portfolio, which will affect energyindependence and energy security, revitalize rural infrastructure and shift energylandscape of the twenty-first century towards greater sustainability and towards lowcarbon-intensity. Discussing multidisciplinary research dimensions of bioenergyand its potential for replacing fossil fuels in coming decades, this monographprovides a roadmap for understanding broad sweep of technological, sociological,and energy policy issues that intermingle and intertwine. Biotechnology andespecially synthetic biology can play a key role in promoting sustainable productionand use of bioenergy through development of next-generation biofuels from locallyavailable biomass feedstocks using advanced sunlight-to-biomass-to-bioenergyconversion processes. Socio-economic and environmental challenges need to beduly considered while designing these technological solutions. This monographcovers such advanced techniques for efficient production of biofuels from locallyavailable raw biomaterials and their utilization in IC engines and power generatingequipment.
An international workshop, 3rd ISEES Workshop on “Sustainable Energy,Environment & Safety with Railway Centric Theme”, was held at Research Designsand Standards Organisation (RDSO), Lucknow, India from December 21 to 23,2015 under the aegis of International Society for Energy, Environment andSustainability (ISEES). This workshop provided a platform for discussions betweeneminent scientists and engineers from various countries including India, USA,South Korea, Thailand, and Austria. In this workshop, eminent speakers presentedtheir views related to different aspects of biofuels, and alternative energy resourcefor sustainable development and cleaner environment. This research monographis based on the topics covered at the workshop, and brings together a wealth
v

of knowledge from renowned experts on the latest developments in selectedtechnology domains with a focus on fundamentals, applications, and advancedteaching pedagogy. Main areas covered in this monograph are biofuels and theiradvantages, advanced biofuel production techniques and their utilization in varioussectors such as transportation and power generation. This monograph also includesmethodologies of increasing biofuel yield from different resources. Research onusing biofuel blended with conventional fossil fuels for power generation is alsopresented. In addition, novel technology developments in biofuel production frommicroalgae are also discussed.
The editors would like to express their sincere gratitude to the authors forsubmitting their work in a timely manner and revising it appropriately at a shortnotice. We would like express our special thanks to Dr. Bhaskar Thallada, Dr.S. Venkata Mohan, Prof. Ashok Pandey, Prof. Atul Dhar, Prof. Santanu De, Prof.V.S. Moholkar, Prof. Dhananjay Srivastava, and Akhilendra Pratap Singh, whoreviewed various chapters of this monograph and provided their valuable sugges-tions to improve the draft manuscripts. We acknowledge the support received fromvarious funding agencies and organizations for the successful conduct of the ISEESworkshop, where these monographs germinated. These include Science andEngineering Research Board, Department of Science and Technology, Governmentof India (Special thanks to Dr. Sanjay Bajpai); RITES Ltd, India (Special thanks toSh. Pradeep Gupta); Office of Naval Research Global, Singapore (Special thanks toDr. Ramesh Kolar); TSI, India (Special thanks to Dr. Deepak Sharma); CaterpillerIndia; AVL India; Dynomerk Controls, India (Special thanks to Sh. Kishore Raut);CEI Softwares, India; ESi Group, Pune; BHEL India; and Bosch India.
This monograph is intended for researchers, practitioners of engineering andtechnology, and we hope that the monograph would be of great interest to theprofessionals involved in biofuels as well as students, government officials, deci-sion makers, policy makers, and civil society organizations interested in renewableenergy and more specifically to those working in biofuel production, optimization,and their utilization in IC engines. Its objective is to promote a better and moreaccurate understanding of the nature, production, challenges, technological status,and usage of biofuels from vegetable oils and algae and to provide an updated andreliable reference and guidebook on biofuels.
Kanpur, India Avinash Kumar AgarwalKanpur, India Rashmi Avinash AgarwalKanpur, India Tarun GuptaRoorkee, India Bhola Ram Gurjar
vi Preface

Contents
Part I General
Introduction to Biofuels . . . . . . . . . . . . . . . . . . . . . . . . . . . . . . . . . . . . . . . 3Avinash Kumar Agarwal, Rashmi Avinash Agarwal, Tarun Guptaand Bhola Ram Gurjar
Sustainable Production of Chemicals and Energy Fuel Precursorsfrom Lignocellulosic Fractions . . . . . . . . . . . . . . . . . . . . . . . . . . . . . . . . . . 7Bhumica Agarwal, Vivek Ahluwalia, Ashok Pandey,Rajender Singh Sangwan and Sasikumar Elumalai
Microbial Electrochemical Platform: Biofactory with DiverseApplications . . . . . . . . . . . . . . . . . . . . . . . . . . . . . . . . . . . . . . . . . . . . . . . . . 35S. Venkata Mohan, G. Velvizhi and P. Chiranjeevi
Biomass-Derived HMF Oxidation with Various Oxidants . . . . . . . . . . . . 51S. Saravanamurugan, Ashok Pandey and Rajender Singh Sangwan
Hydrothermal Liquefaction of Lignocellulosic BiomassComponents: Effect of Alkaline Catalyst . . . . . . . . . . . . . . . . . . . . . . . . . . 69Rawel Singh, Bhavya B. Krishna and Thallada Bhaskar
Pretreatment Strategies of Lignocellulosic BiomassTowards Ethanol Yield: Case Study of Pine Needles . . . . . . . . . . . . . . . . 85Sangeeta Negi
Ultrasound-Assisted Biodiesel Synthesis: A Mechanistic Insight . . . . . . . 103Ritesh S. Malani, Arun Goyal and Vijayanand S. Moholkar
Thermo-Chemical Ethanol Production from AgriculturalWaste Through Polygeneration: Performance AssessmentThrough a Case Study . . . . . . . . . . . . . . . . . . . . . . . . . . . . . . . . . . . . . . . . 137Kuntal Jana and Sudipta De
vii

Microalgae Based Biofuel: Challenges and Opportunities . . . . . . . . . . . . 157Richa Katiyar, Amit Kumar and B.R. Gurjar
Surrogates for Biodiesel: Review and Challenges . . . . . . . . . . . . . . . . . . . 177Aditya Dilip Lele, Krishnasamy Anand and Krithika Narayanaswamy
Response Surface Methodology Based Multi-objectiveOptimization of the Performance-Emission Profileof a CI Engine Running on Ethanol in Blends with Diesel . . . . . . . . . . . 201Probir Kumar Bose, Vijay Narayan Bodkhe, Bishop Deb Barmaand Rahul Banerjee
Effect of Alcohol Blending on Performance of KeroseneFuelled Four-Stroke Spark Ignition Genset . . . . . . . . . . . . . . . . . . . . . . . 229Mritunjay Shukla, Eshan Singh and Sunil Pathak
viii Contents

About the Editors
Prof. Avinash Kumar Agarwal joined IIT Kanpur in2001. He worked at ERC, University of Wisconsin,Madison, USA as a postdoctoral Fellow (1999–2001).His areas of interest include IC engines, combustion,alternative fuels, hydrogen, conventional fuels, lubri-cating oil tribology, optical diagnostics, laserignition, HCCI, emission and particulate control, andlarge bore engines. He has published more than200 peer-reviewed international journal and confer-ence papers. He is associate editor of ASME Journal ofEnergy Resources Technology, and InternationalJournal of Vehicle Systems Modelling and Testing. Hehas edited “Handbook of Combustion” (5 Volumes;3168 pages), published by Wiley VCH, Germany. Heis a Fellow of SAE (2012), Fellow of ASME (2013)and a Fellow of INAE (2015). He is the recipient ofprestigious Shanti Swarup Bhatnagar Prize-2016 inEngineering Sciences.
Dr. Rashmi Avinash Agarwal is a senior researcherat IIT Kanpur. She completed her doctoral degree inInorganic Chemistry from IIT Kanpur in 2014. Shecompleted her M.Sc. in Organic Chemistry fromRajasthan University, Jaipur in 2002 and B.Sc. inChemistry, from Kanoria College, RajasthanUniversity, Jaipur in 2000. She has expertise in coor-dination chemistry, coordination polymers, organicsynthesis, inorganic synthesis, crystal structure deter-mination, supramolecular chemistry, porous materials,topology, florescence, SC (single crystal)-to-SC
ix

transformation, and synthesis of nanoparticles. Dr.Rashmi A. Agarwal has published over 20 researchpapers in leading international journals.
Prof. Tarun Gupta is a PK Kelkar Research Fellowat IIT Kanpur. He completed his Doctor of Science(2004) in Environmental Health from HarvardUniversity, USA. He has been involved in teachingand research activities at IIT Kanpur since June 2006.He has published more than 80 internationalpeer-reviewed journal papers and has filed three Indianpatents. He has received numerous awards andrecognitions such as NASI Scopus Young Scientist(2015), INSA Young Scientist (2011), INAE YoungEngineer (2009), and IEI Young Engineer (2008). Hehas extensively worked on engine emissions andcontrols using development and testing of non-noblemetal catalyst based DOC.
Dr. Bhola Ram Gurjar is Associate Professor andthe Coordinator of the Environmental EngineeringGroup at IIT Roorkee. He holds a PhD inEnvironmental Risk Analysis from IIT Delhi. Hispresent research interests include mega-cities, air pol-lution: environmental impact and risk assessment:atmospheric emissions and climate change; and inte-grated cross-disciplinary study of science and policyissues of the environment, health, energy, economy,technology, and infrastructure and resources particu-larly from the global change, sustainable development,and risk governance perspectives. Dr. Gurjar has (co)authored/(co)edited seven books and more than 100publications. He has received prestigious AdvancedPostdoctoral Research Fellowship of the Max PlanckSociety (Germany) (2002–2005) and UKIERI Grant.He is also co-recipient of the Nawab Zain Yar JungBhadur Memorial Medal (best research paper award)from Environmental Engineering Division of theInstitution of Engineers (India) Kolkata, for the year1995–1996.
x About the Editors

Part IGeneral

Introduction to Biofuels
Avinash Kumar Agarwal, Rashmi Avinash Agarwal, Tarun Guptaand Bhola Ram Gurjar
Abstract Sustainable energy source and cleaner environment is the most importantrequirement for developing countries. In India, total primary energy consumptionwas *0.5 BTOE in 2008, which is expected to rise up to *1.2 BTOE by 2035. Insuch a scenario, biofuel utilization program seems to be a promising solutionbecause biofuels are relatively cleaner and can be produced from indigenousresources available locally. However availability and continuous supply are themost challenging tasks for the countrywide implementation of biofuels program. Insuch a scenario, advanced techniques of biofuel production includingbio-technology route seem to have significant potential for the energy security infuture. This monograph covers practical aspects of biofuel production, utilisation,challenges and limitations and outlines the strengths and constraints of differentbiofuel production techniques.
Keywords Biofuels � Hydrothermal liquefaction � Microalgae � Biodiesel �Bioprocessing
Large quantities of low carbon fuels are required to meet increasing global energydemand and drive to achieve climate change goals. Electricity and hydrogen appear
A.K. Agarwal (&)Department of Mechanical Engineering, Indian Institute of Technology Kanpur,Kanpur 208016, Uttar Pradesh, Indiae-mail: [email protected]
R.A. AgarwalDepartment of Chemistry, Indian Institute of Technology Kanpur,Kanpur 208016, Uttar Pradesh, India
T. GuptaDepartment of Civil Engineering, Indian Institute of Technology Kanpur,Kanpur 208016, Uttar Pradesh, India
B.R. GurjarDepartment of Civil Engineering, Indian Institute of Technology Roorkee,Roorkee 247667, Uttaranchal, India
© Springer Nature Singapore Pte Ltd. 2017A.K. Agarwal et al. (eds.), Biofuels, Green Energy and Technology,DOI 10.1007/978-981-10-3791-7_1
3

to be potentially attractive fuels for light-duty vehicles, however these energycarriers may not be suitable for heavy-duty transport applications and for agricul-tural applications in rural areas. Therefore many alternatives transport fuels arebeing considered, which include natural gas, liquefied petroleum gas, hydrogen,unconventional fossil oils, electricity, Fischer-Tropsch liquids, ethers, alcohols,biodiesels, etc. Amongst these test fuels, biofuels are a promising solution becausethey can be produced directly from biomass
About the biofuels, Henry Ford predicted in 1925, “The fuel of the future isgoing to come from fruit like that sumac out by the road, or from apples, weeds,sawdust—almost anything. There is fuel in every bit of vegetable matter that can befermented”.
EPA report shows that use of renewable fuel results in 20% savings in GHGemissions, which can be further improved up to 60% if biofuels are produced fromcellulosic biomass. Therefore several countries have adopted different measures tointroduce biofuels, depending on their resource base. Two most common types ofbiofuels in use today are ethanol and biodiesel. Use of lower gasoline-alcoholblends in SI engine results in reduction in CO, HC and NOx emissions, whileproducing almost similar torque output. Alcohol blends can also be used in CIengines as a supplementary fuel. The Green Paper of the European Commissionproposed 20% substitution of conventional fossil fuels by alternative fuels in theroad transport sector by the year 2020. Directive 2003/30/EC requires EU memberstates sets indicative targets for biofuel sales and the reference values were 2%biofuels penetration in petrol and diesel by 2005, increasing to 5.75% by 2010.Biofuel policy of Indian government targets 20% blending of biofuels, both bio-diesel and bio-ethanol by 2017. In 2010, India launched a National EthanolBlending Programme, thus establishing a 5% mandatory ethanol blending in 20states across the country. As rising crude oil prices and increasing energyrequirements put huge burden on economy, continuation of blended transport fuelsmay offer some immediate relief. However alcohol availability remains a keychallenge for this program’s success. Conflict between energy and food security isyet another challenge for biofuels because most of the first generation biofuels areproduced from food-crops. Therefore producing biofuels from agricultural waste(e.g. rice straw) using thermo-chemical process may be a sustainable option throughrecycling of waste. Second generation bioethanol can be produced by breakdown ofcellulosic biomass in several steps including hydrolysis and finally fermentation toproduce bioethanol. Presently researchers are focusing on third generation biofuels,which can be produced using bio-reactors for ethanol and transesterification forbiodiesel. Research into production of liquid transportation fuels from micro-algaeis also gaining importance throughout the world. These micro-organisms use solarenergy to combine carbon dioxide with water and create biomass more efficientlyand rapidly than terrestrial plants. Biofuels from microalgae are also attractingresearchers due to their ‘carbon neutral’ nature because the carbon generated in thefuel combustion is almost neutralized by the CO2 consumption during microalgaegrowth.
4 A.K. Agarwal et al.

This monograph explores such key technologies, including biotechnology,bioprocessing, and thermo-chemical process, which show a sustainable future ofbiofuels. The future of biofuels from a broader perspective needs appropriateaddressing of the economic, social, and environmental issues, which are critical forthe sustainable development of bioenergy. This monograph contains 12 chapters,which include introduction of biofuels, optimization of biofuel production tech-niques, advanced techniques for biofuel production and biofuel utilization. Theseare as follows
• Introduction• Sustainable production of chemicals and energy fuel precursors from
lignocellulosic• Microbial electrochemical platform: Biofactory with diverse applications• Biomass-derived HMF oxidation with various oxidants• Hydrothermal liquefaction of lignocellulosic biomass components: Effect of
alkaline Catalyst• Pretreatment strategies of lignocellulosic biomass towards ethanol yield: Case
study of pine needles• Ultrasound-assisted biodiesel synthesis: A mechanistic insight• Thermo-chemical ethanol production from agricultural waste through poly-
generation: Performance assessment through a case study• Microalgae Based Biofuel: Challenges and opportunities• Surrogates for biodiesel: Review and challenges• Response surface methodology based multi-objective optimization of the
performance-emission profile of a CI engine running on ethanol in blends withdiesel
• Effect of alcohol blending on performance of kerosene fuelled four-stroke sparkignition genset
This monograph shows the optimization of ethanol production process using anefficient integrated multi-utility system called polygeneration, which is beneficialfor the environment. This chapter presents the suitability of the process usingthermodynamic, economic and environmental performance assessment. To improvebiofuel production process, several novel techniques have been discussed in onechapter. Microbial catalyzed electro-chemical systems (MES) can be used fordegradation of organic carbon present in the waste. This technique utilizes a bio-catalyst and generates the reducing equivalents in the form of redox carriers.
Another chapter presents the role of individual biomass components (celluloseand lignin) on the production of hydrocarbons during hydrothermal liquefaction(HTL) of ligno-cellulose, which is composed of mainly three components, namely:cellulose, hemicellulose and lignin. Main focuss of this chapter is to promote thethird generation biofuel production using microalgae. Microalgae can produce highoil yields compared to other terrestrial plants. Microalgae requires non-cultivablesoil and waste water for cultivation, which reduces overall cost of production.Bioprocessing of lignocellulose using chemical catalysis is an impressive
Introduction to Biofuels 5

methodology for biofuel synthesis. One chapter provides an account of valueaddition to biomass via chemical catalysis of cellulosic, hemicellulosic and ligninfractions towards product chemical’s synthesis.
The climate change is presently an important element dictating energy usepattern and energy resource development. Biodiesel is considered “climate neutral”because all of carbon dioxide released during consumption is sequestered out of theatmosphere in advance during the crop growth in the previous crop-cycle. Biodieselis an alternative to conventional diesel, and is made from renewable resources, suchas non-edible vegetable oils, algae and animal fat. To optimize biodiesel produc-tion, exact physical mechanism of ultrasound-induced enhancement of biodieselsynthesis is also described in a chapter. Analysis of physical mechanism ofultrasound-assisted biodiesel synthesis is discussed, which provides links betweenphysical and chemical effects of ultrasound and cavitation, and the basic chemistryof biodiesel synthesis.
For better utilization of biofuels, few experimental studies are also discussed inthis monograph, in which the effect of ethanol-diesel blends on the engine per-formance and emission characteristics have been discussed. Researchers exploredthe potential of biodiesel to completely or partially replace mineral diesel in a CIengine. For better understanding of biodiesel combustion in CI engines, develop-ment of reaction kinetics to describe its oxidation using surrogates plays a crucialrole. This monograph also includes a chapter on review of the existing studieswherein different surrogates for biodiesel are discussed at length.
6 A.K. Agarwal et al.

Sustainable Production of Chemicalsand Energy Fuel Precursorsfrom Lignocellulosic Fractions
Bhumica Agarwal, Vivek Ahluwalia, Ashok Pandey,Rajender Singh Sangwan and Sasikumar Elumalai
Abstract From time immemorial, bioprocessing of lignocelluloses via chemicalcatalysis has been an impressive methodology of numerous value added com-modities and energy fuel precursors (drop-in-fuel) synthesis. The most commontechnique for biomass fragmentation is catalytic hydrolysis using various acidcatalysts covering inorganic or organic liquid acids as well as solid acids (hetero-geneous). Most research in the past decade has been focused on cost-effectiveproduction of such biomass derived commodities with the aim of their commer-cialization. Till date, in order to improve final product yields and minimize pro-duction costs, various improvised production schemes have been developed likepretreatment methods for improved saccharification and displacement and/orreconstruction of recalcitrant biomass constituents, such as lignin to improveaccessibility, employing multi-functional catalysts to promote single stage trans-formations, continuous extraction of desired product by use of specific solvents toimprove product stability as well as to inhibit by-product formation, integration ofphysical processes for example microwave and ultrasonic irradiation resulting indecreased residence time, etc. With these technological advancements, researchershave overcome substantial limitations associated with lignocellulose transformationincluding mass-transfer hindrances and expensive downstream processing; as aresult a wide array of commercially important chemicals and fuel precursors havebeen synthesised. The chapter provides an account of value addition to biomass viachemical catalysis of cellulosic, hemicellulosic and lignin fractions towards productchemicals synthesis.
Keywords Lignocellulose � Chemical catalysis � Biorefining � Fuel precursors �Value-added chemicals
B. Agarwal � V. Ahluwalia � A. Pandey � R.S. Sangwan � S. Elumalai (&)Center of Innovative and Applied Bioprocessing (CIAB),Mohali 160071, Punjab, Indiae-mail: [email protected]
© Springer Nature Singapore Pte Ltd. 2017A.K. Agarwal et al. (eds.), Biofuels, Green Energy and Technology,DOI 10.1007/978-981-10-3791-7_2
7

1 Introduction
Till date, most of the worlds’ energy requirements are met from one or the otherform of conventional petroleum derived fossil fuels. Apart from its main applicationin the transportation sector and machinery energy resources, fossil reserves alsoplay an important role in synthesis of industrial chemicals and solvents. However,regrettably, near depleting fossil reserves increases energy insecurity along withexcessive greenhouse gas emissions (GHCs), evolved due to incombustiblehydrocarbons. In order to tackle this fast energy crisis, worldwide many scientistshave believed that biomass derived fuel chemicals (second generation cellulosicfuels) are the sustainable energy source to satisfy both energy replacement and netzero carbon emissions. With expectation, over the past few decades, biorefining oflignocellulose feedstock is attracting worldwide interest. According to the recentsurvey, global biomass production is estimated to be 1.7–2.0 � 1011 tons per year[27]. Considering the current policy scenarios of India, its primary energy demandis postulated to double in the next two decades i.e., from 750 MTOE in 2011 to1469 MTOE in 2030 [32]. Contrarily, India’s biofuel production currently accountsfor nearly 1% of global production, which estimates for approximately 127.7 billionlitres. The major source of first-generation bio-ethanol in India remains molasses, aby-product of sugar industry. While for second generation biofuels, sugarcanebagasse and leaves, rice straw and husk and wheat straw accounts most of theagricultural residues (crop residues) generated in India [16].
Around world, the abundancy of lignocellulosic biomass is widely distributed asenergy crops (e.g., switchgrass and short rotation woody crops), forestry residues(e.g., branches and unused trees), agricultural residues (e.g., straws and stover), andindustrial residues (e.g., sawdust and brewers spent grains). In general, the inherentbiomass comprises up to 75% carbohydrate sugars in the form of cellulose andhemicelluloses, and therefore, represents a store of abundant sugar polymers labileto be converted into specialty chemicals. Thus, making it an ideal feedstock forsustainably renewable energy applications [75]. In broad classification, lignocel-lulosic conversion methodologies are thermal, thermochemical and biochemicalconversions, and in specific each method is employed for appropriate feedstocktypes and resulting specific end product yield. Although most of these technologiesare at pre-commercial stage, production of bio-ethanol from biomass feedstocks iswell established (biochemically) and fully commercialized. Industrial-scale syn-thesis of lactic acid via fermentation of glucose is also established on the market.Undoubtedly, the usefulness of biomass-based chemicals is realized in biorefineries(Fig. 1), where transformation of lignocellulosic feedstocks into value-addedproducts is envisaged by sequential transformations of a set of biomass derivativemolecules, the so-called platform molecules (or building blocks). The USDepartment of Energy (DOE) in 2004 identified top 12 building blocks as1,4-diacids (succinic, fumaric and malic), 2,5-furan dicarboxylic acid, 3-hydroxypropionic acid, aspartic acid, glucaric acid, glutamic acid, itaconic acid, levulinicacid, 3-hydroxybutyrolactone, glycerol, sorbitol, and xylitol/arabinitol, which can
8 B. Agarwal et al.

be produced from biomass derived sugars via sequential chemical or biochemicalprocessing steps [81]. Later, few other important platform molecules have beenincluded in the list, such as fatty acids, fatty acid alky esters and triglycerides [21].Thus, this chapter takes into account production strategies of few important plat-form molecules which could be chemically catalyzed and their potential applica-tions as industrial chemicals and energy fuel precursors [88].
2 Lignocellulosic Biomass: Fraction and Its Structure
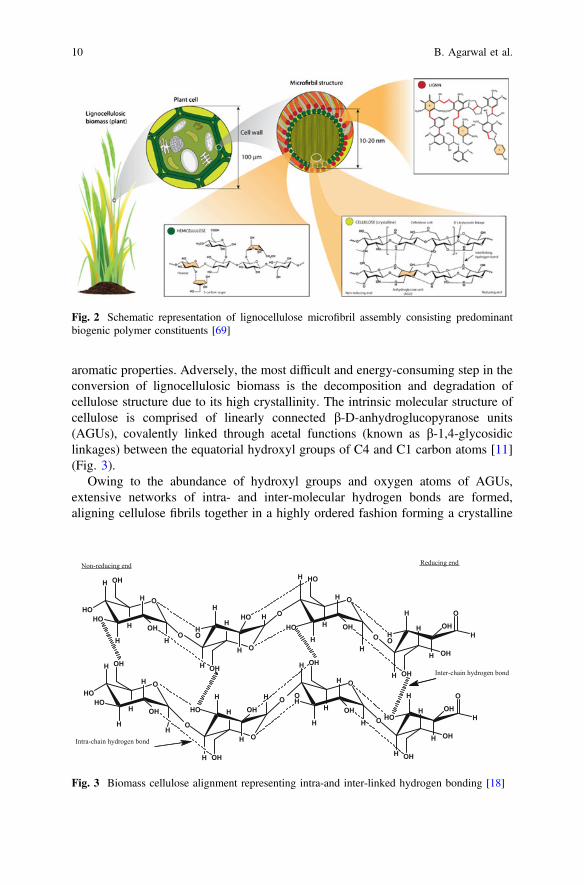
Inherently, lignocellulosic biomass is known as a polymeric material comprisedpredominantly of three biogenic polymers, namely cellulose (30–50% wt.), hemi-cellulose (20–30% wt.) and lignin (20–30% wt.) along with other trace componentsincluding organic and organic extractives (phenolic substituents) and ash (10–15%wt.). In understanding, the structural characteristics of lignocellulose are governedby composition and alignment of its polymeric constituents [63]. These polymersare clustered to form microfibrils, as depicted in Fig. 2, which mediate structuralstability in the plant cell [69].
Typical lignocellulosic biomass is of recalcitrant nature to resist microbialdegradation, which stems from the high crystallinity of cellulose, hydrophobicity oflignin, and encapsulation of cellulose by strong lignin–hemicellulose matrix. Basedon the constituent representation, cellulose consists of only anhydrous glucose unitsimparting high crystallinity due to interlinked hydrogen bonding between same andadjacent cellulose chains, while hemicelluloses is a polymer of different sugarmonomers and therefore, hemicellulose has a random, amorphous structure.Likewise, lignin is composed of complex, cross-linked, three-dimensionalbiopolymers with phenylpropane units imparting relative hydrophobic and
Fig. 1 Schematic illustration of concept of LCF based biorefinery for energy and productchemicals
Sustainable Production of Chemicals and Energy Fuel Precursors … 9
aromatic properties. Adversely, the most difficult and energy-consuming step in theconversion of lignocellulosic biomass is the decomposition and degradation ofcellulose structure due to its high crystallinity. The intrinsic molecular structure ofcellulose is comprised of linearly connected b-D-anhydroglucopyranose units(AGUs), covalently linked through acetal functions (known as b-1,4-glycosidiclinkages) between the equatorial hydroxyl groups of C4 and C1 carbon atoms [11](Fig. 3).
Owing to the abundance of hydroxyl groups and oxygen atoms of AGUs,extensive networks of intra- and inter-molecular hydrogen bonds are formed,aligning cellulose fibrils together in a highly ordered fashion forming a crystalline
Fig. 2 Schematic representation of lignocellulose microfibril assembly consisting predominantbiogenic polymer constituents [69]
O
H
HO
H
HO
H
H
OHHO
OH
O
H
H
HO
H
HHOH
O
OH
O
H
H
H
H
OHH
HO
O
H
HO
H
HO
H
H
OHH
OH
O
H
O
H
H
H
OHHO
OH
O
H
H
OH
H
H
OHH
OH
HO
HOO
OH
H
H
HO
H
O
OHHH
OH
O
OH
H
H
HO
H
O
OHHH
OH
Reducing endNon-reducing end
Inter-chain hydrogen bond
Intra-chain hydrogen bond
Fig. 3 Biomass cellulose alignment representing intra-and inter-linked hydrogen bonding [18]
10 B. Agarwal et al.

region, which is water insoluble and very resistant to chemical or enzymaticcleavage. Based on its crystalline structure, cellulose can be categorized into sevenknown allomorphic forms, denoted as cellulose Ia, Ib, II, IIII, IIIII, IVI, and IVII.
Although cellulose I is the naturally occurring form (native cellulose), its crystalstructure is thermodynamically less stable than that of cellulose II. Four otherpolymorphs of cellulose (IIII, IIIII, IVI and IVII) are less commonly encountered andless relevant from commercial perspectives.
Unlike cellulose, hemicellulose has a random and amorphous structure, which iscomposed of several heteropolymers of different 5- and 6-carbon sugars or sugaracids including xylans (arabinoxylans and 4-O-methyl-glucuronoxylans), galac-tomannans, glucuronoxylans, arabinoxylans, glucomannans and xyloglucans(4- linked b-D-glucans with attached side chains) (Fig. 4).
These polysaccharides backbone usually consists of one repeating sugar unitlinked through b-(1 ! 4) with branch points (1 ! 2), (1 ! 3), and/or (1 ! 6). Inaddition, it consists certain side groups, such as uronic acids and acetyl-andmethyl-substituted groups [7].
Pectins, another group of polysaccharides made up of polycarboxylic acid, alsoaccount for minor fraction of carbohydrates in some plants. Pectins functiontogether with hemicelluloses as a matrix component providing structural support tothe cell walls. However, hemicellulose polymers have a low degree of polymer-ization (only 50–300 dp) as compared to cellulose. The predominant polysaccha-ride in hemicellulose is the glucuronoxylans, comprised of a xylan backbone ofb-D-xylopyranose units linked through b (1 ! 4) with acetyl groups at C-2 or C-3of the xylose units [18]. Therefore, xylan is generally considered to be the simplestrepresentation of a typical hemicellulose. It functions as the cellular glue whichprovides compressive strength to the plant tissue and the individual fibres, stiffnessto the cell wall and resistance against insects and pathogens.
Similarly, lignin is a three-dimensional, highly cross-linked polymer composedof three types of phenylpropanoid units viz. trans-p-coumaryl, trans-coniferyl, and
OOH
OHHOHO
D-xylose
OOH
OH
HOHO
D-mannose
OH
OOH
OHHO
HO
D-galactose
OH
OHO
OH
OH
OHO
OH
HO
HOMeO
4-O-methyl-D-glucuronic acid
HO O
L-arabinose
OOH
OHHO
HO
D-galactose
OH
Backbone chain
Side chain
Fig. 4 Chemical structure of hemicellulose backbone monomers including C5- and C6-sugars asbackbone and side chain molecules [3]
Sustainable Production of Chemicals and Energy Fuel Precursors … 11

trans-sinapyl alcohols formed by oxidative coupling, yielding a number of func-tional groups and linkages.
These precursors are aligned variedly to form three main type of lignin units inplants i.e., p-hydroxyphenyl-propane (H), syringylpropane (S) and guaiacylpropane(G) units. Within the lignin polymer, the phenylpropane units (S, G and H units) arebonded together by a set of linkages include b-O-4, a-O-4, 5-5′, b-5, b-1′, b-b′ anddibenzodioxcin linkages, as depicted in Fig. 5. The crosslinked, lyophilic nature oflignin makes it insoluble and stable in water and acts as the “cellular glue” thatconnects the polysaccharides, such as cellulose and hemicellulose together pro-viding comprehensive strength to plant tissue. The most common linkage betweenthe lignin monomer units is recognized as the b-O-4 linkage, accounting for 50–60% of total linkages. Lignin also consists of additional functional groups, such ashydroxyl, methoxyl, carboxyl and carbonyl, which play an important role duringdelignification and lignin fragmentation reactions [46].
3 Hydrolysis of Lignocellulose
Hydrolysis of cellulose commonly refers to breakdown of glucan polymer to itsmonomer units, is a pre-requisite step in utilization of lignocellulosic biomass andcan be accomplished via acidic catalysis using most common mineral acids or
Lignin
OCH3
O
OH
OH
H3CO O
OCH3
OCH3
Lignin
β-O-4 linkage(β-aryl ether)
O
O
H3CO O
OCH3
OCH3
Lignin
OCH3
OH
Lignin
Lignin
α-O-4 linkage(aryl ether)
O
OCH3
Lignin
OH
Lignin
4-O-5 linkage(diaryl ether)
O
O
H3CO
OCH3
O
OCH3
OLignin
Lignin
H3CO
β−β' linkage(resinol)
OCH3
OCH3Lignin
O OCH3
OH
Lignin
β-5 linkage(phenylcoumaran)
OH OCH3
Lignin
H3CO
Lignin
OH
5-5' linkage(biphenyl)
HO
O
OCH3
Lignin
OLignin
H3CO OCH3
β-1' linkage(diphenyl ethane)
HO
OLignin
OCH3
H3CO
O
O
OH
Lignin
OCH3
Lignin
H3CO
Dibenzodioxocin linkage
Fig. 5 Representation of major linkages present in biogenic lignin polymer [4]
12 B. Agarwal et al.

biocatalyst (cellulase complex). Presumably, cellulase comprised of three majorenzymes depending on their mode of action and end-product i.e., (i) endoglucanaseattacks low crystallinity regions in the cellulose fibers, creating free chain-ends,(ii) exoglucanase or cellobiohydrolase hydrolyze the 1,4-glycocidyl linkages toform cellobiose, and (iii) b-glucosidase converts cello-oligosaccharides and dimers(cellobiose) into glucose residues. At the same time, breaking down of hemicel-lulose polymers into monomer mixtures consisting 5-and 6-carbon sugars) can beachieved via enzymatic reactions using enzyme cocktails include glucoronide,acetylesterase, xylanase, b-xylosidase, galactomannase and glucomannase [75].Figure 6 depicts general reaction scheme for hydrolysis of cellulosic and hemi-cellulosic fraction of lignocellulosic biomass. These enzymes work synergisticallyto hydrolyse cellulose and hemicellulose. Enzymatic hydrolysis of lignocellulosicbiomass is considered to be more effective than the use of acid catalysts owing totheir highly specific action and operation at mild process conditions. In spite ofthese advantages, the use of enzymes in lignocellulosic hydrolysis is still limiteddue to several associated factors for example their relative instability at high tem-perature conditions, high costs of enzyme isolation and purification as well asdifficult recovery and reusability. When considering the advantages offered byacidic catalysis, various aspects of chemically mediated hydrolysis are brieflydiscussed in the following sections.
The concept of utilization of lignocellulosic biomass, specifically carbohydratebased fuels and specialty chemicals rely heavily on availability of monomeric C5and C6 sugars. It is well established that lignocellulose resist any changes in theirstructural integrity owing to its complexity. Therefore, the first and foremost step inthe biorefineries is fragmentation of lignocellulose into its fractional componentsi.e., cellulose, hemicellulose and lignin. Often termed as pretreatment, the objectiveof this step is to disrupt the matrix structure to relieve lignin and decrease cellulosecrystallinity, enabling enhanced chemical or enzyme accessibility to the celluloseduring hydrolysis [56].
Though number of methods have evolved for lignocellulose pretreatment,intrinsic drawbacks, such as development of undesired byproducts, componentsloss and high processing cost have to be kept in mind while selecting appropriate
hydrolysis solubleoligomers
hydrolysis
O
H
O
H
HO
H
HOHH
RO
O
H
H
HO
H
HOHH
RO
O
H
HOHO
H
H
HOHH
R
OH
R=CH2OHR=H
CelluloseXylan
R=CH2OHR=H
GlucoseXylose
Fig. 6 Proposed reaction scheme of cellulose and hemicellulose hydrolysis [2]
Sustainable Production of Chemicals and Energy Fuel Precursors … 13

approach. For instance, pretreatment severity has to be sometimes reduced to reduceoverall economic cost (normally accounts for about 30% of operating cost) as wellas inhibitory degradation products. However, low severity factor corresponds tolow sugar yields. Therefore, a balance has to be stroked out between variousfactors. Many different pretreatment methodologies viz. biological, physical,chemical and physico-chemical pretreatments have been employed during the lastfew decades. Since the chapter focus on chemical catalysis of lignocellulose bio-mass, pretreatment via chemical methods is discussed in the perspective of inte-gration of pretreatment and production step with the aim of reducing overallproduction cost in future.
3.1 Homogeneous Hydrolysis Strategy
Mineral acid pretreatment is generally carried out with aim of hemicellulose sol-ubilization and thereby, rendering cellulose more accessible for further processing[75]. A key advantage of acid pretreatment is that subsequent hydrolysis step couldbe sometimes over-stepped, as the acid itself hydrolyses the biomass to yield fer-mentable sugars by careful modulating reaction conditions. Most studies haveemployed strong acids like sulfuric, hydrochloric, nitric and phosphoric acids forbiomass pretreatment with favored use of sulfuric acid, owing to being relativelyless expensive than other acids and promising yield results [2]. Typically, bothdilute (1–2% wt.) and concentrated (30–70% wt.) preparations of acid are evaluatedfor pretreatment; however, latter strategy is prone to intense formation of inhibitorycompounds (poison to microbes), excessive corrosion problems and expensiveproduct downstream. Nevertheless, literature cites that concentrated acid treatment(up to 50% wt.) causes apparent swelling of cellulose leading to the dissolution ofcellulose to glucose, whereas dilute acid treatment offers the advantage of solubi-lizing hemicellulose, mainly xylan and subsequent conversion of solubilizedhemicellulose to fermentable sugars depending upon reaction severity.
At the same time, organic acids such as fumaric, maleic and trifluoroacetic acidhave emerged as hydrolyzing agents with comparable monosaccharide yields assulfuric acid along with limited sugar degradation and corresponding furfuralproduction [40, 52]. With time, various types of reactors have been developed andapplied for large-scale acidic pretreatment of lignocellulosic materials such aspercolation, plug flow, shrinking-bed and counter-current reactors [77].Voluminous amount of literature is available on acidic pretreatment of lignocel-lulose biomass [10, 87] and it has been summarized that optimum conditions for theacid pretreatment are highly dependent on the purpose of pretreatment in terms oftargeted sugars [49]. For instance, Saha and co-workers [71] achieved maximumcarbohydrate content of 76% and 60% wt. from mild acid pretreated wheat strawand rice hull substrates, respectively, after enzyme saccharification and reported lessor no formation of sugar degradation products (furfural and HMF) under typicalreaction conditions (1.0% v/v H2SO4 at 121 °C for 1 h) [71]. Alternatively, several
14 B. Agarwal et al.

other studies have proposed for addition of supplementary agents during acidichydrolysis, in order to improve the direct conversion of cellulose into glucose. Forexample, Ragg and co-workers [62] employed HCl (6–7 M) supplemented withLiCl or CaCl2 in aqueous phase for conversion of cellulose to glucose and yiel-ded *85% fermentable sugar release [62]. Later, in a similar fashion Cao andco-workers [5] employed ZnCl in a homogeneous cellulose pretreatment systemfollowed by hydrolysis with dilute HCl, resulting in improved glucose yield (up to91.5%) [5]. In modified study, Luterbacher and co-workers [50] evaluated theapplicability of biphasic reaction system consisting aqueous (0.05% by wt. H2SO4)and organic (c-valerolactone, a biomass derived green organic solvent) phase forthe conversion of various cellulosic substrates to glucose and reported 70–90%conversion yield [50].
Likewise, studies have also been conducted on C5 sugar production fromhemicellulosic fraction of lignocellulose via dilute acid hydrolysis. Herrera andco-workers [30] evaluated the production of xylose (16.2 g/L) which correspondedto 71.6% of theoretical yield from sorghum straw using 6% wt. HCl at 122 °C for70 min [30]. Later, Rita and co-workers demonstrated further improved xyloseyield (*74% wt.) from sugarcane bagasse using sulfuric acid (100 mg acid/g dm)under comparatively low severity conditions (130 °C for 10 min) [65]. In modifiedstudy, Zhang and co-workers [85] investigated combined dilute acid-catalyzedhydrolysis of palm oil empty fruit bunch by employing both dilute H2SO4 (0.5%w/v) and H3PO4 (0.2% w/v) to achieve 91.3% xylose yield. The apparent improvedyields is mainly attributed to the synergistic action of acids under the modestreaction conditions (160 °C within 10 min) [85].
It is profound that typical alkaline pretreatments increase cellulose digestibilitythrough fiber swelling and are known to be more effective for lignin solubilization,exhibiting minor cellulose and hemicellulose solubilization (less sugar loss) thanacid or hydrothermal processes [6]. In perception, alkalis viz. sodium, potassium,calcium and ammonium hydroxides generally enables degradation of ester andglycosidic side chains, resulting in structural alterations of lignin, cellulose swellingand increase its internal surface area, partial decrystallization of cellulose, andpartial solvation of hemicellulose [53]. In support, several early studies haverevealed for the improved digestibility of lignocellulose (for example hardwoodsubstrate) after pretreatment using NaOH yielded up to 55% wt. glucose, due toenhanced enzyme accessibility through recalcitrant lignin removal [41]. Similarly,numerous comparative studies have established for the better delignificationcapabilities of NaOH (up to 59% wt.) than sulfuric acid (31% wt.) while increasingits concentration from 0.05 to 0.2% g/g solids [19].
Alongside, studies have also demonstrated using weak base (for example CaOH)for biomass hydrolysis through removal of acetyl groups in hemicellulose andreducing steric hindrance, resulting in enhanced cellulose digestibility. Indeed,biomass pretreatment using lime offers the advantages of lower cost and less safetyrequirements compared to NaOH or KOH pretreatments, and easy recovery fromhydrolysate by reaction with CO2. Consequently, application of this approach hasresulted in 89% wt. glucose recovery from leafstar rice straw [59]. Furthermore,
Sustainable Production of Chemicals and Energy Fuel Precursors … 15

supplementation of oxidative reagents, for example O2 or H2O2 to alkali duringbiomass pretreatment could improve cellulose and hemicellulose hydrolysis byfavoring lignin removal and more importantly, decreased furfural and HMF for-mation [6]. Apparent studies have witnessed for no obvious furfural or HMF for-mation during alkaline peroxide pretreatment, which favors further microbialfermentation of sugars to ethanol [77]. Several other chemical pretreatment methodslike ozonolysis, organosolv and wet oxidation have been practiced with consider-ably high delignification yields, however, these methods restricted for use in cel-lulose to bioethanol transformations, due to high expenses involved as well assubsequent enzymatic inhibition by chemical agents employed [58, 75, 86]. Table 1summarizes few examples of lignocellulosic biomass processing for C5 and C6sugars production.
In advancement of bioprocessing, ILs functionalized with acidic groups arenew-types of thermally stable catalysts having special properties like providinghigh-density active sites as liquid acids, non-volatile, easily recyclable and exist assolids even above 100 °C [26]. Several mechanistic studies on cellulose hydrolysisproposed that hydrolysis of cellulose involves breakdown of the hydrogen bond incellulosic network by the high activity of chloride concentration in ILs [76].However, water acts as an inhibitor for the dissolution of cellulose and hence can beused to regenerate the cellulose dissolved in ILs. Fascinatingly, during dissolutionand regeneration by precipitation of cellulose, its crystallinity reduces significantlyand thus, exposing the amorphous part which is much easier to hydrolyze comparedwith the native cellulose. Furthermore, various ILs specifically hydrophilicimidazolium-based, such as 1-butyl-3-methylimidazolium chloride ([BMIM]Cl),1-allyl-3-methylimidazolium chloride ([AMIM]Cl), 1-benzyl-3-methylimidazoliumchloride ([BZMIM]Cl), and 1-ethyl-3-methylimidazolium acetate ([EMIM]CH3COO), have been demonstrated for significant dissolution of lignocellulosicmaterials with remarkable glucose conversion yields (>80%) [14, 45, 64]. Anotheraspect of ILs in lignocellulosic processing was demonstrated when Lee and
Table 1 Examples of monomeric sugar production from lignocellulosic biomass (adapted fromRef. [88])
Catalyst Lignocellulose Operating parameters HydrolysisProduct
Yield (%wt.)
Ref.
H2SO4
(0.175% wt.)Wood chips 210 °C, 2 min, *1.9 MPa Xylose 54 [20]
H2SO4 (0.5%wt.)
Corn cobs 125 °C, 165 min Xylose 25 [66]
H2SO4 (6.2 %wt.)
Sugar maple wood extract 95 °C, 50 min, 0.1 MPa Xylose 161.6 g.L-1 [31]
SO2
ImpregnationAspen chips 205 °C, 3 min, 1.62 MPa Glucose
Xylose3710
[15]
HCl (20% wt.)+ [EMIM]Cl
Cellulose 105 °C, 2–4 h Glucose *90 [2]
16 B. Agarwal et al.

co-workers [44] discovered for dissolution of lignin in ILs, however, exhibited alimited affinity toward cellulose and other constituents of wood flour [44]. TheseILs were [MMIM]-[CH3OSO3],1,3-dimethylimidazolium trifluoromethanesulfonate([BMIM][CF3SO3]), [EMIM][CH3COO], [AMIM][Cl], [BMIM][Cl], or1-benzyl-3-methylimidazolium chloride ([BZMIM][Cl]). Despite the advantagesoffered by ILs, the high cost of ILs limits their large-scale application in biomasspretreatment. However, it can be expected that research will be focused on droppingdown the production cost of ILs so as to enable its application in commercialhydrolysis and pretreatment processes for cellulose conversion.
3.2 Heterogeneous Hydrolysis Strategy
Although homogeneous acids have been quite successful in cellulose hydrolysis toyield monomeric glucose, the handling and operational issues associated with theseapproaches led to the research and development of heterogeneous acid catalysts.However, most heterogeneous catalytic studies are based on commercial cellulosedue to difficulties in separation of cellulose and lignin in biomass; nevertheless, fewresearches have demonstrated for direct lignocellulose conversion. Table 2 sum-marizes potential applications of heterogeneous solid acid catalysts towards cellu-lose hydrolysis to glucose.
In modified study, Jiang and co-workers demonstrated self-derived carbona-ceous solid acid (CSA) catalysts giving rise to a close loop recycle procedure,
Table 2 Popularly used heterogeneous solid acid catalysts for bio-derived component transfor-mation reactions [29]
Example solids Class
Zeolite and zeolite-like X-, Y-zeolites (faujasite), chabasite, ferriertie, beta-zeolite,mordenite, erionite, HZSM-5, MCM-22, metalloaluminophosphate(e.g., silicoaluminophosphate, gallosilicate, beryllosilicate,titanosilicate, stanosilicate
Clay Montmorillnite, saponite
Metal oxide and mixedmetal oxide
Al2O3, TiO2, SiO2, Nb2O5, WO3, SiO2–Al2O3, SiO2–ZrO2, SiO2–
MgO, TiO2–SiO2, WO3–ZrO2, WO3–Al2O3, WO3–SnO2, Nb2O5–
Al2O3, B2O3–Al2O3
Acid supported H3PO4/SiO2, HClO4/SiO2, SO3H/SiO2, SO3H/C, AlCl3/SiO2, BF3/SiO2, SbF5/SiO2–Al2O3, SbF5/TiO2, CF3SO3H/SiO2, heteropolyacids/SiO2
Sulfated oxide SO42−/ZrO2, SO4
2−/TiO2, SO42−/SnO2
Layered transition metaloxide
HNBMoO6, HTaWO6, HNbWO6
Metal salt AlPO4, Nb3(PO4)5, FePO4, NiSO4
Heteropoly compound H3PW12O40, H4SiW12O40, H3PMo12O40, H4SiMo12O40, and theirsalts (e.g., H0.5Cs2.5PW12O40)
Ion exchange resin Amberlyst-15, Nafion, Nafion-silica composite/nanocomposite
Sustainable Production of Chemicals and Energy Fuel Precursors … 17

where CSA is prepared under microwave irradiation from hydrolyzed corncobresidues and re-used for the hydrolysis of corncob, as illustrated in Fig. 7 [35]. Theobvious advantages of this process are two end products as output, first is the sugarsderived from cellulose and hemicelluloses and secondly, CSA coming from theunconverted solid residue. Considering the use of inexpensive solid acid catalyst,moderate reaction conditions (130 °C) and appreciable yields of xylose and ara-binose (78% wt.) the overall process is postulated to yield good economics.Therefore, it is evident that heterogeneous catalysis offers economic conversion oflignocellulosic biomass into platform sugar compounds. However, efforts are to bemade in the direction of overcoming mass-transfer limitations associated withsubstrate-catalyst interactions without incorporating additional physical pretreat-ment costs.
4 Thermochemical Catalysis of Carbohydrate Sugars
Depending on the intended end-use of the product, lignocellulosic biomass can beprocessed in numerous ways like liquefaction, solvo-hydrolysis, pyrolysis,hydrolysis, hydrothermal hydrolysis etc. For instance, synthesis of transportationfuels and chemicals require less oxygen content and consequently, lignocellulosicbiomass is depolymerized and deoxygenated prior to catalytic hydrolysis. Infavorable, presence of oxygen often provides valuable physical and chemicalproperties to other value-added chemicals and therefore, require much lessdeoxygenation. In accordance, with the recent literature cites that5-hydroxymethylfurfural, lactic acid, acetone-butanol-ethanol (ABE) and lignin hasbeen identified as platform molecules in addition to the previously defined platformchemicals by the US-DOE, which could be obtained from lignocellulose-derivedC5 and C6 sugars and also, lignin fraction by any of the chemical or biologicalprocessing techniques. Because these molecules can be further processed intovalue-added chemicals by employing appropriate processing approaches [33].
5-Hydroxymethylfurfural (HMF): A versatile ‘value-added’ additive mole-cule, gaining much attention in petroleum and chemical industries due to its reactivefeatures (heterocyclic furan), consisting hydroxide and aldehyde functionalities at
Fig. 7 Process scheme of corncob hydrolysis by CSA derived from the hydrolysis residue [35]
18 B. Agarwal et al.

2,5-poistions,and moreover, it is relatively an unsaturated aromatic compound [12].Thus, HMF is susceptible to many chemical reactions, depending upon the syn-thesis route (Fig. 8) undergoing favorable changes leading to the production ofcommercially important chemicals [79].
It is generally produced through acid-catalyzed dehydration of hexose sugarspreferably fructose. Synthesis of HMF from biomass-derived glucose is essentiallya two-step process i.e., a base and/or Lewis acid catalyzed reaction for isomer-ization of glucose to fructose followed by Brønsted acid mediated catalysis to theend product. Due to the unstable character of HMF, obtaining high yield andselectivity from glucose is challenging from industrial point of view. In a typicalreaction conditions, HMF is more likely to rehydrate to levulinic acid and formicacid at equal proportion under same prevailing reaction conditions. The earliestreports on synthesis of HMF in aqueous phase reaction system employing cheapraw material like wood chips, were restricted by meager selectivity towards HMFowing to instability of HMF in water under acidic conditions. In order to avoid thecomplications and further product yield improvement, Kuster and Der Van Steen in1977 [42] attempted to introduce organic solvents, as extracting agents, resultingachieved remarkable conversion yield under modest reaction conditions withappreciable synergistic effects on HMF’s rate of formation along with limiting itsdecomposition to humin species and other side products [42]. Since then numeroussolvents including DMSO (dimethyl sulfoxide), DMF (dimethyl formamide), DMA
Fig. 8 Potential application of 5-hydroxymethylfurfural as platform molecule
Sustainable Production of Chemicals and Energy Fuel Precursors … 19

(dimethyl acetamide), NMP (N-methyl pyrrolidinone), sulfolane etc. have beenevaluated and consequently achieved higher HMF yields [70]. For instance, Qi andco-workers [60] successfully tested sulfated zirconia (SZ) for dehydration of fruc-tose reactions achieving 72.8% HMF yield at 180 °C under microwave heating for20 min in solvent mixture consisting of acetone–dimethylsulfoxide (DMSO) [60].Recently, Moreno-Recio and co-workers achieved 42% HMF yield with 80%glucose conversion using HZSM-5 (Si/Al ratio of 18.9) in a biphasic systemcontaining 20% NaCl and MIBK, within 30 min reaction at 195 °C [55].Apprehensively, these processes increase the overall cost economics owing tocomplex recovery itinerary of such high boiling point solvents. Another advance-ment in this field is the use of bi-functional heterogeneous catalysts presenting bothacidic and basic catalytic sites. In accordance with the literature reports thatheterogeneous catalysts have shown superior catalytic activity over homogeneouscatalysts in terms of product selectivity [26]. Table 3 lists various catalysts thathave been reported for HMF synthesis under various reaction conditions.
With the continuous evaluation of various efficient catalysts for HMF synthesis,complete conversion of biomass derived sugars has been achieved, however,one-pot synthesis still remains a challenge owing to mass-transfer limitations. Dueto this, commercialization of HMF from lignocellulosic biomass has not beenrealized. New heterogeneous catalysts, such as Metal Organic Frameworks(MOFs), Porous Organic Polymer (POP), Covalent Organic Frameworks (COFs)and Covalent Triazine Frameworks (CTFs) have emerged with excellent charac-teristics, suited the most pivotal being easy functionalization to facilitate directvalorization of lignocellulosic biomass. A recent example of use of such MOFs ishydrolysis of carboxymethylcellulose (CMC) to 5-HMF in aqueous phase at200 °C for 4 h with aluminum based MIL-53(Al) and achieved a molar yield of40.3% of 5-HMF [89].
Levulinic acid (LA): Another class platform molecule, which serve as precursorto numerous value-added chemicals production, and is generally prepared fromlignocellulose via hydrolysis and dehydration/hydration reactions through inter-mediate HMF formation.
Table 3 Classified catalyst group for HMF synthesis from hexose sugar molecule (reproducedfrom Ref. [68])
Catalystgroup
Example
Organicacids
Carboxylic acids, lactic acid, oxalic acid, levulinic acid, maleic acid, p-tolunesulfonic acid, boric acid
Inorganicacids
Sulfuric acid, phosphoric acid, hydrochloric acid, iodine or hydroiodic acidgenerated in situ
Slats MgCl2, (NH4)2SO4/SO3, pyridine/PO4−3, pyridine/HCl, aluminum salts, Th and
Zr ions, zirconium phosphate ions: Cr, Al, Ti, Ca, In, ZrOCl2, VO(SO4)2, TiO2,V-porphyrine, Zr-, Cr- and Ti-porphyrins, lanthanides (LaCl3, NdCl3, EuCl3,DyCl3 and YbCl3)
Lewis acids ZnCl2, AlCl3, BF3Solid acids Ion exchange resins, zeolites, supported acids, heteropoly compounds
20 B. Agarwal et al.

In popular, the well-established method for LA preparation from biomass isBiofine process, essentially a two-stage processing protocol. Briefly, in the firststage, a plug flow reactor is employed for initial biomass hydrolysis under elevatedconditions (210–220 °C, 25 bar for 12 s) and subsequently, the slurry mixture istreated under relatively less severe conditions (190–200 °C, 14 bar and 20 min) atsimilar acid concentrations to yield ultimately a product mix consisting predomi-nantly LA (50% by wt. of C6 sugar), furfural (50% by wt. of C5 sugar) and formicacid (20% by wt.) along with residual HMF concentrations. So far, variety ofcarbonaceous feedstocks (biomass) have been evaluated for LA preparation catal-ysed via both homogeneously and heterogeneously and could achieve up to40–45% wt. under modest reaction conditions [61]. In a typical reaction setup, LAyields of about two thirds (or even less) than the theoretical value are attainable dueto the formation of undesired black insoluble-materials called humins. Recentadvancements in LA synthesis include use of SO3− functionalized ionic liquid, 1-(4-sulfonic acid) butyl-3-methylimidazolium hydrogen sulphate ([BSMim]HSO4),giving the highest yield up to 40% wt. within 120 min in aqueous medium at 120 °C from cellulose [72]. Figure 9 illustrates various value-added commodities whichare synthesized from biomass derived levulinic acid.
Sorbitol: A sugar alcohol, which is generally produced by the hydrogenation ofglucose in the presence of suitable catalyst either homogenous or heterogeneous.
The earliest reports of sorbitol production from cellulose dates back to 1950employing mineral acid and supported Ru catalysts under H2 pressure (7 MPa)giving 99% recovery of sorbitol. Figure 10 summarizes use of sorbitol as potentialplatform molecule. Although literature cites on direct conversion of biomass
HO
O
OH
O
Succinic acid
H3COH
OH
1,4-pentanediol
O
OCH3
CH3O
γ−valerolactone
2-methyltetrahydrofuranH3COH
O
Pentanoic acid
O
5-nonanone
H3COR
O
OAlkyl levulinate
OCH3O
α−angelica lactone
H3COH
O
OLevulinic acid
Fig. 9 Summary of end products derived from levulinic acid as building block [50]
Sustainable Production of Chemicals and Energy Fuel Precursors … 21

substrates for sorbitol production is scarce, commercial D-glucose has been trans-formed into sorbitol by various researchers [13]. For instance, Käldström andco-workers [37] employed hydrolytic hydrogenation of bleached birch kraft pulp inaqueous medium at 185 °C under 20 bar H2 over H-MCM-48 and Pt/MCM-48synthesis zeolite catalysts and identified that former was able to convert cellulosicand hemicellulosic fractions into variety of products include glucose, xylose,5-HMF, furfural and furfuryl alcohol. The later catalyst was able to further trans-form the synthesized glucose and fructose molecules into sorbitol and xylitolproducts, respectively [37]. Subsequently, Kobyashi and co-workers [39] evaluatedtransformation of Avicel microcrystalline cellulose to sugar alcohols usingc-Al2O3-supported Pt catalyst and Pt(Cl)/c-Al2O3 in the presence of H2 pressure(5 MPa) at 190 °C for 24 h, resultantly achieved 25% wt. sorbitol along withconsiderable mannitol (6% wt.) as co-product [39]. Overall, reviews convey thatcellulosic fraction of lignocellulosic biomass is an extensive source of platformcompounds for production of value added chemicals. However, successful con-version of commercial cellulose appears to be promising technique.
Furfural: Furfural (2,5-furandicarboxyaldehyde) is the principal product of C5sugar derived via dehydration reaction in the presence of mild acid under typicalreaction conditions. It can be used as precursor for the production of wide range ofhigh value chemicals and energy fuels, as depicted in Fig. 11. This value addedproduct is exclusively produced from lignocellulose biomass even at commercialscale. The first known commercial production of furfural is accredited to the Quaker
Fig. 10 Reaction scheme for sorbitol production from cellulose and its end-use [39]
22 B. Agarwal et al.

Oats technology established in 1921 and later, various modifications have beenmade to create new processes with improved furfural yields, recovery, and purity bygroups like Westpro modified Huaxia Technology and Supra yield [38]. Despitecommercialization of furfural, low yields are obtained which probably is due to theevolution of side reactions as well as cross-polymerization that involve sugars,furfural, and reaction intermediates in an acidic aqueous environment. Till date,varied furfural yields have been reported at bench scale level through employingvariety of approaches, which are mainly governed by operating conditions. Forinstance, maximum up to 87% wt. furfural concentrations have been achieved in anintegrated two stage processing i.e., hot water hydrolysis followed by homogenouscatalysis (H2SO4), of various lignocellulosic biomass (hybrid poplar, miscanthus,switchgrass and corn stover) [51]. In another study, Lewis acid metal chloridecatalysts (CrCl3 and CrCl2) have been employed as alternative to mineral acids forfurfural production in a monophasic solvent system (N,N-dimethylacetamide/LiCl)and reported maximum furfural yield (56% wt.) [2]. In another approach, use ofmicrowave irradiation has been demonstrated to be effective in reducing the resi-dence time without compromising overall yields [84]. Alternatively, solid catalystshave been employed for furfural synthesis and achieved remarkable yields andconversion performance. For instance, Lima and co-workers [48] employedmicroporous silicoaluminophosphates (SAPO-5, SAPO-11 and SAPO-40), as solidacid catalysts during dehydration of xylose into furfural under biphasic conditions,and obtained maximum furfural yield (65% wt.) at 170 °C in 24 h [48]. In a recentstudy, increased furfural yield (relatively 21% wt.) was obtained by Chen and
O O
OO
OEtOOHO
O
O
OO
O
O
O
O
OEt
O
OEt
O
O
HO OH
OH
OH
OH
C10-15 alkanes
Hydrodeoxygenation
Aldol-condenstationand dimerization
Aldol coupling with LA
2-methyltetrahydrofuran
Tetrahydrofuran
MethylfuranEthyl levulinate
Alcohols and diols ETE
O O
Furfural
Fig. 11 Potential application of furfural as an industrial precursor
Sustainable Production of Chemicals and Energy Fuel Precursors … 23
co-workers [9] in a process employing HZSM-5 with the addition of4-Methoxyphenol, a polymerization inhibitor, due to less formation of humins [9].Recent advancements in the area of utilization of biomass derived hemicellulosicfraction, including integrated two-stage strategies, application of microwave irra-diation resulting in decreased residence time, addition of polymerization inhibitorsfor decreased humin formation have exerted the cumulative effect of increasedfurfural yield, resulting in improved economical aspect of industrial scale furfuralproduction. Overall, it is therefore recommended to be carry forwarded towardsapplication in biomass to value addition to realize the concept of biorefineries, inthe context of substitute to petroleum derivatives.
5 Catalytic Valorization of Bio-derived Lignin
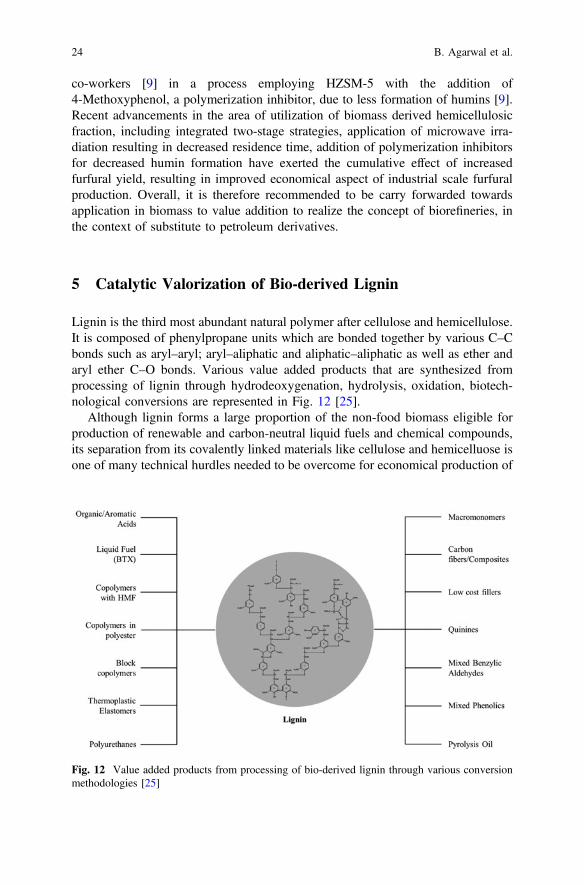
Lignin is the third most abundant natural polymer after cellulose and hemicellulose.It is composed of phenylpropane units which are bonded together by various C–Cbonds such as aryl–aryl; aryl–aliphatic and aliphatic–aliphatic as well as ether andaryl ether C–O bonds. Various value added products that are synthesized fromprocessing of lignin through hydrodeoxygenation, hydrolysis, oxidation, biotech-nological conversions are represented in Fig. 12 [25].
Although lignin forms a large proportion of the non-food biomass eligible forproduction of renewable and carbon-neutral liquid fuels and chemical compounds,its separation from its covalently linked materials like cellulose and hemicelluose isone of many technical hurdles needed to be overcome for economical production of
Fig. 12 Value added products from processing of bio-derived lignin through various conversionmethodologies [25]
24 B. Agarwal et al.

biofuels from cellulosic wastes. To realize this objective, various traditionallignin-isolation methods have been employed such as sulfite (SO2 and alkali/acid),kraft or sulfate (Na2S and NaOH) and soda (NaOH) processes. With time severalnon-conventional chemical methods, such as ammonia fiber expansion (AFEX),aqueous NH3, dilute and concentrated acids( e.g., H2SO4, HCl, HNO3, H3PO4),alkaline (e.g., NaOH, KOH, Ca(OH)2),organic solvents (e.g., ethanol, formic acid,acetic acid, methanol), and ionic liquids have evolved, which offer the advantage oflignin production with little or no sulfur compounds and thus, increasing theapplicability for manufacture of value-added products [17]. Although ligninobtained by organic solvents, called organosolv lignin, is beneficial over sulfonatedand kraft lignins due to greater ability to be derivatised, lower ash content, higherpurity (due to lower carbohydrate content), generally lower molecular weight andmore hydrophobicity, it is not used widely developed because of the lower qualityof the pulp produced and extensive corrosion of the process equipment. Recentadvancements in the area of lignin extraction and precipitation is employing ofionic liquids, where lignins can be recovered from IL by precipitation, allowing theIL to be recycled. Mostly alkylmidazolium based IL have been employed as bio-mass solvents for dissolution of cellulose. There are reports on use ofN-methylimidozole indimethyl sulfoxide for lignin isolation from wood and laterprecipitation using dioxane/water mixture [22]. Recently, Tan and co-workers [78]utilized ionic liquid mixture consisting 1-ethyl-3-methylimidazolium cation and amixture of alkylbenzene sulfonates with xylene sulfonate to extract lignin fromsugarcane bagasse at elevated temperatures of 170–190 °C under atmosphericcondition [78].
High energy content and presence of highly reactive functional groups representlignin as a potential substrate for synthesis of wide range of renewable chemicals.Further lignin polymer is susceptible to a wide range of chemical transformations,principally cracking or hydrolysis reactions, catalytic reduction, and catalytic oxi-dation reactions to form valuable chemicals. Normally, lignin catalytic reductionreactions aim at removal of the extensive functionality of the lignin subunits togenerate simpler monomeric compounds like phenols, benzene, toluene, or xylene,which can be then hydrogenated to alkanes (carbon atoms C7–C18) via couplingreactions or used as platform chemicals under appropriate reaction environment.Lignin valorisation is often realized through thermal hydrogenolysis (depolymeri-sation) which could be base-catalyzed, acid-catalyzed, metallic catalyzed and ionicliquids-assisted depolymerization for synthesis of various phenolics (Table 4).However, very meagre yields have been reported indicating pyrolysis to be bettermethodology for phenolics generation [1, 83].
Heterogeneous hydrogenation of lignin was reported in as early as 1938 whenHarris and co-workers obtained monomeric propylcyclohexanols (substituted alkylphenols) and methanol when lignin was reacted with hydrogen overcopper-chromium oxide [28]. Later, many patented processes were reported, forexample Noguchi process, which employed an Fe(II)-sulfide along with copper oxideas co-catalyst in phenol at 250–450 °C with an initial hydrogen pressure of 15.2–45.6 MPa and obtained 40% yield of C6–C9 mono phenols [57]. In another patented
Sustainable Production of Chemicals and Energy Fuel Precursors … 25

Tab
le4
Prod
uctio
nof
arom
atic
phenolicsfrom
ligninthroug
hvariou
scatalytic
reactio
ns(reprodu
cedfrom
Ref.[80])
Lignin
Catalyst
Reactioncond
ition
sMajor
prod
ucts
Yields(%
wt.)
Ref.
Base-catalyzed
Steam
explosionhemp
lignin
5%wt.NaO
H30
0–33
0°C
,3.5MPa
Guaiacol,
Catecho
lVanilin
0.9–
2.8
0.8–
3.0
0.5–
0.8
[43]
Steam
explosionsoftwoo
dlig
nin
Guaiacol
Catecho
lVanilin
1.2–
2.1
0.1–
3.2
0.3–
0.5
Organosolvlig
nin
2%wt.NaO
H30
0°C
,25
MPa
Syring
olHyd
roxy
acetop
heno
neGuaiacol
4.1
1.6
1.1
[67]
Acid-catalyzed
Wheat
straw
lignin
10%
wt.form
icacid
77%
ethano
l36
0°C
,25
MPa
Metho
xyph
enols
Catecho
lsPh
enols
1.3
0.5
0.3
[24]
Wheat
straw
lignin
10%
wt.form
icacid
81%
wt.ethano
l38
0°C
,25
MPa
Metho
xyph
enols
Catecho
lsPh
enols
2.9
1.5
2.0
[23]
Metallic-catalyzed
Kraftlig
nin
Si–Alcatalyst/
H2O
/butanol
200–
350°C
,1.1–
23MPa
Phenols
6.5
[82]
Acidichy
drolysisspruce
lignin
4.4%
wt.form
icacid
0.15
%wt.Pd
catalyst
0.94
%wt.Nafion
SAC-13
300°C
,9.6MPa
Guaiacol
Pyrocatechol
Resorcino
l
2.0
1.8
0.5
[47]
(con
tinued)
26 B. Agarwal et al.

Tab
le4
(con
tinued)
Lignin
Catalyst
Reactioncond
ition
sMajor
prod
ucts
Yields(%
wt.)
Ref.
Birch
sawdu
stlig
nin
Ni/C
200°C
Prop
enylgu
aiacol
Prop
enylsyring
ol12 36
[73]
Ionic-liq
uid-catalysed
Organosolvbeechlig
nin
[EMIM
][CF 3SO
3]/M
n(NO3)2
100°C
,8.4MPa
2,6-Dim
etho
xy-1,4-benzoqu
inon
e11
.5[74]
Guaiacylglycerol-b-
guaiacyl
ether
[BdM
IM]Cl/1
,5,7-triazabicyclo
[4.4.0]dec-5-ene
150°C
Guaiacol
71.5
[34]
Sustainable Production of Chemicals and Energy Fuel Precursors … 27

work, Inventa AG employed ferrous sulfate for the fragmentation of lignin into dis-tillable products containing a substantial amount of monophenols [36]. Subsequently,Misson and co-workers [54] investigated catalytic pyrolysis of the pretreated emptypalm fruit bunches using NaOH, H2O2, and Ca(OH)2 and yielded up to 90 and 80%wt. phenolic monomers in the presence of AlMCM-41 and H-ZSM-5, respectively,when processed at 300 °C [54]. In recent work, Chan and co-workers [8] employedvanadiumbased catalysts for conversion of dioxasolv-lignin derived fromMiscanthusgiganteus (under 80 °C for 24 h in 10:1 acetonitrile/THF and 8:1 ethyl acetate/THFmixtures) and obtained a mixture of monophenolics, such as vanillin, syringic acid,syringaldehyde, 4-hydroxybenzaldehyde, vanillic acid, in major proportions [8].However, utilization of lignin fraction of lignocellulosic biomass for value-addedcommodities synthesis has not been well established due to its heterogeneity nature.
Further improvements in the existing techniques along with development ofnovel protocols specifically heterogeneous based are emerging, which will enablethe researchers to exploit the potential of lignin at industrial scale.
6 Summary and Perspectives
Lignocellulosic biomass is an abundant source of renewable energy with thepotential to be successful alternative to petroleum-based economy. A large pool ofvalue-added chemicals and fuel additives have been devised from cellulosic,hemicellulosic and lignin biogenic polymers and their scope as industrial com-modities is revealed in this chapter. Considering the predicted opportunities oflignocellulosic biomass valorization, various catalytic processes that have beenevolved for biomass processing, namely hydrolysis, liquefaction, gasification,pyrolysis and deoxygenation/hydrogenation have received increasing attention.However, irrespective of catalytic processes employed, present techniques have notyet offered complete commercialization barring only few bio-products. Althoughcatalytic hydrolysis has evolved as simple process over present liquefaction, gasi-fication and pyrolysis methods of lignocellulosic biomass processing, operationalissues such as reactor corrosion, energy-intensive product separation and catalystrecycle remains a challenge in industrial scale production. Advent of heterogeneousas well as ionic liquid-mediated catalysis has emerged as acceptable alternatives,developments in the valorization of lignocellulose still remains a great challengetogether with many opportunities. Nevertheless, efforts are being made to developspecific catalysts to overcome various limitations including mass-transfer and cat-alytic activity loss on reuse and certain novel candidates viz. MOF, POP, COF andCTFs, which finds considerable application in certain fields of biomass valorization.It is postulated that use of such tailored catalysts would bring remarkableimprovements in process economics of biomass into biovalue. Commercial
28 B. Agarwal et al.
considerations can be further improved through continued research and develop-ment and in support, recent trends suggest that chemical catalysis of lignocellulosicbiomass will be a key player in establishing a worldwide bio-based economy tosubstitute conventional petroleum dependent industries.
Acknowledgements The authors gratefully thank Department of Biotechnology, New Delhi,India for their consistent financial support. Authors BA and SE thank Department of Science andTechnology (DST-SERB), New Delhi for providing financial assistance through GrantNo. PDF/2015/000285 and Grant No. YSS/2014/000031, respectively.
References
1. Amen-Chen C, Pakdel H, Roy C (2001) Production of monomeric phenols by thermochem-ical conversion of biomass: a review. Bioresour Technol 79(3):277–299
2. Binder JB, Raines RT (2010) Fermentable sugars by chemical hydrolysis of biomass. ProcNatl Acad Sci 107(10):4516–4521
3. Brody T (1999) Nutrients that resist or escape digestion. Nutritional Biochemistry 2nd edition,Academic Press, San Diego, pp 53–61
4. Brunow G, Lundquist K (2010) Functional groups and bonding patterns in lignin (includingthe lignin-carbohydrate complexes). CRC Press, Taylor Francis Group, New York, NY, USA
5. Cao N-J, Xu Q, Chen C-S, Gong CS, Chen LF (1994) Cellulose hydrolysis using zincchloride as a solvent and catalyst. Appl Biochem Biotechnol 45(1):521–530
6. Carvalheiro F, Duarte LC, GÃrio FM (2008) Hemicellulose biorefineries: a review onbiomass pretreatments. J Sci Ind Res 849–864
7. Cengiz M, Dincturk OD, Sahin HT (2010) Fractional extraction and structural characteri-zation of opium poppy and cotton stalks hemicelluloses. Pharm Mag 6(24):315
8. Chan JMW, Bauer S, Sorek H, Sreekumar S, Wang K, Toste FD (2013) Studies on thevanadium-catalyzed nonoxidative depolymerization of miscanthus giganteus-derived lignin.ACS Catal 3(6):1369–1377
9. Chen H, Qin L, Yu B (2015) Furfural production from steam explosion liquor of rice straw bysolid acid catalysts (HZSM-5). Biomass Bioenerg 73:77–83
10. Chiaramonti D, Prussi M, Ferrero S, Oriani L, Ottonello P, Torre P, Cherchi F (2012) Reviewof pretreatment processes for lignocellulosic ethanol production, and development of aninnovative method. Biomass Bioenerg 46:25–35
11. Ciolacu D, Ciolacu F, Popa VI (2011) Amorphous cellulose—structure and characterization.Cellul Chem Technol 45(1):13
12. Corma A, Iborra S, Velty A (2007) Chemical routes for the transformation of biomass intochemicals. Chem Rev 107(6):2411–2502
13. Crezee E, Hoffer BW, Berger RJ, Makkee M, Kapteijn F, Moulijn JA (2003) Three-phasehydrogenation of D-glucose over a carbon supported ruthenium catalyst: mass transfer andkinetics. Appl Catal A 251(1):1–17
14. da Costa Lopes AM, Joo KG, Morais ARC, Bogel-Łukasik E, Bogel-Łukasik R (2013) Ionicliquids as a tool for lignocellulosic biomass fractionation. Sustain Chem Processes 1(1):1
15. De Bari I, Nanna F, Braccio G (2007) SO2-catalyzed steam fractionation of aspen chips forbioethanol production: optimization of the catalyst impregnation. Ind Eng Chem Res46(23):7711–7720
16. Dhar S, Shukla PR (2015) Low carbon scenarios for transport in India: co-benefits analysis.Energy Policy 81:186–198
17. Doherty WOS, Mousavioun P, Fellows CM (2011) Value-adding to cellulosic ethanol: ligninpolymers. Ind Crops Prod 33(2):259–276
Sustainable Production of Chemicals and Energy Fuel Precursors … 29
19. Elumalai S, Pan XJ (2011) Chemistry and reactions of forest biomass in biorefining. In:Sustainable production of fuels, chemicals, and fibers from forest biomass. ACS symposiumseries, vol 1067. American Chemical Society, pp 109–144
18. Elumalai S, Agarwal B, Sangwan RS (2016) Thermo-chemical pretreatment of rice straw forfurther processing for levulinic acid production. Bioresour Technol 218:232–246
20. Emmel A, Mathias AL, Wypych F, Ramos LP (2003) Fractionation of Eucalyptus grandischips by dilute acid-catalysed steam explosion. Bioresour Technol 86(2):105–115
21. Farmer TJ, Mascal M (2015) Platform molecules. In: Introduction to chemicals from biomass.John Wiley & Sons, Ltd, pp 89–155
22. Fasching M, Schroder P, Wollboldt RP, Weber HK, Sixta H (2008) A new and facile methodfor isolation of lignin from wood based on complete wood dissolution. Holzforschung62(1):15–23
23. Forchheim D, Gasson JR, Hornung U, Kruse A, Barth T (2012) Modeling the lignindegradation kinetics in a ethanol/formic acid solvolysis approach. Part 2. validation andtransfer to variable conditions. Ind Eng Chem Res 51(46):15053–15063
24. Gasson JR, Forchheim D, Sutter T, Hornung U, Kruse A, Barth T (2012) Modeling the lignindegradation kinetics in an ethanol/formic acid solvolysis approach. Part 1. Kinetic modeldevelopment. Ind Eng Chem Res 51(32):10595–10606
25. Grestini C (2011) Conversion of lignin: chemical technologies and biotechnologies.EuroBioRef Summer School, Universita Degli Studi di Roma, Castro Marina, Lecce, Italy
26. Guo F, Fang Z, Xu CC, Smith RL (2012) Solid acid mediated hydrolysis of biomass forproducing biofuels. Prog Energy Combust Sci 38(5):672–690
27. Haberl H, Erb K-H, Krausmann F, Bondeau A, Lauk C, Müller C, Plutzar C, Steinberger JK(2011) Global bioenergy potentials from agricultural land in 2050: sensitivity to climatechange, diets and yields. Biomass Bioenerg 35(12):4753–4769
28. Harris EE, D’Ianni J, Adkins H (1938) Reaction of hardwood lignin with hydrogen. J AmChem Soc 60(6):1467–1470
29. Hattori H, Ono Y (2015) Solid acid catalysis: from fundamentals to applications. CRC Press30. Herrera A, Tallez-Luis SJ, Ramarez JA, Vazquez M (2003) Production of xylose from
sorghum straw using hydrochloric acid. J Cereal Sci 37(3):267–27431. Hu R, Lin L, Liu T, Liu S (2010) Dilute sulfuric acid hydrolysis of sugar maple wood extract
at atmospheric pressure. Bioresour Technol 101(10):3586–359432. IEA (2014) World energy outlook 2014. International Energy Agency (IEA), Paris33. Isikgor FH, Becer CR (2015) Lignocellulosic biomass: a sustainable platform for the
production of bio-based chemicals and polymers. Polym Chem 6(25):4497–455934. Jia S, Cox BJ, Guo X, Zhang ZC, Ekerdt JG (2010) Decomposition of a phenolic lignin model
compound over organic N-bases in an ionic liquid. Holzforschung 64(5):577–58035. Jiang Y, Li X, Wang X, Meng L, Wang H, Peng G, Wang X, Mu X (2012) Effective
saccharification of lignocellulosic biomass over hydrolysis residue derived solid acid undermicrowave irradiation. Green Chem 14(8):2162–2167
36. Johann G (1959) Production of phenols by catalytic hydrogenation of lignin. US2870133 A37. Kaldstrom M, Kumar N, Murzin DY (2011) Valorization of cellulose over metal supported
mesoporous materials. Catal Today 167(1):91–9538. Karinen R, Vilonen K, Niemel M (2011) Biorefining: heterogeneously catalyzed reactions of
carbohydrates for the production of furfural and hydroxymethylfurfural. ChemSusChem 4(8):1002–1016
39. Kobayashi H, Ohta H, Fukuoka A (2012) Conversion of lignocellulose into renewablechemicals by heterogeneous catalysis. Catal Sci Technol 2(5):869–883
40. Kootstra AMJ, Beeftink HH, Scott EL, Sanders JPM (2009) Comparison of dilute mineral andorganic acid pretreatment for enzymatic hydrolysis of wheat straw. Biochem Eng J46(2):126–131
41. Kumar P, Barrett DM, Delwiche MJ, Stroeve P (2009) Methods for pretreatment oflignocellulosic biomass for efficient hydrolysis and biofuel production. Ind Eng Chem Res48(8):3713–3729
30 B. Agarwal et al.

42. Kuster BFM, Der Van Steen HJC (1977) Preparation of 5-hydroxymethylfurfural Part I.Dehydration of fructose in a continuous stirred tank reactor. Starch 29(3):99–103
43. Lavoie J-M, Bara W, Bilodeau M (2011) Depolymerization of steam-treated lignin for theproduction of green chemicals. Bioresour Technol 102(7):4917–4920
44. Lee SH, Doherty TV, Linhardt RJ, Dordick JS (2009) Ionic liquid-mediated selectiveextraction of lignin from wood leading to enhanced enzymatic cellulose hydrolysis.Biotechnol Bioeng 102(5):1368–1376
45. Li C, Zhao ZK (2007) Efficient acid catalyzed hydrolysis of cellulose in ionic liquid. AdvSynth Catal 349(11–12):1847–1850
46. Li H, Qu Y, Xu J (2015) Microwave-Assisted conversion of lignin. In: Fang Z, Smith JLR,Qi X (eds) Production of biofuels and chemicals with microwave. Springer, Netherlands,Dordrecht, pp 61–82
47. Liguori L, Barth T (2011) Palladium-Nafion SAC-13 catalysed depolymerisation of lignin tophenols in formic acid and water. J Anal Appl Pyrol 92(2):477–484
48. Lima S, Fernandes A, Antunes MM, Pillinger M, Ribeiro F, Valente AA (2010) Dehydrationof xylose into furfural in the presence of crystalline microporous silicoaluminophosphates.Catal Lett 135(1–2):41–47
49. Lloyd TA, Wyman CE (2005) Combined sugar yields for dilute sulfuric acid pretreatment ofcorn stover followed by enzymatic hydrolysis of the remaining solids. Bioresour Technol96(18):1967–1977
50. Luterbacher JS, Rand JM, Alonso DM, Han J, Youngquist JT, Maravelias CT, Pfleger BF,Dumesic JA (2014) Nonenzymatic sugar production from biomass using biomass-derivedgamma-valerolactone. Science 343(6168):277–280
51. Mandalika A, Runge T (2012) Enabling integrated biorefineries through high-yieldconversion of fractionated pentosans into furfural. Green Chem 14(11):3175–3184
52. Marzialetti T, Valenzuela Olarte MB, Sievers C, Hoskins TJC, Agrawal PK, Jones CW (2008)Dilute acid hydrolysis of Loblolly pine: a comprehensive approach. Ind Eng Chem Res47(19):7131–7140
53. McIntosh S, Vancov T (2010) Enhanced enzyme saccharification of Sorghum bicolor strawusing dilute alkali pretreatment. Bioresour Technol 101(17):6718–6727
54. Misson M, Haron R, Kamaroddin MFA, Amin NAS (2009) Pretreatment of empty palm fruitbunch for production of chemicals via catalytic pyrolysis. Bioresour Technol100(11):2867–2873
55. Moreno-Recio M, Santamaría-González J, Maireles-Torres P (2016) Brönsted and Lewis acidZSM-5 zeolites for the catalytic dehydration of glucose into 5-hydroxymethylfurfural. ChemEng J 303:22–30
56. Mosier N, Wyman C, Dale B, Elander R, Lee YY, Holtzapple M, Ladisch M (2005) Featuresof promising technologies for pretreatment of lignocellulosic biomass. Bioresour Technol96(6):673–686
57. Motoyoshi O, Yoshio M, Kan K (1963) Process of liquefaction of lignin58. Panagiotou G, Olsson L (2007) Effect of compounds released during pretreatment of wheat
straw on microbial growth and enzymatic hydrolysis rates. Biotechnol Bioeng 96(2):250–25859. J-Y Park, Shiroma R, Al-Haq MI, Zhang Y, Ike M, Arai-Sanoh Y, Ida A, Kondo M,
Tokuyasu K (2010) A novel lime pretreatment for subsequent bioethanol production from ricestraw calcium capturing by carbonation (CaCCO) process. Bioresour Technol101(17):6805–6811
60. Qi X, Guo H, Li L (2011) Efficient conversion of fructose to 5-hydroxymethylfurfuralcatalyzed by sulfated zirconia in ionic liquids. Ind Eng Chem Res 50(13):7985–7989
61. Rackemann DW, Doherty WO (2011) The conversion of lignocellulosics to levulinic acid.Biofuels, Bioprod Biorefin 5(2):198–214
62. Ragg PL, Fields PR, Tinker PB (1987) The development of a process for the hydrolysis oflignocellulosic waste [and discussion]. Philos Trans R Soc Lond A: Math, Phys Eng Sci321(1561):537–547
Sustainable Production of Chemicals and Energy Fuel Precursors … 31

63. Raven PH, Evert, R.F. (1992) Biology of plants. 6th Edition edn. W.H. Freeman andCompany/Worth Publishers
64. Rinaldi R, Palkovits R, Schath F (2008) Depolymerization of cellulose using solid catalysts inionic liquids. Angew Chem Int Ed 47(42):8047–8050
65. Rita de Cassia LB, Rocha GJM, Rodrigues D, Helcio Filho JI, Maria das Gracas AF,Pessoa A (2010) Scale-up of diluted sulfuric acid hydrolysis for producing sugarcane bagassehemicellulosic hydrolysate (SBHH). Bioresour Technol 101(4):1247–1253
66. Rivas B, Domanguez JM, Domanguez H, Paraji JC (2002) Bioconversion of posthydrolysedautohydrolysis liquors: an alternative for xylitol production from corn cobs. Enzyme MicrobTechnol 31(4):431–438
67. Roberts V, Stein V, Reiner T, Lemonidou A, Li X, Lercher JA (2011) Towards quantitativecatalytic lignin depolymerization. Chem A: Eur J 17(21):5939–5948
68. Rosatella AA, Simeonov SP, Frade RF, Afonso CA (2011) 5-hydroxymethylfurfural(HMF) as a building block platform: Biological properties, synthesis and syntheticapplications. Green Chem 13(4):754–793
69. Rubin EM (2008) Genomics of cellulosic biofuels. Nature 454(7206):841–84570. Saha B, Abu-Omar MM (2014) Advances in 5-hydroxymethylfurfural production from
biomass in biphasic solvents. Green Chem 16(1):24–3871. Saha BC, Iten LB, Cotta MA, Wu YV (2005) Dilute acid pretreatment, enzymatic
saccharification and fermentation of wheat straw to ethanol. Process Biochem40(12):3693–3700
72. Shen Y, Sun J-K, Yi Y-X, Wang B, Xu F, Sun R-C (2015) One-pot synthesis of levulinic acidfrom cellulose in ionic liquids. Bioresour Technol 192:812–816
73. Song Q, Wang F, Cai J, Wang Y, Zhang J, Yu W, Xu J (2013) Lignin depolymerization(LDP) in alcohol over nickel-based catalysts via a fragmentation/hydrogenolysis process.Energy Environ Sci 6(3):994–1007
74. Stark K, Taccardi N, Basmann A, Wasserscheid P (2010) Oxidative depolymerization oflignin in ionic liquids. ChemSusChem 3(6):719–723
75. Sun Y, Cheng J (2002) Hydrolysis of lignocellulosic materials for ethanol production: areview. Bioresour Technol 83(1):1–11
76. Swatloski RP, Spear SK, Holbrey JD, Rogers RD (2002) Dissolution of cellose with ionicliquids. J Am Chem Soc 124(18):4974–4975
77. Taherzadeh MJ, Karimi K (2008) Pretreatment of lignocellulosic wastes to improve ethanoland biogas production: a review. Int J Mol Sci 9(9):1621–1651
78. Tan SSY, MacFarlane DR, Upfal J, Edye LA, Doherty WOS, Patti AF, Pringle JM, Scott JL(2009) Extraction of lignin from lignocellulose at atmospheric pressure using alkylbenzene-sulfonate ionic liquid. Green Chem 11(3):339–345
79. Teong SP, Yi G, Zhang Y (2015) Hydroxymethylfurfural production from bioresources: past,present and future. Green Chem 16(4):2015–2026
80. Wang H, Tucker M, Ji Y (2013) Recent development in chemical depolymerization of lignin:a review. J Appl Chem
81. Werpy T, Petersen G, Aden A, Bozell J, Holladay J, White J, Manheim A, Eliot D, Lasure L,Jones S (2004) Top value added chemicals from biomass. Volume 1-results of screening forpotential candidates from sugars and synthesis gas. DTIC Document
82. Yoshikawa T, Yagi T, Shinohara S, Fukunaga T, Nakasaka Y, Tago T, Masuda T (2012)Production of phenols from lignin via depolymerization and catalytic cracking. Fuel ProcessTechnol 108:69–75
83. Zakzeski J, Bruijnincx PCA, Jongerius AL, Weckhuysen BM (2010) The catalyticvalorization of lignin for the production of renewable chemicals. Chem Rev110(6):3552–3599
85. Zhang Z, Zhao ZK (2010) Microwave-assisted conversion of lignocellulosic biomass intofurans in ionic liquid. Bioresour Technol 101(3):1111–1114
32 B. Agarwal et al.

84. Zhang D, Ong YL, Li Z, Wu JC (2012) Optimization of dilute acid-catalyzed hydrolysis of oilpalm empty fruit bunch for high yield production of xylose. Chem Eng J 181:636–642
86. Zhao X, Cheng K, Liu D (2009) Organosolv pretreatment of lignocellulosic biomass forenzymatic hydrolysis. Appl Microbiol Biotechnol 82(5):815–827
87. Zheng Y, Zhao J, Xu F, Li Y (2014) Pretreatment of lignocellulosic biomass for enhancedbiogas production. Prog Energy Combust Sci 42:35–53
88. Zhou C-H, Xia X, Lin C-X, Tong D-S, Beltramini J (2011) Catalytic conversion oflignocellulosic biomass to fine chemicals and fuels. Chem Soc Rev 40(11):5588–5617
89. Zi G, Yan Z, Wang Y, Chen Y, Guo Y, Yuan F, Gao W, Wang Y, Wang J (2015) Catalytichydrothermal conversion of carboxymethyl cellulose to value-added chemicals over metal–organic framework MIL-53 (Al). Carbohydr Polym 115:146–151
Sustainable Production of Chemicals and Energy Fuel Precursors … 33

Microbial Electrochemical Platform:Biofactory with Diverse Applications
S. Venkata Mohan, G. Velvizhi and P. Chiranjeevi
Abstract Microbial electrochemical technologies (MET) have significant potentialto negate the impending energy, and renewable feedstock crisis. METs have evolvedinto a sustainable and eco-friendly solutions owing to their diverse applications likemicrobial fuel cell (MFC), for power generation, bioelectrochemical treatment(BET) for wastewater remeduiation, microbial desalination cell (MDC) for saltremoval and resource recovery, microbial electrolysis cell (MEC) for the productionof Hydrogen by applying external potential and bioelectrochemical syntheis(BES) for value-added products production and other applications such as plantmicrobial fuel cells (P-MFC) and artificially constructed wetlands fuel cells(CW-MFC) utilize the root exudates for power generation, biosensor applications,etc. This chapter draws light upon the multifaceted application of MET and theirspecific operational mechanism along with their futuristic integrations and devel-opmental models.
Keywords Electro-fermentation � Bioelectrochemical treatment (BET) �Microbialfuel cell (MFC) � Microbial desalination cell (MDC)
1 Introduction
Microbial catalyzed electrochemical systems (MES) are multi-disciplinary hybridsystems emerging as a potential platform with multi-facet applications.Exo-electrogens has become an increasingly important platform for the production ofbiofuels and chemicals from renewable resources [22, 77, 78]. Microbes are effec-tive cleavers of organic substrate to generate electrons and protons. Fewmicrobes are
S. Venkata Mohan (&) � G. Velvizhi � P. ChiranjeeviBioengineering and Environmental Science (BEES), CSIR-Indian Instituteof Chemical Technology (CSIR-IICT), Hyderabad 500 007, Indiae-mail: [email protected]
© Springer Nature Singapore Pte Ltd. 2017A.K. Agarwal et al. (eds.), Biofuels, Green Energy and Technology,DOI 10.1007/978-981-10-3791-7_3
35

able to transport electrons beyond their cell boundaries and thereby, electricallyinteracting with the external environment creating a specific niche to be developedinto an advanced bio-processes by harnessing these electrons with the insertion of theelectrodes [37]. Bacteria–electrode interactions exchange the electrons and uses forwider applications such as bioelectricity, wastewater treatment, production ofvalue-added products etc. Research has been originally initiated for harvesting powerfrom microbial fuel cell (MFC) taking advantage of biocatalyst metabolic function.Then,MESnurtured and fragmented into various processeswhich increased the scopein utilizing the reducing equivalents (electrons and protons) for the remediation ofwastewater as bio-electrochemical treatment (BET) [75, 76] and desalinating saltwater as microbial desalination cell (MDC) [51], supplying external energy in addi-tion to in situ potential for the production of hydrogen as microbial electro-synthesiscell (MEC) [77] and synthesis of value-added products as bioelectrochemical systems(BES) [44]. Other applications like utilizing root of plant and utilizing artificiallyconstructed wetlands (CW) for power generation and biosensor application, etc. werealso reported [2, 3, 11, 79]. Overcoming metabolic redox limitations by electronexchange between microbes and electrodes enhances the yield [37, 59, 77, 78].This chapter outlines the principles associated with MES operation with particularemphasis on its multifaceted applications (Fig. 1).
Microbial Electrochemical systems
H+ + e- + CO2
e-O2
H+
PEM
Substrate e-
Anaerobic Metabolism
An
od
e
Air Pump
O2
O2
H2O
Cat
ho
de
H+
H+
H+
H+
Wet Land MFC
Microbial Desalination Cell
Microbial Electrolysis Cell
BioelectrochemicalSystem/Electrofermentation
Bioelectrochemical Treatment
Microbial Fuel Cell
Plant Microbial Fuel Cell
Power pack Applied poten al
e-
e-
e-
e-
e-
H+
H+
H+
H+
e-
e-e-
Microbial electrolysis cell
TreatedWastewater
H2
Fig. 1 Multi-faceted applications of microbial catalyzed electrochemical systems
36 S. Venkata Mohan et al.

2 Electron Transfer
Few microorganisms have a unique mechanism to transfer electrons extracellularlyto electrodes that are distant from the cell surface through microbial electrontransport chains. The microbes utilize the substrates and generate the electrons andprotons, and these reducing equivalents move via series of redox mediators towardsan available terminal electron acceptor (TEA). This facilitates generation ofenergy-rich phosphate bonds that are useful for the microbial growth and subse-quent metabolic activities which occur inside the cell. Bacteria can communicatewith external electron acceptors from the cell to the artificially placed electrodethrough direct contact and electron shuttling mediators and through electricallyconductive appendages (nanowires/pilin) [56, 59]. Microorganisms transfer elec-trons between their cytoplasmic membrane and extracellular electrodes through anetwork of redox and structural proteins. These proteins often form specific path-way that are electrically and physically connected to intracellular metabolic pro-cesses with redox transformation to extracellular electron acceptors that are beyondthe outer membrane. Various ‘C’ type cytochromes present on the bacterial plasmamembrane transfer electrons to the electrode through Mtr pathway which is themain route for the reduction of external inorganic electron acceptors or electrodesby both direct and mediated exo-electron transport (EET) [16, 77]. Geobacter,Rhodoferax and Shewanella are reported bacterial species for their exo-cellularelectron transfer through membrane-bound organelles [41, 56].
3 Applications of MES
The application of MES depends upon the efficiency of electron transfer machinerybased on the electrode-bacterial interactions in the system. The electron fluxmanifested by bacteria can be harnessed for power generation, pollutant remedia-tion and production of commercial viable value-added product (Fig. 1).
3.1 Microbial Fuel Cell (MFC)
Microbial fuel cells (MFCs) configures with an arrangement of anode and cathodesandwiched with a membrane, in the anode chamber anaerobic bacteria oxidizes thesubstrates to release electrons and protons, the protons pass through the membraneto the cathode and the electrons pass through the external circuit originating as ameasurable direct current flow (Table 1). The potential difference developed by thesolid electrode based on the bacterial activity will be used as overall cell electro-motive force to harvest electricity. The biochemical reactions occurring during theoperation of MFC with glucose is represented below.
Microbial Electrochemical Platform: Biofactory … 37

C6H12O6 þ 6H2O ! 6CO2 þ 24Hþ þ 24e� ðAnodeÞ ð1Þ
4e� þ 4Hþ þO2 ! 2H2O Cathodeð Þ ð2Þ
C6H12O6 þ 6H2Oþ 6 O2 ! 6CO2 þ 12H2O Overallð Þ ð3Þ
MFC was originated with the dual chamber by separating both the anode andcathode chamber through the membrane where the oxidation and reduction reac-tions could occur respectively [66, 69–72, 77]. In single chambered systems thecathodic chamber is eliminated by providing an open-air cathode, which accountsfor economics in construction and operation. Research was carried out by elimi-nating the membrane, though the performance of single chamber is relatively lowcompared to the double chamber in terms of electrogenic activity due to theinherent limitations in the cathodic reduction reactions but single chambermembrane-less are cost effective and could be easily commercialized. Irrespectiveof the configuration, MFC performance is independent of reactor volume becausethe possible theoretical potential in MFC is around 1.2 V [higher electron donorsand acceptors NAD+ (−0.32 V) and O2 (+0.816 V) are available in the biologicalsystem]. Henceforth, to enhance the power generation stacked MFCs were designedby connecting multiple MFCs in series connection [34, 60, 87, 94]. Four MFC’swere stacked by sandwiching multifunctional paper layers for two-chambered fuelcell configuration for potentially powering on-chip paper based MFCs [24].A stacked MFC with a total volume of 72 L was constructed with granular activatedcarbon (GAC) packed bed electrodes [13]. Various applications of MFC are dis-cussed as follows.
Table 1 Bioelectrogenesis with respect to fuel cell configuration
Configuration Power Reference
Single chamber 150 mW/m2 Min and Logan [43]
Flat plate MFC 72 mW/m2 Min and Logan [43]
Double chamber 1.3 mA/cm2 Niessen et al. [49]
Single chamber 305 mW/m2 Liu et al. [40]
Single chamber 354 mW/m2 Heilmann and Logan [28]
Single chamber 269 mW/m2 Heilmann and Logan [28]
Stacked MFC 258 W/m3 Aelterman et al. [4]
Double chamber 170 mW/m2 He et al. (2008)
Single chamber 211 mA/m2 Venkata Mohan et al. [69]
Single chamber 182.85 mA/m2 Venkata Mohan et al. [71]
Benthic MFC 35.08 mW/m2 Venkata Mohan et al. [76]
Single chamber 401 mW/m2 Sharma and Li [58]
Single chamber 107.89 mW/m2 Goud et al. [27]
Basic stack MFC 1184 mW/m2 Kim et al. [34]
Double chamber 66.21 mW/m2 Venkata Mohan et al. [81]
38 S. Venkata Mohan et al.

3.1.1 Plant-MFC
Plant rhizo-deposition (root exudates) constitutes major photosynthetic product andprovides the supplementation of the carbon required for the propagation of microbialconsortia which in turn, simplify the nutrients in the soil and make them amenablefor the plant root system to absorb. The plant-microbial interactions at rhizosphererepresent a favorable microenvironment for both bacterial and plant growth (uti-lizing plant rhizo-deposits) as well as mediate reducing equivalents for harnessingbioelectricity by incorporation of solid non-catalyzed electrode assembly (MFCsystem) which facilitates the transformation of solar energy into green electricity(Fig. 2 and Table 2). P-MFC (Plant MFC) with Reed mannagrass (Glyceria max-ima) using cation exchange membrane for harnessing of power was well studied[62]. Rice field embedded MFC was also reported to produce good power [10, 18,33]. Bio-cathode was successfully integrated into P-MFC and operated for longterm, wherein power density increased with the continuous growth of the plant anddue to the high redox potential of oxygen which was effectively catalyzed bymicroorganisms in the cathode [85]. The new composition of the plant-growthmedium (modified Hoagland medium) with fewer nitrates, high-ammonium basedmacro and micro-nutrients, balanced amount of bicarbonate buffer and addition ofsulfates helped to maximize current production of P-MFC [30, 31]. The theoreticalcalculations between Spartina anglica salt marsh and Phragmites australis peat
Fig. 2 Plant-microbial fuel cell (P-MFC)
Microbial Electrochemical Platform: Biofactory … 39

soil in P-MFC setup showed that salt marsh generated 10 times more power than theP-MFC in peat soil due to the tidal advection [86]. The tubular P-MFC was designedto increase the feasibility of the P-MFC with the graphite felt and graphite granulesrespectively. Graphite felt exhibited 15 times higher power output than the P-MFCwith the graphite granules based on the mass of the electrode material due to thereduction of anode electrode material while achieving higher power outputs persquare meter of the membrane [65]. The feasibility of power generation bynon-destructive usage of rhizo-deposits of Pennisetum setaceum plant was studiedin rhizosphere based MFC (R-MFC) [11]. Miniatured ecologically engineeredsystem with submerged emergent and floating macrophytes embedded with fuelcells were studied for harnessing bioelectricity along with simultaneous wastewatertreatment [12, 79].
3.1.2 Wetland Constructed MFC
Apart from power generation, sediment microbial fuel cell (S-MFCs) enhances theoxidation of reduced compounds at the anode, thus bringing about the removal ofexcessive or unwanted reducing equivalents from submerged soils (Fig. 3). The twobiologically mediated cathodic reactions, oxygen reduction, and manganese cycleimply a low cost and high electrode potential. They are of particular interest forreactor-type S-MFCs and go beyond energy generation for low-power applications[18]. The light/dark effect on power output were studied and found fluctuations dueto the photosynthetic activity of the macrophytes (Phragmites australis) at darkcondition (night time). A pilot-scale subsurface constructed wetland system fortreating domestic wastewater was studied with horizontal flow (HF) and undervertical flow (VF) modes [6]. A low-cost PVC-made structure is constructed toharvest electricity from mangrove environment located in French Guiana [54].A bench-scale constructed wetland was operated for 400 days with groundwater
Table 2 Plant-microbial fuel with respect to plant species for harnessing power
Plant species Power Reference
Glyceria Maxima 67 mW/m2 Strik et al. [62]
Oryza sativa L. cv.Sasanishiki
6 mW/m2 Kaku et al. [33]
Oryza sativa sp. indica 33 mW/m2 De Schamphelaire et al. [18, 19]
Spartina anglica 222 mW/m2 Helder et al. [29]
Oryza sativa L. cv.Satojiman
14 mW/m2 Takanezawa et al. [63]
Floating macrophyte based ecosystem 224 mA/m2 Venkata Mohan et al. [79]
Flat plate plant MFC 5.8 W/m3 Helder et al. [30, 31]
Pennisetum setaceum 163 mW/m2 Chiranjeevi et al. [11]
Submerged and emergent macrophytes 179.78 mW/m2 Chiranjeevi et al. [12]
40 S. Venkata Mohan et al.

contaminated with benzene, methyl-test-butyl ether (MTBE), and ammonium(NH4
+) [84]. Upflow constructed wetland–microbial fuel cell (UFCW–MFC)planted with cattail was used for simultaneous wastewater treatment and electricitygeneration by using carbon felt as an electrode material. Dewatered alum sludge(DAS) based vertical upflow constructed wetland (CW) was integrated with MFC.Powdered activated carbon (PAC) was used in the anode area in varied percentagewith DAS to explore its influences on the performance of CW-MFC system [88].
3.2 Bioelectrochemical Treatment (BET)
Bioelectrochemical treatment (BET) systems functions with electrodes as electronacceptor and exploit microbial catabolic activities to degrad organic molecules [36,66, 75, 76]. BET has the advantage of coupling both electrochemical and anaerobicbiological processes, which triggers the redox reactions for the degradation ofcomplex pollutants with simultaneous power generation [45, 76, 91]. Whenwaste/wastewater functions as an electron donor or acceptor, its remediation isaccomplished by anodic oxidation or cathodic reduction under defined conditions.In addition to in situ bio-potential, anodic oxidation and cathodic reduction reac-tions have a positive influence on pollutant removal [67]. BET was reported to treatwastewater viz., distillery [45], dairy waste [77], Complex chemical wastewater[21, 73–75], Pharmaceutical wastewater [66]; petrochemical wastewater [8] Paperand pulp [38], Azo dye based wastewater [61], breweries wastewater [17],pre-irrigation treatment wastewater etc. [1]. Various application of BET are dis-cussed as follows.
Fig. 3 Constructed wetlandsystems integrated with MFC
Microbial Electrochemical Platform: Biofactory … 41

3.2.1 Metal Recovery
Bioelectrochemical treatments (BET) have emerged as a potential technologicalplatform for recovery of metal ions from metallurgical waste. The general approachof bio-electrochemical metal recovery is using metals as the electron acceptor in thecathode chamber and organic waste as the electron donor in the anode chamber [47,83]. The bio-potential/in situ potential developed in bio-electrochemical systemsacts as the driving force towards metal removal and recovery. Some of the metalions can be recovered by using the in situ generated potential, whereas other metalions can be recovered by the ex situ or externally applied potential [32, 39, 64, 82].Bacteria play a crucial role in the biotic systems by utilizing the organic substrateand thereby liberate reducing equivalents which act as the power source in reducingthe metal species. Various metals, viz. Ag, Au, V, Pb, Cd, Cr and Cu, Se(IV), V(V),Ag(I), Cu(II), Mn(IV) and Cr(VI) have been recovered in the bio-electrochemicalsystems by the action of a biotic anode and abiotic cathode [47, 48, 82, 92]. Themetal compounds act as good electron sinks due to their high electronegativity andcan be reduced to a different oxidation states [35]. Since, many metals haveeffective electron accepting conditions the bio-cathodes have shown good perfor-mances in removing and recovering metals, but high concentration metal solutionsgenerally inhibit microbial activities and reduce system efficacy. The electrostaticinteractions between the cathode and metal ions affect metal recovery efficiency, theelectrostatic attraction facilitates metal cations to move toward the cathode, whileelectrostatic repulsion inhibits the approaching of metal anions to the cathode [83].The scope for future research in metal reduction through bioelectrochemical sys-tems include the strategies on developing efficient cathode materials, optimum fuelcell configurations, circuit design and biocatalyst enrichment to improve thereduction reactions towards metal removal/recovery.
3.3 Bioelectrochemical System (BES)
Bioelectrochemical systems (BES) synthesize electricity driven chemical com-pounds through a series of microbial catalyzed reactions based on theelectrode-bacteria interactions [20, 26, 52, 55, 93]. The reduction mechanism inMES processes could be used for the production of reduced end product rather thanpollutant degradation. Some of the product formations require less redox potentialwhich can be accomplished by the in situ bio-potential generated in the system,while some reactions require more redox potential at cathode which could beapplied externally to meet the energy necessary to cross the thermodynamic barrierfor product formation [80]. BES have been gaining prominence for sequesteringCO2, where the electro-lithoautotrophs act as biocatalysts for the reduction of CO2
to platform chemicals (C1-C6) by utilizing electrons directly derived from
42 S. Venkata Mohan et al.

solid-inorganic electron donors (electrode) [44, 81]. Carbon chain elongation fromC1 to higher-chain compounds originates from acetate (C2) towards propionate(C3), butyrate (C4), or caproate (C6) and derived from the chain elongationprocesses.
3.4 Microbial Electrolysis
Hydrogen is one of the alternative renewable fuels having high impact in thepresent bioenergy research. H2 production through acidogenic fermentation waswell established and understood with respect to the operational and regulatingfactors [14, 68, 71]. However, there are some drawbacks for the fermentativeH2 production, due to its low substrate conversion efficiency, accumulation ofcarbon-rich acid intermediates, an imbalance in buffering the system by a suddendrop in system pH, etc. [68, 72]. Microbial electrolysis cell (MEC) combines theconventional acidogenic process with electrochemical hydrolysis [5, 78, 89]. Thereducing equivalents generated during fermentation move through a series of redoxcomponents towards an available terminal electron acceptor. However, the electronflow slows down due to the thermodynamic feasibility which requires additionaldrive for the electrons to flow. Hence external potential is applied to the system todrive the electrons for the hydrogen production. External potential results in thegrowth of electrochemically active microbes on anode which can discharge elec-trons more effectively [32]. MEC has potential for application within the wastew-ater industry, reducing energy and operation costs [15].
3.5 Microbial Desalination
Conventionally, desalination process involves high energy inputs and are operatedusing very expensive setups. Therefore, developing sustainable desalination tech-nologies is being seriously considered. In this context, microbial desalination cell(MDC) is an emerging area which requires less energy inputs and also harnessesenergy from the process [23, 53]. MDC is configured with three chambers intro-ducing an additional salt water chamber separated from an anode chamber with ananion exchange membrane (AEM), and from a cathode chamber with a cationexchange membrane (CEM) [90]. The anode chamber is responsible for organicdegradation and electricity production, the middle chamber is responsible for saltremoval while the cathode chamber completes the electrical loop [46].Continuously operated upflow, stacked MDC, simultaneous desalination andhydrogen production are also being evaluated in MDC. The performance of MDCdepends on the internal resistance, including ohmic, charge transfer, and masstransfer resistances. Apart from low energy inputs, it can also simultaneously tackle
Microbial Electrochemical Platform: Biofactory … 43
multi-pollutant removal, saline water desalination, resource recovery and valueaddition advocating sustainable water infrastructure [51].
3.6 Electro-Fermentation
Electro-fermentation (EF) melds conventional microbial fermentative on withelectrochemistry. By application of very low potentials of electrical field across theelectrodes incorporated in the fermentation medium which influences the fermen-tative environment and microbial metabolism. This electromotive induced regula-tion of anaerobic fermentation is termed electro-fermentation and can be employedto produce desirable biochemicals. EF is improved with selectively enrichedmicrobial cultures, increases carbon efficiency, reducing the use of chemicals forpH control; in some cases enhance product recovery. Regulating the potentials ofthe electrical inputs to drive fermentation can also be used to maneuver both pureculture and mixed microbial fermentations. This innovative EF paves a new avenueto the existing industrial fermentation processes, to utilize organic waste towardsthe value-added product in a biorefinery approach [50].
3.7 Other Applications
Apart from the above applications MES are also used as Photosynthetic fuel cells(PhFC) which is similar to the MFC in operation but instead of chemotrophicmechanism, phototrophic bacteria will act as biocatalyst [7]. MEC are also beingused as biosensors [2, 3, 9, 25, 42, 57]. Micro-MFC was developed forhigh-throughput screening and sensitivity analyses of biological and electrochem-ical performance parameters.
4 Conclusion
Great efforts are being made to improve the performance of MES and advance theirtranslational potential toward real-world applications. Significant improvement inMES performance can be achieved with the development of new techniques insynthetic biology that can regulate microbial metabolic pathways or control theirgene expression and generate high-throughput rapid screening tools for microbialbio-power production. To enhance the efficacy of its application, a special focus onthe essential connection of redox reactions and energy metabolism, should beanalyzed in depth. Synergistic interaction between the MES components and bio-catalyst needs to be optimized to maximize the product recovery and energy gen-eration. MES has wide scope in upgrading the existing effluent treatment plants
44 S. Venkata Mohan et al.

(ETP) by integrating with BET which might be an added advantage with dualbenefit of treatment and bioelectricity generation. The value-added products syn-thesized by elector-fermentation is also an emerging field which requires morefocus on electrical potential and impact on the metabolism of the organism forexploiting external electron transfer for the enhanced yield.
Acknowledgements The authors wish to thank the Director, CSIR-IICT for support andencouragement. Authors sincerely acknowledges support from Council of Scientific and IndustrialResearch (CSIR; SETCA (CSC-0113)), Department of Biotechnology (DBT) and Department ofScience and Technology (DST) in the form of research grants.
References
1. Abourached C, English MJ, Liu H (2016) Wastewater treatment by Microbial Fuel Cell(MFC) prior irrigation water reuse. J Cleaner Prod 137:144–149
2. Abrevaya XC, Sacco Natalia J, Bonetto Maria C, Hilding-Ohlsson Astrid, Cortón E (2015)Analytical applications of microbial fuel cells. part I: biochemical oxygen demand. BiosensBioelectron 63:580–590
3. Abrevaya XC, Sacco NJ, Bonetto MC, Hilding-Ohlsson A, Corton E (2015) Analyticalapplications of microbial fuel cells. part ii: toxicity, microbial activity and quantification,single analyte detection and other uses. Biosens Bioelectron 15(63):591–601
4. Aelterman P, Rabaey K, Pham HT, Boon N, Verstraete W (2006) Continuous electricitygeneration at high voltages and currents using stacked microbial fuel cells. Environ SciTechnol 40:3388–3394
5. Call D, Logan BE (2008) Hydrogen production in a single chamber microbial electrolysis celllacking a membrane. Environ Sci Technol 42:3401–3406
6. Camacho JV, Montano C, Andrés M, Rodrigo R, Jesús F, Morales F et al (2014) Energyproduction from wastewater using horizontal and vertical subsurface flow constructedwetlands 13:2517–2523
7. Chandra R, Subhash GV, Venkata Mohan S (2012) Mixotrophic operation ofphoto-bioelectrocatalytic fuel cell under anoxygenic microenvironment enhances the lightdependent bioelectrogenic activity. Bioresource Technol 109:46–56
8. Chandrasekhar K, Venkata Mohan S (2012) Bio-electrochemical remediation of real fieldpetroleum sludge as an electron donor with simultaneous power generation facilitatesbiotransformation of PAH: effect of substrate concentration. Bioresour Technol 110:517–525
9. Chang IS, Jang JK, Gil GC, Kim M, Kim HJ, Cho BW, Kim BH (2004) Continuousdetermination of biochemical oxygen demand using microbial fuel cell type biosensor.Biosens Bioelectron 19:607–613
10. Chen Z, Huang YC, Liang JH, Zhao F, Zhu YG (2012) A novel sediment microbial fuel cellwith a biocathode in the rice rhizosphere. Bioresour Technol 108:55–59
11. Chiranjeevi P, Mohanakrishna G, Venkata Mohan S (2012) Rhizosphere mediatedelectrogenesis with the function of anode placement for harnessing bioenergy through CO2
sequestration. Bioresour Technol 124(2012):364–37012. Chiranjeevi P, Chandra Rashmi, Venkata Mohan S (2013) Ecologically engineered
submerged and emergent macrophyte based system: an integrated eco-electrogenic designfor harnessing power with simultaneous wastewater treatment. Ecol Eng 51(2013):181–190
13. Chouler J, Padgett GA, Cameron PJ, Preuss K, Titirici M-M, Ieropoulos I, Lorenzo MD(2016) Towards effective small scale microbial fuel cells for energy generation from urine.Electrochimica Acta 192:89–98
Microbial Electrochemical Platform: Biofactory … 45

14. Clauwaert P, Verstraete W (2009) Methanogenesis in membrane less microbial electrolysiscells. Appl Microbiol Biotechnol 82:829–836
15. Cotterill SE, Curtis HT (2016) Microbial electrolysis cells for hydrogen production [chapter].[book] Microbial electrochemical and fuel cells, pp 287–319. doi:10.1016/B978-1-78242-375-1.00009-5In
16. Coursolle D, Baron DB, Bond DR, Gralnick JA (2010) The Mtr respiratory pathway isessential for reducing flavins and electrodes in Shewanella oneidensis. J Bacteriol 192:467–474
17. Dannys E, Green T, Wettlaufer A, Madhurnathakam CMR, Elkamel A (2016) Wastewatertreatment with microbial fuel cells: a design and feasibility study for scale-up inmicrobreweries. J Bioprocess Biotech 6:1–6
18. De Schamphelaire L et al (2008) Microbial fuel cells generating electricity from rhizodepositsof rice plants. Environ Sci Technol 42:3053–3058
19. De Schamphelaire L et al (2010) Microbial community analysis of anodes from sedimentmicrobial fuel cells powered by rhizodeposits of living rice plants. Appl Environ Microbiol76:2002–2008
20. Dennis PG, Harnisch F, Yeoh YK, Tyson GW, Rabaey K (2013) Dynamics ofcathode-associated microbial communities and metabolite profiles in a glycerol-fed bioelec-trochemical system. Appl Environ Microbiol 79:4008–4014
21. Dileep Y, Velvizhi G Venkata, Mohan S (2016) Coupling sequential batch reactor andbioelectrochemical treatment systems for treatment of complex wastewater associated withbioelectricity generation. Renew Energy 98:171–177
22. Du J, Shao Z (2011) Engineering microbial factories for synthesis of value-added products.J Ind Microbiol Biotechnol 38:873–890
23. ElMekawy A, Hanaa Ab, Hegabcde M, Pant D (2014) The near-future integration ofmicrobial desalination cells with reverse osmosis technology. Energy Environ Sci 7:3921
24. Fraiwan A, Choi S (2016) A stackable, two-chambered, paper-based microbial fuel cell.Biosens Bioelectron 15(83):27–32
25. Gil GC, Chang IS, Kim BH, Kim M, Jang JK, Park HS, Kim J (2003) Operational parametersaffecting the performance of a mediator-less microbial fuel cell. Biosens Bioelectron 18:327–334
26. Gildemyn S, Verbeeck K, Slabbinck R, Andersen SJ, Prévoteau A, Rabaey K (2015).Integrated production, extraction, and concentration of acetic acid from CO2 throughmicrobial electrosynthesis. Environ Sci Technol Lett 2:325–328
27. Goud RK, Babu PS, Venkata Mohan S (2011) Canteen based composite food waste aspotential anodic fuel for bioelectricity generation in single chambered microbial fuel cell(MFC): bio-electrochemical evaluation under increasing substrate loading condition. Int JHydrogen Energy 36:6210–6218
28. Heilmann J, Logan BE (2006) Production of electricity from proteins using a microbial fuelcell. Water Environ Res 78:531–537
29. Helder M et al (2010) Concurrent bio-electricity and biomass production in three plant–microbial fuel cells using Spartina anglica, Arundinella anomala and Arundo donax.Bioresour Technol 101:3541–3547
30. Helder M, Strik DPBTB, Hamelers HVM, Buisman CJN (2012a) The flat-plateplant-microbial fuel cell: the effect of a new design on internal resistances. BiotechnolBiofuels 5:70
31. Helder M, Strik DPBTB, Hamelers HVM, Kuijken RCP, Buisman CJN (2012b) Newplant-growth medium for increased power output of the plant-microbial fuel cell. BioresourTechnol 104:417–423
32. Huang L, Chai X, Chen G, Logan BE (2011) Effect of set potential on hexavalent chromiumreduction and electricity generation from biocathode microbial fuel cells. Environ Sci Technol45:5025–5031
33. Kaku N et al (2008) Plant/microbe cooperation for electricity generation in a rice paddy field.Appl Microbiol Biotechnol 79:43–49
46 S. Venkata Mohan et al.

34. Kim D, An J, Kim B, Jang JK, Kim BH, Chang IS (2012) Scaling-up microbial fuel cells:configuration and potential drop phenomenon at series connection of unit cells in sharedanolyte. Chem Sus Chem 5:1086–1091
35. Kim HJ, Park HS, Hyun MS, Chang IS, Kim M, Kim BH (2002) A mediator-less microbialfuel cell using a metal reducing bacterium, shewanella putrefaciens. Enzyme Microb Tech 30(2):145–152
36. Kiran Kumar A, Reddy MV, Chandrasekhar K, Srikanth S, Venkata Mohan S (2012)Endocrine disruptive estrogens role in electron transfer: bio-electrochemical remediation withmicrobial mediated electrogenesis. Bioresour Technol 104:547–556
37. Kracke F, Vassilev I, Kromer JO (2015) Microbial electron transportand energy conserva-tion–the foundation for optimizing bioelectrochemical systems. Front Microbiol 6:1–18
38. Krishna KV, Sarkar O, Venkata Mohan S (2014) Bioelectrochemical treatment of paper andpulp wastewater in comparison with anaerobic process: integrating chemical coagulation withsimultaneous power production. Bioresour Technol 174:142–151
39. Lefebvre O, Neculita CM, Yue X, Ng HY (2012) Bioelectrochemical treatment of acid minedrainage dominated with iron. J Hazard Mater 241–242:411–417
40. Liu H, Cheng SA, Logan BE (2005) Production of electricity from acetate or butyrate using asingle-chamber microbial fuel cell. Environ Sci Technol 39:658–662
41. Lovley DR (2006) Microbial fuel cells: novel microbial physiologies and engineeringapproaches. Cur. Opin Biotechnol 17:327–332
42. Lowy DA, Tender LM, Zeikus J, Park DH, Lovley DR (2006) Harvesting energy from themarine sediment–water interface II: kinetic activity of anode materials. Biosens Bioelectron21:2058–2063
43. Min B, Logan BE (2004) Continuous electricity generation from domestic wastewater andorganic substrates in a flat plate microbial fuel cell. Environ Sci Technol 38:5809–5814
44. Modestra JA, Navaneeth B, Venkata Mohan S (2015) Bioelectrocatalytic reduction of CO2:enrichment of homoacetogens and pH optimization towards enhancement of carboxylic acidsbiosynthesis. J CO2 Utilization 10:78–87
45. Mohana Krishna G, Venkata Mohan S, Sarma PN (2010) Bio-electrochemical treatment ofdistillery wastewater in microbial fuel cell facilitating decolorization and desalination alongwith power generation. J Hazard. Mater 177:487–494
46. Morel A, Zuo KC, Xia Xue, Wei JC, Xi L, Liang P, Huang X (2012) Microbial desalinationcells packed with ion-exchange resin to enhance water desalination rate. Bioresour Technol118:43–48
47. Nancharaiah YV, Venkata Mohan S, Lens PNL (2015) Removal and recovery of metal ions inmicrobial fuel cells: a review. Bioresour Technol 195:102–114
48. Nancharaiah YV, Venkata Mohan S, Lens PNL (2016) Biological and bioelectrochemicalrecovery of critical and scarce metals. Trends Biotech 137–155
49. Niessen J, Schroder U, Scholz F (2004) Exploiting complex carbohydrates for microbialelectricity generation—a bacterial fuel cell operating on starch. Electrochem Commun 6:955–958
50. Nikhil GN, Venkata Subhash G, Yeruva Dileep Kumar, Venkata Mohan S (2015) Synergisticyield of dual energy forms through biocatalyzed electrofermentation of waste: stoichiometricanalysis of electron and carbon distribution. Energy 88:281–291
51. Nikhil GN, Yeruva DK, Venkata Mohan S, Swamy YV (2016) Assessing potential cathodesfor resource recovery through wastewater treatment and salinity removal using non-bufferedmicrobial electrochemical systems. Bioresour Technol 215:247–253
52. Rabaey K, Rozendal RA (2010) Microbial electrosynthesis—revisiting the electrical route formicrobial production. Nat Rev Microbiol 8:706–716
53. Saeed HM, Husseini GA, Yousef S, Saif J, Al-Asheh Sameer, Abu Fara A, Azzam S,Khawaga R, Aidan A (2015) Microbial desalination cell technology: a review and a casestudy. Desalination 359:1–13
54. Salvin P, Ondel O, Roos C, Robert F (2014) Energy harvest with mangrove benthic microbialfuel cells 39:543–556
Microbial Electrochemical Platform: Biofactory … 47

55. Schievano A, Sciarria TP, Vanbroekhoven K, Wever HD, Puig S, Andersen SJ, Rabaey K,Deepak P (2016) Electro-fermentation—merging electrochemistry with fermentation inindustrial applications. Trends Biotechnol. 34:866–878
56. Schroder U (2007) Anodic electron transfer mechanisms in microbial fuel cells and theirenergy efficiency. Phys Chem Chem Phys 9:2619–2629
57. Shantaram A, Beyenal H, Veluchamy RRA, Lewandowski Z (2005) Wireless sensorspowered by microbial fuel cell. Environ Sci Technol 39:5037–5042
58. Sharma Y, Li BK (2010) The variation of power generation with organic substrates insingle-chamber microbial fuel cells (SCMFCs). Bioresour Technol 2010(101):1844
59. Shi L, Dong M, Reguera G, Beyenal H, Lu A, Liu J, Yu H, Fredrickson JF (2016)Extracellular electron transfer mechanisms between microorganisms and minerals. Nat RevMicrobiol 14:651–662
60. Shijia Wu, Hui Li, Chen X, Zhou Peng, Liang, Zhang X, Jiang Y, Huang X (2016) A novelpilot-scale stacked microbial fuel cell for efficient electricity generation and wastewatertreatment. Water Res 98:396–403
61. Sreelatha S, Velvizhi G, Naresh Kumar A, Venkata Mohan S (2016) Functional behaviourand treatment efficiency of bio-electrochemical system with increasing azo dye concentration:synergistic interactions of biocatalyst and electrode assembly. Bioresour Technol 213:11–20
62. Strik DPBTB et al (2008) Green electricity production with livingplants and bacteria in a fuelcell. Int J Energy Res 32:870–876
63. Takanezawa K et al (2010) Factors affecting electric output from ricepaddy microbial fuelcells. Biosci Biotechnol Biochem 74:1271–1273
64. Tandukar M, Huber SJ, Onodera T, Pavlostathis SG (2009) Biological chromium(VI)reduction in the cathode of a microbial fuel cell. Environ Sci Technol 43:8159–8165
65. Timmers RA, Strik DPBTB (2010) Long-term performance of a plant microbial fuel cell withSpartina anglica. Appl Microbiol Biotechnol 86:973–981
66. Velvizhi G, Venkata Mohan S (2011) Biocatalyst behaviour under self-induced electrogenicmicroenvironment in comparison with anaerobic treatment: evaluation with pharmaceuticalwastewater for multi-pollutant removal. Bioresour Technol 102:10784–10793
67. Velvizhi G, Venkata Mohan S (2015) Bioelectrogenic role of anoxic microbial anode in thetreatment of chemical wastewater: microbial dynamics with bioelectro-characterization. WaterRes 70:52–63
68. Venkata Mohan S, Veer Raghuvulu S, Srikanth S, Sarma PN (2007) Bioelectricity productionby meditorless microbial fuel cell (MFC) under acidophilic condition using wastewater assubstrate: influence of substrate loading rate. Curr Sci 92:1720–1726
69. Venkata Mohan S, Sarvanan R, Raghuvulu SV, Mohana Krishna G, Sarma PN (2008a)Bioelectricity production from wastewater treatment in dual chambered microbial fuel cell(MFC) using selectively enriched mixed microflora: effect of catholyte. Bioresour Technol99:596–603
70. Venkata Mohan S, Mohana Krishna G, Sarma PN (2008b) Effect of anodic metabolic functionon bioelectricity generation and substrate degradation in single chambered microbial fuel cell.Environ Sci Technol 42:8088–8094
71. Venkata Mohan S, Raghuvulu SV, Sarma PN (2008c) Biochemical evaluation ofbioelectricity production process from anaerobic wastewater treatment in a single chamberedmicrobial fuel cell (MFC) employing glass wool membrane. Biosen Bioelectron 23:1326–1332
72. Venkata Mohan S, Lalit Babu V, Sarma PN (2008d) Effect of various pretreatment methodson anaerobic mixed microflora to enhance biohydrogen production utilizing dairy wastewateras substrate. Bioresour Technol 99:59–67
73. Venkata Mohan S, Mohana Krishna G, Reddy BP, Sarvanan R, Sarma PN (2008e)Bioelectricity generation from chemical wastewater treatment in mediatorless (anode)microbial fuel cell (MFC) using selectively enriched hydrogen producing mixed culture underacidophilic microenvironment. Biochem Eng J 39:121–130
48 S. Venkata Mohan et al.

74. Venkata Mohan S, Mohana Krishna G, Srikanth S, Sarma PN (2008f) Harnessing ofbioelectricity in microbial fuel cell (MFC) employing aerated cathode through anaerobictreatment of chemical wastewater using selectively enriched hydrogen producing mixedconsortia. Fuel 87, 2667–2676
75. Venkata Mohan S, Veer Raghuvulu S, Dinakar P, Sarma PN (2009a) Integrated function ofmicrobial fuel cell (MFC) as bio-electrochemical treatment system associated withbioelectricity generation under higher substrate load. Biosens Bioelectron 24:2021–2027
76. Venkata Mohan S, Srikanth S, Raghuvulu SV, Mohanakrishna G, Kumar AK, Sarma PN(2009b) Evaluation of the potential of various aquatic eco-systems in harnessing bioelectricitythrough benthic fuel cell: effect of electrode assembly and water characteristics. BioresourTechnol. 100:2240–2246
77. Venkata Mohan S, Velvizhi G, Vamshi Krishna K, Lenin Babu M (2014a) Microbialcatalyzed electrochemical systems: A bio-factory with multi-facet applications. BioresourTechnol 165:355–364
78. Venkata Mohan S, Velvizhi G, Annie J, Srikanth S (2014b) Microbial fuel cells: Criticalfactors and Recent advancements. Renew Sustainable Energy Rev 40:779–797
79. Venkata Mohan S, Mohanakrishna G, Chiranjeevi P (2011b) Sustainable power genera-tionfrom floating macrophytes based ecological microenvironment through embedded fuelcellsalong with simultaneous wastewater treatment. Bioresour Technol 102:7036–7042
80. Venkata Mohan S, Srikanth S, Velvizhi G, Lenin Babu M (2013) Microbial fuel cells forsustainable bioenergy generation: principles and perspective applications (Chapter 11). In:Gupta VK, Tuohy MG (eds) Biofuel technologies: recent developments, Springer. ISBN978-3-642-34518-0
81. Venkata Mohan S, Annie J, Amulya K, Butti SK, Velvizhi G (2016) A circular bioeconomywith biobased products from CO2 sequestration. J Trends Biotechnol 34:506–519
82. Wang G, Huang L, Zhang Y (2008) Cathodic reduction of hexavalent chromium [Cr(VI)]coupled with electricity generation in microbial fuel cells. Biotechnol Lett 30(11):1959–1966
83. Wang H, Ren ZS (2014) Bioelectrochemical metal recovery from wastewater: a review. WaterRes 66:219–232
84. Wei M, Rakoczy J, Vogt C, Harnisch F, Schumann R, Richnow HH (2015) Bioresourcetechnology enhancement and monitoring of pollutant removal in a constructed wetland bymicrobial electrochemical technology. Bioresour Technol 196:490–499
85. Wetser K, Sudirjo E, Buisman CJN, Strik DPBTB (2015) Electricity generation by a plantmicrobial fuel cell with an integrated oxygen reducing biocathode. Appl Energy 137:151–157. doi:10.1016/j.apenergy.2014.10.006
86. Wetser K, Liu J, Buisman C, Strik D (2015) Biomass and Bioenergy Plant microbial fuel cellapplied in wetlands: spatial, temporal and potential electricity generation of Spartina anglicasalt marshes and Phragmites australis peat soils. Biomass Bioenergy 83:543–550
87. Wu S, Li H, Zhou X, Liang P, Zhang X, Jiang Y, Huang X (2016) A novel pilot-scale stackedmicrobial fuel cell for efficient electricity generation and wastewater treatment. Water Res98:396–403
88. Xu L, Zhao Y, Doherty L, Hu Y, Hao X (2016) Promoting the bio-cathode formation of aconstructed wetland-microbial fuel cell by using powder activated carbon modified alumsludge in anode chamber. Nat Publ Gr 1–9
89. Yuan H, Lu Y, Abu-Reesh IM, He Z (2015a) Bioelectrochemical production of hydrogen inan innovative pressure-retarded osmosis/microbial electrolysis cell system: experiments andmodeling. Biotechnol Biofuels 8:116. doi:10.1186/s13068-015-0305-0
90. Yuan H, Abu-Reesh IM, He Z (2015b) Enhancing desalination and wastewater treatment bycoupling microbial desalination cells with forward osmosis. Chem Eng J 270:437–443
91. Zachary AS, Dolfing J, Ren ZJ, Xu P (2016) Interplay of anode, cathode, and current inmicrobial fuel cells: implications for wastewater treatment. Energy Technol 4:583–592
92. Zhang LJ, Tao HC, Wei XY, Lei T, Li JB, Wang AJ, Wuc WJ (2012) Bioelectrochemicalrecovery of ammonia–copper (II) complexes from wastewater using a dual chamber microbialfuel cell. Chemosphere 89:1177–1182
Microbial Electrochemical Platform: Biofactory … 49

93. Zhao Z et al (2015) Potential for direct interspecies electron transfer in an electric-anaerobicsystem to increase methane production from sludge digestion. Sci Rep 5:11094
94. Zhuang L, Zheng Y, Zhou S, Yuan Y, Yuan H, Chen Y (2012) Scalable microbial fuel cell(MFC) stacks for continuous real wastewater treatment. Bioresour Technol 106:82–88
50 S. Venkata Mohan et al.

Biomass-Derived HMF Oxidationwith Various Oxidants
S. Saravanamurugan, Ashok Pandey and Rajender Singh Sangwan
Abstract This chapter describes the conversion of cellulosic biomass-derived 5-hydroxymethylfurfural (HMF) to various oxidation products, such as 2,5-diformylfuran (DFF), 5-hydroxymethyl-2-furancarboxylic acid (HMFCA), and 5-formyl-2-furancarboxylic acid (FFCA), with solid catalysts containing with andwithout metal(s) in the presence of various solvents including water. This chapterfurther describes the influence of various oxidant, such as hydrogen peroxide (H2O2)and tert-butyl hydroperoxide (t-BuOOH), air, and molecular oxygen, on the yield ofoxidation products under wide range of reaction conditions. This chapter also focusesthe influence ofmetal nanoparticles on the yield of FDCAwith andwithout addition oforganic bases.
1 Introduction
Most chemicals and fuels are today being produced from fossil resources, such as coal,oil and natural gas. It has been forecasted that the availability of fossil resources willsteadily be dwindling in coming decades as the world population increase, so it isparamount important to find alternative substitutes that can replace fossil resources tokeep the value chain. Lignocellulosic biomass has been identified as one of theindispensable, renewable, sustainable, and alternative feedstock sources of carbon forproducing wide spectrum of chemicals and fuels such as 5-hydroxymethylfurfural(HMF), levulinate and lactates [11, 17, 18]. In this context, furanic compoundsderived from biomass have great potential to replace fossil based chemicals, forexample, 2,5-furandicarboxylic acid (FDCA) has been identified as a suitable sub-stituent for terephthalic acid in the synthesis of polyethylene terephthalate (PET)—precursor for making drinks plastic bottles. In connection with this, this book chapterdescribes solid-catalysed oxidation of biomass-derived furanic compounds, such asHMF, to FDCA via various intermediates, such as 2,5-diformylfuran (DFF),
S. Saravanamurugan (&) � A. Pandey � R.S. SangwanCenter of Innovative and Applied Bioprocessing (CIAB), Mohali 160071, Punjab, Indiae-mail: [email protected]
© Springer Nature Singapore Pte Ltd. 2017A.K. Agarwal et al. (eds.), Biofuels, Green Energy and Technology,DOI 10.1007/978-981-10-3791-7_4
51
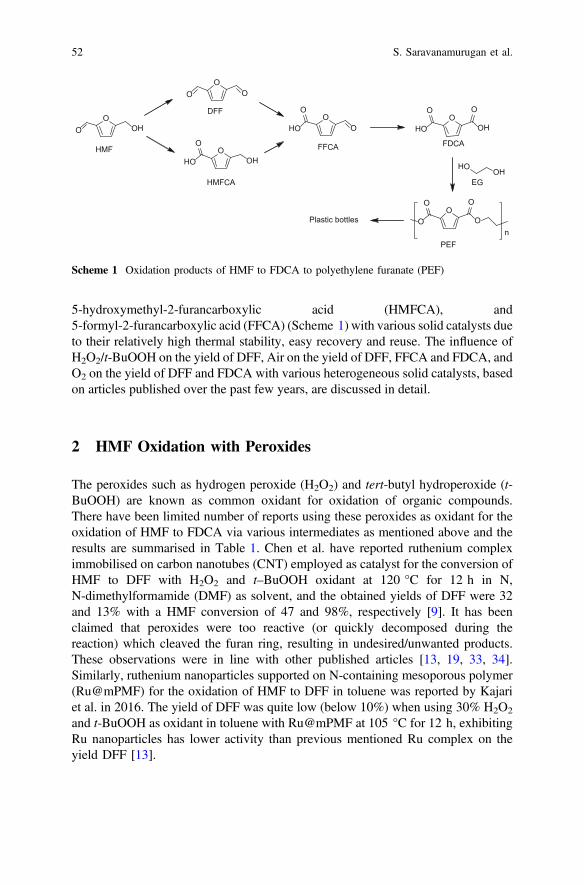
5-hydroxymethyl-2-furancarboxylic acid (HMFCA), and5-formyl-2-furancarboxylic acid (FFCA) (Scheme 1) with various solid catalysts dueto their relatively high thermal stability, easy recovery and reuse. The influence ofH2O2/t-BuOOH on the yield of DFF, Air on the yield of DFF, FFCA and FDCA, andO2 on the yield of DFF and FDCA with various heterogeneous solid catalysts, basedon articles published over the past few years, are discussed in detail.
2 HMF Oxidation with Peroxides
The peroxides such as hydrogen peroxide (H2O2) and tert-butyl hydroperoxide (t-BuOOH) are known as common oxidant for oxidation of organic compounds.There have been limited number of reports using these peroxides as oxidant for theoxidation of HMF to FDCA via various intermediates as mentioned above and theresults are summarised in Table 1. Chen et al. have reported ruthenium compleximmobilised on carbon nanotubes (CNT) employed as catalyst for the conversion ofHMF to DFF with H2O2 and t–BuOOH oxidant at 120 °C for 12 h in N,N-dimethylformamide (DMF) as solvent, and the obtained yields of DFF were 32and 13% with a HMF conversion of 47 and 98%, respectively [9]. It has beenclaimed that peroxides were too reactive (or quickly decomposed during thereaction) which cleaved the furan ring, resulting in undesired/unwanted products.These observations were in line with other published articles [13, 19, 33, 34].Similarly, ruthenium nanoparticles supported on N-containing mesoporous polymer(Ru@mPMF) for the oxidation of HMF to DFF in toluene was reported by Kajariet al. in 2016. The yield of DFF was quite low (below 10%) when using 30% H2O2
and t-BuOOH as oxidant in toluene with Ru@mPMF at 105 °C for 12 h, exhibitingRu nanoparticles has lower activity than previous mentioned Ru complex on theyield DFF [13].
OO OH
OO O
OHO OH
O
OHO O
OHO OH
OO
HMF
DFF
HMFCA
FFCA
OHHO
OO O
OO
nPlastic bottles
FDCA
EG
PEF
O
Scheme 1 Oxidation products of HMF to FDCA to polyethylene furanate (PEF)
52 S. Saravanamurugan et al.

Wang et al. studied the oxidation of HMF to DFF with trimetallic catalystcontaining Ru, Co, and Ce with peroxides as oxidant at 90 °C for 12 h. In thisstudy, a very low yield of DFF (4%) was obtained along with 18% of FDCA at aquantitative conversion of HMF with Co6.6Ce3.3Ru1.1 and t-BuOOH as oxygendonor in methyl isobutyl ketone (MIBK) as solvent. When switching the oxidantfrom t-BuOOH to H2O2, the yield of DFF (7%) slightly increased, but the yield ofFDCA descended from 18 to 8% at a low conversion of HMF (17%) [33]. A similartrend has been observed on the yield of DFF from HMF over Fe3O4@SiO2-NH2-Ru(III) and with t-BuOOH and H2O2 at 120 °C in toluene [33]. From these studies onecan understand that peroxides are not good oxidant due to their low temperaturedecomposition and very high reactivity towards HMF oxidation.
Interestingly, Liu et al. reported magnetic Fe3O4 supported Mn3O4 nanoparticlesas catalysts for the transformation of HMF to DFF and FDCA with peroxides asoxygen donor at 120 °C, but gave a very poor yield (<7%) [19]. MontmorilloniteK-10 containing molybdenum has also been reported as catalyst for the oxidation ofHMF with peroxides at 80 °C for 2 h. It was found that no furanic products such asDFF, HMFCA and FDCA was formed with a quantitative conversion of HMFwhen using t-BuOOH as oxidant. Authors have speculated that the ring openingreaction of HMF could have taken place with highly reactive t-BuOOH as men-tioned above, leading to formation of no furanics but to unwanted products [35].Conversely, around 5% of HMFCA with very high selectivity was obtained whenthe oxidant changed to H2O2. The oxidation of HMF with solid acid catalysts in thepresence of H2O2 to other than furanic compounds has also been reported. Theobtained products in this study were 2-oxoglutaric acid (OGA), succinic acid (SA),maleic acid (MA), fumaric acid (FA) and formic acid. Highest yield of OGA and
Table 1 Oxidation of HMF in the presence of peroxides on the yield of DFF with various solidcatalysts
Entry Catalyst Oxidant Solvent HMFconv.(%)
DFFyield(%)
Reactionconditions
Ref.
1 Ru-PVP/CNT H2O2 DMF 47 32 120 °C;12 h
[9]
t-BuOOH 98 13
2. Ru@mPMF H2O2 Toluene 11 4 105 °C;12 h
[13]
100 9t-BuOOH
3. Fe3O4/Mn3O4 H2O2
t-BuOOHDMF 13 5 120 °C;
4 h[18]
84 7
4. TrimetallicCoCeRu
H2O2 MIBK 16.5 5 90 °C;2 h
[32]
t-BuOOH 100 7
5. Fe3O4@SiO2-NH2-Ru(III)
H2O2 Toluene 8 6 120 °C;12 h
[33]
t-BuOOH 100 17 120 °C;6 h
Biomass-Derived HMF Oxidation with Various Oxidants 53

SA was found to be 31 and 18%, respectively, apart from formic acid (60%) inwater with Amberlyst-15 at 75 °C after 24 h, and the other products found in thisstudy were in trace amounts. It has been proposed that p-p interaction betweenAmberlyst-15 and HMF took place before forming Baeyer-Villiger product prior tosuccinic acid formation. The plausible reaction pathway for the formation SA hasbeen proposed by authors as shown in Scheme 2 [10].
3 HMF Oxidation in Air
As the oxidation of HMF with peroxides over various solid catalysts did not giveany oxidation products such as DFF, HMFCA, FFCA and FDCA in high yields,there have been many reports for HMF oxidation with air as an alternative greenoxidant in various solvents in order to improve the yield of these oxidation products(Table 2).
Saha et al. studied HMF conversion over polymer supported Fe(III) catalyst inwater in the presence of air at different pressure ranging from 4 to 10 bar at 100 °C,and it was found to be FDCA was the major product along with minor yields ofDFF and FFCA [31]. At 4 bar air, the yield of FDCA was only 14% along with 15and 12% of DFF and FFCA, respectively, at a conversion of 42% HMF after 5 h.As the pressure increased to 10 bar, the yield of FDCA improved to 53% with aconversion of 80% HMF. FDCA yield further enhanced to 79% from 53% when thereaction time prolonged to 10 h. Pt and Pt–Bi supported on activated carbon werereported to be active catalyst for the transformation of HMF to FDAC. The obtainedFDCA yield from HMF was about 70% in water in the presence of NaHCO3 at100 °C at a high pressure of air (40 bar), with a molar ratio of Pt to HMF 100 [28].
The major intermediate in this study was found to be FFCA, achieving about80% after 4 h which descended to 30% by converting into FDCA after 24 h. Theother intermediates DFF and HMFCA were obtained below 10%. Moreover, theaddition of Bi into Pt/C improved the reusability of the catalyst for at least four
OOHO
SO3H
Amberlyst-(15)
H2O2
OOHO H
O
Baeyer-Villiger productHMF
H2O, H+
OHOHO
OOHOOH
O
O
HO
Intermediate
H2O2, H+OH
O
OHO
H2O, H+
Succinnic acid
Scheme 2 Proposed reaction pathway for the formation of succinic acid from HMF [10]
54 S. Saravanamurugan et al.

Tab
le2
HMFox
idationin
airwith
variou
ssolid
catalysts
Entry
Catalyst
Solvent
Con
v.HMF(%
)Yield
(%)
Reactioncond
ition
sRef.
DFF
HMFC
AFF
CA
FDCA
1Ru/CTF
MTBE
8664
––
Trace
80°C
,1h,
20bar
[5]
2Bi(N
O3)3�5
H2O
and
cellu
lose
mediatedCu–
NPs.
Acetonitrile
8582
––
–80
°C,2h,
atmosph
eric
pressure
[6]
3Ru@
mPM
FToluene
5135
––
–10
5°C
,12
h,10
bar
[13]
4NG-800
Acetonitrile
100
100
––
–10
0°C
,3h,
atmosph
eric
pressure
[22,
23]
Water
ormethano
l86–88
40–
46–
46–
56–
5Pt/C,Pt–Bi/C
Water
0–10
0<1
0<1
00–80
0–10
010
0°C
,0–
24h,
40bar,
inorganicbases
[28]
6Pt/TiO
2Water
0–10
00– 40
0–12
0–75
0–95
100°C
,0–
12h,
40bar,
Na 2CO3,NaH
CO3
[29]
7FeIII–PO
P-1
Water
42–10
07– 15
8–12
4–79
100°C
,5–
10h;
5–10
bar
[31]
8Fe
3O4@
SiO2–NH2–
Ru(III)
Toluene
78–10
068
–
89–
––
120°C
,12
–16
h,airballo
onpressure
[33]
9Co 6
.6Ce 3
.3Ru 1
.1MIBK
4538
––
512
0°C
,12
h,atmosph
eric
air
[33]
10K-10clay-M
oToluene
65–10
0–
59–84
––
110°C
,2–
8h,
atmosph
eric
air
[35]
Biomass-Derived HMF Oxidation with Various Oxidants 55

runs-maintaining FDCA yields between 90 and 100%, but in the case of Pt/C lostits activity significantly even after third run-FDCA yield dropped from 80% at firstrun to 30% after third run.
Fe3O4@SiO2-NH2-Ru(III) was employed as catalysts for HMF conversion intoluene in the presence of air at 120 °C for 12 and 16 h, yielding 68 and 89% ofDFF at HMF conversion of 78 and 100%, respectively [34]. The formation ofHMFCA and FDCA were not observed in this study under these reaction condi-tions. Trimetallic catalyst containing Co, Ce and Ru has also been reported forHMF oxidation in MIBK in an atmospheric air pressure at 120 °C for 12, and theobtained yield of DFF and FDCA were 38 and 5%, respectively, with 54%unconverted HMF [33]. Similarly, the HMF oxidation in an atmospheric air withmontmorillonite K-10 catalyst containing molybdenum in toluene was also studiedby Zhang et al. in [35]. It was reported that 59 and 84% of HMFCA was achieved at110 °C for 1 and 8 h, with 65% and quantitative conversion of HMF, respectively.No other HMF oxidation furanic intermediates towards FDCA was reported underthese reaction conditions [35]. Recently, Lv et al. have also studied the oxidation ofHMF to DFF with nitrogen doped graphene (NG) materials in the presence of2,2,6,6-tetramethylpiperidin-oxyl (TEMPO) as co solvent in an atmospheric airpressure [22, 23]. Gratifyingly, authors found that NG treated at 800 °C (NG-800)gave a quantitative yield of DFF with a quantitative conversion of HMF in ace-tonitrile at 100 °C after 6 h, due to incorporation of nitrogen into the carbonnanosheets and changing the electronic structure of a sp2 carbon material andthereby enhancing its activity. They attempted to reuse the catalyst NG-800 andfound to be HMF conversion (*100) and DFF selectivity (*90) remainedunchanged from first through the sixth run. However, authors have reported thatwhen changing solvent from acetonitrile to water and methanol under identicalreaction conditions, the selectivity to DFF drastically decrease from 100 to below50%, concomitantly, the selectivity to FFCA increased to about 50%. In anotherreport, cellulose mediated Cu nanoparticles along with Bi(NO3). 5H2O were usedas catalyst for HMF conversion to DFF in acetonitrile in an atmospheric air at 80 °Cfor 2 h. The obtained DFF yield was 82% along with 85% HMF conversion [6].
Rass et al. have studied the transformation of HMF over Pt/TiO2 with andwithout base NaHCO3 on the yield of FDCA at 100 °C with a pressure of 40 bar airfor 12 h [28]. This study clearly indicated that without a base the yield of FDCAwas below 10% but DFF and FFCA were the major product, reaching above 30%after 3 h. In order to improve the yield of FDCA at the expense of formed inter-mediates, authors have introduced 1 to 4 equivalents of NaHCO3 with respect toHMF in the reaction medium and found to be a pronounced effect on the yield ofFDCA. The yield of FDCA attained to above 90% after 12 h. The influence of basehas also been investigated in this study and reported that addition of Na2CO3
favoured the reaction towards the formation of FDCA faster than NaHCO3 underidentical reaction conditions. Authors have proposed the reaction pathway for theaqueous oxidation of HMF to FDCA via including various hydrated intermediatesas shown in Scheme 3.
56 S. Saravanamurugan et al.

Artz et al. in [5], comprehensively studied on the yield of DFF from HMF withcovalent triazine framework (CTF) supported Ru catalysts (Scheme 4) in varioussolvents at 80 °C at 20 bar air for 1 h [5]. Among the solvents (toluene, MTBE,1,4-dioxane, DMSO, H2O, acetone, and acetonitrile) used, methyl t-butyl ether(MTBE) favoured a highest yield of DFF (44%) at a conversion of 55% HMF. Theyield of DFF (10%) was quite low when using DMSO as solvent, claiming that thepresence trace amount of water favoured further oxidation to form FDCA. A lowselectivity of DFF was also found in this study when using only water as solvent,substantiating the role of water on the formation of FDCA from HMF oxidation.Interestingly, authors have studied the influence of Ru on various supports, such ascarbon, alumina, hydrotalcite (HT) and MgO, for HMF oxidation in MTBE at 80 °Cat 20 bar air for 1 h and found that CTF showed a superior support than others,yielding 64% DFF over Ru/CTF along with 14% unconverted HMF. Gosh et al.recently reported that ruthenium nanoparticles supported on N-containing meso-porous polymer (Ru@mPMF) could convert HMF to DFF to a moderate selectivity(68%) at a conversion of 51% HMF in toluene at 105 °C at 10 bar air after 12 h [13].
OO OH
HMF
OO O
OO OH
HO
HMFCA
DFF
OO O
OH
FFCA
OO O
OH
FDCA
HOO
HO OH
HO
OHO O
OHHO
OO OH
OH+H2O
-H2O
+H2 O-H
2 O
+H2O
-H2O
k1
k2
k3
k4
k5
Intermediate
Intermediate
Intermediate
Scheme 3 Reaction pathway for HMF oxidation to FDCA via various intermediates [28]
CN
CN
N
N
N
N
N
N
N
N
N
N
N
NRu
ClClCl
N
N
N
N
N
NRu0
ZnCl2
400/600 oCRuCl3.xH2O
Reflux, 6 hH2, 350 oC
1,3-dicyanobenzene CTF-a Ru@CTF-a Ru@CTF-a
Scheme 4 Proposed synthesis route for stabilisation of Ru nanoparticles in CTF [5]
Biomass-Derived HMF Oxidation with Various Oxidants 57

4 HMF Oxidation in Pure Oxygen
There have been ample numbers of publications dealing with HMF oxidationtowards FDCA formation in pure oxygen as it has been considered as green oxidant(Table 3). In this context, Pasini et al. reported Au and Cu supported on TiO2 ascatalysts for HMF oxidation in an oxygen atmosphere in the presence of NaOH asbase [27]. Among the catalyst employed, 1.5(AuCu)-TiO2 (1.14 wt% Au and0.36 wt% Cu with respect to TiO2) found to be superior catalytic activity to yieldquantitative amount of FDCA in water at 95 °C at 10 bar oxygen pressure after 4 h30 min, with a ratio of HMF to NaOH 4. It has been claimed that aldehyde group ofHMF was quite easily oxidised than hydroxyl group to form HMFCA, attainingclose to 90% of HMFCA with 1.5(AuCu)-TiO2after an hour reaction time. In thesame year, Gupta et al. reported Au nanoparticle supported on HT as catalyst for theoxidation HMF in water at an atmospheric oxygen pressure without addition of anyhomogeneous base [15]. In an experiment, a quantitative yield of FDCA from HMFwas obtained in water with 1.92 wt% Au/TiO2 at 95 °C after 7 h, with a ratio ofHMF to metal 40 and an oxygen flow rate of 50 ml/min. The size of the Aunanoparticles on HT were found to be an average size of 3.2 nm which were muchlower than 2 wt% Au nanoparticles on TiO2 (6 nm), giving FDCA yield of 31% at50 °C and 10% at 60 °C, respectively. However, the reaction conditions in bothstudies were different [15, 27]. A comprehensive study was carried out byArdemani et al. to get insight to the activity of Au nanoparticles in HT towardsHMF oxidation to FDCA [4]. From this study, it has been disclosed that compet-itive adsorption between HMF and oxidation intermediate, such as HMFCA andFDCA, impeded the active sites on Au/HT, thus disabling further oxidation ofHMF. On the other hand, high gold surface concentration on HT without alkalimedium can enhance the yield of FDCA from HMF in water. For example, 10 wt%Au/HT yielded 78% FDCA without any soluble base in water at 90 °C underoxygen flow with a rate of 10 ml/min. Below 5 wt% Au/HT gave predominantlyHMFCA than FDCA, indicating a high surface concentration of Au required forhaving higher yield of FDCA. In another study, Gui et al. reported that the role ofbasicity of the support for Au and Pd nanoparticles for HMF oxidation [14]. Theemployed supports were zinc hydroxy carbonate (ZOC), hydrotalcite (MG20),TiO2, CeO2 and activated carbon and revealed that ZOC possessed a higher basicitythan other supports. In an experiment, a quantitative yield of FDCA over Au–Pd/ZOC (Au to Pd ratio was 1:1) was obtained in water in the presence ofNaHCO3 at 80 °C at 3 bar O2 after 4 h, the basicity of ZOC support alone in waterwas pH = 8.05.
Albonetti et al. reported the influence on the ratio of Au and Cu on TiO2 for theoxidation of HMF to FDCA, as an extension of their previous studies [1].Interestingly, they found that introducing Cu into the nanoparticle of Au on TiO2
seemed to be decreasing the overall particle size (from 4 to 3 nm), estimated byusing XRD through Scherrer equation and TEM analysis. It has been found from thisstudy that the ratio of Au to Cu 3 on TiO2 was optimal to give a higher selectivity
58 S. Saravanamurugan et al.

Tab
le3
HMFox
idationwith
molecular
oxyg
enov
ervariou
ssolid
catalysts
Entry
Catalyst
Solvent
HMFconv
.(%
)Yield
(%)
Reactions
cond
ition
sRef.
DFF
HMFC
AFF
CA
FDCA
110
wt%
Au/HT
Water
–20
7890
°C,O2flow
[4]
2Ru/c-alum
ina
Toluene
100
97–
3–
120°C
,4h,
2.7bar
[2]
3V2O
5/AC
MIBK
or Toluene
>95
>96
–<2
–10
0°C
,4h,
2.8bar
[3]
41.5w
t%Au/HY
Water
>99
––
–>9
960
°C,6h,
3barO2,NaO
H[7]
5Ru–
PVP/CNT
DMF
100
94–
––
120°C
,12
h,20
bar
[9]
6Au–
Pd/ZOC
Water
>99
––
–>9
980
°C,4h,
3bar,NaH
CO3
[14]
71.9wt%
Au/HT
Water
100
––
–10
095
°C,7h,
O2flo
w[15]
8Pt/C–O–Mg
Water
>99
––
–97
110°C
,12
h,10
bar
[16]
9Fe
3O4/Mn 3O4
DMF
9580
––
1012
0°C
,2h,
O2flow
[19]
10Pd
/C@Fe
3O4
Water
8098
8780
°C,6h,
O2flo
w,K2C
O3
[20]
11Ni 3(BTP)
2Water
2727
––
–12
0°C
,24
h,30
bar
[18]
12GO
DMSO
100
90–
8–
140°C
,24
h,O2flo
w[22,
23]
13Mn 0
.70C
u 0.05A
l 0.25-c
Water
9689
––
690
°C,24
h,12
bar
[25]
14NNC-900
Water
100
––
–80
80°C
,48
h,O2flow
,K2C
O3
[26]
151.5(AuC
u)–TiO
2Water
0–10
0–
0–90
–0–
100
60–11
5°C
,0–5h,
5–20
bar,
NaO
H[27]
16Pt/C
Pt–Bi/C
Water
100
–0–
1017
–
4744
–83
100°C
,1h,
40bar,Na 2CO3
[27]
17FeIII–PO
P-1
Water
100
9–
575
100°C,5h5bar
[30]
(con
tinued)
Biomass-Derived HMF Oxidation with Various Oxidants 59

Tab
le3
(con
tinued)
Entry
Catalyst
Solvent
HMFconv
.(%
)Yield
(%)
Reactions
cond
ition
sRef.
DFF
HMFC
AFF
CA
FDCA
181wt%
V2O
5/H-beta
[24]
DMSO
8482
––
–12
5°C
,3h,
10bar
[29]
19Au-Pd
/AC
orAu–
Pt/AC
Water
100
–0–
3862
–
100
60°C
,2–6h,
3bar
[31]
20K-10clay-M
oMIBK
97–
81–
–11
0°C
,8h,
O2flow
[35]
21c-Fe
2O3@
HAP–
Pd(0)
Water
97–
––
9310
0°C
,6h,
K2C
O3
[36]
22Fe
3O4@
C@Pt
Water
100
––
–10
090
°C,4h,
O2flo
w,Na 2CO3
[37]
23Co 6
.6Ce 3
.3Ru 1
.1MIBK
84–97
72–
83–
–7–
812
0°C
,12
h,O2flo
wand
ballo
on[33]
24Fe
3O4@
SiO2–NH2-
Ru(III)
Toluene
>99
86–
––
110°C
,4h,
O2flow
[34]
60 S. Saravanamurugan et al.

towards FDCA compared to ratio of Au to Cu 1 in water at 95 °C at 10 bar O2 after4 h, in the presence of NaOH as base. In a similar approach, Villa et al. reported themodification of Au on activated carbon by introducing Pd and Pt to enhance itscatalytic activity towards formation of FDCA from HMF [32]. A quantitative andnear quantitative yield of FDCA was achieved in this study with Au6–Pd4/AC andAu8–Pd2/AC catalysts, respectively, than individual monometallic catalysts (Au/ACand Pd/AC yielded 36 and 8% of FDCA, respectively) in water in the presence ofNaOH at 60 °C after 2 h, with a pressure of 3 bar O2. In another study, it has beenreported that changing the metal combination on activated carbon could enhance theactivity of the material towards HMF oxidation. In this context, Rass et al. havereported that introducing bismuth into Pt/C to get Pt–Bi/C could reduce the particlesize of Pt to 2 nm from 6 nm (Pt/C), particle size estimated by TEM technique. Thecatalytic activity Pt/C was compared with various ratio of Bi to Pt on C (Pt–Bi/C),ranging from 0 to 0.96. It has been clearly demonstrated that Pt/C yielded 51% ofFDCA along with 10 and 35% of HMFCA and FFCA, respectively, with a fullconversion of HMF in the presence of Na2CO3after 1 h. The FDCA yield signifi-cantly improved to 83% at the expense of other formed intermediates over Pi–Bi/C(Pt to Bi ratio 0.2) under identical reaction conditions [28]. Another Pt based catalyst(Pt/C–O–Mg) was also reported and found to be efficient catalyst for the transfor-mation of HMF to FDCA (97%) in water at 110 °C at an oxygen pressure of 10 barafter 12 h. It was further revealed that the other solvents, such as acetonitrile,DMSO, DMF, c-valerolactone (GVL), 1,4-dioxane, and MIBK, used in this studyhad no significant effect on the yield of FDCA under identical reaction conditions,highest yield of FDCA was found to be 19% in MIBK, but GVL yielded 35% DFF[16].
Ru/c-alumina exhibited as promising catalyst for the oxidation of HMF to DFFin high selectivities. Among the solvents employed, a near quantitative yield ofDFF was obtained with Ru/c-alumina in toluene at 120 °C at 2.7 bar O2 after 4 h.The other organic solvents (DMF, 1,4-dioxane, acetonitrile, ethanol, 1-butanol,isopropanol (IPA), MIBK) used in this study showed either a lower selectivity(DFF) with higher conversion or higher selectivity (DFF) with lower conversion ofHMF [2]. Similarly, a high yield of DFF (94%) was achieved with a quantitativeconversion of HMF using ruthenium complex immobilised on poly(4-vinylpyridine)-functionalized carbon-nanotube (PVP/CNT), (Ru-PVP/CNT), inDMF at 120 °C at 20 bar O2 after 12 h [9]. In related to HMF oxidation, variouszeolites, such as Beta, ZSM-5, mordenite and Y, have also been used as supportsfor vanadia for the oxidation of HMF to DFF in different organic solvents, such asN,N-dimethylformamide (DMF), MIBK, toluene, trifluorotoluene and DMSO. Thebest results obtained in this study was in DMSO as solvent where 98% selectivitytowards DFF along with 84% conversion of HMF was observed with 1 wt% V2O5/H-beta [25] at 125 °C after 3 h, with an oxygen pressure of 10 bar [30]. However,the major drawback in this study was leaching of vanadia into the solution whichpartly contributed to the oxidation of HMF to DFF. Cai et al. have reported thesynthesis of Au nanoparticle in various supports including zeolites and their cat-alytic activity towards HMF oxidation. A full conversion to FDCA (>99%) was
Biomass-Derived HMF Oxidation with Various Oxidants 61

obtained with 1.5 wt% Au/HY zeolite (average Au nanoparticle size of 1 nm) inwater in the presence of NaOH at 60 °C at 3 bar O2 after 6 h. It has been proposedthat small Au nanoparticles were encapsulated in the cages of HY zeolites andclaimed that confined Au nanoparticles exhibited a higher catalytic activity thanusing others supports, such as Mg(OH)2, TiO2, CeO2, mordenite, ZSM-5 [7].
Fe(III)–porous organic polymer(FeIII–POP-1) was also examined as catalyst forthe transformation of HMF to FDCA in water at 100 °C at 5 bar O2 for 5 h andfound that the obtained FDCA yield was 75% along with 9 and 5% or DFF andFFCA, respectively, with a quantitative conversion of HMF. However, the con-centration of HMF was quite low. As the concentration of HMF increased withdecreasing FDCA yield but enhancing DFF yield (up to 31%) [31]. In a similar kindof approach, a fair yield of FDCA (85%) at full conversion of HMF was obtainedbut in toluene with mesoporous poly-melamine-formaldehyde containing Runanoparticles (Ru@mPMF) (Scheme 5) at 105 °C with 20 bar of O2 pressure after12 h [13].
Wang et al. reported trimetallic mixed metal oxides (Co, Ce and Ru) for theoxidation of HMF to DFF in MIBK solvent under the oxygen flow or oxygenpressure in the balloon. The obtained results were quite interesting that 83% of DFFalong with 8% of FDCA was observed at a conversion of 97% HMF at 120 °Cunder the flow of oxygen (20 ml/min) after 12 h. However, the yield of DFFdropped down to 72% when using oxygen balloon under identical reaction con-ditions. It has also been shown that this trimetallic mixed oxides can be reused for
N
N
N
NH2
H2N NH2
N
N
N
HN
HN NH
N
N
N
NH
NH
NH
N
N
N
HN
HN NH
Paraformaldehdey
DMSO, 170 oC
m-PMF
RuCl3
Ethlen lcoygyl
180 oC, 6 hRuNPs + m-PMF
Methanol
20 h
Ru@m-PMF
Scheme 5 Schematic representation for synthesis of mesoporous Ru@m-PMF [13]
62 S. Saravanamurugan et al.

four times without significant loss of its activity [33]. The combination of anothertrimetal mixed oxides (nanocrystalline spinel Li2CoMn3O8) as catalyst for HMFoxidation was reported and found to be the obtained isolated yield of FDCA was80% [8]. Yet another manganese based trimetal mixed oxides was also reported forthe conversion of HMF with molecular oxygen, but in this case the major productwas DFF rather than FDCA. HMF conversion of 96% with DFF and FDCAselectivity of 93 and 6%, respectively, was obtained over Mn0.70Cu0.05Al0.25-c inwater at 90 °C at 12 bar O2 after 24 h [24]. However, a significant yield ofHMFCA (22%) was observed at low oxygen pressure (4 bar) under identicalreaction conditions. In this context, a bimetallic mixed oxides (Mn and Fe)exhibited as a promising catalysts on the yield of FDCA from HMF. The selectivitytowards FDCA and FFCA were 32 and 68%, respectively, with 93% conversion ofHMF with Mn0.75/Fe0.25 in water at 90 °C at 8 bar O2 after 24 h, with a HMF toNaOH ratio of 1:4. However, a quantitative yield of FDCA was attained when usingFFCA as substrate under similar reaction conditions [24].
Zhang et al. extended their previous work on HMF oxidation using immobilisedmolybdenum acetylacetonate in montmorillonite K-10 as catalysts under the flow ofoxygen. The activity of this catalyst substantially changed the selectivity towardsHMFCA rather than DFF. For example, 81% HMFCA was obtained along withnear quantitative conversion of HMF in MIBK with molecular oxygen at 110 °Cafter 8 h. A similar HMFCA yield was observed with other solvents such asp-chlorotoluene, toluene and trifluortoluene in this study [35].
In 2014, Antonyraj et al. have also reported the transformation of HMF to DFFin MIBK as solvent using vanadia supported on activated carbon as catalyst andfound greater than 90% yield of DFF with HMF conversion of about 95% at 100 °Cat 2.8 bar O2. A high selectivity towards DFF (98%) with 95% conversion of HMFin toluene was also obtained at 100 °C at 2.8 bar O2 after 4 h [3]. On the otherhand, a poor yield of DFF (11%) was obtained when using MIBK as solvent andFe3O4/Mn3O4 (magnetic separation approach) as catalyst with an oxygen flow rateof 20 ml/min. However, the DFF yield was drastically improved to 80% with 95%conversion of HMF in DMF with Fe3O4/Mn3O4 at 120 °C after 2 h, clearly indi-cating solvent played a crucial role [19]. In a similar strategic approach, the sameresearch group synthesised magnetically separable Ru based catalyst(Fe3O4@SiO2-NH2-Ru(III)) for the conversion of HMF to DFF. A quantitativeconversion of HMF with 86% DFF yield was attained with this catalyst in tolueneat 110 °C in molecular oxygen with a flow rate of 20 ml/min [34]. In this context,the same group extended further to synthesise c-Fe2O3 supported Pd-based catalyst(c-Fe2O3@HAP-Pd(0)) (Scheme 6) for HMF oxidation. A high yield of FDCA(93%) was achieved with 97% conversion of HMF in water at 100 °C under flow ofoxygen (30 ml/min) after 6 h, with a ratio of K2CO3 to HMF 0.5 [36]. The studyhas been extrapolated further by the same research group synthesising magneticallyseparable Pd/C@Fe3O4 as catalyst for the conversion of HMF. The obtained FDCAyield was 87% at a conversion of 98% HMF in water at 80 °C under flow ofoxygen (30 ml/min) after 6 h, but in the presence of K2CO3 [20]. Yet another studyhas also been reported related to magnetic separation approach in which authors
Biomass-Derived HMF Oxidation with Various Oxidants 63

synthesised Pt nanoparticles on Fe3O4@carbon microspheres (Fe3O4@C@Pt),employed as catalyst for HMF oxidation and found to be superior activity in termsof FDCA yield (100%) in water in the presence of Na2CO3 at 90 °C after 4 h, withan oxygen flow rate of 100 ml/min [37].
Above mentioned articles dealt with metal catalysed oxidation of HMF in var-ious solvents. There have been a very few reports on HMF oxidation with metalfree catalytic systems. In connection to this, Lv et al. disclosed a carbon-based(GO) bifunctional material, derived from graphite powder treated with NaNO3,H2SO4, H2O2, and HCl in a sequence of steps, which did not contain any metal wasa promising catalyst for the conversion of HMF to DFF. GO yielded 90% DFFalong with 8% FFCA at full conversion of HMF in DMSO at 140 °C at an oxygenflow rate of 20 ml/min after 24 h. Authors also performed an experiment in N2
atmosphere (20 ml/min) under identical reaction conditions, and no yield of DFFwith negligible conversion of HMF was found, substantiating hydroxyl group ofHMF was oxidised rather than dehydrogenated [22, 23]. There was another reportdealing with metal free zeolitic-imidazole framework (ZIF-8) based, nitrogen-dopednanoporous carbon (NNC) for HMF oxidation. It was found to be NNC-900 gave ahighest yield of FDCA (80%) with a full of conversion of HMF in water at 80 °Cafter 48 h, with three equivalents of K2CO3 with respect to HMF and an oxygenflow rate of 100 ml/min [26]. Ni-based metal organic frameworks (MOFs), such asNi(BDP), Ni(BPEB), and Ni3(BTP)2, was also reported for the oxidation of HMFand yielded 27% DFF with a selectivity close to 100% in water at 120 °C, at 30 barO2 after 24 h [21]. Even though these materials exhibited higher selectivity towardsthe targeted product, there are some major challenges which limit the implemen-tation of large scale production as follows. Organic moieties adsorbed over thesematerials during the reaction are difficult to remove by simple wash with aqueousand organic solvents as they strongly bound with the active sites. Moderate thermalstability of these materials further hampers to treat at high temperatures to get rid ofthe adsorbed organic moieties.
Fe(II)
+
Fe(III)
NH4OHFe2O3
Ca2+, PO4
3-, NH4OH
Calcination
P P
O OCa2+
Na2PdCl4 P P
O OPd2+
NaBH4 P P
O O
γ-Fe2O3@HAP γ-Fe2O3@HAP-Pd2+ γ-Fe2O3@HAP-Pd
Scheme 6 Pictorial representation of synthesis of magnetically separable c-Fe2O3@HAP–Pd(0)[36]
64 S. Saravanamurugan et al.

5 Perspective and Outlook
The transformation of HMF to FDCA via oxidation with various oxidants overvariety of solid catalysts has been reported. Particularly, a quantitative yield ofFDCA was achieved with pure molecular oxygen over Au, Pd and Pt nanoparticlebased catalysts. On the other hand, using H2O2 of t-BuOOH as oxidant for HMFoxidation, Ru nanoparticle based catalysts yielded DFF as a major product. Theinfluence of the size of Au nanoparticles on HT with and without a base on the yieldof FDCA well studied and revealed that at high surface Au nanoparticle concen-tration on HT did not require any base for obtaining a high yield of FDCA. On thecontrary, having a low surface concentration of Au nanoparticle did need a base toachieve a high yield of FDCA. In most cases with metal nanoparticles as catalysts,the addition of base entailed as to enhance the yield of FDCA, thus increasing theworkup procedure. In general, however, the major problem associated with nobelmetal(s) based nanoparticle catalysts are agglomeration and sintering and highlysensitive to fouling, thus preventing the long term activity of the materials, inaddition to high cost of precious metals. Therefore, a robust catalyst based oninexpensive metals, including metal nanoparticles, need to be designed for theefficient transformation of HMF to FDCA as well as for economic viability.
The cost of HMF is very expensive today, consequently, the FDCA price is alsovery high. As to reduce the cost of the process, there has been limited number ofstudies which focused on the synthesis of FDCA from carbohydrates via cascadereaction. For example, Fang et al. have recently reported sulfonic acid function-alised Fe containing MOF could efficiently dehydrate fructose at quantitativeconversion to HMF followed by oxidation to form DFF (>99%) in ethanol at 100 °C [12]. In this context, GO based material possessing bifunctional sites has beenreported for the conversion of fructose to DFF where 73% of DFF was obtained inDMSO at 140 °C under flow of oxygen. However, fructose is not an abundantsugar, so the target should be focused on glucose as starting substrate to produceFDCA [21, 22]. On the contrary, this multi-step approach needs a catalyst withvarious functions; Lewis acid sites for isomerisation of glucose to fructose,Bronsted acid sites for dehydration of fructose to HMF, and metal sites for oxi-dation of HMF to FDCA. Moreover, from economic point of view, the organicsolvents should be replaced with water to enhance the solubility and concentrationof starting sugars. Today, the major challenge encountered by researchers is todesign such a catalyst and to perform the direct conversion of glucose to FDCA inone-pot multi-step approach. Having such a catalytic system would minimisenumber of intermediate steps of the process and pave the way towards economicallyviable to implement the process.
Biomass-Derived HMF Oxidation with Various Oxidants 65

References
1. Albonetti S, Pasinia T, Lolli A et al (2012) Selective oxidation of 5-hydroxymethyl-2-furfuralover TiO2-supported gold–copper catalysts prepared from preformed nanoparticles: effect ofAu/Cu ratio. Catal Today 195:120–126
2. Antonyraj CA, Jeong J, Kim B et al (2013) Selective oxidation of HMF to DFF usingRu/g-alumina catalyst in moderate boiling solvents toward industrial production. J Ind EngChem 19:1056–1059
3. Antonyraj CA, Kim B, Kim Y et al (2014) Heterogeneous selective oxidation of5-hydroxymethyl-2-furfural (HMF) into 2,5-diformylfuran catalyzed by vanadium supportedactivated carbon in MIBK, extracting solvent for HMF. Catal Commun 57:64–68
4. Ardimani L, Cibin G, Dent AJ et al (2015) Solid base catalysed 5-HMF oxidation to2,5-FDCA over Au/hydrotalcites: fact or fiction? Chem Sci 6:4940–4945
5. Artz J, Mallmann S, Palkovits R (2015) Selective aerobic oxidation of HMF to2,5-diformylfuran on covalent triazine frameworks-supported Ru catalysts. ChemSusChem8:672–679
6. Baruah D, Hussain FL, Suri M et al (2016) Bi(NO3)3�5H2O and cellulose mediated Cu-NPs—a highly efficient and novel catalytic system for aerobic oxidation of alcohols to carbonyls andsynthesis of DFF from HMF. Catal Commun 77:9–12
7. Cai J, Ma H, Zhang J et al (2013) Gold nanoclusters confined in a supercage of Y zeolite foraerobic oxidation of HMF under mild conditions. Chem Eur J 19:14215–14223
8. Jain A, Jonnalagadda SC, Ramanujachary KV et al (2015) Selective oxidation of5-hydroxymethyl-2-furfural to furan-2,5-dicarboxylic acid over spinel mixed metal oxidecatalyst. Catal Commun 58:179–182
9. Chen J, Zhong J, Guoa Y et al (2015) Ruthenium complex immobilized on poly(4-vinylpyridine)-functionalized carbon-nanotube for selective aerobic oxidation of5-hydroxymethylfurfural to 2,5-diformylfuran. RSC Adv 5:5933–5940
10. Choudhary H, Nishimura S, Ebitani K (2013) Metal-free oxidative synthesis of succinic acidfrom biomass-derived furan compounds using a solid acid catalyst with hydrogen peroxide.Appl Catal A: Gen 458:55–62
11. Corma A, Iborra S, Velty A (2007) Chemical routes for the transformation of biomass intochemicals. Chem Rev 107:2411–2502
12. Fang R, Luque R, Li Y (2016) Efficient one-pot fructose to DFF conversion using sulfonatedmagnetically separable MOF-derived Fe3O4 (111) catalysts. Green Chem. doi:10.1039/c6gc02018f
13. Ghosh K, Mollaa RA, Iqubalb MA et al (2016) Ruthenium nanoparticles supported onN-containing mesoporous polymer catalyzed aerobic oxidation of biomass- derived5-hydroxymethylfurfural (HMF) to 2,5-diformylfuran (DFF). Appl Catal A: Gen 520:44–52
14. Gui Z, Cao W, Saravanamurugan S et al (2016) Efficient Aerobic oxidation of5-hydroxymethylfurfural in aqueous media with Au–Pd supported on Zinc hydroxycarbonate.ChemCatChem 8:3636–3643
15. Gupta NK, Nishimura S, Takagaki A et al (2011) Hydrotalcite-supported gold-nanoparticle-catalyzed highly efficient base-free aqueous oxidation of 5-hydroxymethylfurfural into2,5-furandicarboxylic acid under atmospheric oxygen pressure. Green Chem 13:824–827
16. Han X, Geng L, Guo Y et al (2016) Base-free aerobic oxidation of 5-hydroxymethylfurfuralto 2,5-furandicarboxylic acid over a Pt/C–O–Mg catalyst. Green Chem 18:1597–1604
17. Holm MS, Saravanamurugan S, Taarning E (2010) Conversion of sugars to lactic acidderivatives using heterogeneous zeotype catalysts. Science 328:602–605
18. Li H, Yang S, Riisager et al (2016) Zeolite and zeotype-catalysed transformations ofbiofuranic compounds. Green Chem. 18:5701–5735.
19. Liu B, Zhang Z, Lv K (2014) Efficient aerobic oxidation of biomass-derived5-hydroxymethylfurfural to 2,5-diformylfuran catalyzed by magnetic nanoparticle supportedmanganese oxide. Appl Catal A: Gen 472:64–71
66 S. Saravanamurugan et al.

20. Liu B, Ren Y, Zhang Z (2015) Aerobic oxidation of 5-hydroxymethylfurfural into2,5-furandicarboxylic acid in water under mild conditions. Green Chem 17:1610–1617
21. Lucarelli C, Galli S, Maspero A et al (2016) Adsorbent—adsorbate interactions in theoxidation of HMF catalyzed by Ni-based MOFs: A DRIFT and FT-IR insight. J Phys Chem C120:15310–15321
22. Lv G, Wang H, Yang Y et al (2016) Aerobic selective oxidation of 5-hydroxymethylfurfuralover nitrogen-doped graphene materials with 2,2,6,6-tetramethylpiperidin-oxyl as cocatalyst.Catal Sci Technol 6:2377–2386
23. Lv G, Wang H, Yang Y et al (2016) Direct synthesis of 2,5-diformylfuran from fructose withgraphene oxide as a bifunctional and metal-free catalyst. Green Chem 18:2302–2307
24. Neatu F, Marin RS, Florea M et al (2016) Selective oxidation of 5-hydroxymethyl furfuralover non-precious metal heterogeneous catalysts. Appl Catal B: Environ 180:751–757
25. Neatua F, Petreab N, Petreb R et al (2016) Oxidation of 5-hydroxymethyl furfural to2,5-diformylfuran inaqueous media over heterogeneous manganese based catalysts. CatalToday 278:66–73. doi:10.1016/j.cattod.2016.03.031
26. Nguyen CV, Liao YT, Kang TC et al (2016) A metal-free, high nitrogen-doped nanoporousgraphitic carbon catalyst for an effective aerobic HMF-to-FDCA conversion. Green Chem18:5957–5961. doi:10.1039/c6gc02118b
27. Pasini T, Piccinini M, Blosi M et al (2011) Selective oxidation of 5-hydroxymethyl-2-furfuralusing supported gold–copper nanoparticles. Green Chem 13:2091–2099
28. Rass HA, Essayem N, Besson M (2013) Selective aqueous phase oxidation of5-hydroxymethylfurfural to 2,5-furandicarboxylic acid over Pt/C catalysts: influence of thebase and effect of bismuth promotion. Green Chem 15:2240–2251
29. Rass HA, Essayem N, Besson M (2015) Selective aerobic oxidation of 5-HMF into2,5-furandicarboxylic acid with Pt catalysts supported on TiO2- and ZrO2- based supports.ChemSusChem 8:1206–1217
30. Sadaba I, Gorbanev YY, Kegnæs S et al (2013) Catalytic performance of zeolite-supportedvanadia in the aerobic oxidation of 5-hydroxymethylfurfural to 2,5-diformylfuran.ChemCatChem 5:284–293
31. Saha B, Gupta D, Abu-Omar MM et al (2013) Porphyrin-based porous organicpolymer-supported iron(III) catalyst for efficient aerobic oxidation of5-hydroxymethyl-furfural into 2,5-furandicarboxylic acid. J Catal 299:316–320
32. Villa A, Schiavoni M, Campisi S et al (2013) Pd-modified Au on carbon as an effective anddurable catalyst for the direct oxidation of HMF to 2,5-furandicarboxylic acid.ChemSusChem 6:609–612
33. Wang Y, Liu B, Huang K et al (2014) Aerobic oxidation of biomass-derived 5-(hydroxymethyl) furfural into 2,5-Diformylfuran catalyzed by the trimetallic mixed oxide(Co–Ce–Ru). Ind Eng Chem Res 53:1313–1319
34. Wang S, Zhang Z, Liu B et al (2014) Environmentally friendly oxidation of biomassderived5-hydroxymethylfurfural into 2,5-diformylfuran catalyzed by magnetic separation ofruthenium catalyst. Ind Eng Chem Res 53:5820–5827
35. Zhang Z, Liu B, Lv K et al (2014) Aerobic oxidation of biomass derived5-hydroxymethylfurfural into 5-hydroxymethyl-2-furancarboxylic acid catalysed by a mont-morillonite K-10 clay immobilized molybdenum acetylacetonate complex. Green Chem16:2762–2770
36. Zhang Z, Zhen J, Liu B et al (2015) Selective aerobic oxidation of the biomass-derivedprecursor 5-hydroxymethylfurfural to 2,5-furandicarboxylic acid under mild conditions over amagnetic palladium nanocatalyst. Green Chem 17:1308–1317
37. Zhang Y, Xue Z, Wang J et al (2016) Controlled deposition of Pt nanoparticles onFe3O4@carbon microspheres for efficient oxidation of 5-hydroxymethylfurfural. RSC Adv6:51229–51237
Biomass-Derived HMF Oxidation with Various Oxidants 67

Hydrothermal Liquefactionof Lignocellulosic Biomass Components:Effect of Alkaline Catalyst
Rawel Singh, Bhavya B. Krishna and Thallada Bhaskar
Abstract The fundamental studies to understand the role of individual biomasscomponents (cellulose and lignin) on the production of valuable hydrocarbonsduring hydrothermal liquefaction (HTL) is presented. Thermal and catalytic HTL ofcellulose and lignin was performed at 280 °C under biomass:H2O ratio of 1:6 at15 min residence time. The use of alkaline catalysts significantly increased bothbio-oil yield and conversion for cellulose as well as lignin. Maximum bio-oil yield(28%) and conversion (90%) in case of cellulose was observed with KOH. Similarlyin case of lignin maximum bio-oil yield (17 wt%) as well as conversion (72%) wasobserved with KOH. From the analysis of bio-oil and bio-residue, it was observedboth cellulose and lignin have undergone hydrolytic cleavage during HTL to formlow molecular weight liquid products. The FTIR and NMR (1H and 13C) of thebio-oil obtained from lignin indicated the presence of phenols and aromatic ethers.
Keywords Cellulose � Lignin � Lignocellulosic biomass � Hydrothermal lique-faction � Subcritical water
1 Introduction
Compared to petroleum feedstocks, biomass contains significant functionality thatcan be exploited for its conversion to fuels and chemicals by different thermo-chemical and biochemical routes. Second generation biofuels produced from lig-nocellulosic biomass is not competing with the food chain. Lignocellulose is acomposite material with three biopolymers such as cellulose, hemicelluloses andlignin. Starting feedstock for petroleum refinery is the liquid crude oil whereas in
R. SinghA. S. College, Samrala Road, Khanna 141402, India
B.B. Krishna � T. Bhaskar (&)Thermo-Catalytic Processes Area, Bio-Fuels Division (BFD),CSIR-Indian Institute of Petroleum (IIP), Dehradun 248005, Indiae-mail: [email protected]; [email protected]
© Springer Nature Singapore Pte Ltd. 2017A.K. Agarwal et al. (eds.), Biofuels, Green Energy and Technology,DOI 10.1007/978-981-10-3791-7_5
69

case of biorefinery starting material is solid biomass. In order to make biorefineryequivalent to existing and well established petroleum refinery, the first step is toeffectively convert the solid biomass to liquid bio-crude thereby converting thewhole biomass to liquid products. In order to achieve this, thermochemical methodslike pyrolysis and hydrothermal liquefaction (HTL) seems to have a great potentialto produce liquid hydrocarbons from biomass. HTL is a process for obtainingfuels/chemicals from biomass in the presence of a sub/supercritical solvent atmoderate to high temperature (250–350 °C) and pressure (5–25 MPa). Comparedto pyrolysis better quality bio-oil is obtained by HTL. Subcritical water possessesunique properties of high ion product (Kw) and a low dielectric constant and can actas both acid and base catalyst [20].
The major reaction paths of cellulose in subcritical and supercritical water werefound to be hydrolysis, retro-aldol condensation, keto-enol tautomerism, anddehydration [3, 5, 7–11]. It was observed using a diamond anvil cell that celluloseswell or dissolved in high-temperature and high-pressure water using in situobservation of its phase behaviour [16]. Microcrystalline cellulose conversion insubcritical and supercritical water was conducted at temperatures between 290 and400 °C in a continuous-flow-type micro reactor. The main products of the micro-crystalline cellulose conversion were hydrolysis products, aqueous degradationproducts of glucose (fructose, erythrose, glycolaldehyde, glyceraldehyde, 5-HMF,etc.), and undetected aqueous products that were probably organic acids (e.g., aceticacid and formic acid) [17]. Effect of subcritical water on structural changes inmicrocrystalline cellulose was studied and it was observed that crystallinityremained practically unchanged throughout the treatment, whereas the size of theremaining cellulose crystallites increased. Microcrystalline cellulose underwentsignificant depolymerisation in subcritical water and cellulose gets dissolved insubcritical water after extensive depolymerisation [25]. The primary liquid productsfrom cellulose hydrolysis contain glucose oligomers and their derivatives with awide range of degrees of polymerization. The primary hydrolysis reactions on thesurface of reacting cellulose particles seem to proceed via the breaking of hydrogenbonds in the structure of microcrystalline cellulose and the random cleavage of theaccessible glycosidic bonds in the cellulose and degradation reactions also occurrandomly on the surface of cellulose particles, but to a much lesser extent, incomparison to the primary hydrolysis reactions [32]. The behaviour of cellulose inhigh temperature and high pressure water was studied and it was found that crys-talline cellulose was transformed to an amorphous state in high temperature and highpressure water followed by complete dissolution [2]. Hydrothermal liquefaction ofcellulose at different pH of 3, 7 and 14 was conducted at temperatures of 275–320 °Cwith reaction residence times of 0–30 min [31]. 5-Hydroxymethylfurfural(HMF) was main product obtained under acidic and neutral conditions, whereasthe main compounds became C2–5 carboxylic acids under alkaline conditions. Forbio-oil yields, it was observed that high temperatures and long residence times hadnegative effects, regardless of the pH levels [31].
Hydrothermal liquefaction of alkaline lignin was studied and bio-oil was mainlycomposed of phenolics. Hydrothermal decomposition of lignin followed mainly
70 R. Singh et al.

three steps: hydrolysis and cleavage of the ether bond and the C–C bond,demethoxylation, and alkylation [12]. Hydrothermal oxidative degradation of ligninusing 0.1% hydrogen peroxide solution in the flow reactor at 150–200 °C wasstudied to produce organic acids such as formic, acetic, and succinic acids. In caseof alkali lignin total yield of organic acids was obtained after oxidation for 2 min at200 °C and was 0.45 g/g-lignin. When organosolv lignin was oxidized at 160 °C,lignin was depolymerised into the oligomer of MW = ca. 300 and the total yield oforganic acids was 0.20 g/g-lignin [6]. Hydrothermal liquefaction of lignin to sub-stituted phenols and aromatic ethers was performed using methanol and ethanol atvarious temperatures (200, 250 and 280 °C) and residence times of 15, 30 and45 min where maximum liquid product yield of 85% was observed [19].
In order to understand and select the conditions for hydrothermal liquefaction ofwhole biomass, it is essential to understand the hydrothermal liquefaction of celluloseand lignin. The fundamental studies to understand the role of individual biomasscomponents (cellulose and lignin) on the production of valuable hydrocarbons duringhydrothermal liquefaction (HTL) is presented in this manuscript. Hydrothermal liq-uefaction of cellulose and lignin was carried out under thermal as well as catalyticconditions to understand the product distribution and nature of products formed.
2 Materials and Experimental Procedures
2.1 Materials
Micro crystalline cellulose has been purchased from Sigma-Aldrich (CAS No:9004-34-6) and dealkaline lignin and has been procured from TCI (LotNo. REA6C). Carbon, hydrogen, nitrogen and sulfur content in lignin were found tobe 45.69, 5.21, 0, 4.48% respectively. Total organic carbon in lignin was 44.79%.Calorific value of lignin was 17.92 MJ Kg−1. ICP analysis of de-alkaline lignin isshown in Table 1. Na amount was very high in lignin compared to other elements.
2.2 Apparatus and Experimental Procedure
Hydrothermal liquefaction experiments of cellulose and lignin were conducted in a500 ml high pressure autoclave (Autoclave Engineers) at 280 °C, 15 min residencetime, 1:6 H2O:biomass ratio and alkaline catalysts (KOH) under N2. Hydrothermalliquefaction of cellulose was also carried out in presence of CO2. The detailed
Table 1 ICP analysis of de-alkaline lignin
Element Ca Si Cu Cr Ni Pb Al Mn Na K Mg Fe Co
Lignin, ppm 380 120 15 3 3 <1 30 15 40,305 278 994 85 <1
Hydrothermal Liquefaction of Lignocellulosic Biomass Components … 71

experimental procedure can be found in our earlier papers [18, 21]. Ether solublefraction after extraction from aqueous phase was weighed and designated asbio-oil1. After extraction, the remaining water phase contained the water-solubleoxygenated hydrocarbons. Solid products were extracted with acetone in a Soxhletextraction apparatus until the solvent in the thimble became colorless. Afterremoval of the acetone under reduced pressure in a rotary evaporator, this fractionwas weighed and designated as bio-oil2. Acetone insoluble fraction was dried at80 °C then weighed, called as bio-residue.
2.3 Analysis of Feed and Reaction Products
Cellulose, lignin and reaction products obtained after the hydrothermal liquefactionwere analyzed by thermo gravimetric analysis, powder XRD, SEM and FTIR. Thebio-oil samples were analyzed using FTIR and NMR (1H NMR, 13C NMR).Powder XRD patterns were collected on a Bruker D8 advance X-ray diffractometerfitted with a Lynx eye high-speed strip detector and a Cu Ka radiation source.Diffraction patterns in the 2°–80° region are recorded with a 0.04 step size (steptime = 4 s). SEM images have been collected on a FEI Quanta 200 F, usingtungsten filament doped with lanthanum hexaboride (LaB6) as an X-ray source,fitted with an ETD (Everhart Thornley Detector), which preferentially work as asecondary electron detector. The sample for SEM has been subjected to disperse ona carbon paper coated adhesive followed by gold coating. TG-DTG of cellulose andlignin was carried out on Shimadzu DTG-60 under N2 flow of 100 ml min−1 atheating rate of 10 °C min−1. The 13C NMR and 1H NMR spectra of the bio-oilsamples have been recorded in the Bruker avance 500 plus instrument. CDCl3 hasbeen used as a solvent. The FTIR spectra were recorded on a Nicolet 8700 FTIRspectrometer. The trace metal analysis of feedstock was carried out using DRE,PS-3000 UV, Leeman Labs Inc., Inductively Coupled Plasma-Atomic EmissionSpectroscopy. The gross calorific value of the feed has been found out using theParr 6300 Bomb Calorimeter. The ultimate analysis has been carried out usingElementar vario micro cube unit. TOC analysis of lignin was performed usingShimadzu TOC-L unit with solid sample module SSM-5000A.
3 Results and Discussions
3.1 Properties of Feedstock
3.1.1 Cellulose
TG/DTG of cellulose shows a single decomposition peak in DTG around 341 °C.There was around 90% weight loss in cellulose with temperature up to 400 °C.
72 R. Singh et al.

FTIR spectrum of cellulose showed broad band of the CH, CH2 stretching at2900 cm−1 and the CH2 shearing at 1400 cm−1. The band at 3400 cm−1 wasidentified as corresponding to OH. The peak at 1200 cm−1 corresponds to C–O–Cstretching. The peak around 1040 cm−1 corresponds to C–O stretching. The peak at899 cm−1 corresponds to ring CH2 rocking.
Lignin
Powder XRD of lignin showed the amorphous nature of de-alkaline lignin. Somesharp peaks were also observed that might be due to the presence of some inorganiccompounds in lignin as ICP analysis showed the presence of some inorganic ele-ments in lignin. TG/DTG of de-alkaline lignin showed around 80% weight loss inlignin up to 900 °C. The decomposition pattern of lignin was complex. There weretwo major decomposition peaks at around 350 and 750 °C. TG/DTG profile oflignin showed that it decomposed in a wider temperature range from 200–800°C.FTIR spectra of de-alkaline (Fig. 3) lignin shows absorbance peak at 1037 cm−1
which is due to the C–O stretching vibrations. The peak at 1212 cm−1 is due to theC–C and C–O stretching vibrations. The peak at 1426 cm−1 is due to the C–H inplane deformation. C–H stretching vibrations in lignin are observed at 2934 cm−1.Peak at 3422 cm−1 is due to O–H stretching vibrations and shows the presence ofphenolic hydroxyl groups. Peak at 1597 cm−1 corresponds to C–C stretch in aro-matics. The peak at 1710 cm−1 shows presence of C = O groups in lignin.Aromatic ring vibrations are observed at 1513 cm−1 [28].
3.2 Product Distribution from Hydrothermal Liquefactionof Cellulose and Lignin
Hydrothermal liquefaction (HTL) of cellulose and lignin under non catalytic andcatalytic conditions (KOH) was studied to understand the product distribution underdifferent conditions. Non catalytic HTL studies of cellulose were done undernitrogen as well as CO2 environment to study the effect of gaseous environment onthe product distribution and nature of the products. Product distribution from HTLof cellulose and lignin is shown in Table 2.
In case of HTL of cellulose using N2 at 280 °C, bio-oil1 yield was 6 wt% andbio-oil2 yield was 6 wt%. The total bio-oil yield was 12 wt%. The gas yield was 6wt%. The yield of bio-residue obtained was 32 wt% and conversion was 68%. Theothers in the Table 2 corresponds to water soluble oxygenated hydrocarbons andtheir yield observed was 50 wt%. When reaction was carried out in CO2 envi-ronment bio-oil1 yield observed was 5 wt% and bio-oil2 yield observed was 7 wt%.The total bio-oil yield observed was 12 wt%. Gas yield observed was 8 wt%. Thebio-residue yield observed was 31 wt% and conversion was 69%. The yield of
Hydrothermal Liquefaction of Lignocellulosic Biomass Components … 73

water soluble oxygenated hydrocarbons (others) was 49 wt%. From above data itwas observed that the use of CO2 have a negligible effect on the product distributionof the reaction products. When HTL of cellulose was carried out using KOHbio-oil1 yield observed was 17 wt% and bio-oil2 yield observed was 11 wt%. Thetotal bio-oil yield observed was 28 wt%. Gas yield observed was 11 wt%. Thebio-residue yield observed was 10 wt% and conversion was 90%. Use of thecatalyst (KOH) significantly increased the conversion and product yields. Theconversion was increased to 90% with the use of catalyst from 68% in case of noncatalytic studies. The total bio-oil yield was also increased from 12 to 27% usingthe catalyst. Both the bio-oil1 and bio-oil2 yield gets increased with the use of thecatalyst.
In case of HTL of de-alkaline lignin at 280 °C without any catalyst, bio-oil1yield was 2 wt% and bio-oil2 yield was 8 wt%. The total bio-oil yield was 10 wt%.The gas yield was 8 wt%. The yield of bio-residue obtained was 34 wt% andconversion was 66%. The others’ yield observed was 48 wt%. When HTL ofde-alkaline lignin was carried out using KOH, bio-oil1 yield observed was 14 wt%and bio-oil2 yield observed was 3 wt%. The total bio-oil yield observed was 17 wt%. Gas yield observed was 6 wt%. The bio-residue yield observed was 28 wt% andconversion was 72%. Here also use of alkaline catalyst increased the conversion aswell as liquid products yield similar to cellulose. There was significant increase ofthe bio-oil1 yield with the use of the catalyst. Gas yield was almost constant underboth catalytic as well as non catalytic case.
Use of the alkali based catalyst increased the conversion as well as liquidproducts yield in case of lignin as well as cellulose. This shows that the catalyst willalso be helpful in increasing the conversion and liquid product yield in case oflignocellulosic biomass as whole and same was observed in our earlier reports [18,21, 22].
Table 2 Effect of various reaction conditions on hydrothermal liquefaction of cellulose and ligninat 280 °C for 15 min
Feed Conversiona
(%)Bio-oil1b
(wt%)Bio-oil2c
(wt%)Total oil(wt%)
Gasd
(wt%)Residuee
(wt%)Othersf
(wt%)
Cellulose, H2O 68 6 6 12 6 32 50
Cellulose, KOH 90 17 11 28 11 10 51
Cellulose, H2O,CO2
69 5 7 12 8 31 49
Lignin, H2O 66 2 8 10 8 34 48
Lignin, KOH 72 14 3 17 6 28 49aSee Appendix Eq. 1bSee Appendix Eq. 2cSee Appendix Eq. 3dSee Appendix Eq. 4eSee Appendix Eq. 5fSee Appendix Eq. 6
74 R. Singh et al.
The addition of alkali positively influences hydrothermal liquefaction byaccelerating the water gas shift and increases liquid yields [14, 27, 29]. Alkalinecatalysts also raise the pH and inhibits dehydration of the biomass monomers.Oxygen removal in form of dehydration instead of decarboxylation might result inunsaturated compounds which have tendency to polymerize to char and tar and useof alkali catalysts suppress char and tar formation [26].
3.3 Analysis of Reaction Products
3.3.1 Analysis of Liquid Products
Cellulose
FTIR spectra of bio-oil1 obtained from cellulose under different reaction conditionsshowed various peaks at 3357, 3964, 1711, 1513, 1451, 1200, 1078 cm−1 etc. wereobserved in all the bio-oil1 obtained under all conditions. FTIR of bio-oil1 obtainedunder different conditions was similar but intensity of some peaks varies. Peak ataround 3300 cm−1 were assigned to the O–H of alcohols. The peak was observed at3344, 3312, and 3357 cm−1 in case of liquefaction using H2O (N2), H2O (CO2),and KOH respectively. Peak at around 2970 cm−1 observed in bio-oil1 is assignedto C–H stretch of alkanes. Peak around 1700 cm−1 is due to the C = O stretch thatmay be due to presence of aldehydes or ketone groups in bio-oil1. Peaks from 1350to 1470 cm−1 are assigned to the C–H rocking and C–H bending vibrations inalkanes. Peaks from 1000–1320 cm−1 are assigned to the C–O stretch of alcohols,ethers, carboxylic acids, esters etc. Peaks from 910–950 cm−1 may be due to O–Hbending vibrations of carboxylic acids. FTIR of bio-oil2 also showed similar peaksbut the intensity of peaks varies.
1H and 13C NMR of bio-oil1 obtained from hydrothermal liquefaction of cel-lulose using KOH is shown in Figs. 1 and 2 respectively.
1H NMR spectra have been used to get information regarding the various typesof protons present in the bio-oil. The most downfield region 0.5–1.5 ppm corre-sponds to the protons present in short chain aliphatics attached to carbon atomswhich are at least 2 bonds away from C=C or heteroatom. The next region from 1.5to 3.0 ppm corresponds to protons on aliphatic carbon atoms which are bonded toC=C either aromatic or olefinic or are two bonds away from a heteroatom. The nextregion 3.0–4.4 ppm corresponds to protons that are attached to carbon atoms nextto an aliphatic alcohol. The range 6.0–8.5 ppm represents the aromatic region of thespectrum. It encompasses the protons in benzenoid molecules and heteroaromatics[15].
Bio-oil1 obtained from hydrothermal liquefaction of cellulose using KOHshowed high proton percentage in aliphatic region from 0.5–3.0 ppm. Proton per-centage in the region from 0.5–1.5 ppm was 28% and in the region from 1.5–3.0 ppm was 39%. Proton percentage in the region from 3.0–4.5 ppm was 12%.
Hydrothermal Liquefaction of Lignocellulosic Biomass Components … 75

Fig. 1 1H NMR of bio-oil1 obtained from HTL of cellulose using KOH
Fig. 2 13C NMR of bio-oil1 obtained from HTL of cellulose using KOH
76 R. Singh et al.

Proton percentage in the region from 6.0–8.5 were also observed (20%) that mightbe due to the heteroaromatics like furan derived compounds, furfural or hydrox-ymethylfurfural etc. 13C NMR of bio-oil1 pointed to a high aliphatic content (0–55 ppm) similar to 1H NMR that also showed high aliphatic proton percentage.Carbon percentage in region from 0–55 ppm was 66%. The next region of thespectrum is from 55–95 ppm which indicates the presence of alcohol, ethers, andcarbohydrate sugars. Carbon percentage in this region was 12%. The aromatics andthe olefinic compounds resonate in downfield region and resonate in the regionbetween 95–165 ppm. The carbon percentage in this region was 13%. The regionbetween 165–180 ppm corresponds to the esters and carboxylic acid carbons andcarbon percentage in this region was 6%. Further downfield region between 180–215 ppm corresponds to the ketones and aldehydes carbons. Carbon percentage wasaround 3% in this region. Peaks corresponding to aldehydes, ketones and car-boxylic acids were also observed in FTIR of bio-oil. FTIR and NMR of bio-oilindicate that cellulose was decomposed to various aliphatic alcohols, furans,aldehydes, carbohydrate sugars and acids etc.
Lignin
FTIR spectra of bio-oil1 and bio-oil2 obtained after hydrothermal liquefaction ofde-alkaline lignin using water at 280 °C is shown in Fig. 3.
It was clear from the figure that bio-oil1 and bio-oil2 has more functionality thande-alkaline lignin indicating that lignin depolymerisation has occurred. The FTIRspectrum of bio-oil1 and bio-oil2 showed absorbance at 1110, 1121, 1215, 1224,
1000 1500 2000 2500 3000 3500
60
80
100
120
140
160
180
200
220
240
260
Bio-oil2
Bio-oil1
Bio-residue
% T
rans
mis
sion
Wavenumber, cm-1
Lignin
Fig. 3 FTIR analysis of lignin, bio-residue, bio-oil1 and bio-oil2 obtained at 280 °C
Hydrothermal Liquefaction of Lignocellulosic Biomass Components … 77

1465, 1513, 1595, 1706, and 2934 cm−1. The absorbances at 2847, 2936, 2962 and1460 cm−1 is attributed to C–H stretching vibrations of methyl and methylene andabsorbance of these peaks increased in liquid samples and indicates the presence ofalkane groups in liquid products. The absorbance at 3007 cm−1 in io-oil1 and3003 cm−1 in bio-oil2 corresponds to the C–H stretch of aromatics. The increasedabsorption peak at 1700 cm−1 in bio-oil2 suggests the presence of conjugatedaromatic ketones or esters. The absorbances at 1513 and 160 cm−1 corresponds toaryl groups and is present in both bio-oil1 and bio-oil2. The peaks around 1220 and3400 cm−1 indicate the presence of phenols which was present in both bio-oil1 aswell as bio-oil2. The peak was observed at 1110 Cm−1 in bio-oil1 and 1120 cm−1 inbio-oil2 belongs to methoxy groups. The peak at 826 cm−1 in bio-oil1 indicates thepresence of para-substituted aromatic groups [30]. The FTIR spectra of bio-oil1 andbio-oil2 obtained from the hydrothermal liquefaction of lignin using water wasalmost similar and indicates the presence of phenols and aromatic ethers. Bio-oil1and bio-oil2 obtained from hydrothermal liquefaction of lignin using water assolvents have same functionality.
NMR spectra provided complementary functional group information to FTIRspectra and enabled to quantify and compare integration areas between spectra. 1HNMR of bio-oil1 obtained after hydrothermal liquefaction of lignin using water isshown in Fig. 4.
The region from 0.5–3.0 is composed of protons on aliphatic carbon. Bio-oil2obtained from hydrothermal liquefaction of lignin showed high proton percentage
Fig. 4 1H NMR of bio-oil1 obtained from HTL of de-alkaline lignin using H2O
78 R. Singh et al.

in this region. Proton percentage in region from 0.5–3.0 ppm was 14% in case ofbio-oil1 whereas it was 65% in case of bio-oil2. The next portion of the 1H NMRspectrum, 3.0–4.5 ppm represents methoxyl protons [13] or methylene group thatjoins two aromatic rings [15]. Bio-oil1 showed high proton percentage (29%) in thisregion compared to bio-oil2 (20%). The region between 4.5–6.6 ppm representsaromatic ether protons i.e. lignin derived methoxy phenols. Bio-oil1 (10%) showedhigh proton percentage in this region than bio-oil2 (1%) The region of the spectrumbetween 6.0–8.5 ppm corresponds to the aromatic region of spectrum. Bothbio-oil1 and bio-oil2 showed significant proton percentage in this region. Protonpercentage in this region was 38% in bio-oil1 and 15% in bio-oil2. The downfieldspectrum regions (8.5–10 ppm) of the bio-oils arise from the aldehydes and theproton percentage was very low in this region less than 1%.
13C NMR of bio-oil1 is shown in Fig. 5. 13C NMR of bio-oil2 (35%) pointed toa high aliphatic content (0–55 ppm) than bio-oil1 (23%) similar to 1H NMR thatalso showed high aliphatic proton percentage in bio-oil2 than bio-oil1. The nextregion of the spectrum is from 55–95 ppm which indicates the presence of alcoholethers, phenolic methoxys and carbohydrate sugars. Carbon percentage in thisregion was 7 and 6% in case of bio-oil2 and bio-oil1 respectively. The aromaticsand the olefinic compounds resonate in downfield region and resonate in the regionbetween 95–165 ppm. The carbon percentage in this region was very high for bothbio-oil1 and bio-oil2. Carbon percentage in this region was 69 and 55% in case ofbio-oil1 and bio-oil2 respectively. The region between 165–180 ppm correspondsto the esters and carboxylic acid carbons. Further downfield region between 180–215 ppm corresponds to the ketones and aldehydes carbons. Carbon percentage wasaround 3% in this region.
The FTIR and NMR (1H and 13C) of the bio-oil1 and bio-oil2 indicated thepresence of substituted phenols and aromatic ethers present in bio-oil. This indi-cated that lignin was depolymerised to low molecular weight phenols and aromaticethers during hydrothermal liquefaction using water. Similar results were alsoobserved when lignin was depolymerised using methanol and ethanol [19]. Theformation of substituted phenols and aromatic ethers may be due to the breakage ofvarious C–C and C–O–C ether bonds (b–O–4 or/and a–O–4) present in lignin. Inthe hydrothermal liquefaction of lignin, hydrolysis and cleavage of the ether bondand the C–C bond, demethoxylation, alkylation and condensation reactions occur[1, 12]. The aromatic rings are generally not affected by hydrothermal reactions [1]indicating that phenolic monomers could be obtained by preliminary cleavage ofether bond and aliphatic C–C bond in a mild condition of relatively low temperatureand short reaction time. Phenolic monomers were also observed during HTL ofdifferent lignocellulosic compounds presented in our earlier manuscripts that havebeen formed by hydrolytic cleavage of lignin in them [23, 24].
Hydrothermal Liquefaction of Lignocellulosic Biomass Components … 79

3.3.2 Analysis of Bio-Residue
Cellulose
FTIR spectrum of cellulose and bio-residue showed that absorbance peak of the OHstretching vibration (around 3400 cm−1) which corresponds to the hydrogen bon-ded OH groups in intramolecular and intermolecular cellulose, respectively,decreases in bio-residue sample compared to cellulose. This shows that cellulosehas undergone hydrolytic cleavage during HTL.
SEM of cellulose and bio-residue obtained after HTL of cellulose is shown inFig. 6. SEM showed that under HTL reaction conditions the fibrous structure ofcellulose was broken and spherical particles are observed in bio-residue. Thefibrous network starts to be disrupted at several points leading to the formation ofnano/micro-sized cellulose fragments, which, not being soluble in water, adopt aspherical shape to minimize their contacting interface with the surroundings [4].
Lignin
FTIR spectra of pure lignin and bio-residue obtained after hydrothermal liquefac-tion of lignin using water at 280 °C is shown in Fig. 3. The absorbances from the
Fig. 5 13C NMR of bio-oil1 obtained from HTL of de-alkaline lignin using H2O
80 R. Singh et al.

ether bond C–O–C at 1130 and 1037 cm−1 weaken in intensity for bio-residuecompared to lignin. Peak at 1130 cm−1 was not observed in bio-residue. This ispossible due to the breakage of b–O–4 and/or a–O–4 ether bonds to form hydroxylgroups and alkyl groups. The weakening of these absorbance peaks in bio-residuesamples indicate that the breakage of b–O–4 and/or a–O–4 ether bonds to formhydroxyl groups and alkyl groups have occurred at 280 °C using water [30]. SEMof lignin and bio-residue obtained is shown in Fig. 7. Similar to SEM of celluloseSEM of lignin also showed the formation of spherical particles but the formationwas not as good as in cellulose.
4 Conclusions
Thermal and catalytic HTL of cellulose and lignin was performed at 280 °C underbiomass:H2O ratio of 1:6 at 15 min residence time. The use of alkaline catalystssignificantly increased both bio-oil yield and conversion for cellulose as well as
Bio-residueCellulose
Fig. 6 SEM of cellulose and bio-residue obtained using water at 280 °C
Lignin Bio-residue
Fig. 7 SEM of lignin and bio-residue
Hydrothermal Liquefaction of Lignocellulosic Biomass Components … 81
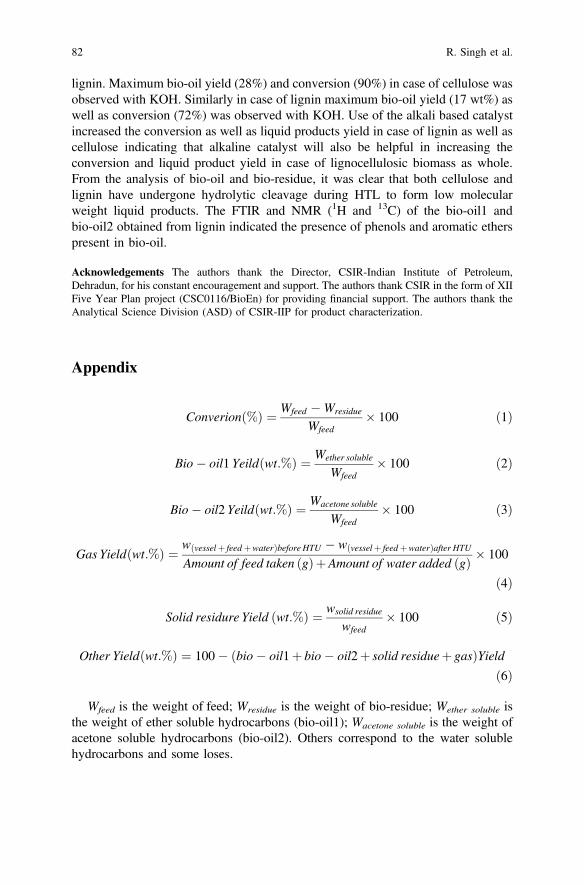
lignin. Maximum bio-oil yield (28%) and conversion (90%) in case of cellulose wasobserved with KOH. Similarly in case of lignin maximum bio-oil yield (17 wt%) aswell as conversion (72%) was observed with KOH. Use of the alkali based catalystincreased the conversion as well as liquid products yield in case of lignin as well ascellulose indicating that alkaline catalyst will also be helpful in increasing theconversion and liquid product yield in case of lignocellulosic biomass as whole.From the analysis of bio-oil and bio-residue, it was clear that both cellulose andlignin have undergone hydrolytic cleavage during HTL to form low molecularweight liquid products. The FTIR and NMR (1H and 13C) of the bio-oil1 andbio-oil2 obtained from lignin indicated the presence of phenols and aromatic etherspresent in bio-oil.
Acknowledgements The authors thank the Director, CSIR-Indian Institute of Petroleum,Dehradun, for his constant encouragement and support. The authors thank CSIR in the form of XIIFive Year Plan project (CSC0116/BioEn) for providing financial support. The authors thank theAnalytical Science Division (ASD) of CSIR-IIP for product characterization.
Appendix
Converionð%Þ ¼ Wfeed �Wresidue
Wfeed� 100 ð1Þ
Bio� oil1 Yeildðwt:%Þ ¼ Wether soluble
Wfeed� 100 ð2Þ
Bio� oil2 Yeildðwt:%Þ ¼ Wacetone soluble
Wfeed� 100 ð3Þ
Gas Yieldðwt:%Þ ¼ wðvesselþ feedþwaterÞbefore HTU � wðvesselþ feedþwaterÞafter HTUAmount of feed taken ðgÞþAmount of water added ðgÞ � 100
ð4Þ
Solid residure Yield ðwt:%Þ ¼ wsolid residue
wfeed� 100 ð5Þ
Other Yieldðwt:%Þ ¼ 100� ðbio� oil1þ bio� oil2þ solid residueþ gasÞYieldð6Þ
Wfeed is the weight of feed; Wresidue is the weight of bio-residue; Wether soluble isthe weight of ether soluble hydrocarbons (bio-oil1); Wacetone soluble is the weight ofacetone soluble hydrocarbons (bio-oil2). Others correspond to the water solublehydrocarbons and some loses.
82 R. Singh et al.

References
1. Barbier J, Charon N, Dupassieux N, Loppinet-Serani A, Mahe L, Ponthus J et al (2012)Hydrothermal conversion of lignin compounds. A detailed study of fragmentation andcondensation reaction pathways. Biomass Bioenergy 46:479–491
2. Deguchi S, Tsujiib K, Horikoshi K (2008) Crystalline-to-amorphous transformation ofcellulose in hot and compressed water and its implications for hydrothermal conversion.Green Chem 10:191–196
3. Ehara K, Saka S (2002) A comparative study on chemical conversion of cellulose between thebatch-type and flow-type systems in supercritical water. Cellulose 9:301–311
4. Falco C, Baccile N, Titirici MM (2011) Morphological and structural differences betweenglucose, cellulose and lignocellulosic biomass derived hydrothermal carbons. Green Chem13:3273–3281
5. Goto K, Tajima K, Sasaki M, Adschiri T, Arai K (2001) Reaction mechanism of sugarderivatives in subcritical and supercritical water. Kobunshi Ronbunshu 58:685
6. Hasegawa I, Inoue Y, Muranaka Y, Yasukawa T, Mae K (2011) Selective production oforganic acids and depolymerization of lignin by hydrothermal oxidation with dilutedhydrogen peroxide. Energy Fuels 25:791–796
7. Kabyemela BM, Adschiri T, Malaluan RM, Arai K (1997) Kinetics of glucose epimerizationand decomposition in subcritical and supercritical water. Ind Eng Chem Res 36:1552–1558
8. Kabyemela BM, Adschiri T, Malaluan RM, Arai K (1997) Degradation kinetics ofdihydroxyacetone and glyceraldehyde in subcritical and supercritical water. Ind Eng ChemRes 36:2025–2030
9. Kabyemela BM, Adschiri T, Malaluan RM, Arai K, Ohzeki H (1997) Rapid and selectiveconversion of glucose to erythrose in supercritical water. Ind Eng Chem Res 36:5063–5067
10. Kabyemela BM, Takigawa M, Adschiri T, Malauan RM, Arai K (1998) Mechanismand kinetics of cellulose decomposition in sub and supercritical water. Ind Eng Chem Res37:357–361
11. Kabyemela BM, Adschiri T, Malaluan RM, Arai K (1999) Glucose and fructosedecomposition in subcritical and supercritical water: detailed reaction pathway, mechanisms,and kinetics. Ind Eng Chem Res 38:2888–2895
12. Kang S, Li B, Chang J, Fan J (2011) Antioxidant abilities comparison of lignins with theirhydrothermal liquefaction products. Bioresources 6:243–252
13. Kosa M, Ben H, Theliander H, Ragauskas AJ (2011) Pyrolysis oils from CO2 precipitatedKraft lignin. Green Chem 13:3196–3202
14. Mok WSL, Antal MJ, Varhegyi G (1992) Productive and parasitic pathways in diluteacid-catalyzed hydrolysis of cellulose. Ind Eng Chem Res 31:94–100
15. Mullen CA, Strahan GD, Boateng AA (2009) Characterization of various fast-pyrolysisbio-oils by NMR spectroscopy. Energy Fuel 23:2707–2718
16. Sasaki M, Fang Z, Fukushima Y, Adschiri T, Arai K (2000) Dissolution and hydrolysis ofcellulose in sub- and supercritical water. Ind Eng Chem Res 39:2883–2890
17. Sasaki M, Adschiri T, Arai K (2004) Kinetics of cellulose conversion at 25 mpa in sub- andsupercritical water. AIChE J 50:192–202
18. Singh R, Bhaskar T, Dora S, Balagurumurthy B (2013) Catalytic hydrothermal upgradation ofwheat husk. Bioresour Technol 149:446–451
19. Singh R, Prakash A, Dhiman SK, Balagurumurthy B, Arora AK, Puri SK et al (2014)Hydrothermal conversion of lignin to substituted phenols and aromatic ethers. BioresourTechnol 165:319–322
20. Singh R, Prakash A, Balagurumurthy B, Bhaskar T (2015a) Hydrothermal liquefaction ofbiomass. In: Pandey A, Bhaskar T, Stöcker M, Sukumaran R (eds) Advances inthermochemical conversion of biomass, Elsevier, pp 269–291
Hydrothermal Liquefaction of Lignocellulosic Biomass Components … 83

21. Singh R, Prakash A, Balagurumurthy B, Singh R, Saran S, Bhaskar T (2015) Hydrothermalliquefaction of agricultural and forest biomass residue: comparative study. J Mater CyclesWaste Manage 17:442–452
22. Singh R, Balagurumurthy B, Prakash A, Bhaskar T (2015) Catalytic hydrothermalliquefaction of water hyacinth. Bioresour Technol 178:157–165
23. Singh R, Chaudhary K, Biswas B, Balagurumurthy B, Bhaskar T (2015) Hydrothermalliquefaction of rice straw: effect of reaction environment. J Supercrit Fluids 104:70–75
24. Singh R, Srivastava V, Chaudhary K, Gupta P, Prakash A, Balagurumurthy B (2015)Conversion of rice straw to monomeric phenols under supercritical methanol and ethanol.Bioresour Technol 188:280–286
25. Tolonen LK, Zuckerstatter G, Penttila PA, Milacher W, Habicht W, Serimaa R, Kruse A,Sixta H (2011) Structural changes in microcrystalline cellulose in subcritical water treatment.Biomacromolecules 12:2544–2551
26. Toor SS, Rosendahl L, Rudolf A (2011) Hydrothermal liquefaction of biomass: a review ofsubcritical water technologies. Energy 36:2328–2342
27. Watanabe M, Aizawa Y, Iida T, Aida TM, Levy C, Sue K et al (2005) Glucose reactions withacid and base catalysts in hot compressed water at 473 K. Carbohydr Res 340:1925–1930
28. Xu F, Yu J, Tesso T, Dowell F, Wang D (2013) Qualitative and quantitative analysis oflignocellulosic biomass using infrared techniques: a mini-review. Appl Energy 104:801–809
29. Yang BY, Montgomery R (1996) Alkaline degradation of glucose: effect of initialconcentration of reactants. Carbohydr Res 280:27–45
30. Ye Y, Zhang Y, Fan J, Chang J (2012) Novel method for production of phenolics bycombining lignin extraction with lignin depolymerization in aqueous ethanol. Ind Eng ChemRes 51:103–110
31. Yin S, Tan Z (2012) Hydrothermal liquefaction of cellulose to bio-oil under acidic, neutraland alkaline conditions. Appl Energy 92:234–239
32. Yu Y, Wu H (2010) Understanding the primary liquid products of cellulose hydrolysis inhot-compressed water at various reaction temperatures. Energy Fuels 24:1963–1971
84 R. Singh et al.
Pretreatment Strategies of LignocellulosicBiomass Towards Ethanol Yield: CaseStudy of Pine Needles
Sangeeta Negi
Abstract Today one of the most challenging and noticeable problem is how tosupply the vast quantities of energy, fuels and chemicals when oil, gas and coal aredepleting exponentially with increase in population. In current scenario lignocel-lulosic bioethanol seems promising alternative sources of energy and chemicalswhich is considered a cleaner/or green source also. Lignocellulose, is composed ofmainly by three components namely cellulose, hemicelluloses and lignin. Howevercellulose and hemicellulose are protected by lignin layer, due to which they are notaccessible to hydrolytic enzymes and efficiency of the bioethanol production alsoinfluenced by crystallinity of cellulose, lignin content, water content and surfacearea etc. Pretreatment technologies in practice show shortfalls and inefficiency inmaking cellulose and hemicelluloses free for hydrolysis and also to crack thecrystallinity of cellulose. Basically selection of efficient pretreatment processdepends on the biomass composition, process economics and environmentalimpact, therefore in search of an efficient and eco-friendly pretreatment technolo-gies, in current chapter, pretreatment of Pine needles (PN) was carried out by usingvarious methods in combination, such as surfactant assisted acid pretreatment(SAAP), surfactant assisted alkali pretreatment (SABP) and sequential dilute alkaliand acid pretreatment (SDAPP) and during pretreatment sugar released (sugar loss)was found to be 0.211, 0.146 and 0.198 g/g, respectively. After pretreatment onenzymatic saccharification of SAAP, SABP and SDAPP liquor, reducing sugaryield was found to be enhanced up to 0.588, 0.477 and 0.582 g/g, respectivelyunder optimized conditions. The PN without pretreatment had released 0.144 g/g ofreducing sugar which implied that SDAAP had enhanced the saccharification up to4 fold. On comparisons of all these pretreatment strategies, sequential acid andalkali pretreatment was found more advantageous in terms of lesser sugar loss andhigh ethanol yield. However inhibitors generated during pretreatment have to beremoved with some potential resins such as Amberlite XAD-4.
S. Negi (&)Department of Biotechnology, Motilal Nehru National Institute of Technology,Allahabad 211004, Uttar Pradesh, India
© Springer Nature Singapore Pte Ltd. 2017A.K. Agarwal et al. (eds.), Biofuels, Green Energy and Technology,DOI 10.1007/978-981-10-3791-7_6
85

1 Introduction
As the world population is growing with exponential rate, the existing fossil fuelstock will not be enough to cope up with future energy needs. The continuousconsumption of fossil fuels will not only create the energy starvation in the futurebut it is also harming the environment by enormous emission of green house gases[1, 2]. Therefore, in view of these energy scarcity and environment related issues,the prima facie solution lies in the search of the cost effective alternate green fueli.e. Bioethanol [3, 4].
Till date, various sugars, starchy substances and lignocelluloses have beenexplored for the bioethanol production but they have not been found economicallyviable because of the demand vs. supply economics [4]. The first generation bio-masses used for bioethanol production were mostly food grains, which has alwaysgenerated the food vs. fuel debates. Infact, it doesn’t require any debate to concludethat food need always finds predominance over the fuel need. Therefore, there isneed of exploration of the readily available non-food based lignocellulosic feed-stock, which actually determines the economic feasibility of the lignocellulosicethanol production [3, 5].
Although, Indian economy is mainly based on agriculture, and India is amongthe top producers of various crops, still the utilization of food grains for the ethanolproduction is almost unthinkable when a vast portion of its populations live inpoverty. Hence, various nonfood based lignocellulosic biomass, such as Pineneedles, Sorghum Stover, Corn Stover, Cotton waste etc., are being explored for thecost effective ethanol production.
1.1 The Roadmap of the Lignocellulosic Biomass to EthanolProduction
The roadmap of the lignocellulosic biomass to ethanol production consists of fol-lowing steps (Fig. 1):
(i) Pretreatment of biomass: In this the biomass is subjected to the decon-struction of the complex network of lignin-cellulose-Hemicellulose.Pretreatment process may involve physical, chemical or biological methods.Physical methods are milling, grinding, extrusion, and irradiation (gammarays, electron beam, ultrasounds, microwaves); chemical methods includeacid, alkali, ammonia, organosolve etc.; whereas in biological pretreatmentwide range of microorganism have been explored to crack the complex cellwall structure to make cellulose and hemicelluloses accessible for sacchari-fication process.Although, lots of efforts have been put to make these processes more sus-tainable, cost effective and echo-friendly, still various drawbacks of the
86 S. Negi

processes are hindering industries to adopt and invest in bioethanol industry[6]. Amongst the drawbacks with existing processes of pretreatment, highpower requirement in mechanical pretreatments insufficient separation ofcellulose and lignin, generation of sugar and lignin derivatives (e.g. weakacids from hemicellulose, furfurals from hexoses and phenolics from thelignin) which later on adversely affects fermentation process, high use ofchemicals and/or energy and production of solid/liquid waste are mostchallenging [6].
(ii) Saccharification of pretreated biomass: In this the pretreated biomass issubjected to hydrolyzing agents such as chemicals (acid) or enzymes (mainlycellulase and xylanase) for the hydrolysis of complex sugars: cellulose andhemicelluloses, into corresponding simple monomeric sugars: hexoses andpentoses, which can easily be fermented by yeast.
(iii) Fermentation of sugars: In this the hydrolyzate obtained after the saccha-rification step (containing fermentable hexoses and pentoses) are exposed tofermentive yeast, generally, under anaerobic condition for ethanol produc-tion. The solution containing ethanol further undergoes distillation for sep-aration of pure ethanol.
Fig. 1 A schematic roadmap of lignocellulosic biomass to ethanol production
Pretreatment Strategies of Lignocellulosic Biomass … 87

1.2 Various Aspects of Pretreatment Process Selection
Although each step is important in the lignocellulosic ethanol production but thepretreatment of the lignocellulosic biomass is the key step because it is the majorfactor affecting the overall efficiency and economy of the entire process, i.e., theyield of fermentable sugar and ethanol, cost of product, plant set up etc.
In bioethanol production through lignocellulosic biomass main culprit is lignin,which reduces the cellulose accessibility for hydrolysis by cellulase enzyme. It iswidely postulated that lignin interferes with cellulase and cellulose bindings as itshields more than a quarter of the surface area of cellulose fibers. However, variousother mechanisms have also been hypothesized, such as the theory that lignin bindswith cellulase via electrostatic or hydrophobic interaction unproductively.
The main aim of pre-treatment processes is basically to reduce the coverage orshielding of cellulose surface by lignin. In crystalline form, cellulose has moreaffinity towards lignin in comparison to the non-crystalline form. Interaction ofcellulase with crystalline form of cellulose is less due to unavailability of hydroxylgroup of sugars for action, which remain hidden more in this form than innon-crystalline form. Through selection of right pretreatment strategies crystallinityof cellulose can be reduced along with the removal of lignin.
Another very crucial point with the existing pretreatment strategies is the gen-eration of the various byproduct derivatives, such as furans, phenolics and weakacids, which hinder with the ethanol production activity of the yeast by playing withtheir enzymatic machinery and reduce their efficiency for ethanol production [7].Therefore, the hydrolyzate has to be detoxified for the significant removal ofinhibitors using the effective detoxification agents, which makes the process moretime taking. It should be noticed that during this detoxification the sugar loss shouldbe minimum otherwise it will increase the cost of the overall process. Some pro-cesses such as over liming, treatment with hydrophobic and anionic resins, treat-ment with activated charcoal and enzymatic treatment using laccase are well knowndetoxification methods but these are not found very efficient in the removal of alltypes of inhibitors, simultaneously.
Therefore to make pretreatment process more effective, efficient and costeffective, followings aspects needs to be taken care of:
(a) Recalcitrance of biomass should be checked;(b) Process selected must give high yields of sugars or value added chemicals
and/or it must break down the biomass into the components easily accessible tohydrolytic enzymes or agents;
(c) Cellulosic and hemicellulosic layers must be intact (check carbohydratesdegradation);
(d) Control formation of inhibitory toxic byproducts;(e) Value added products should be recovered to make the process cost effective;(f) Select cost–effective, low energy input and reasonable size reactors or plant set
up with least waste generation.
88 S. Negi

In current scenario demand of ethanol from lignocellulose is growing fast andyield/supply is not able to meet the increased demand. To meet the increase indemand of bioethanol, yield and cost determining aspects of this industry have to bestudied well and more attention should be given in process development. Selectionof the suitable pretreatment method depends on various factors such as type oflignocellulosic biomass and desired product; therefore, any particular methodcannot be categorized as best or right method. A good method of pretreatmentsshould improve the digestibility of lignocellulosic biomaterials with least inhibitorgeneration at low cost. Each pretreatment has its own impact on the compositionand structure of various components of the biomass. In industries, acid-basedpretreatment methods are mainly in use for ethanol production. However, with thisprocess lignin is only partially removed and sugar loss is also high. Therefore, moreresearch is needed to be focused on higher removal of lignin with minimum sugarloss, increased solids concentration and higher yield of ethanol.
In this chapter studies on various pretreatment processes, i.e., steam explosion,dilute acid, dilute alkali, sequential dilute alkali and acid, microwave assisted alkali,microwave assisted dilute acid, microwave assisted dilute alkali and surfactantassisted acid pretreatment have been provided. For saccharification chemical pro-cesses are not preferred because these lead to degradation of cellulose and hemi-celluloses. In a chemical process high chemical charges are required for completelignin removal. Therefore, for complete removal of lignin, combination of two orthree processes may be adopted instead of choosing single process, because at lowchemical charges single pretreatment process is not very effective. The pretreatmentprocess should be designed to remove lignin and to disintegrate the cellulosestructure without loss (degradation) of cellulose and hemicellulose parts.
In this chapter case studies on various hybrid pretreatment methods, such assurfactant assisted acid pretreatment (SAAP), surfactant assisted alkali pretreatment(SABP) and sequential dilute alkali and acid pretreatment (SDAPP) for the opti-mized reduction of lignin hindrance and crystallinity in the ethanol productionprocess to make the process commercially viable have been described.
2 Various Pretreatment Methods
2.1 Selection of Pretreatment Method
Biomass varies from each other on the basis of their composition and structure;therefore pretreatment strategies differ for different biomasses. Because selection offeedstock or biomass is one of the major criteria impacting efficiency of the overallprocess and yield of the product, therefore, criteria of selection of pretreatmentmethod would be dependent on it. The criteria those must be taken into consid-eration while selecting feedstock are: high biomass production, optimal composi-tion, high harvest index, suitable storage of harvested material, high bulk density,
Pretreatment Strategies of Lignocellulosic Biomass … 89

high biofuel content in harvest biomass, high coproduct potential, high scalability,low harvest cost, high growth rate, high polysaccharide content, no intervention inhuman food chain etc.
Pretreatment process is directly related to the complexity of biomass. The majorfactors which makes the difference in the degree of digestibility or hydrolysis ofdifferent biomasses are degree of cellulose polymerization and crystallinity; poroussurface area (accessibility); thickness of lignin covering cellulose; hemicellulosecontent intermingled with cellulose (sheathing); and fibre strength [8, 9].
Followings are some of the key criteria for the selection of pretreatment processfor lignocellulosic biomass:
• It should be cost effective (low capital and operational cost).• It should be effective on a broad range of lignocellulosic biomass.• After the pretreatment various components should be in stable and fermentable
form with efficient recovery (separation should be easy).• It should be simple and without much prerequisite requirement prior to start (or
preconditioning steps).• Minimum inhibitors (sugar and lignin derivative inhibits the fermentation pro-
cess) should be generated.• It should have a low energy requirements and waste of the process could be used
for heating or value added product formation in order to minimize the impactcost of the downstream processing and trade off [9, 10].
Evaluation and comparison of different pretreatment technologies would not befully justified unless other aspects involved in the process, such as cost of upstreamand downstream processing, investment capita, recycling and waste treatmentsystems etc. are also considered [11].
In this chapter various treatment methods, such as acid pretreatment, alkalipretreatment, sequential acid and alkali pretreatment, surfactant assisted acid pre-treatment and surfactant assisted alkali pretreatment taking pine needles as feed-stock for case study have been described with respect to the efficiency of themethod for their potential to breakdown the lignocellulosic network, porosity,crystallinity of the cellulose, generation of various fermentation inhibitors etc.
2.2 Weak Acid Pretreatment of the Biomass
Weak acid pretreatment is one of the most common methods for the lignocellulosedeconstruction. The major target of this method is hemicelluloses removal andminor target is lignin alteration along with the prime aim of surface area incrementfor sugar exposures for hydrolysis [12]. Generally, inorganic acids such as H2SO4,HCl and HNO3 are preferred acids for acidic pretreatment but sometimes organicacids such as fumaric acid and maleic acid can also be used [13]. Based on thestructural complexity and composition, the efficiency of the particular acid varies.
90 S. Negi

In pretreatment study on pine needles (PN) various acids, such as H2SO4, HCland HNO3, have been checked for their pretreatment efficiency and among thesesulphuric acid (H2SO4) has been found to be the most effective [3]. The pineneedles as lignocellulosic biomass were soaked with dilute acids and exposed tosteam explosion. Various pretreatment parameters, such as acid concentration(0-5-5% v/v), Biomass loading (5–25% w/v) and autoclaving time (15–60 min),were studied and optimized for the effective release of the sugar during the pre-treatment process. Under optimum conditions of 1% (v/v) H2SO4, 10% (w/v) and45 min autoclaving time, a maximum of 0.221 g/g of reducing sugar was obtainedfrom PN and after enzymatic saccharification of the pretreated PN the total reducingsugar yield was found to be enhanced up to 0.511 g/g. These, results indicated thatduring pretreatment the lignocellulosic network was deconstructed and hemicellu-loses were hydrolyzed to generate monomeric reducing sugars [3].
In acidic conditions the most prominent ether bond of the lignin gets convertedinto hydroxyl group first, followed by conversion into carbonyl/carboxyl group andfinally it fragments into C3/C2 molecules [14].
2.2.1 Mechanism of Action of Acid on Sugar Polymer Chain
The acid molecule act as the source of proton for the protonation and charging ofthe chain through alkyl group (-R). This charged group leaves the polymer chainand gets replaced with the hydroxyl group of the water to form monomers [14].
The sugar polymer chain gets converted into simpler forms by followingmechanism (Fig. 2):
2.2.2 Effects of Pretreatment on Biomass Composition
The compositional analysis of the native and dilute acid pretreated PN can becarried out by National Renewable Energy Laboratory (NREL) method [3]. Thedata obtained had indicated that the acid pretreatment has enhanced the cellulosecontent about 40.1%, whereas hemicelluloses and lignin content were found to bereduced by 41.16 and 9.56%, respectively.
Fig. 2 Mechanism of the action of acid on sugar polymer chain
Pretreatment Strategies of Lignocellulosic Biomass … 91

2.2.3 Drawbacks of Acid Pretreatment
Although, dilute acid pretreatment is the most widely used pretreatment globallydue to ease in its mode of action, but this process suffers with the problem ofgeneration of some miscellaneous sugar and lignin derivatives, such as furans(furfural and hydroxyl methyl furfural), weak acids and phenolics. Furan interveneswith the respiration and growth of the yeast, whereas phenolics causes cell mem-brane’s integrity loss which reduces growth and sugar assimilation capability oforganisms. Hemicellulose’s acetyl group generates acetic acid, which causes cel-lular pH lowering and slow activity. These inhibitors reduce the ethanol produc-tivity and yield [15, 16].
Therefore, the fermenting yeast should be either adapted to the inhibitorsgradually or some efficient detoxification strategy should be employed for effectiveremoval of inhibitors with the least effect on the sugar concentration.
2.3 Alkaline Pretreatment of the Biomass
Removal of lignin, which increases the reactivity of the celluloses and hemicellu-loses, from the biomass is the major bottleneck in alkali pretreatment. In thisprocess, saponification of intermolecular ester bonds occur which breaks down thecross linking of lignin with hemicelluloses. Removal of acetyl group along with thesubstitution of uronic acid on hemicelluloses reduces the surface of cellulose andhemicellulose for enzymes action [17].
Effectiveness of various alkali, such as Ca(OH)2, NaOH and KOH, varies withstructural complexity and integrity. Pandey and Negi [3] investigated these alkalisfor the pretreatment of the PN and found NaOH as most effective for itspretreatment.
In a case of pretreatment process used for the PN, biomass was soaked withdilute NaOH and exposed to steam explosion. Various pretreatment processes, suchas alkali concentration (0-5-5% w/v), Biomass loading (5–25% w/v) and auto-claving time (15–60 min), were studied and optimized for the effective release ofthe sugar during the pretreatment process. Under optimum conditions, i.e., 1.5%(w/v) NaOH, 15% (w/v) biomass loading and 45 min autoclaving time, a maximumof 0.191 g/g of reducing sugar was obtained from PN and after enzymatic sac-charification of the pretreated PN the total reducing sugar yield was found to beenhanced up to 0.454 g/g. These results implied that during pretreatment saponi-fication of the biomass occurred and ester bond cross linking of lignin with sugarswas broken down [18].
92 S. Negi

2.3.1 Mechanism of Action of Alkali Pretreatment of Biomass
During alkaline pretreatment the intra-molecular ether bonds of the lignin moleculebreakdown in following manner and the aromatic rings get separated from eachother (Fig. 3):
In alkali pretreatment, the breakdown of sugar polymer chain occurs via theformation of an epoxide intermediate of 1,2-anhydro configuration. Since, the ringis formed between one oxygen and two carbon atoms the substitution of hydrogenoccurs via nucleophilic substitution mechanism (SN2) [14] (Fig. 4).
2.3.2 Effects of Pretreatment on Biomass Composition
The compositional analysis of the native and dilute alkali pretreated PN werecarried out by using National Renewable Energy Laboratory (NREL) protocol byPandey and Negi [3]. The data obtained indicated that the alkali pretreatment hadenhanced the cellulose content about 48.22%, whereas hemicelluloses and lignincontent were found to be reduced by 51.25 and 6.56%, respectively.
Fig. 3 Mechanism of lignin breakdown during alkali pretreatment
Fig. 4 Mechanism of Sugar polymer chain breakdown during alkali pretreatment
Pretreatment Strategies of Lignocellulosic Biomass … 93

2.3.3 Significance and Drawbacks of Alkaline Pretreatment
In dilute alkali pretreatment significant delignification occurs and overall processinput is lesser because it requires low pressure and temperature input in comparisonto other pretreatment methods. Since, this process occurs at low temperature theformation of yeast growth inhibiting sugar and lignin derivatives is lesser. Thisproduces less corrosion effect in comparison to acid pretreatment.
The major consequence of alkali pretreatment is formation of irrecoverable saltsand production of combined C6 and C5 sugar stream, whereas the dilute acidpretreatment generates C5 rich pretreated liquor and C6 rich solid pretreated residue[8, 9].
2.4 Sequential Dilute Alkali and Dilute Acid Pretreatment(SDAAP)
Primary pretreatment of PN was carried out by using 1% NaOH at 121 °C and15 lb pressure for 45 min [3]. After pretreatment, the solid residual PN was neu-tralized by using 1 N HCl, followed by washing under tap water to eliminate saltcontamination. The neutralized sample was dried at dried at 45 ± 2 °C to removemoisture. The dilute alkali pretreated biomass was pretreated by using dilute acidfor a second time. Under optimum conditions of 1.5% (v/v) H2SO4 concentration,10% (w/v) biomass loading and 45 min incubation time a maximum of 0.296 g/greducing sugar was released. The possible reason for this could be the affinity ofacid towards the solubilization of hemicelluloses fraction of biomass which hasmade the cellulosic fraction accessible towards the enzyme action. Similar kind offindings was also reported by [16] for the pretreatment of rape seed straw.
In case of SDAAP, the pretreated biomass contained the cellulase, hemicelluloseand total lignin content of 42.10 ± 0.21%, 9.87 ± 0.16% and 12.54 ± 0.09%,respectively. The total biomass was found to be degraded by 20% [3].
After hydrolysis of SDAAP-PL carried out for 48 h with 50 FPU/g enzymeloading and 0.15% w/v Tween-80 loading with biomass loading (12.5% w/v),maximum yield of reducing sugar was of 0.582 g/g, whereas reducing sugar releasewithout pretreatment of the PN biomass was only 0.144 g/g, which shows thatSDAAP had enhanced the saccharification more than 4 fold [3].
2.5 Surfactant Assisted Acid or Alkali Pretreatment
Cellulases contain hydrophobic residues on its surface, which interact with ligninby hydrophobic interactions and lead to unproductive adsorption on lignin surfaces.This is one of the major drawbacks of pretreatment processes. Surfactants can play
94 S. Negi

important role in reducing these unproductive enzyme lignin interaction and,thereby, increasing the hydrolytic productivity.
A process involving use of mild acid or alkali along with surfactant can be usedto remove lignin and improve the sugar yield from pine needles more effectively.Surfactants interact with hydrolytic enzymes, biomass and enzyme-substratecomplex during pretreatment and play following roles:
(a) Thermal deactivation of enzymes during hydrolysis can be reduced;(b) During saccharification enzymes tend to bind with lignin. Amphiphillic nature
of surfactant prevents this unproductive binding and improves enzyme–sub-strate interactions. Surfactant binds to lignin by hydrophobic interactions andprevents unproductive binding of cellulases to lignin through its hydrophilichead group; thereby, helping in more cellulase being used for hydrolysis ofcellulose.
(c) Surface activity of the non-ionic surfactant reduces contact of enzyme with theair–liquid interface.
(d) Surfactant occupies hydrophobic sites on the lignin surface and causes dis-placement of adsorbed enzyme and reduces further enzyme adsorption. Thehydrophilic Ethylene oxide (EO) chains of the adsorbed surfactants at the ligninsurface protrude into the water solution and causes repulsion of protein from thelignin surface.
2.5.1 Surfactant Assisted Acid Pretreatment (SAAP) and SurfactantAssisted Base Pretreatment (SABP)
Dilute acid treatment dissolves hemicellulose layer but have very little impact onlignin layer. Dilute acid blending with surfactants can enhance effectiveness ofpretreatment. Pandey and Negi [3] investigated effectiveness of the surfactantassisted acid pretreatment (SAAP) for pine needle biomass. In the process 5 g ofPN was soaked in 50 ml of 1% H2SO4 supplemented with 1% C-TAB (w/w ofbiomass) for 60 min. The solid liquid separation of the pretreated content wascarried out by filtration through double layered muslin cloths. The liquid fractionwas neutralized by using 1 M H2SO4 and 1 M NaOH. The liquid fraction wasanalyzed for reducing sugar and the sugar obtained was considered as the sugar lossduring the pretreatment (Fig. 5).
For surfactant assisted base pretreatment (SABP) the same set of experiment wascarried out using 1% NaOH supplemented with 1% (w/w) PEG-6000. In bothSAAP and SABP experiments a flask without any surfactant was used as control[3]. The solid fraction was neutralized by washing with deionized water and con-sidered as pretreated biomass such as SAAP-PN and SABP-PN throughout thestudy.
The various processes parameters, such as acid/base concentration (0.5–2.5%w/v), biomass loading (5–25% w/v), surfactant concentration (0.5–2.5% w/w) and
Pretreatment Strategies of Lignocellulosic Biomass … 95
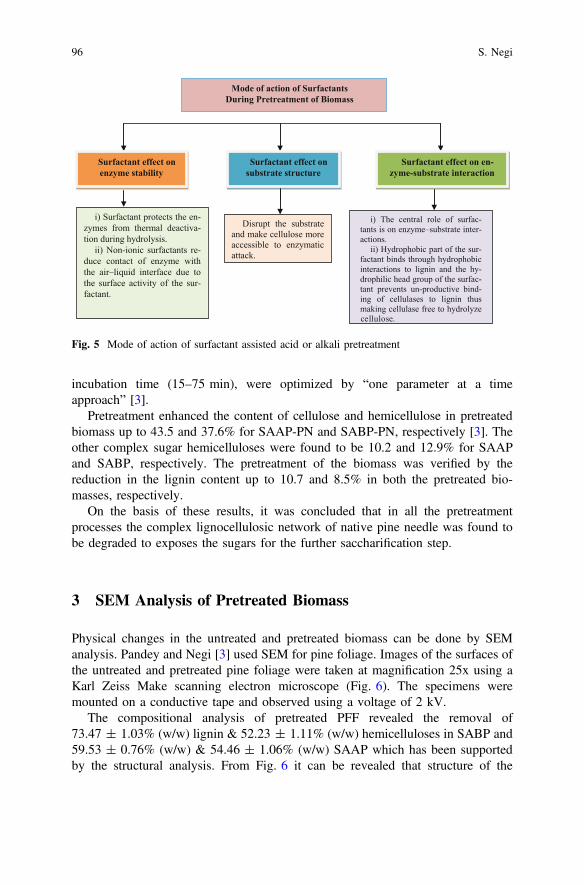
incubation time (15–75 min), were optimized by “one parameter at a timeapproach” [3].
Pretreatment enhanced the content of cellulose and hemicellulose in pretreatedbiomass up to 43.5 and 37.6% for SAAP-PN and SABP-PN, respectively [3]. Theother complex sugar hemicelluloses were found to be 10.2 and 12.9% for SAAPand SABP, respectively. The pretreatment of the biomass was verified by thereduction in the lignin content up to 10.7 and 8.5% in both the pretreated bio-masses, respectively.
On the basis of these results, it was concluded that in all the pretreatmentprocesses the complex lignocellulosic network of native pine needle was found tobe degraded to exposes the sugars for the further saccharification step.
3 SEM Analysis of Pretreated Biomass
Physical changes in the untreated and pretreated biomass can be done by SEManalysis. Pandey and Negi [3] used SEM for pine foliage. Images of the surfaces ofthe untreated and pretreated pine foliage were taken at magnification 25x using aKarl Zeiss Make scanning electron microscope (Fig. 6). The specimens weremounted on a conductive tape and observed using a voltage of 2 kV.
The compositional analysis of pretreated PFF revealed the removal of73.47 ± 1.03% (w/w) lignin & 52.23 ± 1.11% (w/w) hemicelluloses in SABP and59.53 ± 0.76% (w/w) & 54.46 ± 1.06% (w/w) SAAP which has been supportedby the structural analysis. From Fig. 6 it can be revealed that structure of the
Surfactant effect on substrate structure
Surfactant effect on en-zyme-substrate interaction
Surfactant effect on enzyme stability
i) Surfactant protects the en-zymes from thermal deactiva-tion during hydrolysis.
ii) Non-ionic surfactants re-duce contact of enzyme withthe air–liquid interface due tothe surface activity of the sur-factant.
i) The central role of surfac-tants is on enzyme–substrate inter-actions.
ii) Hydrophobic part of the sur-factant binds through hydrophobic interactions to lignin and the hy-drophilic head group of the surfac-tant prevents un-productive bind-ing of cellulases to lignin thusmaking cellulase free to hydrolyze
Disrupt the substrate and make cellulose more accessible to enzymaticattack.
Mode of action of SurfactantsDuring Pretreatment of Biomass
cellulose.
Fig. 5 Mode of action of surfactant assisted acid or alkali pretreatment
96 S. Negi

cellulose (crystallinity) has been reduced in both the pretreatment methods. Theseresults suggested that during SABP, the saponification of intermolecular estercross-linkage of lignin and hemicelluloses occurred, which lead to significantincrease in biomass porosity, cellulose bulging and overall accessible surface areabiomass.
4 Detoxification of Pretreated Liquor
Inhibitors, such as furfural, HMF, phenolic compounds, weak acids etc., are pro-duced during pretreatment processes, such as deliming, adsorption, resins, solventextraction, biphasic methods etc. These inhibitors can be effectively removed usingvarious detoxification methods. Pandey and Negi [3] used a hydrophobic resinAmberlite XAD-4 for the detoxification of the pretreated liquor. They found thefurfural and phenolics concentrations as 0.71 and 1.06 g/l in the dilute acid pre-treatment of pine needles with 1% H2SO4. After detoxification with the
Fig. 6 a Pine needle native sample. b Pine foliage acid pretreated sample; c Pine foliage alkalipretreated sample
Pretreatment Strategies of Lignocellulosic Biomass … 97

hydrophobic resin Amberlite XAD-4 furfural and phenolics were found to beremoved by 86 and 61%, respectively. Further, the ethanol yield of the hydrolyzatewas found to be enhanced by 17.3% using the yeast Saccharomyces cerevisiaeNCIM 3288. Similar results were also reported for the removal of the furfural ofabout 90% from the corn fiber biomass hydrolyzate using XAD-4 [19, 20].During SABP only phenolic derivatives were formed and no other inhibitor for-mation was found. In acid mediated pretreatments furans and phenolics wereformed. XAD-4 had removed 73.92% furfural and 55.1% phenolics throughadsorption of them with sugar loss of 7.8% in SAAP-PFN hydrolyzate, while38.2% phenolics removal was found in SABP-PFF hydrolyzate. These results werefound in line with the already reported data for inhibitor removal from acid pre-treated lignocellulosic hydrolyzate. These results revealed that the XAD-4 is anefficient detoxification agent which adsorbs inhibitors by hydrophobic interactionwith lesser effect on sugar content. Summary of detoxication efficiency is given inthe Table 1.
5 Enzymatic Saccharification of Pretreated Biomass
The enzymatic saccharification of SAAP-PN and SABP-PN was carried out usingcrude enzyme (enzyme activity; 7.15 FPU/ml) [3], the pretreated PN samples weremixed with sodium citrate buffer (50 mM, pH 4.8) with biomass loading of 10%w/v and this mixture was inoculated with crude cellulase loading (100 FPU/g). Thereaction mixture was supplemented with 0.1% w/w Tween-80 and 0.3% w/vsodium azide (to prevent microbial growth). The reaction mixtures were incubatedat 50 °C in an orbital incubator shaker for 48 h at 150 rpm. After incubation, theunhydrolyzed residues were separated by centrifugation at 10,000 rpm for 10 min[2, 21]. The hydrolyzates were analyzed for reducing sugar yield by 2,5-dinitrosalicylic acid method [22].
Table 1 Removal of inhibitors generated during pretreatment through XAD-4
S.No.
Parameters SAAP-PFN SABP-PFN SDAAP-PFN
Untreated Treated %loss
Untreated Treated %loss
Untreated Treated %loss
1 Reducingsugar (g/l)
58.8 54.12 7.8 47.7 44.51 6.6 58 54 6.9
2 Furfural(g/l)
0.51 0.133 73.92 – – – 0.62 0.133 78.55
3 Phenolics(g/l)
0.98 0.44 55.1 0.718 0.444 38.2 1.02 0.64 37.25
98 S. Negi

6 Fermentation of Biomass Hydrolyzate for EthanolProduction
Saccharomyces cerevisiae NCIM 3288 was used by Pandey and Negi [3] forpreparation of seed inoculums by growing it in Yeast extract peptone dextrose(YEPD) broth (composition in g/L; yeast extract, 10.0; peptone, 20.0; dextrose20.0; pH 4.5–5.0) for 18 h [3]. The fermentation of the biomass hydrolyzate wascarried out using 3% yeast inoculums for ethanol production under anaerobiccondition. The ethanol yield was found to be enhanced by 16.1 and 6.01% inXAD-4 detoxified SAAP-PFN and SABP-PFN hydrolyzate, respectively, in com-parison to non-detoxified ones after 72 h (Table 2). On the basis of these resultsPandey and Negi [3] concluded that XAD-4 is promising inhibitor removal agentand it also enhances the fermentation efficiency of ethanologenic yeast. They car-ried out ethanol fermentation of SDAAP-PFN hydrolyzate (with sugar concentra-tion 58 g/l) using S. cerevisiae (NCIM 3288). After 72 h of incubation, ethanolyield and ethanol efficiency were found to be 0.442 g/g and 86.49%, respectivelywith 55.17% sugar consumption. Similar kind of the results are also reported forethanol production from switch grass [23].
7 Summary
See Table 3.
Table 2 Fermentation profile of XAD-4 treated and untreated hydrolyzate
S.No.
Samples Sugar(t = 0 h)(g/l)
Sugar(t = 72 h)(g/l)
Sugarconsumed(%)
Ethanolconcentration(g/l)
Ethanolyield(g/g)
Ethanolefficiency(%)
1 SAAP 58.8 24.53 58.282 13.98 0.407 79.83
2 SAAP(Treated)
54.12 19.88 63.266 16.31 0.476 93.217
3 SABP 47.7 20.31 57.421 10.95 0.399 78.235
4 SABP(Treated)
44.51 17.71 60.211 11.33 0.422 82.732
5 SDAAP 58 26 55.17 14.14 0.442 86.49
6 SDAAP(Treated)
54 18 66.67 18.2 0.505 98.83
Pretreatment Strategies of Lignocellulosic Biomass … 99

Tab
le3
Summaryof
allpretreatmentmetho
dsem
ploy
edforethano
lyield
Feedstock
used
Pretreatment
metho
dHyd
rolysisagentused
Hyd
rolysis
optim
ization
metho
d
Sugar
yield
(g/g)
Ethanol
yield(g/g)
References
Pine
needles
Steam
explosion
Enzym
econsortia
(Cellulase:4.56
3IU
/ml,laccase:
0.05
IU/m
l,Xylanase:
38.32IU
/ml)
RSM
(CCD)
0.33
4–
[24]
Pine
needles
Microwaveassisted
alkali
(Cellulase:4.56
3IU
/ml,Laccase:0.05
IU/m
l,Xylanase:
38.32IU
/ml)
Artificial
Neural
Network(A
NN)
0.66
9–
[24]
Pine
needles
Surfactant
assisted
acid
Crude
cellu
lase(7.12FP
U/m
l)RSM
(BBD)
0.58
80.47
6[3]
Pine
needles
Surfactant
assisted
alkali
Crude
cellu
lase
(7.12FP
U/m
l)RSM
(BBD)
0.47
70.42
3[3]
Pine
needles
Surfactant
assisted
alkali
H2SO4(2%)
One
atatim
e0.36
6–
–
Pine
needles
Acid(H
2SO41%
v/v)
Crude
cellu
lase
(7.12FP
U/m
l)–
0.51
1–
–
Pine
needles
Alkali(1%)
(Cellulase:0.67
3IU
/ml,Laccase:0.21
4IU
/ml,
Xylanase:
0.03
2IU
/ml)
–0.45
4–
[24]
Pine
needles
Sequ
entialdilute
alkaliandacid
Com
mercial
cellu
lase
(52.86
FPU/m
l)RSM
(BBD)
0.58
20.49
6[3]
Kitchen
waste
Dilu
teacid
Crude
cellu
lase
(7.12FP
U/m
l)One
atatim
e0.28
0.45
5
Sugarcane
tops
Microwaveassisted
dilute
acid
Crude
cellu
lase
(20FP
U/m
l)RSM
(BBD)
0.59
50.43
[25]
Sugarcane
tops
Microwaveassiste
dilute
alkali
Crude
cellu
lase
(20FP
U/m
l)RSM
(BBD)
0.47
20.42
7[25]
Sorghu
mstov
erAcid(H
2SO41%
v/v)
Crude
cellu
lase
andxy
lanase
One
factor
atatim
e0.45
90.41
1g/g
[2]
Sorghu
mstov
erAlkali(N
aOH
1%w/v)
Crude
cellu
lase
andxy
lanase
–0.36
6–
–
100 S. Negi

8 Conclusions
Out of the various pretreatment strategies discussed in this chapter, SAAP andSDAAP delivered better results with high yield of ethanol after detoxification withhydrophobic resin XAD-4. These strategies significantly improve (about three-fourfold) the enzymatic saccharification efficiency. The cellulase from the locally iso-lated strain Rhizopus oryzae SN-5 has potential of a very good hydrolysis agent forthe extraction of significant amount of fermentable sugar from lignocellulosicbiomass, as it gave very promising results with pine needles biomass. These pre-treatment processes along with the XAD-4 detoxification could become a potentialtool for the biorefineries for the economical industrial scale production of bioe-thanol from lignocellulosic biomass.
Acknowledgements The authors are thankful to Department of Science and Technology(DST) and Ministry of New and Renewable Energy (MNRE) Government of India New Delhi, forfacilitating current work with financial support and Motilal Nehru National Institute of Technology(MNNIT), Allahabad for providing the space and basic facilities to carry out the research work.
References
1. Kumar P, Barrett DM, Delwiche MJ, Stroeve P (2009) Methods for pre-treatment oflignocellulosic biomass for efficient saccharification and biofuel production. Ind Eng ChemRes 48(8):3713–3729
2. Pandey AK, Negi S (2016) Optimization of concomitant production of cellulase and xylanasefrom Rhizopus oryzae SN5 through EVOP-factorial design technique and application insorghum stover based bioethanol production. Renew Energy 98:51–56
3. Pandey AK, Negi S (2015) Impact of surfactant assisted acid and alkali pretreatment onlignocellulosic structure of pine foliage and optimization of its saccharification parametersusing response surface methodology. Bioresour Technol 192:115–125
4. Sarkar N, Ghosh SK, Bannerjee S, Aikat K (2012) Bioethanol production from agriculturalwastes: An overview. Renew Energy 37:19–27
5. Sindhu R, Kuttiraja M, Binod P, Sukumaran RK, Pandey A (2014) Physicochemicalcharacterization of alkali pretreated sugarcane tops and optimization of enzymatic saccha-rification using response surface methodology. Renew Energy 62:362–368
6. Pandey A, Negi S, Binod P, Larroche C (2015) Pretreatment of biomass processes andtechnologies. ISBN: 978-0-12-800080-9. Chapter 8—Ionic Liquid Pretreatment, pp 137–155,Sangeeta Negi, Ajay Kumar Pandey. Copyright © 2015 Elsevier B.V. All rights reserved
7. Hawkins GM, Doran-Peterson J (2011) A strain of Saccharomyces cerevisiae evolved forfermentation of lignocellulosic biomass displays improved growth and fermentative ability inhigh solids concentrations and in the presence of inhibitory compounds. Biotechnol Biofuels4:49
8. Mosier N, Hendrickson R, Brewer M, Ho N, Sedlak M, Dreshel R et al (2005) Industrialscale-up of pH-controlled liquid hot water pretreatment of corn fiber for fuel ethanolproduction. Appl Biochem Biotechnol 125:77–97
9. Mosier N, Wyman CE, Dale BE, Elander R, Lee YY, Holtzapple MT et al (2005) Features ofpromising technologies for pretreatment of lignocellulosic biomass. Bioresour Technol96:673–686
Pretreatment Strategies of Lignocellulosic Biomass … 101

10. Chandra RP, Bura R, Mabee WE, Berlin A, Pan X, Saddler JN (2007) Substrate pretreatment:the key to effective enzymatic hydrolysis of lignocellulosics? Adv Biochem Eng Biotechnol108:67–93
11. Jeoh T, Ishizawa CI, Davis MF, Himmel ME, Adney WS, Johnson DK (2007) Cellulasedigestibility of pretreated biomass is limited by cellulose accessibility. Biotechnol Bioeng98:112–122
12. Chen H, Qiu W (2010) Key technologies for bioethanol production from lignocellulose.Biotechnol Adv 28:556–562
13. Kootstra AMJ, Beeftink HH, Scott EL, Sanders JPM (2009) Optimization of the dilute maleicacid pretreatment of wheat straw. Biotechnol Biofuels 2(31)
14. Krassig H, Schurz J (2002) Ullmann’s encyclopedia of industrial chemistry, 6th edn.Germany, Wiley-VCH, Weinheim
15. McKillip WJ, Collin G (2002) Ullmann’s encyclopedia of industrial chemistry, 6th edn.Germany, Wiley-VCH, Weinheim
16. Jeong T, Um B, Kim J, Oh K (2010) Optimizing dilute acid pretreatment of rape seed strawfor extraction of hemicelluloses. Appl Biochem Biotechnol 161:22–33
17. Chang VS, Holtzapple MT (2000) Fundamental factors affecting biomass enzymaticreactivity. Appl Biochem Biotechnol Part A Enzym Eng Biotechnol 84–86:5–37
18. Sun Y, Cheng J (2002) Hydrolysis of lignocellulosic materials for ethanol production: Areview. Bioresour Technol 83(1):1–11
19. Sandhya SV, Kiran K, Kuttiraja M, Preeti VE, Sindhu R, Vani S, Kumar SR, Pandey A,Bionod P (2013) Evaluation of polymeric adsorbent resins for efficient detoxification of liquorgenerated during acid pretreatment of lignocellulosic biomass. Indian J Exp Biol 51:1012–1017
20. Weil Joseph R, Dien Bruce, Bothast Rodney, Hendrickson Richard, Mosier Nathan S,Ladisch Michael R (2002) Removal of Fermentation Inhibitors Formed during Pretreatmentof Biomass by Polymeric Adsorbents. Ind Eng Chem Res 41(24):6132–6138
21. Harshvardhan K, Mishra A, Jha B (2013) Purification and characterization of cellulase from amarine Bacillus sp. H1666: a potential agent for single step saccharification of seaweedbiomass. J Mol Catal B Enzy 93:51–56
22. Miller GM (1959) Use of dinitrosalicylic acid reagent for determination of reducing sugar.Anal Chem 31:426–428
23. Dien BS, O’Bryan PJ, Hector RE, Iten LB, Mitchell RB, Qureshi N, Sarath G, Vogel KP,Cotta MA (2013) Conversion of switchgrass to ethanol using dilute ammonium hydroxidepretreatment: influence of ecotype and harvest maturity. Environ Technol 34:1837–1848
24. Vats S, Negi S (2013) Use of artificial neural network (ANN) for the development ofbioprocess using Pinus roxburghii fallen foliages for the release of polyphenols and reducingsugars. Bioresour Technol 140:392–398
25. Maurya DP, Vats S, Rai S, Negi S (2013) Optimization of enzymatic saccharification ofmicrowave pretreated sugarcane tops through response surface methodology for biofuel.Indian J Exp Biol 51:992–996
102 S. Negi

Ultrasound-Assisted Biodiesel Synthesis:A Mechanistic Insight
Ritesh S. Malani, Arun Goyal and Vijayanand S. Moholkar
Abstract Use of ultrasound in intensification of biodiesel synthesis process iswell-known. However, most of the published literature in this area has focused onresults than rationale—in that the exact physical mechanism of theultrasound-induced enhancement of the biodiesel synthesis has remained unex-plored. The research in our group has tried to fulfil this crucial knowledge gap. Inthis chapter, we have provided an overview and analysis of our studies in estab-lishment of the physical mechanism of ultrasound-assisted biodiesel synthesis. Thisessentially means identification of the links between physical and chemical effects ofultrasound and cavitation, and the basic chemistry of biodiesel synthesis. Thephysical effect of cavitation and ultrasound is generation of intense microturbulencein the medium, while the chemical effect is generation of highly reactive radicalsthrough thermal dissociation of the gas and vapor molecules entrapped in the bubble.The basic approach in our research has been concurrent analysis of the experimentalresults and simulations of cavitation bubble dynamics. We have treated diversebiodiesel synthesis processes that employ edible, non-edible and mixed non-ediblefeedstocks of oil, both base and acid catalysts in homogeneous form and hetero-geneous base catalysts. Our analysis has essentially established that physical effectsof ultrasound and cavitation have greater contribution to enhancement and intensi-fication of the transesterification process for biodiesel synthesis. This is essentiallymanifested through generation of strong emulsion and elimination of mass transfer
R.S. Malani � V.S. MoholkarCentre for Energy, Indian Institute of Technology, Guwahati,Guwahati, Assam, India
A. GoyalDepartment of Biosciences and Bioengineering,Indian Institute of Technology, Guwahati, Guwahati, Assam, India
V.S. Moholkar (&)Department of Chemical Engineering,Indian Institute of Technology, Guwahati, Guwahati, Assam, Indiae-mail: [email protected]
© Springer Nature Singapore Pte Ltd. 2017A.K. Agarwal et al. (eds.), Biofuels, Green Energy and Technology,DOI 10.1007/978-981-10-3791-7_7
103

barriers in the process. However, for heterogeneous catalyzed systems, the masstransfer still remains the rate controlling step, despite intense microconvectiongenerated by sonication.
Keywords Ultrasound � Non-edible oil � Esterification � Transesterification �Catalyst � Modelling
1 Introduction
Principal energy needs of developing economy are in terms of electricity and liquidtransportation fuel. Moreover, fast depletion of fossil fuel reserves and growingconcerns of global warming and climate change risk has made search for alternateand renewable sources of energy an urgent need of the hour. Among various sourcesof renewable liquid transportation fuels, bioalcohols (like ethanol and butanol) andbiodiesel have shown good promise for blending with conventional gasoline anddiesel, respectively [1]. Bioalcohols are manufactured through the fermentationroute. Conventionally, fermentation of molasses from sugar industry has been agood source of ethanol. However, due to growing cost of molasses (as a consequenceof other potential outlets) and also higher price offered by beverage industry formolasses-based ethanol, the amount of ethanol that ends up in refineries for blendingwith gasoline is quite low. As far as biobutanol is concerned, the fermentationprocess has high operating cost due to requirement of strict anaerobic conditions forthe microbial culture of Clostridium acetobutylicum that carries out the fermentation.The other source of bioalcohol is fermentation of lignocellulosic biomass. However,this route too has low economy due to high cost of pretreatment of biomass (acidpretreatment, delignification and enzymatic hydrolysis). Secondly, cost of concen-tration of rather dilute solutions of bioalcohols resulting from fermentation throughdistillation route is also cost intensive. Due to these reasons, commercial imple-mentation of gasoline/bioalcohol blends has been hampered [1–3].
The other popular alternate liquid biofuel is Biodiesel. This essentially is alkylester of fatty acids [4]. Biodiesel can be produced through esterification/transesterification of free fatty acid/triglyceride with short chain alcohols likemethanol and ethanol. Biodiesel is usually blended with petro-diesel for use inconventional IC engines. Up to 20 wt% biodiesel blends with petro-diesel can beused in existing diesel engines without requiring any modifications, and with nosignificant deviations in engine performance [5]. Depending on the feedstock usedin biodiesel production, biodiesel had been classified as 1st, 2nd and 3rd generationbiodiesel [6]. 1st generation biodiesel (manufactured mainly in Latin Americancountries) utilized relatively low-cost edible oils like palm and soybean as feed-stock. However, given tremendous shortage and high cost of edible oils in devel-oping economies like India, this route of biodiesel synthesis is absolutely infeasible.2nd generation processes for biodiesel production essentially utilized non-edibleoils like Jatropha curcus (Jatropha), Pongamia pinnata (Karanja), Madhuca indica
104 R.S. Malani et al.

(Mahua), Ricinus communis (Castor) or waste cooking oil as feedstock.Nonetheless, this route also lacked attractive economy due to various reasons likelow production of oil seeds, low oil content of seeds and high free fatty acid contentof feedstock. More recently, microalgal lipids have been investigated as alternatefeedstock for biodiesel. Conventionally, microalgae have been cultivated for naturalfood ingredients like omega-3 fatty acids or natural food colorants and dyes,pharmaceuticals (antioxidants) and nutraceuticals. The algal biomass left afterextraction of these ingredients is good fish food. More recently, the microalgal oilor lipid has been considered as low-cost feedstock for biodiesel production. Themicroalgal lipids, however, contain significant quantities of poly-unsaturated freefatty acids, which are unstable and susceptible to oxidation prior to esterification.Therefore, partial hydrogenation of this feedstock is essential to increase the sta-bility. This route is essentially known as 3rd generation biodiesel. This route alsohas limitations such as contaminations in the raceway ponds that cultivate the algalspecies, low lipid content of natural strains, higher susceptibility of geneticallymodified strains in large-scale open systems and cost of pre-processing of lipids, asnoted earlier.
Although the economy of large-scale production of biodiesel is not attractive dueto various limitations stated above, there are many feasible solutions. One solutionto boosting the economy of commercial biodiesel production is the revenue earnedby the side product of transesterification process, viz. glycerol. Glycerol is a ver-satile chemical and has many potential applications in food, pharmaceutical andcosmetics industry. However, the glycerol from biodiesel industry is contaminatedwith alkali catalyst and excess alcohol used in the transesterification process, and isthus, not useful for conventional applications [1, 5]. Use of heterogeneous catalystsduring transesterification reaction is a possible solution to avoid contamination ofthe glycerol, which increases its quality and sale value. The literature on biodieselsynthesis is rife with studies reporting use of numerous catalysts for biodieselsynthesis. However, the other side of the coin is slow kinetics of biodiesel synthesiswith heterogeneous catalyst (as compared to the homogeneous catalyst) due totriphasic nature of the reaction system. The mass transfer limitations in such systemare very marked, which results in slowing down of the kinetics. Mass transferbarrier in heterogeneous reaction systems can be overcome by generation of strongconvection in the system. This essentially depends on method of introduction ofenergy into the system. Conventionally, mechanical agitators have been used formixing of the reaction mixtures. However, this mixing is essentially macro-scalemixing and does not generate very fine emulsions of organic (oil) and aqueous(alcohol) phases.
A relatively new method of introduction of energy into reaction systems issonication or ultrasound irradiation of the reaction mixture. Research in past fewdecades has clearly demonstrated efficacy of sonication in introducing energy in thereaction system on extremely small temporal and spatial scales, which gives higheryield as well as kinetics of desired physical, chemical or biological transformation.Ultrasound is essentially a longitudinal acoustic wave with frequency � 20 kHz.Passage of ultrasound wave through the medium in the form of alternate
Ultrasound-Assisted Biodiesel Synthesis … 105

compression and rarefaction cycles results in sinusoidal static pressure variation inthe liquid medium. A secondary effect of this is occurrence of cavitation phe-nomenon in the medium. In present context, the word “Cavitation” refers tonucleation, volumetric oscillations and implosive collapse of tiny gas or vaporbubbles driven by sinusoidal variation in bulk pressure induced by propagation ofultrasound wave. At sufficiently high amplitude of ultrasound pressure wave,cavitation bubble undergoes transient implosive collapse. This phenomenon causesextreme energy concentration in the medium at an incredibly small temporal(*50 ns) and spatial scale (*100 nm) [7]. The temperature and pressure inside thebubble reach extreme (*5000 K and *50 MPa) during the transient collapse [8,9]. Energy concentration generated by transient cavitation has remarkable physicaland chemical effects on the reaction system. The physical effect is generation ofintense microturbulence (or micro-convection) in the medium. Thismicro-convection has several fold higher effect in creating interphase mixtures oremulsification as compared to macro-scale mixing generated by mechanical agi-tation. The micro-convection can enormously boost mass transfer in the system.The chemical effect of transient cavitation includes generation of highly reactiveradicals during collapse. These radicals are generated by thermal dissociation of gasand vapor molecules present in the bubble at the moment of transient collapse,when temperature and pressure inside the bubble reach extreme. The bubble mayundergo fragmentation during transient collapse, with release of the radicals into themedium. These radicals can then induce/accelerate chemical reactions. This is thewell-known sonochemical effect.
Ultrasonic enhancement of various biofuel processes has been an active area ofresearch for past few years. Main applications of ultrasound in biofuel processesinclude: pretreatment of biomass (delignification/acid hydrolysis), enzymatichydrolysis of pretreated biomass (or saccharification), fermentation of thehydrolyzates from acid/enzymatic hydrolysis, extraction of lipids from microalgalbiomass, biodiesel synthesis with homogeneous/heterogeneous catalysts, and biogasdigestion [1]. All previous authors have reported beneficial effects of sonication onthe transesterification process for production of biodiesel using both homogeneousand heterogeneous catalysts. These effects mainly include higher yield and fasterkinetics. However, the exact physical mechanism underlying ultrasound-inducedenhancement of transesterification has not been explored. This essentially meansdiscernment of the links between physical and chemical effects of ultrasound andcavitation (noted above) and the basic physics/chemistry of transesterification.Establishment of the physical mechanism of the ultrasound-assisted transesterifi-cation process is not only crucial to understanding fundamental intricacies, but it canalso give useful guidelines for optimization and scale-up of the process. In thischapter, an overview of our research in discernment of physical mechanism ofultrasound-assisted biodiesel synthesis is given. Several transesterification systemsusing homogeneous base or acid catalyst and heterogeneous base catalyst has beentreated employing both edible and non-edible feedstocks and also mixed oil feed-stock. For feedstocks with relatively high free fatty acid content, two-stage(esterification/transesterification) and single-stage process with in situ water
106 R.S. Malani et al.

removal has been discussed. Concurrent analysis of experimental and simulationsresults reveals interesting mechanistic facets of transesterification process with dif-ferent combinations of feedstock and catalysts, as outlined in subsequently in thischapter. Brief introduction to basic concepts and principles of ultrasound and cav-itation bubble dynamics is given in the next section.
2 Ultrasound and Cavitation Bubble Dynamics:A Brief Overview
2.1 Ultrasound Wave Phenomenon
Sound wave passes through a compressible medium in the form of a longitudinalwave comprising of alternate compression and rarefaction phases. Propagation ofthe ultrasound wave causes sinusoidal variation in bulk pressure as well as densityof the medium. A simple mathematical expression that represents the variation inbulk pressure with passage of ultrasound is:
P tð Þ ¼ Po � PA sin xtð Þ ¼ Po � PA sin 2pftð Þ ð1Þ
where, Po is the hydrostatic pressure in the medium, PA is the pressure amplitude ofthe ultrasound wave, x is the angular frequency of the ultrasound wave, while f isthe absolute frequency and t is time in seconds. The pressure amplitude of theultrasound wave is governed by net power input to the ultrasonic device and thearea of the transducer through which ultrasound is generated. The pressureamplitude of the ultrasound wave also determines the oscillatory velocity of thefluid elements. Basic relations between these physical quantities are given in ourprevious publication [1]. Ultrasound wave undergoes attenuation (or reduction inpressure amplitude due to energy loss) during its passage through the medium. Thiseffect is attributed to three mechanisms, viz. frictional (or viscous) loss, thermal lossand acoustic damping due to bubbles [10, 11]. Viscous dissipation or attenuation isessentially due to absorption of the momentum of the ultrasound wave by themedium due to finite viscosity and this loss is manifested in terms of unidirectionalcirculatory currents set up in the medium (known as acoustic streaming). The gasbubbles present in the medium also scatter the ultrasound waves that cause severeattenuation. Presence of gas bubbles in the liquid also alters the compressibility ofthe medium, as a result of which the speed of sound in the medium reduces.
2.2 Cavitation Bubble Dynamics
Ultrasound manifests its physical and chemical effects through phenomenon ofcavitation [7, 12]. Cavitation essentially refers to nucleation, growth, oscillations
Ultrasound-Assisted Biodiesel Synthesis … 107

and implosive transient collapse which results due to the variation in bulk pressureinduced by propagation of ultrasound wave through the medium. In ultrasoniccavitation (also known as acoustic cavitation), the liquid medium is usually stagnantduring propagation of the ultrasound wave through it. However, in some processes(especially those operating on continuous basis), the liquid medium could beflowing. In this case, variation of bulk pressure can also be created by changing theflow geometry that induces variation in the velocity of the flow. This type ofcavitation is termed as hydrodynamic cavitation. Occurrence of acoustic orhydrodynamic cavitation requires presence of nuclei in the bulk liquid medium. Thecavitation nuclei could be tiny free-floating gas bubbles already present in the liquidor the gas pockets trapped in the crevices of the solid boundaries in the liquidmedium. These gas pockets can grow in response to reduction in ambient pressurewith passage of acoustic wave [13]. In case of hydrodynamic cavitation, the cav-itation nuclei are also contributed by the gas bubble generated due to release ofdissolved gas, as the bulk pressure in the flow falls with rise in velocity. Dependingon the level of energy dissipation in the medium, vaporous cavitation can also occurin the medium in case of both acoustic and hydrodynamic cavitation that results ingeneration of vapor bubbles.
2.3 Radial Motion of Cavitation Bubbles
As noted earlier, transient implosive collapse of the cavitation bubbles createsintense energy concentration on extremely small spatial and temporal scale. Thisphenomenon has been extensively studied with help of mathematical models for theradial motion (or volumetric oscillations) of the cavitation bubbles. Modeling ofcavitation bubble dynamics is a major area of research in physical acoustics withvoluminous literature published in past five decades. In this section we very brieflysummarize the major contributions in this area for the readers who are not wellconversant with this subject matter. The mathematical models for cavitation bubbledynamics described in this section have been developed for the acoustic or ultra-sonic cavitation, but these are equally applicable for the hydrodynamic cavitation.For more information on cavitation bubble dynamics, we would like to refer theinterested readers to comprehensive treatises by Young [14] or Leighton [10].
The nature of the radial motion (or volumetric oscillations) of the cavitationbubble depends on the pressure amplitude of the acoustic wave. Two forces, viz.inertial force and pressure force, govern the radial motion of the cavitation bubble.For relatively small acoustic pressure amplitudes—typically smaller than the staticpressure in the medium, the volume oscillations of the bubble are of smallamplitude—driven mainly by the pressure forces, and essentially in phase with theacoustic wave. Volumetric oscillations of the cavitation bubble become
108 R.S. Malani et al.

large-amplitude as well as non-linear for larger acoustic pressure amplitudes—typically greater than static pressure in the medium. In this case, the radial motionof the bubble comprises of an initial explosive growth, in which the bubble radiusgrows at least two times or higher of its initial value. The growth phase is followedby a transient collapse and few after–bounces. In this case, the radial motion of thebubble is dominated by the pressure forces [15].
Lord Rayleigh presented the first–ever mathematical analysis of an empty cavitycollapsing under constant static pressure [16]. Subsequent researchers improved theanalysis of Lord Rayleigh, which included accounting for the effects of surfacetension and viscosity of liquid, and presence of non-condensable gas and solventvapor inside the bubble. This analysis resulted in the popular Rayleigh–Plesset–Noltingk–Neppiras–Poritsky [17–19] equation for radial motion of bubble which isas follows:
Rd2Rdt2
þ 32
dRdt
� �2
¼ 1q
Po þ 2rRo
� Pv
� �Ro
R
� �3c
þPv � 2rR
� 4lRdRdt
� Po þP tð Þð Þ
ð2Þ
The above equation did not account for liquid compressibility, which becomes adominant factor as the bubble wall velocity becomes closer or even exceeds thesonic velocity in the medium during the final moment of transient bubble collapse.The first model for cavitation bubble dynamics accounting for liquid compress-ibility effect was proposed by Gilmore [20] on the basis of Kirkwood-Bethehypothesis [21]. Major subsequent contributions in this area are from Keller andKolodoner [22], Keller and Miksis [23], Prosperetti and Lezzi [24]. These analyseshave resulted in more rigorous forms of models for radial motion of cavitationbubbles. Two most popular equations for cavitation bubble dynamics among sci-entific community are:
(1) Keller and Miksis equation [22, 25]:
1�_Rc
� �R€Rþ 1� 3 _R
c
� �32_R2 ¼ 1
q1þ
_Rc
� �Pg � Po � P tð Þ� �þ _R
qcdPg
dt
� 4m_RR� 2rqR
ð3Þ
(2) Bubble dynamics equation proposed by Lofstedt et al. [26], Barber et al. [27]:
R€Rþ 32_R2 ¼ 1
qPg � Po � P tð Þ� �þ _R
qcdPg
dt� 4m
_RR� 2rqR
ð4Þ
Ultrasound-Assisted Biodiesel Synthesis … 109

2.4 Modeling of the Sonochemical and Sonophysical Effects
Ultrasound waves as well as radial motion of cavitation bubbles driven by thesewaves induce physical and chemical effects in the reaction system or in generalliquid medium. The physical effect associated with ultrasound and cavitation isessentially generation of intense micro-mixing in the system as a result of strongmicro-convection generated through various mechanisms.
2.4.1 Sonochemical Effect
The chemical effect associated with ultrasound and cavitation (popularly known assonochemical effect) is generation of highly reactive chemical species, some ofwhich are radical species, which can induce/accelerate numerous chemical reactionsin the medium, generated through thermal dissociation of gas and vapor moleculespresent in the bubble at the moment of transient collapse [12, 28, 29].
Several previous authors have dealt with the physical explanation to the sono-chemical effect induced by ultrasound and cavitation. Passage of ultrasound wavethrough the medium gives rise to sinusoidal variation in the bulk pressure in theliquid medium. In the rarefaction half cycle of ultrasound, when the pressure in themedium falls sufficiently below the ambient or static pressure, the cavitation bub-bles grow from the nuclei. These nuclei could be gas pockets trapped in the crevicesof solid boundaries in the reactor. If the pressure amplitude of the ultrasound waveis higher than the static pressure in the medium, the radial motion of the bubble isdominated by inertial forces and bubble undergoes an explosive growth to severaltimes its original size. During this expansion, liquid at the bubble interface evap-orates with diffusion of the vapor molecules towards the core of the bubble.However, as the bubble gets compressed in the compression half cycle of ultra-sound, not all of the vapor present in the bubble can condense and return to theliquid medium. A review of literature on vapor transport across bubble interface andthe entrapment of vapor in the bubble during transient collapse is given by Krishnanet al. [28].
Storey and Szeri [29] presented comprehensive analysis of vapor transport andentrapment in the cavitation bubble. This analysis relaxed all of the assumptionsand simplifications made in previous analyses. Storey and Szeri [29] showed that inthe compression phase of radial bubble motion, counter diffusion of the vapormolecules occurs with condensation at the bubble wall. The principal result of thestudy of Storey and Szeri [30] was that water vapor transport in the bubble is atwo-step process, i.e. diffusion to the bubble wall and condensation at the wall.Thus, it is influenced by two time scales, viz. time scale of diffusion (tdif) and timescale of condensation (tcond) [31], and their magnitudes relative to the time scale ofbubble dynamics, tosc.
During the transient motion of cavitation bubble, the velocity of the bubble wall(or the bubble-liquid interface) reaches or even exceeds the sonic velocity in the
110 R.S. Malani et al.

medium. At this stage, tosc << tdiff condition is reached, and the vapor moleculeshave insufficient time to diffuse to the bubble wall for undergoing phase change orcondensation. The bubble composition gets essentially “freezed” with fixed anduneven distribution of vapor molecules in the bubble. In other words, the vaporpresent inside the bubble is essentially “trapped” in the bubble. In addition todiffusion limitation, another mechanism which also contributes to trapping of vapormolecules inside the bubble, is the non-equilibrium phase change at the bubble wall.In the final moments of bubble collapse, the time scale of bubble oscillationsbecomes lesser than the time scale of phase change or vapor condensation. As aconsequence, all of the vapor molecules approaching the bubble wall cannot “stick”to the bubble wall for undergoing a phase change [31]. Storey and Szeri [29] haveshown in their analysis that the vapor entrapment in the cavitation bubble occurspredominantly due to diffusion limitation than condensation limitation. As thetemperature and pressure inside the bubble reach extreme at transient collapse, thevapor molecules trapped inside the bubble undergo thermal dissociation along withthe gas molecules resulting in generation of spectrum of chemical species (withrelatively smaller molecular weight) including some radical species. In view of theresults of Storey and Szeri [29, 30], Toegel et al. [32] developed a simple diffusionlimited model, which has become immensely popular among the sonochemicalcommunity. This model, based on ordinary differential equations, has distinct meritsof being simple yet physically realistic. Ordinary differential equations and ther-modynamic data of the diffusion-limited model of cavitation bubble dynamics arelisted in Tables 1 and 2 [33]. The main components of diffusion-limited model are:(1) Keller–Miksis equation for radical motion of cavitation bubbles, (2) Equation forthe diffusion of solvent vapor across bubble wall, (3) Equation for heat conductionacross bubble wall, and (4) Overall energy balance of cavitation bubble. In overallenergy balance, the cavitation bubble is treated as open system. Diffusion coefficientand thermal conductivity of the bubble contents have been determined usingChapmen–Enskog theory with Lennard–Jones 12–6 potential at the bulk tempera-ture of the liquid [34–36]. With assumption of fast condensation of vapor moleculesat bubble interface and prevalence of equilibrium, the thermal and diffusive pene-tration depths are estimated using dimensional analysis as follows [37]:
ldiff ¼ min R=p;ffiffiffiffiffiffiffiffiffiffiffiffiffiffiffiffiffiffiffiffiffiffiffiffiffiffiRDij
�dR=dtj j
q� �ð5Þ
lth ¼ min R=p;ffiffiffiffiffiffiffiffiffiffiffiffiffiffiffiffiffiffiffiffiffiffiffiRj= dR=dtj j
p� ð6Þ
An important assumption made for estimation of the sonochemical effect is theprevalence of chemical equilibrium in the bubble all through radial motion. Thisassumption is based on the relative time scales of reactions kinetics inside thebubble and the timescale of bubble dynamics. The temperature and the pressure inthe bubble reaches extreme (*5000 K and *50 MPa) at the point of maximumcompression triggering chemical reactions with large kinetic constants. Moreover,
Ultrasound-Assisted Biodiesel Synthesis … 111

Tab
le1
Essentialequatio
ns(O
DE’s)of
thediffusion-lim
itedODEmod
el[1,33
]
Mod
elcompo
nent
Equ
ation
Initial
value
1.Radialmotionof
thecavitatio
nbu
bble
1�dR
=dt
c
�� R
d2R
dt2þ
3 21�dR
=dt
3c
��
dR dt�� 2
¼1 q L
1þ
dR=dt
c
�� P
i�Pt
ðÞ
þR qLcdP
i
dt�4m
dR=dt
R�
2r qLR
Internal
pressure
inthebu
bble:Pi¼
NtotðtÞkT
4pR3ðtÞ
�h3
ðÞ=3
½�
Pressure
inbu
lkliq
uidmedium:Pt¼
P0�PAsin2p
ftð
Þ
Att=0,
R=Ro,
dR/dt=0
2.Diffusiveflu
xof
solvent(m
ethano
l)molecules
dNS
dt¼
4pR2D
S@CS
@r
r¼R�
4pR2D
SCS;R�C
S
l diff
�
Instantaneou
sdiffusivepenetrationdepth:
l diff
¼min
ffiffiffiffiffiffiffiffiffiffi
RD
SdR
=dt
jj
q;R p
�
Att=0,
NS=0
3.Heatcond
uctio
nacross
bubb
lewall
dQ dt¼
4pR2k@
T @r r¼
R�
4pR2k
T 0�T l th�
Therm
aldiffusionleng
th:l th
¼min
ffiffiffiffiffiffiffiffiffiffi
Rj
dR=dt
jj
q;R p
�
Att=0,
Q=0
4.Overallenergy
balance
CV;m
ixdT
=dt
¼dQ
=dt
�PidV=dtþ
h S�U
Sð
ÞdNS=dt
Mixture
heat
capacity:CV;m
ix¼
PCV;iNi
(i=N2/O2/So
lvent)
Molecular
prop
ertiesof
solvent:
Enthalpy:
h¼
1þ
f i 2
�� kT
o
Internal
energy
:U
S¼
NSkT
3þ
P3 i¼1
h i=T
exph i=T
ðÞ�
1
��
Heatcapacity
ofvariou
sspecies(i=N2/O2/So
lvent):
CV;i¼
Nik
f i=2þ
Ph i=T
ðÞ2 e
xph i=T
ðÞ. ex
ph i=T
ðÞ�
1ð
Þ2�
�
Att=0,
T=T0
Reprodu
cedwith
perm
ission
from
[1]Cop
yright
©20
15,Sp
ring
erScience+BusinessMedia
Dordrecht
112 R.S. Malani et al.

the concentrations of different chemical species in the bubble are very high due toextremely small volume. As a result, the rates of various reactions occurringbetween chemical species present in the bubble are extremely fast, due to whichchemical equilibrium prevails in bubbles all along during the radial motion [28, 38].
2.4.2 Physical Effects of Cavitation Bubble
The principal physical effect of ultrasound and cavitation on a reaction system isgeneration of intense micro-convection and micro-mixing. This micro-convectionessentially helps in elimination of mass transfer barriers in the system. A briefdescription of different mechanisms of generation of micro-convection is givenbelow [10, 12, 14].
Table 2 Thermodynamic data for the diffusion limited model
Species Degrees of freedom(translational + rotational)(fi)
Lennard–Jonesforce constants
Characteristic vibrationaltemperatures h (K)
r(10−10
m)
e/k(K)
N2 5 3.68 92 3350
O2 5 3.43 113 2273
CH3OH 6 3.626 481.8 500.59, 1674.41, 1708.94,1854.22, 2169.26, 2356.26,2376.4, 2392.22, 4581.62,4649.23, 4752.8, 5923.74
Ar 3 3.42 124 –
H2O 6 2.65 380 2295, 5255, 5400
Reproduced with permission from [1] Copyright © 2015, Springer Science + Business MediaDordrecht*Data taken from Toegel [33], Hirschfelder et al. [34], Reid et al. [35], Condon and Odishaw [36],Davis [41]Notations R radius of the bubble; dR/dt bubble wall velocity; c velocity of sound in bulk liquidmedium; qL density of the liquid; m kinematic viscosity of liquid; r surface tension of liquid; kthermal conductivity of bubble contents; j thermal diffusivity of bubble contents; h characteristicvibrational temperature(s) of the species; NS number of solvent molecules in the bubble; NN2
number of nitrogen molecules in the bubble; NO2 number of oxygen molecules in the bubble;t time, DS diffusion coefficient of solvent vapor; CS concentration of solvent molecules in thebubble; CS,R concentration of solvent molecules at the bubble wall or gas–liquid interface; Q heatconducted across bubble wall; T temperature of the bubble contents; To ambient (or bulk liquidmedium) temperature; k Bolzmann constant; hS molecular enthalpy of solvent; US internal energyof solvent molecules; fi translational and rotational degrees of freedom; CV,i heat capacity atconstant volume for species i; Ntot total number of molecules (gas + vapor) in the bubble; h vander Waal’s hard core radius; Po ambient (bulk) pressure in liquid; PA pressure amplitude ofultrasound wave; f frequency of ultrasound wave
Ultrasound-Assisted Biodiesel Synthesis … 113

Micro-streaming
This is essentially small amplitude oscillatory motion of fluid elements around amean position, which is induced by propagation of ultrasound wave. For a typicalultrasound wave with pressure amplitude of 120 kPa in water (q = 1000 kg/m3,C = 1500 m/s), the micro-streaming velocity = 0.08 m/s.
Acoustic Streaming
Due to finite viscosity of the medium through which ultrasound waves propagate,the momentum of the wave is absorbed by the medium. This is manifested in termsof low velocity unidirectional currents of the fluid known as acoustic streaming [39,40]. Acoustic streaming also generated due to obstruction of the oscillatory motionof the fluid elements in the vicinity of solid boundaries in the medium. This phe-nomenon results in setting up of unidirectional current parallel to the boundary.
Microturbulence
The oscillatory motion of fluid induced by volume oscillations of the bubble iscalled microturbulence. During expansion of the cavitation bubble, the liquid sur-rounding the bubble is displaced away from bubble interface. In the compressionphase, fast contraction of the bubble generates “void” around it, and the liquid ispulled towards the bubble as it fills this void. The velocity of microturbulence, isobviously a function of the amplitude of bubble oscillation. The phenomenon ofmicroturbulence is observed only in the close vicinity of the bubble, and diminishesvery rapidly away from it.
Acoustic (or Shock) Waves
As noted above, the liquid gushes or spherically converges towards the bubbleinterface during the contraction phase. The compression of the bubble is mostlyadiabatic and the pressure inside the bubble rises rapidly if the bubble containsnon-condensable gas such as air. At the point of minimum radius (or maximumcompression) during radial motion, the velocity of the bubble wall becomes zero.At this moment, the velocity of the fluid elements converging towards the bubbleinterface also reduces to zero—almost instantly—which creates rise in pressure(due to conservation of momentum). This generates a high pressure shock wave thatpropagates through the medium. The bubble may undergo renounces due to thepressure exerted by the non-condensable gas inside the bubble.
114 R.S. Malani et al.

Microjets
During radial motion driven by ultrasound wave, the initial spherical geometry ofthe bubble may be disturbed due to non-uniformity of pressure gradients sur-rounding it. These non-uniform gradients are induced by phase boundaries, eithersolid–liquid, gas–liquid or liquid–liquid, due to which the motion of liquid in thevicinity of the cavitation bubble is hindered. Under influence of non-uniformpressure gradient, the bubble undergoes asymmetric radial motion with the portionof bubble exposed to higher pressure collapsing at a faster rate than rest of thebubble. Such asymmetric motion results in formation of a high speed liquid jet. Thedirection of this jet depends on the type of phase boundary. For a “rigid” boundarysuch as metal surface, the microjet is directed towards the boundary. For a “free”boundary such as gas–liquid (typically air–water) interface, the microjet is directedaway from the boundary. The velocities of these microjets are in the range of 120–150 m/s.
3 Mechanistic Insight into Ultrasound-Assisted BiodieselSynthesis
The transesterification reaction is essentially a liquid-liquid heterogeneous reaction.With use of solid catalyst, it becomes a tri-phasic reaction, with strong mass transferlimitations. The basic chemical mechanisms of both alkali and acid catalyzedtransesterification reactions are well known. Due to heterogeneous nature of thereaction system, the kinetics and yield of transesterification is a major function ofthe interfacial area. As noted earlier, sonication can have multiple beneficial effectson such reaction system. Our research group has put in significant efforts indeducing the physical mechanism of ultrasound-assisted biodiesel synthesis withvariety of feedstocks and catalysts. In this section, we present an overview of thesestudies.
3.1 Transesterification of Refined Edible Oil
3.1.1: Kalva et al. [42] have deduced the physical mechanism of ultrasound–as-sisted enhancement of transesterification reaction by discriminating betweenphysical and chemical effects of ultrasound. Kalva et al. [42] investigated theprocess using refined soybean oil with methanol and sodium hydroxide as thehomogeneous alkali catalyst. Experiments were carried out in a beaker made ofborosilicate glass with dimensions: height = 95 mm, diameter = 68 mm, andthickness = 2.5 mm. Microprocessor based and programmable ultrasonic processor
Ultrasound-Assisted Biodiesel Synthesis … 115

was used (Sonics and Materials Inc., Model: VCX 500) with frequency of 20 kHzas a source of ultrasound.
Discrimination between relative contributions of physical and chemical effects ofultrasound and cavitation have been achieved with following experimental cate-gories: (1) no external addition of base catalyst during reaction; (2) sparging ofmethanol with argon prior to reaction (without addition of external catalyst);(3) addition of Fe2+ to methanol prior to reaction; (4) addition of base catalyst(NaOH) in methanol. First three experimental categories were aimed at in situproduction of •OH radicals and OH¯ ions, which would generate methoxide ions bytheir reaction with methanol. First category experiments aimed at in situ productionof •OH radicals through thermal dissociation of methanol vapor in the transientcavitation bubble. The second category experiments were aimed at seeding cavi-tation nuclei of monatomic gas (argon) in the reaction system so as to boost thecavitation intensity. Third experimental category aimed at generating OH¯ ionsfrom •OH radicals produced from transient cavitation bubbles through oxidation ofFe2+ to Fe3+ (Fenton reaction). OH¯ ions can generate methoxy ions (CH3O¯)required for transesterification by reacting with methanol. These experiments didnot yield any biodiesel, which clearly pointed at no role played by the chemicaleffects of transient cavitation in the transesterification process.
In the fourth category, base catalyst (NaOH) was added to methanol. Twoconcentrations of NaOH were used, viz., 0.5 and 1% (w/w) of oil. The experimentswere carried out using 4 methanol:oil molar ratios, viz. 6:1; 12:1; 16:1 and 24:1.Results of the experimental study were coupled to single bubble dynamics model toestablish the physical mechanism of sonication on transesterification reaction. Thisexperimental category produced good yields of biodiesel, and the trends in bio-diesel yield with varying alcohol/oil molar ratios was shown in Fig. 1. For both 0.5and 1% w/w NaOH, the highest yield was obtained for an alcohol to oil molar ratioof 12:1, while the lowest yield was obtained for an alcohol to oil molar ratio of24:1. Moreover, for any particular alcohol to oil molar ratio, the biodiesel yield for1% w/w NaOH is higher than 0.5% w/w NaOH.
Fig. 1 Biodiesel yield in thefourth category ofexperiments as a function ofalcohol to oil molar ratio(Reproduced with permissionfrom [42], Copyright © 2009,American Chemical Society)
116 R.S. Malani et al.

Kalva et al. [42] also performed simulations of radial motion of a single 10 lmargon cavitation bubble using diffusion-limited model in methanol and oil as liquidmedia. The results of these simulations, viz. radial motion of the cavitation bubble,number of vapor molecules in the bubble and temperature/pressure conditionsreached inside the bubble, have been shown in Figs. 2 and 3 for methanol and oil asliquid media, respectively. The results of simulations have been summarized inTable 3, which lists the temperature and pressure peaks reached in the bubble attransient collapse and the magnitude of the microturbulence and acoustic wavesgenerated by the bubble.
Results presented in Figs. 2 and 3 and Table 3 reveal following key facets ofradial motion of cavitation bubbles in oil and methanol as liquid media:
(1) Cavitation bubble in methanol undergoes large expansion (*5 � original size)due to low viscosity of methanol. This expansion is accompanied by significantvaporization of methanol into the bubble. At the final moments of transientcollapse, the velocity of the bubble wall becomes extremely fast and not all ofthe methanol vapor that has entered cavitation bubble during expansion canescape the bubble. Methanol molecules entrapped in the bubble at transientcollapse are subjected to extreme conditions of temperature and pressure (viz.,810 K and 1455 atm) generated in the bubble at transient collapse. At theseconditions, methanol vapor undergoes thermal dissociation to form smallerchemical species. The chemical composition of the cavitation bubble at tran-sient collapse can be determined by knowing the number of moles of O2, N2
and CH3OH in the bubble and temperature/pressure conditions reached in thebubble, and minimization of the Gibbs energy for this system. Table 3 alsogives the equilibrium composition of the bubble contents at conditions oftransient collapse. Results presented in Table 3 reveal that the dominant speciesresulting out of dissociation of O2, N2 and methanol molecules in cavitationbubble are CH4, H2O, H2, and CO2 along with traces of several other species.However, the gamut of these species does not include any radical species (suchas H�, OH�, and HO2
� ). This result is essentially a consequence of relatively lowpeak temperature reached inside the bubble during transient collapse, which inturn is a result of large entrapment of methanol vapor molecules in the bubbledue to which the net heat capacity of bubble content increases. The meanvelocity of microturbulence generated due to bubble motion is � 2 cm/s.
(2) The cavitation bubble in oil undergoes marginal initial expansion (just � 2times the initial size) with practically no solvent evaporation in the bubble as aresult of very low vapor pressure of oil. Therefore, sonochemical effect ofproduction of radicals in the bubble does not take place. Moreover, peaktemperature and pressure conditions reached in the bubble during collapse arealso smaller than methanol. Mean microturbulence velocity in oil is � 0.3 m/s,which was one order of magnitude smaller than that in methanol. In summary,the cavitation phenomenon in oil was less energetic than methanol, which was
Ultrasound-Assisted Biodiesel Synthesis … 117

attributed due to high viscosity of the oil. The viscosity of the liquid mediumessentially offers resistance to radial motion of the bubble, causing reduction inthe intensity of the resultant physical and chemical effects.
0 1 2 3 4 50
3
6
Time (t/Tau)
Rad
ius (
R/R
o)
(a)
0 1 2 3 4 5200
600
1000
Time (t/Tau)
Tem
pera
ture
(K)
(b)
0 1 2 3 4 50
1 .1012
2 .1012
Time (t/Tau)
No.
of M
eOH
Mol
ecul
es
(c)
0 1 2 3 4 50
1000
2000
Time (t/Tau)
Pres
sure
(bar
)
(d)
0 1 2 3 4 50.04
0.01
0.02
Time (t/Tau)
Osc
illat
ory
Vel
ocity
(m/s
) (e)
Fig. 2 Simulation results ofradial motion of a 10 lmcavitation bubble in methanolmedium (Reproduced withpermission from [42],Copyright © 2009, AmericanChemical Society)
118 R.S. Malani et al.

In the first, second, and third experimental categories, the transesterificationreaction was left out of in situ-produced methoxy ions (or methoxy radicals). Thesemethoxy ions were essentially generated from OH� radicals generated by cavitationbubbles. The results of simulations show that no generation of any radical species(H�, OH�, or HO2
� ) occurs during transient collapse of argon bubbles in methanol.This essentially rules out in situ generation of methoxide ions. This result points outthat the influence of ultrasound and cavitation on the transesterification reactionsystem has predominantly physical nature, i.e. generation of large interfacial areabetween oil and methanol due to intense micro-convection.
0 1 2 3 4 50
1.5
3
No. of acoustic cycles
Rad
ius (
R/R
o)
0 1 2 3 4 5200
600
1000
No. of acoustic cycles
Tem
pera
ture
(K)
0 1 2 3 4 50
7.5
15
No. of acoustic cycles
Pres
sure
(bar
)
0 1 2 3 4 50.004
0.001
No. of acoustic cycles
Osc
illat
ory
Vel
ocity
(m/s
)
(a)
(b)
(c)
(d)
Fig. 3 Simulation results ofradial motion of a 10 lmcavitation bubble in oilmedium (Reproduced withpermission from [42],Copyright © 2009, AmericanChemical Society)
Ultrasound-Assisted Biodiesel Synthesis … 119

An interesting trend was seen from the experimental results of the fourth cate-gory, the biodiesel yield passing through a maximum for an alcohol to oil molarratio of 12:1. Moreover, increase in catalyst concentration resulted in highertriglyceride conversion. To explain these trends, we need to analyze the variation inthe two principal factors influencing the yield of the reaction, viz., the concentrationof methoxide ions and the interfacial area with respect to the alcohol to oil molarratio and catalyst concentration used in the four sets of experiments in this category.(a) For alcohol/oil molar ratio 6:1, the methanol forms the dispersed phase (20 mL)of the reaction mixture compared to the continuous oil phase (80 mL). Thus, extendof dispersion of methanol in the oil phase decides the availability of interfacial areafor the reaction. Due to a high level of microturbulence generated by the cavitationbubbles in methanol in the vicinity of the interface, methanol disperses uniformly inthe oil phase. However, due to a small amount of methanol, the RO¯ radicals wereproduced limited. This puts a limit on biodiesel yield. (b) Increasing alcohol/oil
Table 3 Summary ofsimulation results
(A) Conditions at the first compression of thecavitation bubble
Parameter Liquid medium
Methanol Oil
Tmax (K) 810 727
Pmax (bar) 1455 7.37
NMeOH 3.88E+011 –
Vturb (m/s) 0.0205 0.00277
(B) Equilibrium composition of the cavitation bubblecontents in methanol at collapse conditions
Species Equilibrium composition (mole fraction)
CH4 7.3213E–01
H2O 2.2833E–01
H2 2.0609E–02
CO2 1.8203E–02
C2H6 3.1621E–04
CO 4.1087E–04
CH3OH 1.5522E–07
C2H4 1.2378E–07
CH3COOH 2.8683E–08
HCOOH 1.3946E–08
H2CO 2.4576E–08
Reproduced with permission from [42], Copyright © 2009,American Chemical SocietyNotations Tmax Temperature peak reached in the bubble at thetime of first collapse; Pmax pressure peak reached in the bubble atthe time of first collapse; NMeOH number of methanol moleculestrapped in the bubble at the instance of first collapse; Vturb bulkliquid velocity (or the microturbulence velocity) generated by thecavitation bubbles
120 R.S. Malani et al.
molar ratio to 12:1, the equilibrium of the reaction shifted to produce more RO¯radicals. Greater generation of the RO¯ radicals raises the rate of the transesteri-fication reaction. However, dispersion of methanol in oil determined the totalinterfacial area, as the volume of the methanol was still less (33 mL) compared tothe oil (67 mL). Because this dispersion was uniform, the interfacial area for thereaction was large. The highest yield of transesterification reaction was achieveddue to combination of favorable factors. (c) For a molar ratio of 16:1, the volume ofoil (60 mL) reduces with a corresponding rise in the methanol volume (40 mL).Since the volumes of methanol and oil are now comparable, the interfacial area forthe reaction was decided not only by the dispersion of methanol in oil but also thedispersion of oil in methanol. The dispersion of oil in methanol depends on theintensity of microturbulence generated by the cavitation bubbles in oil, located atthe interface between two media.
Simulations of the radial motion of the cavitation bubble in methanol and oilwere shown in Figs. 2 and 3 respectively. It can be seen that the magnitude of themicroturbulence generated by cavitation bubble in oil was very small with velocity� 0.3 cm/s, which was an order of magnitude smaller than the velocity inmethanol. This was attributed to a high viscosity of oil and low acoustic pressureamplitude sensed by the bubble as a result of high attenuation. Given the largedifference in the intensity of microturbulence in methanol and oil, it was obviousthat the dispersion of oil in methanol was not as uniform as that of methanol in oil,resulting in lesser interfacial area for the reaction and, hence, reduced yield ofbiodiesel. (d) For a molar ratio of 24:1, the volumes of oil and methanol becomeequal (50 mL). With this, the problem of low dispersion of oil becomes morepronounced. In addition, dispersion of methanol in oil may also not be completedue to a rather large volume of methanol. As a result, the interfacial area for thereaction further reduces and so does the overall yield of biodiesel. (e) For all alcoholto oil molar ratios, the yield of the reaction with 1% (w/w) catalyst concentrationwas higher than 0.5% (w/w) catalyst concentration. This was clearly attributed tothe higher production of the RO¯ species with a higher concentration of the cata-lyst. However, the rise in the yield was found to be marginal (� 10%) with dou-bling of the catalyst concentration. This result suggests that the dynamics of thereaction system at catalyst concentration of 1% (w/w) was kinetics (and not masstransfer) limited.
Cavitation phenomenon in oil and methanol phase has different characteristics.As a result of large vapor pressure of methanol, significant evaporation of methanolmolecules occurs inside the bubble. Accordingly, the peak temperature and pressureattained during at transient collapse was reduced. The summary of the simulationresults has been given in Table 3. Although thermal dissociation of methanolmolecules occurs during collapse, the species resulting from this are molecularspecies such as CH4, H2O, H2 and CO2. No formation of radical species was seen.This result basically confirmed that intensification of transesterification reaction byultrasound was due to emulsification effect, which generated enormous interfacialarea between oil and methanol phases.
Ultrasound-Assisted Biodiesel Synthesis … 121

Although cavitation and ultrasound wave phenomenon occurs in both oil andmethanol phase, the velocities of micro-streaming and microturbulence are farhigher in methanol due to its viscosity being lower than oil. For molar ratio of 6:1,the methanol phase forms the minor fraction of the reaction mixture, as comparedwith the oil phase. Thus, the dispersion of methanol in oil phase decides theinterfacial area for reaction. Due to high level of microturbulence generated bycavitation bubbles in methanol, the dispersion of methanol in oil phase is uniform.However, the production of methoxy (CH3O
–) ions is limited due to smaller volumeof methanol, which places a limit on biodiesel yield.
For alcohol/oil molar ratio of 12:1, formation of methoxide ions was favored dueto equilibrium shift towards right hand side. This lead to higher concentration ofCH3O
– resulting in faster kinetics. However, methanol volume was still lesser thanoil. This made methanol dispersed phase and oil continuous phase. Intensity ofmicroturbulence and micro-streaming was higher in methanol, which caused uni-form dispersion of methanol in oil. This resulted in high interfacial area. Netmanifestation of higher CH3O
– concentration and high interfacial area was largeryield of biodiesel. For alcohol/oil molar ratio of 16:1, oil and methanol volumes inreaction mixture become comparable. In this situation, interfacial area is determinednot only by dispersion of methanol in oil, but also vice versa, i.e. dispersion of oil inmethanol. However, due to feeble micro-streaming and microturbulence velocities,oil does not get dispersed properly in methanol, resulting in reduced interfacial area.For the highest alcohol/oil molar ratio of 24:1, the effect of weak dispersion of oilwas more pronounced resulting in probably the least interfacial area, and thus,slowest kinetics and least biodiesel yield. Thus, Kalva et al. [42] have clearlyestablished the roles of physical and chemical effects of ultrasound and cavitation inalkali-catalyzed transesterification process.
3.1.2: Parker et al. [43] investigated acid catalyzed ultrasonic transesterificationof edible grade soybean oil. The major findings of acid catalyzed transesterificationstudy was the reaction mechanism were quite atypical of base catalyzed reaction.Several anomalies were observed when ultrasonic transesterification with acidcatalyst was compared to mechanically agitated systems, the anomalies such as theoccurrence of reaction at a below atmospheric temperatures (i.e. 15 °C), highreaction rate constants for alcohol ratio of 6:1 despite the high activation energy,and a minimum in reaction rate constant at temperatures in the range of 15–65 °C.These results, when correlated with simulation of cavitation bubble dynamics,revealed interesting physical mechanistic facts of acid–catalyzed transesterification.
The basic chemical mechanisms of base and acid catalyzed transesterificationreactions were different [42, 43]. In case of base–catalyzed transesterification,generation of alkoxide anion initiates reaction between alcohol and alkali, whereasin acid-catalyzed transesterification, direct protonation of triglycerides by acidinitiates the reaction (Scheme 1). Protonation of triglycerides generates elec-trophillic center on the carbonyl carbon making it susceptible to nucleophilic attackof methanol. Rate controlling step in acid catalyzed transesterification was proba-bility of interaction between proton in methanol (or aqueous phase) and triglyceridein oil (or organic phase). Acid concentration reduces with increasing alcohol to oil
122 R.S. Malani et al.

molar ratio, and so does the probability of interaction between proton andtriglyceride. The macroscopic equilibrium constant also shifts towards product.Reduction in the concentration of protons with increasing alcohol ratio results inslowing down of reaction kinetics at any temperature. For the same reason, thehighest rate constant and yield was obtained for an alcohol ratio of 6:1, as against12:1 in case of base–catalyzed process [42]. These results have signified predom-inant role of intrinsic kinetics of acid catalyzed transesterification, despite elimi-nation of mass transfer barriers due to emulsification and enhancement of interfacialarea induced by sonication.
Simulations of cavitation bubble dynamics in methanol reveal that the intensityof the shock waves generated by cavitation bubble at 15 °C was much higher than25 °C [43]. This essentially means greater emulsification and interfacial area at 15 °C than 25 °C. The emulsification effect overwhelms intrinsic kinetics of transes-terification at lower temperature, resulting in higher rate constants at 15 °C than25 °C. However, at higher temperatures of 45–65 °C, the intrinsic kinetics domi-nates and higher rate constant than at 15 °C have been obtained. These results havehighlighted physical or mechanistic features of ultrasonic biodiesel synthesis.Parkar et al. [43] have also determined the activation energies of transesterificationas a function of alcohol to oil molar ratios. Least activation energy of 27.53 kJ/molwas obtained for molar ratio of 12:1. Despite the lowest activation energy (orhighest specific rate constant at any temperature), the overall yield and kineticconstant was low for alcohol/oil molar ratio of 12:1 at 15 °C.
1) Protonation of the
carbonyl group
2) Nucleophilic attack
of ROH on carbonyl
group of TG
3) Proton migration &
breakdown of
intermediate
Scheme 1 Chemical mechanism of acid catalyzed transesterification reaction (Reproduced withpermission from [1] Copyright © 2015, Springer Science + Business Media Dordrecht)
Ultrasound-Assisted Biodiesel Synthesis … 123

3.1.3: Choudhury et al. [44] investigated the mechanistic in ultrasonic biodieselsynthesis were based on statistical design of experiments (DOE) that were coupledwith simulation of cavitation bubble dynamics. Box–Behnken statistical design ofexperiments was employed to optimize the transesterification reaction parameters[44]. The optimization parameters were reaction temperature, alcohol to oil molarratio and catalyst loading. The transesterification yield was treated as the objectivefunction. Optimization of the process for the highest yield was done throughresponse surface methodology (RSM) using a quadratic model and analysis ofvariance (ANOVA). The response surface plots resulting from this analysis havebeen depicted in Fig. 4. Optimum parameters were: Temperature = 62 °C, molarratio = 10:1 and catalyst loading of 6 wt%. The activation energy at optimumconditions was determined as 82.3 kJ/mol. This was significantly higher thanactivation energy for homogenous catalyst, which is typically in the range of 20–30 kJ/mol. Transesterification system in the present case was 3-phase heteroge-neous (liquid–liquid–solid), with more pronounced mass transfer restrictions than2-phase (liquid–liquid) system for homogeneous catalyst. The optimum tempera-ture resulted from the RSM analysis was close to boiling point of methanol. Atthese conditions, very large evaporation of methanol occurred into the bubble,which drastically reduced the intensity of transient collapse of cavitation bubble.The peak temperature reached in the bubble was *700 K, which is not sufficientlyhigh to generate radical species through thermal dissociation of methanol mole-cules. The microturbulence generated by cavitation bubble was also less intense. Insuch situation, the main contribution to the convection in the medium was bymicro-streaming process, which is oscillatory motion of fluid elements induced byultrasound wave propagation. Base catalyst CaO, with hydrophilic surface,preferably stays in the aqueous (or methanol) phase. Generation of methoxy ions inthis case is through adsorption of methanol molecules on the catalyst surface, whichare transferred to organic phase from interface between phases. Micro-streaming byultrasound can enhance the rate of adsorption and enhance CH3O
– production.Unlike the homogenous base catalyzed process (where high yield of biodiesel
have been obtained at ambient temperature); the optimum temperature in the case ofheterogeneous base catalyst was 62 °C. This result has essentially indicated thatenhancement of mass transfer due to micro-convection generated by ultrasounddoes not overcome the intrinsic kinetic limitations of the process. This is attributedto high activation energy of the system. However, the optimum alcohol ratio of 10:1is almost similar to that for the homogenous system (12:1). The explanation for thiscan be given along similar lines as that for homogenous system. The ANOVAresults have indicated strong interactions between effects of all optimizationparameters on biodiesel yield. The parameters of catalyst loading and molar ratioand temperature and molar ratio are related through the variation in convection levelin the medium, which in turn related to cavitation bubble dynamics and ultrasoundwave phenomena. The parameters of catalyst loading and temperature are relatedthrough intrinsic kinetics of the process. Impurities in catalyst (such as CaCO3
phase) could have also contributed to a reduction in the yield.
124 R.S. Malani et al.

0
20
40
60
80
100
6
8
10
1214
1618
4045
5055
60
% F
AME
Molar r
atio
Temperature
-40
-20
0
20
40
60
80
100
40
45
50
55
6065
12
34
56
% F
AME
Tempe
ratur
e
Catalyst
0
20
40
60
80
100
6
8
10
1214
1618
12
34
56
7%
FAM
E
Mola
r rat
io
Catalyst
(a)
(b)
(c)
Fig. 4 Response surfaceplots for percentage of fattyacid methyl ester (FAME)yield as a function of reactiontemperature, catalyst loadingand methanol-to-oil molarratio (Reproduced withpermission from [44],Copyright © 2014, Elsevier)
Ultrasound-Assisted Biodiesel Synthesis … 125

3.2 Transesterification of Non-edible Oil
3.2.1: Choudhury et al. [45] have also done mechanistic investigations on acidcatalyzed biodiesel synthesis from Jatropha curcus oil. The non-edible oil havemuch higher contents of free fatty acids than conventional refined oils. Therefore,the process was carried out in two stages, viz. esterification of free fatty acidsfollowed by transesterification of triglycerides. The esterification experiments weredesigned on the results of Deng et al. [46]. The experiments were conducted usingmechanical shaking and ultrasound. However, it was found that the time for almostcomplete esterification (>90%, as indicated by reduction in acid value of oil) wassame for both mechanical stirring and sonication. Almost complete reduction ofacid value was obtained within 1 h with FAME yield in the range of 17–20%. Theimportant parameters for esterification reaction were alcohol to oil molar ratio andcatalyst concentration at a fixed temperature of 65 ± 2 °C with a reaction time of1 h. Experiments were performed in nine sets, with duplicate runs in each set inorder to assess the reproducibility of the results. The acid catalyzed esterificationwas found to be insensitive to ultrasound irradiation.
Esterified low acid value feedstock was used for transesterification using soni-cation. Optimization of independent process parameter has been carried out usingBox-Behnken statistical design for 3 factors and 3 levels, comprises of 15 com-bination sets of experiments. The experimental results were complied with diffusionbased bubble dynamics model. RSM of the experimental results shows followingimportant results: (a) For experiment with the temperature 85 °C i.e. above opti-mum, catalyst concentration 6 wt% at optimum, however alcohol/oil molar ratio 4:1below optimum, and the yield drops to 18%. (b) For experiment with the tem-perature 70 °C near optimum, catalyst concentration 9 wt% above optimum, andalchol/oil molar ratio 4:1 below optimum, resulted in the yield of 28% only. (c) Forexperiment with the temperature 70 °C near optimum, catalyst concentration 9 wt%and molar ratio 10:1 above optimum, the yield was relatively higher, i.e., 52.77%.(d) For experiment with the temperature 70 °C near optimum; however, catalystconcentration 3 wt% and molar ratio 4:1 below optimum, again the yield drops to32%. (e) For experiment with the temperature 55 °C below optimum, catalystconcentration 6 wt% at optimum and molar ratio 10:1 above optimum, and the yielddrops to 30.7%. These results revealed that all the three process parameters havestrong influence on transesterification reaction.
The kinetic analysis of the transesterification was carried out at the optimumconditions obtained from statistical analysis (RSM). Pseudo 1st order kinetic modelwas fitted and the activation energy of the reaction system was determined usingArrhenius equation. Activation energy for transesterification reaction was deter-mined as 167.419 kJ/mol. Relatively higher activation energy for homogenous acidcatalyzed transesterification (as compared to homogenous base catalyst) results inslower reaction kinetics. Concurrent analysis of experimental and simulation resultshas revealed important facets of the physical mechanism of the acid catalyzedesterification/transesterification process. The kinetics of esterification reaction was
126 R.S. Malani et al.

practically insensitive to sonication. In case of transesterification, intrinsic kineticsplays a predominant role. Simulations of cavitation bubble dynamics have notreleaved any sonochemical effect, i.e. formation of any radical species from cavi-tation bubbles. This essentially means that beneficial effect of ultrasound on thereaction system was through strong micro-mixing and emulsification of oil andalcohol phases [38, 47]. Moreover, the intensity of microturbulence generated bycavitation bubbles was small, and thus, microstreaming by ultrasound mainlycontributes to emulsification of oil and alcohol. Due to high viscosity of oil, theintensity of bubble motion was too low to create sufficient convection. In addition,the micro-streaming velocity was also expected to be quite small. Thus, the majorcontribution to the overall convection in the system was through micro-streaming inmethanol.
Assessment of the experimental results corroborates above conjectures. Even forhigh reaction temperatures (70 or 85 °C), and high catalyst concentration (6 or 9%w/w oil), biodiesel yield was low for smaller molar ratios (4:1). This was attributedto low convection intensity in the medium with low alcohol content, which resultsin lesser emulsification and lower interfacial area. As a consequence, protonation ofcarbonyl oxygen of triglyceride was reduced. Quite interestingly, low FAME yieldwas obtained at 55 °C for alcohol/oil molar ratio of 10:1. This result could possiblybe ascribed to dilution of acid concentration in methanol at high molar ratio. Thus,despite higher convection in the reaction system due to larger alcohol content, thenet probability of interaction of proton in aqueous phase with carbonyl oxygencould be lower, leading to smaller yield. A rise of catalyst concentration to 9 wt%and temperature to 70 °C almost doubles this yield. These results clearly show therelative influence of mass transfer and intrinsic kinetics on the transesterificationreaction system. Mere enhancement of mass transfer with ultrasound was notsufficient to boost the overall kinetics of the process leading to high biodiesel yield.It also depends on factors such as catalyst concentration and temperature thatdetermine the intrinsic kinetics of the reaction. Therefore, for maximum yield of thetransesterification process, an overall optimization in terms of all parameters wasnecessary and mere elimination of mass transfer limitation with sonication will notsuffice.
The optimum set of process parameter obtained by the statistical design ofexperiments was as follows: alcohol/oil molar ratio = 7, catalyst loading = 6 wt%,and reaction temperature = 70 °C. The kinetics of the acid catalyzed transesterifi-cation was found to be much slower than base catalyzed process, which is attributedto basic difference in the chemical mechanism of acid and alkali catalyzed trans-esterification. The transesterification for acid catalyst is initiated by nucleophilicattack of methanol on the protonated carbonyl carbon of triglycerides. Sincemethanol is a poor nucleophile, its intrinsic reactivity was much less than themethoxide (CH3O
–) ion, which initiates the transesterification in base catalyzedprocess. This was essentially manifested in slower kinetics of the reactions. It hasbeen observed from the experimental trends, that enhanced mass transfer withultrasound was not sufficient to boost the overall kinetics of the process leading to
Ultrasound-Assisted Biodiesel Synthesis … 127

higher biodiesel yield. Hence, an overall optimization in terms of all parameters wasnecessary to get high yield of transesterification process.
3.2.2: Choudhury et al. [48] have extended the above theme of two-stage biodieselsynthesis from Jatropha curcus oil with acid catalyst in the transesterification stepreplaced by solid base catalyst. Scheme 2 depicts the chemical mechanism of CaOcatalyzed transesterification reaction. The statistical design of experiments resultedoptimum set of operating parameters as: alcohol/oil molar ratio = 11, catalyst load-ing = 5.5 wt% and reaction temperature = 64 °C. The variation on transesterificationyield by varying operating parameters were shown in Fig. 5. The X-Ray Diffractionanalysis of catalyst powder revealed formation of calcium methoxide Ca(OMe)2phase, which acts as active sites for transesterification reaction. Activation energy ofthe ultrasound-assisted transesterification process at optimized conditions found to be133.5 kJ/mol, and this was attributed to 3 phase heterogeneity of the system. Ascompared to the previous study of Choudhury et al. [44] using refined soybean oil as afeedstock, which showed an activation energy of 82.3 kJ/mol (the correspondingArrhenius plot is shown in Fig. 6), *50% higher activation energy for Jatrophacurcus oil could also be attributed to crudeness of oil. The impurities in the oil couldpoison the catalyst by adsorbing over it and reduces the availability of active sites forthe reaction. However, as compared to mechanically stirred system, the ultrasonicsystem showed*30% reduction in activation energy, which could be a consequenceof the mass transfer enhancement in the system. The optimum value of alcohol molarratio of 11 could be justified as follows: For very low catalyst concentration (3 wt%),the amount of methoxy ions generated was less, resulting in lower yields. Althoughstronger dispersion and emulsification between oil andmethanol phases was achieved
CaO +2CH3OH Ca(OCH3)2
CH3O Ca OCH3
2+C
O
R
OR1
CH3O Ca2+
C R
OR1
O
OH3C+
CH3O Ca2+
OR1 + C
O
R
OCH3
CH3O Ca2+
OR1 + CH3OH CH3O Ca OCH2+
+ R1OH
(1)
(2)
(3)
Scheme 2 Proposed chemical mechanism of calcium oxide catalyzed trans-esterification reaction(Reproduced with permission from [48], Copyright © 2014, Elsevier)
128 R.S. Malani et al.

at high alcohol molar ratio, the mass transfer resistance for CH3O– ions increases.
Higher mass transfer resistance can be explained as follows: CH3O– ions were gen-
erated at the surface of CaO catalyst. The CaO catalyst particles, being hydrophilic innature, preferentially stay in the methanol phase. As the volume fraction of methanolin the total reaction mixture increases with molar ratio, these ions have to diffusethrough larger volume so as to reach the interface and react with triglyceride. For lowalcohol molar ratios, the volume fraction of oil in reaction mixture was high and somecatalyst particles may also stay in oil phase. The oil can wet the catalyst surface, andhinder adsorption of methanol leading to formation of methoxy ions. Hence, toovercome the mass transfer limitations in 3-phase heterogeneity higher molar ratio ofalcohol was required.
Fig. 5 Contour plots showing variation of transesterification yield (or %FAME yield) as afunction of any two experimental parameters. a Temperature and molar ratio, b molar ratio andcatalyst concentration, c catalyst concentration and temperature (Reproduced with permission from[48], Copyright © 2014, Elsevier)
Ultrasound-Assisted Biodiesel Synthesis … 129

3.2.3: Choudhury et al. [49] have also reported a novel single step process forbiodiesel synthesis using chlorosulphonic acid as catalyst. The previous processwith H2SO4 catalyst reported in literature required a two stage approach withseparate esterification and transesterification [45]. With the application of chloro-sulfonic acid as the catalyst, two steps process was combined in a single stepprocess. The chemical mechanism of this synthesis was shown in Scheme 3. Theacid catalyzed esterification of the free fatty acids in Jatropha curcus oil releaseswater, which has serious inhibition effects due to solvation of the protons as well asCH3OH2
+ (methoxenium) ions. Solvation of the protons reduces their reactivity andaccessibility leading to lowering of kinetics. This inhibition was counteracted bychlorosulphonic acid by in-situ removal of water formed during esterification.Water produced in the esterification process reacts with chlorosulfonic acid toproduce H2SO4. Dissociation of this H2SO4 can generate additional protons thatcatalyze esterification/transesterification reaction. However, generation of H2SO4 isaccompanied by in-situ removal of water molecules that solvate the H3O
+ ion andreduce its activity. In this study as well, the statistical design of experiment wasused to determine the optimum condition for the highest biodiesel yield. Theoptimum conditions are: catalyst concentration = 8.358 wt%, alcohol molarratio = 18:1 and temperature = 60 °C.
The major findings from the optimizations were summarized as follows. Theoptimum temperature was close to boiling point of methanol, and also that theintensity of transient cavitation was minimal at this temperature, once againdemonstrates that the beneficial effect of ultrasound and cavitation on reactionsystem was merely physical, i.e. emulsification of the phases. The activation energyfor the single-step process was determined as 57.3 kJ/mol, which was more thanthree-fold lower than for H2SO4 catalyzed process (i.e. 169 kJ/mol). Choudhuryet al. [49] also carried out chlorosulfonic acid catalyzed transesterification in con-ventional two-step process comprising of esterification and tranesterification. Quiteinterestingly, the two-step process had 40% less activation energy of 31 kJ/mol.This reduction has been attributed to complete removal of water from reactionsystem in the two-step process—as compared to single step process, in which some
Fig. 6 Arrhenius plot of ln(k) versus 1/T fortransesterification reactionconsidering 3rd order reactionkinetics (with respect totriglyceride) for optimumconditions of methanol to oilmolar ratio (11:1) and catalystconcentration (5.5 wt%) asdetermined by statisticalanalysis (Reproduced withpermission from [48],Copyright © 2014, Elsevier)
130 R.S. Malani et al.

trace of water might be left in the system despite the in-situ removal of chloro-sulfonic acid, which reduces inhibition effect on the process.
3.3 Transesterification with Mixed Non-edible OilFeedstock
Malani et al. [50] have extended the work to biodiesel production from mixednon-edible oil feedstock in continuous packed bed mode. The approach adoptedwas two-fold, viz. (1) statistical optimization of the transesterification process in acontinuous packed bed reactor with Cu2O catalyst, coupled with sonication (or
R C
O
OH + R C
O
H2OMeOHClSO3H
OMe +
Cl S
O
O
OH H2O+ HO S
O
O
OH + HCl
H2C
HC
H2C
O
O
O
CR
COR
CR
O
O
Cl S
O
O
OH+-Cl
H2C
HC
H2C
O
O
O
CR
COR
CR
O
O
S
O
O
OH
MeO
H H2C
CHO2CR
H2C
O
O
CR
CR
O
O
S
O
O
OH
H2C
CHO2CR
H2C
OH
O CR
O
Cl S
O
O
OH + 3+
H2C
HC
H2C
OH
OH
OH
TG
DGFAME
ACID
ACIDGLYCEROL
MG
MeO H
+
MeO R
O
CR
O S
O
O
OH
OMe
Cl
-H+/+H+
(a)
(c)
(b)
Scheme 3 a Reaction of chlorosulfonic acid induced esterification process, b removal of waterformed during esterification by chlorosulfonic acid, and c mechanism of chlorosulfonic acidinduced trans-esterification process (Reproduced with permission from [49], Copyright © 2014,Wiley)
Ultrasound-Assisted Biodiesel Synthesis … 131

ultrasound irradiation), and (2) kinetic and mechanistic analysis of transesterifica-tion process using mathematical model based on Eley–Rideal mechanism.Experiments were conducted in packed bed as well was batch mode using slurryreactor coupled with sonication to get the time dependent profiles of reactants. Theexperimental data has been fitted to kinetic model to obtain the values of kineticparameters. Experiments in batch mode with mechanical agitation done to comparethe kinetic parameters for sonication and mechanical agitation.
Malani et al. [50] has investigated the mechanistic issues of ultrasound–assistedtransesterification process using solid Cu2O catalyst and mixed feedstock ofnon-edible oils, which consists of Jatropha oil (15% v/v), castor oil (25% v/v),rubber seed oil (20% v/v), cotton seed oil (25% v/v), waste cooking oil (15% v/v).The optimum conditions for transesterification have been determined using statis-tical experimental design in packed bed catalytic reactor. The kinetic constants ofdifferent steps of transesterification process was determined using kinetic modelbased on Eley–Rideal mechanism (as depicted in Tables 4 and 5) coupled to timeprofiles of reactants and products of transesterification in batch slurry reactors.
Table 4 The steps and corresponding kinetic expressions in Eley–Rideal (ER) mechanism oftransesterification using a solid heterogeneous catalyst
Step in the mechanism Chemical equation Rate expression
1. Methanol adsorption þCH3OH�CH3OH r1 ¼ �k1 ½ �f CH3OH½ �2. Transesterification reactions CH3OH þ T�D þF r2 ¼ �k2 T½ � CH3OH½ �
CH3OH þD�M þF r3 ¼ �k3 D½ � CH3OH½ �CH3OH þM�G þF r4 ¼ �k4 M½ � CH3OH½ �
3. Desorption of adsorbed species D�Dþ r5 ¼ �k5 D½ �M�Mþ r6 ¼ �k6 M½ �G�Gþ r7 ¼ �k7 G½ �
Symbols * Free catalyst active site, T triglyceride, D diglyceride, M monoglyceride, G glycerol,F fatty acid methyl ester (biodiesel)
Table 5 The final kinetic rate expressions in Eley–Rideal (ER) mechanism of transesterificationusing a solid heterogeneous catalyst
Rate of triglyceride consumption rT ¼ d T½ �dt ¼ � k2 T½ �
1þ k2 T½ �k5
þ k3 D½ �k6
þ k4 M½ �k7
þ k2 T½ � þ k3 D½ � þ k4 M½ �k1 CH3OH½ �
Rate of diglyceride consumption rD ¼ d D½ �dt ¼ � k3 D½ � � k2 T½ �
1þ k2 T½ �k5
þ k3 D½ �k6
þ k4 M½ �k7
þ k2 T½ � þ k3 D½ � þ k4 M½ �k1 CH3OH½ �
Rate of mono-glyceride consumption rM ¼ d M½ �dt ¼ � k4 M½ � � k3 D½ �
1þ k2 T½ �k5
þ k3 D½ �k6
þ k4 M½ �k7
þ k2 T½ � þ k3 D½ � þ k4 M½ �k1 CH3OH½ �
Rate of methanol consumption rCH3OH ¼ d CH3OH½ �dt ¼ � k2 T½ � þ k3 D½ � þ k4 M½ �
1þ k2 T½ �k5
þ k3 D½ �k6
þ k4 M½ �k7
þ k2 T½ � þ k3 D½ � þ k4 M½ �k1 CH3OH½ �
Rate of glycerol formation rG ¼ d G½ �dt ¼ k4 M½ �
1þ k2 T½ �k5
þ k3 D½ �k6
þ k4 M½ �k7
þ k2 T½ � þ k3 D½ � þ k4 M½ �k1 CH3OH½ �
Rate of FAME formation rF ¼ d F½ �dt ¼ ðk2 T½ � þ k3 D½ � þ k4 M½ �Þ
1þ k2 T½ �k5
þ k3 D½ �k6
þ k4 M½ �k7
þ k2 T½ � þ k3 D½ � þ k4 M½ �k1 CH3OH½ �
132 R.S. Malani et al.

The batch experiments were performed at optimum conditions obtained fromstatistical design of experiments (DoE): alcohol/oil molar ratio = 10.6, tempera-ture = 62.5 °C, catalyst concentration = 7.25 wt% oil. The results revealed thatadsorption of methanol was the slowest and rate determining step of transesterifi-cation process. Sonication enhanced the kinetics of reaction steps of transesterifi-cation process, but its effect on methanol adsorption on Cu2O catalyst was adverse.The activation energy of overall transesterification process was found to be90.14 kJ/mol; while, the sum total of activation energies of the three reaction steps oftriglyceride conversion (i.e. r2–r4) was 40.98 kJ/mol. These results essentially pointto strong mass transfer influence on Cu2O–catalyzed transesterification process,even in presence of sonication. The adsorptive mass transfer of methanol to catalystsites was not enhanced by microturbulence generated by sonication. Two probablecauses leading to this effect were: discrete and intermittent nature of acoustic (orshock) waves generated by the transient cavitation, and secondly, the high tem-perature of reaction that offsets the methanol adsorption on catalyst free sites.
4 Conclusions and Perspectives
The potential of biodiesel as alternate renewable liquid transportation fuel is welldemonstrated. The commercial production of biodiesel would require efficienttechnologies for the basic esterification/transesterification reactions, which shouldalso be flexible in terms of feedstock and catalyst. The basic reaction system ofbiodiesel synthesis has heterogeneous character with mass transfer limitations. Withuse of a solid catalyst for avoiding contamination of the glycerol side product, themass transfer limitations become even predominant. In order to have sufficientlyfast kinetics in such processes that would increase productivity, efficient methods ofintroduction of energy in the system are required that overcome the mass transferbarriers. Ultrasound is a potential technology for efficient introduction of energyinto the reaction system on extremely small temporal and spatial scales. Althoughultrasound has been demonstrated to intensify both homogeneous and heteroge-neous biodiesel processes, the basic physical mechanism of the process intensifi-cation has remained largely unexplored. In order to have efficient design andscale-up of the ultrasound-assisted biodiesel processes, it is utmost essential toestablish the basic physical mechanism of the process. In this chapter, we havepresented a review of our studies in discerning the physical mechanism of theultrasound-assisted biodiesel process. Our analysis has clearly established thatphysical effect of generation of strong micro-convection in the reaction systemplays crucial role in enhancement of the biodiesel yield through elimination of themass transfer barriers. Moreover, for solid catalyzed reaction systems, despiteintense micro-convection in the system, the intrinsic kinetics of the reaction stillplay a dominant role. Quite interestingly, these conclusions are found to hold truefor a wide variety of reaction systems employing different edible and non-ediblefeedstocks and both homogeneous and heterogeneous catalysts. The results
Ultrasound-Assisted Biodiesel Synthesis … 133

presented in this chapter can form useful guidelines for development and opti-mization of large scale processes for ultrasound-assisted biodiesel. These results arealso expected to give crucial inputs for further research in ultrasound-assistedprocesses for biodiesel synthesis.
References
1. Moholkar VS, Choudhury HA, Singh S, Khanna S, Ranjan A, Chakma, S Bhasarkar JB(2015) Physical and chemical mechanisms of ultrasound in biofuel synthesis. In: Fang Z,Smith RL, Qi X (eds) Production of biofuels and chemical with ultrasound, biofuels andbiorefineries series, vol. 4. Springer Science + Business Media, Dordrecht, pp 35–86
2. Borah AJ, Singh S, Goyal A, Moholkar VS (2016) An assessment of the potential of invasiveweeds as multiple feedstocks for biofuel production. RSC Adv 6(52):47151–47163
3. Ranjan A, Singh S, Malani RS, Moholkar VS (2016) Ultrasound-assisted bioalcoholsynthesis: review and analysis. RSC Adv 6(70):65541–65562
4. Gerpen JV (2005) Biodiesel processing and production. Fuel Process Technol 86:1097–11075. Ma F, Hanna MA (1999) Biodiesel production: a review. Bioresour Technol 70(1):1–56. Kumar M, Sharma MP (2015) Assessment of potential of oils for biodiesel production. Renew
Sustain Energy Rev 44:814–8237. Suslick KS (1988) Ultrasound: its physical, chemical and biological effects. VCH, New York8. Hart EJ, Henglein A (1985) Free radical and free atom reactions in the sonolysis of aqueous
iodide and formate solutions. J Phys Chem 89(20):4342–43479. Hart EJ, Henglein A (1987) Sonochemistry of aqueous solutions: hydrogen–oxygen
combustion in cavitation bubbles. J Phys Chem 91:3654–365610. Leighton TG (1994) The acoustic bubble. Academic Press, San Diego11. Mason TJ, Lorimer JP (2002) Applied sonochemistry: the uses of power ultrasound in
chemistry and processing. Wiley–VCH, Coventry12. Shah YT, Pandit AB, Moholkar VS (1999) Cavitation reaction engineering. Plenum Press,
New York13. Atchley AA, Prosperetti A (1989) The crevice model of bubble nucleation. J Acoust Soc Am
86:1065–108414. Young FR (1989) Cavitation. McGraw Hill, London15. Flynn HG (1964) Physics of acoustic cavitation in liquids. In: Mason WP (ed) Physical
Acoustics. Academic Press, New York, pp 57–17216. Rayleigh L (1917) On the pressure developed in a liquid during the collapse of spherical
cavity. Phil Mag 34:94–9817. Plesset MS (1949) Dynamics of cavitation bubbles. J Appl Mech (Trans. ASME) 16:277–28218. Noltingk BE, Neppiras EA (1950) Cavitation produced by ultrasonics. Proc Phys Soc
B63:674–68519. Poritsky H (1952) The collapse or growth of a spherical bubble or cavity in a viscous fluid. In:
Sternberg E (ed) Proceedings 1st national congress on theoretical and applied mechanics,pp 813–821
20. Gilmore FR (1954) Hydrodynamic Laboratory Report. California Institute of Technology,26–4
21. Kirkwood JG, Bethe HA (1942) The pressure wave produced by an under water explosion.Office of Science Research and Development, Rep 558
22. Keller JB, Kolodner II (1956) Damping of underwater explosion bubble oscillations. J ApplPhys 27:1152–1161
23. Keller JB, Miksis MJ (1980) Bubble oscillations of large amplitude. J Acoust Soc Am68:628–633
134 R.S. Malani et al.

24. Prosperetti A, Lezzi A (1986) Bubble dynamics in a compressible liquid. Part 1. First ordertheory. J Fluid Mech 168:457–477
25. Colussi AJ, Weavers LK, Hoffmann MR (1998) Chemical bubble dynamics and quantitativesonochemistry. J Phys Chem A 102(35):6927–6934
26. Lofstedt R, Weninger K, Puttermann SJ, Barber BP (1995) Sonoluminescing bubbles andmass diffusion. Phys Rev E 51:4400–4410
27. Barber BP, Hiller RA, Lofstedt R, Putterman SJ, Weninger KR (1997) Defining theun-knowns of sonoluminescence. Phys Rep 281:65–143
28. Krishnan SJ, Dwivedi P, Moholkar VS (2006) Numerical investigation into the chemistryinduced by hydrodynamic cavitation. Ind Eng Chem Res 45:1493–1504
29. Storey BD, Szeri AJ (2000) Water vapor, sonoluminescence and sonochemistry. Proc R SocLond Ser A 456:1685–1709
30. Storey BD, Szeri AJ (2001) A reduced model of cavitation physics for use in sonochemistry.Proc R Soc Lond Ser A 457:1685–1700
31. Eames IW, Marr NJ, Sabir H (1997) The evaporation coefficient of water: a review. Int J HeatMass Transfer 40:2963–2973
32. Toegel R, Gompf B, Pecha R, Lohse D (2000) Does water vapor prevent upscalingsono-luminescence? Phys Rev Lett 85:3165–3168
33. Toegel R (2002) Reaction diffusion kinetics of a single sonoluminescing bubble. Ph.D.Dissertation, University of Twente, Netherlands
34. Hirschfelder JO, Curtiss CF, Bird RB (1954) Molecular theory of gases and liquids. Wiley,New York
35. Reid RC, Prausnitz JM, Poling BE (1987) Properties of gases and liquids. McGraw Hill, NewYork
36. Condon EU, Odishaw H (1958) Handbook of physics. McGraw Hill, New York37. Crank J (1975) The mathematics of diffusion. Clarendon Press, Oxford38. Brennen CE (1995) Cavitation and bubble dynamics. Oxford University Press, Oxford39. Kolb J, Nyborg WL (1956) Small scale acoustic streaming in liquids. J Acoust Soc Am
28:1237–124240. Nyborg WL (1958) Acoustic streaming near a boundary. J Acoust Soc Am 30:329–33941. Davis SL Vibrational modes of methanol. http://classweb.gmu.edu/sdavis/research/modes.
htm. Accessed May 200042. Kalva A, Sivasankar T, Moholkar VS (2009) Physical mechanism of ultrasound–assisted
synthesis of biodiesel. Ind Eng Chem Res 48:534–54443. Parkar PA, Choudhary HA, Moholkar VS (2012) Mechanistic and kinetic investigations in
ultrasound assisted acid catalyzed biodiesel synthesis. Chem Eng J 187:248–26044. Choudhury HA, Chakma S, Moholkar VS (2014) Mechanistic insight into sonochemical
biodiesel synthesis using heterogeneous base catalyst. Ultrason Sonochem 21:169–18145. Choudhury HA, Malani RS, Moholkar VS (2013) Acid catalyzed biodiesel synthesis from
Jatropha oil: mechanistic aspects of ultrasonic intensification. Chem Eng J 231:262–27246. Deng X, Fang Z, Liu YH, Yu CL (2011) Production of biodiesel from Jatropha oil catalyzed
by nanosized solid basic catalyst. Energy 36(2):777–78447. Colussi AJ, Hoffmann MR (1999) Vapor supersaturation in collapsing bubbles: relevance to
mechanisms of sonochemistry and sonoluminescence. J Phys Chem A 103:11336–1133948. Choudhury HA, Goswami PP, Malani RS, Moholkar VS (2014) Ultrasonic biodiesel
synthesis from crude Jatropha curcas oil with heterogeneous base catalyst: mechanistic insightand statistical optimization. Ultrason Sonochem 21:1050–1064
49. Choudhury HA, Srivastava P, Moholkar VS (2014) Single-step ultrasonic synthesis ofbiodiesel from crude Jatropha curcas oil. AIChE J 60:1572–1581
50. Malani RS, Patil S, Kuldeep, Chakma S, Goyal A, Moholkar VS (2016) Mechanistic analysisof ultrasound–assisted biodiesel synthesis with Cu2O catalyst and mixed oil feedstock usingcontinuous (packed bed) and batch (slurry) reactors (communicated)
Ultrasound-Assisted Biodiesel Synthesis … 135

Thermo-Chemical Ethanol Productionfrom Agricultural Waste ThroughPolygeneration: Performance AssessmentThrough a Case Study
Kuntal Jana and Sudipta De
Abstract Substitution of fossil fuels by biofuels over a planned period is animperative need to meet the energy demand in future with minimum possibleenvironmental impact. Biofuels from food stuff may lead to conflict between energyand food security. However, producing biofuel (say, ethanol) from agriculturalwaste (say, rice straw) in thermo-chemical process may be a sustainable optionthrough recycling of waste. But energy requirement for this process is significantlyhigher and independent production of ethanol may not be economically feasible.However, suitable integration of this ethanol production through an efficientlyintegrated multi-utility system called polygeneration may be economically feasiblewith low impact on the environment. This has been explored through a case studywith thermodynamic, economic and environmental performance assessment.Results show sustainability of such a process with acceptable performance frommultidimensional viewpoints.
1 Introduction
Energy is the vital resource for civilization and improvement of living standard ofany society. Often per capita energy consumption is considered as the indicator ofliving standard. Over several decades, fossil fuels have catered to this demand [1].However, the impact on environment due to energy generated from fossil fuels isalso critical. The climate change problem has emerged as the greatest threat tofuture survival of living species on earth, including human being [2]. Major sourceof green house gases causing this climate change are fossil fuels that have been usedover a long period for rapid industrial and economic growth and improvement ofliving standard. The concept of ‘sustainability’ has eventually evolved. This means
K. Jana � S. De (&)Department of Mechanical Engineering, Jadavpur University, Kolkata 700032, Indiae-mail: [email protected]
K. Janae-mail: [email protected]
© Springer Nature Singapore Pte Ltd. 2017A.K. Agarwal et al. (eds.), Biofuels, Green Energy and Technology,DOI 10.1007/978-981-10-3791-7_8
137
to maintain the living standard with possible future continuation of it even withlimited resources and ever increasing population. Present challenge of the energytechnologists is to develop sustainable options to meet energy demand over a longperiod in the future [3]. Use of fossil fuels has to be replaced by alternatives over areasonable period for future sustainability. Exploring alternative fuels for meetingenergy demand is the key issue in this effort.
Biofuels are those which are from any living material and have useful heatenergy that can be used substituting fossil fuels [4]. Initially biofuels were producedfrom agricultural products which were used as food [5]. Though these biofuels havethe potential of reduced carbon emission, a serious conflict between food andenergy securities emerged for such biofuels. These first generation biofuels thusfound to be not sustainable in the long run. ‘Waste-to-energy’ is considered to be avery good sustainable option if it can be implemented in an economically feasibleand environmentally benign way [6]. Ethanol has several usages. It can also be usedas fuel. Producing ethanol from agricultural waste can be a sustainable option.However, the thermo-chemical process of waste-to-ethanol involves several stepsrequiring energy inputs both in the form of heat and work. Thus, the independentprocess of producing ethanol from agricultural waste may not be cost effective. Ifthis can be integrated in a multiple utility output system formally called ‘poly-generation’, the process may be economically feasible with less environmentalimpact [7].
2 Types and Sources of Biomass
Biomass is any matter from plant or animals which is living or was alive a shorttime ago. It includes plants, organic waste, wood, animals, humans, marine life, etc.Before the invention of fossil fuels, biomass was used for heating, cooking, etc.Still, many developing countries use biomass for cooking in open burner though itcauses health hazards and environmental degradation.
Recently, importance of biomass is increasing due to its use as ‘carbon neutral’energy source. Biomass is considered as renewable resource because in a typicaltime-scale for human use, it can be regenerated within the time scale. Regenerationor growing of biomass occurs through photosynthesis process. In the photosyn-thesis process, solar energy is stored in the form of chemical energy in the plant asshown by the following:
6CO2 þ 6H2O �!½sunlight; chlorophyll�
C6H12O6 þ 6O2; DG0 ¼ 480kJ=mol ð1Þ
Plants capture CO2 from air during their growth phase and emit CO2 to theatmosphere during the combustion process of biomass. Hence, it is generally calledas ‘carbon neutral’ fuel, after neglecting the soil carbon balance. Apart from its
138 K. Jana and S. De
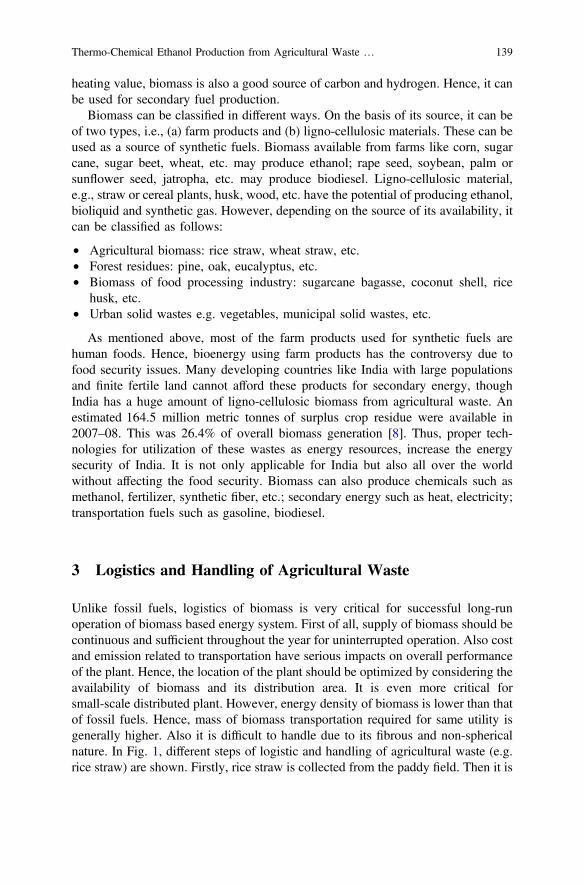
heating value, biomass is also a good source of carbon and hydrogen. Hence, it canbe used for secondary fuel production.
Biomass can be classified in different ways. On the basis of its source, it can beof two types, i.e., (a) farm products and (b) ligno-cellulosic materials. These can beused as a source of synthetic fuels. Biomass available from farms like corn, sugarcane, sugar beet, wheat, etc. may produce ethanol; rape seed, soybean, palm orsunflower seed, jatropha, etc. may produce biodiesel. Ligno-cellulosic material,e.g., straw or cereal plants, husk, wood, etc. have the potential of producing ethanol,bioliquid and synthetic gas. However, depending on the source of its availability, itcan be classified as follows:
• Agricultural biomass: rice straw, wheat straw, etc.• Forest residues: pine, oak, eucalyptus, etc.• Biomass of food processing industry: sugarcane bagasse, coconut shell, rice
husk, etc.• Urban solid wastes e.g. vegetables, municipal solid wastes, etc.
As mentioned above, most of the farm products used for synthetic fuels arehuman foods. Hence, bioenergy using farm products has the controversy due tofood security issues. Many developing countries like India with large populationsand finite fertile land cannot afford these products for secondary energy, thoughIndia has a huge amount of ligno-cellulosic biomass from agricultural waste. Anestimated 164.5 million metric tonnes of surplus crop residue were available in2007–08. This was 26.4% of overall biomass generation [8]. Thus, proper tech-nologies for utilization of these wastes as energy resources, increase the energysecurity of India. It is not only applicable for India but also all over the worldwithout affecting the food security. Biomass can also produce chemicals such asmethanol, fertilizer, synthetic fiber, etc.; secondary energy such as heat, electricity;transportation fuels such as gasoline, biodiesel.
3 Logistics and Handling of Agricultural Waste
Unlike fossil fuels, logistics of biomass is very critical for successful long-runoperation of biomass based energy system. First of all, supply of biomass should becontinuous and sufficient throughout the year for uninterrupted operation. Also costand emission related to transportation have serious impacts on overall performanceof the plant. Hence, the location of the plant should be optimized by considering theavailability of biomass and its distribution area. It is even more critical forsmall-scale distributed plant. However, energy density of biomass is lower than thatof fossil fuels. Hence, mass of biomass transportation required for same utility isgenerally higher. Also it is difficult to handle due to its fibrous and non-sphericalnature. In Fig. 1, different steps of logistic and handling of agricultural waste (e.g.rice straw) are shown. Firstly, rice straw is collected from the paddy field. Then it is
Thermo-Chemical Ethanol Production from Agricultural Waste … 139

stored for a short time in the form of a pile. Drying and pressing of straw are done toreduce the volume of biomass. Straw is baled in cylindrical form for handling andtransportation. After that it is transported to the storehouse. Then biomass is fed tothe gasifier through different types of feeding systems e.g. conveyor belt.
4 Conversion of Biomass
Biomass is usually available in nature in rather inconvenient form for energyconversion using existing technologies. Hence, biomass needs to be converted togaseous or liquid fuels for use in conventional energy conversion devices.Conversion of biomass to liquid or gaseous fuels can be achieved by two funda-mental ways—(a) bio-chemical and (b) thermo-chemical. These two processes maybe executed in different ways as shown in Fig. 2.
In presence of bacteria or enzymes, large biomass molecules are converted intosmall molecules in bio-chemical route. It is significantly slower thanthermo-chemical conversion and no external heat is required. The main products ofdigestion are methane and CO2 with solid and liquid wastes. In this process, bac-teria take oxygen from biomass. During the fermentation process, alcohols areproduced in the presence of bacteria. In thermo-chemical process, biomass is ini-tially converted to synthetic gas. This gas is further treated or synthesized forchemicals or power generation. In this chapter, thermo-chemical conversion ofbiomass and also gasification is considered as the means of conversion of biomassinto synthetic gas.
Agricultural residues (e.g., rice straw)
Collec on
Transport (by truck, tractor)
Prepara on (e.g., pressing, drying, baling)
Storage (e.g., pile)
Thermo-chemical conversion (gasifica on)
Storage (by storehouse)
Conveying (by conveyor belt)
Feeding (by screw type feeder)
Fig. 1 Schematic of logistic and handling of agricultural waste
140 K. Jana and S. De

5 Biomass to Thermo-Chemical Ethanol
To produce thermo-chemical ethanol from biomass, gasification route is a possibleoption. Syngas produced through gasification is processed for alcohol synthesis.Then ethanol is separated. A brief discussion over this topic is given below.
5.1 Gasification
Gasification is the process of thermo-chemical conversion of solid/liquid car-bonaceous fuels to synthetic gas with the useful heat value [9]. It is achieved bypartial oxidation of fuel at atmospheric pressure or higher than that and at a tem-perature above ambient as shown in Fig. 3. During the biomass gasification pro-cess, biomass is partially oxidized by oxygenating agent (air, steam, oxygen) andproduces hot syngas that consists of H2, CO, CO2 etc. This hot gas is quenched bywater. Then it is cleaned and conditioned according to the requirement of down-stream process. In gas cleaning process tar is removed to use the syngas smoothly indownstream processes. Acid gas removal unit may be used additionally for removalof CO2 and sulfur.
Following physical, chemical and thermal processes occur sequentially orsimultaneously within the gasifier depending on the type of gasifier.
Biomass conversion
Biochemical route
Digestion
Fermentation
Thermochemical route
Pyrolysis Gasification
Supercritical water
Air/ oxygen
Steam
Liquifaction Combustion
Fig. 2 Conversion routes of biomass into fuels, gases or chemicals
Thermo-Chemical Ethanol Production from Agricultural Waste … 141
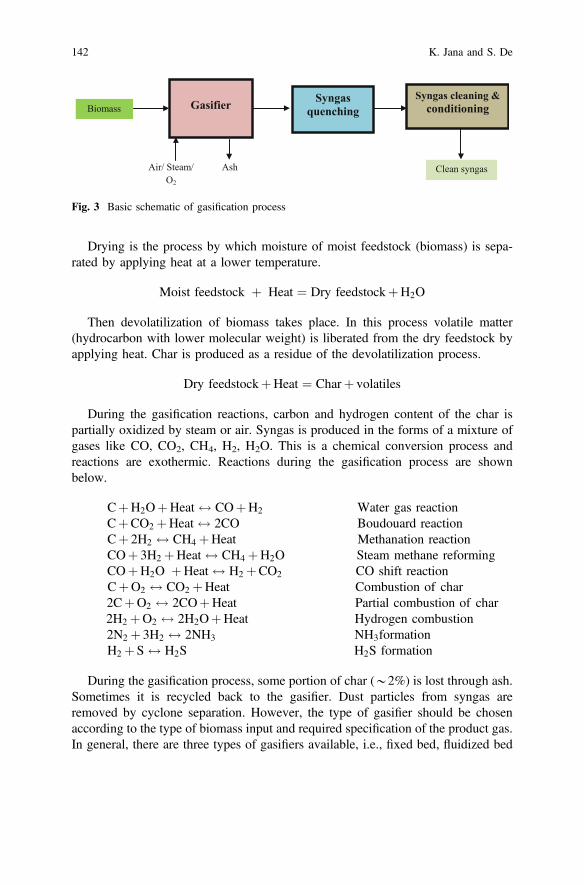
Drying is the process by which moisture of moist feedstock (biomass) is sepa-rated by applying heat at a lower temperature.
Moist feedstock þ Heat ¼ Dry feedstockþH2O
Then devolatilization of biomass takes place. In this process volatile matter(hydrocarbon with lower molecular weight) is liberated from the dry feedstock byapplying heat. Char is produced as a residue of the devolatilization process.
Dry feedstockþHeat ¼ Charþ volatiles
During the gasification reactions, carbon and hydrogen content of the char ispartially oxidized by steam or air. Syngas is produced in the forms of a mixture ofgases like CO, CO2, CH4, H2, H2O. This is a chemical conversion process andreactions are exothermic. Reactions during the gasification process are shownbelow.
CþH2OþHeat $ COþH2 Water gas reactionCþCO2 þHeat $ 2CO Boudouard reactionCþ 2H2 $ CH4 þHeat Methanation reactionCOþ 3H2 þHeat $ CH4 þH2O Steam methane reformingCOþH2O þHeat $ H2 þCO2 CO shift reactionCþO2 $ CO2 þHeat Combustion of char2CþO2 $ 2COþHeat Partial combustion of char2H2 þO2 $ 2H2OþHeat Hydrogen combustion2N2 þ 3H2 $ 2NH3 NH3formationH2 þ S $ H2S H2S formation
During the gasification process, some portion of char (*2%) is lost through ash.Sometimes it is recycled back to the gasifier. Dust particles from syngas areremoved by cyclone separation. However, the type of gasifier should be chosenaccording to the type of biomass input and required specification of the product gas.In general, there are three types of gasifiers available, i.e., fixed bed, fluidized bed
Biomass GasifierSyngas cleaning &
conditioning
Air/ Steam/ O2
Ash
Syngas quenching
Clean syngas
Fig. 3 Basic schematic of gasification process
142 K. Jana and S. De

and entrained flow gasifier. Downdraft and updraft gasifiers are the two types offixed bed gasifier. Depending on the capacity, operating conditions and charac-teristics of the biomass, gasifiers are selected.
5.2 Syngas Processing
Gasification at elevated temperature reduces the yield of tar formation. Hence,post-processing of syngas is minimized for treatment of tar. After gasification andbefore entering to the ethanol synthesis tower, syngas needs to be treated as shownin Fig. 4. Firstly, it is cleaned for ammonia and other impurities. Then water gasshift reaction is required to achieve the desired H2 and CO ratio (i.e. 2:1) for ethanolsynthesis [10]. For sour water gas shift (WGS) reaction, separation of H2S is notrequired. Otherwise, H2S is separated before the water gas shift reactor, dependingon the catalyst used for WGS reaction. In this case, WGS reactor operates at apressure of 4 MPa. Hence, compression of syngas is necessary before WGS.Following is the water gas shift reaction:
COþH2O $ CO2 þH2 DH298 ¼ 41:0 kJ=mol ð2Þ
To stack/ combus on chamber
Ethanol
CO2
Syngas cooler/ Water wash
WGS Reactor
CO2
Separator
Ethanol synthesis tower
Ethanol condenser
Separator
Heat recovery
Recycler
Expander
Compressor 1
Compressor 2
NH3 Impuri es
Inter-cooler
Steam
Syngas from
gasifier
MEA
Catalyst
Catalyst
Heat
Fig. 4 Schematic of thermo-chemical ethanol production [16]
Thermo-Chemical Ethanol Production from Agricultural Waste … 143

Conversion percentage of CO is designed according to the desired ratio.For WGS reaction, external input of steam is required depending on the percentageof H2O in the syngas. After WGS, concentration of CO2 increases. This CO2 isseparated by an absorption based system using mono-ethanol amine (MEA) or byadsorption based system. However, separation process requires reboiler heating instripper column. Before entering to the carbon capture process, heat generated inthe exothermic WGS reaction is removed/recovered. Then syngas containing N2
(for gasification with air), CO and H2 enters to the ethanol synthesis tower. Theethanol synthesis tower is maintained at 9.6 MPa pressure [11]. Hence, syngas iscompressed before entering to the ethanol synthesis process and it requires a sig-nificant amount of power.
5.3 Ethanol Synthesis and Separation
For ethanol synthesis different types of catalyst (e.g. MoS2 based, Rh based) are usedaccording to the desired product and conversion rate. Direct conversion of syngas toethanol, i.e., hydrogenation of CO, is highly exothermic as shown below [10]
2COþ 4H2 $ C2H5OHþH2O DH298 ¼ �255:7 kJ=mol ð3Þ
There are many other side reactions during the ethanol synthesis process. To getthe desired product, selection of suitable catalyst is important. Other higher alcoholsare also produced during ethanol synthesis (like propanol (C3H7OH), butanol(C4H9OH) and pentanol (C5H11OH)). These alcohols act as excellent additives withgasoline for internal combustion engines.
At the exit of ethanol synthesis reactor, unconverted gases, alcohols (ethanol,methanol, and higher alcohols), and water are obtained. Unconverted gases areseparated by pressure reduction in ethanol condenser. The remaining liquid isseparated in distillation columns into ethanol, methanol, higher alcohols, and water,which requires additional energy but in the form of heat. A part of the unconvertedgases can be used for combustion whereas the remaining part is recycled back to theethanol synthesis tower.
6 Process Configurations
In this thermo-chemical ethanol production process, heat and materials are lost inmany components. Due to different exothermic reactions (as discussed previously),heat is available at different temperatures. In ethanol production process, significantamount of power is consumed during compression of the syngas. The waste heatcan be utilized and power can be generated within an efficiently integrated system.Also production of other utilities from this integrated system may influence the
144 K. Jana and S. De

economic and environmental performance of the plant. Hence, there is a significantscope to increase the energy efficiency through proper system integration. Thissystem integration can be obtained through polygeneration (Fig. 5).
6.1 Polygeneration
When multiple utilities are produced in a single plant that is called polygeneration.Input energy sources may be single or multiple. In polygeneration, multiple outputsare obtained through process integration. Depending on the utility demands at theplace of operation, outputs of polygeneration may be energy services, syntheticfuels or other types of utilities like potable water etc. [12]. However, proper inte-gration of processes is critical to increase energy efficiency and flexibility of thesystem. Output amounts can be adjusted according to the demand. Also the eco-nomic performance of the polygeneration plant improves due to the production ofmultiple utilities. Polygeneration also reduces waste and emission to the environ-ment. Decentralized polygeneration in remote areas also increases energy access torural people [13]. For coal and biomass based polygeneration, capture of CO2 maybe integrated to reduce the greenhouse gas emission. The available waste heat of thesystem can be utilized for this carbon capture. This kind of polygeneration reducesthe energy penalty of GHG mitigation.
6.2 Ethanol Production Through Polygeneration—A CaseStudy
For this study, rice straw is utilized as the source of energy input to the polygen-eration plant. Rice straw has useful calorific value to be used as an energy resourcethough there are some serious challenges during gasification. Thermo-chemicalproperties of rice straw are shown in Table 1. Different units of polygeneration areshown in Fig. 6. The proposed polygeneration consists of syngas production bygasification unit, combined cycle gas turbine (CCGT) for power generation, CO2
separation unit using MEA, ethanol production unit, heat recovery and ammonia
Polygeneration plantInput energy Ethanol
Heating
Cooling
Power
Fig. 5 Basic concept of a polygeneration
Thermo-Chemical Ethanol Production from Agricultural Waste … 145

based vapor absorption refrigeration system. The power required for ethanol pro-duction is supplied by the CCGT unit. Heat recovered from gasification and flue gasis used for vapor absorption cooling. Also from ethanol production, a significantamount of heat is obtained. Detailed schematics of the CCGT power generation isshown in Fig. 7. Produced syngas is utilized by two processes—either in power
Table 1 Feedstockproperties and ultimate andproximate analyses (masspercent) (dry basis)
Rice straw
Higher calorific value (MJ/kg) 14.56
Lower calorific value (MJ/kg) 13.76
FC 13.33
VCM 62.31
Ash 24.36
C 34.6
H 3.93
O 35.38
N 0.93
S 0.16
Ash 25
Syngas production
Combined cycle gas turbine
Thermo-chemical ethanol production
CO2 separation
Waste heat recovery
Vapor absorption refrigeration
Straw baling
Straw transportation
Rice cultivation
POLYGENERATION
Power
Ethanol
Chill
Utility heat
RiceStraw
Emissions
Fig. 6 Integration of multiple units in a polygeneration [17]
146 K. Jana and S. De

generation or in ethanol production. The percentage of syngas between these twoprocesses can be varied according to demand. In Fig. 8, heat recovery from theWGS reaction and ethanol synthesis reaction shown.
Rice straw
Superheater-Reheater
Syngas cooler
Gasifier
Syngas compressor
Economizer -Evaporator
Combus on chamber
Air compressor
Waste heat recovery
To ethanol produc on unit
Vapor absorp on chiller
Process heater
Air
Spli er
LPST
Gas turbine
HPST
Condenser
Air
Ash
To stack
Pump
inputsyngas/ flue gasheat recoverysteam/ water
Fig. 7 Detailed schematic of biomass based power generation integrated with ethanol production[14]
CO2
Syngas cooler/ Water
wash
WGS Reactor
CO2Separator
Ethanol synthesis tower
Ethanol condenser
Separator
Heat recovery
Recycler
Expander
Compressor 1
Compressor 2
NH3 H2S
Ethanol
Process heater
Inter-cooler
Steam
Steam
Syngas from
spli er
Cooling water MEA
Catalyst
Power
Power
Fig. 8 Detailed schematic of ethanol production integrated with polygeneration [14]
Thermo-Chemical Ethanol Production from Agricultural Waste … 147

6.3 Net-CO2 Negative Ethanol
In the ethanol production unit, after WGS reaction, CO2 is separated from thesyngas to maintain the desired composition of the syngas for ethanol synthesis.Hence, there is a possibility of sequestration of CO2 as shown in Fig. 9. Bysequestering this CO2, concentration of GHG gases in the atmosphere can bereduced. In order to store CO2, it must be transported to a proper site of seques-tration. Hence, liquefaction of CO2 is necessary for transportation by pipeline or byvessels. Liquefaction can be done by pressurization and it requires a significantamount of power which is supplied by the polygeneration itself.
Input energy of this polygeneration is obtained from rice straw which is anagricultural waste. As it is a by-product of paddy cultivation, it may be treated as aCO2-neutral fuel. After CO2 sequestration, this energy system may become a netCO2-negative one and this production of ethanol by this process may even be a
Syngas production
Combined cycle gas turbine
Thermo-chemical ethanol production
CO2 separation
Waste heat recovery
Vapor absorption refrigeration
Straw baling
Straw transportation
Rice cultivation
POLYGENERATION
Power
Ethanol
Chill
Utility heat
RiceStraw
Emissions
CO2 transport and storage
CO2
Fig. 9 Polygeneration with CO2 capture and storage [17]
148 K. Jana and S. De

net-CO2 negative one. To assess the net-CO2 emission, life cycle analysis (LCA) isthe most scientific tool for this purpose.
7 Assessment of the Ethanol Production Process
To assess a sustainable energy solution, assessment should be multi-dimensional[13]. Technological feasibility may be assessed through thermodynamic analysis.Simultaneously, this system should be economically viable for its sustainability.Economic viability of this system is tested through techno-economic analysis. Oneof the major objectives of bio-ethanol production and use is to reduce the GHGemission from transportation sector. This reduction of GHG emission is assessedmost scientifically through life cycle analysis (LCA). LCA study also identifiesenvironmental benefits/burdens from this polygeneration. However, it also exploresthe net-CO2 negativity of this energy solution.
7.1 Thermodynamic Assessment
Thermodynamic simulation of the polygeneration plant is done by using AspenPlus®. As performance of a biomass based plant is highly dependent on confirmedavailability of biomass, this polygeneration is designed according to the availabilityof rice straw of an Indian district [15, 16]. The operating parameters of the plant aregiven in Table 2.
Table 2 Plant operating parameters [14]
Parameters Value
Biomass feed rate 62 t/h
Gasification equivalence ratio 25%
Produced syngas in ethanol production unit 30%
GT-cycle pressure ratio 14
Water circulation rate in steam cycle 70 t/h
Make-up water for steam cycle 10%
HP-Steam turbine inlet temperature 538 °C
HP-Steam turbine inlet pressure 12.4 MPa
LP-Steam turbine inlet pressure 3.2 MPa
NH3 circulation rate in cold storage 124 t/h
Cold storage evaporator temperature −5 °C
H2:CO in WGS 2:1
Ethanol synthesis pressure 9.6 MPa
Recycling of unconverted syngas in ethanol synthesis tower 70%
Flue gas exhaust temperature 200 °C
Lean amine loading 30% (wt./wt.)
Thermo-Chemical Ethanol Production from Agricultural Waste … 149

In this simulation, 30% of produced syngas is utilized for ethanol production andthe rest is used for power generation. However, heat recovered from both of theseunits is used for either heating or cooling. Cooling is used for cold storage forpreservation of foods and agricultural products. The results of the simulation aregiven in Table 3 which shows that a significant amount of power, ethanol, heatingand cooling can be produced through this polygeneration. Rate of ethanol pro-duction may be decided according to utility demands and economic value of each ofthe products.
7.2 Economic Assessment
For sustainable operation of the polygeneration plant, it must be economicallyfeasible. The cost of produced ethanol should be competitive with other availableliquid fuels to be acceptable to the consumers. By taking the market value ofethanol as the input, economic performance of the polygeneration plant is assessed.Inputs and assumptions of the techno-economic performance are given in Table 4.
The results of the economic performance of the polygeneration plant are given inTable 5. Though this plant needs a large capital investment, its payback period isquite reasonable, i.e., within 5 years. Net present value of the polygeneration plantis also high. Hence, ethanol production through polygeneration is an economicallyfeasible solution.
7.3 Environmental Impact Assessment
The main incentive for using ethanol as the secondary fuel is the possible decar-bonization of the transport sector. Use of ethanol reduces the dependency on oilimport and hence, increases energy security also. To assess the environmentalimpact, assessment of GHG emission throughout the life cycle of the ethanolproduction process is necessary. LCA is the most scientific tool to measure theGHG emission. Cradle-to-gate LCA is used to show the environmental impact ofethanol production from straw. For the LCA, basic assumptions for life cycle
Table 3 Thermodynamicperformance of thepolygeneration plant for anIndian district (30% syngasused for ethanol production)[14]
Item Value
Net gas turbine power output 33.5 MW
Steam turbine power output 28 MW
Power requirement for ethanol production 5.3 MW
Ethanol production rate 3.6 t/h
Cooling rate 3.7 MW
Utility heat rate 3 MW
CO2 capture rate 8.9 t/h
150 K. Jana and S. De

inventory are given in Table 6. The system boundary of polygeneration is shown inFigs. 6 and 9. In Fig. 9, the polygeneration is explored with carbon sequestrationoption.
Table 4 Basic assumptions and prices for economic calculation [14]
Parameters Value
Year of study September 2013
Plant life 10 years
Start-up period 3 years (20, 45, 35%)
Plant location factor 1.02
Plant overheads 10% of FCI
Working capital 15% of FCI
Depreciation method Linear
Salvage value after 10 years 15% of FCI
Plant discount rate 10%
Plant O&M 2.8% of FCI
Insurance and taxes 1% of FCI
Sales tax 4%
Operating hours per annum 8000
Biomass purchasing cost 13.33 USD/t
MoS2 Catalyst cost 11.57 USD/kg
Catalyst replacement per year 20%
Catalyst’s alcohol productivity 300 g/kg-catalyst/hr
Water cost 0.28 USD/m3
Thermal energy requirement for CO2 capture 3 GJ/t CO2
Specific MEA price 1416.7 USD/t
MEA degradation rate 1.5 kg/t CO2
CO2 transport and storage cost 14.2 USD/t CO2
Carbon credit 21.25 USD/t CO2
Electricity price 72.67 USD/MWh
Ethanol price 1.6 USD/gallon
Cooling price 20 USD/MMBtu
Utility heating price 13.33 USD/MWh
Table 5 Economicperformance of thepolygeneration plant [14]
Parameters Value
Total capital investment 257 million USD
Annual operating cost 16 million USD
Annual net profit (after tax) 40 million USD
Payback period 4.76 years
Return on investment (ROI) 15.5%
Net present value (NPV) 97 million USD
Thermo-Chemical Ethanol Production from Agricultural Waste … 151
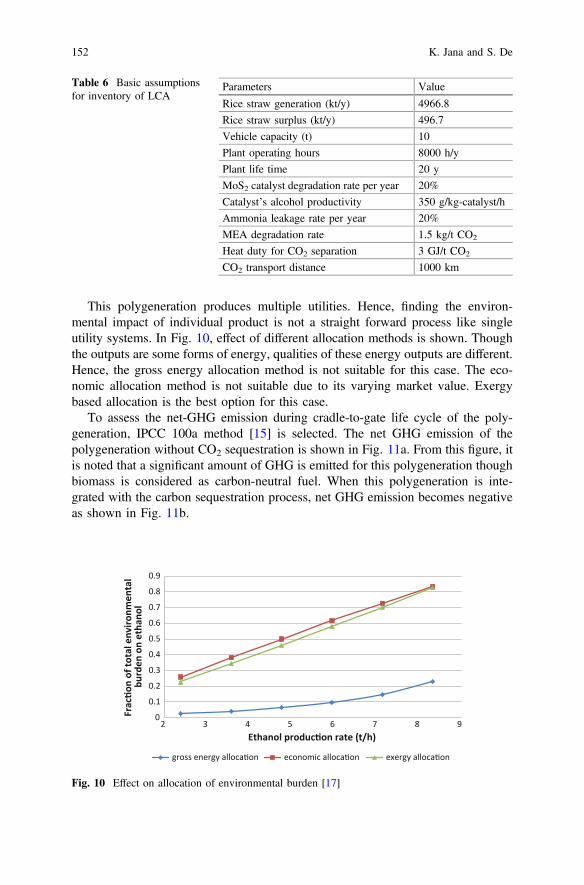
This polygeneration produces multiple utilities. Hence, finding the environ-mental impact of individual product is not a straight forward process like singleutility systems. In Fig. 10, effect of different allocation methods is shown. Thoughthe outputs are some forms of energy, qualities of these energy outputs are different.Hence, the gross energy allocation method is not suitable for this case. The eco-nomic allocation method is not suitable due to its varying market value. Exergybased allocation is the best option for this case.
To assess the net-GHG emission during cradle-to-gate life cycle of the poly-generation, IPCC 100a method [15] is selected. The net GHG emission of thepolygeneration without CO2 sequestration is shown in Fig. 11a. From this figure, itis noted that a significant amount of GHG is emitted for this polygeneration thoughbiomass is considered as carbon-neutral fuel. When this polygeneration is inte-grated with the carbon sequestration process, net GHG emission becomes negativeas shown in Fig. 11b.
Table 6 Basic assumptionsfor inventory of LCA
Parameters Value
Rice straw generation (kt/y) 4966.8
Rice straw surplus (kt/y) 496.7
Vehicle capacity (t) 10
Plant operating hours 8000 h/y
Plant life time 20 y
MoS2 catalyst degradation rate per year 20%
Catalyst’s alcohol productivity 350 g/kg-catalyst/h
Ammonia leakage rate per year 20%
MEA degradation rate 1.5 kg/t CO2
Heat duty for CO2 separation 3 GJ/t CO2
CO2 transport distance 1000 km
0
0.1
0.2
0.3
0.4
0.5
0.6
0.7
0.8
0.9
2 3 4 5 6 7 8 9
Frac
on o
f tot
al e
nviro
nmen
tal
burd
en o
n et
hano
l
Ethanol produc on rate (t/h)
gross energy alloca on economic alloca on exergy alloca on
Fig. 10 Effect on allocation of environmental burden [17]
152 K. Jana and S. De
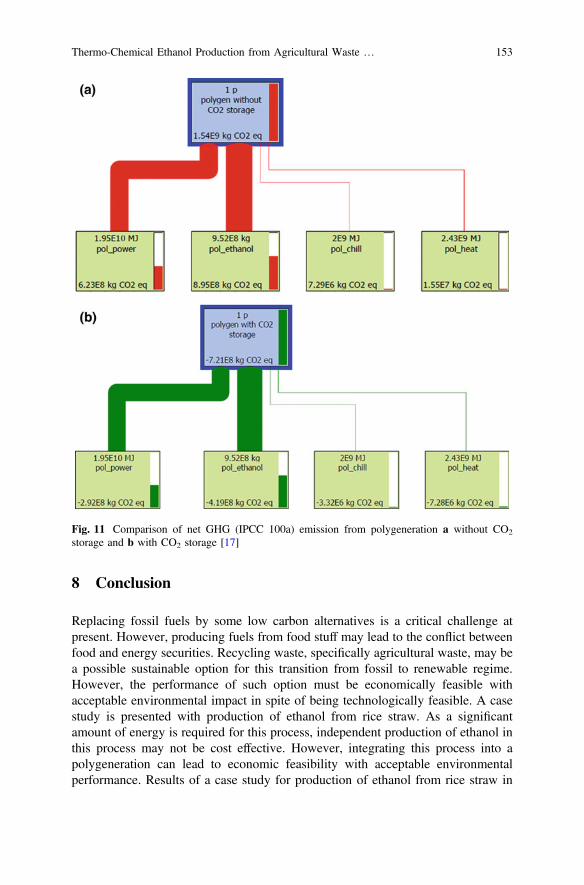
8 Conclusion
Replacing fossil fuels by some low carbon alternatives is a critical challenge atpresent. However, producing fuels from food stuff may lead to the conflict betweenfood and energy securities. Recycling waste, specifically agricultural waste, may bea possible sustainable option for this transition from fossil to renewable regime.However, the performance of such option must be economically feasible withacceptable environmental impact in spite of being technologically feasible. A casestudy is presented with production of ethanol from rice straw. As a significantamount of energy is required for this process, independent production of ethanol inthis process may not be cost effective. However, integrating this process into apolygeneration can lead to economic feasibility with acceptable environmentalperformance. Results of a case study for production of ethanol from rice straw in
Fig. 11 Comparison of net GHG (IPCC 100a) emission from polygeneration a without CO2
storage and b with CO2 storage [17]
Thermo-Chemical Ethanol Production from Agricultural Waste … 153
thermo-chemical process in a polygeneration system and estimated performancefrom multi-dimensional viewpoint are reported. The results show that with theavailability of rice straw, the system will be economically attractive with existingoptions. A payback period of less than 5 years will be required for recovery ofinvestment of capital. The system may be integrated with CO2 sequestration for anet CO2-negative option as observed from a cradle-to-gate life cycle analysis.
Acknowledgements Mr. Kuntal Jana gratefully acknowledges to the Council of Scientific andIndustrial Research (CSIR), India for awarding Senior Research Fellowship during this worktoward Ph.D.
References
1. IEA (2015) World energy outlook. International Energy Agency, Paris2. IPCC (2015) Climate change 2014, Synthesis Report (AR5). Cambridge University Press,
Intergovernmental Panel on Climate Change3. Tester JW, Drake EM, Driscoll MJ, Golay MW, Peters WA (2012) Sustainable energy:
choosing among options. MIT press, MA4. de Freitas LC, Kaneko S (2011) Ethanol demand in Brazil: regional approach. Energy Policy
39:2289–22985. Hira A (2011) Sugar rush: prospects for a global ethanol market. Energy Policy 39:6925–
69356. Kalyani KA, Pandey KK (2014) Waste to energy status in India: a short review. Renew
Sustain Energy Rev 31:113–1207. Meerman JC, Ramirez A, Turkenburg WC, Faaij APC (2011) Performance of simulated
flexible integrated gasification polygeneration facilities. part A: technical energetic assess-ment. Renew Sustain Energy Rev 15:2563–2587
8. TIFAC (2009) Availability of Indian biomass resources for exploitation. http://www.tifac.org.in/index.php?option=com_content&view=article&id=747&Itemid=208. Accessed 17 Oct2016
9. Higman C, Burgt MVD (2008) Gasification. Elsevier, UK10. Van der Heijden H, Ptasinski KJ (2012) Exergy analysis of thermochemical ethanol
production via biomass gasification and catalytic synthesis. Energy 46:200–22111. Perales ALV, Valle CR, Ollero P, Gomez-Bare A (2011) Technoeconomic assessment of
ethanol production via thermochemical conversion of biomass by entrained flow gasification.Energy 36:4097–4108
12. Jana K, De S (2015) Sustainable polygeneration design and assessment through combinedthermodynamic, economic and environmental analysis. Energy 91:540–555
13. Chicco G, Mancarella P (2009) Distributed multi-generation: a comprehensive view. RenewSust Energy Rev 13(3):535–551
14. Jana K, De S (2015) Polygeneration performance assessments: multi-dimensional viewpoint.Clean Technol Environ Policy 17:1547–1561
15. CGPL (2010) Biomass resource atlas of India. Combustion, gasification and propulsionlaboratory, IISc Bangalore, India. http://lab.cgpl.iisc.ernet.in/Atlas/Tables.aspx Accessed 05May 2014
16. Jana K, De S (2015) Techno-economic evaluation of a polygeneration—a case study for anIndian district. Bioresour Technol 181:163–173
17. IPCC (2007) Climate change 2007: working group I: the physical science basis.Intergovernmental Panel on Climate Change
154 K. Jana and S. De

18. Jana K, De S (2015) Polygeneration using agricultural waste: thermodynamic and economicfeasibility study. Renew Energy 74:648–660
19. Jana K, De S (2016) Environmental impact of an agro-waste based polygeneration withoutand with CO2 storage: life cycle assessment approach. Bioresour Technol 216:931–940
Thermo-Chemical Ethanol Production from Agricultural Waste … 155

Microalgae Based Biofuel: Challengesand Opportunities
Richa Katiyar, Amit Kumar and B.R. Gurjar
Abstract The growing demand of conventional fuels and its limited reservoir hasignited attention of scientific communities to produce alternative fuels includingbiofuels from renewable sources. The renewable sources include wood, plants,agro-waste, fruit pulps and other waste materials with nutrients. The use of biomassbased bioenergy or biofuel is gaining public attention due to their environmentfriendly aspects. Earlier the biofuel was produced from food and non food cropswhich puts pressure on land resource. To circumvent such negative impacts, sci-entific communities have explored the use of microalgae for production of biofuels.Microalgae can produce high oil (more than 300 times) than other existingresources such as terrestrial plants. The added advantage of microalgae alsoincludes the use of non cultivable soil and waste water for its cultivation whichrenders the process more efficient from cost perspective. Thus, the usage ofmicroalgae for biofuel production doesn’t affect the agriculture land resource anddrinking water balance in the environment. Using microalgae based biofuel hasbeen shown to be a carbon neutral process because the carbon generated in the fuelcombustion is almost neutralized by the carbon consumption during micro-algalgrowth. Moreover, the different species of microalgae produce bio-sustainablenovel products which can be used as raw materials in a number of industries likeenergy, power generation, feed and food industry and cosmetics. In this way, themulti usage of microalgae can contribute toward cost effectiveness with develop-ment of nation in terms of health, industry establishment and job creation.
R. Katiyar � A. Kumar � B.R. Gurjar (&)Centre for Transportation Systems, Indian Institute of Technology Roorkee, Roorkee 247667,Uttarakhand, Indiae-mail: [email protected]
B.R. GurjarDepartment of Civil Engineering, Indian Institute of Technology Roorkee, Roorkee 247667,Uttarakhand, India
© Springer Nature Singapore Pte Ltd. 2017A.K. Agarwal et al. (eds.), Biofuels, Green Energy and Technology,DOI 10.1007/978-981-10-3791-7_9
157

Graphical Abstract
Keywords Carbon � Bioenergy � Biofuel � Renewable energy � Environment
1 Introduction
Negative environmental repercussions of anthropogenic activities such as burningof fossil fuels include release of various greenhouse gas emissions to the envi-ronment. The non renewable nature of fossil fuels causes degradation of environ-mental components and consequently hazards to human health. To avoid thesenegative effects of non-renewable sources, researchers have created interest inproduction of renewable energy sources including biofuels [86]. Biofuels can beproduced from several resources such as food crops (first generation biofuels),non-food crops (second generation biofuels) and biomass based energy resources(advanced or third generation biofuels). Commercially the cultivation of energycrops (food and non food crops) for fuel generation has created a lot of issuesrelated to food prices and land requirement. This has shifted idea toward biomassbased energy resources which are gaining more scientific attention due to its highyield and advantages over other resources. Biomass based resources such asmicroalgae can utilize animal fat, agro waste materials, fruit pulps, municipal wastematerials for production of biofuels. Biofuels produced from microalgae are con-sidered as carbon neutral in nature because the CO2 liberated in combustion processof biofuel is equilibrated by the CO2 taken by the new ones sowed to replace
158 R. Katiyar et al.

harvested ones [8, 43, 73]. On account of these positive aspects, biofuels haveemerged as a viable alternative to diesel/petroleum fuels used in the transport sector[24]. This article critically reviews and presents the biofuel production frommicroalgae, and associated advantages and challenges.
2 Demand and Production of Biofuel
Human dependency on transportation vehicles for their livelihood across the worldis increasing the demand of biofuels generation globally. As the reservoirs ofpetroleum based fuels are limited and non-renewable, it further stresses the need fordevelopment of production of alternate energy fuels for future including biofuels.To produce biofuels and its byproducts in 2004, about 14 million hectare cropswere used globally that has accounted about 1% of global cropland area [85].Many countries like Germany, India, USA, China and Japan are using blending ofbiodiesel with conventional fuel in transportation sector [72]. Volkswagen Grouphas used B20 (20% biodiesel and 80% conventional diesel) in their vehicles.
While India produces 30% of its crude oil needs, yet India has demanded 3.6Million Metric Tons of biodiesel in 2011–12 [29, 41]. In 2004, many busses inGujrat and some trains like Jan Shatabdi have run successfully using B5 and B20 inIndia [68]. In India, total production of biodiesel was 6 million gallons in 2009 [81]and the demand for biofuel is estimated to grow at the rate of 5.8% annually till2030 [41]. For production of biofuels in India, many private companies havealready planted safflower, castor and Argemone over 400 ha in Gujarat, Karnatakaand Maharashtra for production of biofuel in India [29].
To fulfill the growing demand of biofuel globally, biofuel production is con-tinuously increasing in number of countries including Germany, India, Brazil, U.S.and China. The biodiesel production in US has started in 2000 and hiked from 25million gallons in 2004 to 678 million gallons in 2008 [81]. In 2009, the biodieselproduction was 6 million gallons in India, whereas the biodiesel production inBrazil was recorded as 500 million gallons in year 2010 [13].
3 Microalgae
Microalgae are unicellular microscopic miniatures which perform photosynthesiswith high efficiency than crops [60]. Microalgae generally have a higher productionrate, growth rate, product accumulation rate, less doubling time and high photo-synthetic rate than other biomass feedstocks and plants [44]. Hence, they canpropagate within a day and can be harvested in about 1–10 days [83]. For instance,doubling time for microalgae can be as short as 3–8 h, while jatropha takes2–3 years [44]. Moreover, microalgae are oxygen (O2) producing miniatures,
Microalgae Based Biofuel: Challenges and Opportunities 159

generally autotrophs, consume inorganic carbon in the form of carbon dioxide(CO2) to produce organic compounds such as carbohydrates, proteins and lipids.Some species of microalgae can grow efficiently in heterotrophic as well as mix-otrophic conditions in the presence of organic carbon compounds. Hence, a singlecell can follow three different modes of growth patterns. Moreover, microalgaehave ability to resist in different environments ranging from fresh water to highalkalinity water and, in wet to dryrocks [34]. Thus microalgae, having the ability toadapt to different environments, is suitable to grow in extreme of stress conditionssuch as nutrient limitation and extremes of pH. Moreover under some stress con-ditions i.e. under extremes of pH and nutrient limitation, microalgae producesmaximum lipids this ultimately leads to highest yield of biofuels. Different speciesof microalgae can increase oil yield up to 70% under stress condition [37].Microalgae based biofuels are also capable to be used with the existing infras-tructure for storage and distribution. Microalgae based biodiesel has been proposedas one of the most popular choices these days [71].
3.1 Use of Microalgae as a Single Cell for Productionof Biofuel and Its Byproducts
The production of biofuel and other byproducts from microalgae is carried out inthree steps (Fig. 1). (i) Cultivation of microalgae (ii) Cell harvesting, drying andextraction of oil bodies and (iii) Transesterification.
Fig. 1 Single step biofuel production from microalgae with production of its byproducts
160 R. Katiyar et al.

3.1.1 Cultivation of Microalgae
Photobioreactor
Photo-bioreactors (PBRs) are closed transparent structures equipped with allfacilities required for growth of microalgae. PBRs are available in different sizes,shapes, designs and varieties such as flat panel reactors (FPR), tubular PBRs(horizontal and vertical column reactors), bubble column reactors (BCR), air liftreactors (ALR), and stirred tank PBR. Amongst these, tubular PBRs and FPR aremost popular and used in mass cultivation of microalgae due to its easy handling,high surface to volume ratio and large illuminating surface area [80]. Samson andLeduy [70] designed a FPR equipped with fluorescence lamps and Ramos deOrtega and Roux [63] have designed an outdoor FPR with thick translucent PVCmaterials to reduce cost. With time and extensive research work in this area, variousdesigns of tubular PBRs and FPR have been reported for mass cultivation ofdifferent algae [40, 78]. The advantages of using PBR for cultivation of microalgaeare to reduce risk of contamination and high productivity. PBRs are designed insuch a way that they can utilize sunlight as well as artificial light like light emittingdiodes (LED), tungsten or fluorescent tube lights and bulbs. LEDs are preferred dueto minimum heat generation and low power consumption. Yet another advantage isthat LEDs can be used to study the effect of different wavelength on growth ofmicroalgae. For example—microalgae, Nannochloropsis sp. has shown a highergrowth rate and lipid productivity under blue light (470 nm) than white, red orgreen [19, 20] (Table 1).
Table 1 Advantages and limitations of different types of PBRs
PBR types Advantages Limitations
TubularPBRs
Cost effective; good biomassproductivity; large illuminating surfacearea and fairly good for outdoor cultures
Difficulty in handling in pH andCO2/O2 ratio; require large space[77]
VerticalPBRs
Reduced photo inhibition andphotooxidation; efficient mixing; goodfor immobilization of microalgae; lowshear force and energy consumption
Decrease illumination on scalingup
FPR Low oxygen buildup; easy to clean;large illuminating surface; cost effectiveand good biomass productivity
Difficulty in scaling up theprocess and temperature control[77]
ALR andBCR
Used for increasing photosyntheticefficiency and light flashing effect
Suitable for indoor operation [57]
Stirred tankreactor
– High shear force, mechanicalagitation required and lowsurface to volume ratio [57]
Microalgae Based Biofuel: Challenges and Opportunities 161
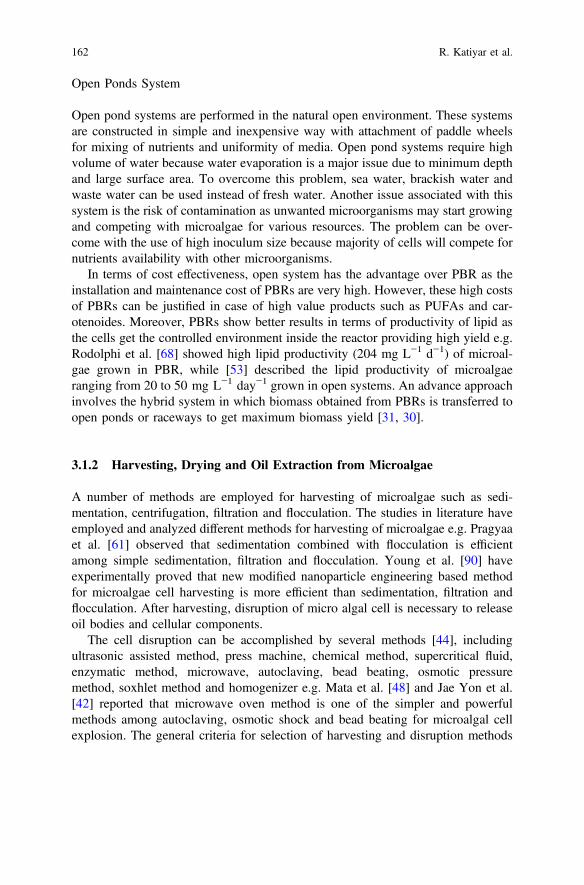
Open Ponds System
Open pond systems are performed in the natural open environment. These systemsare constructed in simple and inexpensive way with attachment of paddle wheelsfor mixing of nutrients and uniformity of media. Open pond systems require highvolume of water because water evaporation is a major issue due to minimum depthand large surface area. To overcome this problem, sea water, brackish water andwaste water can be used instead of fresh water. Another issue associated with thissystem is the risk of contamination as unwanted microorganisms may start growingand competing with microalgae for various resources. The problem can be over-come with the use of high inoculum size because majority of cells will compete fornutrients availability with other microorganisms.
In terms of cost effectiveness, open system has the advantage over PBR as theinstallation and maintenance cost of PBRs are very high. However, these high costsof PBRs can be justified in case of high value products such as PUFAs and car-otenoides. Moreover, PBRs show better results in terms of productivity of lipid asthe cells get the controlled environment inside the reactor providing high yield e.g.Rodolphi et al. [68] showed high lipid productivity (204 mg L−1 d−1) of microal-gae grown in PBR, while [53] described the lipid productivity of microalgaeranging from 20 to 50 mg L−1 day−1 grown in open systems. An advance approachinvolves the hybrid system in which biomass obtained from PBRs is transferred toopen ponds or raceways to get maximum biomass yield [31, 30].
3.1.2 Harvesting, Drying and Oil Extraction from Microalgae
A number of methods are employed for harvesting of microalgae such as sedi-mentation, centrifugation, filtration and flocculation. The studies in literature haveemployed and analyzed different methods for harvesting of microalgae e.g. Pragyaaet al. [61] observed that sedimentation combined with flocculation is efficientamong simple sedimentation, filtration and flocculation. Young et al. [90] haveexperimentally proved that new modified nanoparticle engineering based methodfor microalgae cell harvesting is more efficient than sedimentation, filtration andflocculation. After harvesting, disruption of micro algal cell is necessary to releaseoil bodies and cellular components.
The cell disruption can be accomplished by several methods [44], includingultrasonic assisted method, press machine, chemical method, supercritical fluid,enzymatic method, microwave, autoclaving, bead beating, osmotic pressuremethod, soxhlet method and homogenizer e.g. Mata et al. [48] and Jae Yon et al.[42] reported that microwave oven method is one of the simpler and powerfulmethods among autoclaving, osmotic shock and bead beating for microalgal cellexplosion. The general criteria for selection of harvesting and disruption methods
162 R. Katiyar et al.
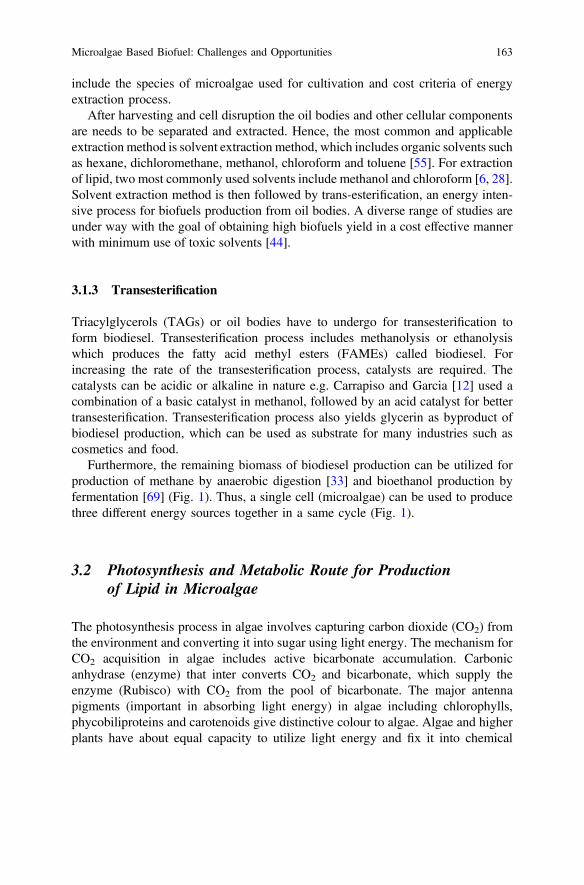
include the species of microalgae used for cultivation and cost criteria of energyextraction process.
After harvesting and cell disruption the oil bodies and other cellular componentsare needs to be separated and extracted. Hence, the most common and applicableextraction method is solvent extraction method, which includes organic solvents suchas hexane, dichloromethane, methanol, chloroform and toluene [55]. For extractionof lipid, two most commonly used solvents include methanol and chloroform [6, 28].Solvent extraction method is then followed by trans-esterification, an energy inten-sive process for biofuels production from oil bodies. A diverse range of studies areunder way with the goal of obtaining high biofuels yield in a cost effective mannerwith minimum use of toxic solvents [44].
3.1.3 Transesterification
Triacylglycerols (TAGs) or oil bodies have to undergo for transesterification toform biodiesel. Transesterification process includes methanolysis or ethanolysiswhich produces the fatty acid methyl esters (FAMEs) called biodiesel. Forincreasing the rate of the transesterification process, catalysts are required. Thecatalysts can be acidic or alkaline in nature e.g. Carrapiso and Garcia [12] used acombination of a basic catalyst in methanol, followed by an acid catalyst for bettertransesterification. Transesterification process also yields glycerin as byproduct ofbiodiesel production, which can be used as substrate for many industries such ascosmetics and food.
Furthermore, the remaining biomass of biodiesel production can be utilized forproduction of methane by anaerobic digestion [33] and bioethanol production byfermentation [69] (Fig. 1). Thus, a single cell (microalgae) can be used to producethree different energy sources together in a same cycle (Fig. 1).
3.2 Photosynthesis and Metabolic Route for Productionof Lipid in Microalgae
The photosynthesis process in algae involves capturing carbon dioxide (CO2) fromthe environment and converting it into sugar using light energy. The mechanism forCO2 acquisition in algae includes active bicarbonate accumulation. Carbonicanhydrase (enzyme) that inter converts CO2 and bicarbonate, which supply theenzyme (Rubisco) with CO2 from the pool of bicarbonate. The major antennapigments (important in absorbing light energy) in algae including chlorophylls,phycobiliproteins and carotenoids give distinctive colour to algae. Algae and higherplants have about equal capacity to utilize light energy and fix it into chemical
Microalgae Based Biofuel: Challenges and Opportunities 163

energy by photosysnthesis. Algae and plants can convert as much as 20% ofphotosynthetically active radiation [PAR * visible light] at very low light inten-sity, while at full light intensity the conversion in plants and algae is reduced to 2–3% of PAR [7]. Algal photosynthesis can be stimulated with increase in nutrients(N, P and Fe) availability and through metabolic engineering. Increase in photo-sysnthesis of algae causes sequestration of more CO2 from the environment. Algaecan grow faster and are capable of converting solar energy into chemical energy,which is mainly in the form of lipids (triacylglycerols), know as oil bodies.
In lipid synthesis pathway, microalgae use CO2 to produce acetyl-CoA (coen-zyme A) by more than one pathway. Acetyl-CoA acts as the initiator in the fattyacid (FA) synthetic pathway, which takes place in chloroplast genome. FAs arebasic units of many cellular lipids including triacylglycerols (TAGs) commonlycalled as oil bodies. In FA synthetic pathway, a multifunctional enzyme complex(acetyl-CoA carboxylase) plays an important role by producing malonyl-CoA fromacetyl-CoA and bicarbonate. Finally, these FA moieties enter into the endoplasmicreticulum (ER) for glycerolipid synthesis. TAGs synthesis in microalgae varies dueto alteration in acetyl-CoA carboxylase (ACCase) activity participated in TAGssynthesis pathway [39]. In further steps, TAGs are formed by the sequential acy-lation of glycerol-3-phosphate (G3P) backbone with three acyl-Co-A, in ER. TheTAGs accumulated in a specific domain of ER, which buds out from the ERforming distinct cellular organelles.
Depending upon the species of microalgae the TAGs content yield may vary.Microalgae may yield high TAGs amount due to its high surface/volume ratio incontrast to other energy crops. This ratio leads to more nutrients uptake rate andenhances acquisition of desired product such as lipid/TAGs for biodiesel produc-tion. Additionally, this ratio also provides microalgae to tolerate the environmentalstresses, which make them an attractive alternative for energy extraction than otherterrestrial plants.
3.3 Benefits of Using Microalgae as Biofuel Source
3.3.1 Oil Content of Microalgae
Microalgae have carbon fixation ability to converts solar energy into chemicalenergy [72] in the form energy rich compounds such as carbohydrates, protein andlipids. Further, these compounds are converted into value-added products e.g. lipidgets converted into oil or biodiesel; carbohydrate into bioethanol or acetone butanoland protein into fertilizers and manure. Microalgae can yield up to 300 times moreoil (lipid content) per acre than other cropping species [59] such as soybeans,coconut, rapeseed or jatrophaetc [16, 66] (Table 2).
164 R. Katiyar et al.

3.3.2 Other Products of Microalgae
Microalgae have capability to produce more than 15,000 novel products which cansupplement raw materials for other industries [62, 79]. One of the known andessential metabolic product of microalgae is PUFA (poly unsaturated fatty acids),an essential fatty acid of human diet [11], e.g. PUFA content of Cadophora fractahas been reported about 51% which is mainly used in aquacultures [23]. Othernovel products of microalgae are listed in Table 3.
Table 3 Products of microalgae with their applications
Serial no. Other products ofmicroalgae
Applications
1. Caretenoide Rich source of pro-vitamin A [84]
2. Phycocolloids Having antitumor, anticoagulant, antioxidant capability[50]
3. Lectins Carbohydrates binding proteins [3]
4. Terpens and latexes Pharmacological activities [21, 22, 65]
5 PUFA (polyunsaturated fattyacids)
Food industry as food supplement [11]
6 Polyketides Used as chemotherapeutic agents in pharmaceuticals forsynthesis of many antibiotics such as tetracycline [26]
Table 2 Oil content of microalgae and other crops (Adapted from [24])
Serial no. Species of microalgae Oil content (% dry weight) Reference
1. Botryococcus braunii 29–75 [5, 51]
2. Chlorella sp. 29 [75]
3. Thalassiosira pseudonana 21–31 [9]
4. Schizochytrium sp. 50–77 [81]
5. Heterotrophic C. protothecoides 57.9 [52]
6. Chlorella sorokiniana 22 [46]
7. Nitzchia sp. 45–47 [15]
8. Cylindrotheca sp. 16–37 [67]
9. C. marina 70.00 [67]
Other crops
10. Jatropha 62.20 [67]
11. Coconut 57.40 [67]
12. Soyabean 9.40–37.80 [67]
Microalgae Based Biofuel: Challenges and Opportunities 165

3.3.3 Use of Low Cost Feed Stocks for Cultivation of Microalgaefor Biodiesel Production
In order to produce biodiesel/oil from microalgae, it is essential to enhance lipidproduction. The oil content of microalgae can be enhanced with application oforganic carbon sources in growth media as a result of which cells exhibit mixotrophicor heterotrophic growth patterns. Micro-algal cultivation in mixotrophic and het-erotrophic modes gives better result in terms of lipid and biomass [4] (Table 4). Thewide availability of lipid extracted algal biomass, orange peel extract, waste frommunicipal and dairy industry makes them low cost organic carbon rich feed stocksfor cultivation of microalgae (Table 5), e.g. lipid extracted algal biomass accounts forapproximately 70% of cell dry weight rich in protein and carbohydrates [64].
Table 4 Productivity and lipid content of different micro algal species under different cultivationconditions
Microalgaespecies
Mode ofgrowth
Biomassproductivity(mg/L/day)
Lipidproductivity(mg/L/day)
Lipidcontent(%)
References
BotryococcusbrauniiUTEX 572
Phototrophic 30 5.5 20.8 [89]
Chlorellaprotothecoides
Heterotrophic 4000 1881.3–1840.0
43.0–46.0
[14]
Chlorellavulgaris#259
Heterotrophic 80–150 27.0–35.0 23.0–36.0
[45]
Chlorellavulgaris#259
Mixotrophic 90–250 22.0–54.0 21.0–34.0
[45]
Scenedesmusobliquus
Mixotrophic 100–510 11.6–58.6 6.6–11.8
[49]
SpirulinamaximaLB 2342
Phototrophic 210 8.6 4.1 [30]
Scenedesmusobliquus
Phototrophic 60 7.14 12.7 [49]
Table 5 Low cost feed stocks for microalgae cultivation in terms of high biomass and lipidproductivity for more biodiesel production
Microalgaespecies
Feedstocks Biomassproductivity(mg/L/day)
Lipidproductivity(mg/L/day)
References
C. vulgaris Enzymatic hydrolysed lipidextracted algal biomass
164 116 [91]
C. vulgaris Dairy industrial waste 750 253 [1]
C. minutissima Wastewater 800 57 [47]
C. vulgaris Orange peel extract 183.33 22.7 [58]
166 R. Katiyar et al.

3.3.4 Use of Waste Water for Cultivation of Microalgae
The use of water in industries and agriculture releases number of organic and inor-ganic substances which leads water pollution that has been aggravating continuously.Wastewater produced from dairy plants, domestic households, paper mills andsewage has high source of nutrients. The carbon in these wastewater is in the form ofreducing and non reducing sugars, organic and inorganic forms of nitrogen andphosphorous [2, 76]. Microalgae have the capability to utilize both organic andinorganic forms of nitrogen, carbon and phosphorus for their growth [38, 88]. Theremoval of various pollutants from wastewater depend on the species of microalgaebeing employed e.g. C. debaryana removes 53% of total phosphate and 88% of totalnitrogen from swine waste water [36]; Scenedesmus sp. removes 98% of totalnitrogen and phosphate from secondary effluent [88]. Consequently, microalgae treatthis wastewater while producing their biomass (by mixotrophic growth) used forbiofuel production (Table 6). Because of these benefits, microalgae make it fantasticalternative among other existing species for biofuel production using waste water.Waste utilizing capability of microalgae reduces the cost of dispose of waste waterand energy inputs for its treatment. Furthermore, utilization of waste water for cul-tivation of microalgae preserves water resource in the environment.
3.3.5 Land Requirement by Microalgae for Their Cultivation
Another problem associated with the production of biofuel from existing energycrops (food and non food crops) is continuous shrinkage of cultivable land [26] andits quality, which can pose an immediate problem for food security on earth. Thedata from India shows that as many as 20 states have reported a decrease incultivable land to the extent of 790,000 ha in 4 years from 2007–08 to 2010–11,mainly attributable to diversion of land to non agricultural purposes [54]. The use ofarable land to grow the crop is the major drawback associated with the use of firstand second generation biofuels generating resources e.g. U.S.A. has consumedabout 220 trillion liters of diesel in 2010. To replace this volume of alternative fuel
Table 6 Biomass productivity of different micro algal species in different waste source
Species Type of WW Biomass productivity (mg/L/day) References
C. vulgaris Municipal WW 138 [27]
C. minutissima Wastewater 800 [47]
C. vulgaris Orange peel extract 183.33 [58]
Microalgae Based Biofuel: Challenges and Opportunities 167

from soybean may require 367 Mha (million hectares) arable land while 178 Mha(million hectares) land is only available for cropping out of 930 Mha total land areaof U.S.A. [85]. Microalgae based biofuels have thus emerged as a partial solution tothese problems [17, 78] (Table 7) because, as stated earlier, it does not competewith food crops and can be grown on land which is not suitable for crops, forinstance, arid land, land with excessively saline soil, and drought stricken land.Moreover, the soil fertility also increases after cultivation of microalgae.
3.3.6 Carbon Neutral Process of Microalgae
Carbon neutral means zero increase in amount of carbon in the atmosphere fromcarbon based fuel combustion. When carbon based fuels burn, the carbon moleculeof the fuel combines with oxygen molecule present in the environment which formsCO2. As CO2 generated in the fuel combustion is not a part of the natural carboncycle, it enters in the atmosphere and increase net amount of CO2. Microalgae showcarbons neutral processes because the amount of carbon generated in the fuelcombustion is utilized by new algae grow, resulting net zero emission (Fig. 2).Inorganic carbon in the form of CO2 serves as food for microalgae to performphotosynthesis to build their biomass. Algae can also be considered as a marine andfreshwater plant bodies that have higher photosynthetic efficiencies and carboncapturing than terrestrial plants [56]. Microalgae require more fossil-based carbonto produce the same amount of bioenergy as other crops [18] (Fig. 2).
3.3.7 Cost Effectiveness of Using Microalgae
Using microalgae has its own cost and benefits. Before the production of biofuel isscaled up, the important aspects to be considered are type of cultivation system andmode, net energy input and output, environmental impacts, and economical analysis.The selection of type of cultivation method and mode for algal cultivation depends onspecies of microalgae used for biofuel production. Also, after extraction of biodieselform microalgae, the oil biomass extract can be utilized for production of methane byanaerobic digestion [33] and bioethanol production by fermentation [69] (Fig. 1), asecondary source of energy leading to cost cutting and efficient use of resources.Moreover the recycling of nutrient utilized in cultivation of microalgae can improve
Table 7 Oil yield and required land area for microalgae and other crops (Adapted from [71])
Source Yield of oil (L/ha)
Corn 172
Jatropha 1892
Microalgae (40% oil (% dry wt) in biomass) 70,405
Microalgae (20% oil (% dry wt) in biomass) 35,202
Rapeseed 1190
168 R. Katiyar et al.

economic feasibility for oil extraction process. Crude glycerol, a by-product of algalbiodiesel production can be utilized as substrate or organic carbon source for algae toproduce more biodiesel. Glycerol, another by-product of the process, can also be usedas substrate for production of acetone butanol or bioethnol (Fig. 1), another sec-ondary source of energy. Hence, the use of microalgae based biofuels is cost effectiveby designing low cost reactors, recycling of nutrients and use of bio-products fordifferent purposes. Moreover, the solvents such as chloroform, methanol and hexaneutilized in extraction of biofuel can be extracted in rotary evaporator at 80 °C for itsutilization in next cycle provides cost cutting results [44].
4 Drawbacks and Challenges of Utilizing Microalgaefor Biofuel Production
Despite all the advantages discussed above, the process of biofuel production frommicroalgae has its drawbacks and challenges associated, as discussed below:
• For commercialization, it is necessary to scale up the process of biofuel pro-duction from microalgae. The scaling up would require large space and fertil-izers, e.g. Buchele and Zimba [10] have stated in their report that 3000 L ofwater is required for production of at least 1 L of biofuel using microalgae when
Fig. 2 Carbon neutral process of microalgae
Microalgae Based Biofuel: Challenges and Opportunities 169

grown in arid soil. To overcome this issue many scientific communities areusing waste water, salt water and brackish water for cultivation of microalgaewithout disturbing the fresh water balance in the environment.
• Commercially, biofuel production from microalgae is not viable presently as thecost of different algal species are normally in the range of $5–10 per kilogram[35].
• Glycerin is the co-product of biodiesel production which requires separation andpurification for its utilization in feed industry. The glycerine and biodiesel isproduced in the ratio of about 1:10 by the transesterification process [82]. Theseparation of glycerin can be done by using different techniques such as dis-tillation units and membrane separation techniques [74]. Production of biodieselcould be economical but combination of downstream processes for purificationof end products may increase the overall production cost. Hence, the econom-ically feasibility of the purification processes is challenging.
• Microalgae require controlled temperature conditions for high yield in terms ofbiofuel.
• The genetic engineering approach used to improve photosynthetic efficiency[87], enhance biomass production rate, alteration in transcriptional factors linkedup with the enzymes involved in TAG synthesis pathway, further escalates thecost of biofuel production using microalgae.
• Microalgae require phosphorous as a fertilizer which has detrimental effects onhuman health.
• Another problem associated with algal cultivation for biofuel generation in opensystem is contamination from unwanted microorganisms. To resolve theseissues many researchers are continuously trying to design inexpensivephoto-bioreactors for cultivation of algae. Bioreactors have proved to be themost effective systems that produce high quality algae.
5 Conclusions and Future Outlook
Microalgae based biofuel can contribute towards the useful solutions for existingglobal problems like fossil fuel shortage and hazardous emission resulting fromfossil fuel combustion. Microalgae utilize solar energy and capture CO2 which isconverted into different variety of biofuels such as bioethanol and biodiesel throughphotosynthesis. Microalgae are robust microorganisms capable of fast growth underwide range of conditions including high alkalinity and extreme of temperature andpH range. Furthermore, microalgae have ability to produce high biofuel undermodified growth conditions or metabolic engineering. Hence, microalgae offerpromising results in the production of biofuel due to its potential to utilize wasteland, waste water and low feed stock. However, a large extent of research is stillrequired before the realistic production of biofuels using microalgae due touncertainties in behavior of various species of microalgae species and lack of cost
170 R. Katiyar et al.

effective harvesting, disruption, oil extraction and biodiesel conversion strategies.Thus, these recent challenges are encouraging scientific communities to take upresearch in various domains of biofuel production on large scale using microalgae.The overview of microalgae as a source for energy and useful byproducts presentedin this study shows that microalgae are able to not only produce biofuel in veryefficient manner but also to generate numerous biorefinery products, whichincreases the overall cost effectiveness of its production process. The biorefineryproducts of microalgae can be used in number of industries including automotive,pharmaceutical, feed industry, energy and chemical. The rapid urbanization andindustrialization is exerting pressure on land resources in developing countriesincluding India, in contrast the production of biofuels from microalgae do notcompete for land and water resources. Moreover, microalgae offer sustainableresults in terms of almost zero carbon to the environment than through conventionalenergy crops. Thus, besides meeting the energy demand through efficient biofuelproduction, microalgae can also enhance the human developmental index throughproviding nutrition, health, jobs and overall socio-economic welfare.
Acknowledgements The authors thank the Ministry of Human Resources and Development,New Delhi for providing funds for the research and Indian Institute of Technology, Roorkee forproviding resources and platform for this study.
References
1. Abreu AP, Fernandes B, Vicente AA, Teixeira J, Dragone G (2012) Mixotrophic cultivationof Chlorella vulgaris using industrial dairy waste as organic carbon source. Bioresour Technol118:61–66
2. Amini M, Younesi H, Zinatizadeh Lorestani AA, Najafpour G (2013) Determination ofoptimum conditions for dairy wastewater treatment in UAASB reactor for removal ofnutrients. Bioresour Technol 145:71–79
3. Andrade LR, Salgado LT, Farina M, Pereira MS, Mourao PAS, Amado-Filho GM (2004)Ultrastructure of acidic polysaccharides from the cell walls of brown algae. J Struct Biol145:216–225
4. Arora N, Patel A, Pruthi PA, Pruthi V (2016) Boosting TAG accumulation with improvedbiodiesel production from novel oleaginous microalgae Scenedesmus sp. IITRIND2 utilizingwaste sugarcane bagasse aqueous extract (SBAE). Appl Biochem Biotechnol (Accepted)
5. Banerjee A, Sharma R, Chisti Y, Banerjee UC (2002) Botryococcusbraunii: a renewablesource of hydrocarbons and other chemicals. J Crit Rev Biotechnol 22:245–279
6. Bligh EG, Dyer WJ (1959) A rapid method of total lipid extraction and purification. BiochemPhysiol 8:911–917
7. Benemann J (2012) Photosynthetic efficiency and biomass productivity of microalgae masscultures John Benemann. Algae biomass summit, San Diego, CA, pp 1–29. http://algaebiomass.org/wp-content/gallery/2012-algae-biomass-summit/2010/06/T1_Wed_1030_JBenemann.pdf.Accessed 08 Nov 2016
8. Brennan L, Owende P (2010) Biofuels from microalgae: a review of technologies forproduction, processing, and extractions of biofuels and co-products. Renew Sustain EnergyRev 14:557–577
Microalgae Based Biofuel: Challenges and Opportunities 171

9. Brown MR, Dunstan GA, Norwood SJ, Miller KA (1996) Effects of harvested stage and lighton the biochemical composition of the diatom Thalassiosira pseudonana. J Phycol 32:64–73
10. Buchele M, Zimba P (2012) A report on—the downside of using algae as a biofuel.University of Texas
11. Cardozo KH, Guaratini T, Barros MP, Falcao VR, Tonon AP, Lopesm NP (2007) Metabolitesfrom algae with economical impact. J Compar Biochem Physiol C Toxicol Pharmacol146:60–78
12. Carrapiso AI, Garcıa C (2000) Development in lipid analysis: some new extraction techniquesand in situ transesterification. Lipids 11:1167–1177
13. Cesar ADS, Batalha MO (2010) Biodiesel production from castor oil in Brazil: a difficultreality. Energy Policy 38:4031–4039
14. Cheng Y, Zhou WG, Gao CF, Lan K, Gao Y, Wu QY (2009) Biodiesel production fromJerusalem artichoke (Helianthus Tuberosus L.) tuber by heterotrophic microalgae Chlorellaprotothecoides. J Chem Technol Biotechnol 84:777–781
15. Christi Y (2007) Biodiesel from microalgae. J Biotechnol Adv 25:294–30616. Chisti Y (2008) Response to reijnders: do biofuels from microalgae beat biofuels from
terrestrial plants. Trends Biotechnol 26(7):351–35217. Chisti Y (2008) Do biofuels from microalgae beat biofuels from terrestrial plants. Trends
Biotechnol 26(7):351–35218. Clarens AF, Resurreccion EP, White MA, Colosi LM (2010) Environmental life cycle
comparison of algae to other bioenergy feedstocks. Environ Sci Technol 44:1813–181919. Das P, Aziz SS, Obbard JP (2011) Two phase microalgae growth in the open system for
enhanced lipid productivity. Renew Energy 36:2524–252820. Das P, Lei W, Aziz SS, Obbard JP (2011) Enhanced algae growth in both phototrophic and
mixotrophic culture under blue light. Bioresour Technol 102:3883–388721. Dembitsky VM, Srebnik M (2002) Natural halogenated fatty acids: their analogues and
derivatives. J Progress Lipid Res 41:315–36722. Demirbas A (2009) Progress and recent trends in biodiesel fuels. J Energy Convers Manag
50:14–3423. Demirbas A, Demirbas MF (2010) Biodiesel from algae. In: Algae energy book, chapter 6,
pp 139–15724. Demirbas A, Demirbas MF (2011) Importance of algae oil as a source of biodiesel. Energy
Convers Manag 52:163–17025. Dos Santos MD, Guaratini T, Lopes JLC, Colepicolo P, Lopes NP (2005) Plant cell and
microalgae culture. In: Modern biotechnology in medicinal chemistry and industry. Researchsignpost, Kerala, India
26. Duncan GR (2011) Beyond food versus fuel. Nature 474:6–827. Ebrahimian A, Kariminia HR, Vosoughi M (2014) Lipid production in mixotrophic
cultivation of Chlorella vulgaris in a mixture of primary and secondary municipal wastewater.Renewable Energy 71:502–508
28. Folch J, Lees M Sloane, Stanley GH (1957) A simple method for the isolation and purificationof total lipids from animal tissues. Biol Chem 226:497–509
29. Gahukar RT (2012) New sources of feed stocks for biofuels production: Indian perspectives.Petroleum Technol Altern Fuels 3(3):24–28
30. Gouveia L, Oliveira AC (2009) Microalgae as a raw material for biofuels production. J IndMicrobiol Biotechnol 36:269–274
31. Greenwell HC, Laurens LML, Shields RJ, Lovitt RW, Flynn KJ (2010) Placing microalgae onthe biofuels priority list: a review of the technological challenges. J R Soc Interface7(46):703–726
32. Grobbelaar JU (2000) Physiological and technological considerations for optimising massalgal cultures. J Appl Phycol 12(3–5):201–206
33. Gunaseelan NV (1997) Anaerobic digestion of biomass for methane production: a review.Biomass Bioenergy 13(1–2):83–114
172 R. Katiyar et al.

34. Gustavo BL, Abdelaziz EMA, Hallenbeck CP (2013) Algal biofuels: challenges andopportunities. Bioresour Technol 145:134–141
35. Haluzan N (2010) Biofuels from algae advantages and disadvantages. http://www.renewablesinfo.com/drawbacks_and_benefits/biofuels_from_algae_advantages_and_disadvantages.html. Accessed 05 Nov 2016
36. Hasan R (2014) Bioremediation of swine wastewater and biofuel potential by using Chlorellavulgaris, Chlamydomonas reinhardtii, and Chlamydomonas debaryana. J Petroleum EnvironBiotechnol 5(3):175–180
37. Hashemi NM, Tabatabaei M, Mansourpanah Y, Khatami FM, Javani A (2011) Upstream anddownstream strategies to economize biodiesel production. Bioresour Technol 102:461–468
38. Hena S, Fatimah S, Tabassum S (2015) Cultivation of algae consortium in a dairy farmwastewater for biodiesel production. Water Resour Indus 10:1–14
39. Hildebrand M, Davis AK, Smith RS, Traller CJ, Abbriano R (2012) A review: the place ofdiatoms in the biofuels industry. Biofuels 3:221–240
40. Hoekema S, Douma RD, Janssen M, Tramper J, Wijffles RH (2002) A pneumatically agitatedflat panel photo bioreactor with gas recirculation: anaerobic photohetrotrophic cultivation of apurple non sulfur bacterium. Int J Hydrogen Energy 27:1228–1331
41. Jadhav CS (2009) Demand for biodiesel will see a steady rise. Biospectrum 54–5542. Jae-Yon L, Chan Y, So-Young J, Chi-Yong A, Hee-Mock O (2010) Comparison of several
methods for effective lipid extraction from microalgae. Bioresour Technol 101:S75–S7743. Karen M, Dougall M, McNichol J, McGinn JP, O’Leary SJB, Melanson JE (2011)
Triacylglycerol profiling of microalgae strains for Biofuel feedstock by liquidchromatography–high-resolution mass spectrometry. J Bioanal Chem 401:2609–2616
44. Katiyar R, Gurjar BR, Biswas S, Pruthi V, Kumar N, Kumar P (2016) Microalgae: anemerging source of energy based bio-products and a solution for environmental issues. RenewSustain Energy Rev (accepted)
45. Liang YN, Sarkany N, Cui Y (2009) Biomass and lipid productivities of Chlorella vulgarisunder autotrophic, heterotrophic and mixotrophic growth conditions. Biotechnol Lett31:1043–1049
46. Li Q, Du W, Liu D (2008) Perspectives of microbial oils for biodiesel production. J ApplMicrobiol Biotechnol 80:749–756
47. Malla FA, Khan SA, Sharma R, Gupta GK, Abraham G (2015) Phycoremediation potential ofChlorella minutissima on primary and tertiary treated wastewater for nutrient removal andbiodiesel production. Ecol Eng 75:343–349
48. Mata Teresa M, Antonio Martins A, Nidia Caetano S (2010) A review: microalgae forbiodiesel production and other applications. Renew Sustain Energy Rev 14:217–232
49. Mandal S, Mallick N (2009) Microalga Scenedesmusobliquus as a potential source forbiodiesel production. J Appl Microbiol Biotechnol 84:281–291
50. Mayer AMS, Lehmann VKB (2001) Marine pharmacology in 1999: antitumor and cytotoxiccompounds. J Anticancer Res 21:2489–2500
51. Metzger P, Largeau C (2005) Botryococcus braunii: a rich source for hydrocarbons andrelated ether lipids. J Appl Microbiol Biotechnol 66:486–496
52. Miao XL, Wu QY (2004) High yield bio-oil production from fast pyrolysis by metaboliccontrolling of Chlorella protothecoides. J Biotechnol 110:85–93
53. Moazami N, Ashori A, Ranjbar R, Tangestani M, Eghtesadi R, Nejad AS (2012) Large-scalebiodiesel production using microalgae biomass of nannochloropsis. Biomass Bioenergy39:449–453
54. Mohan V (2013) Cultivable land continues to shrink, The Times of India. Aug 16, 2013, p 755. Mubaraka M, Shaijaa A, Suchithrab TV (2015) A review—the extraction of lipid from
microalgae for biodiesel production. Algal Res 7:117–12356. Packer M (2009) Algal capture of carbon dioxide; biomass generation as a tool for greenhouse
gas mitigation with reference to New Zealand energy strategy and policy. Energy Policy 37(9):3428–3437
57. Pandey A, Lee JD, Chisti Y (2014) Biofuel from algae, chapter-8, algae oils as fuel, pp 1–4
Microalgae Based Biofuel: Challenges and Opportunities 173

58. Park WK, Moon M, Kwak MS, Jeon S, Choi GG, Yang JW, Lee B (2014) Use of orange peelextract for mixotrophic cultivation of Chlorella vulgaris increased production of biomass andFAMEs. Bioresour Technol 171:343–349
59. Peng W, Wu Q, Tu P (2001) Pyrolytic characteristics of heterotrophic Chlorellaprotothecoides for renewable bio-fuel production. J Appl Phycol 13:5–12
60. Pirt SJ, Tansley (1986) A review (4) the thermodynamic efficiency (quantum demand) anddynamics of photosynthetic growth. J New Phytol 102:3–37
61. Pragyaa N, Pandeya KK, Sahoo PK (2013) A review on harvesting, oil extraction and biofuelsproduction technologies from microalgae. Renew Sustain Energy Rev 24:159–171
62. Qiang H, Sommerfeld M, Jarvis E, Ghirardi M, Posewitz M, Seibert M, Darzins A (2008)Microalgal triacylglycerols as feedstocks for biofuel production: perspectives and advances.Plant J 54:621–639
63. Ramos de Ortega A, Roux JC (1986) Production of Chlorella biomass in different types ofFlat bioreactor in temperate zones. Biomass 10:141–156
64. Rashid N, Rehman MSU, Han JI (2013) Recycling and reuse of spent microalgal biomass forsustainable biofuels. Biochem Eng J 75:101–107
65. Rawat I, Ranjith R, Mutanda T, Bux F (2011) Dual role of microalgae: phycoremediation ofdomestic wastewater and biomass production for sustainable biofuels production. J ApplEnergy 88:3411–3424
66. Reijnders L (2008) Do biofuels from microalgae beat biofuels from terrestrial plants? TrendsBiotechnol 26(7):349–350
67. Rekha V, Gurusami R, Santhanam P, ShenbagaDevi A, Ananth S (2012) Culture and biofuelproduction efficiency of Marine Microalgae Chlorella Marina and Skeletonema costatum.Ind J Geo-Marine Sci 41(2):152–158
68. Rodolphi L, Zittelli GC, Bassi N, Padovani G, Biondi N, Bonini G, Tredici MR (2009)Microalgae for oil: strain selection, induction of lipid synthesis and outdoor mass cultivationin a low-cost photobioreactor. J Biotechnol Bioeng 102:100–112
69. Rojan P, Johna GS, Anishab K, Nampoothiric M, Pandey A (2011) Micro and macroalgalbiomass: a renewable source for bioethanol. Bioresour Technol 102(1):186–193
70. Samson R, Leduy A (1985) A multistage continuos cultivation of blue green alga Spirulinamaxima in the flat photobioreactor. J Chem Eng 63:105–112
71. Satyanarayana KG, Mariano AB, Vargas JVC (2011) A review: microalgae, a versatile sourcefor sustainable energy and materials. J Integrated Energy Res 35:291–311
72. Schenk MP, Skye R, Hall T, Stephens E, Marx UC, Mussgnug JH, Posten C, Kruse O,Hankamer B (2008) Second generation biofuels—high-efficiency microalgae for biodieselproduction. J Bioenergy Res 1:20–43
73. Scott SA, Davey MP, Dennis JS, Horst I, Howe CJ, LeaSmith DJ, Smith AG (2010) Biodieselfrom algae: challenges and prospects. J Curr Opinion Biotechnol 21:277–286
74. Sdrula N (2010) A study using classical or membrane separation in the biodiesel process.Desalination 250:1070–1072
75. Sheehan J, Dunahay T, Benemann J, Roessler P (1998) A look back at the US Department ofEnergy’s Aquatic Species Program—biodiesel from algae. National Renewable EnergyLaboratory (NREL) report: NREL/TP-580-24190, Golden, CO
76. Shen QH, Jiang JW, Chen LP, Cheng LH, Xu XH, Chen HL (2015) Effect of carbon sourceon biomass growth and nutrients removal of Scenedesmusobliquus for wastewater advancedtreatment and lipid production. Bioresour Technol 190:257–263
77. Sherif SA, Goswami YD, Stefanakos KE, Steinfeld A (2014) A Hand book of hydrogenenergy, p 337
78. Singh A, Nigam PS, Murphy JD (2011) Renewable fuels from algae: an answer to debatableland based fuels. Bioresour Technol 102:10–16
79. Spolaore P, Joannis-Cassan C, Duran E, Isambert A (2006) Commercial applications ofmicroalgae. J Biosci Bioeng 101(2):87–96
80. Suali E, Sarbatly R (2012) Conversion of microalgae to biofuel. Renew Sustain Energy Rev16:4316–4342
174 R. Katiyar et al.

81. Subramaniam R, Dufreche S, Zappi M, Bajpai R (2010) Microbial lipids from renewableresources: production and characterization. J Indus Microbiol Biotechnol 37:1271–1287
82. Sun F, Chen H (2008) Organosolv pretreatment by crude glycerol from oleochemicalsindustry for enzymatic hydrolysis of wheat straw. Bioresour Technol 99:5474–5479
83. Tabatabaei M, Masoud T, Salehi JG, Mohammadreza S, Mohammad P (2011) Biodieselproduction from genetically engineered microalgae: future of bioenergy in Iran. RenewSustain Energy Rev 15:1918–1927
84. Tapiero H, Townsend DM, Tew KD (2004) The role of carotenoids in the prevention ofhuman pathologies. J Biomed Pharmacol 58:100–110
85. USEIA (2012) Annual energy outlook. US Energy Information Administration. http://www.eia.gov/forecasts/aeo/pdf/0383(2012).pdf
86. Verbruggen A, Mohamed Marchohi, Marchohi Mohamed Al (2010) Views on peak oil and itsrelation to climate change policy. J Energy Policy 38:5572–5581
87. Victoria HW, Sarah DA, Radakovits R, Jinkerson RE, Posewitz MC (2012) Improvingphotosynthesis and metabolic networks for the competitive production of phototroph-derivedbiofuels. Curr Opin Biotechnol 23:290–297
88. Xin L, Hong-ying H, Ke G, Ying-xue S (2010) Effects of different nitrogen and phosphorusconcentrations on the growth, nutrient uptake, and lipid accumulation of a freshwatermicroalga Scenedesmus sp. Bioresour Technol 101:5494–5500
89. Yoo C, Jun SY, Lee JY, Ahn CY, Oh HM (2010) Selection of microalgae for lipid productionunder high levels carbon dioxide. Bioresour Technol 101:S71–S74
90. Young LC, Kyubock L, You-Kwan O (2015) A review-Recent nanoparticle engineeringadvances in microalgal cultivation and harvesting processes of biodiesel production.Bioresour Technol 184:63–72
91. Zheng H, Gao Z, Yin F, Ji X, Huang H (2012) Lipid production of Chlorella vulgaris fromlipid extracted microalgal biomass residues through two-step enzymatic hydrolysis. BioresourTechnol 117:1–6
Microalgae Based Biofuel: Challenges and Opportunities 175

Surrogates for Biodiesel: Reviewand Challenges
Aditya Dilip Lele, Krishnasamy Anand and Krithika Narayanaswamy
Abstract Biodiesel is being considered as a renewable fuel candidate to com-pletely or partially replace fossil diesel. Understanding its combustion is key toassess its applicability in practical compression ignition engines. Significant pro-gress has been made in understanding biodiesel combustion through experimentalstudies, development of reaction kinetics to describe its oxidation, and simulationsin typical engine environments. The use of surrogates in place of the real biodieselsplays a crucial role in this endeavour. This chapter reviews the existing studiesrevolving around surrogate fuels for biodiesels. Thereafter, the challenges ahead inthis context to further enhance our knowledge of biodiesel combustion are pre-sented, and possible options to address these are discussed where appropriate.
Keywords Biodiesel � Surrogate � Chemical kinetics � ChallengesList of Abbreviations
MB Methyl butanoateMB2D Methyl crotonateMD Methyl decanoateMD5D Methyl-5-decanoateMD9D Methyl-9-decanoatenC7 n-heptaneCN Cetane numberNTC Negative temperature coefficientLHV Lower heating valueCFPP Cold filter plugging pointJSR Jet stirred reactorRME Rapeseed methyl esterPME Palm methyl esterHCCI Homogeneous charge compression ignitionNOx Nitrogen oxides
A.D. Lele � K. Anand � K. Narayanaswamy (&)Department of Mechanical Engineering, Indian Institute of Technology Madras, Chennai, Indiae-mail: [email protected]
© Springer Nature Singapore Pte Ltd. 2017A.K. Agarwal et al. (eds.), Biofuels, Green Energy and Technology,DOI 10.1007/978-981-10-3791-7_10
177

1 Introduction
In the wake of depleting fossil fuel resources, the use of renewable and alternatefuels has gathered momentum. Biodiesel is one such fuel, which has shown thepotential to partially or completely substitute diesel fuel [1]. Biodiesel is typicallyderived from plant oil or animal fat using trans-esterification [2]. Existing enginedesign and operating strategies have evolved with fossil fuels as the principal focus.The use of biodiesel in compression ignition (CI) engines requires no major enginemodifications, and therefore makes it an attractive replacement for diesel fuel [3].To assess and quantify the use of these alternative fuels in practical engines,understand their combustion behavior, reactivity, and emission characteristics usingcomputations, it is important to incorporate finite rate chemistry in these studies.
In the case of fossil derived fuels, which are a mixture of several hundreds ofspecies belonging to different hydrocarbon classes, a reaction mechanism thatdescribes the oxidation of the complex mixture is impractical. Therefore, in com-putational studies, the notion of using a representative simpler surrogate fuel inplace of the real fuel, which reproduces certain target properties of the real fuel isthe practical way forward when dealing with fuels such as kerosene [4, 5], diesel [6,7], and gasoline [8]. On the contrary, most biodiesels, consist of only a few majorcomponents (4–6) as shown in Table 1, which permits detailed kinetic descriptionof the actual fuel. However, these components being long chain ester molecules,detailed kinetic mechanisms for the real biodiesel typically runs into severalthousands of species and reactions [9]. Since reactive flow computations of com-bustion dynamics in the engine scale are expensive, there is a severe restriction onthe size of chemical kinetic mechanism that can be coupled with the simulations. Tosimplify the kinetic description of biodiesel in computations, surrogates made ofsimpler well-studied molecules are used in place of the actual fuel, for whichaccurate and compact reaction mechanisms are proposed. In this short write-up, thefocus is to present a review of the existing work on surrogate fuels for biodieselsthat represent their gas phase combustion characteristics, kinetic model
Table 1 Chemical composition of biodiesels obtained from different sources [11]
Source Methylpalmitate(C16:0)
Methylstearate(C18:0)
Methyloleate(C18:1)
Methyllinoleate(C18:2)
Methyllinolenate(C18:3)
Soybean 11.3 3.6 24.9 53.0 6.1
Rapeseed 4.9 1.6 33 20.4 7.9
Animalfat
25.2 19.2 48.9 2.7 0.5
Canola 3.9 3.1 60.2 21.1 11.1
Lard 25.5 15.5 47.1 8.9 1.1
Karanja 11.1 2.9 60.6 16.9 0
Note that the amount of different components in a particular biodiesel will also vary depending onthe source of the fuel
178 A.D. Lele et al.
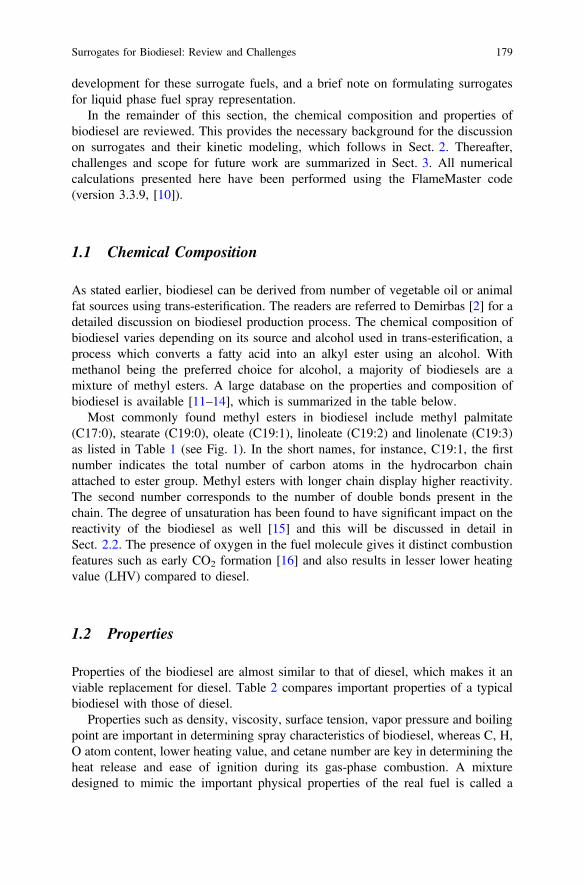
development for these surrogate fuels, and a brief note on formulating surrogatesfor liquid phase fuel spray representation.
In the remainder of this section, the chemical composition and properties ofbiodiesel are reviewed. This provides the necessary background for the discussionon surrogates and their kinetic modeling, which follows in Sect. 2. Thereafter,challenges and scope for future work are summarized in Sect. 3. All numericalcalculations presented here have been performed using the FlameMaster code(version 3.3.9, [10]).
1.1 Chemical Composition
As stated earlier, biodiesel can be derived from number of vegetable oil or animalfat sources using trans-esterification. The readers are referred to Demirbas [2] for adetailed discussion on biodiesel production process. The chemical composition ofbiodiesel varies depending on its source and alcohol used in trans-esterification, aprocess which converts a fatty acid into an alkyl ester using an alcohol. Withmethanol being the preferred choice for alcohol, a majority of biodiesels are amixture of methyl esters. A large database on the properties and composition ofbiodiesel is available [11–14], which is summarized in the table below.
Most commonly found methyl esters in biodiesel include methyl palmitate(C17:0), stearate (C19:0), oleate (C19:1), linoleate (C19:2) and linolenate (C19:3)as listed in Table 1 (see Fig. 1). In the short names, for instance, C19:1, the firstnumber indicates the total number of carbon atoms in the hydrocarbon chainattached to ester group. Methyl esters with longer chain display higher reactivity.The second number corresponds to the number of double bonds present in thechain. The degree of unsaturation has been found to have significant impact on thereactivity of the biodiesel as well [15] and this will be discussed in detail inSect. 2.2. The presence of oxygen in the fuel molecule gives it distinct combustionfeatures such as early CO2 formation [16] and also results in lesser lower heatingvalue (LHV) compared to diesel.
1.2 Properties
Properties of the biodiesel are almost similar to that of diesel, which makes it anviable replacement for diesel. Table 2 compares important properties of a typicalbiodiesel with those of diesel.
Properties such as density, viscosity, surface tension, vapor pressure and boilingpoint are important in determining spray characteristics of biodiesel, whereas C, H,O atom content, lower heating value, and cetane number are key in determining theheat release and ease of ignition during its gas-phase combustion. A mixturedesigned to mimic the important physical properties of the real fuel is called a
Surrogates for Biodiesel: Review and Challenges 179

physical surrogate, which can be different from a chemical surrogate, which isformulated to capture the gas-phase combustion targets [18]. The focus of thepresent discussion will primarily center around chemical surrogates.
Fig. 1 Chemical structures of commonly found methyl esters in biodiesels
Table 2 Comparison of biodiesel and diesel properties [17]
Properties Biodiesel Diesel
C, H O, wt% 77, 12, 11 84–87, 13–16, 0
Molecular weight 292 195
Density @ 20 °C (kg/L) 0.870–0.892 0.831
Viscosity @ 40 °C (mm2/s) 3.1–5.4 3
Boiling point °C 330–340 160–380
Lower heating value (MJ/kg) 37.4–40.1 42.6
Flash point °C 135–180 74
Stoichiometric A/F, (by wt) 13 14.7
Cetane number 42–61 >45
CFPP −11–12 17
180 A.D. Lele et al.

2 Surrogates for Biodiesels and Their Kinetic Modeling
The target application of the surrogate drives its selection for any fuel. In case ofbiodiesel, its application is mainly in compression ignition engines where it is usedas a neat fuel or in the form of blends with diesel. Furthermore, depending on thespecific target that the surrogate is intended for, it can be defined to emulate thosekey properties of the real fuel that are necessary to predict the desired combustioncharacteristics. For instance, surrogates may be defined specific to capturing heatrelease rate alone versus onset of ignition or emission predictions. Such surrogatescould also be defined to account for the biodiesel composition itself, which variesdepending on its source.
Thus, there are three main aspects to formulating a surrogate: (a) choice ofsurrogate components, (b) identification of target properties to match between thesurrogate and the real fuel, and (c) determination of the amounts of each componentin the surrogate to define the surrogate. Note that the set of properties to bereproduced between the surrogate and the real fuel itself plays a key role indetermining the suitable components of the surrogate. This aspect is highlightedwith specific examples in the discussion in Sect. 2.2. Additionally, the accuracy ofthe individual component’s kinetic mechanism should also be paid attention towhile choosing the components in a surrogate, since this has a direct bearing on theaccuracy of the kinetic description of the multi-component surrogate itself. Oncethe components of the surrogate mixture are chosen and the target properties areidentified, one strategy to define a surrogate is using a constrained optimizationapproach, such as those employed in Refs. [5, 19–21] to define gasoline, diesel, andjet fuel surrogates. Another attractive approach for surrogate definition is brieflypresented in Sect. 3.
Several surrogates have been proposed for biodiesels [16, 22–34]. Based on thecompositional analysis of biodiesels presented in Table 1, methyl ester moleculesof differing chain lengths and degrees of unsaturation have been used as compo-nents in these surrogate mixtures. It is interesting to note that a surrogate com-prising just a normal alkane can still reproduce the reactivity of biodiesels [35],although not the ester specific characteristics of biodiesel oxidation, mandating anester representative in the surrogate mixture. The choice of the ester molecule in thesurrogate used in these studies has been influenced both by the availability ofaccurate kinetics for the ester molecules and the size of their chemical mechanisms.A brief summary of kinetic models for ester molecules relevant to biodiesels ispresented first, followed by a discussion of surrogate mixtures proposed in theliterature.
Surrogates for Biodiesel: Review and Challenges 181

2.1 Kinetics of Methyl Ester Molecules
2.1.1 Kinetic Models for Saturated Methyl Esters
The earliest studies on ester kinetics focusing on methyl formate, the smallestmember of the methyl ester group, and methyl butanoate (MB), a candidate forbiodiesel surrogate, were conducted by Fisher et al. [36]. In their reaction mech-anism, rules for estimating kinetic parameters were adopted from hydrocarboncombustion. The kinetic model showed qualitative agreement with the low tem-perature sub-atmospheric experiments available then. Gail et al. [22] updated thismechanism and compared against experimental data obtained in jet stirred reactor(JSR) at 0.101 MPa, / = 1.13 and 800 K < T < 1350 K. This mechanism wasfurther validated against more experiments using opposed flow diffusion flame andPrinceton variable pressure flow reactor data with good agreement. Metcalfe et al.[37] also developed a detailed mechanism for C5H10O2 ethyl and methyl esters.Their comparison in shock tubes indicated that ethyl propanoate is more reactivethan methyl butanoate. The reader is referred to Refs. [9, 38–41] for further detailson kinetic modeling of saturated methyl esters.
While the kinetics of methyl butanoate serves as a prototype for methyl esterkinetics, it does not exhibit the NTC behavior that is characteristic to long chainmethyl esters found in biodiesel [22, 36] (see Fig. 2). As a remedy, methyldecanoate was proposed as a representative of the ester content in biodiesel sur-rogates in later studies, which possessing a longer carbon chain than methylbutanoate, shows Negative Temperature Coefficient (NTC) behavior. A detailedkinetic mechanism for methyl decanoate (MD) was developed by Herbinet et al.[16] based on the reaction class description by Curran et al. [42, 43] and using esterspecific kinetics from methyl butanoate mechanism [36]. Including methyl decan-oate component in the surrogate also permitted to predict the early CO2 formationcharacteristic to biodiesel combustion. A surrogate comprised of methyl decanoate
0.1
1
10
100
1000
10000
100000
0.9 1 1.1 1.2 1.3 1.4
Igni
tion
Del
ay (m
s)
1000/T(K)
P = 13.5 bar, phi = 1.0
MD9DMDMB
MB2D
Fig. 2 Comparison ofsimulated ignition delay timesfor different methyl esterssurrogates (MB, MB2D [45],MD, MD9D [34]) atP = 13.5 bar and / = 1;lines-simulations
182 A.D. Lele et al.

and n-heptane was found to give qualitatively good results against JSR experimentsperformed with Rapeseed methyl ester (RME) as the fuel [35]. Based on thechemical reaction scheme constructed by Herbinet et al. [16], a new chemicalkinetic model was developed for methyl decanoate by Diévart et al. [44]. Thismodel adapts the kinetic and thermochemical parameters of methyl decanoate fromthose of methyl butanoate oxidation, and thereby achieves improved predictions forignition delays, species profiles in jet stirred reactors, and flame speeds.
2.1.2 Kinetic Models for Unsaturated Methyl Esters
Most of the biodiesels contain significant amount of unsaturated methyl esters,whose importance as a surrogate component needs to be understood. Gail et al. [45]further developed their methyl butanoate mechanism to include methyl crotonate(MB2D) to account for the unsaturated ester content of biodiesels. This mechanismhas been validated at moderate to high temperatures, 900–1400 K and equivalenceratios of 0.5–1.13. While methyl crotonate has its advantages similar to that ofmethyl butanoate, in that it can be represented by a compact scheme, it does notexhibit the NTC behavior characteristic of biodiesels (see Fig. 2), and this moti-vated the need to study longer unsaturated methyl esters in surrogates.
Based on their methyl decanoate mechanism, Herbinet et al. [34] furtherdeveloped reaction schemes for methyl-5-decanoate (MD5D) and methyl-9-decanoate (MD9D). These are unsaturated methyl esters with a C10 carbon chainhaving one double bond at the 5th and 9th C atom away from ester group,respectively. Methyl-5-decanoate has a C=C bond in the middle of the chain, whichis similar in position to that found in many biodiesel components such as methylstearate, whereas methyl-9-decanoate mimics the distance of the C=C bond inbiodiesel components from the ester group. These mechanisms were also comparedagainst JSR experiments with RME. Their comparison indicated that MD9D isbetter at representing major species profiles than MD5D and hence a better can-didate to represent the unsaturated ester content of biodiesels in a surrogate.
2.1.3 Kinetic Models for Biodiesels
This picture is completed by noting that detailed chemical kinetic schemes for the estermolecules present in actual biodiesel components, such as methyl palmitate, methylstearate, methyl oleate, methyl linoleate and methyl linolenate, have been developedrecently [9]. This mechanism based on the work for methyl decanoate and itsunsaturated counterparts, consists of *4800 species and *30,000 reactions.Herbinet et al. [46] also generated mechanisms for C11–C19 saturated methyl estersusing a reactionmechanism generation software, EXGAS. Amechanism generated inthis manner for methyl stearate is huge, with*6203 species and*43,444 reactions.Recent studies have focused on obtaining reduced mechanisms starting with thedetailed kinetic scheme proposed by Westbrook et al. [9], for instance, Ref. [47].
Surrogates for Biodiesel: Review and Challenges 183

With this discussion providing a brief account of the development of esterkinetics specific to biodiesels, surrogates proposed for biodiesels are detailed next.Readers may refer to more comprehensive reviews [48, 49] for elaborate accountsof ester kinetics.
2.2 Components of Surrogate Mixtures
Due to the lack of long chain methyl ester kinetic models, initial studies used asmall methyl ester component usually combined with n-alkane to define surrogatesfor biodiesels. Several works have used a combination of methyl butanoate and n-heptane in different proportions as a surrogate for the desired biodiesel [23, 25].Long chain n-alkanes, such as n-hexadecane, have been found to replicate thereactivity of rapeseed methyl esters in jet stirred reactor experiments [35]. However,it can be surmised that a normal alkane alone may not be well suited to predict theignition delays and major intermediates in the case of biodiesels, which have largeramounts of unsaturated components. In fact, significant differences in ignitiondelays of saturated and unsaturated methyl esters at low temperatures are suggestedby the kinetic scheme proposed by Westbrook et al. [9] for the actual biodieselcomponents, and this is also corroborated by shock tube experiments [15]. As arepresentative of the unsaturated ester content in biodiesels, a small molecule,methyl crotonate has been used in addition to methyl butanoate and n-heptane insome other studies [24, 26].
Later studies substituted methyl decanoate in place of methyl butanoate in thesurrogate, owing to its ability to reproduce the reactivity, NTC behavior, and earlyCO2 rise, which are characteristic of the long chain methyl esters in biodiesels [16,27–30, 50].
Reactivity of biodiesel, represented by its cetane number, is also found to be afunction of its degree of unsaturation. Four components have been used to representunsaturated ester content of biodiesel, namely MB2D, MD9D, MD5D and methyllinoleate. Herbinet et al. [34] concluded that MD9D is a better candidate to representunsaturated ester based on JSR experiments. But shock tube experiments [15] withMD5D and MD9D have suggested otherwise. It has been found that MD5D hasignition delays that are longer by almost a factor of two at T < 900 K compared toMD, while those of MD9D are comparable to MD. This observation has promptedmany researchers [29, 32, 33] to choose MD5D as the unsaturated methyl estercandidate in their surrogates, while others have opted for MD9D [27–30].
Recently, Liu et al. [32], included methyl linoleate itself as a surrogate com-ponent to represent the multiple C=C bonds present in biodiesels (see Table 1),since no existing surrogate candidate belonged to the diene hydrocarbon class.Reduced kinetic schemes for several of these surrogate combinations have alsobeen developed invoking state-of-art model reduction strategies, and are discussedbriefly in Sect. 2.3.
184 A.D. Lele et al.

From the above discussion, we see that the presence of at least one methyl estercomponent is typical of all surrogates proposed to represent biodiesel. Addition ofn-alkane in the surrogate helps to match reactivity as well as the heat content of thebiodiesel. The importance of a representative for the unsaturated ester content of thebiodiesel to mimic ignition as well as major species profiles is also acknowledged inthe literature. Most of the above combinations perform well in predicting engineparameters like pressure rise rate and ignition delays, but improved accuracy isdesirable. A list of various surrogate mixtures proposed for biodiesel is summarizedin Appendix.
Analysis on the Choice of Surrogate ComponentsA comparison between two surrogates with the same carbon content: one com-prising of 2.75 mol of 20% methyl butanoate and 80% n-heptane (by mole %),while the other having 2 mol of 25% methyl decanoate, 25% methyl-9-decanoate,and 50% n-heptane, is provided here to examine their usability as surrogates fordifferent target applications. The kinetic schemes for these surrogates come fromthe compact schemes derived by Liu et al. [23] for the surrogate containing methylbutanoate and Luo et al. [31] for the surrogate containing methyl decanoate, usingFisher et al. [36] and Herbinet et al. [34] as the reference mechanisms, respectively.
Figure 3 shows that the differences in predictions between the two surrogates forsoot precursors such as ethylene and acetylene concentrations in a plug flow reactorare small, within 20%, whereas this increases up to 100% for ethane. In this case,considering the soot precursors alone, although both surrogates show similar pre-dictions (equally good or bad depending on actual values for the real fuel), thecompact size of the methyl butanoate and n-heptane kinetic scheme can make it anattractive choice compared to surrogates made of long chain methyl esters such asmethyl decanoate. Further, being a small molecule, methyl butanoate has attractedmany experimental studies [22, 40, 41, 45, 51–53], compared to the longer methylesters such as methyl decanoate [53–55], and has thereby facilitated the develop-ment of accurate kinetic schemes for methyl butanoate [45, 51].
The ignition delays of the two surrogates at low through high temperatures areshown in Fig. 4. Note that although methyl butanoate does not exhibit the NTCbehavior [51] characteristic of biodiesel by itself, when combined with a n-alkane,for instance, a mixture of methyl butanoate and n-heptane does exhibit NTCbehavior due to the alkane component [23]. More importantly, Fig. 4 shows thatsignificant differences are seen in ignition delays between the two surrogates, whichcould place one more suitable for determining the onset of ignition, depending onthe reactivity of the real fuel. Similar extents of differences are also observed atequivalence ratios other than the stoichiometric conditions examined in Fig. 4 (notshown here).
Laminar flame speeds of the surrogates are compared in Fig. 5. Similar toignition delays, the surrogates show significant differences in laminar flame speedpredictions, up to 45%. It can be seen that the surrogate containing methyl
Surrogates for Biodiesel: Review and Challenges 185

0
0.002
0.004
0.006
0.008
0.01
600 700 800 900 1000 1100 1200 1300 1400 1500
mol
e fr
actio
n
Tin (K)
(a) C 2H2
0.004
0.008
0.012
0.016
0.02
0.024
0.028
600 700 800 900 1000 1100 1200 1300 1400 1500
mol
e fr
actio
n
Tin (K)
(b) C 2H4
0
0.0004
0.0008
0.0012
0.0016
0.002
600 700 800 900 1000 1100 1200 1300 1400 1500
mol
e fr
actio
n
Tin (K)
(c) C 2H6
Fig. 3 Comparison of computed species profiles for C2H2, C2H4, C2H6 in plug flow reactor forinitial T = 1000 K, / = 1 and P = 20 atm; lines simulations results for two surrogates:(i) MB + n-heptane ( ) [23] and (ii) MD + MD9D + n-heptane ( ) [31]
0.001
0.01
0.1
1
10
0.6 0.7 0.8 0.9 1 1.1 1.2 1.3 1.4 1.5
Igni
tion
Del
ay (m
s)
1000/T(K)
P = 20 bar, phi = 1
MD, MD9D, nC7MB, nC7
Fig. 4 Comparison of ignition delay times; lines simulations for two surrogates:(i) MB + n-heptane ( ) [23], (ii) MD + MD9D + n-heptane ( ) [31]
186 A.D. Lele et al.
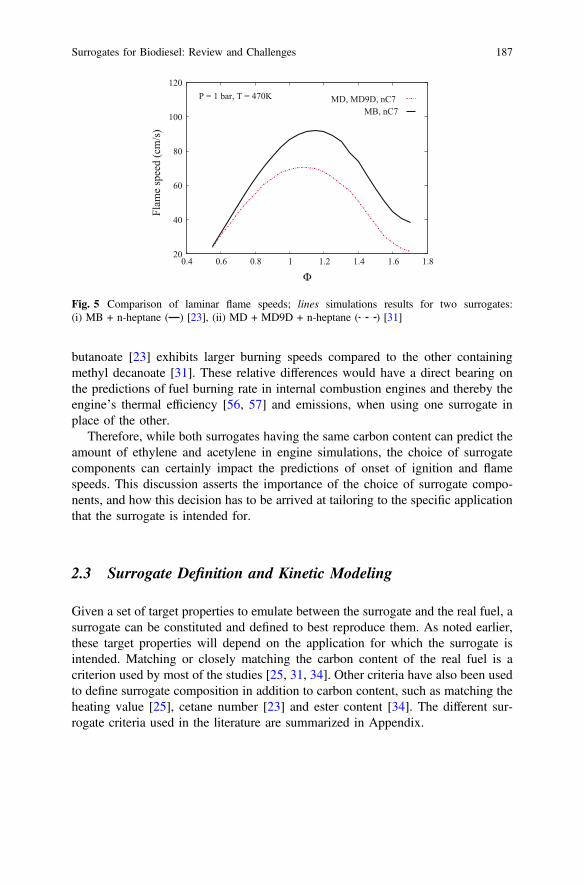
butanoate [23] exhibits larger burning speeds compared to the other containingmethyl decanoate [31]. These relative differences would have a direct bearing onthe predictions of fuel burning rate in internal combustion engines and thereby theengine’s thermal efficiency [56, 57] and emissions, when using one surrogate inplace of the other.
Therefore, while both surrogates having the same carbon content can predict theamount of ethylene and acetylene in engine simulations, the choice of surrogatecomponents can certainly impact the predictions of onset of ignition and flamespeeds. This discussion asserts the importance of the choice of surrogate compo-nents, and how this decision has to be arrived at tailoring to the specific applicationthat the surrogate is intended for.
2.3 Surrogate Definition and Kinetic Modeling
Given a set of target properties to emulate between the surrogate and the real fuel, asurrogate can be constituted and defined to best reproduce them. As noted earlier,these target properties will depend on the application for which the surrogate isintended. Matching or closely matching the carbon content of the real fuel is acriterion used by most of the studies [25, 31, 34]. Other criteria have also been usedto define surrogate composition in addition to carbon content, such as matching theheating value [25], cetane number [23] and ester content [34]. The different sur-rogate criteria used in the literature are summarized in Appendix.
20
40
60
80
100
120
0.4 0.6 0.8 1 1.2 1.4 1.6 1.8
Flam
e sp
eed
(cm
/s)
Φ
P = 1 bar, T = 470K MD, MD9D, nC7MB, nC7
Fig. 5 Comparison of laminar flame speeds; lines simulations results for two surrogates:(i) MB + n-heptane ( ) [23], (ii) MD + MD9D + n-heptane ( ) [31]
Surrogates for Biodiesel: Review and Challenges 187

2.3.1 Comparing Different Surrogate Definition Criteria
Figure 6 compares simulated ignition delays of surrogates made of methylbutanoate and n-heptane mixture defined based on two different criteria. In the firstcase, fuel is taken as a mixture of 20% MB and 80% n-heptane (by mole), whosecetane number is closer to that of the real fuel [23]. Whereas, in the second case,one mole of fuel is assumed to be composed of 1 mol of methyl butanoate and2 mol of n-heptane [25], so that its heating value is closer to the real fuel. This casetranslates into a surrogate with 33% of methyl butanoate and 67% of n-heptane (bymole). The two surrogates, comprising the same components, depict similar pre-dictive capabilities for major species in flow reactors (not shown here). However,they show different ignition delays at moderate and low temperatures, which canhave an impact on the onset of ignition in a compression ignition engine. Thus, thecriteria employed in the surrogate definition can play an key role in predicting thecombustion dynamics in engine simulations.
2.3.2 Kinetic Models for Surrogates
Although the size of mechanisms for biodiesel surrogates are smaller compared tothe detailed mechanism for actual biodiesel components, they still remain com-putationally expensive to be incorporated in turbulent combustion simulations.Several studies [23, 26, 28, 32] use a combination of existing graph based reductionmethods such as DRG [58], DRGEP [59], DRGEPSA [60] and species and reactionlumping to derive compact kinetic schemes to be coupled with reactive flow sim-ulations [30–32].
0.1
1
10
0.9 1 1.1 1.2 1.3 1.4
Igni
tion
Del
ay (m
s)
1000/T(K)
P = 13.5 bar, phi = 1.0
matching CNmatching C content
Fig. 6 Comparison ofignition delay times atP = 13.5 bar and / = 1computed with two differentsurrogates comprised ofmethyl butanoate andn-heptane, defined by(i) matching cetane numberand (ii) matching carboncontent
188 A.D. Lele et al.

In a nutshell, these reduction techniques rely on eliminating species and reac-tions not important at the desired target conditions. To compensate for the errorsdue to reduction, in a few studies [26, 28, 30, 32], pre-exponential factors in the rateconstants of reactions with high sensitivity towards parameters such as ignitiondelays have been adjusted. Other studies [29, 32] have opted for the development ofskeletal mechanism using a decoupling methodology. In this approach, a reducedC2–C3 mechanism and a detailed H2/CO/C1 forms the basis. Thereafter, thismechanism is extended to include the overall reaction pathways for the fuel underconsideration. Following this, the kinetic parameters are optimized using availableexperimental results. Both these approaches result in compact surrogate mecha-nisms suitable for the computationally demanding combustion models (for instance,see Refs. [61–63]). Some remarks on deriving such reduced mechanisms are pre-sented in the following section.
It is interesting to note that the definition of the surrogate composition also playsan important role in deriving combustion kinetic models for the multi-componentfuel oxidation. In the context of gasoline surrogates, it has been demonstrated thatdepending on the composition of the multicomponent surrogate for which thereduced mechanism is derived, different reduced schemes can be obtained, specificto the precise surrogate composition [64]. In fact, most of the reduced reactionschemes for biodiesel surrogates follow this trend and tend to be specific to theproposed surrogate composition.
While kinetic models developed in this manner have been assessed for thespecific surrogate, they do not guarantee similar accuracy for changes in surrogatecomposition. When it is of interest to understand the specificities arising out of thevariabilities in biodiesels (depending on its source), reaction mechanisms that alsoallow examining surrogates for different biodiesel compositions are preferred.Recently, Cheng et al. [30] developed such a generic reduced surrogate mechanismusing methyl decanoate, methyl-5-decanoate, and n-heptane as components that isapplicable for biodiesels arising out of different sources. Furthermore, these generickinetic schemes are also particularly useful to evaluate different surrogate definitioncriteria by proposing several surrogate mixtures with varying component compo-sitions (still comprised of the same chosen components) and thereby crystallize thebest approach to define a surrogate for a particular type of biodiesel fuel and adesired target application.
3 Challenges
Having summarized the recent work on biodiesel surrogates, this section focus onthe challenges ahead in this field.
Surrogates for Biodiesel: Review and Challenges 189

3.1 Widening the Experimental Database for the Real Fueland its Components
Experimental data for biodiesels lag behind other hydrocarbons, especially when itcomes to ignition delay measurements at moderate and low temperatures(T < 900 K). With advanced combustion technologies such as HCCI or ultra leancombustion, which are more chemical kinetically driven compared to conventionalcombustion strategies, it is imperative to experimentally study the behavior of thefuels in wider operating ranges, especially in the low temperature regime, yet insimple reactor configurations, to facilitate the development of accurate kinetics forthe real fuel. Low vapor pressure of biodiesel fuels and their components poseconsiderable challenges to conducting heated shock tube experiments at thesetemperatures. Aerosol shock tubes have been proposed as a viable alternative formeasuring ignition delays of these fuels [65].
Experimental data for ignition delays of the actual biodiesel fuel can pave way topropose better surrogates for the specific biodiesel. Recently, a surrogate definitionstrategy has been proposed for jet fuels [66], which suggests that in place of thecetane number used as a criteria for matching reactivity between real fuel and thesurrogates, the experimental ignition delay data of the real fuel over a wide range ofpressures and temperatures themselves be used. This strategy has been foundpromising and demonstrates that a better jet fuel surrogate, than one defined basedon cetane number, can be proposed using the same components. The idea can besimilarly extended to defining biodiesel surrogates, if experimental data for ignitiondelays of the real fuel at wide temperature and pressure ranges become available.
Further, the existing literature lacks ignition delay measurements for the com-ponents of the real biodiesel at moderate and low temperatures. These experimentaldatasets are valuable to validate the component kinetics, which show widely dif-ferent reactivities depending on their degree of unsaturation (see Fig. 7). Suchwell-validated kinetic schemes for the actual components of biodiesels will form a
0.1
1
10
100
0.8 0.9 1 1.1 1.2 1.3 1.4 1.5 1.6
Igni
tion
Del
ay (m
s)
1000/T(K)
P = 13.5 bar, phi = 1.0
linoleatelinolenate
oleatestearate
palmitate
Fig. 7 Comparison ofignition delays of differentmethyl esters present inbiodiesels at P = 13.5 bar and/ = 1; lines simulations [9]
190 A.D. Lele et al.
solid base for selecting suitable representatives for the different types of methylesters to form a surrogate mixture, which can emulate the same ignition behavior asthe real fuel.
3.2 Accuracy of Surrogate Component Kinetics
A non-exhaustive summary of methyl ester kinetic modeling and the significantprogress made until recently has been provided earlier. Noneless, there is still aneed to further refine the present detailed mechanisms for the ester components ofthe surrogates. In fact, it has been noted by Wang et al. [15] when comparing thereactivities of different C10 methyl esters: methyl decanoate (MD), methyl-9-decanoate (MD9D), and methyl-5-decanoate (MD5D) in a shock tube that MD9D isclose in reactivity to MD, while this aspect is not predicted by the existing detailedmechanisms for these methyl esters. While the ignition delay data from Wang et al.provide a useful target for validation of kinetic models proposed for these com-ponents, the development of accurate kinetics for these methyl esters and a com-prehensive assessment will greatly benefit from additional experimental data for theoxidation of these methyl esters in flow reactors and flame configurations as well.
3.3 Surrogate Definition Criteria for Gas PhaseApplications
It has been noted in the earlier discussion that several criteria have been used forsurrogate definition, such as carbon content, heating value, cetane number, estercontent, and unsaturated molecule content. A general agreement on the mostimportant set of definition criteria has been suggested and agreed upon for for-mulating jet fuel surrogates [4], diesel fuel surrogates [6], and gasoline surrogates,whereas such a consensus is yet to be reached for biodiesel surrogates. This needs asystematic and careful assessment of the different surrogate definition criteria (andadditionally others if relevant) and their significance to the target applications,which they are intended for.
3.4 Deriving Reduced Mechanisms for Surrogates
Several studies have derived reduced mechanisms for surrogate mixtures andoptimized the reduced kinetics against experimental data or with the correspondingreference detailed mechanism [26, 29, 30, 32, 33]. The changes in rate parameters
Surrogates for Biodiesel: Review and Challenges 191

are justified in order to compensate for the errors due to reduction, nevertheless, theoptimized mechanism compromises on the kinetic accuracy.
As a consequence, this procedure may not guarantee similar accuracy in con-figurations for which the mechanism has not been optimized for. The authorsbelieve that this approach, which is the viable one in the absence of accuratekinetics for the surrogates components, must be revisited when the surrogatecomponent kinetics are better described. Reduced and compact mechanisms mustideally be derived starting from a reference mechanism that is well-validated, usingreduction strategies to prune out insignificant species and pathways pertaining tothe target conditions.
3.5 Surrogates for Liquid Phase Applications
The discussion in this chapter has entirely been on chemical surrogates, which areintended for gas-phase applications. To represent fuel spray characteristics, such asatomization, vaporization and mixing, the physical properties, such as density,viscosity, and surface tension, are particularly important to be matched between thereal fuel and the surrogate. Table 3 shows some of these properties for the typicalcomponents used in gas-phase surrogates and for an actual biodiesel. It is notsurprising to note that no combination of these components can emulate some of thekey liquid phase properties, such as kinematic viscosity and boiling point. Hence, itbecomes important to describe liquid phase properties using a separate surrogate.
As highlighted in the previous section, biodiesels are less complex in terms ofnumber of components in its chemical composition (only 4–6) compared to diesel,gasoline or jet fuels. Considering this, liquid phase properties of biodiesel could berepresented precisely by its actual methyl ester constituents. Thus, a model fuel forbiodiesel can use two groups of surrogates: one to represent the liquid phaseproperties and the other to represent the gas phase kinetics of biodiesel. As indi-cated earlier, in the case of biodiesel, its actual methyl ester constituents can be usedto represent the liquid phase fuel spray properties, while a simpler well charac-terized chemical surrogate (comprising of two or three components) can representthe gas phase chemical kinetics.
Table 3 Biodiesel and surrogate property comparison at standard conditions
Properties Methylbutanoate
Methyldecanoate
n-heptane n-decane Biodiesel[17]
Density (kg/L) @ 298 K[67, 68]
0.892 0.873 0.679 0.726 0.870–0.892
Kinematic viscosity(mm2/s)
0.510 1.72 0.499 0.969 3.1–4.5
@ 313 K [69, 70]
Boiling point °C [71, 72] 102 224 98 174 330–340
192 A.D. Lele et al.

This strategy referred to as the hybrid surrogate modeling approach, would be away forward to model biodiesel fuel characteristics as it (i) provides a moreaccurate representation of liquid phase properties and (ii) is also computationallyless expensive due to use of a simpler surrogate to represent gas phase kinetics, forwhich a compact kinetic scheme can be derived. The components in the liquidphase surrogates can be interfaced to gas phase surrogates by using a GroupChemistry Representation (GCR) approach proposed by Anand et al. [73] for dieselfuel. The hybrid surrogate modeling approach has been found to accurately rep-resent diesel fuel characteristics under conventional and low temperature com-bustion engine conditions [74, 75]. Extending this approach to the case of biodieselfuels will enable the use of a surrogate whose physical and chemical propertiesmatch the real fuel in computational studies.
4 Concluding Remarks
This exposition summarizes the recent progress in surrogate formulation for bio-diesels and their kinetic models. Since biodiesels are made up of methyl esters ofvarying degrees of unsaturation, representative methyl esters have been consideredas a part of most biodiesel surrogates. Therefore, in this chapter, kinetic modeldevelopment for methyl esters has been discussed in detail. Surrogate definitionmethods used in the literature have been reviewed as well and the need for carefulassessment of different criteria and their importance to target applications has beenemphasized. The authors have also availed this opportunity to highlight severalimpending challenges in the field of biodiesel surrogates and their kinetic modeling.
As commonly agreed upon in the combustion community, while being renew-able, the one main downside to the use of biodiesels in conventional engines is theincrease in NOx potential as compared to diesel [76]. When coupled with NOx
chemistry, a well-validated kinetic mechanism for an appropriately defined bio-diesel surrogate can shed light into the NOx formation pathways and possiblestrategies to mitigate NOx. Such molecular level kinetics based understanding ofglobal emissions can also be immensely useful in designing the next generationfuels with desirable emission and performance characteristics.
Acknowledgements The last author gratefully acknowledges support from the New FacultyInitiation Grant, Project no. MEE/15–16/845/NFIG offered by the Indian Institute of TechnologyMadras.
Appendix: List of Biodiesel Surrogatesand Their Kinetic Models
See Table 4.
Surrogates for Biodiesel: Review and Challenges 193

Tab
le4
Summaryof
availablestud
ieson
surrog
ates
forbiod
ieselsandtheirkinetic
mod
elsin
chrono
logicalorder:Detaileda
andredu
cedb
schemes
Surrog
ates
Typ
eandsize
Surrog
atedefinitio
ncriteria
Year
#species
#reactio
ns
n-hexadecane
a22
518
41Carbo
ncontent
2007
[35]
Methy
lbu
tano
ate+n-heptaneb
5315
6LHV,O2contentof
real
biod
iesel(bymass)
2008
[25]
Methy
ldecano
ate
3012
8820
Carbo
ncontent
2008
[16]
Methy
ldecano
ate+n-heptane
Carbo
ncontent
2008
[16]
Methy
l-9-decano
ate
Carbo
ncontent
2010
[34]
Methy
l-5-decano
ate
Carbo
ncontent
2010
[34]
Methy
ldecano
ate+n-heptane+methy
l-9-decano
ate
Ccontent,estergrou
pcontent
2010
[34]
Methy
ldecano
ate+methy
l-9-decano
ate+n-heptane
118
837
Equ
almolefractio
nof
surrog
ates
2010
[27]
Methy
ldecano
ate+n-heptane+methy
l-9-decano
ate
115
460
25%
MD,25
%MD9D
and50
%n-heptaneby
mole
2012
[31]
Methy
lbu
tano
ate+n-heptane
145
Cetanenu
mber
2012
[23]
Methy
lcroton
ate+methy
lbu
tano
ate+n-heptane
8029
9Saturatedandun
saturatedmethy
lester
ratio
s,molecular
mass,LHV
andfuel-bou
ndox
ygen
content
2012
[24]
Methy
lbu
tano
ate+methy
lcroton
ate+n-heptane
113
399
Saturatedandun
saturatedmethy
lesterratio
s20
12[26]
(con
tinued)
194 A.D. Lele et al.

Tab
le4
(con
tinued)
Surrog
ates
Typ
eandsize
Surrog
atedefinitio
ncriteria
Year
#species
#reactio
ns
Methy
ldecano
ate+n-heptane+methy
l-9-decano
ate
112
498
25%
MD,25
%MD9D
and50
%n-heptane
2014
[28]
Methy
ldecano
ate+n-decane
+methy
l-5-decano
ate
6017
2Saturatedandun
saturatedmethy
lesterratio
s,energy
contentandC/H/O
ratio
2014
[29]
Methy
lmecanoate
+n-heptane+methy
l-9-decano
ate
9236
0Saturatedandun
saturatedmethy
lesterratio
s20
15[30]
Methy
ldecano
ate+methy
l-5-decano
ate+n-decane
+methy
llin
oleate
106
263
Energycontent,C/H/O
ratio
andmethy
lestercontent
with
twodo
uble
bond
s20
15[32]
Methy
ldecano
ate+methy
l-5-decano
ate+n-decane
+methy
llin
oleate
134
475
Energycontent,C/H/O
ratio
andmethy
lestercontent
with
twodo
uble
bond
s20
16[33]
Surrogates for Biodiesel: Review and Challenges 195

References
1. Anand K, Sharma RP, Mehta PS (2008) Experimental investigations on combustion ofjatropha methyl ester in a turbocharged direct-injection diesel engine. Proc Inst Mech Eng PartD: J Autom Eng 222(10):1865–1877
2. Demirbas A (2009) Progress and recent trends in biodiesel fuels. Energy Convers Manag 50(1):14–34
3. Wang W-G, Lyons W, Clark N, Gautam M, Norton P (2000) Emissions from nine heavytrucks fueled by diesel and biodiesel blend without engine modification. Environ Sci Technol34(6):933–939
4. Colket M, Edwards T, Williams S, Cernansky NP, Miller DL, Egolfopoulos F, Lindstedt P,Seshadri K, Dryer FL, Law CK, Friend D, Lenhert DB, Pitsch v, Sarofim A, Smooke M,Tsang W (2007) Development of an experimental database and kinetic models for surrogatejet fuels. In: 45th AIAA aerospace sciences meeting and exhibit, pp 2007–770
5. Narayanaswamy K, Pitsch H, Pepiot P (2016) A component library framework for derivingkinetic mechanisms for multi-component fuel surrogates: application for jet fuel surrogates.Combust Flame 165:288–309
6. Farrell JT, Cernansky NP, Dryer FL, Friend DG, Hergart CA, Law CK, McDavid RM,Mueller CJ, Patel AK, Pitsch H (2007) Development of an experimental database and kineticmodels for surrogate diesel fuels. SAE Paper No. 2007-01-0201
7. Pitz WJ, Mueller CJ (2011) Recent progress in the development of diesel surrogate fuels. ProgEnergy Combust Sci 37(3):330–350
8. Mehl M, Chen J-Y, Pitz WJ, Mani Sarathy S, Westbrook CK (2011) An approach forformulating surrogates for gasoline with application toward a reduced surrogate mechanismfor CFD engine modeling. Energy Fuels 25(11):5215–5223
9. Westbrook CK, Naik CV, Herbinet O, Pitz W, Mehl M, Sarathy SM, Curran HJ (2011)Detailed chemical kinetic reaction mechanisms for soy and rapeseed biodiesel fuels. CombustFlame 158(4):742–755
10. Pitsch H, Bollig M (1993) Flamemaster, a computer code for homogeneous andone-dimensional laminar flame calculations. Institut fur Technische Mechanik, RWTHAachen
11. Thangaraja J, Anand K, Pramod S (2016) Mehta. Biodiesel no x penalty and controlmeasures-a review. Renew Sustain Energy Rev 61:1–24
12. Goodrum JW (2002) Volatility and boiling points of biodiesel from vegetable oils and tallow.Biomass Bioenergy 22(3):205–211
13. Yanowitz J, Ratcliff MA, McCormick RL, Taylor JD, Murphy MJ (2014) Compendium ofexperimental cetane numbers. Technical Repot, National Renewable Energy Laboratory
14. Takase M, Zhao T, Zhang M, Chen Y, Liu H, Yang L, Xiangyang W (2015) An expatiatereview of neem, jatropha, rubber and karanja as multipurpose non-edible biodiesel resourcesand comparison of their fuel, engine and emission properties. Renew Sustain Energy Rev43:495–520
15. Wang W, Gowdagiri S, Oehlschlaeger MA (2013) Comparative study of the autoignition ofmethyl decanoates, unsaturated biodiesel fuel surrogates. Energy Fuels 27(9):5527–5532
16. Herbinet O, Pitz WJ, Westbrook CK (2008) Detailed chemical kinetic oxidation mechanismfor a biodiesel surrogate. Combust Flame 154(3):507–528
17. Anand K, Sharma RP, Pramod S (2011) Mehta. Experimental investigations on combustion,performance and emissions characteristics of neat karanji biodiesel and its methanol blend in adiesel engine. Biomass Bioenergy 35(1):533–541
18. Edwards T, Maurice LQ (2000) Surrogate mixtures to represent complex aviation and rocketfuels. J Prop Power 17:461–466
196 A.D. Lele et al.

19. Mueller CJ, Cannella WJ, Bruno TJ, Bunting B, Dettman HD, Franz JA, Huber ML,Natarajan M, Pitz WJ, Ratcliff MA, Wright K (2012) Methodology for formulating dieselsurrogate fuels with accurate compositional, ignition-quality, and volatility characteristics.Energy & Fuels 26(6):3284–3303
20. Ahmed A, Goteng G, Shankar VSB, Al-Qurashi K, Roberts WL, Mani Sarathy S (2015) Acomputational methodology for formulating gasoline surrogate fuels with accurate physicaland chemical kinetic properties. Fuel 143:290–300
21. Pepiot-Desjardins P (2008) Automatic strategies for chemical mechanism reduction. PhDthesis, Stanford University, Department of Mechanical Engineering, June 2008
22. Gal S, Thomson MJ, Mani Sarathy S, Syed SA, Dagaut P, Diévart P, Marchese AJ, Dryer FL(2007) A wide-ranging kinetic modeling study of methyl butanoate combustion. ProcCombustion Inst 31(1):305–311
23. Liu W, Sivaramakrishnan R, Davis MJ, Som S, Longman DE, Lu TF (2013) Development ofa reduced biodiesel surrogate model for compression ignition engine modeling. ProcCombustion Inst 34(1):401–409
24. Kiat Ng H, Gan S, Ng J-H, Mun Pang K (2013) Development and validation of a reducedcombined biodiesel–diesel reaction mechanism. Fuel 104:620–634
25. Brakora JL, Ra Y, Reitz RD, McFarlane J, Stuart Daw C (2008) Development and validationof a reduced reaction mechanism for biodiesel-fueled engine simulations. SAE Int J FuelsLubricants 1(2008-01-1378):675–702
26. Mohamed Ismail H, Kiat Ng H, Gan S, Lucchini T, Onorati A (2013) Development of areduced biodiesel combustion kinetics mechanism for CFD modelling of a light-duty dieselengine. Fuel 106:388–400
27. Luo Z, Tianfeng L, Maciaszek MJ, Som S, Longman DE (2010) A reduced mechanism forhigh-temperature oxidation of biodiesel surrogates. Energy Fuels 24(12):6283–6293
28. An H, Yang WM, Maghbouli A, Li J, Chua KJ (2014) A skeletal mechanism for biodieselblend surrogates combustion. Energy Convers Manag 81:51–59
29. Chang Y, Jia M, Li Y, Zhang Y, Xie M, Wang H, Reitz RD (2015) Development of a skeletaloxidation mechanism for biodiesel surrogate. Proc Combustion Inst 35(3):3037–3044
30. Cheng X, Kiat Ng H, Gan S, Hou Ho J, Mun Pang K (2015) Development and validation of ageneric reduced chemical kinetic mechanism for CFD spray combustion modelling ofbiodiesel fuels. Combustion Flame 162(6):2354–2370
31. Luo Z, Plomer M, Lu T, Som S, Longman DE, Mani Sarathy S, and William J. Pitz.A reduced mechanism for biodiesel surrogates for compression ignition engine applications.Fuel, 99:143–153, 2012
32. Liu T, Jiaqiang E, Yang W, Hui A, Hao Cai (2016) Development of a skeletal mechanism forbiodiesel blend surrogates with varying fatty acid methyl esters proportion. Appl Energy 162(x):278–288
33. Jiaqiang E, Liu T, Yang W, Deng Y, Gong J (2016) A skeletal mechanism modeling on sootemission characteristics for biodiesel surrogates with varying fatty acid methyl estersproportion. Appl Energy 181:322–331
34. Herbinet O, Pitz WJ, Westbrook CK (2010) Detailed chemical kinetic mechanism for theoxidation of biodiesel fuels blend surrogate. Combust Flame 157(5):893–908
35. Dagaut P, Gail S, Sahasrabudhe M (2007) Rapeseed oil methyl ester oxidation over extendedranges of pressure, temperature, and equivalence ratio: Experimental and modeling kineticstudy. Proc Combustion Inst 31 II:2955–2961
36. Fisher EM, Pitz WJ, Curran HJ, Westbrook CK (2000) Detailed chemical kinetic mechanismsfor combustion of oxygenated fuels. Proc Combust Inst 28:1579–1586
37. Metcalfe WK, Dooley S, Curran HJ, Simmie JM, El-Nahas AM, Navarro MV (2007)Experimental and modeling study of C5H10O2 ethyl and methyl esters. J Phys Chem A 111(19):4001–4014
38. Hakka MH, Glaude PA, Herbinet O, Battin-Leclerc F (2009) Experimental study of theoxidation of large surrogates for diesel and biodiesel fuels. Combustion Flame 156(11):2129–2144
Surrogates for Biodiesel: Review and Challenges 197

39. Grana R, Frassoldati A, Cuoci A, Faravelli T, Ranzi E (2012) A wide range kinetic modelingstudy of pyrolysis and oxidation of methyl butanoate and methyl decanoate. note i: Lumpedkinetic model of methyl butanoate and small methyl esters. Energy 43(1):124–139
40. Parandaman A, Balaganesh M, Rajakumar B (2015) Experimental and theoretical study onthermal decomposition of methyl butanoate behind reflected shock waves. RSC Advances 5(105):86536–86550
41. Diévart P, Hee Won S, Gong J, Dooley S, Ju Y (2013) A comparative study of the chemicalkinetic characteristics of small methyl esters in diffusion flame extinction. Proc CombustionInst 34(1):821–829
42. Curran HJ, Gaffuri P, Pitz WJ, Westbrook CK (1998) A comprehensive modeling study ofn-heptane oxidation. Combustion Flame, 114(1):149–177
43. Curran HJ, Gaffuri P, Pitz WJ, Westbrook CK (2002) A comprehensive modeling study ofiso-octane oxidation. Combustion Flame 129(3):253–280
44. Diévart P, Hee Won S, Dooley S, Dryer FL, Ju Y (2012) A kinetic model for methyldecanoate combustion. Combustion Flame 159(5):1793–1805
45. Gal S, Sarathy SM, Thomson MJ, Diévart P, Dagaut P (2008) Experimental and chemicalkinetic modeling study of small methyl esters oxidation: Methyl (e)-2-butenoate and methylbutanoate. Combust Flame 155(4):635–650
46. Herbinet O, Biet J, Hichem Hakka M, Warth V, Alexandre Glaude P, Nicolle A,Battin-Leclerc F (2011) Modeling study of the low-temperature oxidation of large methylesters from C11 to C19. Proc Combustion Inst 33(1):391–398
47. Saggese C, Frassoldati A, Cuoci A, Faravelli T, Ranzi E (2013) A lumped approach to thekinetic modeling of pyrolysis and combustion of biodiesel fuels. Proc Combust Inst 34(1):427–434
48. Coniglio L, Bennadji H, Alexandre Glaude P, Herbinet O, Billaud F (2013) Combustionchemical kinetics of biodiesel and related compounds (methyl and ethyl esters): experimentsand modeling–advances and future refinements. Progr Energy Combustion Sci 39(4):340–382
49. Lai JYW, Lin KC, Violi A (2011) Biodiesel combustion: advances in chemical kineticmodeling. Progr Energy Combustion Sci 37(1):1–14
50. Sarathy SM, Thomson MJ, Pitz WJ, Lu T (2011) An experimental and kinetic modeling studyof methyl decanoate combustion. Proc Combust Inst 33(1):399–405
51. Dooley S, Curran HJ, Simmie JM (2008) Autoignition measurements and a validated kineticmodel for the biodiesel surrogate, methyl butanoate. Combust Flame 153(1):2–32
52. Wang YL, Lee DJ, Westbrook CK, Egolfopoulos FN, Tsotsis TT (2014) Oxidation of smallalkyl esters in flames. Combust Flame 161(3):810–817
53. Wang YL, Feng Q, Egolfopoulos FN, Tsotsis TT (2011) Studies of C4 and C10 methyl esterflames. Combust Flame 158(8):1507–1519
54. Alexandre Glaude P, Herbinet O, Bax S, Biet J, Warth V, Battin-Leclerc F (2010) Modelingof the oxidation of methyl esters—validation for methyl hexanoate, methyl heptanoate, andmethyl decanoate in a jet-stirred reactor. Combust Flame 157(11):2035–2050
55. Seshadri K, Tianfeng L, Herbinet O, Humer S, Niemann U, Pitz WJ, Seiser R, Law CK(2009) Experimental and kinetic modeling study of extinction and ignition of methyldecanoate in laminar non-premixed flows. Proc Combust Inst 32(1):1067–1074
56. Farrel JT, Weissman W, Johnston RJ, Nishimura J, Ueda T, Iwashita Y (2003) Fuel effects onsidi efficiency and emissions. SAE Publication 2003-01-3186 (2003)
57. Kuo TW (1990) J Eng Gas Turbines Power 112:348–35658. Tianfeng L, Law CK (2005) A directed relation graph method for mechanism reduction. Proc
Combust Inst 30(1):1333–134159. Pepiot-Desjardins P, Pitsch H (2008) An efficient error-propagation-based reduction method
for large chemical kinetic mechanisms. Combust Flame 154(1–2):67–8160. Niemeyer KE, Sung C-J, Raju MP (2010) Skeletal mechanism generation for surrogate fuels
using directed relation graph with error propagation and sensitivity analysis. Combust Flame157(9):1760–1770
198 A.D. Lele et al.

61. Gustavsson J, Golovitchev VI (2003) Spray combustion simulation based on detailedchemistry approach for diesel fuel surrogate model. Technical report, SAE Technical Paper
62. Som S, Ramirez AI, Longman DE, Aggarwal SK (2011) Effect of nozzle orifice geometry onspray, combustion, and emission characteristics under diesel engine conditions. Fuel 90(3):1267–1276
63. Som S, Longman DE, Luo Z, Plomer M, Lu T, Senecal PK, Pomraning E (2012) Simulatingflame lift-off characteristics of diesel and biodiesel fuels using detailed chemical-kineticmechanisms and large eddy simulation turbulence model. J Energy Res Technol 134(3):032204
64. Niemeyer KE, Sung C-J (2014) Mechanism reduction for multicomponent surrogates: a casestudy using toluene reference fuels. Combust Flame 161(11):2752–2764
65. Davidson DF, Haylett DR, Hanson RK (2008) Development of an aerosol shock tube forkinetic studies of low-vapor-pressure fuels. Combust Flame 155(1):108–117
66. Narayanaswamy K, Pepiot P (under review) Simulation-driven formulation of transportationfuel surrogates. Combust Theory Model
67. Pintos M, Bravo R (1988) Maria Carmen Baluja, Maria Inmaculada Paz Andrade, GenevièveRoux-Desgranges, and Jean-Pierre E Grolier. Thermodynamics of alkanoate + alkane binarymixtures. concentration dependence of excess heat capacities and volumes. Can J Chem 66(5):1179–1186
68. Ortega J, Alcalde R (1992) Determination and algebraic representation of volumes of mixingat 298.15 K of methyl n-alkanoates (from ethanoate to n-pentadecanoate) with n-pentadecane.Fluid Phase Equilib 71(1–2):49–62
69. José S (2001) Matos, José L Trenzado, Emilio González, and Rafael Alcalde. Volumetricproperties and viscosities of the methyl butanoate + n-heptane + n-octane ternary system andits binary constituents in the temperature range from 283.15 to 313.15 K. Fluid Phase Equilib186(1):207–234
70. Knothe G, Steidley KR (2005) Kinematic viscosity of biodiesel fuel components and relatedcompounds. Influence of compound structure and comparison to petrodiesel fuel components.Fuel 84(9):1059–1065
71. Tsibanogiannis IN, Kalospiros NS, Tassios DP (1995) Prediction of normal boiling pointtemperature of medium/high molecular weight compounds. Ind Eng Chem Res 34(3):997–1002
72. Liu S, Cao C, Li Z (1998) Approach to estimation and prediction for normal boiling point(NBP) of alkanes based on a novel molecular distance-edge (MDE) vector, & #x03BB.J Chem Inf Comput Sci 38(3):387–394
73. Krishnasamy A, Ra Y, Reitz RD, Bunting B (2012) Combustion simulations of the fuels foradvanced combustion engines in a homogeneous charge compression ignition engine. Int JEngine Res 191–208
74. Krishnasamy A, Reitz RD, Willems W, Kurtz E (2013) Surrogate diesel fuel models for lowtemperature combustion. SAE Technical Paper, 2013-01-1092
75. Anand K, Ra Y, Reitz RD, Bunting B (2011) Surrogate model development for fuels foradvanced combustion engines. Energy & Fuels 25(4):1474–1484
76. Xue J, Grift TE, Hansen AC (2011) Effect of biodiesel on engine performances and emissions.Renew Sustain Energy Rev 15(2):1098–1116
Surrogates for Biodiesel: Review and Challenges 199

Response Surface Methodology BasedMulti-objective Optimizationof the Performance-Emission Profileof a CI Engine Running on Ethanolin Blends with Diesel
Probir Kumar Bose, Vijay Narayan Bodkhe, Bishop Deb Barmaand Rahul Banerjee
Abstract The present study is aimed at optimizing the effect of ethanol-dieselblends on the performance and emission characteristics of a single cylinder (indirectinjection) four-stroke diesel engine at different loads. Hexane was used as aco-solvent for higher ethanol concentration while Diethyl ether (DEE) was added asan ignition improver. D-optimal was chosen as the Design of experimentmethodology. Quadratic polynomial models were constructed for the desiredemission-performance parameters based on experimental data through the ResponseSurface Methodology NOx, CO and HC were chosen as the emission outputparameters while BSFC. Load and ethanol-hexane-DEE concentration in the dieselblend were chosen as the input parameters. Multi-objective optimization involvingthe objective of minimizing both the emission and BSFC simultaneously yielded anoptimal input condition of 5% hexane and 15% DEE in blend with 40% ethanol anddiesel at 95% full load operation with 15.3% absolute error in NOx, 17.1% in HC,1.69% in CO and 3.4% in BSFC estimation with respect to actual experimentalvalues at the calibrated test condition predicted through RSM model optimization.
Keywords Design of experiment � D-optimal � Desirability approach � RSMperformance-emission trade-off � Multiobjective optimization
P.K. Bose (&)NSHM Knowledge Campus, Durgapur, Indiae-mail: [email protected]
V.N. Bodkhe � R. BanerjeeDepartment of Mechanical Engineering, National Institute of Technology,Agartala, India
B.D. BarmaDepartment of Production Engineering, National Institute of Technology,Agartala, India
© Springer Nature Singapore Pte Ltd. 2017A.K. Agarwal et al. (eds.), Biofuels, Green Energy and Technology,DOI 10.1007/978-981-10-3791-7_11
201

1 Introduction
The environmental effects like global warming and climate change, have greatlyincreased the interest of legislative agencies in making emission standards stricterfor diesel engines. Diesel engines are widely used in off road and on road appli-cations. There exist a sufficient number of alternatives to diesel which includesButanol, Ethanol, Hydrogen, Biodiesel, Natural gas, propane [1]. Among thesealternative fuels ethanol has emerged as a plausible on gasoline and diesel pow-ertrains due to its low cost, simplicity in production, renewability, low toxicity, highoctane [2, 3]. Ethanol can be made from agricultural yield such as corn potatoes,waste paper, wheat, brewery waste by fermenting sugars and food-waste. Researchwork published earlier [4] proved that the use of this renewable component i.e.ethanol in diesel provides a significant reduction in particulate emissions, with noconsiderable increase in other gaseous emissions. Huang et al. [5] in their study ona diesel engine fuelled with ethanol-diesel blends observed that the thermal effi-ciency of the engine when run on diesel ethanol blend were near to baseline dieseloperation with a slight penalty of increment in fuel consumption. That said, thereare problems associated with the direct use of ethanol by blending it with diesel,which include mainly phase separation and an overall decrease in cetane no. of theethanol-diesel blend. Ethanol, when blended with diesel, is observed to separateafter few hours of mixture formation due to the difference in chemical properties ofethanol and diesel. Phase separation of the blend can also be termed asnon-homogeneous fuel. Non-homogeneous fuel disrupts the smooth operation ofthe engine as fuel injector cannot inject it (Non-homogeneous fuel) properly [6].Phase separation can be avoided with the use of either Co-Solvent or Emulsifier [7].Emulsifier helps to avoid phase separation but requires heating and blending of thefuel whereas with the addition of co-solvent phase separation can be avoided bymere stirred and mixing of the blend component properly [2]. Among the differentco-solvents available, hexane has good miscibility with Ethanol [8]. Also, it hasshown a positive impact on the performance and emission characteristics of thediesel engine when blended with diesel in the proportion of 4, 6 and 8% by volume.Almost at all concentration n-hexane and n-pentane, 3–6% rise in thermal efficiencywas observed. At the same time, 5–6% decrease in NOx emission was alsoobserved for the blend of n-hexane. NOx decrement was higher for a higher con-centration of hexane, and this maximum value of NOx reduction was 7.528%associated with the 8% blend of n-hexane and diesel. The cetane number of ethanolis around 8, which it lowers the overall cetane of the blend. The decrement in theperformance observed with Diesel-Ethanol Blends as used in four-cylinder directinjection engine have been seen to be distinctly improved by the addition of CetaneImprovers to the blends [9]. Though optimizing the baseline diesel injection timingcan be an exploratory alternative to address the combustion and performancedeteriorations, arising out of prolonged ignition delays, studies have clearlyestablished that cetane improvers provide a more pragmatic solution to the itera-tions involved in optimising the injection timings during blend operation [9–11].
202 P.K. Bose et al.
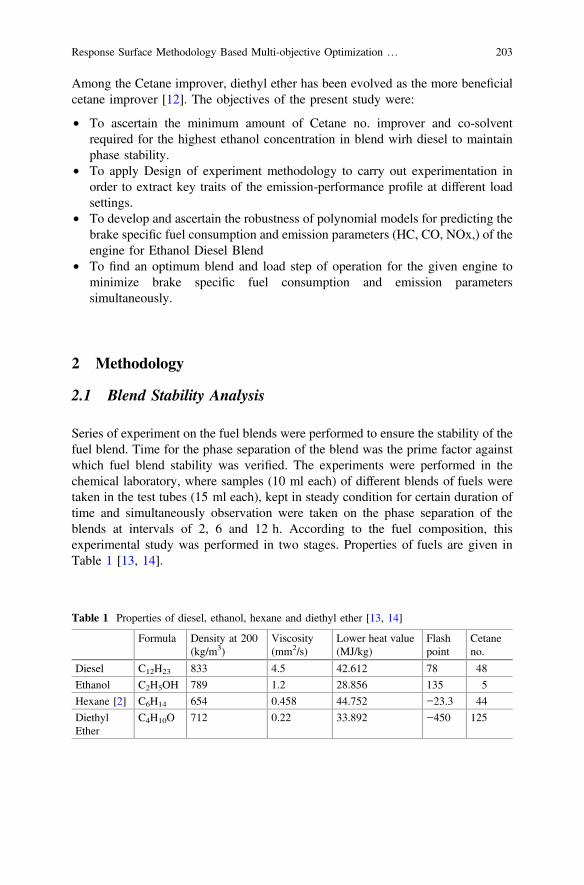
Among the Cetane improver, diethyl ether has been evolved as the more beneficialcetane improver [12]. The objectives of the present study were:
• To ascertain the minimum amount of Cetane no. improver and co-solventrequired for the highest ethanol concentration in blend wirh diesel to maintainphase stability.
• To apply Design of experiment methodology to carry out experimentation inorder to extract key traits of the emission-performance profile at different loadsettings.
• To develop and ascertain the robustness of polynomial models for predicting thebrake specific fuel consumption and emission parameters (HC, CO, NOx,) of theengine for Ethanol Diesel Blend
• To find an optimum blend and load step of operation for the given engine tominimize brake specific fuel consumption and emission parameterssimultaneously.
2 Methodology
2.1 Blend Stability Analysis
Series of experiment on the fuel blends were performed to ensure the stability of thefuel blend. Time for the phase separation of the blend was the prime factor againstwhich fuel blend stability was verified. The experiments were performed in thechemical laboratory, where samples (10 ml each) of different blends of fuels weretaken in the test tubes (15 ml each), kept in steady condition for certain duration oftime and simultaneously observation were taken on the phase separation of theblends at intervals of 2, 6 and 12 h. According to the fuel composition, thisexperimental study was performed in two stages. Properties of fuels are given inTable 1 [13, 14].
Table 1 Properties of diesel, ethanol, hexane and diethyl ether [13, 14]
Formula Density at 200(kg/m3)
Viscosity(mm2/s)
Lower heat value(MJ/kg)
Flashpoint
Cetaneno.
Diesel C12H23 833 4.5 42.612 78 48
Ethanol C2H5OH 789 1.2 28.856 135 5
Hexane [2] C6H14 654 0.458 44.752 −23.3 44
DiethylEther
C4H10O 712 0.22 33.892 −450 125
Response Surface Methodology Based Multi-objective Optimization … 203

2.1.1 Stability of Ethanol-Diesel Blends
The aim of this study section was to verify the stability of ethanol-diesel blend afterstirring and mixing for selected duration of time. Blends E10D90, E15D85,E20D80, E25D75, E30D70, E35D65, and E40D60 [where E xx = % vol of ethanolconcentration in a given ethanol diesel blend] were observed immediately after5 min, after 2, 6, 8 and 12 h. Table 2 shows the test results of the solubility and thephysical stability of the Ethanol-Diesel blends. From the table, it can be seen thatfor all the blends, two different layers were formed. E10D90, which was not sep-arated even after 12 h of the start of Test; E25D75 separated after 2 h while andE30D70 separated immediately even after stirring. The results show that the blendsof ethanol greater than 25% vol with diesel were not stable and were all separatedafter 5 min.
2.1.2 Deciding Volume Percentage of Solvent
To maintain phase stability of ethanol-diesel blend, hexane was used as co-solvent.The aim of this analysis was to decide the minimum amount of co-solvent, whichwas to be added to the Ethanol-diesel blend in order to maintain phase stability. NoCetane Improver was added in this experiment. The blends were observed for aspecified time duration for phase separation. Hexane was added in two differentamount, i.e., 2 and 5% vol. for E10, E15, E20, E25, E30, E35, and E40 of ethanolconcentrations in the blend. When ethanol was varied between 10 and 40%, theminimum Hexane required maintaining the stability of blend was found to be 5% asseen from Table 3.
Table 2 Phase separation duration in ethanol-diesel blend
Blend Time
Instant(Up to 5 min) no stirring
After 2 h(Stirred)
After 6 h(Stirred)
After 12 h(Stirred)
E10D90 Homogeneous Homogeneous Homogeneous Homogeneous
E15D85 Homogeneous Homogeneous Phase separation –
E20D80 Homogeneous Homogeneous Phase separation –
E25D75 Homogeneous Phase separation – –
E30D70 Phase separation – – –
E35D65 Phase separation – – –
E40D60 Phase separation – – –
204 P.K. Bose et al.
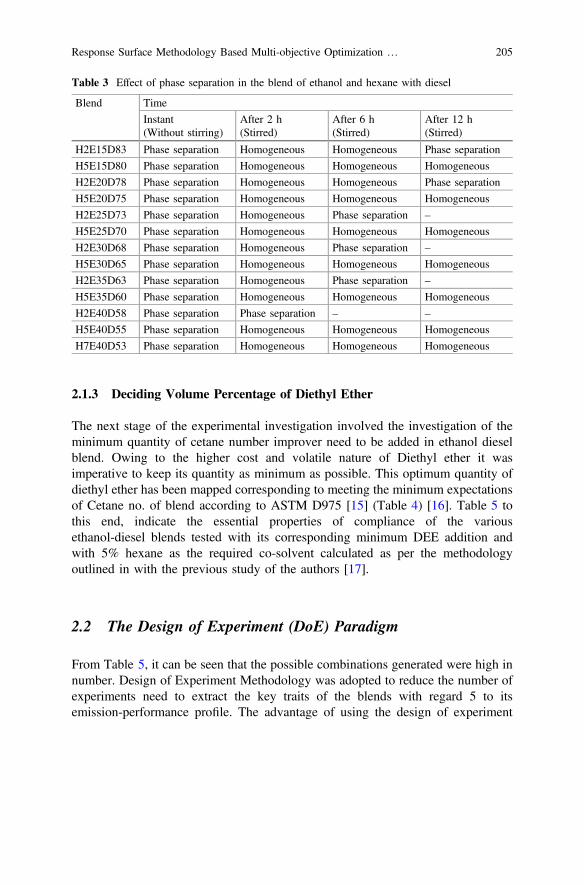
2.1.3 Deciding Volume Percentage of Diethyl Ether
The next stage of the experimental investigation involved the investigation of theminimum quantity of cetane number improver need to be added in ethanol dieselblend. Owing to the higher cost and volatile nature of Diethyl ether it wasimperative to keep its quantity as minimum as possible. This optimum quantity ofdiethyl ether has been mapped corresponding to meeting the minimum expectationsof Cetane no. of blend according to ASTM D975 [15] (Table 4) [16]. Table 5 tothis end, indicate the essential properties of compliance of the variousethanol-diesel blends tested with its corresponding minimum DEE addition andwith 5% hexane as the required co-solvent calculated as per the methodologyoutlined in with the previous study of the authors [17].
2.2 The Design of Experiment (DoE) Paradigm
From Table 5, it can be seen that the possible combinations generated were high innumber. Design of Experiment Methodology was adopted to reduce the number ofexperiments need to extract the key traits of the blends with regard 5 to itsemission-performance profile. The advantage of using the design of experiment
Table 3 Effect of phase separation in the blend of ethanol and hexane with diesel
Blend Time
Instant(Without stirring)
After 2 h(Stirred)
After 6 h(Stirred)
After 12 h(Stirred)
H2E15D83 Phase separation Homogeneous Homogeneous Phase separation
H5E15D80 Phase separation Homogeneous Homogeneous Homogeneous
H2E20D78 Phase separation Homogeneous Homogeneous Phase separation
H5E20D75 Phase separation Homogeneous Homogeneous Homogeneous
H2E25D73 Phase separation Homogeneous Phase separation –
H5E25D70 Phase separation Homogeneous Homogeneous Homogeneous
H2E30D68 Phase separation Homogeneous Phase separation –
H5E30D65 Phase separation Homogeneous Homogeneous Homogeneous
H2E35D63 Phase separation Homogeneous Phase separation –
H5E35D60 Phase separation Homogeneous Homogeneous Homogeneous
H2E40D58 Phase separation Phase separation – –
H5E40D55 Phase separation Homogeneous Homogeneous Homogeneous
H7E40D53 Phase separation Homogeneous Homogeneous Homogeneous
Response Surface Methodology Based Multi-objective Optimization … 205

methodology is to evaluate the performance of the engine over the entire range ofvariation of fuel blend and load with as a minimum number of experiments aspossible. The concept of undertaking a design of experiment is to statistically planthe experimental design and then performing the designated experiments to getmost information on the main and interactive effects of the participating controllingvariables or input factors.
The research work done earlier focuses on the effect operating parameters on theperformance and emission by varying one factor at a time. However, for thecomplete information on the effect of fuel composition and operating parameter onthe performance and emission of diesel engine, an extensive multivariate study ofthe input parameters on the output holds a strong prerogative. In such cases, use ofstatistical techniques like the design of experiment helps to extract the maximuminformation about interactive effects of input factors on the responses with aminimum number of the experiment [18]. The design of experiment can be done byemploying various statistical algorithms designed to this effect such as CCD, fullfactorial design. Box-Behnken, CCC, CCF, CCO, D-Optimal, Onion D-Optimaletc.
Among the methods stated above D-Optimal method has been extensively usedwhere there is both involvement of process and mixture factors with minimumexperiments as possible. Kitamura et al. [19] investigated about predictive accuracyof empirical engine models employing design of experiments methodology. Effectof a number of measurement points on the accuracy of models for different designssuch as D-Optimal, Latin Hypercube Sampling (LHS) was discussed extensively inthis literature. A higher level of accuracy was observed with the implementation ofD-Optimal design than that with Latin Hypercube Sampling (LHS). El-Gendy et al.[20] optimized the transesterification of waste cooking oil by using D-Optimaldesign method based on RSM to find out the significance and interactive effects ofcatalyst concentration, mixing rate and reaction time on biodiesel production.Borhan et al. [21] undertook the optimization of Okara Soap formulation forStratum Corneum application by using the D-Optimal design method of design ofthe experiment. Optimal design was applied to investigate the influence of the maincomposition. The presented study showed that optimization study of Okara soap
Table 4 Compliance properties of conventional diesel fuels and various e-diesel products [3, 16]
Property ASTMmethod
Units No. 02 dieselrequirement
Blend dieselrequirement
Ethanol content Nominal vol% – –
ASTM D975 [4]
Flash point D93 °C, min 52 58
Kinematic viscosity40 °C
D445 mm2/sminmm2/s,max
1.94.1
–
Cetane no. D613 min 40 42
Cetane index D975 min 40 –
206 P.K. Bose et al.
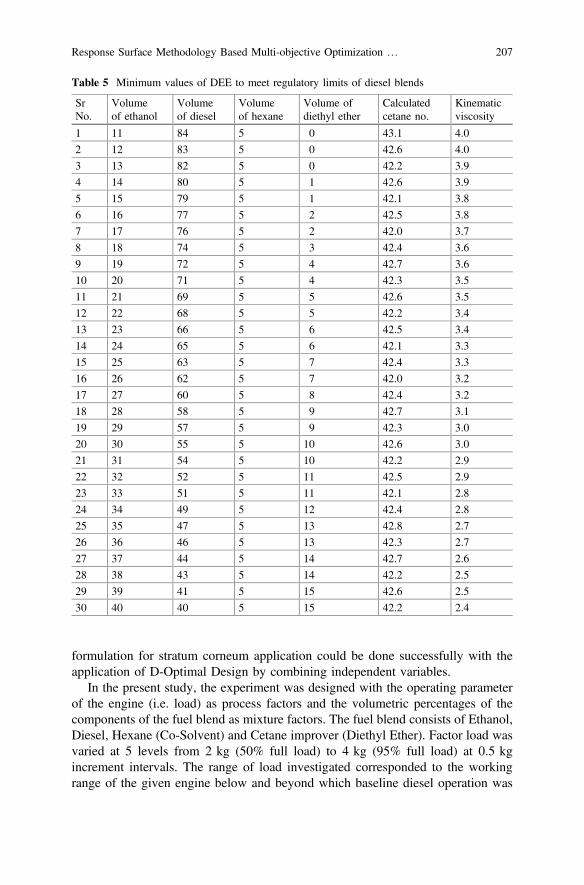
formulation for stratum corneum application could be done successfully with theapplication of D-Optimal Design by combining independent variables.
In the present study, the experiment was designed with the operating parameterof the engine (i.e. load) as process factors and the volumetric percentages of thecomponents of the fuel blend as mixture factors. The fuel blend consists of Ethanol,Diesel, Hexane (Co-Solvent) and Cetane improver (Diethyl Ether). Factor load wasvaried at 5 levels from 2 kg (50% full load) to 4 kg (95% full load) at 0.5 kgincrement intervals. The range of load investigated corresponded to the workingrange of the given engine below and beyond which baseline diesel operation was
Table 5 Minimum values of DEE to meet regulatory limits of diesel blends
SrNo.
Volumeof ethanol
Volumeof diesel
Volumeof hexane
Volume ofdiethyl ether
Calculatedcetane no.
Kinematicviscosity
1 11 84 5 0 43.1 4.0
2 12 83 5 0 42.6 4.0
3 13 82 5 0 42.2 3.9
4 14 80 5 1 42.6 3.9
5 15 79 5 1 42.1 3.8
6 16 77 5 2 42.5 3.8
7 17 76 5 2 42.0 3.7
8 18 74 5 3 42.4 3.6
9 19 72 5 4 42.7 3.6
10 20 71 5 4 42.3 3.5
11 21 69 5 5 42.6 3.5
12 22 68 5 5 42.2 3.4
13 23 66 5 6 42.5 3.4
14 24 65 5 6 42.1 3.3
15 25 63 5 7 42.4 3.3
16 26 62 5 7 42.0 3.2
17 27 60 5 8 42.4 3.2
18 28 58 5 9 42.7 3.1
19 29 57 5 9 42.3 3.0
20 30 55 5 10 42.6 3.0
21 31 54 5 10 42.2 2.9
22 32 52 5 11 42.5 2.9
23 33 51 5 11 42.1 2.8
24 34 49 5 12 42.4 2.8
25 35 47 5 13 42.8 2.7
26 36 46 5 13 42.3 2.7
27 37 44 5 14 42.7 2.6
28 38 43 5 14 42.2 2.5
29 39 41 5 15 42.6 2.5
30 40 40 5 15 42.2 2.4
Response Surface Methodology Based Multi-objective Optimization … 207

inhibited due to engine stability issues. Ranges for the mixture factors weredetermined according to the constraints placed. The first constraint placed was theCetane no of blend should not fall below the limit prescribed by the “ASTM D975standard for the fuels and composition” [15]. As low Cetane no affects the per-formances of the engine [22], the second constraint placed on the factors wasnatural, the summation of volume percentages of components of blend should notexceed 100%.
Volume PercentageBlend component ¼ 100 ¼ xETH þ xDEE þ xHEX þ xD ð1Þ
The objective of the experiment was to find the optimum composition of theblend and generate the model equation for the responses. From the total no ofdesigns generated, the one with maximum value (73.7955017) of G-efficiency with19 runs was selected as the design for carrying out experiments. G-efficiency hasbeen defined as in [23]
where: G-efficiency ¼ 100 �ffiffiffifn
q=rm:
It has been chosen as the index of efficiency for the present D-optimal designoutput as it contains constraints set by mixture variables. This measure being relatedto the G-optimality criterion invoked to minimize the maximum value of thestandard error of the predicted responses during optimization. Now, according tothe run order given in the design matrix (Table 6), experiments were performed,and values of the responses were noted corresponding to each designed experiment.
Table 6 Design matrixgenerated
Runorder
Load Hexane Diethylether
Ethanol Diesel
1 2 0.05 0.00 0.13 0.82
2 2 0.05 0.15 0.40 0.40
3 2 0.05 0.00 0.13 0.82
4 2 0.05 0.15 0.40 0.40
5 2 0.05 0.09 0.29 0.57
6 2.5 0.05 0.15 0.40 0.40
7 2.5 0.05 0.00 0.13 0.82
8 2.5 0.05 0.05 0.22 0.68
9 3.5 0.05 0.15 0.40 0.40
10 3.5 0.05 0.15 0.40 0.40
11 3.5 0.05 0.00 0.13 0.82
12 4 0.05 0.15 0.40 0.40
13 4 0.05 0.00 0.13 0.82
14 4 0.05 0.00 0.13 0.82
15 4 0.05 0.10 0.31 0.54
16 4 0.05 0.10 0.31 0.54
17 3 0.05 0.09 0.29 0.57
18 3 0.05 0.09 0.29 0.57
19 3 0.05 0.09 0.29 0.57
208 P.K. Bose et al.

Where f stands for the number of design factors, n being the number of runsproposed in the design; rm denotes the maximum standard error of predictionacross the generated candidate experiments.
2.3 The Experimental Setup
The engine test rig consisted of a diesel engine, calorimeter, Eddy currentdynamometer, fuel tank, fuel flow measurement system, data acquisition system.The engine specification is given in Table 7 while the setup has been depicted inFig. 1. The engine was loaded by Eddy current a Powermag dynamometer with themaximum loading capacity of 6 kg. The load was measured by load cell of 20 kgcapacity and provided a precision of 0.02 kg increment. Load mentioned in kg wastranslated in corresponding to N-m scale via the following correlation provided byengine vendor:
Load ðN-m) ¼ Load in ðkgÞ � 9:81 � 0:25:
The in-cylinder pressure sensor and crank angle encoder were synchronized ontothe GUI based Engine post processing software. The data was averaged over a timespan corresponding to 100 consecutive cycles at the constant engine speed of1500 rpm (±2%) to avoid error due to cyclic variations. Determination of Specificfuel consumption was done using fuel burette of 30 ml volume. The time required forthe drop in 0.3 ml of fuel in the fuel burette was observed and thereby specific fuelconsumption for each blend was evaluated. The experiment was performed at the30 °C ambient temperature. The cooling water temperature was recorded as 26 °C.
Table 7 Specification of test engine
Make/model Kirloskar varsha
Type Horizontal single cylinder four stroke indirect injection dieselengine
Combustion type Pre-combustion chamber type
Cooling Air
Displacement (sweptvolume)
0.381 L
Bore size 74 mm (0.074 m)
Stroke length 74 mm (0.074 m)
Swept volume 0.831 L
CR 20
Connecting length 200 mm (0.200 m)
Fuel Diesel
Speed 1500–1800 RPM
HP 4 HP
Response Surface Methodology Based Multi-objective Optimization … 209

2.4 Error Analysis
To ensure the repeatability of the experiment an uncertainty analysis was under-taken where the index of uncertainty due to inconsistency in observation at anydesigned experimental step and instrument accuracy were as per Eq. 2.
DU ¼ffiffiffiffiffiffiffiffiffiffiffiffiffiffiffiffiffiffiffiffiffiffiffiffiffiffiffiffiffiffiffiffiffiffiffiffiffiffiffiffiffiffiffiffiffiffiffiffiffiffiffiffiffiffiffiffiffiffiffiffiffiffiffiffiffiffiffiffiffiffiffiffiffiffiffiffiffiffiffiffiffiffiffiffiffiffiffiffiffiffiffiffiffiffiffiffiffi@U@X1
DX1
� �2
þ @U@X2
DX2
� �2
þ � � � @U@Xn
DXn
� �2s
ð2Þ
The accuracy of the computed performance and emission parameters are cal-culated on the basis of the corresponding components of engine and emissionanalysis instrumentation, as declared by their respective manufacturers [24]. Theroot mean square method is used to carry out combined uncertainty analysis of theperformance parameters by which total uncertainty U of a quantity Q has beenestimated, depending on the independent variables x1, x2, x3, xn (i.e., Q = f[x1, x2,…xn]) having individual errors Δx1, Δx2, …, Δxn is given by Eq. (2) [25]. Brakepower and Brake specific fuel consumption were analysed for the uncertainty usingthe combined uncertainty analysis method. Individual uncertainty of the all theinstruments which were used to measure brake power and brake specific fuelconsumption were considered. Uncertainty has been shown in terms of percentagein Tables 8 and 9 [17].
Fig. 1 Experimental setup
210 P.K. Bose et al.

2.5 Emission Analysis
Exhaust gasses were sampled and measured by AVL Di-Gas 444 emission ana-lyzer. Emission analyzer was used to mainly to measure the contents of oxides ofnitrogen (ppm), Hydrocarbon (ppm) and carbon monoxide (%vol) in the exhaust.Average of 5 readings each sampled over a time span corresponding to 100 cyclesfor a given designed experiment at a given load step was computed and logged.
2.6 RSM Technique: An Optimization Approach
Silva et al. [26] applied response surface methodology for optimization of biodieselproduction by transesterification of soybean oil with ethanol The biodiesel pro-duction process by transesterification of soybean oil with ethanol was optimized bythe application of full factorial design and response surface methodology as part ofan optimization procedure. The mutual effects of the molar ratio of alcohol, tem-perature, catalyst concentration and reaction time in relation to oil were investigatedand optimized. Pandian et al. [23] did an investigation on the effect of injectionsystem parameters on performance and emission characteristics of a twin cylindercompression ignition direct injection engine fuelled with Pongamia biodiesel–dieselblend using response surface methodology. The design of experiments (DoE) wasused to design the experiments. Responses such as Brake Thermal Efficiency(BTE), Carbon monoxide (CO), Hydrocarbon (HC), Brake Specific EnergyConsumption (BSEC), smoke opacity and Nitrogen Oxides (NOx) were well pre-dicted by resultant models obtained by response surface methodology. Also, thesemodels helped to identify significant Interactions between the input factors.Desirability approach of Response surface methodology was used. An injectiontiming of 21° BTDC, an injection pressure of 225 bar, and tip protrusion of 2.5 mmnozzle were found to be optimal values for the 7.5 kW engine usingbiodiesel-blended diesel fuel at 1500 rpm. Lee and Reitz [27] undertook a
Table 8 Total percentage ofuncertainty of computedperformance parameters
Measurements Accuracy Percentageuncertainty
Engine speed ±1 rpm ±0.2
Temperatures ±10 C ±0.1
Nitrogen oxides ±20 ppm ±0.2
Hydrocarbon ±10 ppm ±0.2
Carbon monoxide ±0.02% ±1.0
Burettemeasurements
±0.3 CC ±1.5
Crank angle encoder ±0.50 CA ±0.2
Load ±1 N ±0.2
Response Surface Methodology Based Multi-objective Optimization … 211

Response Surface Method Optimization of a High-Speed Direct-Injection DieselEngine equipped with a common rail injection system. Response surface method-ology was utilized to find out role of EGR and other parameters in reducing theemission footprint. The engine was test run @ 1757 rev/min, 45% load. Injectiontiming, Injection pressure, boost pressure and EGR rate were the variables for theoptimization process. It was observed that RSM model based optimization is aneffective tool for utilizing the interactive effects of combustion control techniquesused during the investigation.
As in the previous case studies highlighted, the present study puts forward thenecessity of optimization with the multiple responses of interest. For optimizingthese multiple responses, techniques such as desirability approach, overlayingcontour plots for each response and constrained optimization problems have beenused widely [23].
In the present work, desirability approach based on response surface method-ology was used for the optimization of operating (i.e. load) as well as mixturefactors (blends components).
Desirability approach offers inherent benefits like availability in the softwarepackages, its simplicity in use and flexibility in weighing and giving moreimportance to any individual response.
The optimization analysis was carried wherein each response was transformedinto a dimensionless desirability value (d). The value of d suggests whether theresponse is acceptable or not. This value of d ranges between d = 0, which suggestresponse is absolutely unacceptable and d = 1 (highest value of d) suggesting it asthe most desirable response. Contingent on the nature of the objectives to behandled, the goal of each response parameter can be set to be minimized, maxi-mized or set a target range or an exact value. Based on the proposals set forth in thestudy of [28], Eqs. 3–6 indicate the methodology for calculating the desirability ofthe each response depending upon the goal of response.
Table 9 Total percentage of uncertainty of computed performance parameters [5, 22]
Computedperformanceparameter
Measuredvariables
Instrumentinvolved inmeasurement
% Uncertaintyof measuringinstrument
Calculation Total %uncertainty ofcomputedparameters
B.P (BrakePower)
Load, RPM Load sensor,Loadindicator,Speedmeasuringunit
0.210.101.1
√[0.212 + 0.102 + 1.12] 1.12
BSFC SFC (LiquidFuel)BP
BurettemeasurementsFrom BPmeasurement
1.51.01
√[1.52 + 1.122] 1.81
212 P.K. Bose et al.

When an objective is of minimum, di = 1 (as objective is minimum, so valuebecomes a set minimum value becomes unacceptable) when Yi � Lowi; di = 0when Yi � High; and
di ¼ Highi � Yi
Highi � Lowi
� �wti
When Lowi\Yi\Highi ð3Þ
When an objective is of maximum, di = 0 when Yi � Lowi; di = 1 whenYi � Highi and
di ¼ Yi � Lowi
Highi � Lowi
� �wti
When Lowi\Yi\Highi ð4Þ
When an objective is of target, di = 0, when Yi < Lowi; Yi > Highi
di ¼ Yi � Lowi
Ti � Lowi
� �wt1i
When Lowi\Yi\Ti ð5Þ
di ¼ Yi � HighiTi � Highi
� �wt2i
When Ti\Yi\Highi; and ð6Þ
When an objective is within the range, di = 1 when Lowi < Yi < Highi anddi = 0; otherwise.
In the above formulas, ‘‘i’’ suggests the response, ‘‘Y’’ the value of response,‘‘Low’’ stands for the lower limit of the response, ‘‘High’’ stands for the upper limitof the response, ‘‘T’’ means the target value of the response, ‘‘wt’’ specifies theweight of the response. The weight field possesses potential of changing the shapeof desirability function for each response. Lower/upper bound can be given more orless preference with the help of weights. Weight greater than 1 gives more pref-erence to the objective whereas weights lower than 1 give less preference to theobjective, in such manner weights can be varied in the range of 0.1–10. When theweight value is equal to one, the desirability function varies in a linear mode. Tosolve the problem of multiple response optimization, the desirability approach usesa technique by which all the responses are combined into a dimensionless measureof performance named as the Overall desirability function denoted by D variesbetween 0 and 1. Overall desirability function is calculated by the following Eq. 7[23].
D ¼Yn
i¼1drii
� � 1Pri ð7Þ
The desirability functions dk (where k = 1… m, responses) are generally usedby the optimizing algorithm of the statistical packages to search for the possible
Response Surface Methodology Based Multi-objective Optimization … 213

combination of input factor values which can predict a result in the given responsespecification as near to the target as possible for each response. The overalldesirability function, f(ds) which is the sum of all dk is a measure of the besttrade-off solution among the competing objectives that need to be satisfied simul-taneously in a typical multiobjective optimization endeavour. Desirability functionwill only be able to find the optimum value if optimizer specification (Min, Target,Max) and the selected Desirability objective are given and chosen appropriately.Each response is generally compared with another response by allocating animportance (r) relative to the other. This importance r takes value from 1 to 5 where1 stands for least important and 5 stands for most important. The best and mostdesirable function is generally identified by the function for which D value is larger.Individual desired function (d) that maximizes D helps to determine the optimalvalues of the input factors. The iteration that produces a minimum value of Log(D) [where D is the normalized distance to target] is selected as the best run for theobjectives set.
3 Results and Discussion
3.1 Response Model Formulation
From variable importance plot i.e. from Fig. 2 the terms for which VariableImportance (VIP) values were greater than 0.8 have been deemed as a significantterm for which the values of the coefficient (scaled and cantered) were taken fromthe coefficient analysis. Using the values of the constant and coefficients, the modelequation for the responses were constructed based on a multi-regression analysiswith quadratic order polynomial [23, 29] in order to capture any significant inter-action effects of the input parameters evident from Fig. 2.
3.1.1 NOx Model Formulation
NOx ¼ 30:605� 2:72469 � L � DEEþ 2:72634 � L � DIE� 2:72689 � L� ETHþ 6:24731 � L � L� 3:35794 � L� 0:878447 � DEEþ 0:873382� DIE� 0:870453 � ETH
ð8Þ
where NOx (Fig. 3) is the amount of oxides of Nitrogen in exhaust gases (ppm), Lis the load in kg, DEE is the diethyl ether (in volume percentage), ETH is theamount of ethanol (in volume percentage).
214 P.K. Bose et al.

Fig. 2 VIP Plot for forming the model equation
Fig. 3 Significance of the model terms coefficients in the NOx equation
Response Surface Methodology Based Multi-objective Optimization … 215

3.1.2 HC Model Formulation
HC ¼ 73:6482� 5:77758 � DEE � DEEþ 5:74718 � DEE � DIE� 5:72781 � DEE � ETH� 5:7085 � DIE � DIEþ 5:68463 � ETH � DIE� 5:65832 � ETH � ETHþ 2:54231 � L � DEE� 2:53318 � L � DIEþ 2:52773 � L � ETH� 1:79642 � ETHþ 1:79379 � DIE� 1:78869 � DEE� 0:861918 � L � Lþ 1:64832 � L
ð9Þ
where HC (Fig. 4) is the amount of hydrocarbon in exhaust gases (ppm), L is theload in kg, DEE is the diethyl ether (in volume percentage), ETH is the amount ofethanol (in volume percentage).
3.1.3 CO Model Formulation
CO ¼ 0:0683459� 0:00545963 � Lþ 0:00158234 � L � DEE� 0:00157988 � L � DIEþ 0:00157828 � L � ETH� 0:00104385 � DEE � DEEþ 0:00103776 � DEE � DIE� 0:00103393 � DEE � ETH� 0:00103067 � DIE � DIEþ 0:00102631 � ETH � DIE� 0:00102166 � ETH � ETHþ 0:000446938 � DEEþ 0:000449426 � ETH� 0:000448573 � DIE� 0:00156091 � L � L
ð10Þ
Fig. 4 Significance of the model terms coefficients in the HC equation
216 P.K. Bose et al.
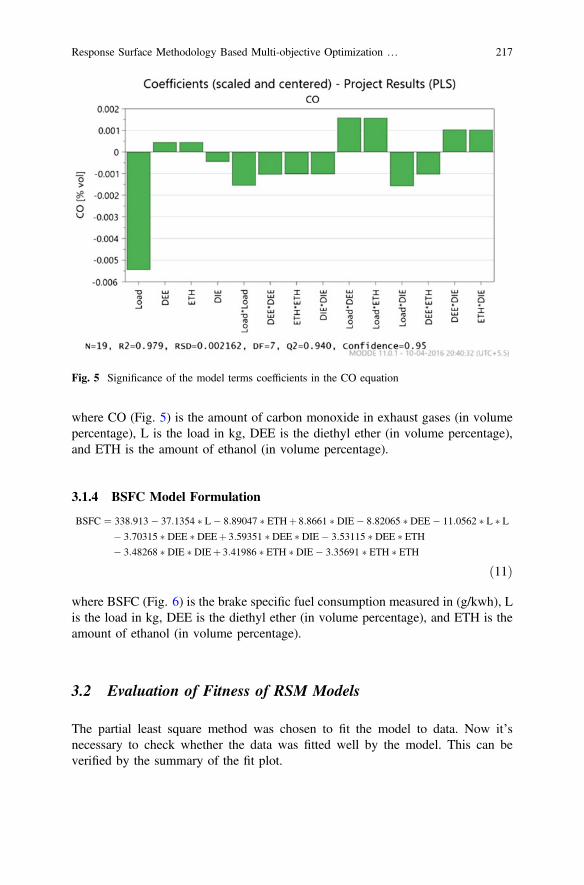
where CO (Fig. 5) is the amount of carbon monoxide in exhaust gases (in volumepercentage), L is the load in kg, DEE is the diethyl ether (in volume percentage),and ETH is the amount of ethanol (in volume percentage).
3.1.4 BSFC Model Formulation
BSFC ¼ 338:913� 37:1354 � L� 8:89047 � ETHþ 8:8661 � DIE� 8:82065 � DEE� 11:0562 � L � L� 3:70315 � DEE � DEEþ 3:59351 � DEE � DIE� 3:53115 � DEE � ETH� 3:48268 � DIE � DIEþ 3:41986 � ETH � DIE� 3:35691 � ETH � ETH
ð11Þ
where BSFC (Fig. 6) is the brake specific fuel consumption measured in (g/kwh), Lis the load in kg, DEE is the diethyl ether (in volume percentage), and ETH is theamount of ethanol (in volume percentage).
3.2 Evaluation of Fitness of RSM Models
The partial least square method was chosen to fit the model to data. Now it’snecessary to check whether the data was fitted well by the model. This can beverified by the summary of the fit plot.
Fig. 5 Significance of the model terms coefficients in the CO equation
Response Surface Methodology Based Multi-objective Optimization … 217

Observation: From the plot shown in Fig. 7, it can be observed that values of R2Q2 are well above 0.5. So it can be said that models can be treated as significant asthey overrule the null hypothesis at 95% confidence level of estimation.
Fig. 6 Significance of the model terms coefficients in the BSFC equation
Fig. 7 Summary of fit plot for the model fitted to the experimental data
218 P.K. Bose et al.

3.2.1 Assessing Model Adequacy by Using Residual Plots Obtainedfor the Model
The residual plots were used to determine whether model meets the assumptions ofanalysis and in turn to check whether it is adequate or not. If the assumption werenot met then the model may not fit the data during subsequent predictive iterationsin the unexplored experimental domains and will require further investigations ofrecalibration after optimization.
Assumptions needed to be met were as the following
a. Residuals are normally distributedb. Residuals are randomly distributed and have constant variancec. Residuals are independent from one another.
Obtained Plots were as following, and they are discussed in the sub sequentsection.
• Normal probability plot of residuals,• Plot of residuals against fitted values, run order or other factors
From Figs. 8 and 9 it can be seen the normal probability plot of residuals isapproximately following the straight line. So the model fulfills the assumption thatresiduals are normally distributed. As there is no point far away from the straight line,it indicates no presence of any outliers. The plot in the Figs. 10 and 11 shows theresiduals versus the fitted values. No uneven spreading of the residuals across fittedvalues exist across all four responses; there exist no point, which is far away from
Fig. 8 Residuals versus normal probability plot for NOx and BSFC
Response Surface Methodology Based Multi-objective Optimization … 219

zero line. Points are falling on both sides of abscissa with no distinguishable patternsin the points. As the spreading of residuals across the fitted values is even, thisindicates that model fulfills the assumption of the presence of constant variance.
Fig. 9 Residuals versus normal probability plot for HC and CO
Fig. 10 Residual versus predicted response for NOx and HC
220 P.K. Bose et al.

Observation of Residuals fall randomly around the centre line with no increasing ordecreasing trend observed in the residuals. No cyclic or repeating pattern nor anysudden shift in the point is observed. The observations from Figs. 12 and 13 sug-gest that the residuals were independent from one another. Figures 14 and 15 show
Fig. 11 Residual versus predicted response for BSFC and CO
Fig. 12 Residual versus run order for NOx and HC
Response Surface Methodology Based Multi-objective Optimization … 221

points are close to a straight line, which in turn indicate goodmodels. Theoretically, ifa model is able to explain 100% of the variance, the fitted values would always equalthe observed values and, therefore, all the data points would fall on the fittedregression line.
Fig. 13 Residual versus run order for BSFC and CO
Fig. 14 Observed versus predicted for NOx and HC
222 P.K. Bose et al.
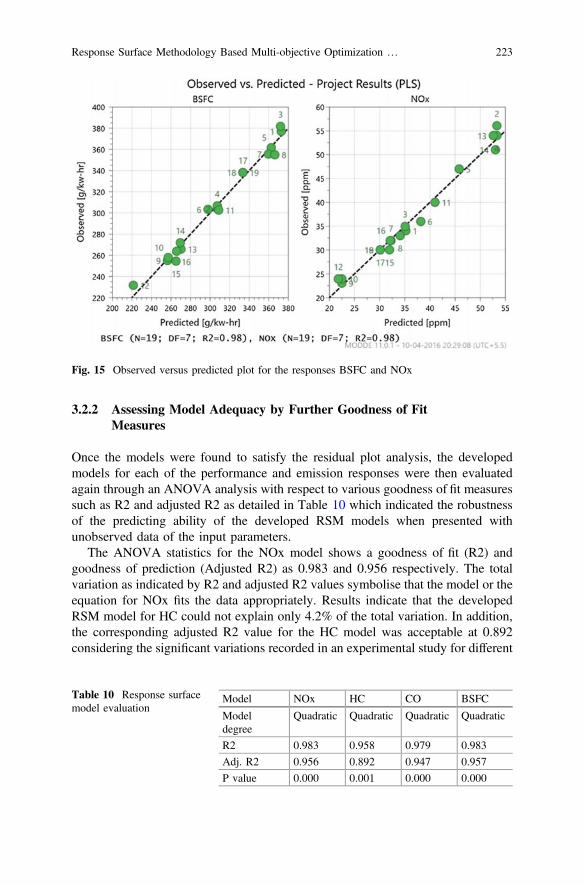
3.2.2 Assessing Model Adequacy by Further Goodness of FitMeasures
Once the models were found to satisfy the residual plot analysis, the developedmodels for each of the performance and emission responses were then evaluatedagain through an ANOVA analysis with respect to various goodness of fit measuressuch as R2 and adjusted R2 as detailed in Table 10 which indicated the robustnessof the predicting ability of the developed RSM models when presented withunobserved data of the input parameters.
The ANOVA statistics for the NOx model shows a goodness of fit (R2) andgoodness of prediction (Adjusted R2) as 0.983 and 0.956 respectively. The totalvariation as indicated by R2 and adjusted R2 values symbolise that the model or theequation for NOx fits the data appropriately. Results indicate that the developedRSM model for HC could not explain only 4.2% of the total variation. In addition,the corresponding adjusted R2 value for the HC model was acceptable at 0.892considering the significant variations recorded in an experimental study for different
Fig. 15 Observed versus predicted plot for the responses BSFC and NOx
Table 10 Response surfacemodel evaluation
Model NOx HC CO BSFC
Modeldegree
Quadratic Quadratic Quadratic Quadratic
R2 0.983 0.958 0.979 0.983
Adj. R2 0.956 0.892 0.947 0.957
P value 0.000 0.001 0.000 0.000
Response Surface Methodology Based Multi-objective Optimization … 223

blends. Also, p value for the model of HC was higher than other models but wasstill less than 0.05 to prove the model is still significant for predicting the values ofresponse HC. For the response of CO concentration in exhaust, the value ofdetermination coefficient (R2 = 0.979) and R2 adjusted was found to be 0.947suggesting that only 2% of the variation could not be explained by the RSM COmodel. The value of determination coefficient was high enough to consider themodel as significant as reasoned in the study of [29]. For the response of brakespecific fuel consumption, the value of determination coefficient (R2 = 0.983)suggested that the sample variation of 98.3% for BSFC attributed to the indepen-dent variables and only 0.017% of the total variation could not be explained by themodel. The value of adjusted determination coefficient (Adjusted R2 = 0.957) wasalso seen to be high suggesting adequate robustness in the predictive ability of themodel.
3.3 Optimization Results
Table 11 shows the results of the multiobjective optimization carried out based onthe approach detailed in Sect. 2.6. NOx, CO, HC and BSFC being the outputresponses that needed to be minimized corresponding to the range of load stepsoutlined in the Table 11. The response factors being inherently contradictory in itstraits of evolution in a typical diesel operation poses a multi-criteria investigationwhere no single optimum can satisfy the objectives of minimizing all responsefactors simultaneously. Thus, a trade-off solution is sought. The optimizationendeavour was carried out at first keeping the load constant at a given point ofinterest incremented in equal epochs. At each given load step, all possible com-bination of the ethanol-hexane-DEE concentration were explored through theoptimization iteration within the constraints of concentration of hexane and DEE inthe blend set as per Sects. 2.1 and 2.2. Optimization exploration at each load stepinvolved investigating the optimal set of constituents of a blend that yielded the bestemission-emission (NOx vs. CO vs. HC) and emission-performance (BSFC vs.NOx–CO–HC and BSFC vs. NOx) trade-off footprint at the given load step. Afterinvestigation at the chosen load steps, the optimization iteration was allowed to runwith the load step as an unconstrained factor (50–95% full load) in an effort toinvestigate the optimal load point of operation that provided the minimum BSFC–NOx–CO–HC trade-off footprint corresponding to a calibrated blend value ofethanol-hexane-DEE in diesel subject to the constraints as mentioned before.
For each load and with that particular strategy optimization was performed andbest run (experiment no) was selected based on the minimum Log (D) value. Thisprocedure was performed for different load steps and the obtained values of Log(D), and the optimum blend combination was then entered in the table.
The optimal trade-off point of operation was observed to be at 95% full load fora blend of 5% hexane, 15% Diethyl ether, 40% ethanol, and 40% Diesel yielding a
224 P.K. Bose et al.

predicted value of 22 ppm NOx, 34 ppm HC, 0.06% vol. CO and a BSFC of221 g/kw-at 1550 rpm.
3.4 Validation of Optimized Results
Validation of the optimized results was done by performing the experiment thrice atthat factor setting which gave optimized results and after that these three readings
Table 11 Optimum combination of load and blend
Load NOx HC CO BSFC Log D HEX DEE ETH DIESEL
2 kg (50% full load) 35 32 0.07 X 1.63 0.05 0.00 0.13 0.82
35 X 0.07 X 1.74 0.05 0.00 0.13 0.82
35 32 X X 1.29 0.05 0.00 0.13 0.82
53 8 0.06 306 1.68 0.05 0.15 0.40 0.40
35 X X 372 1.82 0.05 0.00 0.13 0.82
2.5 kg (60% full load) 32 28 0.06 X 1.46 0.05 0.00 0.13 0.82
32 X 0.06 X 1.57 0.05 0.00 0.13 0.82
32 28 X X 1.12 0.05 0.00 0.13 0.82
38 16 0.06 298 1.47 0.05 0.15 0.40 0.40
38 X X 298 1.50 0.05 0.15 0.40 0.40
3 kg (75% full load) 34 23 0.06 X 1.30 0.05 0.00 0.13 0.82
34 X 0.06 X 1.43 0.05 0.00 0.13 0.82
28 23 X X 0.80 0.05 0.15 0.40 0.40
28 23 0.06 281 1.34 0.05 0.15 0.40 0.40
28 X X 281 1.11 0.05 0.15 0.40 0.40
3.5 kg (85% full load) 41 20 0.05 X 1.30 0.05 0.00 0.13 0.82
22 X 0.06 X 1.42 0.05 0.15 0.40 0.40
22 29 X X 0.82 0.05 0.15 0.40 0.40
22 29 0.06 256 1.26 0.05 0.15 0.40 0.40
22 X X 256 0.61 0.05 0.15 0.40 0.40
4 kg (95% full load) 22 34 0.06 X 1.33 0.05 0.15 0.40 0.40
22 X 0.06 X 1.35 0.05 0.15 0.40 0.40
22 34 X X 1.00 0.05 0.15 0.40 0.40
22 34 0.06 221 1.21 0.05 0.15 0.40 0.40
22 X X 221 −0.60 0.05 0.15 0.40 0.40
Free mode at any load 22 34 0.06 221 1.20 0.05 0.15 0.40 0.40
Where, X denotes that the response was excluded during that particular optimisation stage
Response Surface Methodology Based Multi-objective Optimization … 225

were averaged and compared with the readings predicted by the statistical software.Validation test results are given in Table 12.
4 Conclusion
The following were the conclusions arrived on performing the several tests in anIDI single cylinder engine by varying the process factor i.e. load and mixturefactors i.e. Blend components.
1. Among tested quantities of Hexane, the maximum amount of hexane needed tomaintain phase stability of ethanol-diesel blend with a concentration of ethanolranging from E10 to E40 is 5% v/v.
2. Optimized results of NOx 22 ppm, HC 34 ppm, CO 0.06% vol. and BSFC221 g/kwh can be obtained at the Load 4 speed 1550 rpm for a blend of 5%hexane, 15% Diethyl ether, 40% ethanol, and 40% Diesel with minimizationcriteria for the ethanol-diesel blend with the addition of co-solvent and cetaneimprover.
3. The D-optimal method of the design of experiment considerably reduced thetime required by giving reduced no of experimental runs. It provided thepotential of designing the experiment efficiently and found extremely helpful inthe process. Also, statistical analysis helped to ascertain the significance of eachmodel developed for predicting response parameters.
4. Multiobjective optimization based on RSM models provided an acceptablecost-effective estimation of the optimal blend of ethanol in diesel with its nec-essary co-solvent and cetane improver additives.
Acknowledgements The authors gratefully acknowledge the kind support of the AICTE (Govt.of India) grant under the RPS projects entitled “Development of an artificial intelligence model tosimulate the performance and emission characteristics of a diesel engine operating in dual fuelmode with biodiesel and CNG under various EGR strategies” under Grant No: 8023/RID/RPS-4/(POLICY-III) (NER)/2011-12 and “An experimental study to explore the potential of biodieselethanol blend as an alternative fuel in diesel engine with hydrogen enrichment” under Grant No:8023/BOR/RID/RPS(NER)-34/2010-11 which has made this study possible.
Table 12 Validation of test results
Expno.
Load(kg)
HEX DEE ETH Diesel Responsetype
NOx(ppm)
HC(ppm)
CO (%vol.)
BSFC(g/kwh)
20 4 0.05 0.15 0.40 0.40 Actual 26 41 0.059 229
Predicted 22 34 0.06 221
%Absoluteerror
15.3 17.1 1.69 3.4
226 P.K. Bose et al.

References
1. Folkson R (2014) Alternative fuels and advanced vehicle technologies for improvedenvironmental performance: towards zero carbon transportation. Elsevier
2. Hansen AC, Zhang Q, Lyne PW (2005) Ethanol–diesel fuel blends—a review. BioresourTechnol 96(3):277–285
3. Ajav E, Akingbehin O (2002) A study of some fuel properties of local ethanol blended withdiesel fuel. Agric Eng Int CIGR J
4. Lapuerta M, Armas O, Herreros JM (2008) Emissions from a diesel–bioethanol blend in anautomotive diesel engine. Fuel 87(1):25–31
5. Huang J et al (2009) Experimental investigation on the performance and emissions of a dieselengine fuelled with ethanol–diesel blends. Appl Therm Eng 29(11):2484–2490
6. Yeom J, Park J, Chung S (2005) A study on the mixture formation process of diesel fuel sprayin unsteady and evaporative field. J Mech Sci Technol 19(12):2253–2262
7. Kwanchareon P, Luengnaruemitchai A, Jai-In S (2007) Solubility of a diesel–biodiesel–ethanol blend, its fuel properties, and its emission characteristics from diesel engine. Fuel86(7):1053–1061
8. Sadek PC (2002) HPLC solvent guide. Wiley-Interscience9. Xing-cai L et al (2004) Effect of cetane number improver on heat release rate and emissions of
high speed diesel engine fueled with ethanol–diesel blend fuel. Fuel 83(14):2013–202010. Ren Y et al (2008) Effects of the addition of ethanol and cetane number improver on the
combustion and emission characteristics of a compression ignition engine. Proc Instit MechEng J Autom Eng 222(6):1077–1087
11. Yu W, Chen G, Zuohua H (2011) Influence of cetane number improver on performance andemissions of a common-rail diesel engine fueled with biodiesel-methanol blend. Front Energ5(4):412–418
12. Sivaprakasam S (2014) Experimental investigation on combustion characteristics of DI dieselengine using diethyl ether fumigation with ethanol blended diesel. Int J Renew Energ Res 4(4):872–878
13. He B-Q et al (2003) The effect of ethanol blended diesel fuels on emissions from a dieselengine. Atmos Environ 37(35):4965–4971
14. Balamurugan T, Nalini R (2014) Experimental investigation on the effect of alkanes blendingon performance, combustion and emission characteristics of four-stroke diesel engine. Int JAmbient Energy 1–9
15. Testing, A.S.f. and Materials ASTM D975 (2011) Standard specification for diesel fuel oils.ASTM International West Conshohocken, PA
16. McCormick RL, Parish R (2001) Advanced petroleum based fuels program and renewablediesel program. NREL/MP 540–32674
17. Paul A et al (2013) An experimental investigation of performance-emission trade off of a CIengine fueled by diesel–compressed natural gas (CNG) combination and diesel–ethanolblends with CNG enrichment. Energy 55:787–802
18. Hirkude J, Padalkar A, Vedartham D (2014) Investigations on the effect of waste fried oilmethyl ester blends and load on performance and smoke opacity of diesel engine usingresponse surface methodology. Energy Procedia 54:606–614
19. Kitamura Y et al (2011) Investigation about predictive accuracy of empirical engine modelsusing design of experiments. SAE Technical Paper
20. El-Gendy NS, Hamdy A, Abu S (2015) Amr, application of d-optimal design and RSM tooptimize the transesterification of waste cooking oil using a biocatalyst derived from wasteanimal bones and novozym 435. Energy Sources Part A 37(11):1233–1251
21. Borhan FP, Abd Gani SS, Shamsuddin R (2014) The use of D-optimal mixture design inoptimising okara soap formulation for stratum corneum application. Sci World J 2014:8
Response Surface Methodology Based Multi-objective Optimization … 227

22. Liu S et al (2010) Effect of a cetane number (CN) improver on combustion and emissioncharacteristics of a compression-ignition (CI) engine fueled with an ethanol–diesel blend.Energy Fuels 24(4):2449–2454
23. Pandian M, Sivapirakasam S, Udayakumar M (2011) Investigation on the effect of injectionsystem parameters on performance and emission characteristics of a twin cylindercompression ignition direct injection engine fuelled with pongamia biodiesel–diesel blendusing response surface methodology. Appl Energy 88(8):2663–2676
24. Kannan G, Anand R (2011) Experimental investigation on diesel engine with diestrol–watermicro emulsions. Energy 36(3):1680–1687
25. Kumar Bose P, Banerjee R (2012) An experimental investigation on the role of hydrogen inthe emission reduction and performance trade-off studies in an existing diesel engineoperating in dual fuel mode under exhaust gas recirculation. J Energy Res Technol134(1):012601–012601
26. Silva GF, Camargo FL, Ferreira AL (2011) Application of response surface methodology foroptimization of biodiesel production by transesterification of soybean oil with ethanol. FuelProcess Technol 92(3):407–413
27. Lee T, Reitz RD (2003) Response surface method optimization of a high-speeddirect-injection diesel engine equipped with a common rail injection system. J Eng GasTurbines Power 125(2):541–546
28. Derringer G, Suich R (1980) Simultaneous optimization of several response variables. J QualTechnol 12(4):214–219
29. Khoobbakht G, Najafi G, Karimi M (2016) Optimization of operating factors and blendedlevels of diesel, biodiesel and ethanol fuels to minimize exhaust emissions of diesel engineusing response surface methodology. Appl Therm Eng
228 P.K. Bose et al.

Effect of Alcohol Blending on Performanceof Kerosene Fuelled Four-Stroke SparkIgnition Genset
Mritunjay Shukla, Eshan Singh and Sunil Pathak
Abstract Environmental pollution from engine exhaust emission has attractedworldwide attention. Besides vehicular pollution, the significance of engine exhaustemission from stationary utility engines, particularly gensets for electrical energyapplications, has also been realized. Gensets based on kerosene are widely in use indeveloping countries like India. To reduce the exhaust emission, from these smallcarbureted engines is challenging due to cost factor. In present work, an attempt hasbeen made to reduce the exhaust emission of a portable genset by blending alcoholsin kerosene. It was observed that blending alcohols in kerosene helps reducingCarbon Monoxide (CO) and Hydrocarbon (HC) emission and fuel consumption ofthe engine while Nitric Oxide (NO) emission increases. Further, the effect of varyingcarbureted jetsize on the performance and exhaust emission is also examined.A comparison of kerosene with base jetsize was done with the various combinationsof fuels and jetsizes to achieve optimized emission and fuel economy. It wasobserved that by blending 10% n-butanol in kerosene and operating engine on aslightly richer side, emission from a kerosene operated genset can be reduced alongwith improvement in fuel economy without any engine hardware modification.
Keywords Kerosene gensets � Emission � Engine performance � Biofuels � SIengines
Abbreviations
CO Carbon MonoxideHC HydrocarbonNO Nitric Oxide
M. Shukla (&) � E. Singh � S. PathakCSIR-Indian Institute of Petroleum, Dehradun 248005, Indiae-mail: [email protected]
E. Singhe-mail: [email protected]
S. Pathake-mail: [email protected]
© Springer Nature Singapore Pte Ltd. 2017A.K. Agarwal et al. (eds.), Biofuels, Green Energy and Technology,DOI 10.1007/978-981-10-3791-7_12
229

K KeroseneE10 K 10% Ethanol blended in Kerosene (v/v)B10 K 10% n-Butanol blended in Kerosene (v/v)RVP Ried-vapour Pressure
1 Introduction
In developing nations, kerosene is being used as fuel for portable gensets forelectricity generation at domestic level due to frequent power cuts. India, forinstance, being the biggest market to generator set, faces a demand-supply gap of17% in Kerosene gensets [1]. More than 0.2 million engines or their applicationproducts are sold in the market every year. For domestic use, population of kero-sene run gensets is large (more than 3 million) due to running cost advantage ofthese gensets over gasoline gensets and lower noise in comparison to diesel gensets[2]. Considering the environmental impact due to gensets, countries have come upwith regulatory norms specific to kerosene based gensets, which ensures minimumharm to the environment. Central Pollution Control Board (CPCB), for instance,specifies the norms for India, laid out in the year 2000 [3]. The latest norms, revisedin 2013, have been tabulated in Table 1.
Usually performing on richer mixture, kerosene based gensets emit higherunburned Hydrocarbon (HC) and Carbon monoxide (CO) emission [4]. Attemptshave been made to reduce these, using catalytic converters in 2-stroke and 4-strokekerosene driven gensets by leaning the exhaust using secondary air [4, 5] injectedinto the exhaust stream rather than the primary air inducted into the intake manifold.Similar studies were performed on SI engines with catalytic coating, resulting inimproved emission [6]. Gensets have also been made to run on alternate fuels likeLPG to reduce emission [7]. For small capacity gensets, it is a bit difficult to achieveemission reduction by simple design modifications, without significant costincrease. The progress in this direction has also been marred by insufficientcooperation between the engine and carburetor manufacturers [8]. A previous studyhas confirmed that kerosene internal combustion engines show higher thermalefficiency while working on leaner mixtures [9]. There have been prospects about
Table 1 CPCB emission norms on kerosene genset
Class Displacement (CC) CO (gm/kW-hr) HC + NOx (gm/kW-hr)
1 Up to 99 � 250 � 12
2 >99 and up to 225 � 250 � 10
3 >225 � 250 � 8
230 M. Shukla et al.

kerosene levitating the burden off gasoline as an automotive fuel [10]. Tests onkerosene blended in gasoline on a variable compression ratio engine revealed alower thermal and volumetric efficiency on increasing kerosene in blend [11].
Bio based fuels have garnered research interest across the globe, and variousbiofuels like alcohols, ethers, furans have been blended in gasoline as well as indiesel with positive reduction in CO and HC emission. Previous works on usingblends of alcohols like methanol and ethanol in gasoline gensets have shownreduction in tailpipe emission of HC and CO [12, 13]. However, kerosene basedgensets have been neglected in this regard. Hence, blending oxygenated biofuels inkerosene might be useful in providing a more environmentally viable option forgensets and other stationary engines.
Kerosene has a higher surface tension and viscosity compared to gasolineresulting in poorer fuel atomization and reduced combustion efficiency [14].Kerosene has a higher rate of heat release compared to gasoline. It is also lessvolatile (boiling range 140–320 °C) requiring startup usually by gasoline.Comparative properties of kerosene with gasoline are given in Table 2. Huge dif-ference in distillation pattern can be noted. Kerosene has a slightly higher density(0.8109) compared to gasoline (0.7453) and primarily composed of less volatile andhigh chain length compounds as compared to gasoline, and that is why it wouldrequire more air for stoichiometric mixture. Octane number of kerosene is 25,which is very low compared to gasoline. Since oxygenated fuels have higher octanerating, blending them in kerosene would enable use of higher compression ratio forsuch engines, which in turn would translate in higher thermal efficiency.
Engine emission studies on alcohol blends in kerosene engines or even kerosenecombustion and emission in generator sets are scarce. Hereby in present work, anexperimental investigation of performance and emission characteristics of 10%n-butanol blend in kerosene (v/v) and 10% ethanol blend in kerosene (v/v) has beencarried out in a portable carbureted SI engine powered genset. Thereafter the effectof varying air-fuel ratio on tail pipe emission was also studied by varying mainjetsize of carburetor. Finally, the optimized combination of blend and jetsize isrecommended after the comparative study considering CO and HC + NO emission.
Table 2 Comparativeproperties of kerosene andgasoline
Properties Kerosene Gasoline
Density 0.8109 0.7453
Octane rating 25 88
Reid vapor pressure (RVP) 0.689 59.5
Lower heating value 43.1 MJ/kg 42.4 MJ/kg
Higher heating value 46.2 MJ/kg 46.6 MJ/kg
Water miscibility Immiscible Immiscible
T10 179.1 °C 61.1 °C
T50 208.2 °C 101.6 °C
T90 248.9 °C 151.4 °C
Effect of Alcohol Blending on Performance of Kerosene … 231

2 Methodology
2.1 Nomenclature
Nomenclature followed in the results abbreviates the alternate fuel followed by itspercentage in the blend followed by K for pure kerosene. For the current study, twoblends are attributed with names E10 and B10 K referring to 10% ethanol +90%kerosene (v/v) and 10% butanol +90% kerosene (v/v) respectively. Ethanol (99.9%pure) and n-butanol (99.9% pure), supplied from Acros Organics, USA, andCommercially available kerosene, were used for the study. Blends of alcohols withkerosene were prepared by splash blending just prior to experiments. The importantphysico-chemical properties were analyzed as per their respective ASTM standardsand are given in Table 3. Kerosene has very low octane rating and is prone to autoignition and knocking. Blending alcohols help in this regard and provides bettercombustion of the blend. The boiling range of pure kerosene is also high andalcohol blends improve the front end volatility of the fuel, which can be observedby T10 values in the Table 3. E10 K provides more benefit in this regard. Tail endvolatility is also improved with blended fuels. Air fuel ratio was adjusted byvarying the size of carburetor main jet. Manufacturer recommended jet size istermed as jet size J(0) while one size larger jet is termed as J(−1), one size smallerjet size is termed as J(+1) in the paper which corresponds to air fuel equivalenceratio k = 1, k = 0.9 and k = 1.1 respectively at engine idle load for kerosene fuel.
2.2 Experimental Setup
A single-cylinder, constant speed air-cooled carbureted spark ignition engine,coupled with 2.2 KVA AC brushless alternator was used for the study. A schematicdiagram of the experimental set-up is given in Fig. 1. Details of the engine andelectrical generator are listed in Table 4. A resistive load bank along with voltmeter,ammeter and frequency meter was used for loading the genset. The load bank was asingle-phase load circuit consisting of a combination of stable resistive elements ofappropriate rating, wired such that the total load current is adjustable to any valueup to 125% of maximum value. Full throttle current of the genset under test was
Table 3 Physico-chemicalproperties of fuels
Sample K B10 K E10 K
Density at 15 °C, g/cc 0.8109 0.8099 0.8069
Flash point °C 43 36 9
Calorific value (MJ/kg) 46.2 44.4665 44.8875
T10 179.1 °C 135 95.5
T50 208.2 °C 204.7 200.6
T90 248.9 °C 248.3 244.9
232 M. Shukla et al.

measured with accuracy of ±0.1 Amp. The resistive elements used were capable ofwithstanding continuous energization at 150% of the rated voltage of the gensetwithout overheating. Voltmeter and ammeter were AC RMS meters, direct actingdigital type conforming to BIS 1248 (part 4), and accuracy class 1. The range offrequency meter was 45–65 Hz.
Fig. 1 Experimental setup
Table 4 Specifications of test engines
Engine type 4-stroke, forced air cooled, side valve engine
No. of cylinder 1
Bore X stroke (mm) 73 X 61
Displacement (cc) 256
Comp ratio 5.1:1
Rated O/P (HP/HR) 4.0/3000
Fuel con. at rated load (l/hr) 2.4 Petrol
Lube oil sump capacity 950 ml
Rated AC O/P 2200 VA
Max. AC output 2400 VA
Voltage 220 V
Current 10 A
Frequency 50 Hz
Effect of Alcohol Blending on Performance of Kerosene … 233

Engine output was measured in terms of electrical power by measuring outputcurrent and voltage at constant frequency (50 Hz). K type thermocouples were usedto monitor the temperature of engine oil and exhaust gases. Volumetric fuel con-sumption was recorded for each load point. Portable automotive emission analyzer(Horiba MEXA-584L) was used to measure engine tail pipe emission levels of CO,HC and NO emission along with air/fuel equivalence ratio. HC emission weremeasured in terms of propane equivalent.
The exhaust sampling arrangement consists of an extension pipe fitted with anexhaust sample probe connected to the outlet of the normal exhaust system. In orderto prevent condensation, exhaust sample probe was kept close to the muffler in asuitable location which could yield a well-mixed homogeneous representativesample of the exhaust.
2.3 Test Procedure
The engine was run to reach steady state conditions till the engine oil temperaturereached 75 °C to ensure steady state operation. Engine load was varied byincreasing current demand. Concentrations of carbon monoxide (CO), hydrocarbon(HC), nitrogen monoxide (NO) along with fuel consumption were recorded withrespect to change in load for three partial engine loads of 753, 1228 and 1650 Wwhich approximately corresponds to 35, 55 and 75% of full engine load. Meteringof emission was done, considering a weight factor of 0.2–35% load, 0.5–55% loadand 0.3–75% load to obtain a single cumulative value of emission for comparisonwith baseline kerosene emission to attain a conclusive optimum combination of jetsize and fuel.
First, the test was carried out for all the three test fuels for carburetor main jetsize of 880 microns which is the manufacturer’s optimized jet size for kerosene fueland corresponds to a stoichiometric mixture (k = 1) at idling engine loads, termedas J(0). Once the emission results from the three test fuels were recorded, attemptswere made to reduce the emission with a combination of fuel and jet size. Hence,the effect of varying main jet size on engine exhaust emission and fuel consumptionwas studied for E10 K and B10 K fuel. By using two different jet sizes, air fuelequivalence ratio was varied. The three jet sizes J(−1), J(0) and J(+1) correspond toslightly rich (k = 0.9), stoichiometric (k = 1.0) and slightly lean (k = 1.1) mixturerespectively for kerosene fuel at engine idling loads only. For actual keroseneengine operation, however, kerosene fueled engines are operated on the rich side forappropriate performance [4], actual air fuel ratios tend to decrease with an increasein engine loads. Values of air fuel equivalence ratio for the three fuels at all the testconditions are presented in Figs. 2a, b and c.
234 M. Shukla et al.

3 Results and Discussion
Figure 3 represents comparative CO emission for the three test fuel correspondingto standard jet size. CO is a toxic by-product of combustion, resulting due toincomplete combustion of fuel. Leaning of mixture due to oxygenated fuel blendsshould lead to better combustion and thereby reducing the CO level. CO emissiondecrease in case of E10 and B10 K fuels, which can be attributed to better com-bustion due to the presence of oxygenated molecules. 21–41% reduction of COemission is observed for B10 K fuels. E10 K fuel offers more reduction in COemission, which varies from 23 to 48% at various loads. This is due to higheroxygen content for Ethanol (47.82%) compared to Butanol (21.62%). Alcoholshave been thought of as partially oxydised fuels in previous literatures, and
Fig. 2 Variation of air-fuel equivalence ratio with power a with different fuels at J(0) b withE10 K for different jet sizes c with B10 K for different jet sizes
Effect of Alcohol Blending on Performance of Kerosene … 235

presence of oxygen molecule certainly helps in leaning of the mixture (consideringthe jet size is kept constant and fuel flow is maintained). This leads to morecomplete combustion and hence the CO formation is reduced, in accordance withoxygen content in the molecule. Ethanol contains more oxygen than butanol onmass basis. Heby E10 K fuel offers more oxygen than B10 K fuel for oxidation ofCO leading to better reduction of CO emission.
Figure 4 shows HC emission levels in engine exhaust for kerosene, E10 K andB10 K fuels. HC emission occur due to highly varied reasons. It may be due toincomplete oxidation of fuel that might have escaped combustion, slipping of liquidfuel into the crankcase, flame quenching and many other reasons. HC emission alsoreduce in case of both the blended fuels by 48–77%. However, it is difficult todeduct that which of the both oxygenates offers more reduction. Blending ofethanol and n-butanol in kerosene improves its evaporation, as it is evident fromdistillation properties of E10 and B10 K fuel. This facilitates formation ofhomogenous mixture. Faster flame propagation with alcohol blends insures com-pletion of combustion of charge before expansion process cools the gases andquenches the flame reaction which in turn leads to less amount of unburned HCemission.
As, both the alcohols offer higher flame speeds than kerosene, which ensuressmaller time for highly compressed HC to move into crevice volume. Hereby, forE10 K and B10 K fuels better mixture formation and flame propagation ensureslesser emission of hydrocarbons from engine tailpipe.
NOx is very harmful emission contributing to the greenhouse effect, acid rainsand global warming. NOx is a collective term for harmful gases Nitric Oxide (NO),Nitrogen Dioxide (NO2) and other Nitrogen-Oxygen compounds formed during
Fig. 3 CO emissioncomparison
236 M. Shukla et al.

combustion of fuel due to reaction to Nitrogen and Oxygen at high temperature andpressure. NO comprises of 90–95% of the NOx, while NO2 makes up the rest [17].NO emission tend to increase with in-cylinder temperature. Comparative emissionof NO for the three fuels on standard jet size has been presented in Fig. 5. It can beobserved that NO emission rise significantly in case of E10 and B10 K fuel ascompared to kerosene. This rise is more than 100% at higher loads with both the
Fig. 4 HC emissioncomparison
Fig. 5 NO emissionscomparison
Effect of Alcohol Blending on Performance of Kerosene … 237

alcohol blended test fuels. This is due to sudden rise in combustion chambertemperatures as alcohols tend to burn quickly due to higher flame speed.
Brake specific fuel consumption for all the three fuels is plotted in Fig. 6. BSFCof E10 and B10 K are less than that of kerosene. Despite the fact that the calorificvalues of ethanol and butanol is lower than of kerosene, BSFC tends to improve foralcohol blended fuels. Alcohols are oxygenated fuels. Here blending alcohols inkerosene enhances oxygen availability for attaining better combustion of hydro-carbons. Kerosene operated generator-sets operate on richer mixtures therefore byalcohol additions in kerosene complete combustion can be attained leading to betterfuel efficiency. Reduction in unburned hydrocarbon emission confirms the fact.This result is in accordance with previous works on alcohol blended gasoline fuel[15, 16]. The results stated above have been considering Jet size corresponding tok = 1.
Figures 7a, b represent variations of CO emission for E10 and B10 K fuel withdifferent jet sizes. For all three loads, CO emission increases with J(−1) anddecreases for J(+1). For J(−1) the CO rises from 24–95%, while CO decreases by4–21% for J(+1) with E10 K fuel. B10 K fuel shows a trend similar to E10 K. Withjet size J(−1) there is a nominal rise in CO level of B10 K fuel. However, reductionin CO emission with jet size J(+1) is more prominent. This increase in CO for J(−1)with both alcohol blended fuels is caused due to incomplete combustion for richermixtures. With J(+1) due to leaning effect, CO reduces.
Figures 8a, b represents variation of HC emission with varying jet sizes for E10and B10 K fuel. With E10 K fuel, HC emission are higher in case of J(−1) ascompared to J(0) for all loads. Jet size J(+1) provides the lowest HC emission with adecrease of 30–46% compared to J(0). Similar results are observed for B10 K fuel,
Fig. 6 BSFC comparison
238 M. Shukla et al.

where HC emission rise for J(−1) and show a decreasing trend for J(+1). A decreaseof 60–78% is attained using jet size J(+1). With richer mixtures, HC emission risedue to incomplete combustion caused from availability of less air. While in case ofJ(+1), mixture leans slightly providing more air available for better combustion offuel. Also, ethanol has more oxygen content than butanol; Due to which leaning ismore effective in decreasing emission of HC in case of B10 K fuel than E10 K.
Fig. 7 Comparison of COemissions for different jetsizes in a E10 K b B10 K
Effect of Alcohol Blending on Performance of Kerosene … 239
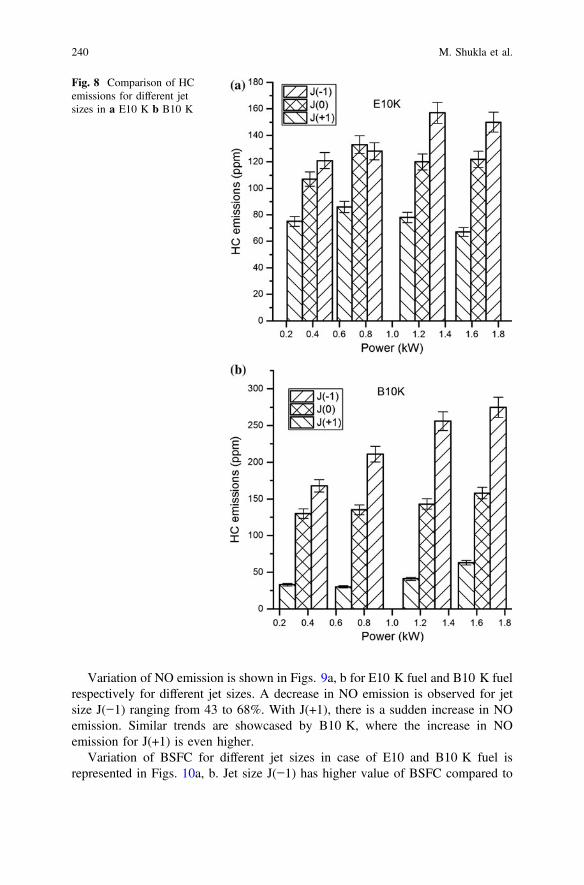
Variation of NO emission is shown in Figs. 9a, b for E10 K fuel and B10 K fuelrespectively for different jet sizes. A decrease in NO emission is observed for jetsize J(−1) ranging from 43 to 68%. With J(+1), there is a sudden increase in NOemission. Similar trends are showcased by B10 K, where the increase in NOemission for J(+1) is even higher.
Variation of BSFC for different jet sizes in case of E10 and B10 K fuel isrepresented in Figs. 10a, b. Jet size J(−1) has higher value of BSFC compared to
Fig. 8 Comparison of HCemissions for different jetsizes in a E10 K b B10 K
240 M. Shukla et al.

the other two jet sizes for all loads. There is an increase of 7–20%. With J(+1), thevalue of BSFC decreases from 2–11% in case of E10 K. For B10 K, BSFCdecreases by 2–27% in J(+1) with respect to initial jet size J(0), while an increase of3–17% is observed for J(–1).
It can be observed that leaning the mixture with jet size J(+1) for both E10 andB10 K fuels NO emission level rises drastically, which tend to supersede thebenefits of reduction in HC and CO emission and fuel economy. With jet size J(−1)
Fig. 9 Comparison of NOemissions for different jetsizes in a E10 K b B10 K
Effect of Alcohol Blending on Performance of Kerosene … 241

corresponding to even richer mixture, NO emission levels can be reduced signifi-cantly at cost of increase emission of CO, HC and BSFC.
Due to trade off between HC and NO emission, it is not possible to reduce bothby means of only adjusting air-fuel ratio. Hence, in order to reach an optimizedsolution, the cumulative metered emission level for HC, NO and CO were calcu-lated by giving weights to part load points for all fuel and jet size combinations.Weightage scheme is defined in methodology. HC and NO emission are clubbedtogether in order to attain a better comparison with emission standards. Figure 11
Fig. 10 Comparison ofBSFC for different jet sizes ina E10 K b B10 K
242 M. Shukla et al.

represents the percentage change of two regulated emission with respect toKerosene at standard jet size J(0) compared to all the combinations of test fuels andjet sizes. It can be observed that B10 K fuel with J(−1) shows a decrease in overallemission compared to baseline kerosene. Percentage change in fuel consumption atdifferent loads for B10 K fuel with J(−1) is shown in Fig. 12. Fuel consumption is
Fig. 11 Emission differencefrom baseline kerosene J(0)
Fig. 12 Change in BSFC forB10 K J(−1)
Effect of Alcohol Blending on Performance of Kerosene … 243
lower for B10 K at J(−1). It is observed that in a kerosene run genset, optimizedlevel of emission and fuel economy can be achieved with B10 K fuel operating atjet size J(−1).
4 Conclusion
Comparative evaluation of engine performance and emission of 10% blend ofn-butanol and ethanol in kerosene (v/v) was carried out in a SI genset. It wasobserved that, on blending 10% ethanol and n-butanol in kerosene (v/v), fuelconsumption decreases. Decrease in emission of CO and HC emission concentra-tion was observed. However NO emission rises significantly. To achieve optimizedfuel consumption, along with engine tail pipe emission from E10 and B10 K fuels,engine test were also carried out at different air fuel ratios using three different mainjet size of carburetter. When leaning the fuels slightly, HC and CO emissiondecrease while NO emission increases dramatically. With slightly richer mixture ofB10 K fuel, a decrease was observed in overall emission level. Using this con-figuration also yielded lower fuel consumption. Hence, by blending 10% n-butanolin kerosene and operating engine on a slightly richer side, emission from a keroseneoperated genset can be reduced along with improvement in fuel economy withoutany engine hardware modification.
References
1. EIA US Energy Information Administration (2013) full report2. Pathak S, Aigal AK, Sharma ML, Narayan L, Saxena M (2004) Reduction of exhaust
emission in a kerosene operated genset for electrical energy applications. SAE TechnicalPaper 2005-26-026, 2005. doi:10.4271/2005-26-026
3. www.cpcb.org.in4. Pundir B (2004) Emission reduction in small SI engine generator sets. SAE Technical Paper
2004-01-1089. doi:10.4271/2004-01-10895. Pundir B, Lachiram B, Malhotra R (2001) Catalytic emission control for portable SI engine
generator sets. SAE Technical Paper 2001-28-00476. Krishna MVSM, Kishor K, Ramana Reddy CV (2006) Studies on emission of catalytic coated
spark ignition engine with adulterated gasoline. J Environ Sci Engg 48(2):97–1027. Pathak S, Aigal A, Sharma M, Narayan L et al. (2005) Reduction of exhaust emission in a
kerosene operated genset for electrical ENERGY applications. SAE Technical Paper2005-26-026. doi:10.4271/2005-26-026
8. Clark W (1917) Burning Kerosene In Tractor Engines. SAE Technical Paper 170031. doi:10.4271/170031
9. Sanchez TDAF (2008) Experimental study of a kerosene fuelled internal combustion engine.Thesis, EPFL, Instituto superior Tecnico
10. Lucke C (1916) Kerosene versus gasoline in automobile engines. SAE Technical Paper160022. doi:10.4271/160022
244 M. Shukla et al.

11. Seshaiah N (2010) Efficiency and exhaust gas analysis of variable compression ratio sparkignition engine fuelled with alternative fuels. Int J Energy Environ 1(5):861–870
12. Misron N, Rizuan S, Vaithilingam A, Mailah NF, Tsuyoshi H, Hiroaki Y, Yoshihito S (2011)Performance improvement of a portable electric generator using an optimized bio-fuel ratio ina single cylinder two-stroke engine. Energies 4:1937–1949. doi:10.3390/en411937
13. Yasar A (2010) Effect of alcohol-gasoline blends on exhaust and noise emission in smallscaled generators. Metalurgija 49(4):335–338
14. Kerosene Base Fuels in Small Gasoline Engines U.S. Army/CR91/A90-210 (1991)15. Yucesu HS, Sozen A, Topgul T, Arcaclioglu E (2007) Comparative study of mathematical
and experimental analysis of spark ignition engine performance used ethanol-gasoline blendfuel. Appl Therm Eng 27(2007):358–368
16. Gravalos I, Moshou D, Gialamas T, Xyradakis P, Kateris D, Tsiropoulos Z (2011)Performance and emission characteristics of spark ignited engine fuelled with ethanol andmethanol gasoline blends. Alternative Fuels. Dr. Maximino Manzanera (Ed.), ISBN:978-953-307-372-9, InTech. doi:10.5772/23176
17. Chan LK (2005) Reduction of nitrogen oxides (NOx) using liquefied petroleum gas (LPG) InSpark Ignition (Si) Engine. Dissertation, University of Southern Queensland
Effect of Alcohol Blending on Performance of Kerosene … 245