avirulence protein avr1b from phytophthora sojae - core · avirulence protein avr1b from...
TRANSCRIPT
Avirulence protein Avr1b
from Phytophthora sojae
Dissertation
zur Erlangung des Doktorgrades
der Fakultät für Biologie
der Ludwig-Maximilians-Universität
München
vorgelegt
von
Karina Valer - Saldaña
2006

Erstgutachter: Prof. Dr. Jürgen Ebel
Zweitgutachter: Prof. Dr. Jörg Overmann
Promotionsgesuch eingereicht am: 22.06.06
Datum der mündlichen Prüfung: 30.10.06

Parts of this work have been published:
Valer, K., Fliegmann, J., Fröhlich, A., Tyler, B.M. and Ebel, J. (2006) Spatial and temporal expression
patterns of Avr1b-1 and defense-related genes in soybean plants upon infection with Phytophthora
sojae. FEMS Microbiol. Lett. 265, 60-68.
(doi:10.1111/j.1574-6968.2006.00467.x)
Index I
Index
Index I
List of abbreviations VI
List of figures IX
List of tables XI
1 Introduction 1 1.1 Plant resistance 1
1.2 Signal transduction 2
1.3 The interaction between soybean and Phytophthora sojae 4
1.3.1 Soybean (Glycine max L.) 4
1.3.2 Plant pathogenic oomycetes 5
1.3.3 Phytophthora sojae 7
1.3.4 The infection response of soybean 8
1.3.5 The phytoalexin pathway and glyceollin production in soybean 9
1.4 Resistance genes in hosts and avirulence genes in pathogens 10
1.5 The role of avirulence genes in pathogens 11
1.6 Avr1b from P. sojae 12
1.7 Objectives 13
2 Material 14 2.1 Antibody 14
2.2 Plant material 14
2.3 Microorganisms 14
2.4 Elicitor 15
2.5 Chemicals 15
2.6 Enzymes for molecular biology 17
2.7 Vectors 17
2.8 Plasmids 17
2.9 Oligonucleotides 18
2.10 Kits for molecular biology 18
2.11 Instruments 18
2.12 Software and internet resources 19
2.13 Media, buffers and other solutions 19
Index II
3 Methods 25 3.1 Soybean cultures 25
3.2 Phytophthora sojae cultures 25
3.2.1 Growth on solid medium 25
3.2.2 Growth on liquid medium 25
3.3 Insect cell culture 25
3.3.1 Revival of frozen insect cells 25
3.3.2 Maintenance of the insect cell culture 26
3.3.3 Transfection of insect cells with recombinant bacmid DNA 26
3.3.4 Infection of insect cells with recombinant baculovirus particles 26
3.3.5 Amplification of recombinant baculovirus particles 27
3.3.6 Insect cell fractionation 27
3.4 Expression of Avr1b in E. coli cells 28
3.4.1 Growth conditions 28
3.4.2 Harvest 28
3.5 Purification of Avr1b 29
3.5.1 Protein purification under denaturing conditions by batch chromatography 29
3.5.2 Protein refolding by FPLC 29
3.6 Production of anti-Avr1b-antiserum 30
3.7 Purification of Anti-Avr1b-antiserum with protein A sepharose
CL-4B by batch chromatography 30 3.8 Basic methods for protein biochemistry 31
3.8.1 Protein estimation 31
3.8.2 Protein precipitation 31
3.8.3 SDS-PAGE 31
3.8.4 Silver staining 31
3.8.5 Coomasie staining 31
3.8.6 Semi-dry Western blotting 32
3.8.7 Detection with anti-Avr1b-antiserum 32
3.8.8 Protein analysis by mass spectrometry 32
3.8.9 Immunoprecipitation with protein A sepharose CL-4B 33
3.8.9.1 Immunoprecipitation of urea-denatured proteins 33
3.8.9.2 Immunoprecipitation of SDS-denatured proteins 33
3.9 Methods in molecular biology 34
3.9.1 Agarose gel electrophoresis 34
3.9.2 Small scale plasmid preparation (minipreparation) 34
3.9.3 DNA purification from agarose gels 34
3.9.4 DNA restriction assay 34
3.9.5 DNA precipitation 35
3.9.5.1 DNA precipitation by sodium acetate and ethanol 35
3.9.5.2 DNA precipitation by sodium acetate and isopropanol 35
Index III
3.9.6 Polymerase chain reaction (PCR) 35
3.9.7 Colony PCR 35
3.9.8 DNase treatment of RNA 35
3.9.9 Reverse transcription-polymerase chain reaction (RT-PCR) 36
3.9.10 A-tailing procedure 36
3.9.11 Ligation of DNA fragments 36
3.9.12 DNA purification and sequencing 36
3.9.13 Transformation of E. coli DH5α cells 37
3.9.14 Transformation of XL10-Gold ultracompetent E.coli cells 37
3.9.15 Transposition of a recombinant donor plasmid into DH10Bac E. coli cells 37
3.9.16 Isolation of recombinant bacmid DNA (minipreparation of bacmid DNA) 37
3.10 Subcellular fractionation of P. sojae mycelium 38
3.11 Hypocotyl assay 38
3.12 Zoospore infection assay 39
3.13 Subcellular fractionation of infected soybean seedlings 39
3.14 RNA isolation 40
3.14.1 RNA isolation from P. sojae mycelium 40
3.14.2 RNA isolation from P. sojae zoospores 40
3.14.3 RNA isolation from soybean plants 41
3.15 Determination of glyceollin in soybean roots 41
4 Results 42 4.1 Production of recombinant Avr1b in bacteria 42
4.1.1 Synthesis of Avr1b in E. coli cells 42
4.1.2 Purification of Avr1b 43
4.1.2.1 Protein purification under denaturing conditions 44
4.1.2.2 Protein refolding 45
4.2 Production of recombinant Avr1b in Sf9 insect cells 47
4.2.1 Generation of the expression constructs 48
4.2.2 Synthesis of Avr1b in Sf9 insect cells 50
4.2.3 Protein analysis by mass spectrometry 53
4.3 Generation and purification of a polyclonal anti-Avr1b-antiserum 54
4.3.1 Testing of the recipient rabbits 55
4.3.2 Purification of the antiserum 55
4.3.3 Evaluation of the antiserum 56
4.3.4 Immunoprecipitation 57
4.3.4.1 Immunoprecipitation of urea-denatured protein preparation from Sf9 insect cells 57
4.3.4.2 Immunoprecipitation of SDS-denatured protein preparation from E. coli cells 57
4.4 Detection of Avr1b in P. sojae 59
4.4.1 Fractionation of mycelial material 59
4.4.2 Analysis of transcript levels in P. sojae and in infected soybean roots 61

Index IV
4.5 Biological tests 62
4.5.1 Biotests on soybean using different protein preparations 62
4.5.1.1 Biotests on soybean using recombinant protein preparations obtained from
E. coli cells 62
4.5.1.2 Biotests on soybean using recombinant protein preparations obtained from
Sf9 insect cells 63
4.5.2 Infection of soybean hypocotyls with mycelium of P. sojae 64
4.5.2.1 Analysis of transcript levels of P. sojae Avr1b-1, actin ActA and soybean
tubulin tubB2 in soybean hypocotyls inoculated with P. sojae mycelium 66
4.5.3. Expression levels of P. sojae Avr1b-1, actin ActA and soybean tubulin
tubB2 in different segments of soybean roots infected with P. sojae
race 1 zoospores 67
4.5.4 Time course of mRNA expression in compatible and incompatible
P. sojae - soybean interactions 68
4.5.5 Analysis of transcript levels of P. sojae Avr1b-1, actin ActA and soybean
tubulin tubB2 in soybean plants infected with P. sojae race 2 zoospores 71
4.5.6 Avr1b-1 DNA sequencing 71
4.5.7 Subcellular fractionation of infected soybean plants 72
4.5.7.1 Immunoprecipitation of SDS-denatured protein fractions from infected
soybean plants 73
4.5.7.2 Protein analysis by mass spectrometry 74
5 Discussion 76 5.1 Expression of Avr1b in E. coli and Sf9 insect cells 76
5.2 Avr1b expression in compatible and incompatible P. sojae - soybean interactions 76
5.3 Localization and recognition of Avr proteins 78
5.4 Biological tests 79
5.4.1 Biotests on soybean using different protein preparations 79
5.4.2 Biotests on soybean hypocotyls using mycelium of P. sojae 80
5.5 The RXLR motif present in different oomycetes 81
5.6 Pathogenesis related proteins found in infected soybean seedlings 82
6 Outlook 84
7 Summary 85
8 References 87 9 Appendix 104 9.1 Restriction maps 104
9.1.1 Map and restriction endonuclease sites for the PGEM-T vector 104
9.1.2 Map and restriction endonuclease sites for the pFASTBAC1 vector 105
Index V
9.1.3 pTZ18R:Avr1b partial restriction map 106
9.2 Amino acid alignment of Avr1b, PauI-1 and PauI-2 106
9.3 Amino acid sequence of Avr1b from E. coli pET26b 107
9.4 Deduced amino acid alignment of Avr1b-1 (accession number AF449622),
Avr1b-1 (clone #10) and Avr1b-1 (clone #11) 107
9.5 PCR programs 109
9.6 Identification of PR-10-like protein by mass spectrometry 110
Acknowledgments 113 Erklärung 115 Lebenslauf 116
List of abbreviations VI
List of abbreviations
A Ampere
aa Amino acids
Abs Absorbance
AP Alkaline phosphatase
APS Ammoniumperoxodisulfate
ATP Adenosine triphosphate
Avr Avirulence
BAC Bacterial artificial chromosome
BCIP 5-Bromo-4-chloro-3-indolyl phosphate
bp Base pairs
BSA Bovine serum albumin
cDNA Complementary deoxyribonucleic acid
CDPK Calcium-dependent protein kinase
C. fulvum Cladosporium fulvum
4CL 4-coumarate:CoA ligase
CoA Coenzyme A
CTAB Hexadecyl trimethyl ammonium bromide
cv. Cultivar
D6aH 3,9-dihydroxypterocarpan 6a-hydroxylase
DEPC Diethylpyrocarbonate
DMF Dimethylformamide
DNA Deoxyribonucleic acid
dNTPs Deoxynucleotide-triphosphate (dATP, dGTP, dCTP, dTTP)
DTT 1,4-Dithiothreitol
EDTA Ethylenediamine-tetraacetic acid
EGTA Ethylene glycol bis(2-aminoethyl)-tetraacetic acid
ESI-Q-TOF Electrospray-ionization-quadrupole-time of flight
EST Expressed sequence tag
FBS Fetal bovine serum
Fig. Figure
FPLC Fast performance liquid chromatography
f. sp. Forma specialis
fw Fresh weight
GBP Glucan binding protein
GFP Green fluorescent protein
Gm Glycine max
List of abbreviations VII
G. max Glycine max
6xHis-tag 6 Histidine residues
h Hour
H. parasitica Hyaloperonospora parasitica
hpi Hours post infection
HPLC High performance liquid chromatography
HR Hypersensitive response
Hrp genes Hypersensitive response and pathogenicity genes
IgG Immunoglobulin G
IPTG Isopropyl-β-D-galactopyranoside
kb Kilobase
KD Dissoziation constant
kD Kilodalton
LB medium Luria Bertani medium
LC Liquid chromatography
LRR Leucine-rich repeat
LZ Leucine zipper
M Molarity
mA Milli ampere
MAPK Mitogen-activated protein kinase
Mbp Mega base pairs
Me-Ja Methyl jasmonate
min Minute
mRNA Messenger ribonucleic acid
MS Mass spectrometry
MW Molecular weight
β-NADPH β-Nicotinamide adenine dinucleotide phosphate
NBS Nucleotide-binding site
NBT Nitro blue tetrazolium
Ni-NTA Nickel-nitrilotriacetic acid
OD Optical density
ORF Open reading frame
PAL Phenylalanine ammonia-lyase
PAMP Pathogen-associated molecular patterns
PAS Protein A sepharose
PBS Phosphate-buffered saline
PCR Polymerase chain reaction
PMSF Phenylmethanesulfonyl fluoride
pi post infection
PR protein “Pathogenesis-related“ protein
P. sojae Phytophthora sojae

List of abbreviations VIII
pth Pathogenesis
pv. Pathovar
PVP Polyvinyl pyrrolidone
R Resistance
RE Raw elicitor
RFLP Restriction Fragment Length Polymorphism
RNA Ribonucleic acid
RNase Ribonuclease
ROS Reactive oxygen species
RP Reversed phase
Rps Resistance to Phytophthora sojae
rpm Revolutions per minute
RPP Recognition of Peronospora parasitica
Rt Room temperature
RT Reverse transcription
SA Salicylic acid
SAM Starvation associated messenger
SAR Systemic acquired resistance
SDS Sodium dodecyl sulfate
SDS-PAGE SDS-polyacrylamide gel electrophoresis
sec Second
Sf9 Spodoptera frugiperda-insect cell line
spp. Species
SSTE Sodium chloride-SDS-Tris-EDTA
TAE Tris-acetate-EDTA buffer
TBS Tris-buffered saline
TCA Trichloroacetic acid
TEMED N,N,N’,N’-tetramethylethylenediamine
Tris Trishydroxymethyl-2-aminomethane
Tween 20 Polyoxyethylene sorbitan monooleate
TTSS Type three secretion system
U Unit (Enyzme units, µmol/minute)
UV Ultraviolet
V Volt
vol Volume
v/v Volume/volume
w/v Weight/volume
X-Gal 5-Bromo-4-chloro-3-indolyl-β-D-galactopyranoside
YFP Yellow fluorescent protein
YTH Yeast-two-hybrid

List of figures IX
List of figures
Fig. 1 Simplified model for the activation of defence responses in soybean
by elicitors 4
Fig. 2 Phylogenetic tree showing the evolutionary relationships between the
major eukaryotic groups 5
Fig. 3 Life cycle of a typical root-infecting Pythium species 7
Fig. 4 Schematic drawing of the order of the different layers for Western blotting 32
Fig. 5 Picture of an infected soybean seedling 39
Fig. 6 SDS-PAGE analysis of Avr1b production in E. coli cells 43
Fig. 7 Purification of 6xHis-tagged proteins under native or denaturing conditions
using the QIAexpress System from Qiagen 44
Fig. 8 SDS-PAGE (17,4%) analysis of different fractions collected after
purification of Avr1b under denaturing conditions 45
Fig. 9 FPLC purification on a Ni-NTA superflow matrix 46
Fig. 10 Generation of recombinant baculoviruses and gene expression 47
Fig. 11 Cloning procedure of pFastBac1-Avr1b with the putative signal peptide (I)
or without the putative signal peptide (II) 49
Fig. 12 Restriction analysis performed with Nco I and Xba I, Sac I, EcoR I and Pau I
on pFastBac1-Avr1b(1) (harbors Avr1b with the secretion signal, sample 1A)
and on pFastBac1-Avr1b(2) (harbors Avr1b without the secretion signal,
sample 2A) 49
Fig. 13 Proof of synthesis of Avr1b in Sf9 insect cells 50
Fig. 14 Synthesis of Avr1b in Sf9 insect cells 53
Fig. 15 Protein analysis by mass spectrometry 54
Fig. 16 Purification of anti-Avr1b-antiserum with protein A sepharose
using a pH gradient 56
Fig. 17 Detection limit of soluble proteins from Sf9 insect cells containing Avr1b 57
Fig. 18 Immunoprecipitation of purified Avr1b 59
Fig. 19 (A) Subcellular fractionation of a mycelium derived from P. sojae race 1
(B) Immunoblot analysis performed with microsomes from P. sojae
race 2 (lane 1) and race 1 (lane 2) 60
Fig. 20 Semi quantitative RT-PCR of P. sojae Avr1b-1 and ActA genes obtained
from the P. sojae race 1 mycelium at different growth stages (A), from its
zoospores (B, lane 3) and from soybean cv. Harosoy roots after infection
with zoospores of P. sojae race 1 (B, lane 2) 61
List of figures X
Fig. 21 Quantification of glyceollin in soybean seedlings treated with Avr1b-containing
protein fractions obtained from Sf9 insect cells infected with P3 baculovirus
particles and with control protein preparations obtained from Sf9 insect cells
infected with wild type virus particles (containing no Avr1b) 64
Fig. 22 Tests on soybean hypocotyls 65
Fig. 23 Gene-for-gene effects, observed after the interaction of different
P. sojae races with soybean cultivars 65
Fig. 24 Analyses of transcript levels in soybean hypocotyls by semi quantitative
RT-PCR 67
Fig. 25 Spatial course of transcript accumulation in infected soybean roots 68
Fig. 26 Time course of mRNA expression in the compatible P. sojae race 1 - soybean
cv. Harosoy (A and B) and the incompatible P. sojae race 1 - soybean
cv. Williams L77-1863 interaction (C and D) 70
Fig. 27 mRNA expression in the compatible soybean cv. Harosoy - P. sojae race 2
and the cv. Williams L77-1863 - P. sojae race 2 interaction 71
Fig. 28 Subcellular fractionation of soybean seedlings cv. Williams L77-1863
infected with P. sojae race 1 zoospores(incompatible interaction) 73
Fig. 29 Western blot analysis performed on immunoprecipitated protein fractions from
soybean cv. Harosoy roots infected with P. sojae race 1 zoospores
(compatible interaction) 73
Fig. 30 Comparison of amino acid sequences of a soybean pathogenesis-
related protein (GmPR10-like), a soybean starvation-associated
message protein (GmSAM22), a soybean GmSAM22-like protein
and a soybean open reading frame (GmORF) 75
Fig. 31 The RXLR motif 82
Fig. 32 (A) pGEM-T vector circle map and sequence reference points
(B) Promoter and multiple cloning sequence of the pGEM-T vector 104
Fig. 33 (A) pFastBac1 vector circle map and sequence reference points
(B) Promoter and multiple cloning sequence of the pFastBac1 vector 105
Fig. 34 Partial restriction map of pTZ18R:Avr1b 106
Fig. 35 Amino acid alignment of Avr1b, PauI-1 and PauI-2 106
Fig. 36 Amino acid sequence of Avr1b from E. coli pET26b containing a
periplasmatic localization signal, a His6-fusion epitope and a spacer 107
Fig. 37 Deduced amino acid alignment of Avr1b-1 (accession number AF449622),
Avr1b-1 (clone #10) and Avr1b-1 (clone #11) 108
Fig. 38 Identification of PR-10-like protein by mass spectrometry 112

List of tables XI
List of tables
Table 1. Three step elution program of 6xHis-tagged Avr1b protein with imidazole 30
Table 2. Gradient elution for HPLC analyses 41
Introduction 1
1 Introduction
1.1 Plant resistance
Plants are exposed to a wide range of microorganisms such as viruses, bacteria, fungi, as well as
nematodes, damaging insects and oomycetes. Yet most plants normally resist attack by potential
pathogens because they possess effective defence mechanisms.
Plant disease resistance can be defined as the ability of the plant to prevent or restrict pathogen
growth and proliferation (Benhamou, 1996). The molecular events constituting critical steps of plant-
pathogen interactions can be divided into three steps (Ebel, 1998):
1. Generation and recognition of signal compounds
2. Inter- and intracellular signal conversion and transduction
3. Activation of signal-specific responses in target cells
Disease resistance processes in plants are diverse. Resistance may occur at the sub-species or
varietal level (race/cultivar-specific resistance mediated by resistance and avirulence genes, specific
resistance) or at the species or genus level (non-host or basic resistance).
In specific resistance, plant perception of elicitors produced by avirulent pathogens, leads to an
induction of a rapid and localized programmed cell death response termed hypersensitive response
(HR). In this case, invaded cells or tissues are sacrificed to prevent spreading of the pathogen.
Disease resistance genes (R genes) are thought to encode specific receptors that interact directly or
indirectly with pathogen elicitors expressed by avirulence genes (Avr genes) and initiate signal
transduction pathways leading to HR and expression of disease resistance (Baker et al., 1997). The
race-specific resistance was first formulated as the “gene-for-gene” hypothesis for the resistance of
flax to rust (Melampsora lini) (Flor, 1956; Flor, 1971).
Basic or non-host resistance is less understood in comparison to specific resistance. Many
biochemical and cellular components of the specific response also occur in the absence of specific
R genes as part of the basic resistance response of plants (Kamoun et al., 1999). Basic resistance is
characterized by the formation of physical barriers such as thick cell-walls and cutin layers or
production of toxic compounds like phenols and saponines (Osbourne, 1996). Pathogen recognition
arises through general elicitors, also known as pathogen-associated molecular patterns (PAMPs)
(Nürnberger and Brunner, 2002).
Elicitors of plant defence responses fall into two categories depending on their source: exogenous
and endogenous compounds. Exogenous elicitors can be considered the primary signals in plant-
pathogen interactions. They originate in the pathogen or aggressor itself, appear to have a limited
mobility within the plant tissues and evoke a response in cells in the immediate vicinity to the

Introduction 2
pathogen. Endogenous elicitors are of plant origin and arise as a result of the interaction with the
aggressor (Ebel and Cosio, 1994). Much progress has been made in characterizing elicitors (Boller,
1995; Hahn, 1996; Ebel and Scheel, 1997) which are believed to interact with host plant receptors
with high specificity and sensitivity. The receptors transduce the elicitor signal into cellular reactions
resulting in the activation of plant defence (Ebel and Mithöfer, 1998; Nürnberger and Scheel, 2001).
Examples of general elicitors from fungi and oomycetes are the elicitins from the species
Phytophthora and Pythium (Kamoun et al., 1993; Kamoun et al.,1994; Kamoun et al., 1997; Qutob et
al., 2003) and β-glucans from the cell walls of oomycetes (Boller, 1995).
1.2 Signal transduction
Following pathogen recognition, a subsequent intracellular signal transduction occurs. The activation
of plant defence response genes involves the transduction of elicitor signals from the site of primary
perception at the cell surface to the nucleus where transcription of specific genes is initiated. It is
conceivable that different signal transduction pathways exist in different plants and for different types
of response. Even in the same plant, different elicitors might activate different signal transduction
chains (Ebel and Mithöfer, 1998).
Responses that appear to be consequences of elicitor perception and are possibly related to signal
transduction include depolarization of the plasma membrane, increase in the cytosolic Ca2+
concentration, alkalinization of the extracellular space, protein phosphorylation, and production of
reactive oxygen species (Fig. 1). In addition to these defences, systemic acquired resistance (SAR),
which increases the plant’s resistance systemically to subsequent pathogen attack, is activated in
many plants and can be induced by certain elicitors (Enyedi et al., 1992; Klessig and Malamy, 1994;
Ryals et al., 1996). Compounds that have been associated with signaling events in plant defence as
part of the SAR are salicylate, jasmonate and ethylene.
The effect of Phytophthora sojae derived β-glucan elicitors on the plasma membrane potential has
been investigated. β-Glucans with different degrees of polymerization transiently depolarized the
plasma membrane of soybean roots (Mithöfer et al., 2005).
Changes in ion fluxes (Cl- and K+ efflux, Ca2+ influx, alkalinization of cell culture growth medium)
constitute an early inducible response, occurring within minutes after elicitor application in many
plant tissues (Bach et al., 1993; Felix et al., 1993; Nürnberger et al., 1994a; Mithöfer et al., 2005),
and are a prerequisite for the activation of a variety of defence-related genes (Ebel and Scheel,
1997).
Protein kinases, mitogen-activated protein kinases (MAPKs), calcium-dependent protein kinases
(CDPKs), and protein phosphatases might represent further elements of elicitor signal transduction,
converting receptor signals into cell-specific responses. Changes in the level of phosporylation of
cellular proteins have been observed upon elicitor treatment of a variety of cell cultures (Boller,
1995; Ebel and Scheel, 1997; Daxberger et al., unpublished).
The production of reactive oxygen species (ROS) such as •O2-, HO• and H2O2, is a rapid reaction of
Introduction 3
plants to infection or elicitor treatment and may originate from two distinct subcellular sources (Allan
and Fluhr, 1997). The oxidative burst can lead to the cross-linking of cell wall proteins rendering
plant cell walls more resistant to attack by fungal enzymes (Bradley et al., 1992). The ROS may
serve as second messengers for the activation of genes expressing protective proteins including
genes for glutathione S-transferase, glutathione peroxidase and polyubiquitin, as well as enzymes
involved in scavenging of ROS (Lamb and Dixon, 1997) or they may be toxic to pathogens.
Generation of ROS is a characteristic feature of the HR (Ebel and Scheel, 1997; Lamb and Dixon,
1997) but there is still no conclusive evidence that ROS directly cause plant cell death. The
connection between ROS production and phytoalexin synthesis has been explored in different plants
such as bean, pea, soybean, tobacco and alfalfa (Mehdy, 1994; Lamb and Dixon, 1997). In some of
the systems, a tight correlation between ROS and phytoalexin production has been reported (Jabs et
al., 1997), whereas in others ROS-independent pathways may exist (Levine et al., 1994; Mithöfer et
al., 1997).
SAR requires the signal molecule salicylic acid (SA) and is associated with accumulation of
pathogenesis-related (PR) proteins, which are thought to contribute to resistance. Much progress
has been made recently in elucidating the mechanism of SAR. The detection of increased SA levels
in neighbouring leaves and in the phloem led many researchers to believe that SA could be the
systemic signal for SAR. Further studies suggested that signaling might occur through the
conversion of SA to the volatile compound methyl salicylate, which could induce resistance not only
in the uninfected parts of the same plant but also in neighbouring plants (Shulaev et al., 1997).
Jasmonic acid and its methyl ester, methyl jasmonate (Me-Ja) have been implicated as wounding-
activated endogenous signals that may alert undamaged tissues of neighboring plants of a pest
attack (Farmer and Ryan, 1992). Addition of jasmonate or Me-Ja to soybean cell suspension
cultures increased the activity of the enzyme phenylalanine ammonia-lyase (PAL) which is part of
the phenylpropanoid pathway (Gundlach et al., 1992; Fliegmann et al., 2003). They also stimulated
the accumulation of a variety of secondary metabolites in cultures of a wide range of plant species
(Gundlach et al., 1992). Jasmonates have been shown to stimulate the production of flavonoids.
Thus exogenous jasmonate induced the accumulation of genistein, a minor isoflavonoid in the
spectrum of soybean defence compounds (Morris et al., 1991). However jasmonates may not
always be involved in signaling for plant defence, they also promote stomatal closure, accelerate leaf
senesce in oats and barley (Ueda and Kato, 1980; Weidhase et al., 1987) and alter gene expression
by rapidly inducing the synthesis of new proteins (Curtis, 1984; Weidhase et al., 1987).
Ethylene is a gaseous plant hormone that regulates many physiological processes in plants (Matoo
and Suttle, 1991). It induces several PR proteins and may also be involved in the strengthening of
the cell wall following a pathogen or pest attack (Enyedi et al., 1992).

Introduction 4
Fig. 1 Simplified model for the activation of defence responses in soybean by elicitors. Figure taken from Ebel
and Mithöfer (1998), and modified according to Mithöfer et al. (2005).
1.3 The interaction between soybean and Phytophthora sojae 1.3.1 Soybean (Glycine max L.) Soybean (Glycine max L.) was cultivated in China since 3000 BC and was introduced to Europe in
the 18th and to the United States in the 19th century. After the second world war, the United States
became the world’s leading soybean producing nation, nowadays followed by Brazil, Argentina,
China, India and Paraguay. According to the American Soybean Association, the United States
produced 66,78 million metric tons of soybean in the year 2004.
Taxonomically soybean belongs to the family Fabaceae of the order Fabales (Strasburger, 2002).
Soybean is a bushy, annual, summer legume 30 to 150 cm tall. The pods, stems and leaves are
covered with fine brown or gray pubescence. The leaves are trifoliate (sometimes with 5 leaflets).
The pods contain between one and five seeds. The small self fertile flowers are either white or
purple. The plant is not frost resistant so it must be grown after spring frosts and have time for the
seeds to mature before the first fall frost. Many selections or cultivars are bred for production under
different day length or other environmental conditions. They range in maturity from 75 to 200 days.
Soybean seeds have a high (38-45%) protein and high (20%) oil contents. The beans can be
processed in a variety of ways. Common forms include soy meal (used as animal feed), soy flour,
soy milk, tofu, and soybean oil. Soybeans are also the primary ingredient involved in the production
of soy sauce.
Gene activation
Oxidase
2+ K+ H+
Wounding Reactive Elicitor Ion fluxesoxygen species
Linoleic acid
Defence factors, Protective and regulatory
reactions
Plasma membrane
Jasmonic acid
ATP ADP + PiCa2+
Nucleus
Protein phosphorylationand dephosphorylation Protein kinases
and phosphatases
ROS O2 E
×
Ca
Gene activation
Oxidase
2+ K+ H+
Wounding Reactive Elicitor Ion fluxesoxygen species
Linoleic acid
Defence factors, Protective and regulatory
reactions
Plasma membrane
Jasmonic acid
ATP ADP + PiCa2+
Nucleus
Protein phosphorylationand dephosphorylation Protein kinases
and phosphatases
ROS O2 E
×
Ca K+ H+

Introduction 5
Green algae
Landplants
Heterokont algae
Oomycetes
Ciliates
Dinoflagellates
Red algae
Animals
Basidiomycete fungi
Ascomycete fungi
Green algae
Landplants
Heterokont algae
Oomycetes
Ciliates
Dinoflagellates
Red algae
Animals
Basidiomycete fungi
Ascomycete fungi
1.3.2 Plant pathogenic oomycetes
Fungi and oomycetes are the two most important groups of eukaryotic plant pathogens. Fungi form a
separate kingdom and are evolutionary related to animals. Oomycetes are related to heterokont,
biflagellate, golden-brown algae (Fig. 2) and should be included in the kingdom Chromista (Erwin
and Ribeiro, 1996) or in the Stramenopiles (Van der Peer and De Wachter, 1997). Fundamental
differences in physiology, biochemistry and genetics between fungi and oomycetes exist as shown
e.g. by comparison of the genes encoding the small ribosomal subunit, actin and tubulin (Kamoun et
al., 1999; Tyler, 2001; Latijnhouwers et al., 2003).
Fig. 2 Phylogenetic tree showing the evolutionary relationships between the major eukaryotic groups. Figure
taken from Kamoun et al. (1999), adapted from Van de Peer and De Wachter (1997).
Plant-pathogenic oomycetes include over 60 species of Phytophthora, numerous genera of the
biotrophic downy mildews (such as Peronospora and Bremia), and more than 100 species of the
genus Pythium. Oomycetes are responsible for economically and environmentally devastating
epidemics, including the 19th century Irish potato famine (Phytophthora infestans) which caused
starvation and death of over 1 million people in Ireland and a similar number of irish citizens
emigrating to the United States and elsewhere (Gregory, 1983).
The International Potato Centre has estimated that worldwide losses in potato production caused by
late blight exceeds three billion dollar annually. Another equally devastating species of the genus
Phytophthora is Phytophthora ramorum, responsible of the current sudden oak death epidemic in the
United States and throughout Europe (Kamoun, 2000).
The name of Phytophthora is derived from the Greek that means plant (phyto) destroyer (phthora).
Phytophthora species attack an extraordinarily wide range of agriculturally and ornamentally
important plants. All 60 species are destructive pathogens, causing rots of roots, stems, leaves and
fruits. Some species such as P. cinamomi and P. cactorum attack hundreds of different plant host
Introduction 6
species, others such as P. infestans or P. sojae (syn. Phytophthora megasperma f. sp. glycinea)
have narrow host ranges.
Phytophthora species are characterized by hyphal swellings, sporangia, biflagellate zoospores,
chlamidospores and the sex organs antheridia, oogonia and oospores. The thallus as in fungi, is
called mycelium, from the Greek: mykes (fungus) and lium (after epithelium). It is composed of
hyaline, branched, coenocytic filaments. Phytophthora species do not synthesize sterols but require
an exogenous source of β-hydroxy sterols for sporulation. Phytophthora and other members of the
family Pythiaceae such as Pythium are resistant to polyene antibiotics such as pimaricin, a
characteristic correlated with a requirement for an exogenous source of β-hydroxy sterols (Erwin and
Ribeiro, 1996).
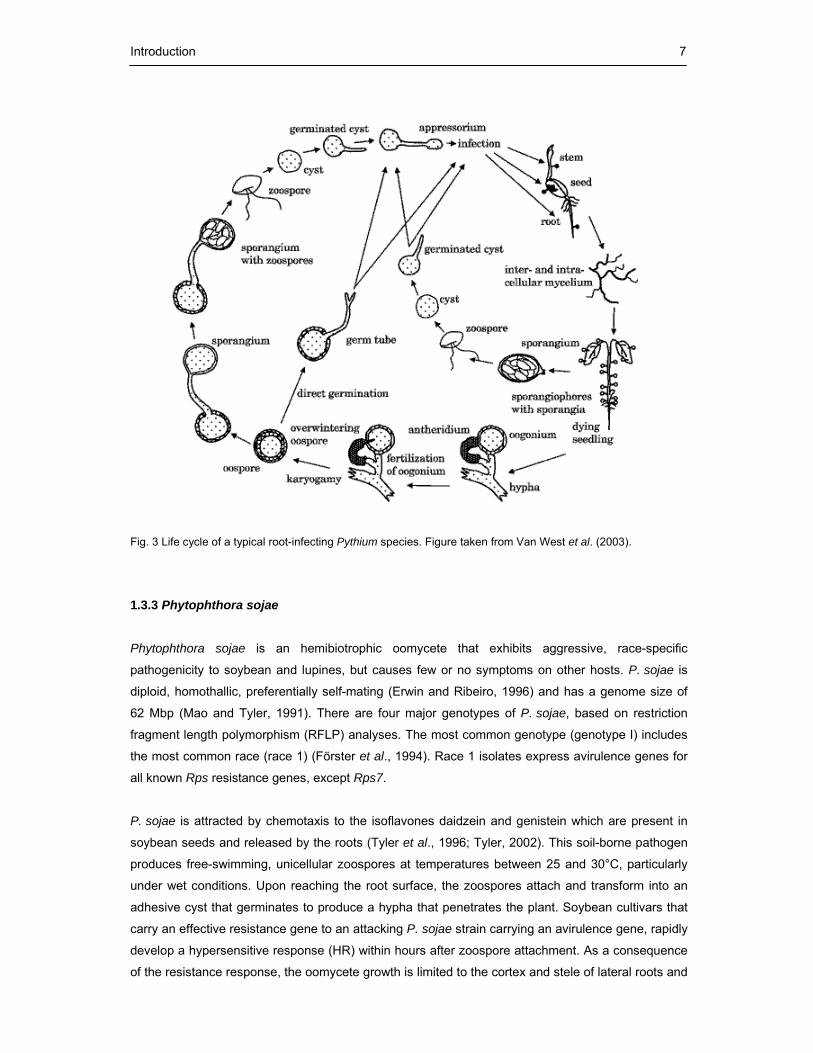
The major stages in life cycle of most root-infecting oomycete species of Pythium and Phytophthora
are similar. The life cycle of a typical Pythium sp. is shown in Fig. 3. It consists of two cycles that are
usually stimulated by environmental conditions. The asexual cycle is characterized by the production
of sporangia. Sporangia may germinate either directly in liquid or on a surface to produce a germ
tube or may differentiate by a process of cytoplasmic cleavage to form uninucleate, biflagellate
zoospores (indirect germination). The zoosporangia of Phytophthora species are formed in an
aqueous medium. The released zoospores swim in water in search of host tissues where they settle
and cyst. The cyst germinates by developing a germ tube that may penetrate the host directly or via
an appresorium. The hyphae ramify through the plant using nutrients acquired from it, developing a
mycelium, from which sporulation occurs on the dying seedling and the disease cycle is repeated.
The sexual cycle generates thick walled oospores adapted for over-wintering and survival under
difficult environmental conditions. Oosporogenesis involves the production of a female oogonium
and a male antheridium that grows towards and fuses the oogonium. Fertilization occurs through the
emptying of some of the contents of the antheridium into the oogonium, leading to the development
of an oospore. The oospore can produce single or multiple germ tubes. These germ tubes can then
form sporangia thereby recapitulating the asexual cycle of the pathogen (Van West et al., 2003).
Introduction 7
Fig. 3 Life cycle of a typical root-infecting Pythium species. Figure taken from Van West et al. (2003).
1.3.3 Phytophthora sojae
Phytophthora sojae is an hemibiotrophic oomycete that exhibits aggressive, race-specific
pathogenicity to soybean and lupines, but causes few or no symptoms on other hosts. P. sojae is
diploid, homothallic, preferentially self-mating (Erwin and Ribeiro, 1996) and has a genome size of
62 Mbp (Mao and Tyler, 1991). There are four major genotypes of P. sojae, based on restriction
fragment length polymorphism (RFLP) analyses. The most common genotype (genotype I) includes
the most common race (race 1) (Förster et al., 1994). Race 1 isolates express avirulence genes for
all known Rps resistance genes, except Rps7.
P. sojae is attracted by chemotaxis to the isoflavones daidzein and genistein which are present in
soybean seeds and released by the roots (Tyler et al., 1996; Tyler, 2002). This soil-borne pathogen
produces free-swimming, unicellular zoospores at temperatures between 25 and 30°C, particularly
under wet conditions. Upon reaching the root surface, the zoospores attach and transform into an
adhesive cyst that germinates to produce a hypha that penetrates the plant. Soybean cultivars that
carry an effective resistance gene to an attacking P. sojae strain carrying an avirulence gene, rapidly
develop a hypersensitive response (HR) within hours after zoospore attachment. As a consequence
of the resistance response, the oomycete growth is limited to the cortex and stele of lateral roots and
Introduction 8
remains confined to the vicinity of the infection site (Beagle-Ristaino and Rissler, 1983; Enkerli et al.,
1997). In susceptible cultivars, P. sojae infects lateral roots and progresses into tap roots and
hypocotyls, without occurrence of an early HR. An initial biotrophic phase of about 12 h is followed
by a necrotrophic, spreading growth mode causing severe, large necrotic lesions at about 24 h
(Ward, 1990; Enkerli et al., 1997).
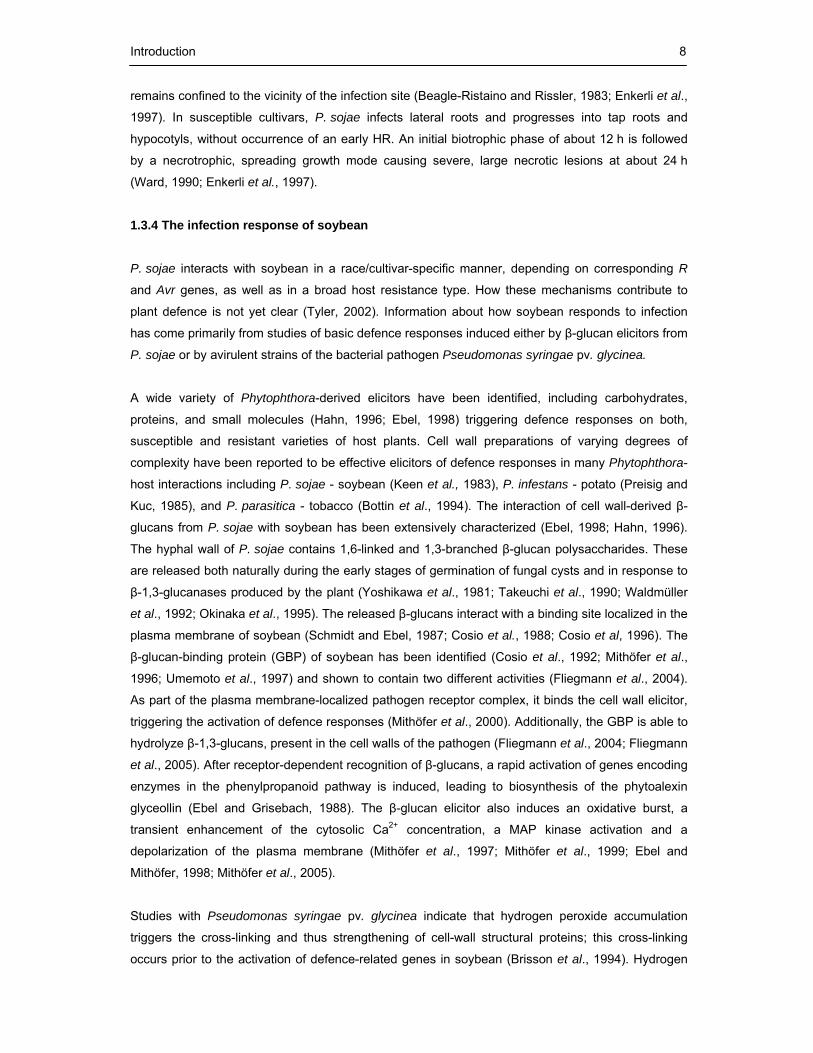
1.3.4 The infection response of soybean
P. sojae interacts with soybean in a race/cultivar-specific manner, depending on corresponding R
and Avr genes, as well as in a broad host resistance type. How these mechanisms contribute to
plant defence is not yet clear (Tyler, 2002). Information about how soybean responds to infection
has come primarily from studies of basic defence responses induced either by β-glucan elicitors from
P. sojae or by avirulent strains of the bacterial pathogen Pseudomonas syringae pv. glycinea.
A wide variety of Phytophthora-derived elicitors have been identified, including carbohydrates,
proteins, and small molecules (Hahn, 1996; Ebel, 1998) triggering defence responses on both,
susceptible and resistant varieties of host plants. Cell wall preparations of varying degrees of
complexity have been reported to be effective elicitors of defence responses in many Phytophthora-
host interactions including P. sojae - soybean (Keen et al., 1983), P. infestans - potato (Preisig and
Kuc, 1985), and P. parasitica - tobacco (Bottin et al., 1994). The interaction of cell wall-derived β-
glucans from P. sojae with soybean has been extensively characterized (Ebel, 1998; Hahn, 1996).
The hyphal wall of P. sojae contains 1,6-linked and 1,3-branched β-glucan polysaccharides. These
are released both naturally during the early stages of germination of fungal cysts and in response to
β-1,3-glucanases produced by the plant (Yoshikawa et al., 1981; Takeuchi et al., 1990; Waldmüller
et al., 1992; Okinaka et al., 1995). The released β-glucans interact with a binding site localized in the
plasma membrane of soybean (Schmidt and Ebel, 1987; Cosio et al., 1988; Cosio et al, 1996). The
β-glucan-binding protein (GBP) of soybean has been identified (Cosio et al., 1992; Mithöfer et al.,
1996; Umemoto et al., 1997) and shown to contain two different activities (Fliegmann et al., 2004).
As part of the plasma membrane-localized pathogen receptor complex, it binds the cell wall elicitor,
triggering the activation of defence responses (Mithöfer et al., 2000). Additionally, the GBP is able to
hydrolyze β-1,3-glucans, present in the cell walls of the pathogen (Fliegmann et al., 2004; Fliegmann
et al., 2005). After receptor-dependent recognition of β-glucans, a rapid activation of genes encoding
enzymes in the phenylpropanoid pathway is induced, leading to biosynthesis of the phytoalexin
glyceollin (Ebel and Grisebach, 1988). The β-glucan elicitor also induces an oxidative burst, a
transient enhancement of the cytosolic Ca2+ concentration, a MAP kinase activation and a
depolarization of the plasma membrane (Mithöfer et al., 1997; Mithöfer et al., 1999; Ebel and
Mithöfer, 1998; Mithöfer et al., 2005).
Studies with Pseudomonas syringae pv. glycinea indicate that hydrogen peroxide accumulation
triggers the cross-linking and thus strengthening of cell-wall structural proteins; this cross-linking
occurs prior to the activation of defence-related genes in soybean (Brisson et al., 1994). Hydrogen

Introduction 9
peroxide also stimulates an influx of calcium ions that activates a programmed cell death (Levine et
al., 1996). Soybean has also been reported to produce chitinase, which can degrade fungal walls
(Yeboah et al., 1998), polygalacturonase-inhibiting protein with activity against certain fungal endo-
polygalacturonases (Favaron et al., 1994) and an array of proteins functionally homologous to the
pathogenesis-related (PR) proteins described in tobacco (Nicotiana tabacum) and Arabidopsis
thaliana (Carr et al., 1985; Cao et al., 1994).
1.3.5 The phytoalexin pathway and glyceollin production in soybean Phytoalexin production is one of a number of inducible plant defence reactions conferring disease
resistance against microbial infections in plants. Soybean tissues produce and accumulate
glyceollins (isoflavonoid phytoalexins) after either inoculation with the soybean pathogen P. sojae, or
treatment with the β-glucan elicitor isolated from oomycete cell walls (Ayers et al., 1976a, b; Ebel et
al., 1986; Ebel and Grisebach, 1988). In principle, all organs from soybean are able to produce
glyceollins, e.g. roots, hypocotyls, cotyledons and leaves (Bhattacharyya and Ward, 1986a, b) as
well as cell suspension cultures (Ebel et al., 1976). Among the isomers, glyceollin I occurs in higher
amounts (Burden and Bailey, 1975) accompanied by the isomers II, III and V.
The glyceollin biosynthetic pathway consists of a series of reactions catalyzed by enzymes of
general phenylpropanoid metabolism and flavonoid/isoflavonoid biosynthesis as well as of enzymes
specifically involved in later steps of pterocarpan phytoalexin biosynthesis (Ebel, 1986). The
enzymes of general phenylpropanoid metabolism (phenylalanine ammonia-lyase (PAL), cinnamate
4-hydroxylase and 4-coumarate:CoA Ligase), acetyl-CoA carboxylase and enzymes of common
terpenoid pathway are involved in providing the substrates, 4-coumaroyl-CoA, malonyl-CoA, and
dimethylallylpyrophosphate for pterocarpan phytoalexin biosynthesis. The reaction linking the
general phenylpropanoid metabolism with the flavonoid/isoflavonoid biosynthesis is catalyzed by
chalcone synthase, using 4-coumaroyl-CoA and malonyl-CoA as substrates. The central reaction of
isoflavonoid biosynthesis involves a 2,3-aryl migration with a flavanone as substrate. Two enzymatic
reactions utilizing pterocarpanoid substrates have been identified in soybean cell-free extracts. The
3,9-dihydroxypterocarpan 6a-hydroxylase (D6aH) converts 3,9-dihydroxypterocarpan stereospecifi-
cally to 3,6a(S),9-trihydroxypterocarpan (glycinol) in the presence of NADPH and dioxygen
(Hagmann et al., 1984). The dimethylallylpyrophosphate 3,6a,9-trihydroxypterocarpan dimethyl-
allyltransferase (PRT) catalyzes the formation of the 4- as well as the 2-dimethylallyltrihydroxyptero-
carpan intermediates in the biosynthesis of the various glyceollin isomers (Zähringer et al., 1981).

Introduction 10
1.4 Resistance genes in hosts and avirulence genes in pathogens Resistance or susceptibility is attributed to a complex exchange of signaling cues between the
pathogen and the host resulting either in colonization and disease (compatible interaction), or in
recognition of the invading pathogen by the host leading to a successful defence response
(incompatible interaction). In the system soybean - P. sojae, the primary determinants of
compatibility are pathogen avirulence (Avr) and host resistance (Rps, resistance to Phytophthora
sojae) genes.
The molecular basis by which plants carrying a resistance (R) gene specifically recognize pathogens
carrying a corresponding Avr gene and activate defence is still largely unknown. Many R genes have
been cloned (Ji et al., 1998; Young, 2000; Dangl and Jones, 2001; Martin et al., 2003).
A characteristic of many R proteins is the reiterated leucine-rich repeat (LRR) motif, which contains
leucine and other hydrophobic amino acids at regular intervals. Most R proteins that contain LRR
motifs, also possess a central nucleotide-binding site (NBS). Some NBS-LRR R proteins posses a
putative leucine zipper (LZ) or coiled-coil sequence between the N terminus and the NBS domains.
LZs are well known for their roles in homo and hetero-dimerization of eukaryotic transcription factors.
Other NBS-LRR R proteins contain a large N-terminal domain called the Toll/interleukin-1/resistance
domain, which have been shown to contribute to the immune response (Agrios, 1997). Several of
the NBS-LRR proteins have a likely or, in some cases, proven intracellular location (Boyes et al.,
1998; Young, 2000).
More than fourteen single dominant R genes against P. sojae have been identified in soybean
(Anderson and Buzell, 1992; Buzell and Anderson, 1992). Six genes are clustered at the Rps1 locus
and three at the Rps3 locus. Several Rps genes are used commercially to protect soybean against
P. sojae, however, races of the pathogen able to infect resistant cultivars have arisen, limiting the
usefulness of Rps genes (Schmitthener et al., 1994; Kaitany et al., 2001).
Many Avr genes have been cloned to date, mostly from bacteria. Cloned Avr genes from fungi
include Avr4, Avr9 and Ecp2 from Cladosporium fulvum (Lauge and De Witt, 1998), NIP1 from
Rhynchosporium secalis (Rohe et al., 1995), AvrL567 genes from Melampsora lini (Dodds et al.,
2004; Catanzariti et al., 2006), AvrPi-ta (Orbach et al., 2000), Avr-CO39 (Farman and Leong, 1998)
and two species-specific Avr genes PWL1 and PWL2 (Kang et al., 1995) from Magnaporthe grisea.
Cloned Avr genes from viruses include the coat protein of potato virus X (PVX) (Bendahmane et al.,
1995) and the coat protein of turnip crinkle virus (TCV) (Zhao et al., 2000). Cloned Avr genes from
oomycetes include ATR13 from Hyaloperonospora parasitica (Allen et al., 2004), ATR1NdWsB from
H. parasitica (Rehmany et al., 2005), Avr3a from P. infestans (Armstrong et al., 2005) as well as the
race-specific avirulence gene Avr1b from P. sojae (Shan et al., 2004).
Genetic crosses among different races of P. sojae provided evidence for eight single dominant
avirulence genes, Avr1a, Avr1b, Avr1d, Avr1k, Avr3a, Avr4, Avr5 and Avr6. Genetic mapping has
shown that some of the avirulence genes of P. sojae are arranged in pairs. For example Avr1b and
Avr1k are inseparable in genetic crosses (Whisson et al., 1995).
Direct interactions between pathogen Avr proteins and plant R proteins have been demonstrated in
a few cases. One example is the interaction of the tomato Pto R gene product with the product of the

Introduction 11
AvrPto gene from the bacterium Pseudomonas syringae pv. tomato, which was demonstrated using
the yeast-two-hybrid (YTH) system (Scofield et al., 1996; Tang et al., 1996). Another example is the
interaction of the rice Pi-ta R gene product with the product of the AvrPi-ta gene from the fungus
Magnaporthe grisea, which was demonstrated using the YTH and in vitro systems (Jia et al., 2000).
However direct interaction seems to be the exception, leading to the suggestion of the “guard
hypothesis” (Van der Biezen and Jones, 1998; Van der Hoorn et al., 2002). The “guard hypothesis”
proposes that in host-pathogen relationships no direct physical interaction between R and Avr gene
products occurs and that perception of Avr proteins by their matching R gene products is indirect.
Indirect perception implies that a third component is required. This third component could be the
virulence target of an Avr protein. Binding of the Avr protein to its virulence target is proposed to be
perceived by the matching R protein, which is “guarding” the virulence target. An intriguing aspect of
the “guard hypothesis” is that the Avr gene product causes avirulence of the pathogen through
interaction with its virulence target in the plant (Luderer and Joosten, 2001; Chang et al., 2004).
Indirect Avr-R protein interaction was recently proposed for the tomato-Cladosporium system where
Avr2 binds and inhibits the extracellular cysteine protease Rcr3 and the Rcr3-Avr2 complex
subsequently enables the Cf-2 protein to activate an HR in tomato (Rooney et al., 2005).
1.5 The role of avirulence genes in pathogens It has been reported that many bacterial avirulence gene products are secreted into the host cell
using a molecular syringe, the conserved type III secretion system (TTSS) encoded by a group of
hypersensitive response and pathogenicity (hrp) genes (Lahaye and Bonas, 2001). Additionally, this
TTSS is found in both plant and animal pathogens for the export, secretion and often delivery of
specific proteinaceous effector molecules (virulence or pathogenicity factors) directly or indirectly
into host cells (Gabriel, 1999).
The idea that host-pathogen cross-talk is shaped due to evolutionary forces implies that avirulence
genes should provide a selective advantage to the bacterium in susceptible plants. Indeed many
bacterial avirulence genes have been shown to play a role in virulence (Kjemptrup et al., 2000;
White et al., 2000). This suggests that avirulence genes in oomycetes may also play a role in
virulence (Gabriel, 1999; Bonas and Van den Ackerveken, 1997). Although no TTSS has been
identified yet in oomycetes it is possible that specialized systems exist for delivering avirulence
proteins into host cells to manipulate defence pathways.
Avr proteins might contribute to pathogen virulence through interaction with specific plant proteins,
so-called virulence targets. Interaction of Avr proteins with virulence targets that are, for example,
involved in host metabolism or in plant defence, could result in enhanced nutrient availability for the
pathogen or a suppression of defence responses, respectively (Van der Biezen and Jones, 1998).
Evidence is accumulating that most avr genes are or once were pathogenicity genes found in
biotrophic pathogens. Avr genes may exist because of horizontal gene transfer, gene duplication or
mutation (Gabriel, 1999).
One example of horizontal gene transfer may be avrBs3, a gene isolated from Xanthomonas
campestris pv. vesicatoria strains. The gene resides on a self-mobilizing plasmid and was proved to
Introduction 12
be unnecessary for pathogenicity (Bonas et al., 1989). Horizontal gene transfer between species is
thought to occur to a greater extent than generally assumed (Shapiro, 1999).
Duplication is known for members of the avrBs3/pthA gene family. All members of this family present
62 bp terminal inverted repeats. The terminal 38 bp of these inverted repeats are highly similar to the
38 bp consensus terminal sequence of the Tn3 family of transposons. It is therefore possible that
these genes can, or once could transpose (De Feyter et al., 1993).
Another event might be the loss of a particular wild plant species as host due to mutation and
adaptation to new plant species, loosing functional but unnecessary genes that once assisted in
pathogenicity on plant species. Evidence for non-functional relics of Avr genes have been reported
for Pseudomonas and Xanthomonas (Kobayashi et al., 1990; Yang et al., 1996).
1.6 Avr1b from P. sojae
Map-based cloning and sequencing of Avr1b from P. sojae and the identification of two genes,
Avr1b-1 and Avr1b-2, within the locus for Avr1b were performed in the group of B.M. Tyler (Shan et
al., 2004). Avr1b-1 is the first genetically defined avirulence gene cloned from an oomycete and was
localized to a single 60 kb bacterial artificial chromosome (BAC) clone by fine-structure genetic
mapping. It was localized within the 60 kb region by identification of an mRNA expressed in a race-
specific and infection-specific manner. Avr1b-2 was genetically mapped to the same BAC contig as
Avr1b-1, and was shown to control the accumulation of Avr1b-1 mRNA. The Avr1k gene, required
for avirulence on soybean cultivars containing the resistance gene Rps1k, was mapped to the same
interval as Avr1b-1. In some isolates of P. sojae which are virulent on Rps1b-containing cultivars,
such as P7081 (race 25, Avr1b-, Avr1k-) and P7076 (race 19, Avr1b-, Avr1k-), the Avr1b-1 gene has
numerous substitution mutations indicative of strong divergent selection. In other isolates, such as
P6497 (race 2, Avr1b-, Avr1k+) there are no substitutions in Avr1b-1, but Avr1b-1 mRNA does not
accumulate (Shan et al., 2004).
Avr1b-1 encodes a small, hydrophilic protein of 117 amino acids, rich in α-helices, and containing a
putative secretion signal of 21 amino acids at the N-terminus. Avr1b-1 is unusual for a secreted
protein since it lacks any disulfide bonds. It shows limited sequence homology to the avirulence
protein Avr3a from P. infestans (Armstrong et al., 2005).
Since Avr1b-1 appears to encode a secreted protein, it was proposed that the Avr1b-1 protein might
act as a specific elicitor on soybean plants containing the Rps1b resistance gene. In support of this
hypothesis, recombinant Avr1b-1 protein obtained from the culture medium of the yeast Pichia
pastoris was infiltrated into soybean leaves and triggered a hypersensitive response observed as a
severe necrosis in the leaves of Rps1b cultivars two to three days after infiltration. From day four
onward this response spread to the mid and upper regions of the plant, beginning not with the
nearest uninfiltrated but with the uppermost leaves and moving downward through the plant (Shan et
al., 2004).
Introduction 13
1.7 Objectives
In recent years, a multitude of gene sequences from oomycetes have been published in data bases,
providing the possibility of identifying components that regulate vital processes in the pathogen such
as sporulation, spore germination and virulence. Avr1b-1 was the first avirulence gene from an
oomycete (P. sojae) to be cloned (Shan et al., 2004) and during the last two years other avirulence
genes from different oomycetes e.g. Avr3a from P. infestans, ATR13 and ATR1NdWsB from
H. parasitica have also been cloned (Armstrong et al., 2005; Allen et al., 2004; Rehmany et al.,
2005). The function and properties of the proteins these avirulence genes encode, are not fully
understood, therefore further research in the race-specific interaction between soybean and P. sojae
needs to be performed.
After isolation of the avirulence gene Avr1b-1 from P. sojae (Shan et al., 2004), the properties,
function and localization of the encoded protein needed to be investigated in infected soybean
plants. Therefore the first objective of this work was the establishment of a reliable transgenic
system for heterologous expression of Avr1b-1. Subsequently, it was necessary to produce Avr1b-1
protein in sufficient amount to enable testing its biological activity in soybean seedlings and also to
raise an anti-Avr1b-antiserum for analysing the presence of Avr1b-1 after infection.

Material 14
2 Material 2.1 Antibody Anti-rabbit IgG (whole molecule) alkaline phosphatase conjugate. (Sigma, Munich)
2.2 Plant material Soybean cultivars Harosoy (rps), Harosoy 1372 (Rps1b) and Williams L77-1863 (Rps1b) were
obtained from T. Anderson, Agriculture and Agri-Food, Canada.
2.3 Microorganisms
Phytophthora sojae
Phytophthora sojae races 1 (Avr1b+, Avr1k+, laboratory culture collection) and 2 (Avr1b-, Avr1k+,
strain P6497 obtained from B.M. Tyler, Virginia Polytechnic Institute and State University, USA) were
routinely grown on Lima bean agar plates at 25°C in the dark.
Escherichia coli
BL21(DE3) (Novagen, Darmstadt)
Genotype: F-ompT hsdSB (rB-mB-)gal dcm (DE3)
DH5α (Hanahan, 1983)
Genotype: F- φ80dlacZ∆M15 ∆(lacZYA-argF) U169 deoR recA1 endA1 hsdR17 (rk-,mk+) phoA
supE44 λ-thi gyrA96 relA1
XL10-Gold (Epicurean ultracompetent cells, Stratagene, Amsterdam)
Genotype: Kan: TetR∆(mcrA) 183 ∆(mcrCB-hsdsMR-mrr) 173 endA1supE44 thi-1 recA gyrA96 relA1
lac Hte [F’ proAB lacIq Z∆M15 Tn10 (TetR) Tn5 (KanR) Amy]a
DH10Bac (Invitrogen, Karlsruhe) Genotype: F- mcrA ∆(mmr-hsdRMS-mcrBC) φ80dlacZ∆M15 ∆lacX74 deoR recA1 endA1 araD139
∆(ara, leu)7697 galU galK λ-rpsL nupG /bMON14272 /pMON7124

Material 15
Sf9 insect cells
Insect cells derived from the fall armyworm Spodoptera frugiperda ovarian cells (Invitrogen,
Karlsruhe).
2.4 Elicitor The raw elicitor, obtained from cell walls of P. sojae, was prepared through partial acid hydrolysis
with trifluoroacetic acid (Hahn et al., 1981; Sharp et al., 1984b).
2.5 Chemicals Common chemicals used in the laboratory were provided by the companies Roth (Karlsruhe), Sigma
(Munich), Serva (Heidelberg) and Merck (Darmstadt).
List of chemicals:
α-D(+)-Glucose monohydrate Roth (Karlsruhe)
Agar-agar Roth (Karlsruhe)
Agarose peqGold universal peqLab (Erlangen)
AgNO3 Sigma (Munich)
Ampicilin sodium salt Roth (Karlsruhe)
Antimycin A Fluka (Sigma-Munich)
APS Roth (Karlsruhe)
Bacto-peptone Difco (Becton Dickinson, Heidelberg)
Bacto-tryptone Difco (Becton Dickinson, Heidelberg)
Bacto-yeast-extract Difco (Becton Dickinson, Heidelberg)
BCIP Roth (Karlsruhe)
Bradford reagent BIO-RAD (Munich)
Bromophenol blue Roth (Karlsruhe)
BSA Serva (Heidelberg)
Ca(NO3)2.4H2O Merck (Darmstadt)
Complete (Protease inhibitor cocktail tablets) Roche (Penzberg)
Coomassie brillant blue R Sigma (Munich)
CTAB Sigma (Munich)
Cytochrome C Sigma (Munich)
DNA peqGOLD markers peqLab (Erlangen)
DMSO Sigma (Munich)
DEPC Roth (Karlsruhe)
DTT Roth (Karlsruhe)
Cellfectin reagent Invitrogen (Karlsruhe)
EDTA-disodium Serva (Heidelberg)
EGTA Roth (Karlsruhe)
Material 16
Ethidiumbromide 1% solution Roth (Karlsruhe)
Gelatine Sigma (Munich)
Gentamycin Invitrogen (Karlsruhe)
Glucose Roth (Karlsruhe)
Glyceollin as standard substance Available in the laboratory
Glycerine Roth (Karlsruhe)
Glycine Roth (Karlsruhe)
4-Methylamino phenol Sigma (Munich)
4-Nitrophenylphospate disodium salt hexahydrate Roth (Karlsruhe)
IPL41 insect cells medium Invitrogen (Karlsruhe)
IPTG Bio Vectra (St. Leon-Rot)
Kanamicin Roth (Karlsruhe)
L-Arginine AppliChem (Darmstadt)
Lima bean agar Difco (Becton Dickinson, Heidelberg)
L-Malate Fluka (Sigma-Munich)
β-Mercaptoethanol Roth (Karlsruhe)
MnCl2.2H2O Merck (Darmstadt)
β-NADPH Sigma (Munich)
NBT Roth (Karlsruhe)
Ni-NTA agarose Qiagen (Hilden)
Ni-NTA-AP-conjugate Qiagen (Hilden)
Orange G Sigma-Aldrich (Steinheim)
Phenol/chloroform/isoamylalcohol (25:24:1) Roth (Karlsruhe)
PMSF Sigma (Munich)
Ponceau S Sigma (Munich)
Prestained protein markers New England Biolabs (Frankfurt)
Protein A Sepharose CL-4B Pharmacia Biotech (Freiburg)
PVP-40 Sigma (Munich)
Random primers Invitrogen (Karlsruhe)
SDS BIO-RAD (Munich)
SF900 II insect cells medium Invitrogen (Karlsruhe)
Slim fast Commercially available
β-Sitosterol Fluka (Sigma-Munich)
Sodium hypochloride solution (12% Cl) Roth (Karlsruhe)
Spermidine Sigma (Munich)
TEMED Roth (Karlsruhe)
Tetracycline (HCl) Sigma (Munich)
Trifast-reagent peqLab (Erlangen)
Tris Roth (Karlsruhe)
Tween 20 Roth (Karlsruhe)
Urea Roth (Karlsruhe)

Material 17
X-Gal Roth (Karlsruhe)
2.6 Enzymes for molecular biology BamH I (10 U/µl) MBI Fermentas (St.Leon-Rot)
EcoR I (10 U/µl) MBI Fermentas (St.Leon-Rot)
Nco I (10 U/µl) New England Biolabs (Frankfurt)
Pau I (10 U/µl) MBI Fermentas (St.Leon-Rot)
Sac I (20 U/µl) New England Biolabs (Frankfurt)
Xba I (10 U/µl) MBI Fermentas (St.Leon-Rot)
Pst I (10 U/µl) MBI Fermentas (St.Leon-Rot)
Spe I (10 U/µl) New England Biolabs (Frankfurt)
Sph I (5 U/µl) New England Biolabs (Frankfurt)
M-MLV Reverse transcriptase (200 U/µl) Invitrogen (Karlsruhe)
Pfu polymerase (3 U/µl) Promega (Mannheim)
RNasin Plus (Ribonuclease inhibitor, 40 U/µl) Promega (Mannheim)
RQ1 RNase free DNase I (1 U/µl) Promega (Mannheim)
T4-DNA ligase (2 U/µl) MBI Fermentas (St.Leon-Rot)
Taq DNA polymerase (5 U/µl) Qbiogene (Heidelberg)
RNase (10 µg/µl) Available in the laboratory
2.7 Vectors
pET26b Novagen (Darmstadt)
pGEM-T Promega (Mannheim)
pFastBac1 Invitrogen (Karlsruhe)
2.8 Plasmids
pTZ18-Avr1b containing the full length-cDNA encoding Avr1b, was obtained from B.M. Tyler, Virginia
Polytechnic Institute and State University, USA.
pET26b-Avr1b containing the full length-cDNA encoding Avr1b, including a periplasmic localization
sequence (pelB) at the N-terminus and a His6-sequence at the C-terminus was prepared by
D. Becker (Botanical Institute, Munich).
pQE-30/Gm4CL1, pQE-30/Gm4CL2, pQE-31/Gm4CL3, and pQE-30/Gm4CL4 (Lindermayr et al.,
2002) were provided by Dr. M.V. Silber (Botanical Institute, Munich).

Material 18
2.9 Oligonucleotides
Sequence
Avr1b_PauI-1 5´-TATGCGCGCCACCATGCGTCTATCTTTTG-3´
Avr1b_PauI-2 5´ TATGCGCGCCACCATGGCAACTGAGTACTC-3´
T7-promoter 5´-TAATACGACTCACTATAGGG-3´
Avr1b-Sac I 5´-GC[GTCGAC]CATGCGTCTATCTTTTGTGC-3´
Avr1b-Not I 5´-TA[GCGGCCGC]TCTGATACCGGTGAAA-3´
Avr1b_for 5´-CCAAGTATCACGAACCATGCG-3´
Avr1b_rev 5´-TGCGATTTCGGCGAGACC-3´
ActA_for 5´-TCATGGTCGGCATGGACCA-3´
ActA_rev 5´-GGCCGTGGTCGTGAACGAG-3´
GmTubB2_for 5´-GTGACTTGAACCATCTGATCTCAGC-3´
GmTubB2_rev 5´- GTTGAAGCCATCCTCAAGCCAG-3´
Cyp93a1_for 5´-GCAAGAAAAACCTTCCACCAAGT-3´
Cyp93a1_rev 5´-AAACGCGAAAAGGAAGTCTTGGG-3´
4CL3_for 5´-ACGGTAGCTGCTTCTCTTGATGC-3´
4CL3_rev 5´-GTCGTCGACGGTCACAACCTT-3´
SP6 5´-ATTTAGGTGACACTATAGAATAC-3´
2.10 Kits for molecular biology NucleoSpin Extract II kit Macherey-Nagel (Düren)
BAC-TO-BAC Baculovirus Expression System Invitrogen (Karlsruhe)
RNeasy Plant Mini Kit Qiagen (Hilden)
2.11 Instruments Autoclave SANOclav Wolf (Geislingen)
Centrifuge Minifuge 5415D Eppendorf (Hamburg)
Centrifuge 3K18 with rotors Nr. 11133 and Nr. 12154-H Sigma (Osterode am Harz)
Centrifuge RC-5B Plus, with rotors: SS-34, GS-3, GSA Sorvall (Hanau)
C10 column and AC10 adaptor for chromatography Pharmacia Biotech (Freiburg)
Culture flasks T-25, T-75 and T-150 CellStar (Frickenhausen)
Dialysis bags, MCWO 8 000-10 000, vol/cm 3,27 ml Roth (Karlsruhe)
Electrophoresis apparatus, Bio-Rad minigel BIO-RAD (Munich)
Evaporator Rotavapor Büchi (Flawil, Switzerland)
Filters Millex-HV 4 mm Millipore (Eschborn)
FPLC, with pumps P-500, Superloop, LKV UV-MII,
conductivity monitor, controller LCC-501 Plus, fraction collector Pharmacia Biotech (Freiburg)

Material 19
HPLC 2690 with Photodiode array detector 474 Waters (Eschborn)
Microscope Axiovert 25, objectives:
CP-Akromat 10x/0,2 Ph1;
LD-Achrostigmat 20x/0,30 Ph1;
LD-Achrostigmat 40x/0,55 Ph2 Zeiss (Jena)
L8-55M ultracentrifuge with rotor: SW28 Beckman (Munich)
Nitrocellulose transfer membranes Pall Gellman Sciences
(VWR International, Ismaning)
Ni-NTA superflow matrix Qiagen (Hilden)
OptimaTM TLX ultracentrifuge with rotor TLA 100.4 Beckman (Munich)
PCR Thermocycler UNOII Biometra (Göttingen)
pH-meter Calimatic Knick (Berlin)
Peristaltic pump miniplus 2 Gilson (Villiers le Bel, France)
Growth chamber Weiss Umwelttechnik
(Reiskirchen-Lindenstruth)
Reacti-Therm heating/stirring module Pierce (Bonn)
RP-column Nova Pak C18, 4,6x150 mm; 4 µm Waters (Eschborn)
Sonifier (Model 250/450) Branson Ultrasonics
Corporation (USA)
Speedvac Bachofer (Reutlingen)
Spectrophotometer Ultrospec 3000 Pharmacia Biotech (Freiburg)
Sterile bench Ehret (Emmendingen)
Vermiculite Deutsche Vermiculite
Dämmstoff GmbH (Sprockhövel)
Western blot LKB-multi Drive XL instrument Pharmacia Biotech (Freiburg)
2.12 Software and internet resources Millenium32 software Waters (Eschborn)
Sigma Plot 8.0 Jandel Scientific (Erkrath)
ISIS Draw 2.4 Silicon Graphics (Munich)
Advanced BLAST search NCBI (Bethesda, USA)
MultAlin MultipleSequenceAlignment INRA (Toulouse, France)
2.13 Media, buffers and other solutions Lima bean agar 2,3% (w/v) Lima bean agar, autoclaved.

Material 20
LB medium 1% (w/v) bacto-tryptone, 0,5% (w/v) bacto-yeast-extract, 1% (w/v) NaCl. For plates 1,5% (w/v) agar-
agar. Adjusted to pH 7,5; autoclaved. Antibiotics added prior to use.
SOC+++ medium 2% (w/v) bacto-tryptone, 0,5% (w/v) bacto-yeast-extract, 10 mM NaCl, 2,5 mM KCl, adjusted to
pH 7,0; autoclaved. 10 mM MgCl2, 10 mM MgSO4 and 20 mM glucose added prior to use. Store at -
20°C.
Modified Erwin synthetic medium
D(+)-Sucrose 15 g/l
L-Asparagin 2 g/l
FeSO4.7H2O 1 mg/l
MgSO4.7H2O 0,2 g/l
CaCl2.2H2O 0,01 g/l
Thiamine-HCl 1 mg/l
K2HPO4 1,9 g/l
KH2PO4 1,04 g/l
ZnSO4.7H2O 4,39 mg/l
CuSO4.5H2O 79 µg/l
Na2MoO4.2H2O 53 µg/l
MnCl2.2H2O 70 µg/l
β-Sitosterol 0,05 g/l
CaCO3 6,25 g/l (not soluble)
Buffers for insect cell fractionation
1x buffer N: 10 mM Tris-HCl (pH 7,0), 150 mM NaCl, 5 mM MgCl2, 40 mM KCl 1x PBS buffer: 40 mM Na2HPO4, 8 mM NaH2PO4, 150 mM NaCl, pH 7,4
Buffer C: 5 mM MgCl2, 10 mM Tris-HCl (pH 7,0)
Buffer for harvesting of E. coli cells Sonication buffer: 50 mM Tris-HCl (pH 8,0), 200 mM NaCl, 15 mM EDTA, 100 µM PMSF
Buffers for protein purification under denaturing conditions Buffer A: 0,1 M NaH2PO4, 0,01 M Tris-HCl, 8 M urea, pH 8,0
Wash buffer: 0,1 M NaH2PO4, 0,01 M Tris-HCl, 8 M urea, pH 7,0
Elution buffer I: 0,1 M NaH2PO4, 0,01 M Tris-HCl, 8 M urea, pH 5,9
Elution buffer II: 0,1 M NaH2PO4, 0,01 M Tris-HCl, 8 M urea, pH 4,5
Dialysis buffer: Tris-HCl (pH 7,5), 1 mM EDTA, 0,5 M arginine, 20% glycerol

Material 21
Buffers for protein refolding Buffer X: 7 M urea, 0,5 M NaCl, 20% (v/v) glycerol, 20 mM Tris-HCl (pH 7,4), 0,5 mM PMSF
Buffer 1A: 0,5 M NaCl, 20% (v/v) glycerol, 20 mM Tris-HCl, 0,5 mM PMSF. Adjusted to pH 7,4 and
degased before use on the FPLC.
Buffer 1B: 0,5 M NaCl; 20% (v/v) glycerol, 20 mM Tris-HCl, 0,5 mM PMSF, 7 M urea. Adjusted to pH
7,4 and degased before use.
Buffer 2A: 50 mM NaH2PO4, 300 mM NaCl. Adjusted to pH 7,0 and degased before use on the
FPLC.
Buffer 2B: 50 mM NaH2PO4, 300 mM NaCl, 250 mM imidazole. Adjusted to pH 7,0 and degased
before use.
Equilibration buffer: 50 mM imidazole, 50 mM NaH2PO4, 300 mM NaCl
Buffer for production of anti-Avr1b-antiserum 1x PBS buffer: 40 mM Na2HPO4, 8 mM NaH2PO4, 150 mM NaCl, pH 7,4
Buffers for purification of anti-Avr1b-antiserum with protein A sepharose
Binding buffer: 50 mM Tris-HCl, pH 7,0, Rt
Elution buffer: 0,1 M glycine pH 3,0, Rt
Solutions for SDS-PAGE 1x SDS loading buffer: 0,05 M Tris-HCl (pH 6,8), 4% (w/v) SDS, 2 mM DTT, 20% (v/v) glycerin,
0,02 mM PMSF, 0,02 mM aminocaproic acid, 5x10⁻³ µg/ml leupeptin, 5x10⁻³ µg/ml aprotinin,
0,01% (w/v) bromophenol blue
3x SDS loading buffer: 0,15 M Tris-HCl (pH 6,8), 12% (w/v) SDS, 6 mM DTT, 20% (v/v) glycerin,
0,02 mM PMSF, 0,02 mM aminocaproic acid, 5x10⁻³ µg/ml leupeptin, 5x10⁻³ µg/ml aprotinin,
0,01% (w/v) bromophenol blue
5x SDS loading buffer: 0,25 M Tris-HCl (pH 6,8), 20% (w/v) SDS, 10 mM DTT, 20% (v/v) glycerin,
0,02 mM PMSF, 0,02 mM aminocaproic acid, 5x10⁻³ µg/ml leupeptin, 5x10⁻³ µg/ml aprotinin,
0,01% (w/v) bromophenol blue
Stacking gel: 6% (v/v) acrylamide, 0,1291 M Tris-HCl (pH 6,8), 0,1% (w/v) SDS, 0,08% APS, 0,4%
TEMED
Separating gel: 17,4% (v/v) acrylamide, 0,369 M Tris-HCl (pH 8,8), 0,1% (w/v) SDS, 0,065% APS,
0,1% TEMED
Running buffer: 192 mM glycine, 25 mM Tris-HCl (pH 8,3), 0,1% (w/v) SDS
Solutions for silver staining Fixative solution: 40% ethanol, 10% acetic acid
Wash solution: 30% ethanol
Thiosulfate reagent: 0,02% sodium thiosulfate
Silver nitrate reagent: 0,2% silver nitrate, 0,02% formaldehyde (37%)
Developing solution: 3% sodium carbonate, 0,05% formaldehyde (37%), 0,0005% sodium thiosulfate

Material 22
Stop reagent: 0,5% glycine
Solutions for Coomassie staining
Coomassie solution: 0,1% (w/v) Coomasie Brilliant Blue R-250; 40% (v/v) methanol; 10% (v/v) acetic
acid glacial
Destaining solution: 40% (v/v) methanol; 10% (v/v) acetic acid glacial
Solutions for semi-dry Western blotting Anode buffer I: 300 mM Tris, 20% (v/v) methanol
Anode buffer II: 25 mM Tris, 20% (v/v) methanol
Cathode buffer: 40 mM aminocaproic acid, 0,01% (w/v) SDS, 20% (v/v) methanol
Ponceau S solution: 1% (w/v) Ponceau S solution in 2% (v/v) acetic acid glacial
Solutions for detection with anti-Avr1b-antiserum TBS buffer: 150 mM NaCl, 1 mM MgCl2, 50 mM Tris-HCl, pH 7,8
TBS-Tween buffer: TBS + 0,05% (v/v) Tween 20
G-Net: 0,25% gelatine, 0,15 M NaCl, 5 mM EDTA (pH 8,0), 0,05% Triton X 100
NBT: 100 mg/ml in 70% (v/v) DMF
BCIP: 50 mg/ml in 100% (v/v) DMF
AP buffer: 33 µl NBT and 33 µl BCIP in 10 ml 100 mM Tris-HCl (pH 9,5), 100 mM NaCl,
5 mM MgCl2
Buffers for immunoprecipitation Denaturing buffer: 7 M urea, 0,5 M NaCl, 20% glycerol, 20 mM Tris-HCl (pH 7,5),
1x protease inhibitor cocktail
Extraction buffer I: 30 mM MgCl2, 5 mM EDTA, 100 mM NaCl, 50 mM Tris-HCl (pH 7,5),
1x protease inhibitor cocktail
Dilution buffer: 1,25% Triton X 100, 190 mM NaCl, 6 mM EDTA, 60 mM Tris-HCl (pH 7,5),
1x protease inhibitor cocktail
Suspension of PAS: 0,05 mg PAS in 0,45 ml extraction buffer I
Buffers for agarose gel electrophoresis 1x Agarose loading buffer: 30% (v/v) glycerin, 1xTAE, 2,5 mg/ml orange G
1x TAE buffer: 40 mM Tris, 2 mM Na-EDTA, 0,11% (v/v) acetic acid
Solutions for minipreparation Solution I: 50 mM D-glucose, 25 mM Tris-HCl (pH 8,0), 10 mM EDTA, autoclaved
Solution II: 1% (w/v) SDS, 0,2 N NaOH (should be prepared fresh each time)
Solution III: 3 M potassium-acetate pH 5,5
Solution IV: 15 mM Tris-HCl (pH 8,0), 10 mM EDTA, 100 µg/ml RNase A (should be prepared fresh
each time)
Material 23
TE buffer: 10 mM Tris-HCl (pH 8,0), 1 mM EDTA
Buffers for PCR, colony PCR and RT-PCR 10x Pfu-polymerase buffer: 200 mM Tris-HCl (pH 8,8), 100 mM KCl, 100 mM (NH4)2SO4, 1,0% Triton
X 100, 1 mg/ml BSA, 20 mM MgSO4
PCR solution: 10 µl solution contains 10 ng template DNA, 0,6 units Pfu-polymerase, 0,2 mM dNTPs,
10 pmol of each specific forward and reverse strand primers in 1x Pfu-polymerase buffer
10x Taq-DNA-polymerase buffer: 100 mM Tris-HCl (pH 9,0), 2 mg/ml BSA, 15 mM MgCl2,
500 mM KCl, 1,0% Triton X 100 Colony PCR solution: 8 µl solution contains 0,25 units of Taq-DNA-polymerase, 0,2 mM dNTPs,
8 pmol of each specific forward and reverse strand primers, 2,5 mM MgCl2 in 1x Taq-DNA-
polymerase buffer
5x First-strand-buffer: 15 mM MgCl2, 250 mM Tris-HCl (pH 8,3), 375 mM KCl
RT-PCR solution I: 20 µl contains 200 units of M-MLV reverse transcriptase, 80 units of RNasin
RNase inhibitor, 80 ng random primers, 1 mM dNTPs, 10 mM DTT in 1x first-strand-buffer
RT-PCR solution II: 10 µl contains 0,25 units of Taq-DNA-polymerase, 10 pmol of each specific
forward and reverse primers, 2,5 mM MgCl2 in 1x Taq-DNA-polymerase buffer. In the case of
4CL3, 2 pmol of each specific forward and reverse primers and 1,5 mM MgCl2 were used.
Buffer for DNase treatment DNase treatment solution: 400 µl contains 40 units RNasin RNase inhibitor, 1 unit DNase/µg RNA in
1x DNase buffer
10x DNase buffer: 400 mM Tris-HCl (pH 8,0), 100 mM MgSO4, 10 mM CaCl2
Solution for A-tailing procedure A-tailing solution: 5 µl solution contains 0,5 µl 2 mM dATP, 2,5 units of Taq-DNA-polymerase,
2,5 mM MgCl2 in 1x Taq-DNA polymerase buffer
Buffers for ligation 10x Ligase buffer: 300 mM Tris-HCl (pH 7,8), 100 mM MgCl2, 100 mM DTT, 10 mM ATP
Ligation solution: 5 solution contains DNA vector, insert, 1 unit T4-DNA-ligase in 1x ligase buffer
Buffer for subcellular fractionation of P. sojae mycelium Grinding buffer: 20 mM HEPES/KOH (pH 7,5), 5 mM MgCl2, 10 mM KCl, 1 mM EGTA, 250 mM
sucrose, 2 mM PMSF, 2 mM DTT
Lysis buffer: 50 mM Tris-HCl (pH 7,5), 250 mM sucrose, 5 mM EDTA, 2 mM DTT, 2 mM PMSF,
2 µg/ml leupeptin
AB buffer: 10 mM Tris-HCl (pH 7,0), 150 mM NaCl, 5 mM MgCl2
Buffer for subcellular fractionation of infected soybean seedlings Extraction buffer II: 50 mM Tris-HCl (pH 7,5), 5 mM EDTA, 30 mM MgCl2, 0,5 mM PMSF

Material 24
Solutions for RNA isolation from P. sojae mycelium RNA extraction buffer: 2% (w/v) CTAB, 2% (w/v) PVP, 100 mM Tris-HCl (pH 8,0), 2 M NaCl, 25 mM
EDTA, 0,25 g/l spermidine, autoclaved. 2% (v/v) β-mercaptoethanol added prior to use.
SSTE: 1 M NaCl, 0,5% (w/v) SDS, 10 mM Tris-HCl (pH 8,0), 1 mM EDTA, autoclaved.
DEPC-water: 0,1% (v/v) DEPC in distilled water, stirred overnight in a fume-hood, autoclaved.
Methods 25
3 Methods 3.1 Soybean cultures Soybean seeds were sterilized in 10% sodium hypochloride solution for 10 min and washed several
times with distilled water. Afterwards the seeds were planted in autoclaved vermiculite and poured
with autoclaved water. After growing 3 to 12 days in a growth chamber with a 16 h (26°C) day and a
8 h (22°C) night period at 65% relative humidity, seedlings were harvested and the vermiculite
removed.
3.2 Phytophthora sojae cultures 3.2.1 Growth on solid medium Phytophthora sojae races 1 and 2 were grown on lima bean agar plates. For inoculation of new
plates, approximately 1 cm2 of the previous culture was transferred to a fresh plate with the mycelium
being in contact to the agar. Plates were incubated for 7 days at 24°C in the dark when used for
maintaining the line or 12 days when used for inoculation of liquid medium or for production of
zoospores. Cultures on solid medium can be stored up to 8 weeks at 4°C.
3.2.2 Growth on liquid medium Growth of P. sojae in liquid medium was performed as described by Erwin and Katznelson (1961),
Keen (1975), Ayers et al. (1976, IX), Antelo (1998). 400 ml of modified Erwin synthetic medium (2.13)
was autoclaved in a 1,8 l Fernbach flask. One third of a 12 day-old culture plate was used for
inoculation of the medium. Incubation was carried out at 24°C in the dark without stirring. After one
week the flask was shaken gently in order to break slightly the mycelium for stimulating further
growth. The culture was incubated for 3 weeks if used for hypocotyl assays, or 2 to 6 weeks if used
for RNA extraction.
3.3 Insect cell culture 3.3.1 Revival of frozen insect cells Frozen Sf9 insect cells were thawed by rapid agitation in a 37°C water bath. As soon as the frozen
medium with the cells was thawed, the vial was removed from the water bath and immersed in 70%
ethanol at Rt. Cells were then transferred to a cold (4°C) pre-wetted T-25 culture flask containing
5 ml IPL41 + 5% FBS -medium and incubated for 30 min at 28°C for cell attachment. Afterwards the

Methods 26
medium was removed and replaced with 5 ml of fresh medium. After overnight incubation at 28°C,
the medium was removed again and replaced with 5 ml of fresh medium, incubated for at least 7
days at 28°C while changing the medium every 72 h.
3.3.2 Maintenance of the insect cell culture After incubation for at least 7 days (3.3.1) the medium was replaced with 5 ml of fresh IPL41 + 5%
FBS medium. Using a pipette the medium was drawn up in a side to side motion removing the cells.
Once the cells have been removed they were diluted 1:2 (i.e. 50% cells were transferred to a new T-
25 culture flask) in IPL41 + 5% FBS medium. After the cells have been transferred 3 to 4 times, they
were diluted 1:10 into a new T-25 flask and incubated for 4 days at 28°C in the dark.
3.3.3 Transfection of insect cells with recombinant bacmid DNA For each transfection, solution A (5 µl of mini-prep bacmid DNA in 100 µl SF-900 II SFM) was
combined with solution B (6 µl cellfectin lipid reagent in 100 µl SF-900 II SFM) producing a lipid-DNA
complex, mixed gently and incubated in 1,5 ml reaction tubes for 30 min at Rt. Afterwards 0,8 ml of
SF-900 II SFM medium was added to each reaction tube containing the lipid-DNA complexes. In
parallel 9x10⁵ insect cells in IPL41 + 5% FBS medium were placed in several 35-mm wells each and
allowed to attach to the bottom of the wells for 1 h at 28°C. The IPL41 + 5% FBS medium was then
removed and the cells were covered with around 1 ml of the lipid-DNA complexes from the reaction
tubes in order to incorporate the bacmid DNA. The cells were incubated for 4 h at 28°C and the SF-
900 II SFM medium with the lipid-DNA complexes (transfection mixtures) was removed and replaced
with 2,5 ml of fresh SF-900 II SFM medium. Then the cells were incubated for another 72 h at 28°C
and the cell culture medium was transferred to a 15 ml falcon tube and centrifuged (500xg, Rt,
5 min). The baculovirus-containing supernatant (P1) was transferred to a new 15 ml falcon tube and
stored at 4°C.
3.3.4 Infection of insect cells with recombinant baculovirus particles Insect cells (2x10⁶) in IPL41 + 5% FBS medium were incubated in a T-25 culture flask for 30 min at
28°C. After attachment of the cells to the flask the IPL41 + 5% FBS medium was removed and
replaced with 2,3 ml SF-900 II SFM medium containing 0,3 ml baculovirus particles (P1). The cells
were incubated for 1 h at 28°C. Afterwards 2,7 ml SF-900 II SFM medium were added and the cells
were incubated for another 48 h at 28°C. After the incubation the cell culture medium was centrifuged
(500xg, Rt, 5 min). The baculovirus-containing supernatant was transferred to a 15 ml falcon tube
and stored at 4°C. This stock of baculovirus particles (P2) was used for amplification.

Methods 27
3.3.5 Amplification of recombinant baculovirus particles
Insect cells (4x10⁶) in IPL41 + 5% FBS medium were transferred from a T-25 to a T-75 culture flask
and incubated for 30 min at 28°C. After attachment of the cells to the flask the IPL41 + 5% FBS
medium was removed and replaced with 2 ml SF-900 II SFM medium containing 10,5 µl baculovirus
particles (P2) and the cells were incubated for 1 h at 28°C. Afterwards 8 ml of fresh SF-900 II SFM
medium were added and the cells were incubated for another 48 h at 28°C. After incubation the cell
culture medium was centrifuged (500xg, Rt, 5 min). The supernatant was transferred to a 15 ml
falcon tube and stored at 4°C. This amplified stock of baculovirus particles (P3) was used for further
infection experiments.
3.3.6 Insect cell fractionation Insect cells (8x10⁶) in IPL41 + 5% FBS medium were incubated in a T-150 culture flask for 30 min at
28°C. After attachment of the cells to the flask the IPL41 + 5% FBS medium was removed and
replaced with 8 ml SF-900 II SFM medium containing 400 µl baculovirus particles (P3). The cells
were incubated for 1 h at 28°C. Another 10 ml of SF-900 II SFM medium were added and the cells
incubated for 120 h at 28°C. After incubation the cell culture medium was transferred in 15 ml falcon
tubes for centrifugation (500xg, Rt, 5 min). A fraction (1 ml) of the supernatant (“culture medium”
fraction) was precipitated with TCA (3.8.2) before SDS-PAGE and the rest was dialyzed against 50
mM NaH2PO4 (2x1 h followed by 1x16 h, 4°C). This “culture medium” fraction was either frozen and
stored at -80°C or used immediately for biotests.
The infected insect cells attached to the flask were used for further fractionation as follows:
In the first case, cells were washed with 5 ml PBS, centrifuged (500xg, Rt, 5min), preswollen in 1 ml
buffer C and lysed by homogenization for 10 min on ice. 1 ml 2x buffer N was added to reach a final
concentration of 1x buffer N and centrifuged for 5 min at 300xg (4°C), obtaining a pellet and a
supernatant (S1). The pellet was resuspended in 1 ml 0,2 M sucrose and the nuclei was pelleted
through a 2 ml 1,6 M sucrose cushion (in 1x buffer N) for 45 min at 44 000xg, 4°C. The pellet was
washed with 1% Triton X 100 in 1x buffer N, centrifuged (300xg, 4°C, 5 min) and the pellet
resuspended in 300 µl 1x buffer N (“nuclei” fraction).
The supernatant (S1) was centrifuged again (300xg, 4°C, 5 min) and the pellet obtained after
centrifugation was discarded. Following addition of 20 µl 0,5 M EDTA, the supernatant was
centrifuged (10 000xg, 4°C, 10 min). The pellet obtained after centrifugation contains heavy
membranes and was resuspended in 300 µl 1x buffer N (“heavy membrane” fraction). The
supernatant was centrifuged (150 000xg, 4°C, 1 h) and the pellet obtained was resuspended in
100 µl 1x buffer N (“light membrane” fraction). The supernatant was also collected (“cytosolic”
fraction).
In the second case infected insect cells were washed with 5 ml PBS, centrifuged (500xg, Rt, 5 min),
preswollen in 1 ml buffer C and lysed by homogenization for 10 min on ice. One ml of 2x buffer N
was added to reach a final concentration of 1x buffer N and centrifuged (29 700xg, 4°C, 10 min). The

Methods 28
pellet (“crude membrane” fraction) obtained after centrifugation was resuspended in 500 µl 1x buffer
N. The supernatant was also collected (“soluble protein” fraction).
Measurement of protein concentration (3.8.1) was performed with all fractions obtained except of the
“culture medium” fraction and 30 µg of protein were precipitated with 1 ml methanol (3.8.2) before
SDS-PAGE.
3.4 Expression of Avr1b in E. coli cells 3.4.1 Growth conditions
Glycerol cultures of BL21(DE3)pET26b and BL21(DE3)pET26b-Avr1b were thawed at Rt and
transferred to LB agar plates containing 30 µg/ml kanamicin with a sterile tip and incubated overnight
at 37°C. The procedure described below was performed for each of the two cultures: the next day
5 ml LB medium containing 30 µg/ml kanamicin were inoculated with a single colony from the LB
agar plate and incubated overnight at 37°C in a rotary shaker (180 rpm). The next day 49 ml LB
medium containing 30 µg/ml kanamicin were added to 1 ml of the overnight culture and incubated for
60-90 min at 37°C (180 rpm). After incubation the OD600 was determined by diluting 200 µl of the
culture with 800 µl LB medium (OD600 should be in the range between 0,5 and 1,0). A 1 ml aliquot
was stored (-80°C) for further SDS-PAGE (“non-induced control”). For induction, IPTG was added to
the culture to a final concentration of 1 mM. The culture was incubated for 2 h at 37°C (180 rpm).
After induction and just prior to harvest another 1 ml aliquot was stored (-80°C) for further SDS-
PAGE (“induced control”). The OD600 was determined by diluting 100 µl of the culture with 900 µl of
LB medium (OD600 should be in the range between 0,8 and 1,0). Cells with an OD600 of 1,0 from the
non induced and the induced control were centrifuged (5 000xg, Rt, 30 sec) and the pellets stored at
-80°C. Prior to electrophoresis, the pellets were thawed and resuspended in 40 µl 1x SDS loading
buffer (2.13). 10 µl were applied to SDS-PAGE.
3.4.2 Harvest After induction with IPTG (3.4.1), the rest of the two cultures was centrifuged (2 500xg, 4°C, 5 min)
and the pellets resuspended in 5 ml sonication buffer (2.13). Sonication on ice took place 2 times for
5 min, at 32 watt and 50% duty. Subsequently the cultures were centrifuged (15 500xg, 4°C, 10 min)
and the pellets stored at -20°C for further SDS-PAGE. The pellet from the BL21(DE3)pET26b-Avr1b
culture was also used for further Avr1b purification under denaturing conditions or for protein
refolding as described below.
For SDS-PAGE the pellets were resuspended in 5 ml of a solution containing 100 mM Tris and
10 mM EDTA and kept in 100, 500 and 1 000 µl aliquots. One of the 100 µl aliquot from each culture
was centrifuged (10 000xg, 4°C, 5 min), the pellet resuspended in 100 µl water and the protein
concentration measured, 20 µg of protein was used for SDS-PAGE.
For purification of Avr1b under denaturing conditions, the pellet was resuspended in 4 ml buffer A
(2.13), centrifuged (29 700xg, 4°C, 15 min) and the supernatant (4 ml lysate) was further used

Methods 29
(3.5.1). For purification of Avr1b after refolding, the pellet was resuspended in 8 ml buffer X (2.13). In
case of large scale procedure, 40 ml of lysate were used (3.5.2).
3.5 Purification of Avr1b
Protein purification was performed according to the Qiagen protocol.
3.5.1 Protein purification under denaturing conditions by batch chromatography A suspension (0,8 ml) of 50% Ni-NTA agarose beads in 30% ethanol was slowly poured into a 12 ml
column. When the agarose matrix was settled (0,4 ml bed volume) the column was equilibrated with
2x10 ml of distilled water and then with 2x4 ml of buffer A (2.13). The lysate (4 ml) (3.4.2) was
applied on the column and the flow through collected. Afterwards 2x4 ml of wash buffer (2.13) were
added and the flow through collected (fractions W1 and W2). Bound proteins were eluted first by
addition of 4x0,5 ml elution buffer I (2.13) (elution samples EI1, EI2, EI3, EI4 were collected) and
second with 4x0,5 ml elution buffer II (2.13) (elution samples EII1, EII2, EII3, EII4 were collected).
5 µl of 3x SDS loading buffer were added to 15 µl of each sample. Samples were heated for 5 min at
100°C and loaded on a gel for SDS-PAGE. The rest of the elution fractions EI2, EI3 and EI4 were
combined and dialyzed against dialysis buffer (2.13) (4x1 h followed by 1x16 h) before being used in
a biotest.
3.5.2 Protein refolding by FPLC A suspension (6 ml) of 50% Ni-NTA superflow resin in 30% ethanol was slowly poured into a C10
column avoiding air bubbles. When the resin was settled (3 ml bed volume), the top adapter was
inserted and adjusted to the top of the bed. The column was adapted to the FPLC system and
equilibrated with 5 bed volumes of buffer 1B (15 ml; 2.13) at a flow rate of 0,5 ml/min. The lysate
(40 ml; 3.4.2) was injected in a loop leading to the Ni-NTA column and the flow through collected
(sample “0”). For protein refolding a linear 7-1 M urea gradient in buffer 1A (2.13) was used. The
renaturation was performed over a period of 90 min. Two 22,5 ml samples were collected sample “I”
(0-45 min) and sample “II” (45-90 min), respectively. After renaturation the column was equilibrated
with 15 ml equilibration buffer and a 15 ml fraction was collected (sample “III”). In order to elute the
protein a three step imidazole gradient was performed with buffers 2A and 2B over a period of 40
minutes (table 1) and twenty 1 ml fractions were collected (E1-E20). After the imidazole gradient, the
column was equilibrated with buffer 2B during 40 min and the last 20 ml fraction was collected
(fraction “IV”). Each sample (400 µl) was precipitated with 1,6 ml methanol (3.8.2) before SDS-
PAGE. The rest of the samples were used for measurement of protein concentration (3.8.1).
Fractions with protein concentrations of more than 20 µg/ml were combined and either stored in 5%
glycerol at -80°C for further production of anti-Avr1b-antiserum or used immediately for biotests.
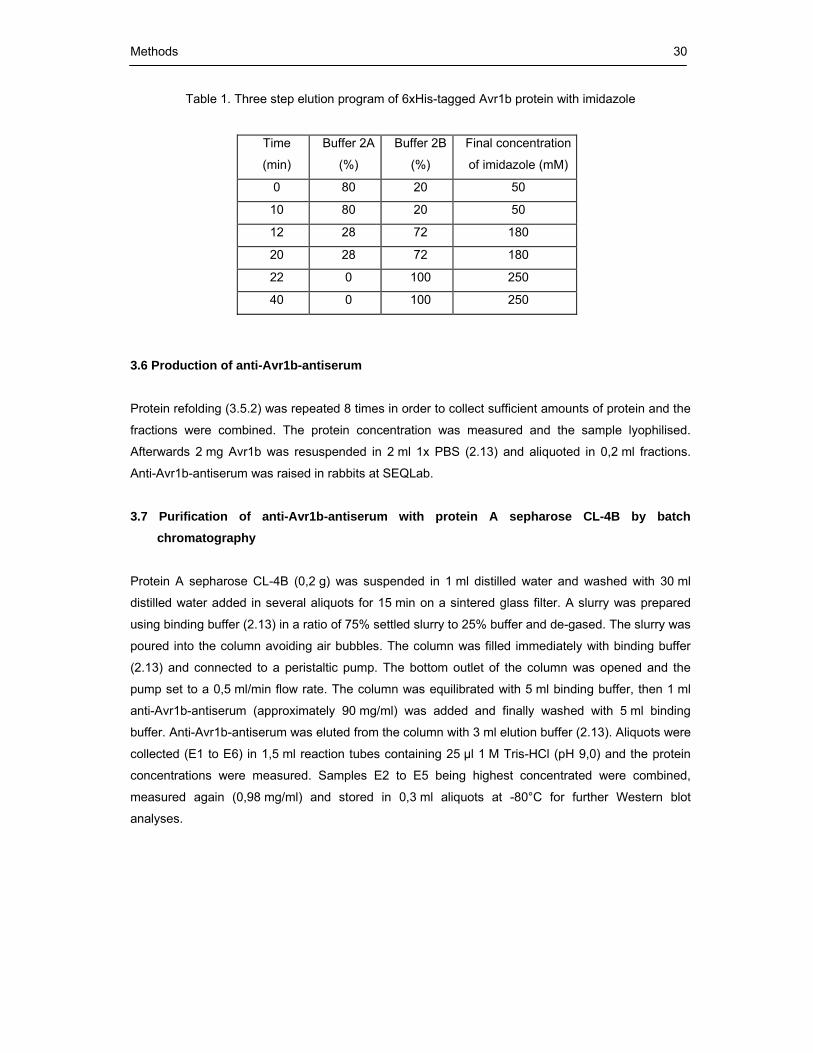
Methods 30
Table 1. Three step elution program of 6xHis-tagged Avr1b protein with imidazole
Time
(min)
Buffer 2A
(%)
Buffer 2B
(%)
Final concentration
of imidazole (mM)
0 80 20 50
10 80 20 50
12 28 72 180
20 28 72 180
22 0 100 250
40 0 100 250
3.6 Production of anti-Avr1b-antiserum Protein refolding (3.5.2) was repeated 8 times in order to collect sufficient amounts of protein and the
fractions were combined. The protein concentration was measured and the sample lyophilised.
Afterwards 2 mg Avr1b was resuspended in 2 ml 1x PBS (2.13) and aliquoted in 0,2 ml fractions.
Anti-Avr1b-antiserum was raised in rabbits at SEQLab.
3.7 Purification of anti-Avr1b-antiserum with protein A sepharose CL-4B by batch chromatography
Protein A sepharose CL-4B (0,2 g) was suspended in 1 ml distilled water and washed with 30 ml
distilled water added in several aliquots for 15 min on a sintered glass filter. A slurry was prepared
using binding buffer (2.13) in a ratio of 75% settled slurry to 25% buffer and de-gased. The slurry was
poured into the column avoiding air bubbles. The column was filled immediately with binding buffer
(2.13) and connected to a peristaltic pump. The bottom outlet of the column was opened and the
pump set to a 0,5 ml/min flow rate. The column was equilibrated with 5 ml binding buffer, then 1 ml
anti-Avr1b-antiserum (approximately 90 mg/ml) was added and finally washed with 5 ml binding
buffer. Anti-Avr1b-antiserum was eluted from the column with 3 ml elution buffer (2.13). Aliquots were
collected (E1 to E6) in 1,5 ml reaction tubes containing 25 µl 1 M Tris-HCl (pH 9,0) and the protein
concentrations were measured. Samples E2 to E5 being highest concentrated were combined,
measured again (0,98 mg/ml) and stored in 0,3 ml aliquots at -80°C for further Western blot
analyses.
Methods 31
3.8 Basic methods for protein biochemistry 3.8.1 Protein estimation Protein concentration was determined with the method described by Bradford (1976) using the
BioRad protein assay reagent. Five µl of each sample were diluted with 795 µl distilled water and
200 µl of the reagent, mixed and the absorbance was measured at 595 nm after 5 min incubation.
3.8.2 Protein precipitation Samples were either incubated overnight with 3 volumes of cold methanol at -80°C or for 1 h on ice
with 1/10 vol 100% TCA (final concentration of TCA 10%). Methanol-precipitated proteins were
centrifuged (29 000xg, 4°C, 15 min) and the pellets resuspended in 20 µl 1x SDS loading buffer
(2.13). TCA-precipitated proteins were also centrifuged (14 000xg, 4°C, 10 min), the pellets were
washed two times with 100 µl acetone each (14 000xg, 4°C, 5 min), dried for 30 min in a speed vac
and resuspended in 20 µl 1x SDS loading buffer (2.13).
3.8.3 SDS-PAGE For protein separation by SDS-PAGE, the method of Laemmli (1970) was used. Gels were poured to
a size of 7x11 cm and 1 mm thickness in a BioRad minigel apparatus. Samples dissolved in 1x SDS
loading buffer were incubated for 5 min at 100°C, centrifuged for 1 min at Rt and then loaded with a
Hamilton syringe in the gel slots. SDS-PAGE was performed at 30 mA/gel (Rt). Commercially
available mixtures of protein molecular markers were used as reference.
3.8.4 Silver staining After SDS-PAGE, some gels were incubated in fixative solution (2.13) for at least 1 h, washed
2x20 min in wash solution (2.13) and 1x20 min in deionised water. Then the gels were incubated with
thiosulfate reagent (2.13) for 1 min and washed 3x20 sec with deionised water. Subsequently they
were incubated with silver nitrate reagent (2.13) for 20 min and washed 3x20 sec with deionised
water. Gels were developed by incubation for 3x10 min with developing solution (2.13). The reaction
was stopped by incubation with stop reagent for 5 min and 3x10 min with deionised water. Finally
gels were dried between cellulose-acetate sheets and stored at Rt.
3.8.5 Coomassie staining After SDS-PAGE, some gels were soaked in Coomassie solution (2.13) for 2 h at Rt and destained
with destaining solution (2.13) until the background disappeared. After washing with distilled water,
the gels were dried between cellulose-acetate sheets and stored at Rt.

Methods 32
3.8.6 Semi-dry Western blotting For Western blot analysis, proteins were transferred after SDS-PAGE to a nitrocellulose membrane
(40 mA/membrane; 90 min). 11 layers of gel-blotting paper were cut (8,5 cm x 5,5 cm) and 4 of them
soaked with anode buffer I (2.13), 3 of them with anode buffer II (2.13) and 4 of them with cathode
buffer (2.13). The nitrocellulose membrane was soaked with anode buffer II. The order of the gel-
blotting layers, the membrane and the gel is shown in Fig. 4.
Fig. 4 Schematic drawing of the order of the different layers for Western blotting.
After the protein transfer, the membrane was soaked with Ponceau S solution by gentle agitation for
2 min and then washed with water until bands appeared.
3.8.7 Detection with anti-Avr1b-antiserum The Western blot membrane was incubated 3 times for 20 min at Rt in G-Net (2.13) and was then
incubated overnight at 4°C with a dilution of anti-Avr1b-antiserum (1/750 to 1/20 000) in G-Net.
Following the antibody treatment (13 h), the membrane was washed in TBS-Tween buffer (2.13) for
10 min, and 2 times in TBS buffer (2.13) for 10 min at Rt. Afterwards the membrane was incubated
for 1 h at Rt in a 1/20 000 dilution of the second antibody (anti-rabbit IgG alkaline phosphatase
conjugate; 2.1) in G-Net. The membrane was washed for 10 min in TBS-Tween buffer (2.13) and
then 2 times for 10 min in TBS buffer at Rt. Finally the membrane was stained with 10 ml AP buffer
(2.13) until bands appeared. The reaction was stopped by rinsing the membrane in water twice.
3.8.8 Protein analysis by mass spectrometry Protein analysis by mass spectrometry was performed in the groups of Prof. Dr. Lutz Eichacker
(Botanical Institute, LMU Munich) and Prof. Dr. Dieter Oesterhelt (Max-Planck Institute, Martiensried),
respectively.

Methods 33
In the first case, recombinant Avr1b obtained from a soluble protein fraction of Sf9 insect cells
(300 µg) was precipitated with 1 ml cold methanol (3.8.2) prior to SDS-PAGE. After electrophoresis
the band corresponding to Avr1b (15,8 kDA) was excised with a scalpel, stored in a 1,5 ml reaction
tube and used for identification by MS/MS on an ESI-Q-TOF instrument.
In the second case, an apoplastic fluid preparation (around 250 µg) obtained from soybean cv.
Harosoy seedlings infected with P. sojae race 1 zoospores was immunoprecipitated followed by
SDS-PAGE. After electrophoresis two bands were excised with a scalpel under sterile conditions,
one around 17 kDa and an adjacent one at 24 kDa. The bands were stored in 1,5 ml reaction tubes
and used for identification by LC-MS/MS on an ESI-Q-TOF instrument.
3.8.9 Immunoprecipitation with protein A sepharose CL-4B 3.8.9.1 Immunoprecipitation of urea-denatured proteins Soluble protein preparations (10 µg) were denatured with 10 µl denaturing buffer (2.13) and
precipitated with 1 ml cold methanol (3.8.2) overnight. Samples were centrifuged (14 000xg, 4°C, 15
min) and the pellet resuspended in 300 µl extraction buffer I. Following the addition of 5 µl anti-Avr1b-
antiserum, the samples were incubated at least 12 h at 4°C by end-over-end mixing. A suspension of
protein A sepharose (PAS) (50 µl) was added and samples were incubated for 2 h at Rt by end-over-
end mixing. The beads were pelleted (16 100xg, Rt, 2 min) and resuspended in 1x SDS loading
buffer (2.13) containing 50 mM DTT before SDS-PAGE. The supernatants were collected and
precipitated with 1 ml cold methanol (3.8.2) before SDS-PAGE.
As positive control 10 µg soluble proteins from infected insect cells were denatured with 10 µl
denaturing buffer and precipitated overnight with 1 ml cold methanol (3.8.2). Sample was centrifuged
(14 000xg, 4°C, 15 min) and resuspended in 1x SDS loading buffer before SDS-PAGE.
3.8.9.2 Immunoprecipitation of SDS-denatured proteins Protein fractions were diluted in extraction buffer I (2.13) and denatured by adding SDS to a final
concentration of 1% and boiling in a water bath (100°C) for 4 min. Four volumes of ice-cold dilution
buffer I (2.13) and anti-Avr1b-antiserum (5 µl in the case of recombinant proteins or 50 µl in the case
of protein fractions from infected soybean plants) were added. Samples were incubated at least 12 h
at 4°C by end-over-end mixing. A suspension of PAS (2.13) (50 µl in the case of recombinant
proteins or 300 µl in the case of protein fractions from infected soybean plants) was added and the
samples were incubated for 2 h at Rt by end-over-end mixing. The beads were collected (16 100xg,
Rt, 2 min) and resuspended in 1x SDS loading buffer (2.13) containing 50 mM DTT before SDS-
PAGE. The supernatant of the recombinant protein fraction was collected and precipitated with 1 ml
cold methanol (3.8.2) before SDS-PAGE.
As positive controls recombinant proteins were either diluted in extraction buffer I (2.13), denatured
by adding SDS to a final concentration of 1% and boiled in a water bath (100°C) for 4 min before

Methods 34
dilution in 5x SDS loading buffer for SDS-PAGE, or diluted directly in 5x SDS loading buffer for SDS-
PAGE.
3.9 Methods in molecular biology 3.9.1 Agarose gel electrophoresis Agarose (0,8% or 1,2%) in 1x TAE buffer (2.13) was boiled, poured into a mould and allowed to
harden. Upon hardening the agarose formed a matrix with a density determined by the concentration
of agarose. The electrophoresis tank was filled with 1x TAE buffer, the gel mounted on the tank and
1,5 µl ethidium bromide was added to the buffer. DNA samples were mixed with 0,5 µl agarose
loading buffer before electrophoresis (Rt, 30 mA/gel). Commercially available mixtures of DNA
markers were used as reference.
3.9.2 Small scale plasmid preparation (minipreparation)
Alkaline lysis of cells was performed according to Birnboim and Doly (1979). An overnight culture of
transformed E. coli cells (1,0 ml) was centrifuged in 1,5 ml reaction tubes (15 000xg, Rt, 2 min). The
supernatant was discarded and the pellet centrifuged again (15 000xg, Rt, 2 min) to remove the
remaining liquid. The pellet was incubated at -20°C for 10 min, resuspended in 50 µl solution I (2.13)
by whirling and then incubated at Rt for 5 min. Solution II (100 µl) was added to the cells and
incubated at Rt for 5 min. Afterwards 75 µl of solution III (2.13) was added, mixed immediately and
incubated for 5 min on ice. The insoluble material (cell walls, genomic DNA, protein) was precipitated
by centrifugation (29 000xg, 15°C, 3 min) and the supernatant (approximately 200 µl) transferred to a
new reaction tube and extracted with 200 µl phenol/chloroform/ isoamylalcohol (25:24:1; v:v:v). After
brief whirling and centrifugation (15 000xg, Rt, 5 min), the supernatant was again transferred to a
new reaction tube, 500 µl ethanol added, incubated at Rt for 10 min and centrifuged (29 000xg, 15°C,
5 min). Plasmid-DNA was colleted in this step. The pellet was then washed with 200 µl 75% ethanol,
dried and dissolved in 50 µl TE buffer. The plasmid-DNA was stored at -20°C.
3.9.3 DNA purification from agarose gels DNA extraction was performed using the MinElute Gel Extraction or the NucleoSpin Extract II kit
according to manufacturer instructions.
3.9.4 DNA restriction assay For DNA restriction of DNA-plasmids and PCR fragments, 10 µl of solution contained approximately
1 unit restriction enzyme/µg DNA, incubation buffer and a variable amount of DNA. In the case of a
plasmid-minipreparation DNA was treated with 0,5 µl RNase A. The restriction assay was monitored
by agarose gel electrophoresis.
Methods 35
3.9.5 DNA precipitation For preparative purposes, restricted DNA was precipitated by one of the following methods:
3.9.5.1 DNA precipitation by sodium acetate and ethanol
DNA was mixed with 1/10 vol 3 M sodium acetate (pH 5,2) and 3 vol ethanol. Samples were mixed,
incubated at -80°C for 30 min, centrifuged (29 700xg, 4°C, 5 min) and washed with 75% ethanol
(29 700xg, 4°C, 2 min). The pellets were dried at 37°C and redissolved in 30 µl TE buffer (2.13).
3.9.5.2 DNA precipitation by sodium acetate and isopropanol
The DNA solution (100 µl) was incubated at 37°C overnight. Phenol/chloroform (100 µl; 50:50; v:v)
was added and centrifuged (15 400xg, Rt, 5 min). Sodium acetate (3 M; 11 µl) and 58 µl of
isopropanol were added, mixed, incubated for 30 min at Rt, centrifuged (16 100xg, Rt, 10 min) and
washed with 75% ethanol (29 700xg, 4°C, 2 min). The pellet was dried at 37°C and redissolved in
15 µl distilled, sterile water.
3.9.6 Polymerase chain reaction (PCR) PCR was used in order to amplify DNA from different sources. Plasmid DNA, cDNA or DNA from
bacterial colonies, picked directly from agar plates, have been used as templates for the reaction.
The oligonucleotides used for PCR were commercially available and provided lyophilized. They were
dissolved in water to 1 nmol/µl. From this stock solution 50 pmol/µl working solutions were prepared.
PCR solutions (2.13) (10 µl) were used for each PCR.
3.9.7 Colony PCR Colony PCR was used to detect the presence of a recombinant vector with the desired insert after
ligation and transformation. A bacterial colony from an agar plate was slightly touched with a sterile
pipette tip and transferred into a 200 µl PCR tube by touching the bottom with the tip. “Colony PCR
solution” (8 µl) was added to each tube.
3.9.8 DNase treatment of RNA RNA (10-20 µg) was incubated in DNAse treatment solution (total volume 400 µl) at 37°C for 30 min.
RNA was extracted two times with 400 µl phenol/chloroform/ isoamylalcohol (25:24:1; v:v:v) and one
time with 400 µl chloroform. After centrifugation (23 000xg, 4°C, 10 min) RNA was precipitated
overnight with 1 ml ethanol and 40 µl sodium acetate at -20°C, collected again (29 000xg, 4°C,
25 min) and washed with 70% ethanol (29 000xg, 4°C, 20 min). The pellet was resuspended in 15 µl
sterile water.

Methods 36
3.9.9 Reverse transcription-polymerase chain reaction (RT-PCR) RT-PCR was used to monitor gene expression in P. sojae and in infected and uninfected soybean
plants. DNase-treated RNA (2 µg) was diluted with sterile water to a final volume of 8,6 µl and heated
at 65°C for 5 min and then at 90°C for 3 min for denaturation. The RT was performed with the
denaturated RNA in RT-PCR solution I (total volume 20 µl) under the following conditions: 25°C for
15 min; 37°C for 90 min; 90°C for 5 min. RT reaction (2 µl) was used for PCR in RT-PCR solution II
(total volume 10 µl).
3.9.10 A-tailing procedure
Thermostable DNA polymerases with proofreading activity such as the Pfu-DNA polymerase
generate blunt-end fragments during PCR amplification. The ends of the PCR fragments were
modified by the A-tailing procedure and the fragments ligated into a pGEM-T easy vector. Using this
method only a single insert was expected to be ligated into the vector as opposed to multiple
insertions that can occur with blunt-ended cloning.
For A-tailing, 2 µl purified DNA were incubated in A-tailing solution (final volume 5 µl) for 30 min at
70°C.
3.9.11 Ligation of DNA fragments For ligation a T4-DNA ligase from MBI Fermentas was used and the ligation reaction performed
according to manufacturer instructions. Usually 25 ng of vector DNA were ligated to an adequate
amount of insert which was calculated using the following formula:
ng of vector x kb size of insert x insert:vector molar ratio = ng of insert
kb size of vector
The ligation was performed in a final volume of 5 µl ligation solution (2.13) incubated overnight at
4°C.
3.9.12 DNA purification and sequencing After minipreparation (3.9.2) DNA was purified before sequencing. RNase (1 µl) was added to 20 µl
plasmid DNA and incubated 1 h at 37°C. A solution of 0,5 M EDTA (0,5 µl) and 30 µl sterile water
were added and extraction of DNA was performed with phenol/chloroform/isoamylalcohol (25:24:1,
v:v:v). After centrifugation (16 100xg, Rt, 15 min), the upper phase containing the DNA was mixed
with 5,5 µl 3 M sodium acetate and 30 µl isopropanol and incubated 30 min at Rt. DNA was
precipitated by centrifugation (16 100xg, Rt, 15 min), washed with 75% ethanol (16 100xg, Rt, 5 min)
and resuspended in 10 µl water. For DNA sequencing, performed in the group of Prof. Dr. Herrmann

Methods 37
(Botanical Institute, LMU Munich), 500 ng DNA and 5 pmol sequencing primer were added to 8 µl
distilled water.
3.9.13 Transformation of E. coli DH5α cells
Electroporation-competent E. coli DH5α cells (laboratory collection) were thawed on ice. DNA (50 ng)
was added to 40 µl of cells, placed on an electroporation cuvette and transformed with an electrical
impulse in the BioRad Gene Pulser at 2,5 KV, 25 µF, and 200 Ω. Immediately after the
electroporation, 460 µl SOC+++ medium (42°C) were added, mixed and the cells transferred to a
1,5 ml reaction tube and incubated 1 h at 37°C and 180 rpm. The mixture was placed on LB agar
plates supplemented with 100 µg/ml ampicilin. Plates were incubated overnight at 37°C.
3.9.14 Transformation of XL10-Gold ultracompetent E. coli cells E. coli XL10-Gold ultracompetent cells (Stratagene) were thawed on ice and then mixed gently by
hand. Cell aliquots (40 µl) were placed onto precooled 15 ml falcon tubes. β-Mercaptoethanol (1,6 µl)
was added to the cells, gently mixed and incubated on ice for 10 min, swirling them every 2 min.
DNA (1 µl) was added to each falcon tube and swirled gently, incubated on ice for 30 min, heat-
pulsed for 30 sec in a 42°C water bath and then incubated on ice for 2 min. SOC+++ Medium (460 µl)
(42°C) was added to each sample and incubated for 1 h at 37°C and 250 rpm. The transformed cells
(25 µl) were plated on LB agar plates supplemented with 100 µg/ml ampicilin. Plates were incubated
overnight at 37°C.
3.9.15 Transposition of a recombinant donor plasmid into DH10Bac E. coli cells E. coli DH10Bac cells (Invitrogene) were thawed on ice. An aliquot of 50 µl cells was dispensed into
a precooled 15 ml polypropylene tube. The recombinant donor plasmid (1 µl) was added and mixed
by tapping the side of the tube. The mixture was incubated for 30 min at 30°C, heat-shocked in a
42°C water bath for 45 sec, and cooled on ice for 2 min. SOC+++ Medium (450 µl) was added and the
mixture shaken for 4 h in an incubator at 37°C and 180 rpm. The cells were serially diluted using
SOC+++ medium to 10-1 and 10-2 and 200 µl of each dilution were placed on LB agar plates containing
50 µg/ml kanamicin, 7 µg/ml gentamicin, 10 µg/ml tetracycline, 100 µg/ml X-gal and 40 µg/ml IPTG.
Plates were incubated for at least 24 h at 37°C.
3.9.16 Isolation of recombinant bacmid DNA (minipreparation of bacmid DNA) Four white E. coli DH10Bac colonies containing recombinant bacmid DNA were selected from agar
plates for isolation of the bacmid DNA and plated on new agar plates for verifying their coloration by
incubating overnight at 37°C. One single colony showing a white phenotype on plates containing X-
gal and IPTG was inoculated into 2 ml LB medium supplemented with 50 µg/ml kanamicin, 7 µg/ml
gentamicin and 10 µg/ml tetracycline, and after incubation overnight, 1,5 ml of the culture was

Methods 38
centrifuged (15 000xg, Rt, 1 min). The supernatant was discarded and the pellet resuspended in
0,3 ml solution IV (2.13) by pipetting up and down. Solution II (2.13) (0,3 ml) was added and mixed
gently. The mixture was incubated at Rt for 5 min and 0,3 ml of solution III (2.13) were added slowly.
A thick, white precipitate of E. coli genomic DNA and protein was formed. The sample was placed on
ice for 10 min and then centrifuged (15 000xg, Rt, 10 min). The supernatant was transferred to
another tube containing 0,8 ml isopropanol, mixed by inverting the tube a few times and placed on
ice for 10 min. The sample was centrifuged (15 000xg, Rt, 15 min), the supernatant removed and the
pellet washed with 0,5 ml 75% ethanol, centrifuged (15 000xg, Rt, 5 min), dried for 10 min at RT and
dissolved in 40 µl TE buffer (2.13). The DNA was stored at -20°C.
3.10 Subcellular fractionation of P. sojae mycelium Three week-old P. sojae mycelium grown in Erwin synthetic medium (2.13) was used for subcellular
fractionation. After adding 69,7 g ammonium sulfate to 100 ml medium, precipitated proteins were
collected by centrifugation (23 000xg, 30 min, 4°C). The pellet was redissolved in 2 ml lysis buffer
(2.13) and dialyzed against a buffer containing 25 mM Tris-HCl (pH 7,5) and 1 mM EDTA (2x1 h
followed by 1x16 h, 4°C) to obtain a “culture medium” fraction.
In parallel, mycelium was placed on a flat surface, washed with cold tap water and finally with
distilled water in order to remove agar and calcium carbonate. The mycelium was collected on a
300 µm nylon mesh, washed again with distilled water and either frozen and stored at -80°C or
processed immediately. Mycelium (40 g) was homogenized in 120 ml grinding buffer (2.13) in a
mortar. The homogenate was filtered through a 300 µm nylon mesh and centrifuged (2 000xg, 4°C,
15 min) to obtain a pellet and a supernatant. The pellet containing cellular fragments and nuclei was
resuspended in 3 ml AB buffer (2.13) (“cell debris” fraction) and the supernatant centrifuged again
(10 000xg, 4°C, 10 min). This pellet containing mitochondria and peroxisomes was also resuspended
in 2 ml AB buffer (“mitochondria” fraction) and the supernatant was centrifuged (100 000xg, 4°C,
3 h). This time the pellet containing microsomes and endoplasmic reticulum was resuspended 1 ml
AB buffer (“microsomal” fraction). The supernatant containing soluble proteins (“soluble protein”
fraction) was also collected. Protein concentration (3.8.1) was measured in all fractions and 50 µg of
protein were precipitated with 1 ml methanol (3.8.2) before SDS-PAGE.
3.11 Hypocotyl assay
The hypocotyl assay was performed according to Albersheim and Valent (1978). Twelve day-old
soybean plants were removed from the vermiculite and rinsed in tap water. The plants were mounted
on horizontal glass rods by piercing the hypocotyls 5 mm below the cotyledons. Two plants were
mounted on each glass rod and the plants were suspended with their roots in water. A small piece of
a 3 week-old P. sojae mycelium was placed in a vertical slit wound of about 1 cm length. Control
plants were also wounded but not inoculated with mycelium. After incubation in a closed chamber for
5 days at 26°C and 100% humidity, the plants were removed from the glass rods and a 2 cm

Methods 39
Up (1cm)
Ring (1 cm)
Tip
segment from the wounded hypocotyl area was excised from each plant, frozen in liquid nitrogen,
and stored at -80°C for further RNA extraction.
3.12 Zoospore infection assay
Lima bean agar plates (20x10 ml) containing 12 day-old P. sojae mycelium were washed 8 times
with 30 ml distilled, autoclaved water for 30 min. Each plate was covered with 10 ml distilled,
autoclaved water and incubated overnight at 18°C in the darkness. The next day the water solutions
containing the P. sojae zoospores were collected in a total of ten 50 ml falcon tubes and centrifuged
(2 000xg, Rt, 10 min). The upper 16 ml of each tube were discarded and the pelleted zoospores
resuspended in the remaining 4 ml. The resuspended zoospores were combined (40 ml in total) and
counted with a microscope. The concentration was around 30 000 zoospores/ml. Groups of 15
unwounded, 3 day-old soybean seedlings of cultivars Harosoy, Harosoy 1372 or Williams L77-1863
were dip-inoculated with a zoospore suspension of P. sojae containing approximately 10 000
zoospores per seedling as described by Hahn et al. (1985). Unwounded, 3 day-old, uninfected
seedlings were placed in distilled water and used as control. Following incubation for different
periods of time in the darkness (26°C;100% humidity), root segments were excised 1 cm above
(“up”), 1 cm around the infection site (“ring”) and from the root tip (“tip”) as shown in Fig. 5. Root
segments were frozen in liquid nitrogen and stored at -80°C.
Fig. 5 Picture of an infected soybean seedling. “Up” area, “ring” area, and “tip” are indicated.
3.13 Subcellular fractionation of infected soybean seedlings Subcellular fractionation of infected soybean seedlings was performed according to De Wit and
Spikman (1982). Unwounded, 16x 3 day-old soybean seedlings of the cultivars Harosoy and Williams
L77-1863 were dip-inoculated with zoospores of P. sojae race 1 (Avr1b). Unwounded, 3 day-old,
uninfected seedlings were placed in distilled water and used as control. Root segments from
uninfected plants (0 h) and infected plants (24 and 48 h after infection) were excised from the ring at
the water-air interface.
Methods 40
Altogether 16 root segments were immersed in 800 µl 10 mM NaPO4 and the apoplastic fluid was
extracted under vacuum (Rt; 90 min) followed by centrifugation (10 000xg, Rt, 15 min). The
supernatant was collected (“apoplastic fluid” fraction) and the roots were homogenized on a pre-
cooled mortar containing 1 ml extraction buffer II (2.13) and centrifuged (4 000xg, Rt, 20 min). The
pellet was discarded and the supernatant centrifuged again (26 000xg, Rt, 30 min). This time the
pellet was resuspended in 400 µl extraction buffer II (“microsomal” fraction) and also collected like
the supernatant (“soluble protein” fraction).
3.14 RNA isolation 3.14.1 RNA isolation from P. sojae mycelium Mycelium (2 to 6 week-old) was placed on a flat surface and washed with tap water and finally with
distilled water in order to get rid of agar and calcium carbonate. The mycelium was collected on a
300 µm nylon mesh, weighted and cut into pieces.
Total RNA was isolated according to the method of Chang et al. (1993) with minor modifications.
Mycelium (3 g) was ground with liquid nitrogen, added to 12 ml of pre-warmed RNA extraction buffer
(65°C; 2.13) and mixed by inverting the falcon tube. The mixture was extracted two times with 12 ml
chloroform/isoamyl alcohol (24:1; v:v) and separation of the phases was achieved by centrifugation
(5 000xg, 20°C, 30 min). The aqueous phase was collected in Corex tubes, and the RNA precipitated
by adding one third vol 8 M LiCl and incubated overnight at 4°C. After centrifugation (10 000xg, 4°C,
20 min) the pellet was dissolved in 500 µl of SSTE (2.13) and extracted one more time with
chloroform/isoamyl alcohol (24:1; v:v). RNA was precipitated by adding two volumes of ethanol and
incubated for 1 h at -80°C. After centrifugation (28 000xg, 4°C, 20 min), the pellet was dried and
resuspended in 50-150 µl DEPC-water (2.13).
3.14.2 RNA isolation from P. sojae zoospores A 20 ml zoospore suspension (30 000 zoospores/ml) was centrifuged (2 000xg, 4°C, 10 min), the
supernatant was discarded and the pellet homogenized on ice with 1 ml trifast-reagent. The
homogenized sample was incubated for 5 min at Rt to permit complete dissociation of nucleoprotein
complexes. Chloroform (0,2 ml) was added and shaken vigorously for 15 sec before incubation for
2 min at Rt. After centrifugation (11 000xg, 4°C, 15 min), the mixture separated into a lower red,
phenol-chloroform phase, an interphase and a colourless upper aqueous phase. RNA remained
exclusively in the aqueous phase and was transferred to a fresh tube, mixed with 500 µl isopropanol
and incubated for 10 min at Rt for RNA precipitation. The sample was centrifuged (11 000xg, 4°C, 10
min) and the pellet washed with 1 ml 70% ethanol (5 800xg, 4°C, 5 min). Finally the pellet was dried
5 min at Rt and dissolved in 30 µl sterile water. RNA was quantified and treated with DNase before
RT-PCR. The experiment was performed twice.
Methods 41
3.14.3 RNA isolation from soybean plants RNA was isolated from 0,1 mg soybean seedlings using the RNeasy Plant Mini Kit from Qiagen.
After extraction, RNA was resuspended in 100 µl of sterile water.
3.15 Determination of glyceollin in soybean roots Unwounded, 3 day-old soybean seedlings were incubated in 300 µl of a testing solution (e.g. protein
preparations containing Avr1b or raw elicitor) and 10 mg/ml gentamicin in 1,5 ml reaction tubes. The
reaction tubes were placed into a plastic box at 100% humidity and incubated for 22 h in the dark at
26°C. Root segments close to the infection site (“ring”) were excised, weighted, frozen in liquid
nitrogen, placed in a pre-cooled mortar with about 1 g sand and mixed by adding liquid nitrogen to
obtain a crude homogenate. The crude homogenate was centrifuged (200xg, 4°C, 5 min), and the
supernatant placed into a potter, homogenized with methanol (5 ml per gram of fresh weight), and
centrifuged (200xg, 4°C, 5 min). The supernatant was evaporated and the residue dissolved in 400 µl
methanol. The sample was filtered through Millex-HV filter before analysis by high performance liquid
chromatography (HPLC). The HPLC system was equipped with a C18 reversed phase column.
Elution from the column was accomplished with a gradient shown in table 2. The injection volume
was 20 µl and the flow rate 1 ml/min. Eluting compounds were monitored at 284 nm and the
glyceollins were identified and quantified by using a glyceollin standard.
Table 2. Gradient elution for HPLC analyses
Time (min) %Methanol %Water
0 40 60
2 40 60
12 75 25
15 100 0
17 100 0
18 40 60
20 40 60
Results 42
4 Results
After isolation of the first avirulence gene (Avr1b) from an oomycete (P. sojae), the properties and
functions of the encoded protein needed to be investigated. Therefore it was necessary to establish a
transgenic system for the production of recombinant Avr1b. Since the yeast Pichia pastoris was the
organism of choice of Shan et al. (2004), in this approach the production of recombinant Avr1b was
established in E. coli and in Sf9 insect cells. According to the program “PeptideMass” the proprotein
Avr1b synthesized in Sf9 insect cells has an expected molecular weight of 15 800 or 13 500 after
cleavage of the putative signal peptide. The His6-fusion protein synthesized in E. coli has an
expected molecular weight of 17 500 or 15 300 after cleavage of the putative signal peptide.
4.1 Production of recombinant Avr1b in bacteria
Recombinant proteins synthesized in E. coli cells can be produced in a soluble form, but in many
cases, especially at high expression levels, they aggregate and form insoluble “inclusion bodies“.
These inclusion bodies contain the highly enriched recombinant protein and can be isolated by
solid/liquid separation. The formation of inclusion bodies is influenced by the nature of the protein, by
the host cell and by the expression level resulting from the vector of choice and the growth and
induction conditions. Inclusion bodies limit the utility of standard purification procedures requiring the
protein’s native, soluble form.
Different methods have been published describing the refolding of insoluble proteins (Marston and
Hartley, 1990; Kurucz et al., 1995; Rudolph and Lilie,1996; Mukhopadhyay, 1997). Most protocols
describe the isolation of inclusion bodies by centrifugation followed by solubilization under denaturing
conditions. The protein is then dialyzed or diluted into a non-denaturing buffer where refolding
occurs. Because every protein possesses unique folding properties, the optimal refolding protocol for
any given protein must be empirically determined.
4.1.1 Synthesis of Avr1b in E. coli cells In a previous project in our group, D. Becker started the heterologous expression of Avr1b in E. coli
cells (D. Becker, personal communication). An Avr1b full-length clone, inserted into the vector
pTZ18, was obtained from B.M. Tyler (Shan et al., 2004). The gene was amplified by PCR with a
Pfu-DNA-Polymerase. The fragment was digested with the restriction enzymes Bsp68 I and Sal I,
ligated into a pET26b vector and transformed into E. coli XL-10 Gold cells. Avr1b was recovered only
in form of inclusion bodies and purified under denaturing conditions for further biotests.
In this study, E. coli BL21(DE3) containing the pET26b-Avr1b expression plasmid was used. The
plasmid pET26b served as a negative control (3.4). Avr1b was recovered in form of inclusion bodies
(Fig. 6) as shown by D. Becker and subsequently purified both under native and under denaturing
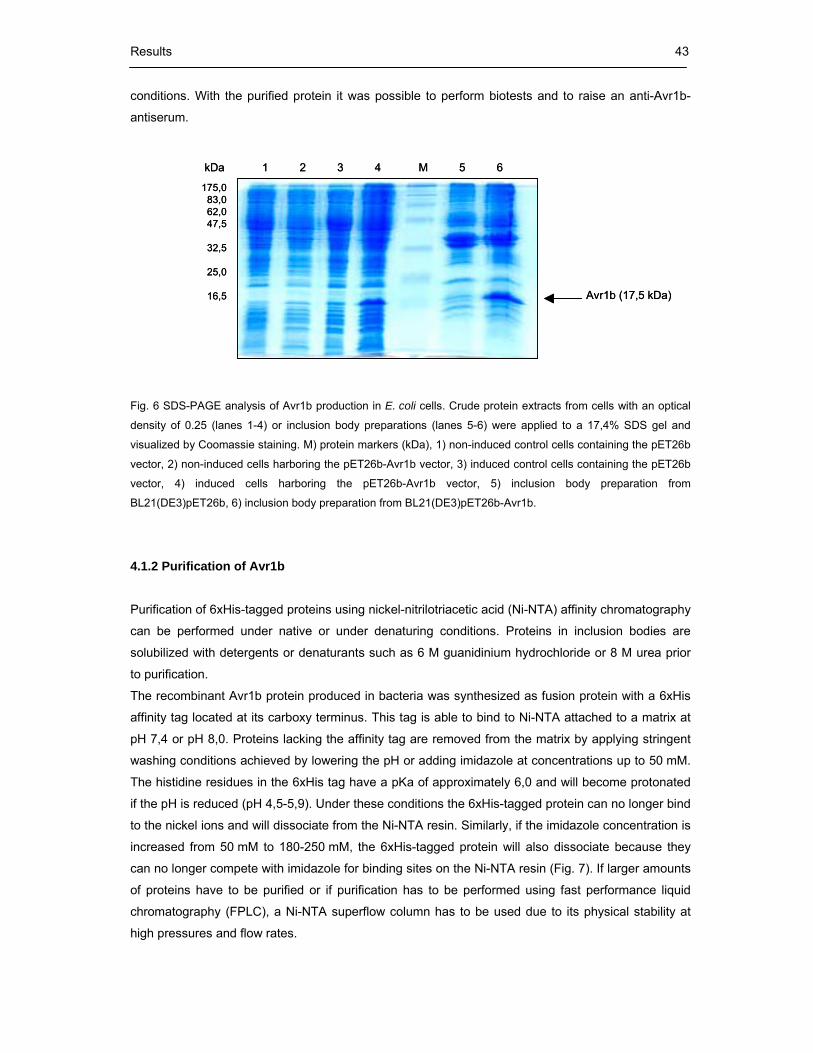
Results 43
kDa 1 2 3 4 M 5 6
175,083,062,047,5
32,5
25,0
16,5 Avr1b (17,5 kDa)
kDa 1 2 3 4 M 5 6
175,083,062,047,5
32,5
25,0
16,5 Avr1b (17,5 kDa)
conditions. With the purified protein it was possible to perform biotests and to raise an anti-Avr1b-
antiserum.
Fig. 6 SDS-PAGE analysis of Avr1b production in E. coli cells. Crude protein extracts from cells with an optical
density of 0.25 (lanes 1-4) or inclusion body preparations (lanes 5-6) were applied to a 17,4% SDS gel and
visualized by Coomassie staining. M) protein markers (kDa), 1) non-induced control cells containing the pET26b
vector, 2) non-induced cells harboring the pET26b-Avr1b vector, 3) induced control cells containing the pET26b
vector, 4) induced cells harboring the pET26b-Avr1b vector, 5) inclusion body preparation from
BL21(DE3)pET26b, 6) inclusion body preparation from BL21(DE3)pET26b-Avr1b.
4.1.2 Purification of Avr1b Purification of 6xHis-tagged proteins using nickel-nitrilotriacetic acid (Ni-NTA) affinity chromatography
can be performed under native or under denaturing conditions. Proteins in inclusion bodies are
solubilized with detergents or denaturants such as 6 M guanidinium hydrochloride or 8 M urea prior
to purification.
The recombinant Avr1b protein produced in bacteria was synthesized as fusion protein with a 6xHis
affinity tag located at its carboxy terminus. This tag is able to bind to Ni-NTA attached to a matrix at
pH 7,4 or pH 8,0. Proteins lacking the affinity tag are removed from the matrix by applying stringent
washing conditions achieved by lowering the pH or adding imidazole at concentrations up to 50 mM.
The histidine residues in the 6xHis tag have a pKa of approximately 6,0 and will become protonated
if the pH is reduced (pH 4,5-5,9). Under these conditions the 6xHis-tagged protein can no longer bind
to the nickel ions and will dissociate from the Ni-NTA resin. Similarly, if the imidazole concentration is
increased from 50 mM to 180-250 mM, the 6xHis-tagged protein will also dissociate because they
can no longer compete with imidazole for binding sites on the Ni-NTA resin (Fig. 7). If larger amounts
of proteins have to be purified or if purification has to be performed using fast performance liquid
chromatography (FPLC), a Ni-NTA superflow column has to be used due to its physical stability at
high pressures and flow rates.

Results 44
Lysis buffer, pH 88M UreaTris buffer pH 7,4
pH 7
pH 5,9pH 4,5
FPLC
Denaturing ConditionsNative Conditions
Batch Chromatography
Pure 6xHis-tagged proteins
180 - 250 mM Imidazole
50 mM Imidazole
Lysis buffer, pH 8,08M UreaTris buffer pH 7,4
pH 7,0
pH 5,9pH 4,5
FPLC
Denaturing ConditionsNative Conditions
Batch Chromatography
Pure 6xHis-tagged proteins
180 - 250 mM Imidazole
Pure 6xHis-tagged proteinsPure 6xHis-tagged proteins
180 - 250 mM Imidazole
e50 mM Imidazole
Lysis buffer, pH 88M UreaTris buffer pH 7,4
pH 7
pH 5,9pH 4,5
FPLC
Denaturing ConditionsNative Conditions
Batch Chromatography
Pure 6xHis-tagged proteins
180 - 250 mM Imidazole
Pure 6xHis-tagged proteinsPure 6xHis-tagged proteins
180 - 250 mM Imidazole
50 mM Imidazole
Lysis buffer, pH 8,08M UreaTris buffer pH 7,4
pH 7,0
pH 5,9pH 4,5
FPLC
Denaturing ConditionsNative Conditions
Batch Chromatography
Pure 6xHis-tagged proteinsPure 6xHis-tagged proteins
180 - 250 mM Imidazole
Pure 6xHis-tagged proteinsPure 6xHis-tagged proteins
180 - 250 mM Imidazole
e
Pure 6xHis-tagged proteinsPure 6xHis-tagged proteins
180 - 250 mM Imidazole
e50 mM Imidazole
Fig. 7 Purification of 6xHis-tagged proteins under native or denaturing conditions using the QIAexpress System
from Qiagen. Figure taken from the manual “QIA Expressionist” from Qiagen and modified.
4.1.2.1 Protein purification under denaturing conditions Avr1b (6xHis-tagged) was obtained as a recombinant protein (3.4.2) and purified on a 0,4 ml Ni-NTA
agarose matrix (batch purification, 3.5.1).
Lysate (4 ml) was applied to the Ni-NTA column. The His6-fusion epitope from Avr1b was bound to
the Ni-NTA agarose matrix under denaturing conditions (8 M urea) at pH 8,0. By lowering the pH to
7,0 unspecifically bound proteins were washed out of the matrix. By reducing the pH to 5,9 the 6xHis-
tagged Avr1b protein dissociated from the Ni-NTA resin as shown in Fig. 7.

Results 45
Avr1b (17,5 kDa)
kDa M F W1 W2 EI1 EI2 EI3 EI4 EII1 EII2 EII3 EII483,062,047,5
32,5
25,0
16,5
6,5
Avr1b (17,5 kDa)
kDa M F W1 W2 EI1 EI2 EI3 EI4 EII1 EII2 EII3 EII483,062,047,5
32,5
25,0
16,5
6,5
Avr1b (17,5 kDa)
kDa M F W1 W2 EI1 EI2 EI3 EI4 EII1 EII2 EII3 EII483,062,047,5
32,5
25,0
16,5
6,5
During batch purification the flow through fraction, washing and eluate fractions were collected and
aliquots were subsequently applied to a 17,4% polyacrylamide gel. As shown in Fig. 8, the early
eluate fractions contained purified Avr1b. The fractions EI2, EI3 and EI4 were collected, combined
and dialyzed for further biological tests.
Fig. 8 SDS-PAGE (17,4%) analysis of different fractions collected after purification of Avr1b under denaturing
conditions. Proteins were visualized by Coomasie staining. M) protein markers (kDa), F) flow through, W1)
washing fraction 1, W2) washing fraction 2, EI1- EI4) fractions eluted with buffer I (pH 5,9), EII1-EII4) fractions
eluted with buffer II (pH 4,5).
4.1.2.2 Protein refolding As shown in 4.1.2.1 it was possible to purify Avr1b from inclusion body fractions under denaturing
conditions. Nevertheless it would be more favorable to obtain renatured protein preparations or even
to purify Avr1b under native conditions in order to use it in biotests or to produce an anti-Avr1b-
antiserum. For these reasons, protein refolding was performed using the Qiagen protocol with the
help of the Ni-NTA superflow matrix and the FPLC device as described in 3.5.2.
Lysate (40 ml) was applied to the matrix and renatured in a 7 to 1 M urea gradient. After presumptive
refolding, unspecifically bound proteins were removed by applying 50 mM imidazole. To elute Avr1b,
a three step imidazole gradient was performed (50, 180, 250 mM imidazole, Fig. 9).
Fig. 9A shows the elution profile obtained during purification. As observed in Figs. 9B and 9C the
eluate fractions 10-17 contained purified Avr1b. These fractions were collected, combined and stored
at -80°C, or used immediately for biotests (4.5.1.2). This purification procedure was performed eight
times and resulted in 2 mg recombinant Avr1b from a total of 1,8 l of induced bacterial cultures.
Results 46
Avr1b (17,5 kDa)
kDa M TP 0 I II III 1 3 5 7 9 10175,0
83,062,047,5
32,5
25,0
16,5
6,5
Avr1b (17,5 kDa)
kDa M TP 0 I II III 1 3 5 7 9 10175,0
83,062,047,5
32,5
25,0
16,5
6,5
kDa M 11 12 13 14 15 16 17 18 19 20 IV
Avr1b (17,5 kDa)
175,083,062,047,5
32,5
25,0
16,5
6,5
kDa M 11 12 13 14 15 16 17 18 19 20 IV
Avr1b (17,5 kDa)
175,083,062,047,5
32,5
25,0
16,5
6,5
Time (min) -30 -20 -10 0 10 20 30 40 50 60 70 80 90
Imid
azol
e co
ncen
tratio
n (m
M)
Protein concentration (µg.ml -1)
50
0
40
30
20
1050
180
250
III 1 5 10 15 20 IV
Column equilibration
Imidazole gradient
Fraction number
A
B
C
Fig. 9 FPLC purification on a Ni-NTA superflow matrix. 6xHis-tagged Avr1b was purified from lysate (40 ml)
derived from 250 ml of an induced E. coli culture on 5 ml of Ni-NTA superflow matrix at a flow rate of 0,5 ml/min.
(A) Elution profile of the column. (B) Coomassie-stained SDS-PAGE (17,4%), M) protein markers (kDa), TP)
Total protein fraction (inclusion bodies) before application onto the column, 0) flow through fraction during
sample injection, I) flow through fraction during 7-4 M urea gradient, II) flow through fraction during 4-1 M urea
gradient, III) flow through fraction during column equilibration with 50 mM imidazole, 1-10) eluate fractions. (C)
Coomassie-stained SDS-PAGE (17,4%). M) protein markers (kDa), 11-20, IV) eluate fractions.
Results 47
4.2 Production of recombinant Avr1b in Sf9 insect cells As an alternative approach, recombinant Avr1b was produced in baculovirus-infected insect cells.
For the generation of recombinant, transfection-competent baculovirus DNA, Avr1b was first cloned
into the transfer vector pFastBac1, flanked by Tn7 elements. This recombinant donor plasmid was
then transposed into E. coli DH10Bac cells which contained the bacmid with a mini-attTn7 target and
a helper plasmid. The mini-Tn7 element of the pFastbac1 donor plasmid is able to transpose to the
mini-attTn7 target site on the bacmid in the presence of transposition proteins provided by the helper
plasmid. After induction with IPTG, the cells with the recombinant bacmid growing on plates
containing X-Gal were identified by the white color of its colonies resulting from disruption of the lacZ
gene after the transposition. High molecular weight mini-prep DNA was performed on transformed
E. coli clones containing the recombinant bacmid, which was then used to transfect insect cells.
Baculovirus particles harvested from the transfected cells were used to infect fresh Sf9 insect cells
for subsequent synthesis of Avr1b (Fig. 10).
Fig. 10 Generation of recombinant baculoviruses and gene expression. Figure taken from the manual “Bac-to-
Bac Baculovirus Expression System” from Invitrogen.
Results 48
pFastBac1- Avr1b
EcoR I Sac I Xba I
Avr1bSecretionsignal
Nco I Sac I
Pau I Start
Polyhedrin promoter
Avr1bSecretionsignal
Nco I Sac I
EcoR IPau I
pFastBac1
EcoR IPau I
Avr1b-3´ (T7promoter)
ptz18R: Avr1b
Avr1b-5´ (PauI-1)
Stop EcoR I
Avr1bSecretionsignal
StartNco I Sac I
Pau I
AB
C
pFastBac1- Avr1b
EcoR I Sac I Xba I
Avr1bSecretionsignal
Nco I Sac I
Pau I Start
Polyhedrin promoter
pFastBac1- Avr1b
EcoR I Sac I Xba I
Avr1bSecretionsignal
Nco I Sac I
Pau I StartStart
Polyhedrin promoter
Avr1bSecretionsignal
Nco I Sac I
EcoR IPau I
pFastBac1pFastBac1
EcoR IPau I
Avr1b-3´ (T7promoter)
ptz18R: Avr1b
Avr1b-5´ (PauI-1)
Stop EcoR I
Avr1bSecretionsignal
StartNco I Sac I
Pau I
AB
Avr1b-3´ (T7promoter)
ptz18R: Avr1b
Avr1b-5´ (PauI-1)
Stop EcoR I
Avr1bSecretionsignal
StartNco I Sac I
Pau I
AB
C
4.2.1 Generation of the expression constructs Genes encoding Avr1b with or without the predicted secretion signal were amplified in the vector
pTZ18-Avr1b. Separate amplifications by PCR including the oligonucleotides Avr1b_PauI-1 or
Avr1b_PauI-2 and T7-promoter were performed using a Pfu-DNA-Polymerase. The resulting 427 and
370 bp gene fragments contained the complete open reading frame of Avr1b or the sequence lacking
the secretion signal, respectively. Both fragments were digested with the restriction enzymes EcoR I
and Pau I. Subsequently they were purified from an agarose gel (3.9.3).
A pFastBac1 donor plasmid was transformed into DH5α E. coli cells. After a minipreparation (3.9.2)
the plasmid was digested with the restriction enzymes EcoR I and Pau I in order to ensure that the
insertion of the gene fragments will be unidirectional.
These gene fragments encoding Avr1b with or without the predicted secretion signal were ligated into
the pFastBac1 vector (3.9.11) and then transformed again into XL10-Gold ultracompetent E. coli
cells (3.9.14; Fig. 11).
To verify the correct insertion into the donor plasmids, restriction analyses with different restriction
enzyme pairs were performed after minipreparation of the plasmid as illustrated in Fig.12. The figure
shows clearly that the ligation of the gene fragments into the pFastBac1 plasmid was successful. The
bands of the restriction fragments present in the agarose gel correspond with the calculated sizes.
I
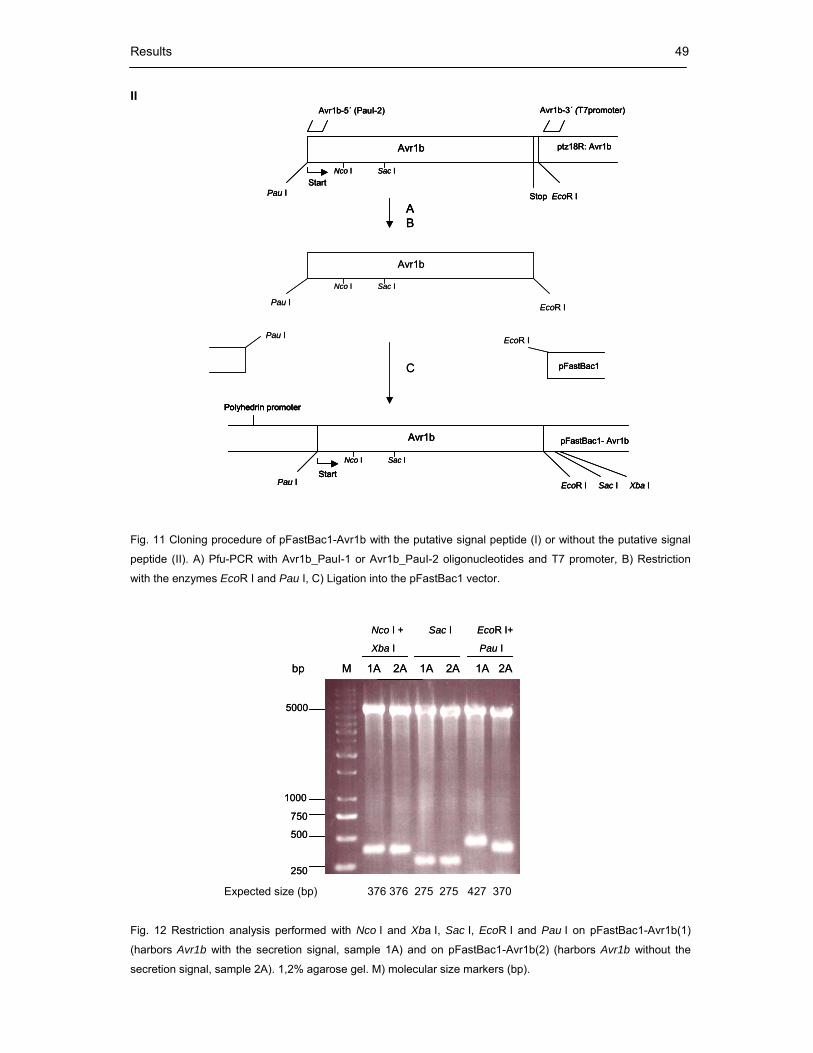
Results 49
bp M 1A 2A 1A 2A 1A 2A
1000
750
500
250
5000
Nco I + Sac I EcoR I+
Xba I Pau I
bp M 1A 2A 1A 2A 1A 2A
1000
750
500
250
5000
Nco I + Sac I EcoR I+
Xba I Pau I
Avr1b
Nco I Sac I
EcoR IPau I
pFastBac1
EcoR IPau I
pFastBac1- Avr1b
EcoR I Sac I Xba I
Avr1b
Nco I Sac I
Pau IStart
Polyhedrin promoter
Avr1b-3´ (T7promoter)
ptz18R: Avr1b
Avr1b-5´ (PauI-2)
Stop EcoR I
Avr1b
StartNco I Sac I
Pau I
AB
C
Avr1b
Nco I Sac I
EcoR IPau I
pFastBac1pFastBac1
EcoR IPau I
pFastBac1- Avr1b
EcoR I Sac I Xba I
Avr1b
Nco I Sac I
Pau IStart
Polyhedrin promoter
pFastBac1- Avr1b
EcoR I Sac I Xba I
Avr1b
Nco I Sac I
Pau IStartStart
Polyhedrin promoterPolyhedrin promoter
Avr1b-3´ (T7promoter)
ptz18R: Avr1b
Avr1b-5´ (PauI-2)
Stop EcoR I
Avr1b
StartNco I Sac I
Pau I
AB
Avr1b-3´ (T7promoter)
ptz18R: Avr1b
Avr1b-5´ (PauI-2)
Stop EcoR I
Avr1b
StartNco I Sac I
Pau I
AB
C
II
Fig. 11 Cloning procedure of pFastBac1-Avr1b with the putative signal peptide (I) or without the putative signal
peptide (II). A) Pfu-PCR with Avr1b_PauI-1 or Avr1b_PauI-2 oligonucleotides and T7 promoter, B) Restriction
with the enzymes EcoR I and Pau I, C) Ligation into the pFastBac1 vector.
Expected size (bp) 376 376 275 275 427 370
Fig. 12 Restriction analysis performed with Nco I and Xba I, Sac I, EcoR I and Pau I on pFastBac1-Avr1b(1)
(harbors Avr1b with the secretion signal, sample 1A) and on pFastBac1-Avr1b(2) (harbors Avr1b without the
secretion signal, sample 2A). 1,2% agarose gel. M) molecular size markers (bp).

Results 50
Nuclei Membrane poteins Soluble proteins
CF B1 B2 CF B1 B2 CF B1 B2
Avr1b (15,8 kDa)
kDa M
83,0 62,0 47,5
32,5
25,0
16,5
6,5
Nuclei Membrane poteins Soluble proteins
CF B1 B2 CF B1 B2 CF B1 B2
Avr1b (15,8 kDa)
kDa M
83,0 62,0 47,5
32,5
25,0
16,5
6,5
4.2.2 Synthesis of Avr1b in Sf9 insect cells Once the Avr1b gene had been cloned into the pFastBac1 vector and after the pFastBac1-Avr1b
recombinant donor plasmids had been transferred into XL10 ultracompetent E. coli cells they were
transposed into DH10Bac E. coli cells to obtain recombinant Avr1b bacmids. These Avr1b bacmids
were transfected into insect cells (3.3.3). The baculovirus particles (P1) harvested from the
transfected cells were used to infect fresh Sf9 insect cells for subsequent synthesis of Avr1b. As
shown in Fig.13, the recombinant Avr1b protein was found in nuclei, in membrane protein and in
soluble protein fractions from Sf9 insect cells infected with baculovirus particles (P1) containing the
Avr1b bacmid B1 (harboring Avr1b with the secretion signal), but not from insect cells infected with
baculovirus particles (P1) containing the Avr1b bacmid B2 (Avr1b without the secretion signal).
Fig. 13 Proof of synthesis of Avr1b in Sf9 insect cells. M) protein markers (kDa), CF) Cellfectin-treated insect
cells (negative control), B1) insect cells infected with baculovirus-particles derived from bacmid B1 (harboring
Avr1b including the secretion signal), B2) insect cells infected with baculovirus-particles derived from bacmid B2
(harboring Avr1b without the secretion signal). Proteins (30 µg each) were separated by SDS-PAGE (17,4%),
transferred onto nitrocellulose membranes and probed with anti-Avr1b-antiserum (1/750 dilution; 3.8.7).
For maximal protein synthesis, it was essential to determine the optimal baculovirus titer for infection
and the time necessary for protein recovery. Sf9 insect cells were first infected with different
concentrations of baculovirus particles (5-500 µl P3 baculovirus particles/1x106 cells). In an
immunoblot analysis (Fig. 14A), it was examined that 50 µl P3 baculovirus particles/1x106 cells were
sufficient. Using this baculovirus titer, insect cells were infected and harvested in a time course
experiment between 24-144 h post-infection (pi). Sufficient abundance of protein expression
occurred at 120 hpi (Fig. 14B and 14C). Using these conditions, a subcellular fractionation (3.3.6) of
insect cells, infected with P3 baculovirus particles derived from the bacmid B1 that harbors Avr1b
including the secretion signal, was performed. As a negative control, wild type virus particles were
used (2,5 µl/1x106 cells). As shown in Fig. 14D, Avr1b did not fractionate into a specific subcellular

Results 51
Pellets Supernatants
Virus particles (µl)/1x10x6 cells 0 5 20 50 100 500 0 5 20 50 100 500
kDa M
47,5
32,5
25,0
16,5 Avr1b (15,8 kDa)
Pellets Supernatants
Virus particles (µl)/1x10x6 cells 0 5 20 50 100 500 0 5 20 50 100 500
kDa M
47,5
32,5
25,0
16,5
47,5
32,5
25,0
16,5 Avr1b (15,8 kDa)
Avr1b (15,8 kDa)
0 50 50 50 50 50 500 50 50
96 24 72 9648 96 24 48 72 96
Virus particles (µl)/1x10 cells6
Time (hpi)
Pellets Supernatants
kDa M
47,5
32,5
25,0
16,5 Avr1b (15,8 kDa)Avr1b (15,8 kDa)
0 50 50 50 50 50 500 50 50
96 24 72 9648 96 24 48 72 96
Virus particles (µl)/1x10 cells6
Time (hpi)
Pellets Supernatants
kDa M
47,5
32,5
25,0
16,5
fraction but was detectable in culture medium, nuclei, heavy membranes, light membranes and in the
cytosol from infected insect cells. Since the fractionation didn’t result in a single Avr1b containing
fraction, a second, less complex subcellular fractionation obtaining only culture medium, crude
membranes and soluble proteins (3.3.6, last paragraph) was performed in additional experiments,
where the soluble protein fraction was used as a positive control in Western blot analyses. Figs. 14E
and 14D show that Avr1b was present in all fractions of infected insect cells.
A
B
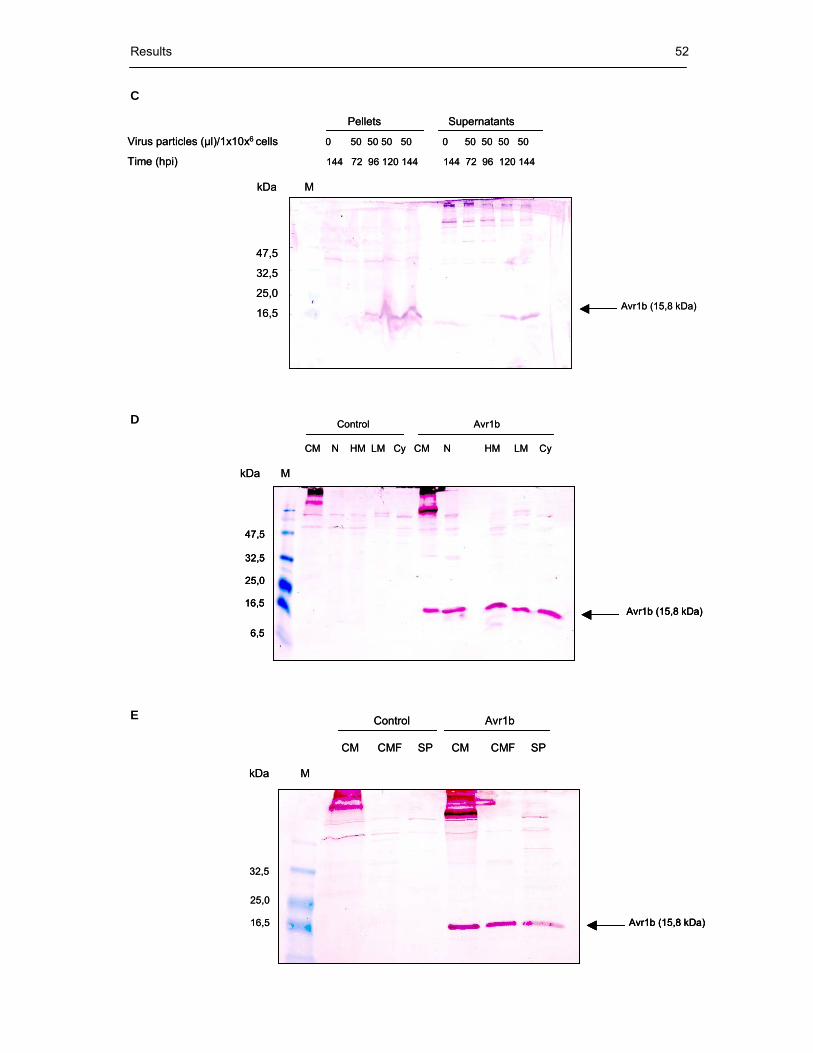
Results 52
Control Avr1b
CM CMF SP CM CMF SP
kDa M
Avr1b (15,8 kDa)
32,5
25,0
16,5
Control Avr1b
CM CMF SP CM CMF SP
kDa M
Avr1b (15,8 kDa)Avr1b (15,8 kDa)
32,5
25,0
16,5
Control Avr1b
CM N HM LM Cy CM N HM LM Cy
kDa M
Avr1b (15,8 kDa)
47,5
32,5
25,0
16,5
6,5
Control Avr1b
CM N HM LM Cy CM N HM LM Cy
kDa M
Avr1b (15,8 kDa)
47,5
32,5
25,0
16,5
6,5
Avr1b (15,8 kDa)
47,5
32,5
25,0
16,5
6,5
Pellets Supernatants
Virus particles (µl)/1x10x6 cells 0 50 50 50 50 0 50 50 50 50
Time (hpi) 144 72 96 120 144 144 72 96 120 144
kDa M
47,5
32,5
25,0
16,5Avr1b (15,8 kDa)
Pellets Supernatants
Virus particles (µl)/1x10x6 cells 0 50 50 50 50 0 50 50 50 50
Time (hpi) 144 72 96 120 144 144 72 96 120 144
kDa M
47,5
32,5
25,0
16,5Avr1b (15,8 kDa)
C
D
E

Results 53
Fig. 14 Synthesis of Avr1b in Sf9 insect cells. (A) Insect cells were infected with different concentrations of
baculovirus particles (5-500 µl P3 baculovirus particles/1x106 cells) for optimizing protein production. (B) Insect
cells were infected with 50 µl P3 baculovirus particles/1x106 cells and harvested in a time course experiment
between 24 and 96 hpi. (C) Insect cells were infected with 50 µl P3 baculovirus particles/1x106 cells and
harvested in a time course experiment between 72 and 144 hpi. (D and E) Subcellular fractionations of infected
insect cells at 120 h pi. Control) insect cells infected with 2,5 µl/1x106 wild type virus particles, Avr1b) insect cells
infected with 50 µl/1x106 P3 baculovirus particles (derived from the bacmid that harbors Avr1b including the
secretion signal). CM) culture medium, N) nuclei, HM) heavy membranes, LM) light membranes, Cy) cytosol,
CMF) crude membrane fraction, SP) soluble protein fraction. M) protein markers (kDa). Proteins (30 µg each)
were separated by SDS-PAGE (17,4%), transferred onto nitrocellulose membranes and probed with anti-Avr1b-
antiserum (1/750 dilution).
4.2.3 Protein analysis by mass spectrometry
To verify that Avr1b was present in the soluble protein preparations obtained from Sf9 insect cells, it
was analysed by mass spectrometry (3.8.8). The band corresponding to Avr1b (15,8 kDa) was
identified by Western blotting and the respective band was excised from another gel lane and
subjected to MS analysis. One tryptic peptide (TFSVTDLWNK) from Avr1b was found after MS
analysis. This result indicates that Avr1b is present in soluble protein preparations from Sf9 insect
cells. The MS spectrum is shown in Fig. 15A, the MS/MS spectrum obtained from TFSVTDLWNK in
Fig. 15B and the Avr1b sequence with the matching peptide in Fig. 15C.
A

Results 54
100 200 300 400 500 600 700 800 900 1000 1100 1200M/z0
100
%
Karina Valer/AG Ebel031010 avr1b1 605 MaxEnt 3 26 [Ev-99664,It50,En1] (0.050,200.00,0.200,1400.00,2,Cmp) 1: TOF MSMS 605.86ES+
TF S V T DL WN K bMax K N W L D T V S F T yMax
221.17a2
159.12W129.13
117.11
962.68y8
605.51
249.17b2
447.32y3
318.19336.21
b3 417.28
560.42y4516.35
606.35
776.53y6
675.46y5
607.62 770.55702.47
875.63y7
784.59 870.57944.64
907.70
1209.79
1192.76970.71
1131.83982.64 1091.72
1211.85
1212.47
1214.31
B
C 10 20 30 40 50 60
MRLSFVLSLVVAIGYVVTCNATEYSDETNIAMVESPDLVRRSLRNGDIAGGRFLRAHEED
70 80 90 100 110 120
DAGERTFSVTDLWNKVAAKKLAKAMLADPSKEQKAYEKWAKKGYSLDKIKNWLAIADPKQ
130 138
KGKYDRIYNGYTFHRYQS
Fig. 15 Protein analysis by mass spectrometry. (A) MS spectrum of a soluble protein preparation from infected
insect cells using a ESI-Q-TOF mass spectrometer. The y-axis shows the ion count of the peptides, the x-axis
the mass to charge ratio. (B) MS/MS spectrum of the peptide TFSVTDLWNK from Avr1b (calculated molecular
weight: 1209,60. In the MS spectrum the peptide has a mass to charge ratio of 605,8). (C) Amino acid sequence
of Avr1b. The peptide identified by MS/MS is shown in grey.
4.3 Generation and purification of a polyclonal anti-Avr1b-antiserum In order to detect the Avr1b protein in soybean - P. sojae interactions, it was necessary to have a
specific and purified antiserum raised against Avr1b. For this reason recombinant Avr1b obtained
from E. coli cells was used to immunize rabbits (3.6). The polyclonal antiserum obtained was purified
and tested by immunoblot analyses.
Results 55
4.3.1 Testing of the recipient rabbits Recombinant Avr1b obtained from E. coli cells and refolded using a 7 to 1 M urea gradient on a Ni-
NTA column (4.1.2.2) was used to raise an anti-Avr1b-antiserum (SeqLab, Göttingen). Pre-serum
obtained from eight rabbits was screened in Western blot analyses for cross reacting antibodies
using different protein preparations obtained from E. coli cells, Sf9 insect cells, soybean and P. sojae
race 1. The pre-serum from one of the rabbits did not show cross reaction with protein preparations
in the area corresponding to 15,8 kDa where Avr1b was expected (Data not shown). The purified
recombinant Avr1b (2 mg) was used to immunize this rabbit. The anti-Avr1b-antiserum obtained after
6 weeks was also tested in an immunoblot analysis. Avr1b was recognized by the antiserum,
however there was a high level of background in the Western blot membrane (Data not shown).
4.3.2 Purification of the antiserum To decrease the background in immunoblot membranes, it was necessary to purify the anti-Avr1b-
antiserum. Many techniques have been developed to purify IgG molecules. Two of them were tested
in the present study using protein G sepharose (without success, not shown) and protein A
sepharose. The principle of this technique relies on the strong binding of protein A to sites in the
second and third constant regions of the Fc portion of the immunoglobulin heavy chain (Deisenhofer,
1981). Each IgG molecule contains two binding sites for protein A. Because protein A itself has four
potential sites for binding to IgG (Sjödahl, 1977), it is possible to form multimeric complexes. Protein
A coupled to a solid support by cyanogen bromide is supplied by several manufacturers. Each ml of
swollen gel can bind approximately 10-20 mg of IgG (equivalent to 1-2 ml of antiserum).The
hydrophobic interactions, by which antibodies bind to protein A can be disrupted at low pH, which
most antibodies can withstand transiently (Sambrook et al., 1989).
After purification (3.6.6), the eluate fractions E2-E5 were combined and the purified anti-Avr1b-
antiserum was tested in an immunoblot analysis using 15 µg of soluble protein preparations from Sf9
insect cells containing Avr1b (4.2.2). Different dilutions of the purified antiserum were used for
membrane development. As shown in Fig. 16, the background in the membrane was significantly
reduced when using the purified anti-Avr1b-antiserum. This purified antiserum was used for further
immunoblot analyses.

Results 56
Anti-Avr1b-antiserum (dilution) 1/750np 1/750p 1/2 000p 1/5 000p 1/10 000p 1/20 000p
Time of development (sec) 15 15 40 42 70 120
kDa M M M M M M
Avr1b (15,8 kDa)
83,0 62,0 47,5 32,5
25,0
16,5
6,5
Anti-Avr1b-antiserum (dilution) 1/750np 1/750p 1/2 000p 1/5 000p 1/10 000p 1/20 000p
Time of development (sec) 15 15 40 42 70 120
kDa M M M M M M
Avr1b (15,8 kDa)
83,0 62,0 47,5 32,5
25,0
16,5
6,5
Soluble proteins from Sf9 insect cells (µg) 0,1 0,5 1 5 10
kDa M
Avr1b (15,8 kDa)
175,0 83,0 62,0 47,5 32,5
25,0
16,5
6,5
Soluble proteins from Sf9 insect cells (µg) 0,1 0,5 1 5 10
kDa M
Avr1b (15,8 kDa)Avr1b (15,8 kDa)
175,0 83,0 62,0 47,5 32,5
25,0
16,5
6,5
Fig. 16 Purification of anti-Avr1b-antiserum with protein A sepharose using a pH gradient. For each lane, 15 µg
of soluble protein preparation obtained from Sf9 insect cells containing Avr1b were separated by SDS-PAGE
(17,4%), transferred onto nitrocellulose membranes and probed with non purified (np) and purified (p) anti-
Avr1b-antiserum. M) protein markers (kDa).
4.3.3 Evaluation of the antiserum Once the anti-Avr1b-antiserum had been purified with protein A Sepharose (4.3.2) and proved to
detect Avr1b in 15 µg of soluble proteins obtained from Sf9 insect cells even at dilutions of 1/20 000,
it was necessary to select optimised dilution conditions. A 1/1 000 dilution was chosen to avoid a
background on the membrane. The diluted antiserum was tested against different dilutions of soluble
proteins obtained from Sf9 insect cells (4.2.2). Fig. 17 shows that the antiserum was able to detect as
little as 0,5 µg of the protein preparation containing Avr1b. However the detection limit may vary
when testing different protein preparations such as apoplastic fluid, microsomes and soluble proteins
obtained from infected soybean seedlings or recombinant Avr1b obtained from E. coli cells.

Results 57
Fig. 17 Detection limit of soluble proteins from Sf9 insect cells containing Avr1b. M) protein markers (kDa).
Different amounts of soluble proteins from Sf9 insect cells (0,1-10 µg) were separated by SDS-PAGE (17,4%),
transferred onto nitrocellulose membranes and probed with purified anti-Avr1b-antiserum (1/1 000 dilution).
4.3.4 Immunoprecipitation Since the anti-Avr1b-antiserum was not highly sensitive, immunoprecipitation tests were performed in
order to detect very low amounts of protein.
4.3.4.1 Immunoprecipitation of urea-denatured protein preparations from Sf9 insect cells
The anti-Avr1b-antiserum was raised against the recombinant Avr1b protein obtained from E. coli
cells and refolded under a 7 to 1 M urea gradient (4.1.2.2). It is possible that the protein refolding did
not work properly. In this case the antiserum would react preferentially with the denatured Avr1b
protein. For this reason, an immunoprecipitation test was performed using urea-denatured Avr1b
protein. The fraction used for the test was 10 µg of a soluble protein preparation from Sf9 insect cells
(4.2.2). The immunoprecipitation protocol is described in 3.8.9.1. It was not possible to detect a band
corresponding to Avr1b at 15,8 kDa, neither in the pellet nor in the supernatant fractions (Data not
shown). Avr1b was found only in the positive control (soluble protein preparation of infected Sf9
insect cells). Since no washing steps were performed, Avr1b should have been present in either of
the fractions. Therefore, an alternative protocol using SDS-denatured protein preparations was
performed.
4.3.4.2 Immunoprecipitation of SDS-denatured protein preparation from E. coli cells For immunoprecipitation 2 µg of recombinant Avr1b obtained from E. coli cells and refolded using a 7
to 1 M urea gradient on a Ni-NTA column (4.1.2.2) was used.
The sample was denatured with SDS followed by immunoprecipitation with anti-Avr1b-antiserum and
PAS (3.8.9.2). Three positive controls were used: recombinant Avr1b denatured with SDS and
resuspended in 5x SDS loading buffer (DP control), recombinant Avr1b diluted in 5x SDS loading
buffer (AV control) and anti-Avr1b-antiserum diluted in 1x SDS loading buffer (AA control). Internal
negative controls were also used: no Avr1b, no anti-Avr1b-antiserum or no PAS in the
immunoprecipitation.
A band corresponding to Avr1b appears in the positive controls (lines 7 and 8; Figs. 18A and 18B). A
band around 47,5 kDa corresponding to the anti-Avr1b-antiserum appears in lane 9 (Figs. 18A and
18B). When there is no Avr1b in the immunoprecipitation, as expected no band corresponding to
Avr1b appears in the membranes (lane 3; Figs. 18A and 18B).
When Avr1b is immunoprecipitated with anti-Avr1b-antiserum and PAS, a band corresponding to
Avr1b (17,5 kDa) appears in the pellet as expected (line 2, Fig. 18A). However, an Avr1b band also
appears in the supernatant (line 2, Fig. 18B), indicating that part of the complex Avr1b - anti-Avr1b-
antiserum did not bind to the beads of PAS, and as consequence remains in the supernatant. It is

Results 58
2 µg Avr1b
Anti-Avr1b
Avr1b (17,5kDa)
kDa M DP AV AA
(E. coli)
PAS
+ -
++
++
+
+++
-- -
-+
175,0 83,0 62,0 47,5
32,5
25,0
16,5
6,5
Avr1b
2 µg Avr1b
Anti-Avr1b
Avr1b (17,5kDa)
kDa M DP AV AA
(E. coli)
PAS
+ -
++
++
+
+++
-- -
-+
175,0 83,0 62,0 47,5
32,5
25,0
16,5
6,5
Avr1b
probable that the amount of PAS used in the immunoprecipitation was not high enough to bind to the
complex. In lane 4 (Fig. 18A), there is a band corresponding to Avr1b at 17,5 kDa in the pellet, this
result was unexpected and it indicates that Avr1b was able to precipitate without the help of the anti-
Avr1b-antiserum, probably the protein was bound to the beads of PAS and therefore was collected in
the centrifugation step. In lane 5 (Fig 18), where Avr1b is treated only with the anti-Avr1b-antiserum,
an unexpected result is observed. A band corresponding to Avr1b is present in the pellet and also in
the supernatant, probably the amount of the complex Avr1b - anti-Avr1b-antiserum was enough for
precipitation in the absence of PAS. When anti-Avr1b-antiserum and PAS are missing (line 6;
Fig. 18) only a thin band corresponding to Avr1b appears in the pellet (Fig. 18A), and a strong band
appears in the supernatant (Fig. 18B), indicating that Avr1b is not able to precipitate alone.
Although it was possible to precipitate the complex Avr1b - anti-Avr1b-antiserum - PAS (line 2,
Fig. 18A), the immunoprecipitation method still presents some problems. For example, Avr1b
precipitates in the absence of anti-Avr1b-antiserum (line 4, Fig 18A) or part of the complex Avr1b –
anti-Avr1b-antiserum remains in the supernatant (line 2, Fig. 18B). However when using enough
amount of purified Avr1b (2 µg from E. coli), Avr1b can be immunoprecipitated.
The prospects of using immunoprecipitation for the detection of Avr1b in soybean tissues after
infection with P. sojae (chapter 4.5.7) could be favorable when the Avr1b level is relatively high.
A Pellets
Lane 1 2 3 4 5 6 7 8 9
Results 59
kDa M DP AV AA
(E. coli)
PASAnti-Avr1b
+ -
++
++
+
+++
-- -
-+
Avr1b (17,5kDa)
175,0 83,0 62,0 47,5
32,5
25,0
16,5
6,5
2 µg Avr1b
Avr1b
kDa M DP AV AA
(E. coli)
PASAnti-Avr1b
+ -
++
++
+
+++
-- -
-+
Avr1b (17,5kDa)
175,0 83,0 62,0 47,5
32,5
25,0
16,5
6,5
2 µg Avr1b
Avr1b
B Supernatants
Lane 1 2 3 4 5 6 7 8 9
Fig. 18 Immunoprecipitation of purified Avr1b (Avr1b obtained from E. coli cells and refolded using a 7 to 1 M
urea gradient). (A) Pellets. (B) Supernatants. Symbols denote (+) presence or (-) absence of a compound. M)
protein markers (kDa), DP) 2 µg Avr1b denatured with SDS and redissolved in 5x SDS loading buffer (positive
control), AV) 2 µg Avr1b diluted in 5x SDS loading buffer (positive control), AA) 2,5 µl anti-Avr1b-antiserum
diluted in 1x SDS loading buffer (positive control). Proteins were separated by SDS-PAGE (17,4%), transferred
onto nitrocellulose membranes and probed with purified anti-Avr1b-antiserum (1/1 000 dilution).
4.4 Detection of Avr1b in P. sojae To confirm the expression of Avr1b in P. sojae, two different approaches have been used. In order to
detect the Avr1b protein, P. sojae mycelium was fractionated followed by an immunoblot analysis.
Furthermore for detecting the Avr1b-mRNA in P. sojae mycelium, its zoospores and in infected
soybean seedlings, RNA was extracted from the tissues followed by RT-PCR analyses.
4.4.1 Fractionation of mycelial material The subcellular fractionation of P. sojae race 1 mycelium (3.10) resulted in four fractions: cell debris,
mitochondria, soluble proteins and microsomes. Since Avr1b contains a putative secretion signal, the
culture medium was also analysed by Western blotting. Fifty µg of the protein fractions were used for
the test. The experiment was performed four times. As shown in Fig. 19, there is no band
corresponding to Avr1b (15,8 kDa) in none of the fractions, except of the positive control in lane 6
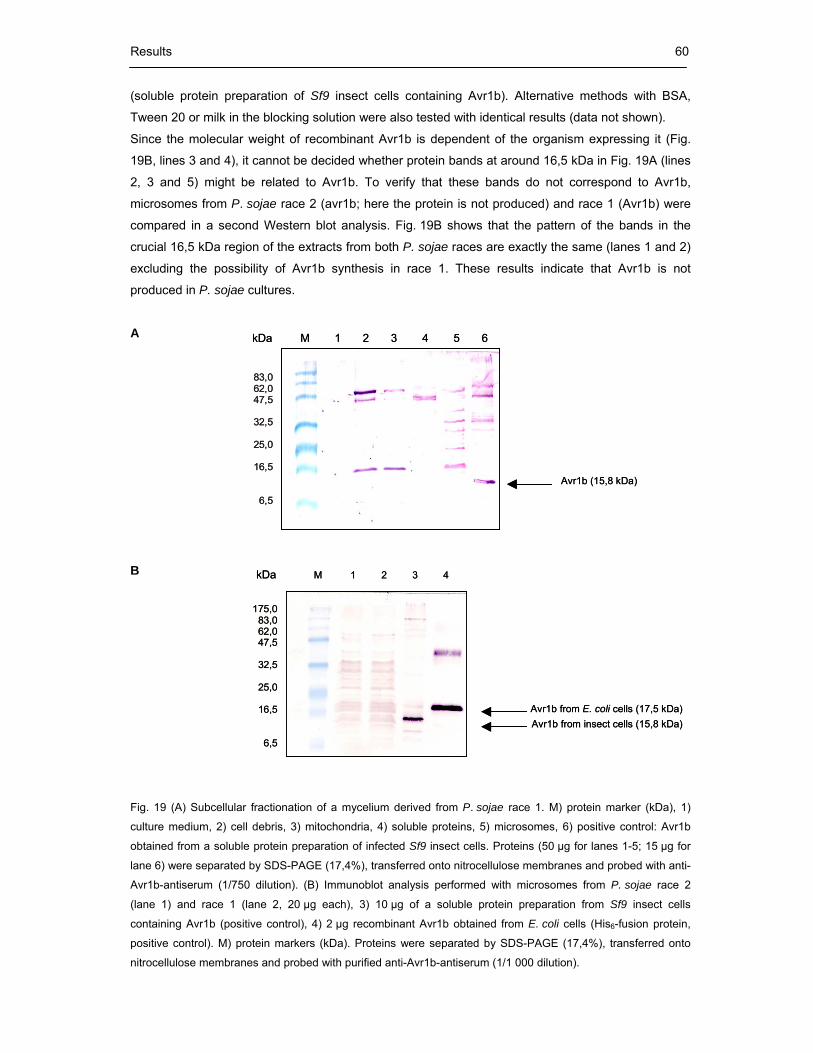
Results 60
kDa M 1 2 3 4 5 6
Avr1b (15,8 kDa)
83,0 62,0 47,5
32,5
25,0
16,5
6,5
kDa M 1 2 3 4 5 6
Avr1b (15,8 kDa)
83,0 62,0 47,5
32,5
25,0
16,5
6,5
kDa M 1 2 3 4
Avr1b from insect cells (15,8 kDa)Avr1b from E. coli cells (17,5 kDa)
175,0 83,0 62,0 47,5
32,5
25,0
16,5
6,5
kDa M 1 2 3 4
Avr1b from insect cells (15,8 kDa)Avr1b from E. coli cells (17,5 kDa)
175,0 83,0 62,0 47,5
32,5
25,0
16,5
6,5
(soluble protein preparation of Sf9 insect cells containing Avr1b). Alternative methods with BSA,
Tween 20 or milk in the blocking solution were also tested with identical results (data not shown).
Since the molecular weight of recombinant Avr1b is dependent of the organism expressing it (Fig.
19B, lines 3 and 4), it cannot be decided whether protein bands at around 16,5 kDa in Fig. 19A (lines
2, 3 and 5) might be related to Avr1b. To verify that these bands do not correspond to Avr1b,
microsomes from P. sojae race 2 (avr1b; here the protein is not produced) and race 1 (Avr1b) were
compared in a second Western blot analysis. Fig. 19B shows that the pattern of the bands in the
crucial 16,5 kDa region of the extracts from both P. sojae races are exactly the same (lanes 1 and 2)
excluding the possibility of Avr1b synthesis in race 1. These results indicate that Avr1b is not
produced in P. sojae cultures.
A B Fig. 19 (A) Subcellular fractionation of a mycelium derived from P. sojae race 1. M) protein marker (kDa), 1)
culture medium, 2) cell debris, 3) mitochondria, 4) soluble proteins, 5) microsomes, 6) positive control: Avr1b
obtained from a soluble protein preparation of infected Sf9 insect cells. Proteins (50 µg for lanes 1-5; 15 µg for
lane 6) were separated by SDS-PAGE (17,4%), transferred onto nitrocellulose membranes and probed with anti-
Avr1b-antiserum (1/750 dilution). (B) Immunoblot analysis performed with microsomes from P. sojae race 2
(lane 1) and race 1 (lane 2, 20 µg each), 3) 10 µg of a soluble protein preparation from Sf9 insect cells
containing Avr1b (positive control), 4) 2 µg recombinant Avr1b obtained from E. coli cells (His6-fusion protein,
positive control). M) protein markers (kDa). Proteins were separated by SDS-PAGE (17,4%), transferred onto
nitrocellulose membranes and probed with purified anti-Avr1b-antiserum (1/1 000 dilution).
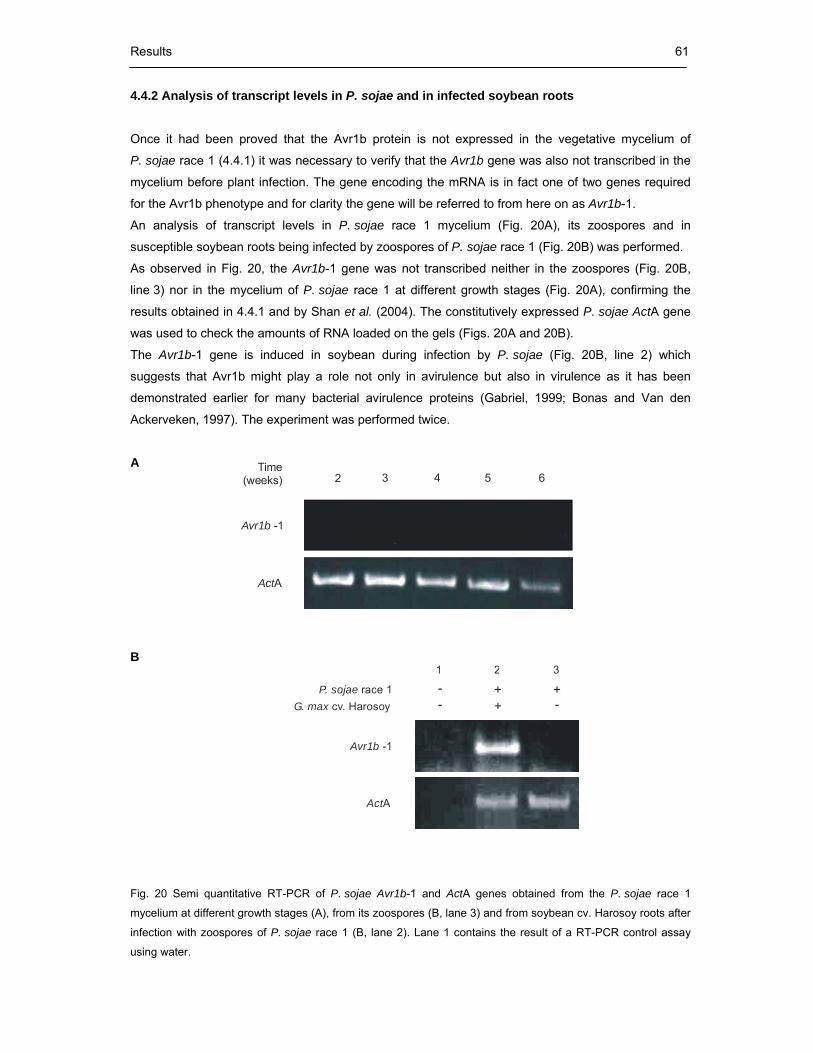
Results 61
Avr1b -1
ActA
Time (weeks) 2 3 4 5 6
1 2 3
P. sojae race 1G. max cv. Harosoy +
+ +--
-
Avr1b -1
ActA
4.4.2 Analysis of transcript levels in P. sojae and in infected soybean roots Once it had been proved that the Avr1b protein is not expressed in the vegetative mycelium of
P. sojae race 1 (4.4.1) it was necessary to verify that the Avr1b gene was also not transcribed in the
mycelium before plant infection. The gene encoding the mRNA is in fact one of two genes required
for the Avr1b phenotype and for clarity the gene will be referred to from here on as Avr1b-1.
An analysis of transcript levels in P. sojae race 1 mycelium (Fig. 20A), its zoospores and in
susceptible soybean roots being infected by zoospores of P. sojae race 1 (Fig. 20B) was performed.
As observed in Fig. 20, the Avr1b-1 gene was not transcribed neither in the zoospores (Fig. 20B,
line 3) nor in the mycelium of P. sojae race 1 at different growth stages (Fig. 20A), confirming the
results obtained in 4.4.1 and by Shan et al. (2004). The constitutively expressed P. sojae ActA gene
was used to check the amounts of RNA loaded on the gels (Figs. 20A and 20B).
The Avr1b-1 gene is induced in soybean during infection by P. sojae (Fig. 20B, line 2) which
suggests that Avr1b might play a role not only in avirulence but also in virulence as it has been
demonstrated earlier for many bacterial avirulence proteins (Gabriel, 1999; Bonas and Van den Ackerveken, 1997). The experiment was performed twice.
A B Fig. 20 Semi quantitative RT-PCR of P. sojae Avr1b-1 and ActA genes obtained from the P. sojae race 1
mycelium at different growth stages (A), from its zoospores (B, lane 3) and from soybean cv. Harosoy roots after
infection with zoospores of P. sojae race 1 (B, lane 2). Lane 1 contains the result of a RT-PCR control assay
using water.

Results 62
4.5 Biological tests Soybean tissues respond to β-glucan elicitors present in P. sojae. This response is the basis of
different biological assays that have been developed. The first assay developed by Ayers et al.
(1976, IX) was a modification of the cotyledon assay used by Frank and Paxton (1971). Briefly, a
section, approximately 1 mm thick and 6 mm diameter, is cut from the lower surface of cotyledons
obtained from 8 day old soybean seedlings, a 100 µl drop of elicitor solution is placed on the wound,
and incubation takes place for 20 h. Production of glyceollins can be detected photometrically at
285 nm (Albersheim and Valent, 1978). This assay has been repeated many times by people in our
laboratory. In this work, three types of alternative biotests were performed. Unwounded, 3 day-old
soybean seedlings were exposed as described in section 3.15, to protein preparations obtained
either from E. coli or from Sf9 insect cells. Glyceollins were isolated, detected photometrically at
285 nm and quantified by high performance liquid chromatography (HPLC).
Furthermore, hypocotyls of 9-12 day-old soybean plants were inoculated with small pieces of
P. sojae mycelium as described by Albersheim and Valent (1978) (3.11). RNA obtained from infected
tissues was isolated and Avr1b-1 transcripts were detected by RT-PCR.
In a third biotest, soybean seedlings were infected with zoospores from P. sojae (Hahn et al., 1985)
(3.12) prior to either Western blotting or RT-PCR.
4.5.1 Biotests on soybean using different protein preparations 4.5.1.1 Biotests on soybean using recombinant protein preparations obtained from E. coli
cells
The biological activity of Avr1b obtained as a recombinant protein from E. coli and purified both under
denaturing conditions and after protein refolding (4.1) was tested. For this purpose, unwounded
seedlings of soybean cv. Harosoy 1372 (Rps1b) were treated with 300 µl of purified Avr1b protein
preparations as described in 3.15. In a first test, the fractions EI-2, El-3 and EI-4 obtained after
denaturing purification (4.1.2.1) were combined and dialyzed against dialysis buffer (3.5.1). The
biotest was performed using dilutions of Avr1b (0,15; 1,5 and 12 µg/ml) as well as water and dialysis
buffer as negative controls. As a positive control for the biotests, the seedlings were treated with
200 µg/ml raw elicitor resulting in an increase of glyceollin concentration to 355 nmol/g fresh weight
(fw) in contrast to 55 nmol/g fw and 185 nmol/g fw for water- and dialysis buffer-treated control
seedlings, respectively.
In a second test, the fractions 9-14 obtained after a protein refolding (4.1.2.2) were combined and the
biotest was performed using dilutions of Avr1b (14 and 53 µg/ml). Here, water and buffer 2B (3.5.2)
served as negative controls. As a positive control for the biotests, the seedlings were treated again
with 200 µg/ml raw elicitor resulting in an increase of glyceollin concentration to 137 nmol/g fw in
contrast to 23 nmol/g fw and 0 nmol/g fw for water- and buffer 2B-treated control seedlings,
respectively.

Results 63
The raw elicitor obtained from cell walls of P. sojae (2.4) contains a β-glucan fraction which has been
shown to elicit phytoalexin production in soybean (Ayers et al., 1976a; Albersheim and Valent, 1978;
Hahn et al., 1985; Ebel et al., 1986). The application of Avr1b to the soybean seedlings did not result
in an increase of glyceollins above the levels monitored for the negative controls.
4.5.1.2 Biotests on soybean using recombinant protein preparations obtained from Sf9 insect
cells Activation of defence responses in several plants depends on the presence of extracellular Ca2+.
Omission of Ca2+ from the culture medium blocked the defence-related phytoalexin formation in
soybean (Stäb and Ebel, 1987). Depletion of Ca2+ also prevented elicitor-mediated gene activation at
the level of transcript accumulation (Nürnberger et al., 1994a) and transcript synthesis (Ebel and
Scheel, 1992). Werner and Hohl (1990) described the positive influence of bivalent cations like Ca2+
and Mg2+ on the accumulation and secretion of isoflavonoids in elicitor-induced soybean seedlings.
To test the biological activity of Avr1b obtained as a recombinant protein from infected Sf9 insect
cells, unwounded seedlings of soybean cv. Harosoy 1372 (Rps1b) were exposed (3.15) to Avr1b-
containing culture medium, soluble protein fraction and a crude membrane fraction obtained from
infected Sf9 insect cells (4.4.2).
Each test was performed using 1 mg/ml protein extract containing Avr1b in the presence or absence
of 10 mM MgCl2. Raw elicitor (200 µg/ml) was used as positive control, water and buffer N as
negative controls. The experiment was performed twice. Production of glyceollin after exposure to
raw elicitor was set as 100% (Fig. 21) and the other fractions were compared to this value.
Seedlings treated with raw elicitor and Mg2+ resulted in an increase of glyceollin concentration
(710 nmol/g fw; 169%) in contrast to 420 nmol/g fw (100%) for raw elicitor treated seedlings. This
effect has also been described previously by T. Waldmüller (personal communication).
Seedlings treated with recombinant Avr1b preparations obtained from infected Sf9 insect cells with or
without Mg2+ as well as with control preparations (4.2.2) with or without Mg2+ induced similar
concentrations of glyceollin (around 300 nmol/g fw; 70%) (Fig. 21).
Since the glyceollin concentration in seedlings treated with and without Avr1b was similar, it can be
deduced that the biological activities measured are not due to Avr1b but probably due to plant
recognition of other pathogen elicitors or due to unknown factors.
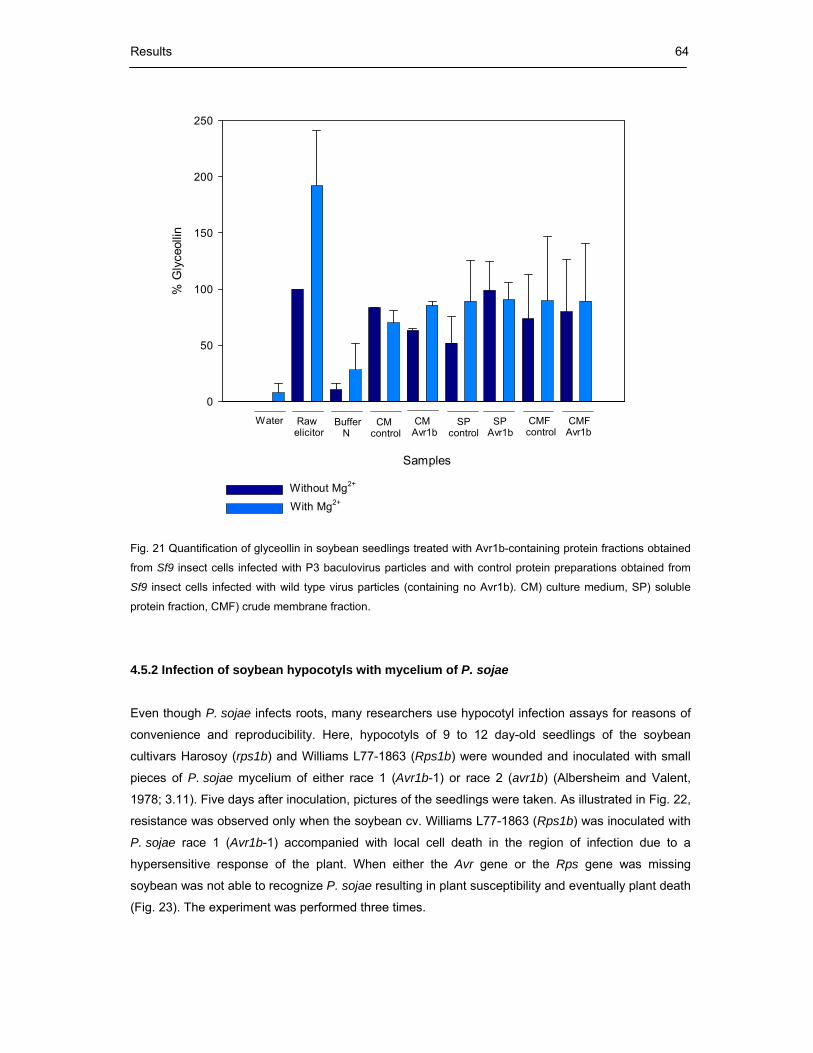
Results 64
Samples
% G
lyce
ollin
0
50
100
150
200
250
Water Rawelicitor
Buffer N
CMcontrol
SPcontrol
CMFcontrol
CMFAvr1b
CM Avr1b
SPAvr1b
Without Mg2+
With Mg2+
Fig. 21 Quantification of glyceollin in soybean seedlings treated with Avr1b-containing protein fractions obtained
from Sf9 insect cells infected with P3 baculovirus particles and with control protein preparations obtained from
Sf9 insect cells infected with wild type virus particles (containing no Avr1b). CM) culture medium, SP) soluble
protein fraction, CMF) crude membrane fraction.
4.5.2 Infection of soybean hypocotyls with mycelium of P. sojae
Even though P. sojae infects roots, many researchers use hypocotyl infection assays for reasons of
convenience and reproducibility. Here, hypocotyls of 9 to 12 day-old seedlings of the soybean
cultivars Harosoy (rps1b) and Williams L77-1863 (Rps1b) were wounded and inoculated with small
pieces of P. sojae mycelium of either race 1 (Avr1b-1) or race 2 (avr1b) (Albersheim and Valent,
1978; 3.11). Five days after inoculation, pictures of the seedlings were taken. As illustrated in Fig. 22,
resistance was observed only when the soybean cv. Williams L77-1863 (Rps1b) was inoculated with
P. sojae race 1 (Avr1b-1) accompanied with local cell death in the region of infection due to a
hypersensitive response of the plant. When either the Avr gene or the Rps gene was missing
soybean was not able to recognize P. sojae resulting in plant susceptibility and eventually plant death
(Fig. 23). The experiment was performed three times.

Results 65
Harosoy ( ( )
Control Infected Control Infected
Williams L77-1863Rps1b
Phytophthora sojae Avr1b race 1 ( -1)
Phytophthora sojae avr1brace 2 ( )
Cultivar
Isolate
rps1b)
Fig. 22 Tests on soybean hypocotyls. Hypocotyls of 9 to 12 day-old soybean seedlings of the cultivars Harosoy
and Williams L77-1863 were wounded and inoculated with small pieces of P. sojae mycelium of either race 1
(Avr1b-1) or race 2 (avr1b). Control) uninfected soybean seedlings.
Cultivar Harosoy Williams L77-1863 (rps1b) (Rps1b)
Isolate
Phytophthoa sojae
race 1 (Avr1b-1)
Phytophthora. sojae race 2 (avr1b)
Fig. 23 Gene-for-gene effects, observed after the interaction of different P. sojae races with soybean cultivars.
R) resistant plants (incompatible interaction), S) susceptible plants (compatible interaction).
S R
S S
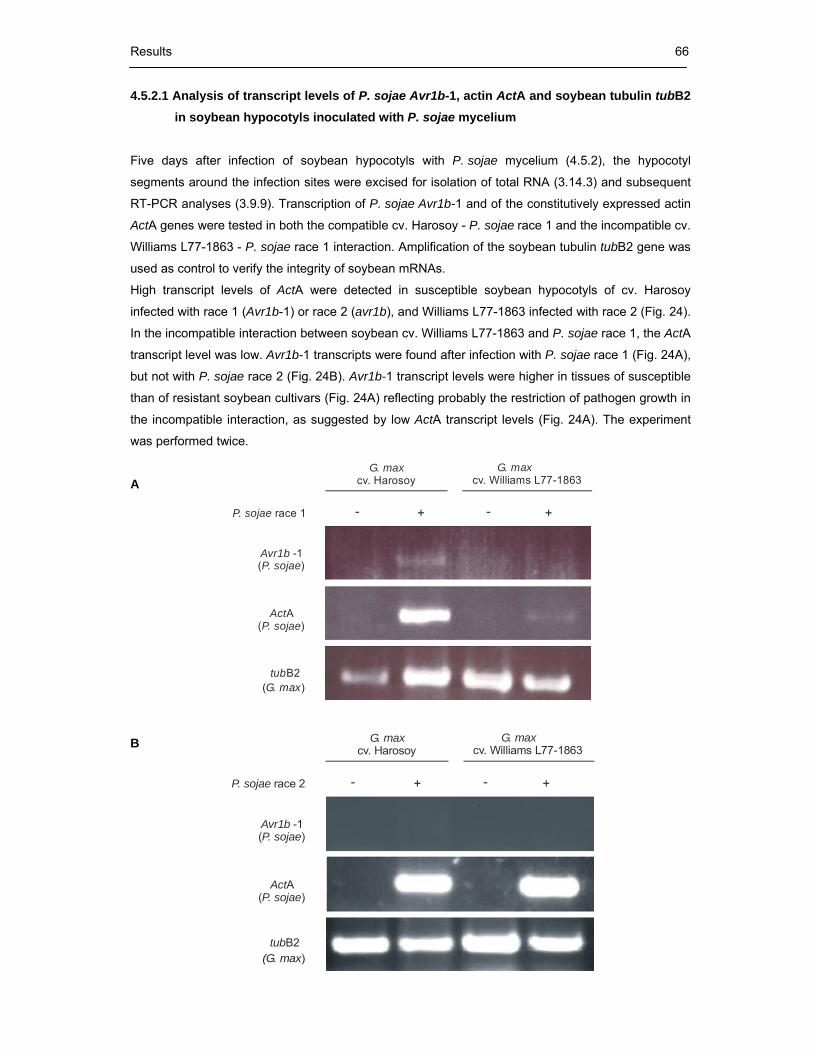
Results 66
P. sojae race 1
G. max cv. Harosoy
-- ++
Avr1b P. sojae
-1( )
ActP. sojae
A( )
tubB2
cv. Williams L77-1863
G. max
( )G. max
Avr1b P. sojae
-1( )
ActP. sojae
A( )
P. sojae race 2 -- ++
G. max cv. Harosoy
G. maxcv. Williams L77-1863
tubB2(G. max)
4.5.2.1 Analysis of transcript levels of P. sojae Avr1b-1, actin ActA and soybean tubulin tubB2 in soybean hypocotyls inoculated with P. sojae mycelium
Five days after infection of soybean hypocotyls with P. sojae mycelium (4.5.2), the hypocotyl
segments around the infection sites were excised for isolation of total RNA (3.14.3) and subsequent
RT-PCR analyses (3.9.9). Transcription of P. sojae Avr1b-1 and of the constitutively expressed actin
ActA genes were tested in both the compatible cv. Harosoy - P. sojae race 1 and the incompatible cv.
Williams L77-1863 - P. sojae race 1 interaction. Amplification of the soybean tubulin tubB2 gene was
used as control to verify the integrity of soybean mRNAs.
High transcript levels of ActA were detected in susceptible soybean hypocotyls of cv. Harosoy
infected with race 1 (Avr1b-1) or race 2 (avr1b), and Williams L77-1863 infected with race 2 (Fig. 24).
In the incompatible interaction between soybean cv. Williams L77-1863 and P. sojae race 1, the ActA
transcript level was low. Avr1b-1 transcripts were found after infection with P. sojae race 1 (Fig. 24A),
but not with P. sojae race 2 (Fig. 24B). Avr1b-1 transcript levels were higher in tissues of susceptible
than of resistant soybean cultivars (Fig. 24A) reflecting probably the restriction of pathogen growth in
the incompatible interaction, as suggested by low ActA transcript levels (Fig. 24A). The experiment
was performed twice.
A
B

Results 67
Fig. 24 Analyses of transcript levels in soybean hypocotyls by semi quantitative RT-PCR. Transcript levels of
P. sojae Avr1b-1, P. sojae actin ActA and soybean tubulin tubB2 genes were monitored using gene-specific
primers in the compatible soybean cv. Harosoy - P. sojae race 1 and the incompatible soybean cv. Williams L77-
1863 - P. sojae race 1 interactions (A), as well as in the compatible soybean cv. Harosoy or cv. Williams L77-
1863 - P. sojae race 2 interaction (B). Symbols denote: (+) soybean infected with either race 1 or race 2 as
indicated; (-) uninfected soybean.
4.5.3 Expression levels of P. sojae Avr1b-1, actin ActA and soybean tubulin tubB2 in different segments of soybean roots infected with P. sojae race 1 zoospores
In an earlier work (Hahn et al., 1985) on the spatial course of hyphae growth and glyceollin I
accumulation in infected soybean seedling roots, two P. sojae races and a single soybean cultivar
were used. The results showed large differences between resistant and susceptible plants. The
incompatible interaction was characterized by extensive colonization of the root cortex by the
oomycete at the infection site concomitantly with high glyceollin I levels. No hyphae were observed in
sections with detectable phytoalexin levels. In contrast, the compatible interaction was characterized
by extensive, unimpeded oomycete colonization of the root stele, with lesser growth in the rest of the
root. Only small amounts of glyceollin I were detected in whole root extracts during the first 14 h after
infection. By 28 h after infection the situation was reversed with the roots from the compatible
interaction containing more glyceollin I than the roots from the incompatible interaction (Hahn et al.,
1985).
Levels of mRNA and activity levels of various enzymes involved in glyceollin formation in soybean
roots increased significantly shortly after inoculation with P. sojae zoospores of an avirulent race
compared with a virulent race when the same soybean cultivar was used throughout the experiment
(Bonhoff et al., 1986a, b; Habereder et al., 1989). Conversely, there is no such detailed information
available on the time course of Avr1b-1 mRNA expression in the P. sojae - soybean interaction
(Shan et al., 2004), nor has the Avr1b-1 protein been analysed in infected soybean plants.
In this study, mRNA expression of P. sojae Avr1b-1 and actin ActA genes was studied in the
compatible soybean cv. Harosoy - P. sojae race 1 and in the incompatible soybean cv. Williams L77-
1863 - P. sojae race 1 interaction. By 24 h after infection of roots with zoospores, Avr1b-1 and ActA
mRNA were detected mainly in the basal soybean root segments (“tip” and “ring”; Fig. 5 in 3.12)
covered by zoospore suspension (Figs. 25A and 25 B). No mRNA expression was detected in the
upper root segments (“up”; Fig. 5 in 3.12) not covered by zoospore suspension (Figs. 25A and 25B).
Avr1b-1 mRNA was expressed stronger in the compatible interaction (Fig. 25A) with soybean cv.
Harosoy in comparison to the incompatible interaction (Fig. 25B) with soybean cv. Williams L77-
1863. The experiment was repeated twice.

Results 68
G. max cv. Harosoy
Area
P. sojae race 1
Up Ring Tip
+ + +
Avr1b P. sojae
-1( )
ActAP. sojae( )
B2( )G. max
tub
G. max cv. Williams L77-1863
Up Ring Tip
+ + +Area
P. sojae race 1
Avr1b P. sojae
-1( )
ActP. sojae
A( )
B2( )G. maxtub
A
B Fig. 25 Spatial course of transcript accumulation in infected soybean roots. Roots of unwounded, 3 day-old
soybean seedlings of cv. Harosoy (A) and cv. Williams L77-1863 (B) were dip-inoculated with zoospores of
P. sojae race 1. After 24 h of inoculation, root segments were excised from the ring at the water-air interface
(“ring”), above this ring (“up”) and below this ring (“tip”) according to Fig. 5 (3.12). Transcript abundance was
analysed by RT-PCR using gene-specific primers in the compatible cv. Harosoy - P. sojae race 1 (A) and the
incompatible cv. Williams L77-1863 - P. sojae race 1 (B) interaction.
4.5.4 Time course of mRNA expression in compatible and incompatible P. sojae - soybean interactions
Besides Avr1b-1, also genes encoding two enzymes of phytoalexin biosynthesis in soybean were
chosen to monitor time courses of infection-induced changes of mRNA levels of defence-related
metabolic processes in the host plant. One of the genes is coding for 4-coumarate:Coenzyme A
ligase (4CL3) (Lindermayr et al., 2002), a central enzyme in general phenylpropanoid metabolism
involved in the synthesis of one of the phytoalexin precursors. The second gene is coding for 3,9-
dihydroxypterocarpan 6a-hydroxylase (D6aH) (Schopfer et al., 1998), a hydroxylase specifically
involved in a late step of glyceollin biosynthesis (Ebel, 1998). In both interactions, the compatible
between soybean cv. Harosoy - P. sojae race 1 and the incompatible between soybean cv. Williams
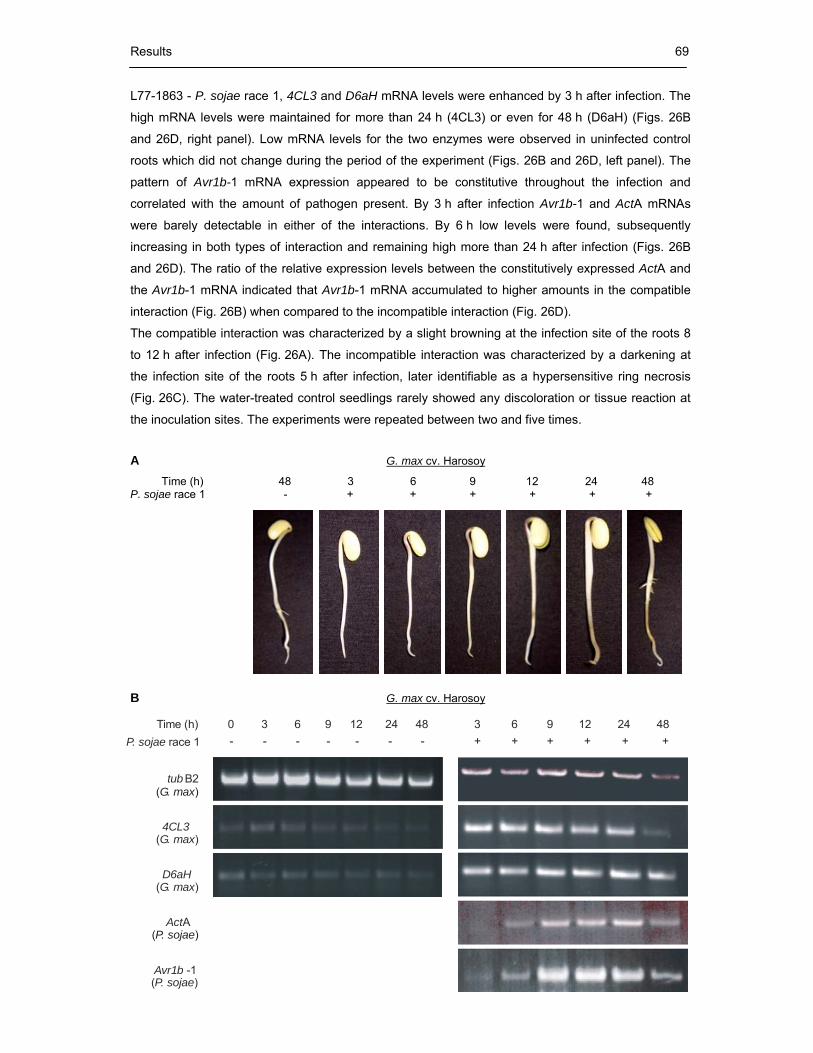
Results 69
tub B2
4CL3G. max( )
D6aHG. max( )
ActA
Avr1b P. sojae
-1( )
Time (h)P. sojae race 1
0 3 6 9 12 24 48 3 6 9 12 24 48- -- - - -- + +++ ++
( )P. sojae
( )G. max
L77-1863 - P. sojae race 1, 4CL3 and D6aH mRNA levels were enhanced by 3 h after infection. The
high mRNA levels were maintained for more than 24 h (4CL3) or even for 48 h (D6aH) (Figs. 26B
and 26D, right panel). Low mRNA levels for the two enzymes were observed in uninfected control
roots which did not change during the period of the experiment (Figs. 26B and 26D, left panel). The
pattern of Avr1b-1 mRNA expression appeared to be constitutive throughout the infection and
correlated with the amount of pathogen present. By 3 h after infection Avr1b-1 and ActA mRNAs
were barely detectable in either of the interactions. By 6 h low levels were found, subsequently
increasing in both types of interaction and remaining high more than 24 h after infection (Figs. 26B
and 26D). The ratio of the relative expression levels between the constitutively expressed ActA and
the Avr1b-1 mRNA indicated that Avr1b-1 mRNA accumulated to higher amounts in the compatible
interaction (Fig. 26B) when compared to the incompatible interaction (Fig. 26D).
The compatible interaction was characterized by a slight browning at the infection site of the roots 8
to 12 h after infection (Fig. 26A). The incompatible interaction was characterized by a darkening at
the infection site of the roots 5 h after infection, later identifiable as a hypersensitive ring necrosis
(Fig. 26C). The water-treated control seedlings rarely showed any discoloration or tissue reaction at
the inoculation sites. The experiments were repeated between two and five times.
A G. max cv. Harosoy Time (h) 48 3 6 9 12 24 48 P. sojae race 1 - + + + + + +
B G. max cv. Harosoy
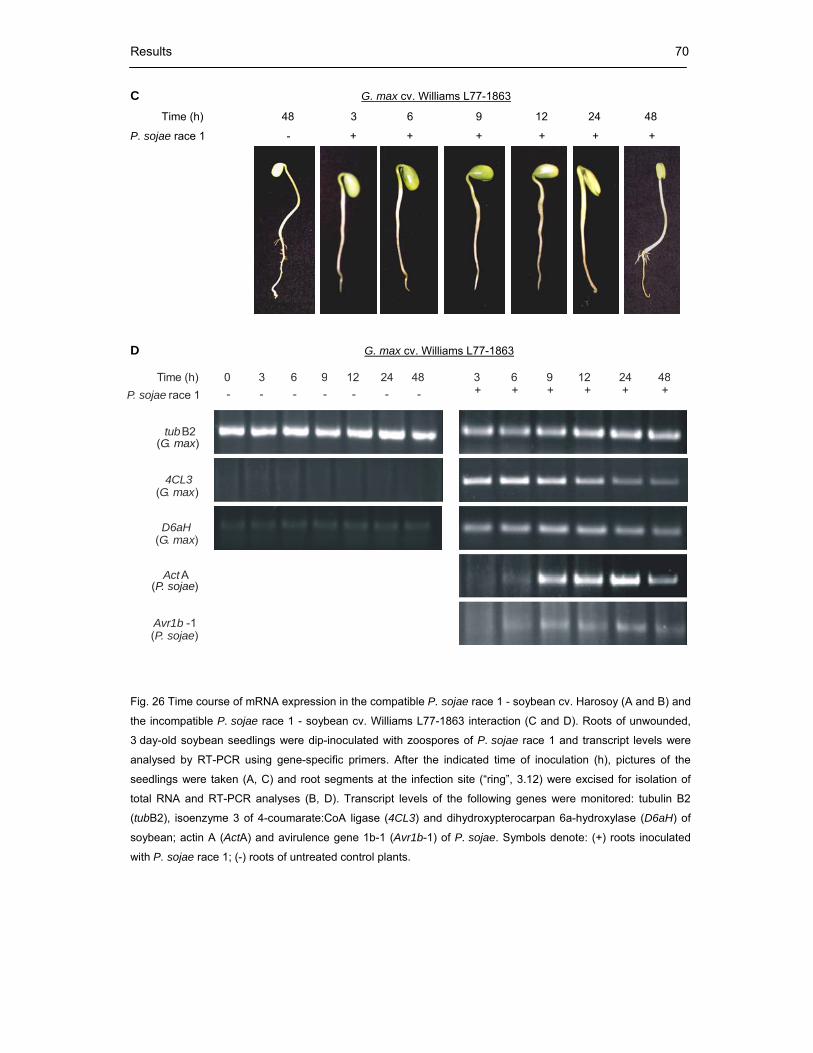
Results 70
tubB2
4CL3G. max( )
D6aHG. max( )
ActA
Avr1b P. sojae
-1( )
Time (h)P. sojae race 1
0 3 6 9 12 24 48- -- - - --
3 6 9 12 24+ +++ ++
48
( )P. sojae
( )G. max
C G. max cv. Williams L77-1863
Time (h) 48 3 6 9 12 24 48 P. sojae race 1 - + + + + + +
D G. max cv. Williams L77-1863
Fig. 26 Time course of mRNA expression in the compatible P. sojae race 1 - soybean cv. Harosoy (A and B) and
the incompatible P. sojae race 1 - soybean cv. Williams L77-1863 interaction (C and D). Roots of unwounded,
3 day-old soybean seedlings were dip-inoculated with zoospores of P. sojae race 1 and transcript levels were
analysed by RT-PCR using gene-specific primers. After the indicated time of inoculation (h), pictures of the
seedlings were taken (A, C) and root segments at the infection site (“ring”, 3.12) were excised for isolation of
total RNA and RT-PCR analyses (B, D). Transcript levels of the following genes were monitored: tubulin B2
(tubB2), isoenzyme 3 of 4-coumarate:CoA ligase (4CL3) and dihydroxypterocarpan 6a-hydroxylase (D6aH) of
soybean; actin A (ActA) and avirulence gene 1b-1 (Avr1b-1) of P. sojae. Symbols denote: (+) roots inoculated
with P. sojae race 1; (-) roots of untreated control plants.
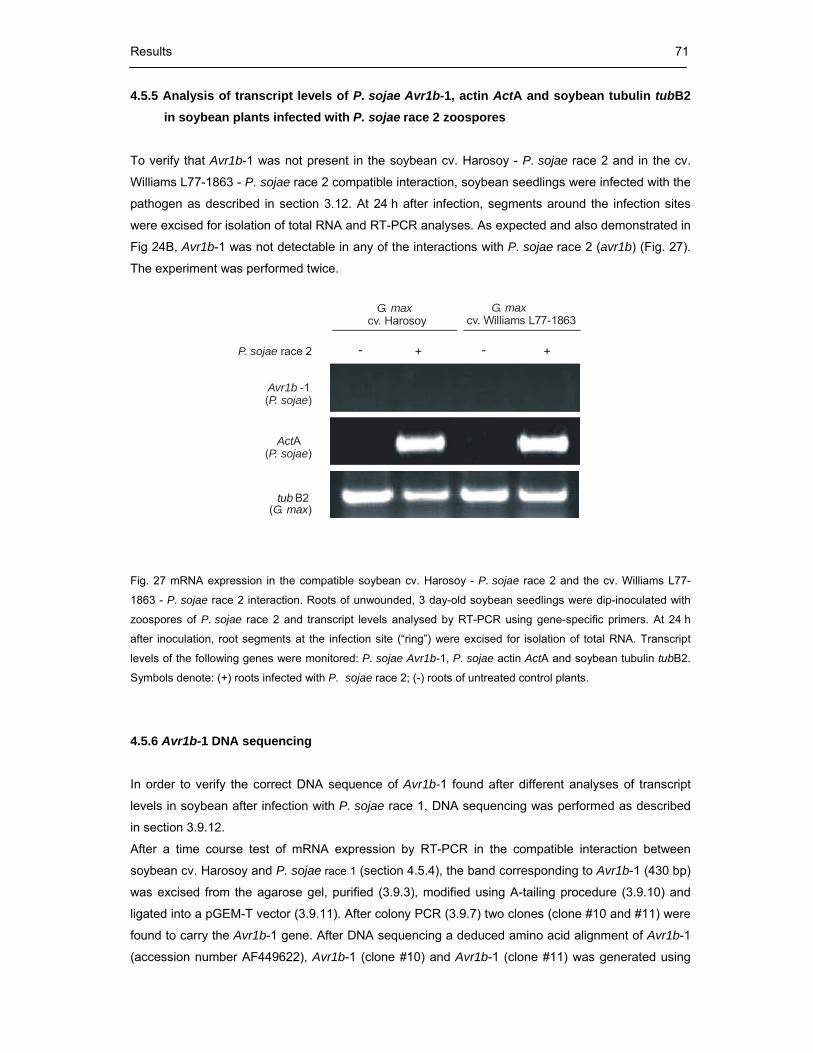
Results 71
B2
Avr1bP. sojae
-1( )
ActP. sojae
A( )
P. sojae race 2
G. max cv. Harosoy
cv. Williams L77-1863
G. max
- + +-
( )G. maxtub
4.5.5 Analysis of transcript levels of P. sojae Avr1b-1, actin ActA and soybean tubulin tubB2 in soybean plants infected with P. sojae race 2 zoospores
To verify that Avr1b-1 was not present in the soybean cv. Harosoy - P. sojae race 2 and in the cv.
Williams L77-1863 - P. sojae race 2 compatible interaction, soybean seedlings were infected with the
pathogen as described in section 3.12. At 24 h after infection, segments around the infection sites
were excised for isolation of total RNA and RT-PCR analyses. As expected and also demonstrated in
Fig 24B, Avr1b-1 was not detectable in any of the interactions with P. sojae race 2 (avr1b) (Fig. 27).
The experiment was performed twice.
Fig. 27 mRNA expression in the compatible soybean cv. Harosoy - P. sojae race 2 and the cv. Williams L77-
1863 - P. sojae race 2 interaction. Roots of unwounded, 3 day-old soybean seedlings were dip-inoculated with
zoospores of P. sojae race 2 and transcript levels analysed by RT-PCR using gene-specific primers. At 24 h
after inoculation, root segments at the infection site (“ring”) were excised for isolation of total RNA. Transcript
levels of the following genes were monitored: P. sojae Avr1b-1, P. sojae actin ActA and soybean tubulin tubB2.
Symbols denote: (+) roots infected with P. sojae race 2; (-) roots of untreated control plants.
4.5.6 Avr1b-1 DNA sequencing In order to verify the correct DNA sequence of Avr1b-1 found after different analyses of transcript
levels in soybean after infection with P. sojae race 1, DNA sequencing was performed as described
in section 3.9.12.
After a time course test of mRNA expression by RT-PCR in the compatible interaction between
soybean cv. Harosoy and P. sojae race 1 (section 4.5.4), the band corresponding to Avr1b-1 (430 bp)
was excised from the agarose gel, purified (3.9.3), modified using A-tailing procedure (3.9.10) and
ligated into a pGEM-T vector (3.9.11). After colony PCR (3.9.7) two clones (clone #10 and #11) were
found to carry the Avr1b-1 gene. After DNA sequencing a deduced amino acid alignment of Avr1b-1
(accession number AF449622), Avr1b-1 (clone #10) and Avr1b-1 (clone #11) was generated using

Results 72
Avr1b (15,8 kDa)
175,0 83,0 62,0 47,5 32,5
25,0
16,5
6,5
Sample M AF Mi SP AF Mi SP AF Mi SP M +Co
Time (h) 0 0 0 24 24 24 48 48 48
P. sojae race 1 - - - + + + + + +
kDa
Avr1b (15,8 kDa)
175,0 83,0 62,0 47,5 32,5
25,0
16,5
6,5
Sample M AF Mi SP AF Mi SP AF Mi SP M +Co
Time (h) 0 0 0 24 24 24 48 48 48
P. sojae race 1 - - - + + + + + +
kDa
175,0 83,0 62,0 47,5 32,5
25,0
16,5
6,5
Sample M AF Mi SP AF Mi SP AF Mi SP M +Co
Time (h) 0 0 0 24 24 24 48 48 48
P. sojae race 1 - - - + + + + + +
kDa
Sample M AF Mi SP AF Mi SP AF Mi SP +Co
Time (h) 0 0 0 24 24 24 48 48 48
P. sojae race 1 - - - + + + + + +
kDa
Avr1b (15,8 kDa)
175,0 83,0 62,0 47,5 32,5
25,0
16,5
Sample M AF Mi SP AF Mi SP AF Mi SP +Co
Time (h) 0 0 0 24 24 24 48 48 48
P. sojae race 1 - - - + + + + + +
kDa
Avr1b (15,8 kDa)
175,0 83,0 62,0 47,5 32,5
25,0
16,5
MultAlin and edited using BioEdit (9.4). The deduced amino acid sequences from clones 10 and 11
were identical to the deduced amino acid sequence of the Avr1b-1 gene chosen for the alignment
except at positions 254 and 335 (9.4). These results demonstrate that the band appearing at 430 bp
in the analyses of transcript levels corresponds to Avr1b-1.
4.5.7 Subcellular fractionation of infected soybean plants
One of the aims of this work was to localize Avr1b in infected soybean plants. Soybean seedlings of
cv. Williams L77-1863 were infected with P. sojae race 1 zoospores (incompatible interaction) and
root segments were excised 24 and 48 h after infection from the ring at the water-air interface for
subcellular fractionation (3.13). Out of the three fractions obtained (apoplastic fluid, microsomes and
soluble proteins), in each case 15 µg of protein were used for SDS-PAGE and subsequent silver
staining or Western blotting. As shown in Figs. 28A and 28B there is no band corresponding to Avr1b
(around 15,8 kDa) in any of the samples, probably due to the low amount of protein loaded on the
gels, with exception of the positive control (10 µg soluble protein preparation of Sf9 insect cells
containing Avr1b).
A
B
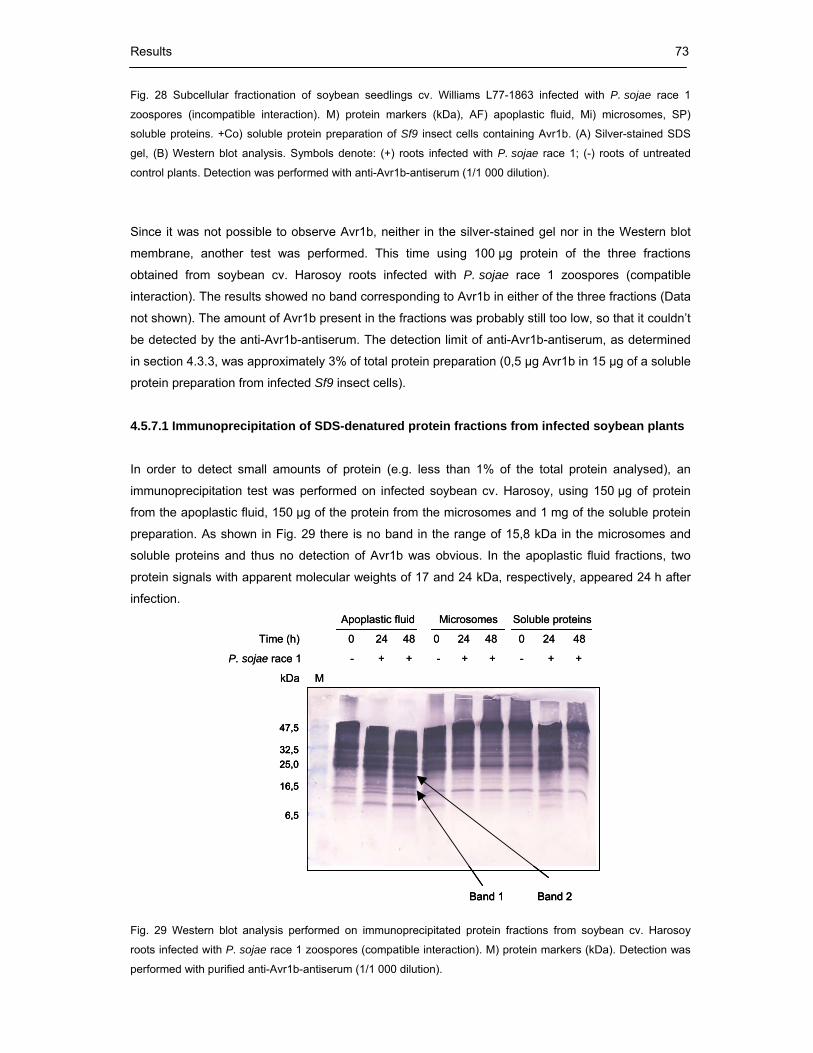
Results 73
Apoplastic fluid Microsomes Soluble proteins
Time (h) 0 24 48 0 24 48 0 24 48
P. sojae race 1 - + + - + + - + +
kDa M
47,5
32,5 25,0
16,5
6,5
Band 1 Band 2
Apoplastic fluid Microsomes Soluble proteins
Time (h) 0 24 48 0 24 48 0 24 48
P. sojae race 1 - + + - + + - + +
kDa M
47,5
32,5 25,0
16,5
6,5
Band 1 Band 2
47,5
32,5 25,0
16,5
6,5
Band 1 Band 2
Fig. 28 Subcellular fractionation of soybean seedlings cv. Williams L77-1863 infected with P. sojae race 1
zoospores (incompatible interaction). M) protein markers (kDa), AF) apoplastic fluid, Mi) microsomes, SP)
soluble proteins. +Co) soluble protein preparation of Sf9 insect cells containing Avr1b. (A) Silver-stained SDS
gel, (B) Western blot analysis. Symbols denote: (+) roots infected with P. sojae race 1; (-) roots of untreated
control plants. Detection was performed with anti-Avr1b-antiserum (1/1 000 dilution).
Since it was not possible to observe Avr1b, neither in the silver-stained gel nor in the Western blot
membrane, another test was performed. This time using 100 µg protein of the three fractions
obtained from soybean cv. Harosoy roots infected with P. sojae race 1 zoospores (compatible
interaction). The results showed no band corresponding to Avr1b in either of the three fractions (Data
not shown). The amount of Avr1b present in the fractions was probably still too low, so that it couldn’t
be detected by the anti-Avr1b-antiserum. The detection limit of anti-Avr1b-antiserum, as determined
in section 4.3.3, was approximately 3% of total protein preparation (0,5 µg Avr1b in 15 µg of a soluble
protein preparation from infected Sf9 insect cells). 4.5.7.1 Immunoprecipitation of SDS-denatured protein fractions from infected soybean plants In order to detect small amounts of protein (e.g. less than 1% of the total protein analysed), an
immunoprecipitation test was performed on infected soybean cv. Harosoy, using 150 µg of protein
from the apoplastic fluid, 150 µg of the protein from the microsomes and 1 mg of the soluble protein
preparation. As shown in Fig. 29 there is no band in the range of 15,8 kDa in the microsomes and
soluble proteins and thus no detection of Avr1b was obvious. In the apoplastic fluid fractions, two
protein signals with apparent molecular weights of 17 and 24 kDa, respectively, appeared 24 h after
infection.
Fig. 29 Western blot analysis performed on immunoprecipitated protein fractions from soybean cv. Harosoy
roots infected with P. sojae race 1 zoospores (compatible interaction). M) protein markers (kDa). Detection was
performed with purified anti-Avr1b-antiserum (1/1 000 dilution).

Results 74
To characterize the relationship of these proteins (17 and 24 kDa from the apoplastic fluid; Fig. 29) to
Avr1b, another immunoprecipitation test was performed, this time using 280 µg apoplastic fluid (24 h
after infection). Apoplastic fluid from uninfected seedlings (200 µg; 0 h) was used as negative control.
Samples were immunoprecipitated (3.8.9.2) followed by SDS-PAGE analysis (Data not shown). The
two bands corresponding to 17 and 24 kDa were excised under sterile conditions from both the
infected fraction and the negative control. Bands were analysed by mass spectrometry (LC-MS/MS).
4.5.7.2 Protein analysis by mass spectrometry After protein analysis by mass spectrometry, tryptic peptides from Avr1b were not detected in
fractions from infected plants. This indicates that Avr1b is either not present at all in infected soybean
seedlings or only in traces.
Interestingly, two tryptic peptides from soybean, ALVTDADNVIPK and GDAEPNQDELK, corresponding
to a PR-10-like protein were found in infected (after 24 h) soybean seedlings (16,5 kDa band) but not
in control seedlings (0 h).
The amino acid sequence of the PR-10-like protein was compared with other amino acid sequences
in the data base for similarities. Two starvation-associated message proteins from soybean (Glycine
max, Gm) GmSAM22 and GmSAM22-like as well as one open reading frame from soybean
(GmORF) showed high sequence homology to the PR-10-like protein. An amino acid alignment of
GmPR10-like, GmSAM22, GmSAM22-like, GmORF and of the two tryptic peptides was generated
using MultAlin and edited using BioEdit (Fig. 30).
GmPR10-like shares 92% identity to the soybean SAM22 gene. PR-10 genes have been reported
from a number of species including soybean, alfalfa, potato, lily and rice (Crowell et al., 1992;
Graham et al., 2003; Chou et al., 2004). The starvation-associated message proteins are induced by
developmental cues like senescence or by different stresses like fungal elicitors. Southern analysis
indicates that multiple copies of sequences related to SAM22 exist in the soybean genome (Crowell
et al., 1992).
The isolation of a PR-10-like protein in the apoplastic fluid of infected soybean cv. Harosoy was an
unexpected result.
10 20 30 40 50 60 70 80 ....|....|....|....|....|....|....|....|....|....|....|....|....|....|....|....| Pep ALVTDADNVIPK GmPR10like MGVFTFEDEINSPVAPATLYKALVTDADNVIPKALDSFKSVENVEGNGGPGTIKKITFLEDGETKFVLHKIESI------ GmSAM22 MGVFTFEDEINSPVAPATLYKALVTDADNVIPKALDSFKSVENVEGNGGPGTIKKITFLEDGETKFVLHKIESIDEANLG GmSAM22like ----TFEDEFNSPVAPATLYKALVTDADNVIPKALDSFKSVVNVEGNGGPGTIKKITFLEDGETKFVLHKIESIDEANLG GmORF MGIFTFEDETTSPVAPATLYKALVTDADNVIPKAVEAFRSVENLEGNGGPGTIKKITFVEDGESKFVLHKIESVDEANLG 90 100 110 120 130 140 150 ....|....|....|....|....|....|....|....|....|....|....|....|....|....|....|... Pep GDAEPNQDELK GmPR10like -------------------------ARHGGGSAGKLTVKYETKGDAEPNQDELKTGKAKADALFKAIEAYLLAHPDYN GmSAM22 YSYSVVGGAALPDTAEKITFDSKLVAGPNGGSAGKLTVKYETKGDAEPNQDELKTGKAKADALFKAIEAYLLAHPDYN GmSAM22like YSYSVVGGAALPDTAEKITFDSKLVA---------------------------------------------------- GmORF YSYSVVGGVGLPDTVEKITFECKLAAGANGGSAGKLTVKYQTKGDAQPNPDDLKIGKVKSDALFKAVEAYLLANPHYN

Results 75
Fig. 30 Comparison of amino acid sequences of a soybean pathogenesis-related protein (GmPR10-like,
accession number AAM94617), a soybean starvation-associated message protein (GmSAM22, accession
number X60043), a soybean GmSAM22-like protein (accession number CAC18803) and a soybean open
reading frame (GmORF; accession number CAA42647). The alignment was generated using MultAlin and
edited using BioEdit. Consensus amino acid residues are boxed in grey. Gaps (shown as dashes) were
introduced to emphasize the similarities between the proteins. Pep) Peptides of extracts from infected soybean
seedlings identified by LC-MS/MS.

Discussion 76
5 Discussion
5.1 Expression of Avr1b in E. coli and Sf9 insect cells
After isolation of Avr1b from P. sojae, the properties and functions of the encoded protein needed to
be investigated. Shan et al. (2004) produced Avr1b in the yeast, Pichia pastoris, and showed that the
protein triggered a hypersensitive response when infiltrated into soybean leaves, however this
expression system was not sufficiently reliable (B. Tyler, personal communication). For this reason,
two different expression systems were established in the present work by using E. coli and Sf9 insect
cells. Avr1b obtained after heterologous synthesis in either of the systems showed no biological
activity on soybean roots. This lack of activity might be attributed to incorrect post-translational
modifications or folding, mislocalization or to the absence of additional plant factors required for the
delivery or maturation of the protein in the heterologous expression system. Problems in finding an
adequate expression system are not uncommon. This problem has been experienced for example in
the case of FLS2. Flagellin sensitive 2 is a receptor in Arabidopsis thaliana that recognises and binds
the elicitor-active epitope flg22 from the bacterium flagellum (Felix et al., 1999). Attempts to produce
FLS2 in cells from other kingdoms such as E. coli, Pichia pastoris and human embryonic kidney cells
did not lead to the accumulation of a functional flg22 binding site. The functionality of the FLS2
receptor was tested successfully only by heterologous production in tomato (Lycopersicon
esculentum) (Chinchilla et al., 2006).
5.2 Avr1b expression in compatible and incompatible P. sojae - soybean interactions
Many investigations have shown highly dynamic changes in gene expression of plant hosts and
microbial aggressors after infection. In a model for plant-oomycete interactions, the Arabidopsis-
downy mildew pathosystem, several host resistance (R) genes were isolated and host responses to
infection by Hyaloperonospora parasitica were characterized (Holub, 2001; Slusarenko and Schlaich,
2003). To describe the “interaction transcriptome” in plant-pathogen interactions (Birch and Kamoun,
2000), patterns of overall transcriptional profiles of soybean and P. sojae at the infection interface
were analysed (Moy et al., 2004). In these studies, it was confirmed that soybean genes encoding
enzymes of phytoalexin biosynthesis, among others, were strongly upregulated with highest
expression levels occurring 24 h after infection. Furthermore, the number of pathogen genes
expressed during infection reached a maximum at 24 h. It was concluded that in the soybean -
P. sojae interaction the pathogen transits from biotrophy to necrotrophy between 12 and 24 h after
infection (Moy et al., 2004). It was reported that a considerable number of upregulated genes of the
pathogen was probably involved in virulence or avirulence such as proteinases, glucanases, elicitins
and others (Moy et al., 2004).

Discussion 77
A gene which has been proposed to control race-specificity between soybean and P. sojae, and
which was not included in the analyses mentioned above, is Avr1b-1. Avr1b-1, the first avirulence
gene from an oomycete to be cloned, is expressed in a race- and infection-specific manner (Shan et
al., 2004). For the comparison of the expression of this avirulence gene with early induced plant
defences, two genes encoding phytoalexin biosynthesis enzymes 4CL3 and D6aH (Ebel and
Grisebach, 1988; Lindermayr et al., 2002; Schopfer et al., 1998) were selected in this work. The
results showed that the expression of the defence-related genes, 4CL3 and D6aH, was strongly
enhanced at the earliest time point of 3 h (4.5.4). The high mRNA levels were maintained for more
than 24 h (4CL3) or even for 48 h (D6aH). Conversely, expression of Avr1b-1 appeared to be
constitutive throughout the infection and to correlate with the amount of pathogen present. Three
hours after inoculation, Avr1b-1 mRNA might have escaped detection because of the low number of
hyphae present at the site of root infection. It could also be possible that expression of the gene
started several hours later than expression of the phytoalexin biosynthesis genes. Expression of
P. sojae Avr1b-1 and actin genes 24 h after infection was detected mainly in the basal soybean root
segments covered by the zoospore suspension (Figs. 25A and 25 B). No mRNA expression was
detected in the upper root segments not covered by zoospore suspension (Figs. 25A and 25B). The
time course of Avr1b-1 expression was similar in the compatible and incompatible interaction starting
at 3 h post infection. The amount of Avr1b-1 mRNA was higher than the amount of ActA mRNA used
as an internal control in the compatible interaction. In contrast, in the incompatible interaction the
amount of Avr1b-1 mRNA was lower than the amount of ActA mRNA (Figs. 26B and 26D).
A reason for the difference in the patterns of Avr1b-1 and defence-related gene expression could be
that Avr1b-1 is not required during the initial but during the intermediate biotrophic phase of P. sojae
until host cell death occurs. In this case, other factors mediating initial recognition of the pathogen by
the host plant with subsequent induction of genes involved in early defence responses like those
encoding enzymes of phytoalexin production would be required. Because defence responses occur
in both compatible and incompatible interactions, factors for initial pathogen recognition might be
race non-specific and might be present at the onset of infection, such as some of the general elicitors
localized in the cell wall of the pathogen including the oligo-β-glucoside motif of the β-glucan
structural polysaccharide (Albersheim and Valent, 1978; Ebel, 1998; Sharp et al., 1984a, b). β-
Glucan elicitors induce rapid K+ and Ca2+ fluxes leading to depolarization of the plasma membrane
potential of soybean root cells within a few minutes after application of the stimulus (Mithöfer et al.,
2005). These changes may represent early signaling events initiating several inducible defence
responses (Ebel and Grisebach, 1988; Lindermayr et al., 2002; Mohr and Cahill, 2001). Therefore
resistance or susceptibility of soybean towards P. sojae may depend on more than one factor.
In order to find whether the relative timing of expression of defence-related genes, such as
phytoalexin biosynthesis genes, and of Avr1b, is more common and might also apply to other
defence genes, further experiments should be performed. One candidate gene could be that
encoding the PR-10-like protein.
Discussion 78
A more favorable way to compare compatible and incompatible interactions in a specific plant -
pathogen system is to choose one plant cultivar and two pathogen races. In the work of Hahn et al.
(1985), a detailed analysis of a single soybean cultivar showed marked differences in the dynamics
and sites of accumulation of glyceollin following infection of roots with zoospores of a virulent
(compatible interaction) and an avirulent race (incompatible interaction). The use of two separate
cultivars of soybean, although differing in resistance to P. sojae, can complicate the direct
comparison of changes in terms of host specificity (Habereder et al., 1989). In this study (section
4.5), two different soybean cultivars and two P. sojae races were choosen to compare compatible
and incompatible interactions. In order to simplify the experiments and to obtain clearer differences
when comparing these two types of interaction, it should have been preferable to choose only one
soybean cultivar, Williams L77-1863 and races 1 and 2 of P. sojae in the time course of mRNA
expression (4.5.4). However race 2 of P. sojae does not encode for Avr1b. The better choice to study
the function and properties of Avr1b would then be to use two near isogenic lines of soybean and
race 1 (Avr1b) of P. sojae.
5.3 Localization and recognition of Avr proteins
It is known that bacterial plant pathogens secrete effector proteins like avirulence (Avr) proteins into
the host plant cytoplasm via the type III secretion system (TTSS) (Van der Ackerveken et al., 1996;
Lahaye and Bonas, 2001). Inside the plant cell, effector proteins can be recognized directly or
indirectly by the corresponding resistance (R) proteins. How eukaryotic pathogens of plants such as
fungi and oomycetes are detected by plant cells is not fully understood yet.
The interaction between effector proteins from tomato and the fungus Cladosporium fulvum appears
to be extracellular. Tomato resistance proteins (Cf proteins) recognize fungal Avr peptides secreted
into the leaf apoplast during infection. A direct interaction of Cf proteins with their corresponding Avr
proteins has not been demonstrated and the molecular mechanism of Avr protein perception is not
known yet. Cf proteins lack an obvious signaling domain, suggesting that defence response
activation is mediated through interactions with other partners (De Wit et al., 2002; Rivas and
Thomas, 2005).
In the plant-pathogen system rice-Magnaporthe grisea, a direct interaction between the R Pi-Ta
protein and the Avr Pi-Ta protein was demonstrated using the yeast two hybrid (YTH) and in vitro
systems suggesting that the Avr protein enters the plant cell (Jia et al., 2000).
Rust, mildew fungi and oomycetes including Phytophthora species form specialized feeding
structures called haustoria that penetrate the host plant cell wall but remain separated from the host
cytoplasm by a double membrane. Avr genes (including Avr1b-1, Shan et al., 2004) from some of
these haustorium-forming eukaryotic pathogens have been cloned (Allen et al., 2004; Armstrong et
al., 2005; Rehmany et al., 2005) and proved to encode small proteins with N-terminal secretion
signals. In flax rust fungi, it has been shown that Avr gene expression occurs in haustoria and their
products are recognized inside plant cells (Dodds et al., 2004; Catanzariti et al., 2006). Although it
has not been demonstrated this could also be the case for some oomycetes.
Discussion 79
Because engineering of genes in pathogenic microorganisms is not available or difficult to achieve,
Agrobacterium tumefaciens-mediated or biolistic transient expression analyses of the cloned
avirulence genes have been used to confirm indirectly avirulence functions of the cloned genes by
inducing HR in host plants (Allen et al., 2004; Rehmany et al., 2005; Armstrong et al., 2005).
Expression of truncated forms of some of these genes, e.g. ATR13 from H. parasitica (formerly
named Peronospora parasitica) (Allen et al., 2004) and Avr3a from P. infestans (Armstrong et al.,
2005) lacking the secretion signal also induced HR. These data have been interpreted as indication
that the two avirulence proteins are detected in the host cytoplasm, which would be consistent with
the presumed cytoplasmic localization of the corresponding R proteins (RPP13 and R3a,
respectively).
Here it was shown that expression of Avr1b-1 occurs only in infected plants, but not in P. sojae
zoospores or in the mycelium of race 1 at different growth stages (4.4). To localize Avr1b,
immunoblot and mass spectrometric analyses were performed on infected soybean plants (4.5.7).
Avr1b-1 could not be detected either in the microsomes or in the soluble protein fraction from
infected soybean seedlings in immunoblot analyses (Fig. 29). However two adjacent bands at the
range of 17 kDa and 24 KDa were observed in the apoplastic fluid fraction of infected, but not in
control plants. These two bands were analysed by mass spectrometry. Tryptic peptides from Avr1b-1
were not detected in fractions from infected plants, indicating that Avr1b-1 is either not present at all
in infected soybean seedlings 24 h after infection or only in traces and cannot be detected by the
experimental techniques used in this work. Thus both methods failed to localize Avr1b-1 in infected
plants.
5.4 Biological tests 5.4.1 Biotests on soybean using different protein preparations
In order to defend themselves against microorganisms, among other strategies, plants synthesize
phytoalexins restricting the growth of a wide variety of pathogens by recognizing structural
components of the cell walls of fungi and oomycetes. Since these components are essential for the
survival of the microorganisms they cannot evade detection by altering the structure of these
components (Albersheim and Valent, 1978). Soybean tissues accumulate the phytoalexin glyceollin
in response either to infection with P. sojae or to β-glucan elicitors present in P. sojae cultures (Ayers
et al., 1976a, b; Albersheim and Valent, 1978; Hahn et al., 1985; Ebel et al., 1986).
To know if glyceollin also accumulates in soybean after treatment with Avr1b-1 (obtained either from
E. coli or Sf9 insect cells), biological tests were performed here. Soybean seedlings were treated with
the recombinant protein and glyceollin was measured as a component of the soybean defence
mechanism.
The results showed that Avr1b-1 obtained as recombinant protein from E. coli (4.1.1) or Sf9 insect
cells (4.2.2) had no biological activity on soybean seedlings 24 h after inoculation when assayed at
concentrations of approximately 10 µg/ml (Avr1b purified from E. coli cells) or 1mg/ml (Sf9 insect cell
Discussion 80
fractions containing Avr1b) (4.5.1). Probably Avr1b-1 concentration was not high enough to induce a
measurable response in inoculated plants. Another explanation could be that due to the presence of
the signal peptide, Avr1b-1 may not interact with other proteins which could be required for
recognition. This is the case for ATR1NdWsB from H. parasitica (Rehmany et al., 2005) which cannot
be recognized by the host plant when its signal peptide is present. In contrast, the ATR13 protein
from H. parasitica, can be recognized equally with or without its signal peptide (Allen et al., 2004)
indicating that the signal peptide does not physically interfere with ATR13 recognition. Here, Avr1b-1
lacking the putative signal peptide was not produced as recombinant protein and thus the possible
interference of the putative signal peptide with Avr1b-1 recognition has not been analysed.
The major problem in performing biotests was the reproducibility. Since glyceollin concentrations
varied in the reproduced experiments, an internal positive control (raw elicitor) as well as negative
controls (water and different buffers) were also used in the biotests in order to compare the different
experiments. Another important task was to avoid microbial contamination during the experiments,
which was problematic since it was not possible to keep a sterile environment in the phytochamber.
In order to avoid undesired contamination, seeds were desinfected before being planted on
autoclaved vermiculite and only sterile water was used for watering the plants. During the biotests,
unwounded seedlings were treated by putting them in reaction tubes containing antibiotics (10 mg/ml
gentamicin) together with the different protein preparations. The tubes were placed in a sterile plastic
box with some sterile water for keeping a humid environment.
5.4.2 Biotests on soybean hypocotyls using mycelium of P. sojae
Wounded hypocotyls inoculated with mycelia or zoospore suspensions of P. sojae have been used in
previous studies on inducible glyceollin and lignin accumulation, and of the hypersensitive response
(HR) in the soybean - P. sojae interaction. The results showed large differences between susceptible
and resistant plants. Incompatible responses of soybean hypocotyls included the formation of dark
lesions, HR and pathogen restriction. Compatible interactions produced light coloured, water-soaked
lesions and sporulation and spread of the pathogen (Ayers et al. 1976a; Moesta et al., 1983; Mohr
and Cahill, 2001).
Here, resistance was observed only when the soybean cv. Williams L77-1863 (Rps1b) was
inoculated with P. sojae race 1 (Avr1b-1). This incompatible interaction was characterized by HR
surrounded by healthy tissue and pathogen restriction. Compatible interactions were observed on cv.
Harosoy (rps1b) after infection with P. sojae races 1 (Avr1b-1) or 2 (avr1b) and on cv. Williams L77-
1863 (Rps1b) after infection with P. sojae race 2 (avr1b) resulting in dark brown lesions and stop of
plant growth. Pathogen spread was characterized by growth of hyphae in the plant as described
before (Mohr and Cahill, 2001). These results are in accordance with the gene-for-gene hypothesis
(Flor, 1956; Flor, 1971) which proposes that resistance occurs only when the R protein from the plant
recognizes the Avr protein from the pathogen. When either the R or the Avr protein is missing, the
plant is not able to recognize the pathogen resulting in plant susceptibility and eventually plant death.

Discussion 81
Analyses of transcript levels revealed expression of ActA and Avr1b-1 when the susceptible soybean
cv. Harosoy (rps1b) was infected with P. sojae race 1 (Avr1b-1). The resistant soybean cv. Williams
L77-1863 (Rps1b) was able to restrict the growth of P. sojae shown by the low transcript level of the
constitutive ActA gene of P. sojae (Fig. 24A).
A clear difference between the hypocotyl and the zoospore assay is that in the hypocotyl test,
P. sojae race 1 mycelium does not cause a heavy infection on plants even 5 days after infection as
demonstrated by the low transcript levels of ActA and Avr1b-1 in soybean (Fig 24A). In contrast, in
the zoospore test, the zoospores of P. sojae race 1 infect soybean roots starting 3 hpi with high
transcript levels of both ActA and Avr1b-1 in the compatible, but relatively low Avr1b-1 level in the
incompatible interaction (Figs. 25 and 26).
5.5 The RXLR motif present in different oomycetes
Cloning of six highly divergent alleles of ATR1NdWsB from eight downy mildew isolates, of avirulence
genes from P. sojae (Avr1b-1) and P. infestans (Avr3a) and of numerous other oomycete genes has
shown that the proteins they encode share a highly conserved motif (“RXLR”) (Fig. 31; Rehmany et
al., 2005; Armstrong et al., 2004). The position of the RXLR residues in the “in planta-induced” IPI-O
proteins from P. infestans is interesting because it overlaps the RGD tripeptide cell adhesion motif
(Senchou et al., 2004). The RXLR motif is also found in more than forty diverse secreted P. infestans
proteins (S. Kamoun, unpublished data) and more than hundred predicted secreted proteins from
each of the genome sequences of P. sojae and P. ramorum with weak sequence similarity to Avr1b-1
(B.M. Tyler, unpublished data). No cysteine-rich proteins from oomycetes have been found that carry
the RXLR motif. Therefore, proteins carrying the RXLR motif differ from cysteine-rich class proteins
implicated in fungus-plant and oomycete-plant interactions (Templeton et al., 1994).
The RXLR motif shares some similarities with the recently described host-targeting signal, which is
conserved in numerous proteins from malaria parasites (Plasmodium species) and required for
translocation of the proteins into the host cell (Hiller et al., 2004; Marti et al., 2004). Since ATR1NdWsB
and Avr3a have been detected in the cytoplasm of host plant cells, Rehmany et al. (2004) proposed
that the RXLR motif may also play a role in translocating secreted oomycete proteins into the host
plant cells. However this hypothesis has not yet been tested experimentally in the soybean - P. sojae
interaction.
In this work, the recombinant Avr1b-1 protein from P. sojae obtained after heterologous synthesis in
E. coli or Sf9 insect cells showed no biological activity in the soybean cv. Harosoy 1372 (Rps1b).
Since the soybean seedlings were incubated with protein preparations containing Avr1b-1 in reaction
tubes for 24 h, it is conceivable that the protein was not properly delivered inside the plant and as a
result no defence reaction was seen (no glyceollin induction, 4.5.1).
In the case of bacteria, effector proteins are delivered inside the host plant cell via a type III secretion
system (TTSS) and they are recognized by the corresponding R proteins (Lahaye and Bonas, 2001).
However such a mechanism has not been found in oomycetes, and as a consequence the mode of

Discussion 82
translocation of the oomycete avirulence proteins inside the host plants is not fully understood yet. If
like the case of Plasmodium species, the RXLR motif plays a role in protein translocation, avirulence
genes such as Avr1b-1 (containing point mutations inside the RXLR motif or not) should be fused to
a gene encoding a green or yellow reporter fluorescent protein (GFP and YFP). If the motif is really
required for translocating Avr1b-1, the reporters will accumulate inside the soybean cells. The
advantage of this technique might reside in the sensitivity for in situ detection and thus localization of
the target protein.
The identification of further oomycete proteins that enter the plant cell, their functions and protein-
uptake mechanisms will be an interesting area for development and for understanding the basis of
plant pathogenesis. These insights could provide novel control methods through genetics or targeted
chemicals to control this important and destructive class of plant disease-causing organisms (Ellis et
al., 2006).
Fig. 31 The RXLR motif. (A) Graphic representation of the sequence alignment shown below in B. The height of
each amino acid symbol indicates its frequency at that position. The amino acids leucine (L) and arginine (R)
(red) and acidic amino acids (green) are highlighted. (B) Alignment of the N-terminal regions of predicted protein
sequences of ATR1NdWsB from H. parasitica (Hp) isolate Emoy2, AVR3a (Armstrong et al., 2005) from
P. infestans (Pi), Avr1b-1 (Shan et al., 2004) from P. sojae (Ps), secreted Pi proteins MY-20-B-07 (Kamoun et
al., 1999), IPI-O1 and IPI-O2 (Pieterse et al., 1994) (IPI-O proteins are identical in this region), a predicted Hp
secreted protein from BAC sequence 12I13, putative Pi PEXs from BACs 14M19 (GenBank accession number
AC146943) and 34A11 (GenBank accession number AC147544), and secreted Ps proteins 3-9f-HA and 1-6b-
ZO (Qutob et al., 2002). Dashes indicate gaps in the alignment. Predicted signal peptides (blue), the RXLR motif
(red), acidic amino acids (green) and the RGD tripeptide motif (underlined) are highlighted. (Figure taken from
Rehmany et al., 2005)
5.6 Pathogenesis related proteins found in infected soybean seedlings Pathogenesis related (PR) proteins were first detected in tobacco cultivars reacting hypersensitively
to tobacco mosaic virus (Van Loon and Van Kammen, 1970) and later also in various plant species
on infection with viruses, viroids, fungi, bacteria and oomycetes as well as during specific
Discussion 83
developmental stages of plants like senescence (Van Loon, 1985). They have in common low
molecular weights, extreme isoelectric points and high resistance to endogenous plant proteinases.
Although the biological and biochemical functions of many PR proteins remain unknown, some have
been shown to possess antimicrobial activity. In vitro studies of chitinases (PR-3 class) and β-1,3-
glucanases (PR-2 class) have shown that these proteins can inhibit fungal growth (Mauch et al.,
1988; Sela-Buurlage et al., 1993) presumably by hydrolytic degradation of fungal cell walls.
The PR-10 class of proteins, first identified as a major pollen allergen (BetV-1) from white birch, is
induced following pathogen attack in a wide variety of plant species such as parsley (Somssich et al.,
1986), potato (Matton and Brisson, 1989), pea (Barral and Clark, 1991), soybean (Crowell et al.,
1992), asparagus (Warner et al., 1994), sorghum (Lo et al., 1999) and rice (McGee et al., 2001).
In soybean, transcripts of GmPR10 were induced in both compatible and incompatible soybean-
Pseudomonas syringae pv. glycinea interactions (Chou et al., 2004). PR-10 proteins show structural
similarity to ginseng ribonuclease and therefore ribonuclease activity has been proposed. In fact, a
PR-10-like protein from white lupin roots was shown to possess ribonuclease activity (Bantignies et
al., 2000).
Accumulation of the PR protein “SAM22” (starvation associated messenger) has been reported to
occur in young leaves after wounding, by transpiration-mediated uptake of salicylic acid, methyl
viologen, hydrogen peroxide, sodium phosphate or after treatment with fungal elicitor. SAM22 also
accumulates in the roots of very young soybean seedlings and cotyledonous tissue (Crowell and
Amasino, 1991; Crowell et al., 1992). PR-10 proteins have also been found on needle tissues of
white pine after wounding or after infection with the fungus Cronartium ribicola (Liu et al., 2003).
Here, in an attempt to localize Avr1b-1 via an indirect approach (immunoprecipitation) in soybean
seedlings infected with P. sojae, a PR protein was fortuitously found (4.7.2). The susceptible
soybean cv. Harosoy (rps) was infected with zoospores of P. sojae race 1 (Avr1b-1). Twenty-four
hours after infection the apoplastic fluid was immunoprecipitated before electrophoresis, immunoblot
and mass spectrometric analyses. Instead of the expected Avr1b-1 in the apoplastic fluid fraction, a
GmPR10-like protein with a relative molecular mass similar to Avr1b-1 (15,8 kDa) was found. This
was an unexpected and interesting result and it demonstrates that 24 h after infection, the
susceptible cv. Harosoy (rps) responds to the pathogen attack by activating its basic defence
responses. The multicomponent defence response of soybean plants in response to a P. sojae
infection involves not only glyceollin (Ayers et al., 1976a, b; Albersheim and Valent, 1978; Hahn et
al., 1985; Ebel et al., 1986) and lignin- like compounds (Mohr and Cahill, 2001), but also PR proteins
as shown here and before (Crowell and Amasino, 1991; Crowell et al., 1992). Furthermore, an amino
acid alignment showed that the PR-10-like protein shares high sequence homology to another PR
protein, the GmSAM22 (Fig. 30).
Outlook 84
6 Outlook
Avr1b-1 was demonstrated to be expressed in a race- and infection-specific manner, but its putative
role in virulence still remains unclear. Attempts to prove the biological activity of Avr1b-1 in soybean
were not successful. In order to better understand the interaction of Avr1b-1 with the resistance
protein of soybean, Rps1b, and to clarify the function of the signal peptide of Avr1b-1, further
experiments need to be performed.
One possibility would be a cobombardment of Rps1b-containing soybean plants with two vectors, the
one expressing Avr1b-1 (with and without the signal peptide) and the other expressing a green
fluorescent protein (GFP). After recognition of Avr1b-1 by Rps1b, a hypersensitive response
(resistance) will be observed simultaneously with a reduction of fluorescence due to cell death.
Recognition of Avr1b-1 with a N-terminal signal peptide would demonstrate that the signal peptide
does not interfere with binding of Rps1b or other target proteins.
Once Rps1b of soybean will be cloned, coinfiltration of Nicotiana benthamiana leaves with an
Agrobacterium tumefaciens strain, carrying a construct expressing Rps1b and another strain
expressing Avr1b-1 (with and without the signal peptide) would also be possible. Resistance may
occur when Rps1b binds Avr1b-1 and the resulting hypersensitive response could be observed as a
necrotic area in the infiltrated leaves. This experiment would only be successful if in the host plant
soybean, the mechanism of action involves a direct interaction between Avr1b-1 and Rps1b. Direct
interactions between pathogen Avr proteins and plant R proteins have been demonstrated only in a
few cases (Scofield et al., 1996; Tang et al., 1996; Jia et al., 2000).
Another possibility would be the transformation of Avr1b-1 in P. sojae (avr1b) strains virulent on
soybean. Soybean plants containing Rps1b will be able to recognize Avr1b-1 after infection with the
transformed P. sojae (Avr1b-1) strains leading to hypersensitive response and eventually plant cell
death.
In order to localize Avr1b-1, a tagged version of the protein (Avr1b-1 tagged to a GFP protein) could
be expressed in Phytophthora. Localization studies and purification of the avirulence protein might be
possible in soybean seedlings infected with the pathogen.
Summary 85
7 Summary
After the isolation of Avr1b-1 from P. sojae (Shan et al., 2004), it was necessary to investigate the
properties, functions and localization of the encoded protein in infected soybean plants. Thus
Avr1b-1 containing a N-terminal putative signal peptide was produced as recombinant protein in
E. coli and in Sf9 insect cells. A 6xHis-tagged Avr1b-1 was produced only in form of insoluble
inclusion bodies in E. coli cells. The protein was then purified under denaturing conditions or by
protein refolding in order to test its biological activity in soybean plants and to raise an anti-Avr1b-
antiserum. The antiserum was purified and used to detect Avr1b-1 in P. sojae mycelium and in
infected soybean tissues by Western blotting. It was also used to co-precipitate Avr1b-1 from
different soybean fractions in immunoprecipitation tests with subsequent mass spectrometric and
Western blot analyses for localization of the protein. Only in apoplastic fluid fractions from infected
soybean seedlings a band corresponding to the molecular weight of Avr1b-1 was detected in
immunoblot analyses. Analysing this band by mass spectrometry did not lead to the identification of
the protein, indicating that Avr1b-1 is either not present at all in infected soybean seedlings 24 h after
infection or is present only in traces.
In Sf9 insect cells, Avr1b-1 containing the putative signal peptide was produced as recombinant
protein. Avr1b-1 without the signal peptide was not produced so that it was not possible to study the
role of the signal peptide in further experiments. Western blot and MS analyses of a soluble protein
fraction obtained after fractionation of Sf9 insect cells showed a clear band of Avr1b-1 at 15,8 kDa
and was used as a positive control in further experiments.
To study basic defence responses of soybean upon infection with P. sojae and the race-specific
interaction between the plant and its pathogen, Avr1b-1 was used as elicitor. For determining basic
defence responses, glyceollin accumulation was measured in soybean seedlings inoculated with
recombinant Avr1b-1 obtained after heterologous synthesis in E. coli or in Sf9 insect cells. Avr1b-1
did not induce accumulation of glyceollin in soybean seedlings 24 h after inoculation.
For elucidating the race-specific interaction, soybean seedlings were infected with mycelium or with
zoospores from P. sojae race 1, and total RNA of soybean was analysed by RT-PCR. Expression of
P. sojae Avr1b-1 and actin mRNA 24 h after infection was detected mainly in the basal but not in the
upper soybean root segments. The time course of Avr1b-1 expression was similar in the compatible
and incompatible interaction. The amount of Avr1b-1 mRNA was higher than the amount of ActA
mRNA used as an internal control in the compatible interaction. In contrast, in the incompatible
interaction the amount of Avr1b-1 mRNA was lower than the amount of ActA mRNA.
Summary 86
Comparing expression of Avr1b-1 with early induced plant defences like expression of two enzymes
(4CL3, D6aH) for phytoalexin biosynthesis, the mRNAs of the defence-related genes 4CL3 and
D6aH were strongly enhanced 3 h after infection. Expression of Avr1b-1 mRNA was barely
detectable at 3 h but was enhanced 6 h after infection. A reason for the difference in the patterns of
Avr1b-1 and defence-related gene expression could be that Avr1b-1 is not required during the initial
but during the intermediate biotrophic phase of P. sojae until host cell death occurs.
To investigate if Avr1b-1 is produced in P. sojae before or after plant infection, the mycelium of the
oomycete was fractionated before infection, followed by immunoblot analyses. Furthermore, total
RNA from P. sojae race 1 mycelium, zoospores and from soybean seedlings infected with P. sojae
race 1 zoospores was extracted followed by RT-PCR. The results showed that Avr1b-1 is expressed
only after infection of the plant.

References 87
8 References
Agrios, G.N. (1997) Plant Pathology. Elsevier Academic Press. 4th edition.
Albersheim, P. and Valent, B. (1978) Host-pathogen interactions in plants. Plants, when exposed to
oligosaccharides of fungal origin, defend themselves by accumulating antibiotics. J. Cell Biol. 78,
627-643.
Allan, A.C. and Fluhr, R. (1997) Two distinct sources of elicited reactive oxygen species in tobacco
epidermal cells. Plant Cell 9, 1559-1572.
Allen, R.L., Bittner-Eddy, P.D., Grenville-Briggs, L.J., Meitz, J.C., Rehmany, A.P., Rose, L.E. and
Beynon, J.L. (2004) Host-parasite coevolutionary conflict between Arabidopsis and downy mildew.
Science 306, 1957-1960.
Anderson, T.R. and Buzell, R.I. (1992) Inheritance and linkage of the Rps7 gene for resistance to
Phytophthora rot of soybean. Plant Dis. 76, 958-959.
Antelo, L., Cosio, E.G., Hertkorn, N. and Ebel, J. (1998) Partial purification of a GTP-insensitive
(1→3)-β-glucan synthase from Phytophthora sojae. FEBS Lett. 433, 191-195.
Armstrong, M.R., Whisson, S.C., Pritchard, L., Bos, J.I.B., Venter, E., Avrova, A.O., Rehmany, A.P.,
Böhme, U., Brooks, K., Cherevach, I., Hamlin, N., White, B., Fraser, A., Lord, A., Quail, M.A.,
Churcher, C., Hall, N., Berriman, M., Huang, S., Kamoun, S., Beynon, J.L. and Birch, P.R.J. (2005)
An ancestral oomycete locus contains late blight avirulence gene Avr3a, encoding a protein that is
recognized in the host cytoplasm. Proc. Natl. Acad. Sci. USA 102 (21), 7766-7771.
Ayers, A.R., Ebel, J., Finelli, F., Berger, N. and Albersheim, P. (1976a) Host-pathogen interactions.
IX. Quantitative assays of elicitor activity and characterization of the elicitor present in the
extracellular medium of cultures of Phytophthora megasperma var. sojae. Plant Physiol. 57, 751-759.
Ayers, A.R., Ebel, J., Valent, P. and Albersheim, P. (1976b) Host-pathogen interactions. X.
Fractionation and biological activity of an elicitor isolated from the mycelial walls of Phytophthora
megasperma var. sojae. Plant Physiol. 57, 760-765.
Bac-to-Bac Baculovirus Expression System manual. Invitrogen (Karlsruhe)

References 88
Bach, M., Schnitzler, J-P. and Seitz, H.U. (1993) Elicitor-induced changes in Ca2+ influx, K+ efflux,
and 4-hydroxybenzoic acid synthesis in protoplasts of Daucus carota L. Plant Physiol. 103, 407-412.
Baker, B., Zambryski, P., Staskawicz, B. and Dinesh-Kumar, S.P. (1997) Signaling in plant-microbe
interactions. Science 276, 726-733.
Bantignies, B., Seguin, J., Muzac, I., Dedaldechamp, F. and Gulick, P. (2000) Direct evidence for
ribonucleolytic activity of a PR-10-like protein from white lupin roots. Plant Mol. Biol. 42, 871-881.
Barral, D.H.P. and Clark, J.A. (1991) Proteins arising during the late stages of embryogenesis in
Pisum sativum. Planta 184, 14-23.
Beagle-Ristaino, J.E. and Rissler, J.F. (1983) Histopathology of susceptible and resistant soybean
roots inoculated with zoospores of Phytophthora megasperma f. sp. glycinea. Phytopathol. 73, 590-
595.
Bendahmane, A., Kohn, B.A., Dedi, C. and Baulcombe, D.C. (1995) The coat protein of potato virus
X is a strain-specific elicitor of Rx1-mediated virus resistance in potato. Plant J. 8, 933-941.
Benhamou, N. (1996) Elicitor-induced plant defence pathways. Trends. Plant. Sci. 1, 233-240.
Bhattacharyya, M.K. and Ward, E.W.B. (1986a) Expression of gene-specific and age-related
resistance and the accumulation of glyceollin in soybean leaves infected with Phytophthora
megasperma f. sp. glycinea. Physiol. Mol. Plant Pathol. 29, 105-113.
Bhattacharyya, M.K. and Ward, E.W.B. (1986b) Resistance, susceptibility and accumulation of
glyceollin I-III in soybean organs inoculated with Phytophthora megasperma f. sp. glycinea. Physiol.
Mol. Plant Pathol. 29, 227-237.
Birch, P.R.J. and Kamoun, S. (2000) Studying interaction transcriptoms: Coordinated analyses of
gene expression during plant-microorganism interactions. In New Technologies for Life Sciences: A
Trends Guide. Wood, R. (Editor). Elsevier Science, London. 77-82.
Birnboim H.C. and Doly, J. (1979) A rapid alkaline extraction procedure for screening recombinant
plasmid DNA. Nucl. Acid. Res. 7, 1513-1523.
Boller, T. (1995) Chemoperception of microbial signals in plant cells. Annu. Rev. Plant Physiol. Plant
Mol. Biol. 46, 189-214.

References 89
Bonas, U., Stall, R.E. and Staskawicz, B. (1989) Genetic and structural characterization of the
avirulence gene, avrBs3 from Xanthomonas campestris pv. vesicatoria. Mol. Gen. Gen. 218, 127-
136.
Bonas, U. and Van den Ackerveken, G. (1997) Recognition of bacterial avirulence proteins occurs
inside the plant cell: a general phenomenon in resistance to bacterial diseases? Plant J. 12 (1) 1-7.
Bonhoff, A., Loyal, R., Ebel, J. and Grisebach, H. (1986a) Race:cultivar-specific induction of
enzymes related to phytoalexin biosynthesis in soybean roots following infection with Phytophthora
megasperma f. sp. glycinea. Arch. Biochem. Biophys. 246, 149-154.
Bonhoff, A., Loyal, R., Feller, K., Ebel J. and Grisebach, H. (1986b) Further investigations of
race:cultivar-specific induction of enzymes related to phytoalexin biosynthesis in soybean roots
following infection with Phytophthora megasperma f. sp. glycinea. Biological Chemistry Hoppe-Seyler
367, 797-802.
Bottin, A., Veronesi, C., Pontier, D., Esquerre-Tugaye, M.T., Blein, J.P., Russterucci, C. and Ricci, P.
(1994) Differential responses of tobacco cells to elicitors from two Phytophthora species. Plant
Physiol. Biochem. 32 (3), 373-378.
Boyes, D.C., Nam, J. and Dangl, J.L. (1998) The Arabidopsis thaliana RPM1 disease resistance
gene product is a peripheral plasma membrane protein that is degraded coincident with the
hypersensitive response. Proc. Natl. Acad. Sci. USA 95, 15849-15854.
Bradford, M.M. (1976) A rapid and sensitive method for the quantification of microgram quantities of
protein utilizing the principle of protein-dye binding. Anal. Biochem. 72, 248-254.
Bradley, D.J., Kjellbom, P. and Lamb, C.J. (1992) Elicitor- and wound- induced oxidative cross-
linking of a plant cell wall proline-rich protein: A novel, rapid defense response. Cell 70, 21-30.
Brisson, L.F., Tenhaken, R. and Lamb, C. (1994) Function of oxidative cross-linking of cell wall
structural proteins in plant disease resistance. Plant Cell 6, 1703-1712.
Burden, R.S. and Bailey, J.A. (1975) Structure of the phytoalexin from soybean. Phytochem. 14,
1389-1390.
Buzzell, R.I. and Anderson, T.R. (1992) Inheritance and race reaction of a new soybean Rps1 allele.
Plant Dis. 76, 600-601.
Cao, H., Bowling, S.A., Gordon, A.S. and Dong, X. (1994) Characterization of an Arabidopsis mutant
that is nonresponsive to inducers of systemic acquired resistance. Plant Cell 6, 1583-1592.
References 90
Carr, J.P., Dixon, D.C. and Klessig, D.F. (1985) Synthesis of pathogenesis-related proteins in
tobacco is regulated at the level of mRNA accumulation and occurs on membrane-bound polysomes.
Proc. Natl. Acad. Sci. USA 82, 7999-8003.
Catanzariti, A.-M., Dodds, P.N., Lawrence, G.J., Ayliffe, M.A. and Ellis, J.G. (2006) Haustorially
expressed secreted proteins from flax rust are highly enriched for avirulence elicitors. Plant Cell 18,
243-256.
Chang, S., Puryear, J. and Cairney, J. (1993) A simple and efficient method for isolating RNA from
pine trees. Plant Mol. Biol. 11, 113-116.
Chang, J.H., Goel, A.K., Grant, S.R. and Dangl, J.L. (2004) Wake of the flood: ascribing functions to
the wave of type III effector proteins of phytopathogenic bacteria. Curr. Opin. Microbiol. 7, 11-18.
Chinchilla, D., Bauer, Z., Regenass, M., Boller, T. and Felix, G. (2006) The Arabidopsis receptor
kinase FLS2 binds flg22 and determines the specificity of flagellin perception. Plant Cell 18, 465-476
Chou, W.M., Shigaki, T., Dammann, C., Liu, Y.Q. and Bhattacharyya, M.K. (2004) Inhibition of
phosphoinositide-specific phospholipase C results in the induction of pathogenesis-related genes in
soybean. Plant Biol. 6, 664-672.
Cosio, E.G., Pöpperl, H, Schmidt, W.E. and Ebel, J. (1988) High-affinity binding of fungal β-glucan
fragments to soybean (Glycine max L.) microsomal fractions and protoplasts. Eur. J. Biochem. 175,
309-315.
Cosio, E.G., Frey, T. and Ebel, J. (1992) Identification of a high-affinity binding protein for a hepta-β-
glucoside phytoalexin elicitor in soybean. Eur. J. Biochem. 204, 1115-1123.
Cosio, E.G., Feger, M., Miller, C.J., Antelo, L. and Ebel, J. (1996) High-affinity binding of glucan
elicitors to cell membranes of species of the plant family Fabaceae. Planta 200, 92-99.
Crowell, D.N. and Amasino, R.M (1991) Induction of specific mRNAs in cultured soybean cells during
cytokinin or auxin starvation. Plant Physiol. 95, 711-715.
Crowell, D.N., John, M.E., Russel, D. and Amasino, R.M. (1992) Characterization of a stress-
induced, developmentally regulated gene family from soybean. Plant Mol. Biol. 18, 459-466.
Curtis, R.W. (1984) Abscission-inducing properties of methyl jasmonate, ABA, and ABA-methyl ester
and their interactions with ethepon, AgNO3, and malformin. J. Plant Growth Regul. 3, 157-168.
References 91
Dangl, J.L. and Jones, J.D.G. (2001) Plant pathogens and integrated defence responses to infection.
Nature 411, 826-833.
De Feyter, R., Yang, Y. and Gabriel, D.W. (1993) Gene-for-gene interactions between cotton R
genes and Xanthomonas campestris pv. malvacearum avr genes. Mol. Plant-Microbe Interact. 6,
225-237.
Deisenhofer, J. (1981) Crystallographic refinement and atomic models of a human Fc fragment and
its complex with fragment B of protein A from Staphylococcus aureus at 2.9 and 2.8-A resolution.
Biochem. 20 (9), 2361-2370.
De Wit, P.J.G.M. and Spikman, G. (1982) Evidence for the occurrence of race and cultivar-specific
elicitors of necrosis in intercellular fluids of compatible interactions of Cladosporium fulvum and
tomato. Physiol. Plant Pathol. 21, 1-11.
De Wit, P.J.G.M., Brandwagt, B.F., Van den Burg, H.A., Cai, X., Van der Hoorn, R.A.L., De Jong,
C.F., Van’t Klooster, J., De Kock, M.J.D., Kruijt, M., Lindhout, W.H., Luderer, R., Takken, F.L.W.,
Westerink, N., Vervoort, J.J.M. and Joosten, M.H.A.J. (2002) The molecular basis of co-evolution
between Cladosporium fulvum and tomato. Antonie van Leeuwenhoek 81, 409-412.
Dodds, P.N., Lawrence, G.J., Catanzariti, A.-M., Ayliffe, M.A. and Ellis, J.G (2004) The Melampsora
lini AvrL567 avirulence genes are expressed in haustoria and their products are recognized inside
plant cells. Plant Cell 16, 755-768.
Ebel, J., Ayers, A. and Albersheim, P. (1976) Response of suspension-cultured soybean cells to the
elicitor isolated from Phytophthora megasperma var. sojae, a fungal pathogen of soybeans. Plant
Physiol. 57, 775-779.
Ebel, J. (1986) Phytoalexin synthesis: the biochemical analysis of the induction process. Annu. Rev.
Phytopathol. 24, 235-264.
Ebel, J., Grisebach, H., Bonhoff, A., Grab, D., Hoffman, C., Kochs, G., Mieth, H., Schmidt, W. and
Stäb, M. (1986) Phytoalexin synthesis in soybean following infection of roots with Phytophthora
megasperma or treatment of cell cultures with fungal elicitor. Recognition in microbe-plant symbiotic
and pathogenic interactions. NATO ASI series, series H: cell biology. Springer-Verlag 4, 345-361.
Ebel, J. and Grisebach, H. (1988) Defence strategies of soybean against the fungus Phytophthora
megasperma f. sp. glycinea: a molecular analysis. Trends Biochem. Sci. 1, 23-27.

References 92
Ebel, J. and Scheel, D. (1992) Elicitor recognition and signal transduction. Plant gene research.
Genes involved in plant defence. Boller, T. and Meins, F. (Editors). Springer, Berlin, Heidelberg, New
York. 8, 183-205.
Ebel, J. and Cosio, E.G. (1994) Elicitors of plant defence responses. Int. Rev. Cytol. 148, 1-36.
Ebel, J. and Scheel, D. (1997) Signals in host-parasite interactions. The Mycota V Part A. Plant
Relationships. Carroll, G.C. and Tudzynski, P. (Editors). Berlin, Heidelberg: Springer-Verlag. 85-105.
Ebel, J. (1998) Oligoglucoside elicitor-mediated activation of plant defence. BioEssays 20, 569-576.
Ebel, J. and Mithöfer, A. (1998) Early events in the elicitation of plant defence. Planta 206, 335-348.
Ellis, J., Catanzariti, A.M. and Dodds, P. (2006) The problem of how fungal and oomycete avirulence
proteins enter plant cells. Trends. Plant Sci. 11, 61-63.
Enkerli, K., Hahn, M.G. and Mims, C.W. (1997) Ultrastructure of compatible and incompatible
interactions of soybean roots infected with the plant pathogenic oomycete Phytophthora sojae. Can.
J. Bot. 75, 1494-1508.
Enyedi, A.J., Yalpani, N., Silverman, P. and Raskin, I. (1992) Signal molecules in systemic plant
resistance to pathogens and pests. Cell 70, 879-886.
Erwin, D.C. and Katznelson, H. (1961) Studies on the nutrition of Phytophthora cryptogea. Can. J.
Microbiol. 7, 15-25.
Erwin, D.C. and Ribeiro, O.K. (1996) Phytophthora Diseases Worldwide. APS PRESS. USA.
Farman, M.L. and Leong, S.A. (1998) Chromosome walking to the Avr1-CO39 avirulence gene of
Magnaporthe grisea: Discrepancy between the physical and genetic maps. Genetics 150, 1049-
1058.
Farmer, E.E. and Ryan, C.A (1992) Octadecanoid precursors of jasmonic acid activate the synthesis
of wound-inducible proteinase inhibitors. Plant Cell 4, 129-134.
Favaron, F., D’Ovidio, R., Porceddu, E. and Alghisi, P. (1994) Purification and molecular
characterization of a soybean polygalacturonase-inhibiting protein. Planta 195, 80-87.
Felix, G., Regenas, M. and Boller, T. (1993) Specific perception of subnanomolar concentrations of
chitin fragments by tomato cells: induction of extracellular alkalinization, changes in protein
phosphorylation, and establishment of a refractory state. Plant J. 4, 307-316.
References 93
Felix, G., Duran, J.D., Volko, S. and Boller, T. (1999) Plants have a sensitive perception system for
the most conserved domain of bacterial flagellin. Plant J. 18, 265-276.
Fliegmann, J., Schüller, G., Boland, W., Ebel, J. and Mithöfer, A. (2003) The role of octadecanoids
and functional mimics in soybean defence responses. Biol. Chem. 384, 437-446.
Fliegmann, J., Mithöfer, A., Wanner, G. and Ebel, J. (2004) An ancient enzyme domain hidden in the
putative β-glucan elicitor receptor of soybean may play an active part in the perception of pathogen-
associated molecular patterns during broad host resistance. J. Biol. Chem. 279 (2), 1132-1140.
Fliegmann, J., Montel, E., Djulić, A., Cottaz, S., Driguez, H. and Ebel, J. (2005) Catalytic properties of
the bifunctional soybean β-glucan-binding protein, a member of family 81 glycoside hydrolases.
FEBS Lett. 579, 6647-6642.
Flor, H.H. (1956) The complementary genetic systems in flax and flax rust. Adv. Genet. 8, 29-54.
Flor, H.H. (1971) Current status of the gene-for-gene concept. Annu. Rev. Phytopathol. 9, 275-296.
Förster, H., Tyler, B.M. and Coffey, M.D. (1994) Phytophthora sojae races have arisen by clonal
evolution and by rare outcrosses. Mol. Plant-Microbe Interact. 7, 780-791.
Frank, J. and Paxton, J. (1971) An inducer of soybean phytoalexin from Phytophthora megasperma
var. sojae. Phytopathol. 61, 954-958.
Gabriel, D.W. (1999) Why do pathogens carry avirulence genes? Physiol. Mol. Plant Pathol. 55, 205-
214.
Graham, M.Y., Weidner, J., Wheeler, K., Pelow, M.J. and Graham, T.L. (2003) Induced expression of
pathogenesis-related protein genes in soybean by wounding and the Phytophthora sojae cell wall
glucan elicitor. Physiol. Mol. Plant Pathol. 63, 141-149.
Gregory, P.H. (1983) Some major epidemics caused by Phytophthora. Phytophthora: Its biology,
taxonomy, ecology and pathology. Erwin, D.C., Bartniki-Garcia, S. and Tsao, P.H. (Editors). St Paul,
USA: American Phytopathological Society. 271-278.
Gundlach, H., Müller, M.J., Kutchan, T.M. and Zenk, M.H. (1992) Jasmonic acid is a signal
transducer in elicitor-induced plant cell cultures. Proc. Natl. Acad. Sci. USA 89, 2389-2393.
Habereder, H., Schröder, G. and Ebel, J. (1989) Rapid induction of phenylalanine ammonia-lyase
and chalcone synthase mRNAs during fungus infection of soybean (Glycine max L.) roots or elicitor
treatment of soybean cell cultures at the onset of phytoalexin synthesis. Planta 177, 58-65.

References 94
Hagmann, M.L., Heller, W. and Grisebach, H. (1984) Induction of phytoalexin synthesis in soybean.
Stereospecific 3,9-dihydroxypterocarpan 6a-hydroxylase from elicior-induced soybean cell cultures.
Eur. J. Biochem. 142, 127-131.
Hahn M.G., Darvill, A.G. and Albersheim, P. (1981) Host-pathogen interactions XIX. The
endogenous elicitor, a fragment of a plant cell wall polysaccharide that elicits phytoalexin
accumulation in soybeans. Plant Physiol. 68, 1161-1169.
Hahn, M.G., Bonhoff, A. and Grisebach, H. (1985) Quantitative localization of the phytoalexin
glyceollin I in relation to fungal hyphae in soybean roots infected with Phytophthora megasperma f.
sp. glycinea. Plant Physiol. 77, 591-601.
Hahn, M.G. (1996) Microbial elicitors and their receptors in plants. Annu. Rev. Phytopathol. 34, 387-
412.
Hanahan, D. (1983) Studies on transformation of Escherichia coli with plasmids. J. Mol. Biol. 136,
557-580.
Hiller, N.L., Bhattacharjee, S., Van Ooij, C., Liolios, K., Harrison, T., Lopez-Estraño, C. and Haldar,
K. (2004) A host-targeting signal in virulence proteins reveals a secretome in malarial infection.
Science 306, 1934-1937.
Holub, E.B. (2001) The arms race is ancient history in Arabidopsis, the wildflower. Nat. Rev. Genet.
2, 516-527.
Jabs, T., Tschöpe, M., Colling, C., Hahlbrock, K. and Scheel, D. (1997) Elicitor-stimulated ion fluxes
and O2- from the oxidative burst are essential components in triggering defence gene activation and
phytoalexin synthesis in parsley. Proc. Natl. Acad. Sci. USA 94, 4800-4805.
Ji, C., Smith-Becker, J. and Keen, N.T. (1998) Genetics of plant-pathogen interactions. Curr. Opin.
Biotechnol. 9, 202-207.
Jia, Y., McAdams, S.A., Bryan, G.T., Hershey, H.P. and Valent, B. (2000) Direct interaction of
resistance gene and avirulence gene products confers rice blast resistance. EMBO J. 19, 4004-4014.
Judelson, H.S. (1997) The genetics and biology of Phytophthora infestans: modern approaches to a
historical challenge. Fungal Genet. Biol. 22, 65-76.
Kaitany, R.C., Hart, L.P. and Safir, G.R. (2001) Virulence composition of Phytophthora sojae in
Michigan. Plant Dis. 85, 1103-1106.
References 95
Kang, S., Sweigard, J.A. and Valent, B. (1995) The PWL host specificity gene family in the blast
fungus Magnaporthe grisea. Mol. Plant-Microbe Interact. 8, 939-948.
Kamoun, S., Young, M., Glascock, C.B. and Tyler, B.M. (1993) Extracellular protein elicitors from
Phytophthora: host-specificity and induction of resistance to bacterial and fungal phytopathogens.
Mol. Plant-Microbe Interact. 6 (1), 15-25.
Kamoun, S., Young, M., Förster, H., Coffey, M.D. and Tyler, B.M. (1994) Potential role of elicitins in
the interaction between Phytophthora species and tobacco. Appl. Environ. Microbiol. 60, 1593-1598.
Kamoun, S., Van West, P., De Jong, A.J., De Groot, K.E., Vleeshouwers, V.G.A.A. and Govers, F.
(1997) A gene encoding a protein elicitor of Phytophthora infestans is down regulated during
infection of potato. Mol. Plant-Microbe Interact. 10 (1), 13-20.
Kamoun, S., Hraber, P., Sobral, B., Nuss, D. and Govers, F. (1999) Initial assessment of gene
diversity for the oomycete pathogen Phytophthora infestans based on expressed sequences. Fungal
Genet. Biol. 28, 94-106.
Kamoun, S., Huitema, E. and Vleeshouwers, V.G.A.A. (1999) Resistance to oomycetes: a general
role for the hypersensitive response. Trends Plant Sci. 4, 196-200.
Kamoun, S. (2000) Phytophthora in “Fungal Pathology” Kronstad, J. (Editor). Kluwer Academic
publishers. 237-265.
Keen, N.T. (1975) Specific elicitors of plant phytoalexin production: Determinants of race specificity in
pathogens? Science 187, 74-75.
Keen, N.T., Yoshikawa, M. and Wang, M.C. (1983) Phytoalexin elicitor activity of carbohydrates from
Phytophthora megasperma f.sp. glycinea and other sources. Plant Physiol. 71, 466- 471.
Kjemptrup, S., Nimchuk, Z. and Dangl, J.L. (2000) Effector proteins of phytopathogenic bacteria:
bifunctional signals in virulence and host recognition. Curr. Opin. Microbiol. 3, 73-78.
Klessig, D.F. and Malamy, J. (1994) The salicylic acid signal in plants. Plant Mol. Biol. 26, 1439-
1458.
Kobayashi, D.Y., Tamaki, S.J., Trollinger, D.J., Gold, S. and Keen, N.T. (1990) A gene from
Pseudomonas syringae pv. glycinea with homology to avirulence gene D from P.s. pv. tomato but
devoid of the avirulence phenotype. Mol. Plant-Microbe Interact. 3, 1103-1111.
References 96
Kurucz, I., Titus, J.A., Jost, C.R. and Segal, D.M. (1995) Correct disulfide pairing and efficient
refolding of detergent-solubilized single-chain Fv proteins from bacterial inclusion bodies. Mol.
Immunol. 32 (17-18): 1443-1452.
Laemmli, U.K. (1970) Cleavage of structural proteins during the assembly of the head of
bacteriophage T4. Nature 227, 680-685.
Lahaye, T. and Bonas, U. (2001) Molecular secrets of bacterial type III effector proteins. Trends Plant
Sci. 6 (10), 479-485.
Lamb, C. and Dixon, R.A. (1997) The oxidative burst in plant-disease resistance. Annu. Rev. Plant
Physiol. Plant Mol. Biol. 48, 251-275.
Latinhouwers, M., De Wit, P. and Govers, F. (2003) Oomycetes and fungi: similar weaponry to attack
plants. Trends Microbiol. 11 (10), 462-469.
Lauge, R. and De Witt, P.J.G.M. (1998) Fungal avirulence genes: Structure and possible functions.
Fungal Genet. Biol. 24, 285-297.
Levine, A., Tenhaken, R., Dixon, R. and Lamb, C. (1994) H2O2 from the oxidative burst orchestrates
the plant hypersensitive disease resistance response. Cell 79, 583-593.
Levine, A., Pennell, R.I., Alvarez, M.E., Palmer, R. and Lamb, C. (1996) Calcium-mediated apoptosis
in a plant hypersensitive disease resistance response. Curr. Biol. 6, 427-437.
Lindermayr, C., Möllers, B., Fliegmann, J., Uhlmann, A., Lottspeich, F., Meimberg, H. and Ebel, J.
(2002) Divergent members of a soybean (Glycine max L.) 4-coumarate:coenzyme A ligase gene
family. Primary structures, catalytic properties, and differential expression. Eur. J. Biochem. 269,
1304-1315.
Liu, J.J., Ekramoddoullah, A.K.M. and Yu, X. (2003) Differential expression of multiple PR10 proteins
in western white pine following wounding, fungal infection and cold-hardening. Physiologia Plantarum
119, 544-553.
Lo, C.S.-C., Hipskind, J.D. and Nicholson, R.L. (1999) cDNA cloning of a sorghum pathogenesis-
related protein (PR-10) and differential expression of defence-related genes following inoculation with
Cochliobolus heterostrophus or Colletotrichum sublineolum. Mol. Plant-Microbe Interact. 12, 479-
489.
Luderer, R. and Joosten, M.H.A.J. (2001) Avirulence proteins of plant pathogens: determinants of
victory and defeat. Mol. Plant Pathol. 2 (6), 355-364.

References 97
Mao, Y. and Tyler, B.M. (1991) Genome organization of Phytophthora megasperma f.sp. glycinea.
Exp. Mycol. 15, 283-291.
Marston, F.A. and Hartley, D.L. (1990) Solubilization of protein aggretates. Meth. Enzymol. 182, 264-
276.
Marti, M., Good, R.T., Rug, M., Knuepfer, E. and Cowman, A.F. (2004) Targeting malaria virulence
and remodeling proteins to the erythrocyte. Sience 306, 1930-1933.
Martin, G.B., Bogdanove, A.J. and Sessa, G. (2003) Understanding the functions of plant disease
resistance proteins. Annu. Rev. Plant Biol. 54, 23-61.
Matoo, A.K. and Suttle, J.c. (1991) The plant hormone ethylene. CRC Press, Boca Raton, Fl.
Matton, D.P. and Brisson, N. (1989) Cloning, expression, and sequence conservation of
pathogenesis-related gene transcripts of potato. Mol. Plant-Microbe Interact. 2, 325-331.
Mauch, F., Mauch-Mani, B. and Boller, T. (1988) Antifungal hydrolases in pea tissue II. Inhibition of
fungal growth by combinations of chitinase and β-1,3-glucanase. Plant Physiol. 88, 936-942.
McGee, J.D., Hamer, J.E. and Hodges, T.K. (2001) Characterization of a PR-10 pathogenesis-
related gene family induced in rice during infection with Magnaporthe grisea. Mol. Plant-Microbe
Interact. 14 (7), 877-886.
Mehdi, M.C. (1994) Active oxygen species in plant defence against pathogens. Plant Physiol. 105,
467-472.
Mithöfer, A., Lottspeich, F. and Ebel, J. (1996) One-step purification of the β-glucan elicitor-binding
protein from soybean (Glycine max L.) roots and characterization of an anti-peptide antiserum. FEBS
Lett. 381, 203-207.
Mithöfer, A., Daxberger, A., Fromhold-Treu, D. and Ebel, J. (1997) Involvement of an NAD(P)H
oxidase in the elicitor-inducible oxidative burst of soybean. Phytochem. 45, 1101-1107.
Mithöfer, A. Ebel, J., Arvind, A.B., Boller, T. and Neuhaus-Url, G. (1999) Transgenic aequorin
monitors cytosolic calcium transients in soybean cells challenged with β-glucan or chitin elicitors.
Planta 207, 566-574.
Mithöfer, A., Fliegmann, J., Neuhas-Url, G., Schwarz, H. and Ebel, J. (2000) The hepta-β-glucoside
elicitor-binding proteins from legumes represent a putative receptor familiy. Biol. Chem. 381, 705-
713.
References 98
Mithöfer, A., Ebel, J. and Felle, H.H. (2005) Cation fluxes cause plasma membrane depolarization
involved in β-glucan elicitor signaling in soybean roots. Mol. Plant-Microbe Interact. 18, 983-990.
Moesta, P., Hahn, M.G. and Grisebach, H. (1983) Development of a radioimmunoassay for the
soybean phytoalexin glyceollin I. Plant Physiol. 73, 233-237.
Mohr, P.G. and Cahill, D.M. (2001) Relative roles of glyceollin, lignin and the hypersensitive
response and the influence of ABA in compatible and incompatible interactions of soybeans with
Phytophthora sojae. Physiol. Mol. Plant Pathol. 58, 31-41.
Morris, P.F., Savard, M.E. and Ward, E.W.B. (1991) Identification and accumulation of isoflavonoids
and isoflavone glucosides in soybean leaves and hypocotyls in resistance responses to
Phytophthora megasperma f.sp. glycinea. Physiol. Mol. Plant Pathol. 39, 229-244.
Moy, P., Qutob, D., Chapman, B.P., Atkinson, I. and Gijzen, M. (2004) Patterns of gene expression
upon infection of soybean plants by Phytophthora sojae. Mol. Plant-Microbe Interact. 17, 1051-1062.
Mukhopadhyay, A. (1997) Inclusion bodies and purification of proteins in biologically active forms.
Adv. Biochem. Eng. Biotechnol. 56, 61-109.
Nürnberger, T., Nennstiel, D., Jabs, T., Sacks, W.R., Hahlbrock, K. and Schell, D. (1994a) High
affinity binding of a fungal oligopeptide elicitor to parsley plasma mebrane triggers multiple defence
responses. Cell 78, 449-460.
Nürnberger, T. and Scheel, D. (2001) Signal transmission in the plant immune response. Trends
Plant Sci. 6, 372-379.
Nürnberger, T. and Brunner, F. (2002) Innate immunity in plants and animals: emerging parallels
between the recognition of general elicitors and pathogen-associated molecular patterns. Curr. Opin.
Plant Biol. 5, 318-324.
Okinaka, Y., Mimori, K., Takeo, K., Kitamura, S., Takeuchi, Y., Yamaoka, N. and Yoshikawa, M.
(1995) A structural model for the mechanisms of elicitor release from fungal cell walls by plant β-1,3-
endoglucanase. Plant Physiol. 109, 839-845.
Orbach, M.J., Farrall, L., Sweigard, J.A., Chumley, F.G. and Valent, B. (2000) A telomeric avirulence
gene determines efficacy for the rice blast resistance gene Pi-ta. Plant Cell 12, 2019-2032.
Osbourne, A. (1996) Saponins and plant defence- a soap story. Trends Plant. Sci. 1, 4-9.
pGEM-T and pGEM-T Easy vector Systems technical manual. Promega (Mannheim)

References 99
Pieterse, C.M.J., Van West, P., Verbakel, H.M., Brasse, P.W.H.M., Van den Berg-Velthuis, G.C.M.
and Govers, F. (1994). Structure and genomic organization of the ipiB and ipiO gene clusters of
Phytophthora infestans. Gene 138, 67–77.
Preisig, C.L. and Kuc, J.A (1985) Arachidonic acid-related elicitors of the hypersensitive response in
potato and enhancement of their activites by glucans from Phytophthora infestans. Arch. Biochem.
Biophys. 236, 379-389.
QIA Expressionist manual. Qiagen (Hilden)
Qutob, D., Kamoun, S. and Gijzen, M. (2002) Expression of a Phytophthora sojae necrosis-inducing
protein occurs during transition from biotrophy to necrotrophy. Plant J. 32, 361-373.
Qutob, D., Huitema, E., Gijzen, M. and Kamoun, S. (2003) Variation in structure and activity among
elicitins from Phytophthora sojae. Mol. Plant Pathol. 4 (2), 119-124.
Rehmany, A.P., Gordon, A., Rose, L.E., Allen, R.L., Armstrong, M.R., Whisson, S.C., Kamoun, S.,
Tyler, B.M., Birch, P.R.J. and Beynon, J.L. (2005) Differential recognition of highly divergent downy
mildew avirulence gene alleles by RPP1 resistance genes from two Arabidopsis lines. Plant Cell 17,
1839-1850.
Rivas, S. and Thomas, C.M. (2005) Molecular interactions between tomato and the leaf mold
pathogen Cladosporium fulvum. Annu. Rev. Phytopathol. 43, 395-436.
Rohe, M., Gierlich, A., Hermann, H., Hahn, M., Schmidt, B., Rosahl, S. and Knogge, W. (1995) The
race-specific elicitor, NIP1, from the barley pathogen, Rhyncosporium secalis, determines avirulence
on host plants of the Rsr1 resistance genotype. EMBO J. 14, 4168-4177.
Rooney, H.C.E., Van’t Klooster, J.W., Van der Hoorn, R.A.L., Joosten, M.H.A.J, Jones, J.D.G. and
De Wit, P.J.G.M. (2005) Cladosporium Avr2 inhibits tomato Rcr3 protease required for Cf-2-
dependent disease resistance. Science 308, 1783-1786.
Rudolph, R. and Lilie, H. (1996) In vitro folding of inclusion body proteins. FASEB J. 10, 49-56.
Ryals, J.A., Neuenschwander, U.H., Willits, M.G., Molina, A., Steiner, H.Y. and Hunt, M.D. (1996)
Systemic acquired resistance. Plant Cell 8, 1809-1819.
Sambrook, J., Fritsch, E.F. and Maniatis, T. (1989) Molecular cloning. Cold Spring Harbor Laboratory
Press. 2nd edition.

References 100
Schmidt W.E. and Ebel, J. (1987) Specific binding of a fungal phytoalexin elicitor to membrane
fractions from soybean Glycine max. Proc. Natl. Acad. Sci. USA 84, 4117-4121.
Schmitthenner, A.F., Hobe, M. and Bhat, R.G. (1994) Phytophthora sojae races in Ohio over a 10-
year interval. Plant Dis. 78, 269-276.
Schopfer, C.R., Kochs, G., Lottspeich, F. and Ebel, J. (1998) Molecular characterization and
functional expression of dihydroxypterocarpan 6a hydroxylase, an enzyme specific for
pterocarpanoid phytoalexin biosynthesis in soybean (Glycine max L.). FEBS Lett. 432, 182-186.
Schopfer, C.R. and Ebel, J. (1998) Identification of elicitor-induced cytochrome P450s of soybean
(Glycine max L.) using differential display of mRNA. Mol. Gen. Genet. 258, 315-322.
Scofield, S.R., Tobias, C.M., Rathjen, J.P., Chang, J.H., Lavelle, D.T., Michelmore, R.W. and
Staskawicz, B.J. (1996) Molecular basis of gene-for-gene specificity in bacterial speck disease of
tomato. Science 274, 2063-2065.
Sela-Buurlage, M.B., Ponstein, A.S., Bres-Vloemans, S.A., Melchers. L.S., Van den Elzen, P.J.M.
and Cornelissen, B.J.C. (1993) Only specific tobacco (Nicotiana tabacum) chitinases and β-1,3-
glucanases exhibit antifungal activity. Plant Physiol. 101, 857-863.
Senchou, V., Weide, R., Carrasco, A., Bouyssou, H., Pont-Lezica, R., Govers, F. and Canut, H.
(2004) High affinity recognition of a Phytophthora protein by Arabidopsis via an RGD motif. Cell. Mol.
Life Sci. 61, 502-509.
Shan, W., Cao, M., Leung, D. and Tyler, B.M. (2004) The Avr1b locus of Phytophthora sojae
encodes an elicitor and a regulator required for avirulence on soybean plants carrying resistance
gene Rps1b. Mol. Plant-Microbe Interact. 17, 394-403.
Shapiro, J.A. (1999) Views about evolution are evolving. ASM News. 65, 201-207.
Sharp, J.K., McNeil, M. and Albersheim, P. (1984a) The primary structures of one elicitor-active and
seven elicitor-inactive hexa(β-D-glucopyranoside)-D-glucitols isolated from the mycelial walls of
Phytophthora megasperma f.sp. glycinea. J. Biol. Chem. 259, 11321-11336.
Sharp, J.K., Valent, B. and Albersheim, P. (1984b) Purification and partial characterization of a β-
glucan fragment that elicits phytoalexin accumulation in soybean. J. Biol. Chem. 259, 11312-11320.
Shulaev, V., Silverman, P. and Raskin, I. (1997) Airborne signaling by methyl salicylate in plant
pathogen resistance. Nature 385, 718–721.
References 101
Sjödahl, J. (1977) Repetitive sequences in protein A from Staphylococcus aureus: arrangement of
five regions within the protein, four of them highly homologous and Fc-binding. Eur. J. Biochem. 73,
343-351.
Slusarenko, A.J. and Schlaich, N.L. (2003) Downy mildew of Arabidopsis thaliana caused by
Hyaloperonospora parasitica (formerly Peronospora parasitica). Mol. Plant Pathol. 4, 159-170.
Somssich, I.E., Schmelzer, E., Bollman, J. and Hahlbrock, K. (1986) Rapid activation by fungal
elicitor encoding “pathogenesis-related” proteins in cultured parsley cells. Proc. Natl. Acad. Sci. USA
83, 2427-2430.
Stäb, M.R. and Ebel, J. (1987) Effects of Ca2+ on phytoalexin induction by fungal elicitor in soybean
cells. Arch. Biochem. Biophys. 257, 416-423.
Strasburger, E. (2002) Lehrbuch der Botanik für Hochschulen. Spektrum Akademischer Verlag
Heidelberg, Berlin. Revision by: Sitte, P., Weiler, E.W., Kadereit, J.W., Bresinsky, A. and Körner, C.
35th edition.
Takeuchi, Y., Yoshikawa, M., Takeba, G., Tanaka, K., Shibata, D. and Horino, O. (1990) Molecular
cloning and ethylene induction of mRNA encoding a phytoalexin elicitor-releasing factor, β-1,3-
endoglucanase, in soybean. Plant Physiol. 93, 673-682.
Tang, X., Frederick, R.D., Zhou, J., Halterman, D.A., Jia, Y. and Martin, G.B. (1996) Initiation of plant
disease resistance by physical interaction of AvrPto and Pto kinase. Science 274, 2060-2063.
Templeton, M.D., Rikkerink, E.H.A. and Beever, R.E. (1994) Small, cysteine-rich proteins and
recognition in fungal-plant interactions. Mol. Plant-Microbe Interact. 7, 320-325.
Tyler, B.M., Wu, M.H., Wang, J.M., Cheung, W.W.S. and Morris, P.F. (1996) Chemotactic
preferences and strain variation in the response of Phytophthora sojae zoospores to host
isoflavones. Appl. Environ. Microbiol. 662, 2811-2817.
Tyler, B.M. (2001) Genetics and genomics of the oomycete-host interface. Trends Genet. 17 (11),
611-614.
Tyler, B.M. (2002) Molecular basis of recognition between Phytophthora pathogens and their hosts.
Annu. Rev. Phytopathol. 40 (1), 137-167.
Ueda, J. and Kato, J. (1980) Isolation and identification of a senescence-promoting substance in
wormwood (Artemisia absinthium L.) Plant Physiol. 66, 246-249.

References 102
Umemoto, N., Kakitani, M., Iwamatsu, A., Yoshikawa, M., Yamaoka, N. and Ishida, I. (1997) The
structure and function of a soybean beta-glucan-elicitor-binding protein. Proc. Natl. Acad. Sci. USA
94, 1029-1034.
Van der Ackerveken, G., Marois, E. and Bonas, U. (1996) Recognition of the bacterial avirulence
protein AvrBs3 occurs inside the host plant cell. Cell 87, 1307-1316.
Van der Biezen, E.A. and Jones, J.D.G. (1998) Plant disease-resistance proteins and the gene-for-
gene concept. Trends Biochem. Sci. 23, 454-456.
Van der Hoorn, R.A.L., De Wit, P.J.G.M. and Joosten, M.H.A.J. (2002) Balancing selection favors
guarding resistance proteins. Trends Plant Sci. 7, 67-71.
Van der Peer, Y. and De Wachter, R. (1997) Evolutionary relationships among the eukaryotic crown
taxa taking into account site-to-site rate variation in 18S rRNA. J. Mol. Evol. 45, 619-630.
Van Loon, L.C. and Van Kammen, A. (1970) Polyacrylamide disc electrophoresis of the soluble leaf
proteins from Nicotiana tabacum var. “Samsun” and “Samsun NN”. II. Changes in protein constitution
after infection with tobacco mosaic virus. Virology 40, 199-211.
Van Loon, L.C. (1985) Pathogenesis-related proteins. Plant Mol. Biol. 4, 111-116.
Van West, P., Appiah, A.A. and Gow, N.A.R. (2003) Advances in research on oomycete root
pathogens. Phys. Mol. Plant Pathol. 62, 99-113.
Waldmüller, T., Cosio, E.G., Grisebach, H. and Ebel, J. (1992) Release of highly elicitor-active
glucans by germinating zoospores of P. megasperma f. sp. glycinea. Planta 188, 498-505.
Ward, E.W.B. (1990) The interaction of soya beans with Phytophthora megasperma f.sp. glycinea:
pathogenicity. In Biological Control of Soil-Borne Plant Pathogens. Hornby, D. (Editor). Wallingford:
CAB International. 311-327.
Warner, S.A., Gill, A. and Draper, J. (1994) The developmental expression of the asparagus
intracellular PR protein (AoPR1) gene correlates with sites of phenylpropanoid biosynthesis. Plant J.
6, 31-43.
Weidhase, R.A., Kramell, H.-M., Lehman, J., Liebisch, H.-W., Lerbs, W. and Parthier, B. (1987)
Methyljasmonate-induced changes in the polypeptide pattern of senescing barley leaf segments.
Plant Sci. 51, 177-186.

References 103
Werner, C. and Hohl, H.R. (1990) The effects of Ca2+ and Mg2+ on accumulation and secretion of
isoflavonoids by soybean roots. Plant Science 72, 181-191.
Whisson, S.C., Drenth, A., Maclean, D.J. and Irwin, J.A.G. (1995) Phytophthora sojae avirulence
genes, RAPD and RFLP markers used to construct a detailed genetic linkage map. Mol. Plant-
Microbe Interact. 8, 988-995.
White, F.F., Yang, B. and Johnson, L.B. (2000) Prospects for understanding avirulence gene
function. Curr. Opin. Plant Biol. 3, 291-298.
Yang, A., Yuan, Q. and Gabriel, D.W. (1996) Watersoaking functions of XcmH1005 are redundantly
encoded by members of a Xanthomonas avirulence/pathogenicity gene family. Mol. Plant-Microbe
Interact. 9, 105-113.
Yeboah, N.A., Arahira, M., Nong, V.H., Zhang, D., Kadokura, K., Watanabe, A and Fukazawa, C.
(1998) A class III acidic endochitinase is specifically expressed in the developing seeds of soybean
(Glycine max (L.) Merr.) Plant Mol. Biol. 36, 407-415.
Yoshikawa, M., Matama, M. and Masago, H. (1981) Release of a soluble phytoalexin elicitor from
mycelial walls of Phytophthora megasperma var. sojae by soybean tissues. Plant Physiol. 67, 1032-
1035.
Young, N.D. (2000) The genetic architecture of resistance. Curr. Opin. Plant Biol. 3, 285-290.
Zähringer, U., Schaller, E. and Grisebach, H. (1981) Induction of phytoalexin synthesis in soybean.
Structure and reactions of naturally occurring and enzymatically prepared prenylated pterocarpans
from elicitor-treated cotyledons and cell cultures of soybean. Z. Natursforsch. C: Biosci. 36c, 234-
241.
Zhao, Y.I., Del Grosso, L., Yigit, E., Dempsey, D.A., Klessig, D.F. and Wobbe, K.K. (2000) The
amino terminus of the coat protein of Turnip crinkle virus is the Avr factor recognized by resistant
Arabidopsis. Mol. Plant-Microbe Interact. 13, 1015-1018.

Appendix 104
9 Appendix
9.1 Restriction maps 9.1.1 Map and restriction endonuclease sites for the PGEM-T vector A
B
T7 Transcription Start
5´...TGTAA TACGA CTCAC TATAG GGCGA ATTGG GCCCG ACGTC GCATG CTCCC GGCCG 3´...ACATT ATGCT GAGTG ATATC CCGCT TAACC CGGGC TGCAG CGTAC GAGGG CCGGC T7 Promoter Apa I Aat II Sph I BstZ I
CCATG GCCGC GGGATT3´ (Cloned insert) ATCAC TAGTG CGGCC GCCTG CAGGT CGACC ATATG GGTAC CGGCG CCCTA 3´TTAGTG ATCAC GCCGG CGGAC GTCCA GCTGG TATAC
Nco I Sac II Spe I Not I Pst I Sal I Nde I
BstZ I SP6 Transcription Start
GGAGA GCTCC CAACG CGTTG GATGC ATAGC TTGAG TATTC TATAG TGTCA CCTAA AT...3´ CCTCT CGAGG GTTGC GCAAC CTACG TATCG AACTC ATAAG ATATC ACAGT GGATT TA...5´
Sac I BstX I Nsi I SP6 Promoter
Fig. 32 (A) pGEM-T vector circle map and sequence reference points. (B) Promoter and multiple cloning
sequence of the pGEM-T vector. The top strand of the sequence shown corresponds to the RNA synthesised by
T7 RNA polymerase. The bottom strand corresponds to the RNA synthesised by SP6 RNA polymerase. Taken
from the manual “pGEM-T and pGEM-T easy vector systems” from Promega.
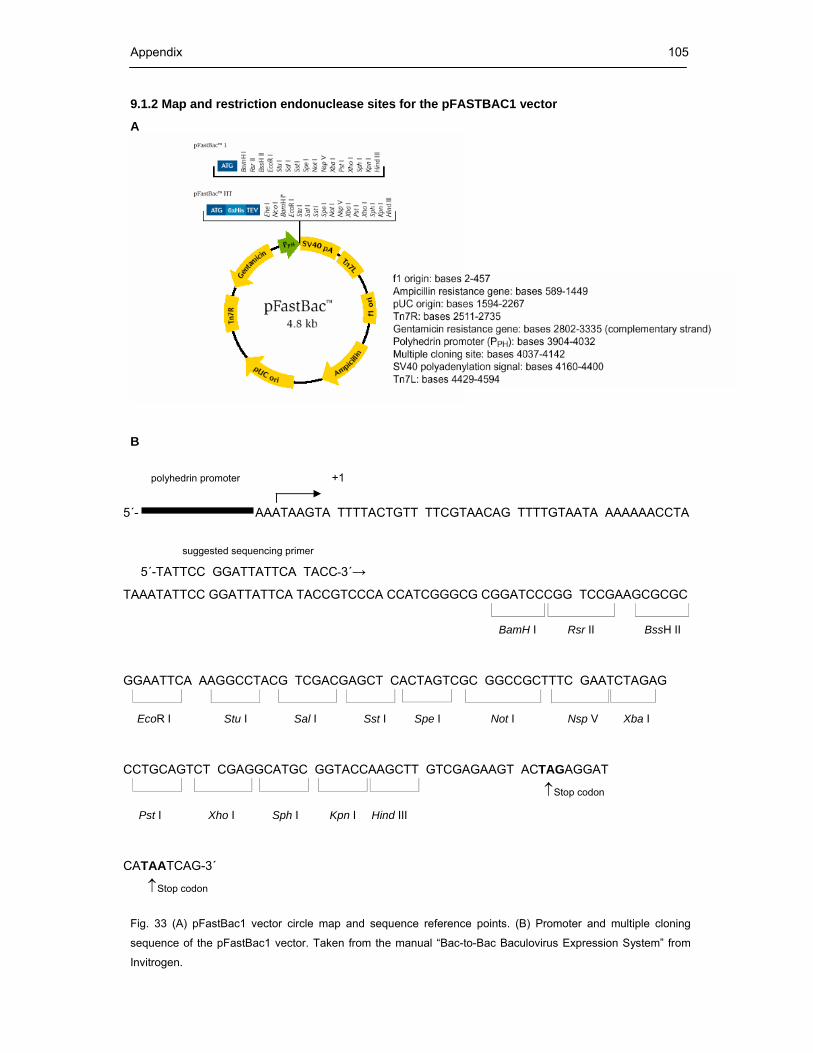
Appendix 105
9.1.2 Map and restriction endonuclease sites for the pFASTBAC1 vector
A
B
polyhedrin promoter +1
5´- AAATAAGTA TTTTACTGTT TTCGTAACAG TTTTGTAATA AAAAAACCTA
suggested sequencing primer
5´-TATTCC GGATTATTCA TACC-3´→ TAAATATTCC GGATTATTCA TACCGTCCCA CCATCGGGCG CGGATCCCGG TCCGAAGCGCGC BamH I Rsr II BssH II
GGAATTCA AAGGCCTACG TCGACGAGCT CACTAGTCGC GGCCGCTTTC GAATCTAGAG
EcoR I Stu I Sal I Sst I Spe I Not I Nsp V Xba I
CCTGCAGTCT CGAGGCATGC GGTACCAAGCTT GTCGAGAAGT ACTAGAGGAT
↑Stop codon
Pst I Xho I Sph I Kpn I Hind III
CATAATCAG-3´
↑Stop codon Fig. 33 (A) pFastBac1 vector circle map and sequence reference points. (B) Promoter and multiple cloning
sequence of the pFastBac1 vector. Taken from the manual “Bac-to-Bac Baculovirus Expression System” from
Invitrogen.

Appendix 106
9.1.3 pTZ18R:Avr1b partial restriction map
R G M C C K A I K L G N A R V F P V T T L * N D G Q C 81 GGGGGATGTGCTGCAAGGCGATTAAGTTGGGTAACGCCAGGGTTTTCCCAGTCACGACGTTGTAAAACGACGGCCAGTGC 160 M A T E Y Q A Y M R L S F V L S L V V A I G Y V V T C N A T E Y PauI:gcgcgc PauI:gcgcgc Kozak:GCCACCATGG Kozak:GCCACCATGG 161 CAAGCTTACATGCGTCTATCTTTTGTGCTTTCTCTTGTCGTGGCCATTGGCTACGTCGTGACCTGCAACGCAACTGAGTA 240 tatgcgcGCcacCATGCGTCTATCTTTTG 38°C tatgcgcgCCacCAtgGCAACTGAGTACTC 39.3°C Avr1b_PauI-1 70.5°C Avr1b_PauI-2 71.6°C S D E T N I A M V E S P D L V R R S L R N G D I A G 241 CTCCGACGAAACCAATATCGCCATGGTGGAATCTCCAGATCTCGTCCGTCGCTCGCTCAGGAACGGCGACATTGCCGGTG 320 NcoI BglII G R F L R A H E E D D A G E R T F S V T D L W N K V A 321 GAAGATTTCTTCGAGCTCATGAAGAGGACGATGCGGGGGAGCGGACCTTCAGCGTGACTGACCTGTGGAACAAGGTGGCG 400 SacI A K K L A K A M L A D P S K E Q K A Y E K W A K K G Y 401 GCCAAAAAGTTGGCCAAGGCGATGCTGGCGGACCCTTCAAAGGAGCAGAAAGCGTACGAGAAGTGGGCAAAGAAGGGGTA 480 S L D K I K N W L A I A D P K Q K G K Y D R I Y N G 481 CAGCCTGGATAAGATCAAGAACTGGTTGGCAATCGCGGACCCCAAGCAGAAGGGGAAGTACGACCGTATCTACAACGGAT 560 Y T F H R Y Q S * E F P I V S R I K F V I M V I A V S 561 ACACCTTTCACCGGTATCAGAGCTGAGAATTCCCTATAGTGAGTCGTATTAAATTCGTAATCATGGTCATAGCTGTTTCC 640 EcoRI <--T7 Promoter Oligo (38.8°C) Fig. 34 Partial restriction map of pTZ18R:Avr1b. The signal peptide is shaded in grey. Underlined are the amino
acids used for the primer generation.
9.2 Amino acid alignment of Avr1b, PauI-1 and PauI-2
10 20 30 40 50 60 70 ....|....|....|....|....|....|....|....|....|....|....|....|....|....|
Avr1b MRLSFVLSLVVAIGYVVTCNATEYSDETNIAMVESPDLVRRSLRNGDIAGGRFLRAHEEDDAGERTFSVT
PauI-1 MRLSFVLSLVVAIGYVVTCNATEYSDETNIAMVESPDLVRRSLRNGDIAGGRFLRAHEEDDAGERTFSVT
PauI-2 -------------------MATEYSDETNIAMVESPDLVRRSLRNGDIAGGRFLRAHEEDDAGERTFSVT
80 90 100 110 120 130 140 ....|....|....|....|....|....|....|....|....|....|....|....|....|...
Avr1b DLWNKVAAKKLAKAMLADPSKEQKAYEKWAKKGYSLDKIKNWLAIADPKQKGKYDRIYNGYTFHRYQS
PauI-1 DLWNKVAAKKLAKAMLADPSKEQKAYEKWAKKGYSLDKIKNWLAIADPKQKGKYDRIYNGYTFHRYQS
PauI-2 DLWNKVAAKKLAKAMLADPSKEQKAYEKWAKKGYSLDKIKNWLAIADPKQKGKYDRIYNGYTFHRYQS
Fig. 35 Amino acid alignment of Avr1b, PauI-1 and PauI-2. Amino acids shaded in grey represent the putative
signal peptide.

Appendix 107
9.3 Amino acid sequence of Avr1b from E. coli pET26b
10 20 30 40 50 60
MKYLLPTAAAGLLLLAAQPAMATEYSDETNIAMVESPDLVRRSLRNGDIAGGRFLRAHEE
70 80 90 100 110 120
DDAGERTFSVTDLWNKVAAKKLAKAMLADPSKEQKAYEKWAKKGYSLDKIKNWLAIADPK
130 140 150 154
QKGKYDRIYNGYTFHLYQSVDKLAAALEHHHHHH
Fig. 36 Amino acid sequence of Avr1b from E. coli pET26b containing a periplasmatic localization signal (kursiv);
a His6-fusionepitope and a spacer (in dots).
9.4 Deduced amino acid alignment of Avr1b-1 (accession number AF449622), Avr1b-1 (clone
#10) and Avr1b-1 (clone #11)
10 20 30 40 50 60 70 80
....|....|....|....|....|....|....|....|....|....|....|....|....|....|....|....|
AF449622 ATGCGTCTATCTTTTGTGCTTTCTCTTGTCGTGGCCATTGGCTACGTCGTGACCTGCAACGCAA
M R L S F V L S L V V A I G Y V V T C N A
clone #10 CCAAGTATCACGAACCATGCGTCTATCTTTTGTGCTTTCTCTTGTCGTGGCCATTGGCTACGTCGTGACCTGCAACGCAA
. . . . . . . . . . . . . . . . . . . . .
clone #11 CCAAGTATCACGAACCATGCGTCTATCTTTTGTGCTTTCTCTTGTCGTGGCCATTGGCTACGTCGTGACCTGCAACGCAA
. . . . . . . . . . . . . . . . . . . . .
90 100 110 120 130 140 150 160
....|....|....|....|....|....|....|....|....|....|....|....|....|....|....|....|
AF449622 CTGAGTACTCCGACGAAACCAATATCGCCATGGTGGAATCTCCAGATCTCGTCCGTCGCTCGCTCAGGAACGGCGACATT
T E Y S D E T N I A M V E S P D L V R R S L R N G D I
clone #10 CTGAGTACTCCGACGAAACCAATATCGCCATGGTGGAATCTCCAGATCTCGTCCGTCGCTCGCTCAGGAACGGCGACATT
. . . . . . . . . . . . . . . . . . . . . . . . . . .
clone #11 CTGAGTACTCCGACGAAACCAATATCGCCATGGTGGAATCTCCAGATCTCGTCCGTCGCTCGCTCAGGAACGGCGACATT
. . . . . . . . . . . . . . . . . . . . . . . . . . .
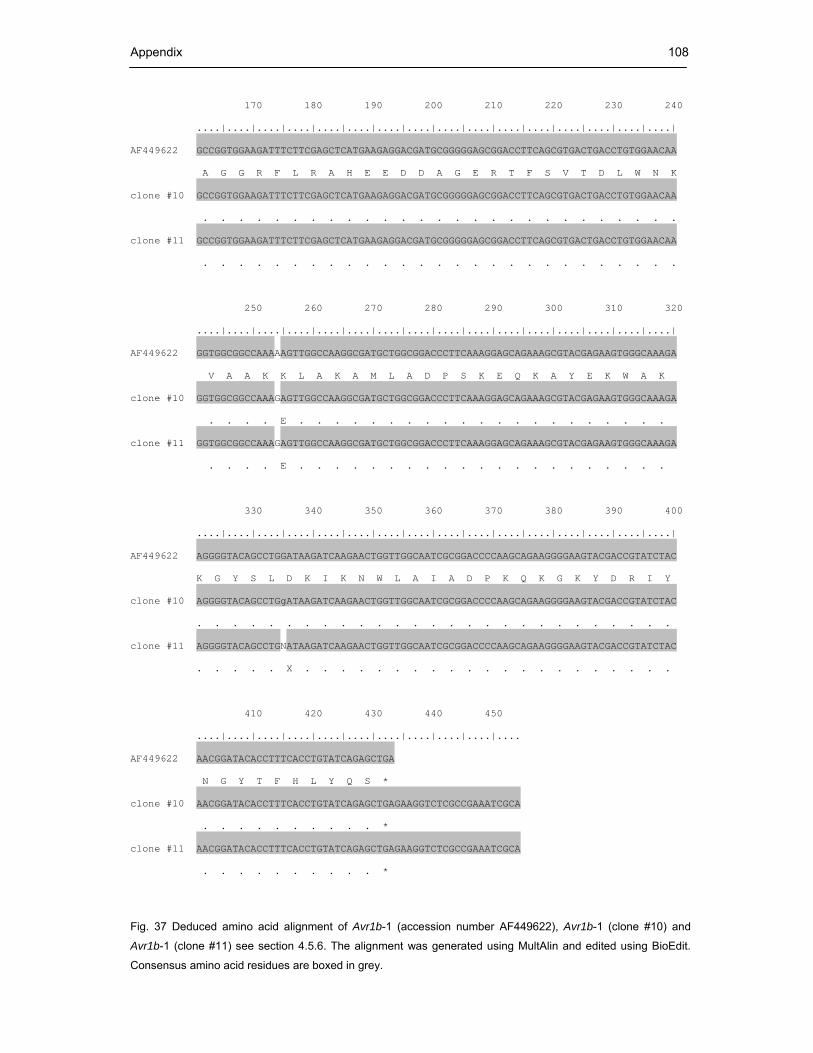
Appendix 108
170 180 190 200 210 220 230 240
....|....|....|....|....|....|....|....|....|....|....|....|....|....|....|....|
AF449622 GCCGGTGGAAGATTTCTTCGAGCTCATGAAGAGGACGATGCGGGGGAGCGGACCTTCAGCGTGACTGACCTGTGGAACAA
A G G R F L R A H E E D D A G E R T F S V T D L W N K
clone #10 GCCGGTGGAAGATTTCTTCGAGCTCATGAAGAGGACGATGCGGGGGAGCGGACCTTCAGCGTGACTGACCTGTGGAACAA
. . . . . . . . . . . . . . . . . . . . . . . . . . .
clone #11 GCCGGTGGAAGATTTCTTCGAGCTCATGAAGAGGACGATGCGGGGGAGCGGACCTTCAGCGTGACTGACCTGTGGAACAA
. . . . . . . . . . . . . . . . . . . . . . . . . . .
250 260 270 280 290 300 310 320
....|....|....|....|....|....|....|....|....|....|....|....|....|....|....|....|
AF449622 GGTGGCGGCCAAAAAGTTGGCCAAGGCGATGCTGGCGGACCCTTCAAAGGAGCAGAAAGCGTACGAGAAGTGGGCAAAGA
V A A K K L A K A M L A D P S K E Q K A Y E K W A K
clone #10 GGTGGCGGCCAAAGAGTTGGCCAAGGCGATGCTGGCGGACCCTTCAAAGGAGCAGAAAGCGTACGAGAAGTGGGCAAAGA
. . . . E . . . . . . . . . . . . . . . . . . . . .
clone #11 GGTGGCGGCCAAAGAGTTGGCCAAGGCGATGCTGGCGGACCCTTCAAAGGAGCAGAAAGCGTACGAGAAGTGGGCAAAGA
. . . . E . . . . . . . . . . . . . . . . . . . . .
330 340 350 360 370 380 390 400
....|....|....|....|....|....|....|....|....|....|....|....|....|....|....|....|
AF449622 AGGGGTACAGCCTGGATAAGATCAAGAACTGGTTGGCAATCGCGGACCCCAAGCAGAAGGGGAAGTACGACCGTATCTAC
K G Y S L D K I K N W L A I A D P K Q K G K Y D R I Y
clone #10 AGGGGTACAGCCTGgATAAGATCAAGAACTGGTTGGCAATCGCGGACCCCAAGCAGAAGGGGAAGTACGACCGTATCTAC
. . . . . . . . . . . . . . . . . . . . . . . . . . .
clone #11 AGGGGTACAGCCTGNATAAGATCAAGAACTGGTTGGCAATCGCGGACCCCAAGCAGAAGGGGAAGTACGACCGTATCTAC
. . . . . X . . . . . . . . . . . . . . . . . . . . .
410 420 430 440 450
....|....|....|....|....|....|....|....|....|....|....
AF449622 AACGGATACACCTTTCACCTGTATCAGAGCTGA
N G Y T F H L Y Q S *
clone #10 AACGGATACACCTTTCACCTGTATCAGAGCTGAGAAGGTCTCGCCGAAATCGCA
. . . . . . . . . . *
clone #11 AACGGATACACCTTTCACCTGTATCAGAGCTGAGAAGGTCTCGCCGAAATCGCA
. . . . . . . . . . * Fig. 37 Deduced amino acid alignment of Avr1b-1 (accession number AF449622), Avr1b-1 (clone #10) and
Avr1b-1 (clone #11) see section 4.5.6. The alignment was generated using MultAlin and edited using BioEdit.
Consensus amino acid residues are boxed in grey.
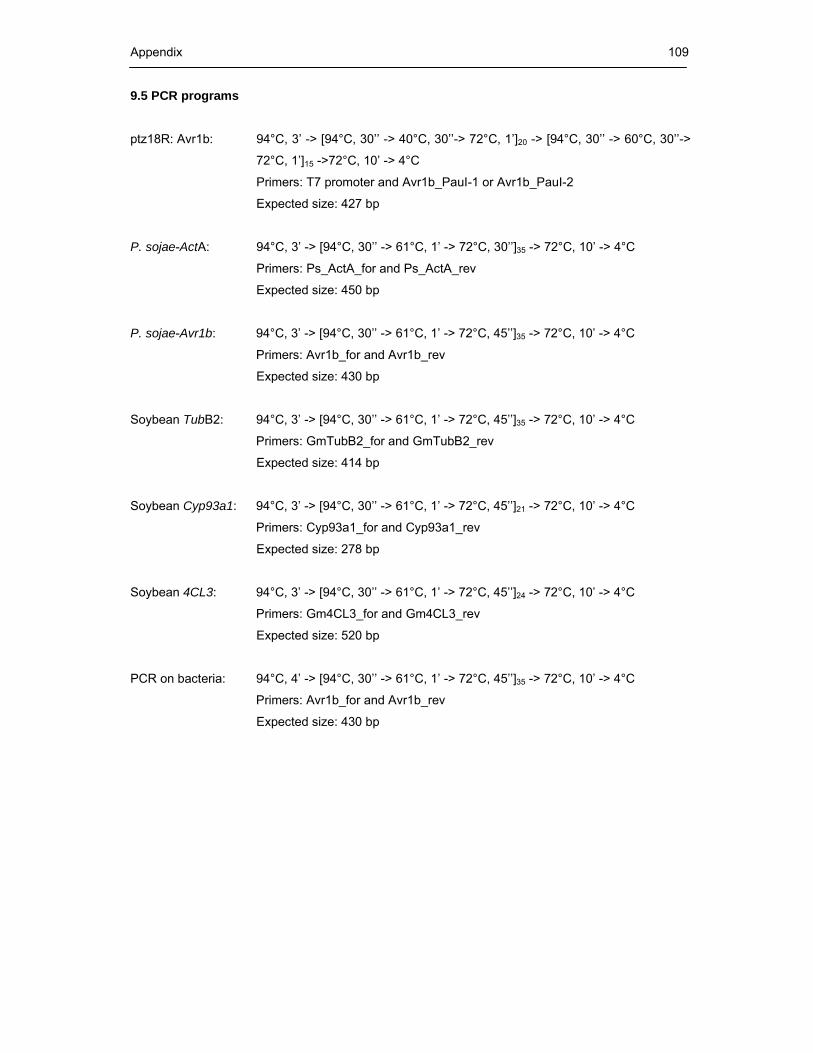
Appendix 109
9.5 PCR programs
ptz18R: Avr1b: 94°C, 3’ -> [94°C, 30’’ -> 40°C, 30’’-> 72°C, 1’]20 -> [94°C, 30’’ -> 60°C, 30’’->
72°C, 1’]15 ->72°C, 10’ -> 4°C
Primers: T7 promoter and Avr1b_PauI-1 or Avr1b_PauI-2
Expected size: 427 bp
P. sojae-ActA: 94°C, 3’ -> [94°C, 30’’ -> 61°C, 1’ -> 72°C, 30’’]35 -> 72°C, 10’ -> 4°C
Primers: Ps_ActA_for and Ps_ActA_rev
Expected size: 450 bp
P. sojae-Avr1b: 94°C, 3’ -> [94°C, 30’’ -> 61°C, 1’ -> 72°C, 45’’]35 -> 72°C, 10’ -> 4°C
Primers: Avr1b_for and Avr1b_rev
Expected size: 430 bp
Soybean TubB2: 94°C, 3’ -> [94°C, 30’’ -> 61°C, 1’ -> 72°C, 45’’]35 -> 72°C, 10’ -> 4°C
Primers: GmTubB2_for and GmTubB2_rev
Expected size: 414 bp
Soybean Cyp93a1: 94°C, 3’ -> [94°C, 30’’ -> 61°C, 1’ -> 72°C, 45’’]21 -> 72°C, 10’ -> 4°C
Primers: Cyp93a1_for and Cyp93a1_rev
Expected size: 278 bp
Soybean 4CL3: 94°C, 3’ -> [94°C, 30’’ -> 61°C, 1’ -> 72°C, 45’’]24 -> 72°C, 10’ -> 4°C
Primers: Gm4CL3_for and Gm4CL3_rev
Expected size: 520 bp
PCR on bacteria: 94°C, 4’ -> [94°C, 30’’ -> 61°C, 1’ -> 72°C, 45’’]35 -> 72°C, 10’ -> 4°C
Primers: Avr1b_for and Avr1b_rev
Expected size: 430 bp

Appendix 110
9.6 Identification of PR-10-like protein by mass spectrometry
A
B
# b b++ b* b*++ b0 b0++ Seq. y y++ y* y*++ y0 y0++ #
1 72.04 36.53 A 12
2 185.13 93.07 L 1184.65 592.83 1167.63 584.32 1166.64 583.82 11
3 284.20 142.60 V 1071.57 536.29 1054.54 527.77 1053.56 527.28 10
4 385.24 193.13 367.23 184.12 T 972.50 486.75 955.47 478.24 954.49 477.75 9
5 500.27 250.64 482.26 241.63 D 871.45 436.23 854.43 427.72 853.44 427.22 8
6 571.31 286.16 553.30 277.15 A 756.43 378.72 739.40 370.20 738.41 369.71 7
7 686.34 343.67 668.32 334.67 D 685.39 343.20 668.36 334.68 667.38 334.19 6
8 800.38 400.69 783.35 392.18 782.37 391.69 N 570.36 285.68 553.33 277.17 5
9 899.45 450.23 882.42 441.71 881.44 441.22 V 456.32 228.66 439.29 220.15 4
10 1012.53 506.77 995.50 498.26 994.52 497.76 I 357.25 179.13 340.22 170.62 3
11 1109.58 555.30 1092.56 546.78 1091.57 546.29 P 244.17 122.59 227.14 114.07 2
12 K 147.11 74.06 130.09 65.55 1

Appendix 111
C
D
# b b++ b* b*++ b0 b0++ Seq. y y++ y* y*++ y0 y0++ #
1 58.029 29.52 G 11
2 173.06 87.03 155.05 78.03 D 1158.5 579.8 1141.5 571.3 1140.5 570.8 10
3 244.09 122.6 226.08 113.5 A 1043.5 522.3 1026.5 513.7 1025.5 513.2 9
4 373.14 187.1 355.12 178.1 E 972.46 486.7 955.44 478.2 954.45 477.7 8
5 470.19 235.6 452.18 226.6 P 843.42 422.2 826.39 413.7 825.41 413.2 7
6 584.23 292.6 567.2 284.1 566.22 283.6 N 746.37 373.7 729.34 365.2 728.36 364.7 6
7 712.29 356.6 695.26 348.1 694.28 347.6 Q 632.32 316.7 615.3 308.2 614.31 307.7 5
8 827.32 414.2 810.29 405.6 809.31 405.2 D 504.27 252.6 487.24 244.1 486.26 243.6 4
9 956.36 478.7 939.33 470.2 938.35 469.7 E 389.24 195.1 372.21 186.6 371.23 186.1 3
10 1069.4 535.2 1052.4 526.7 1051.4 526.2 L 260.2 130.6 243.17 122.1 2
11 K 147.11 74.06 130.09 65.55 1
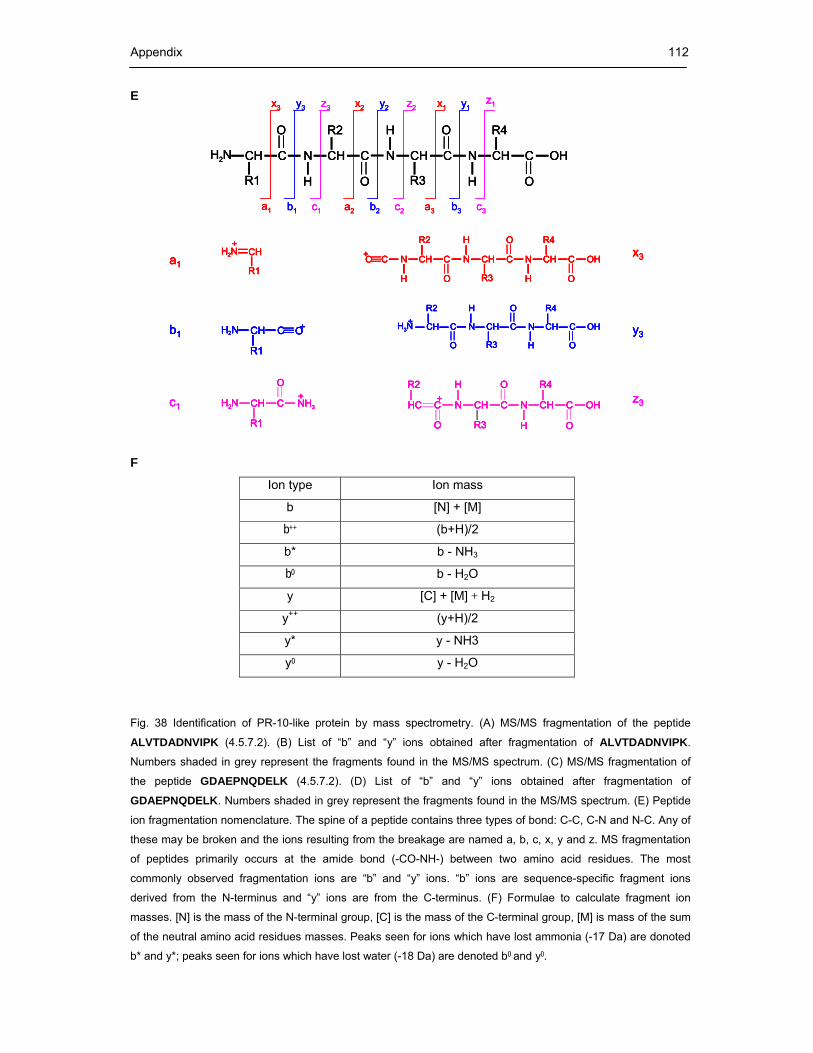
Appendix 112
b1
y3
c1
z3
a2 b2 c2
x2 y2 z2
a3 b3 c3
x1 y1z1
H2N CH
R1
C
O
N
H
CH
R2
C
O
N
H
CH
R3
C
O
N
H
CH
R4
C
O
OH
H2N CH
R1
+
a1x3CO N
H
CH
R2
C
O
N
H
CH
R3
C
O
N
H
CH
R4
C
O
OH+
H2N CH
R1
C O+b1 y3H3N CH
R2
C
O
N
H
CH
R3
C
O
N
H
CH
R4
C
O
OH+
c1z3H2N CH
R1
C
O
NH3+
HC
R2
C
O
N
H
CH
R3
C
O
N
H
CH
R4
C
O
OH+
a1
x3
b1
y3
b1
y3
c1
z3
c1
z3
a2 b2 c2
x2 y2 z2
a3 b3 c3
x1 y1z1
a2 b2 c2
x2 y2 z2
a3 b3 c3
x1 y1z1
H2N CH
R1
C
O
N
H
CH
R2
C
O
N
H
CH
R3
C
O
N
H
CH
R4
C
O
OH
H2N CH
R1
+
a1x3CO N
H
CH
R2
C
O
N
H
CH
R3
C
O
N
H
CH
R4
C
O
OH+
H2N CH
R1
C O+b1 y3H3N CH
R2
C
O
N
H
CH
R3
C
O
N
H
CH
R4
C
O
OH+
c1z3H2N CH
R1
C
O
NH3+
HC
R2
C
O
N
H
CH
R3
C
O
N
H
CH
R4
C
O
OH+
H2N CH
R1
C
O
N
H
CH
R2
C
O
N
H
CH
R3
C
O
N
H
CH
R4
C
O
OH
H2N CH
R1
+
a1x3CO N
H
CH
R2
C
O
N
H
CH
R3
C
O
N
H
CH
R4
C
O
OH+H2N CH
R1
+
a1x3CO N
H
CH
R2
C
O
N
H
CH
R3
C
O
N
H
CH
R4
C
O
OH+
H2N CH
R1
C O+b1 y3H3N CH
R2
C
O
N
H
CH
R3
C
O
N
H
CH
R4
C
O
OH+H2N CH
R1
C O+H2N CH
R1
C O+b1 y3H3N CH
R2
C
O
N
H
CH
R3
C
O
N
H
CH
R4
C
O
OH+
c1z3H2N CH
R1
C
O
NH3+
HC
R2
C
O
N
H
CH
R3
C
O
N
H
CH
R4
C
O
OH+c1z3H2N CH
R1
C
O
NH3+
HC
R2
C
O
N
H
CH
R3
C
O
N
H
CH
R4
C
O
OH+
a1
x3
a1
x3 E
F
Ion type Ion mass
b [N] + [M]
b++ (b+H)/2
b* b - NH3
b0 b - H2O
y [C] + [M] + H2
y++ (y+H)/2
y* y - NH3
y0 y - H2O
Fig. 38 Identification of PR-10-like protein by mass spectrometry. (A) MS/MS fragmentation of the peptide
ALVTDADNVIPK (4.5.7.2). (B) List of “b” and “y” ions obtained after fragmentation of ALVTDADNVIPK.
Numbers shaded in grey represent the fragments found in the MS/MS spectrum. (C) MS/MS fragmentation of
the peptide GDAEPNQDELK (4.5.7.2). (D) List of “b” and “y” ions obtained after fragmentation of
GDAEPNQDELK. Numbers shaded in grey represent the fragments found in the MS/MS spectrum. (E) Peptide
ion fragmentation nomenclature. The spine of a peptide contains three types of bond: C-C, C-N and N-C. Any of
these may be broken and the ions resulting from the breakage are named a, b, c, x, y and z. MS fragmentation
of peptides primarily occurs at the amide bond (-CO-NH-) between two amino acid residues. The most
commonly observed fragmentation ions are “b” and “y” ions. “b” ions are sequence-specific fragment ions
derived from the N-terminus and “y” ions are from the C-terminus. (F) Formulae to calculate fragment ion
masses. [N] is the mass of the N-terminal group, [C] is the mass of the C-terminal group, [M] is mass of the sum
of the neutral amino acid residues masses. Peaks seen for ions which have lost ammonia (-17 Da) are donoted
b* and y*; peaks seen for ions which have lost water (-18 Da) are denoted b0 and y0.

Acknowledgments 113
Acknowledgments
I would like to thank the people who helped me during this work:
Prof. Dr. Jürgen Ebel for giving me the opportunity to work in his group, in this interesting project.
Thanks also for his advise, ideas, explanations and all the interesting discussions we had about
the work.
Dr. Judith Fliegmann for her continuous help during my doctoral work. For being always there to
give me advice and explanations to my questions. Thanks also for teaching me many of the
methods I have used here and for the constructive and nice discussions we have had. Thanks
also for reading this manuscript.
Dr. Julie Leclercq for her continuous help during the second part of my doctoral work, for all the
explanations about molecular biology and her ideas about the work.
Dr. Martina Silber for her valuable help and for the constructive discussions about the work.
Thanks also for teaching me some of the methods I used in this work.
Kosta Konstantinidis for his help during the time he worked in the laboratory, for his constructive
critics about my work and for his help after he left the group (without him, the work with the HPLC
could have been really difficult). Thanks also for sequencing Avr1b from infected soybean plants
in the Max Planck Institute and for reading this manuscript. +LP"DÊFJf Bo8b.
Andreas Fröhling, we worked together during part of this work and developed some of the
methods used here.
Dr. Axel Mithöfer for his help and comments about this work.
Dr. Christian Lindmayer, Agnes Walter, Alma Djulić, Karin Schmieja, Tilman Schlunck, Lisa
Hueber, Katarina Furtwangler, Ruth Aulinger and Georg Malterer for their valuable help in the
laboratory.
Dr. Lutz Eichacker and Bernhard Granvogel for sequencing Avr1b from insect cells.
The group of Prof. Dr. Ulrich Koop, namely Stefan Kirchner, Lars Scharf, Alexander Dovzenko,
Uta Geldermann and Jessica Zühlke for their valuable help.

Acknowledgments 114
Gracias al Dr. Eric Cosio por introducirme al grupo del Prof. Dr. Ebel. Gracias también por su
ayuda y comentarios acerca de este trabajo.
Finalmente las gracias a mis padres Arlene y Goyo y a mi hermana Olga, por su constante apoyo
y por estar siempre junto a mi aun cuando se encontraban tan lejos.

Erklärung 115
Erklärung
Hiermit erkläre ich, daß die vorliegende Doktorarbeit selbstständig und nur mit den angegebenen
Hilfsmitteln angefertigt wurde. Ebenfalls versichre ich, dass ich zuvor nirgendwo anders
promoviert habe bzw. nirgendwo anders mit einer Promotion angefangen habe.
Karina Valer
Lebenslauf 116
Lebenslauf Name: Karina Valer Saldaña
Geburtstag: 29.07.1977
Geburtsort: Lima (Peru)
Staatsangehörigkeit: spanisch
Familienstand: ledig
Anschrift: Tegernseer Landstr. 129. 81539-München
Schulbildung: 1993 allgemeine Hochschulreife,
San Jose de Monterrico, Lima (Peru)
Studium: 1994 Vorbereitungskurse für die universitäre
Aufnahmeprüfung
1995-2000 Bachelor Chemie,
Pontificia Universidad Católica del Peru, Lima
2000-2001 Diplom Chemie,
Pontificia Universidad Católica del Peru, Lima
sowie Botanisches Institut, LMU, München
2001-2002 hilfswissenschaftliche Tätigkeiten,
Pontificia Universidad Católica del Peru, Lima
2002-2006 Doktorarbeit Biologie,
Botanisches Institut, LMU, München
Sprachkenntnisse: spanisch; englisch