aviva family finances report 2016 · the typical family income has dropped ... rises, the typical...
TRANSCRIPT
Retirement Investments Insurance Health
Family Finances Report January 2016
Welcome to Aviva’s Family Finances Report January 2016
02 Income The typical family income has
dropped for the first time since Summer 2012
04 Expenditure The cost of the average weekly food
shop has fallen by £7 in the last six months, adding up to £364 over the course of a year
06 Family borrowing Household debt has shot up by 42% in
the last year to reach a 2 ½ year high
08 Savings Falling incomes have pulled in the
reins on savings habits, but family pots have grown substantially over the past five years
10 Housing wealth Homeownership among UK
families has fallen back as more find themselves living in the private rental sector
12 A look to the future More than one in five families (22%)
now say they have made no financial preparation for the future, up from 18% a year ago
14 Regional variations Yorkshire and the Humber has
replaced the North East as the region with the lowest level of family income, while Scottish families are most likely to have saved for a rainy day
16 Spotlight: The taboo of death
•AlthoughtwointhreeadultsinUK families have thought about their own mortality, just one in five feel prepared for their own death.
•Morewomenthanmenfeelthesubject is too painful to consider, but they also worry more about not having made financial preparations for their children.
•Almosthalfofparentshavenotdiscussed what might happen to their family if the worst was to happen to them.
Contents
01Aviva Family Finances Report
January 2016
Introduction and overview
It has been five years since the Aviva Family Finances Report began tracking the fluctuating fortunes of the different family types that make up the modern UK population.
Back then, the country was barely out of recession and still feeling the effects of the global financial crisis. Much has improved in the intervening years, but our latest findings from research carried out in October 2015 show that balancing the books and saving for the future remain a daily challenge for many families.
In particular, it is a worry to see that for all the talk of the economic outlook getting better, families are getting by from month to month on less income than they were when we first began examining this in Winter 2010. The jobs situation has improved, but this has not yet translated into higher earnings for UK families in the way we might have hoped.
At a time when the Government has been focusing on reducing the national deficit, families have made significant progress over the last five years to grow their savings pots. Across the board, the six different types of families examined by our research now have noticeably more saved or invested than they did in Winter 2010.
However, when you compare these larger savings pots to UK families’ typical monthly incomes, our data suggests that many still have relatively little room for manoeuvre and could quickly run into difficulties if their circumstances were to change.
With that in mind, as well as examining the fundamentals of income, spending, saving, borrowing, protection and living situations, this edition of the Family Finances Report takes a detailed look at one of the most sensitive subjects for families to discuss: the taboo of death and its implications for their financial security.
There are many reasons why preparing for the worst often falls down the agenda, not least due to the pressures and distractions of everyday life and our modern culture of ‘seizing the day’ and ‘living life to the full’. But with the majority of adults having experienced the death of a family member, the fact that so many have not made any financial preparations in case the unforeseen happens is a worry for us all.
There are signs that some families have decided that taking action simply isn’t necessary, but when few open conversations are had about the subject, it is difficult to be confident that people are truly comfortable with this decision and not simply avoiding the issue.
It is a particularly important issue to address at a time when there are signs that income and savings habits are coming under renewed pressure and the spectre of unsecured borrowing has reared its head again. Finding room in the monthly budget to help plan for the unexpected can be hard, but taking steps to do so – practically as well as financially – can relieve untold difficulties in the long run.
Louise ColleyManaging Director, Protection, Aviva
02Aviva Family Finances Report January 2016
IncomeThe typical family income has dropped for the first time since Summer 2012
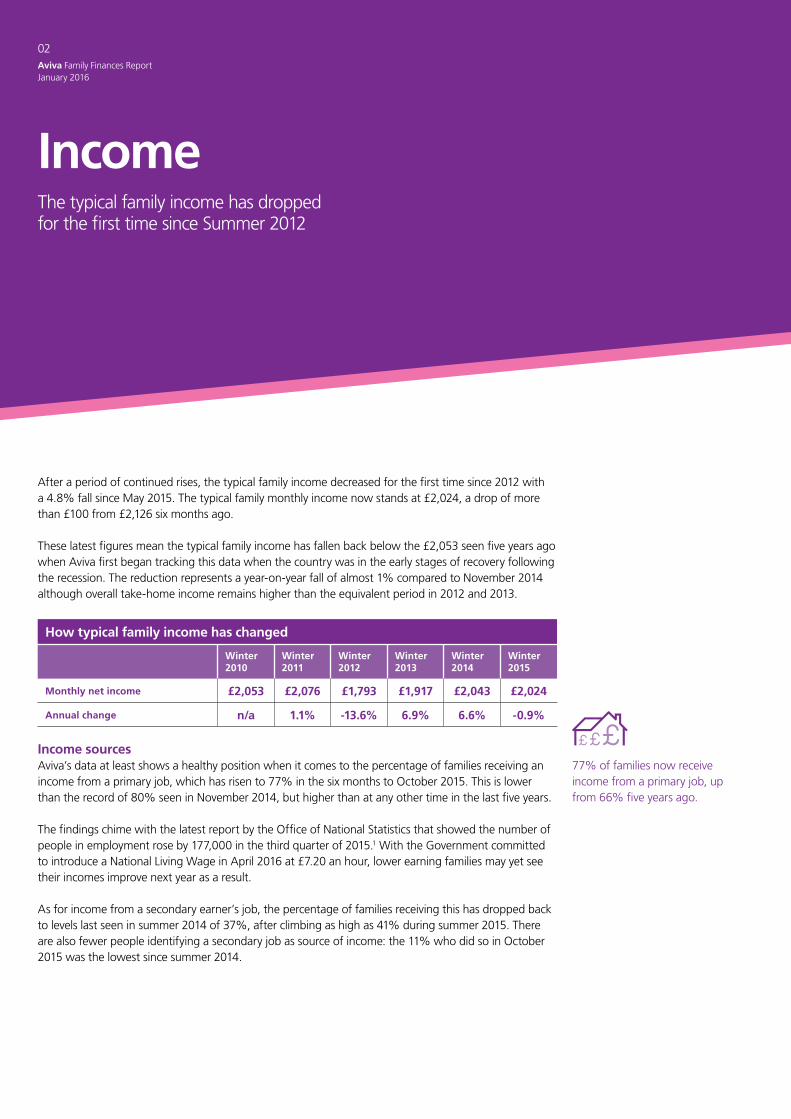
77% of families now receive income from a primary job, up from 66% five years ago.
After a period of continued rises, the typical family income decreased for the first time since 2012 with a 4.8% fall since May 2015. The typical family monthly income now stands at £2,024, a drop of more than £100 from £2,126 six months ago.
These latest figures mean the typical family income has fallen back below the £2,053 seen five years ago when Aviva first began tracking this data when the country was in the early stages of recovery following the recession. The reduction represents a year-on-year fall of almost 1% compared to November 2014 although overall take-home income remains higher than the equivalent period in 2012 and 2013.
How typical family income has changed
Winter 2010
Winter 2011
Winter 2012
Winter 2013
Winter 2014
Winter 2015
Monthly net income £2,053 £2,076 £1,793 £1,917 £2,043 £2,024
Annual change n/a 1.1% -13.6% 6.9% 6.6% -0.9%
Income sourcesAviva’s data at least shows a healthy position when it comes to the percentage of families receiving an income from a primary job, which has risen to 77% in the six months to October 2015. This is lower than the record of 80% seen in November 2014, but higher than at any other time in the last five years.
The findings chime with the latest report by the Office of National Statistics that showed the number of people in employment rose by 177,000 in the third quarter of 2015.1 With the Government committed to introduce a National Living Wage in April 2016 at £7.20 an hour, lower earning families may yet see their incomes improve next year as a result.
As for income from a secondary earner’s job, the percentage of families receiving this has dropped back to levels last seen in summer 2014 of 37%, after climbing as high as 41% during summer 2015. There are also fewer people identifying a secondary job as source of income: the 11% who did so in October 2015 was the lowest since summer 2014.
03Aviva Family Finances Report
January 2016
Families see the benefit of the jobs recovery%
Winter 2010
Summer 2015
Winter 2015
Families receiving income from a primary job 66 76 77
Families receiving income from a spouse’s job 35 41 37
Families and benefitsThe latest Aviva data also highlights how many families include state benefits as part of their overall income. Many lower earning families will have welcomed the Government’s decision in its latest Autumn Statement and Spending Review to reverse its scheduled tax credit cuts. Nevertheless, the number citing benefits as part of their monthly income has already fallen noticeably since 2010. Parents who are single, divorced, separated or widowed have been especially affected.
Benefits as a source of income across different family types%
Winter 2010
Winter 2015
Change in percentage points
Single raising one or more children alone 50 36 -14
Divorced, separated or widowed and raising one or more children 46 28 -18
Married or committed relationship and one child 23 14 -9
Married or committed relationship and two or more children 18 18 n/a
Married or committed relationship and don’t plan children 16 10 -6
Married or committed relationship and plan children 6 6 n/a
All families 20 16 -4
With a long-term plan of the current Government being further reductions in the welfare budget, these numbers may fall further in the coming years. Even without the tax credit cuts, the Institute of Fiscal Studies has still warned that working age benefits will be reduced to their lowest level as a share of national income for 30 years because of the latest Spending Review: leaving around 2.6 million working families an average of £1,600 a year worse off.2
Louise Colley, Managing director, protection, Aviva
“Family incomes have fluctuated over the last five years, and the fact that the typical monthly post-tax income is no better than it was after the end of the recession will clearly prey on people’s minds and make saving even more of a challenge. There is at least some comfort to take from signs that the outlook for jobs is improving, and families can look to 2016 with the hope that the rising minimum wage will make a tangible difference to the outlook for some of those at the lower end of the pay scale.”
1 ONS Labour Market Statistics, 11 November 2015, http://www.ons.gov.uk/ons/rel/lms/labour-market-statistics/november-2015/sty-labour-market-statistics--november-2015.html
2 Sky News, Osborne Cuts ‘To Make 2.6m Families Worse Off’, 26 November 2015, http://news.sky.com/story/1594887/osborne-cuts-to-make-2-6m-families-worse-off
The percentage of single, divorced, separated and widowed parents receiving benefits has fallen visibly since 2010.
04Aviva Family Finances Report January 2016
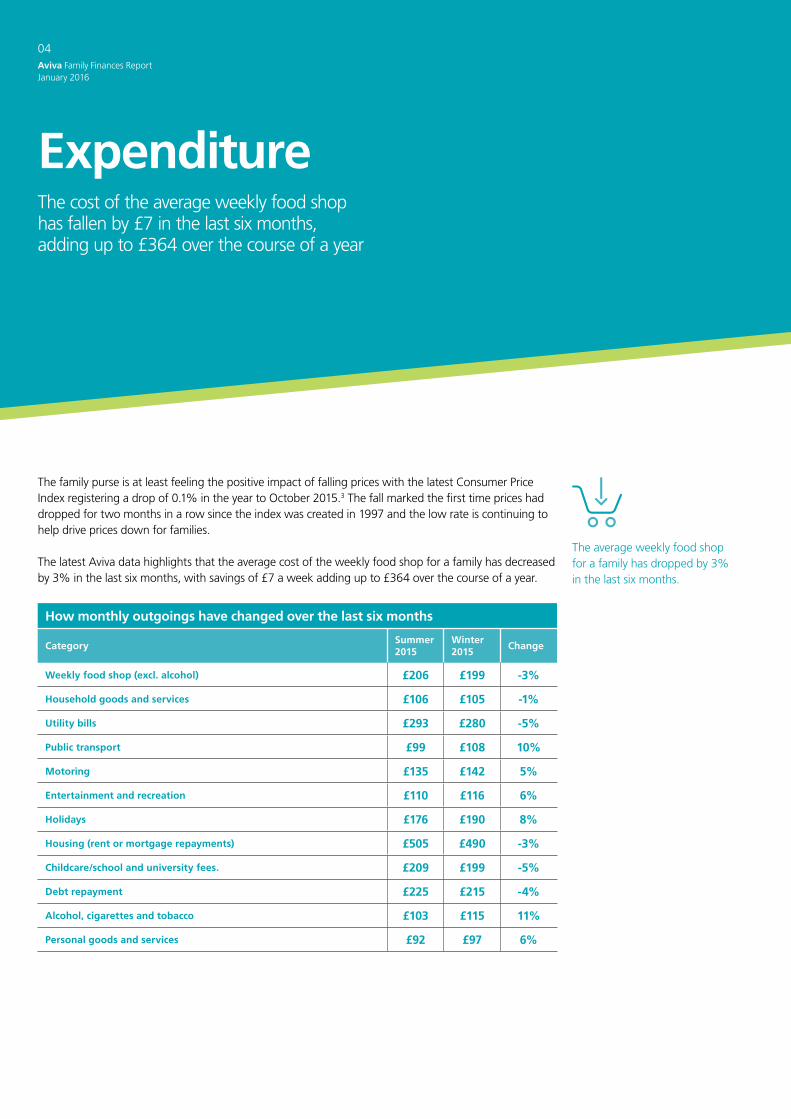
ExpenditureThe cost of the average weekly food shop has fallen by £7 in the last six months, adding up to £364 over the course of a year
The average weekly food shop for a family has dropped by 3% in the last six months.
The family purse is at least feeling the positive impact of falling prices with the latest Consumer Price Index registering a drop of 0.1% in the year to October 2015.3 The fall marked the first time prices had dropped for two months in a row since the index was created in 1997 and the low rate is continuing to help drive prices down for families.
The latest Aviva data highlights that the average cost of the weekly food shop for a family has decreased by 3% in the last six months, with savings of £7 a week adding up to £364 over the course of a year.
How monthly outgoings have changed over the last six months
CategorySummer 2015
Winter 2015
Change
Weekly food shop (excl. alcohol) £206 £199 -3%
Household goods and services £106 £105 -1%
Utility bills £293 £280 -5%
Public transport £99 £108 10%
Motoring £135 £142 5%
Entertainment and recreation £110 £116 6%
Holidays £176 £190 8%
Housing (rent or mortgage repayments) £505 £490 -3%
Childcare/school and university fees. £209 £199 -5%
Debt repayment £225 £215 -4%
Alcohol, cigarettes and tobacco £103 £115 11%
Personal goods and services £92 £97 6%
05Aviva Family Finances Report
January 2016
“The low inflation rate is likely to have been one of the factors giving a short term boost to the family finances when it comes to spending on essential items. With prices falling, it seems families feel they have more flexibility to increase their outlay on holidays, entertainment and personal goods. This is usually a sign of growing confidence, but taken in context of the rise in debt shown elsewhere in this report, it could become a cause for concern – even if spending on luxury items is more modest than it was five years ago.”
Other points of note in family spending habits since Summer 2015 include a slight drop in other essential spending such as utility bills, childcare and school fees, as well as an increase in transport costs and ‘luxury’ spending on entertainment, recreation and holidays.
Expenditure on housing – either rent or mortgage repayments – also fell slightly in winter 2015 to £490, down by 3% from £505 in summer 2015. This is likely to have been driven by falls in mortgage pricing over the last 12 months, given that rents are reported to have risen by 8.5% in the year to September 2015. Some housing commentators have expressed concern that tax changes affecting landlords – the removal of mortgage tax relief and increase in Stamp Duty – may put extra pressure on the private rented sector and push up rents even further during 2016.
Over the longer term, families are still spending 26% less each month on entertainment and recreation than they were five years ago, with an average monthly outlay of £83 in Winter 2015 compared with £112 in Winter 2010. On the other hand, spending on leisure goods such as sports equipment or music has gone up by 7% over the same period from £77 to £82.
Monthly spending on food has risen by 6% to reach £267, having been £251 when Aviva first began tracking this data. Despite falling petrol prices, motoring spend has risen by 10% in this period from £119 to £130. This may be a sign of families making more use of their own transportation, as spending on public transport has dropped by 8% in the last five years from £107 to £98.
3 Consumer Price Index, 17 November 2015, http://ons.gov.uk/ons/rel/cpi/consumer-price-indices/october-2015/sum-cpi-october-2015.html
4 Homelet Rental Index, September 2015, http://homelet.co.uk/assets/documents/September-2015-HomeLet-Rental-Index.pdf
Louise Colley, Managing director, protection, Aviva
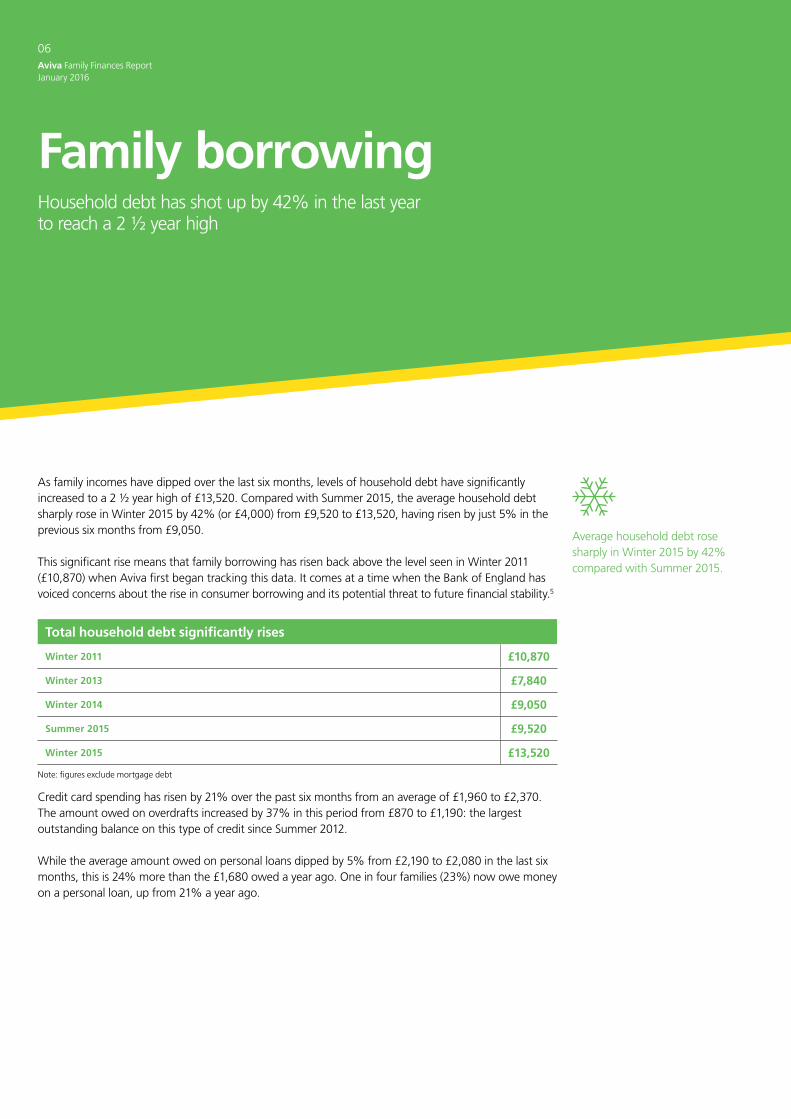
Family borrowingHousehold debt has shot up by 42% in the last year to reach a 2 ½ year high
As family incomes have dipped over the last six months, levels of household debt have significantly increased to a 2 ½ year high of £13,520. Compared with Summer 2015, the average household debt sharply rose in Winter 2015 by 42% (or £4,000) from £9,520 to £13,520, having risen by just 5% in the previous six months from £9,050.
This significant rise means that family borrowing has risen back above the level seen in Winter 2011 (£10,870) when Aviva first began tracking this data. It comes at a time when the Bank of England has voiced concerns about the rise in consumer borrowing and its potential threat to future financial stability.5
Total household debt significantly rises
Winter 2011 £10,870
Winter 2013 £7,840
Winter 2014 £9,050
Summer 2015 £9,520
Winter 2015 £13,520
Note: figures exclude mortgage debt
Credit card spending has risen by 21% over the past six months from an average of £1,960 to £2,370. The amount owed on overdrafts increased by 37% in this period from £870 to £1,190: the largest outstanding balance on this type of credit since Summer 2012.
While the average amount owed on personal loans dipped by 5% from £2,190 to £2,080 in the last six months, this is 24% more than the £1,680 owed a year ago. One in four families (23%) now owe money on a personal loan, up from 21% a year ago.
06Aviva Family Finances Report January 2016
Average household debt rose sharply in Winter 2015 by 42% compared with Summer 2015.
07Aviva Family Finances Report
January 2016
5 The Guardian, Consumer spending rise troubles Bank of England, 24 November 2015, http://www.theguardian.com/business/2015/nov/24/consumer-spending-troubling-bank-of-england
Comparing family types, married couples have almost twice the level of personal debt than parents raising children alone (£14,500 vs. £6,370). Those couples with two or more children have the most aggregate debt of any family type examined by this research, totalling £18,830 among those who borrow. This is more than three times the average £5,070 owed by single parents raising children alone, who are the lowest borrowers of any family type.
How total debts compare across those families who borrow
Married or committed relationship and don’t plan children £10,820
Married or committed relationship and plan children £8,680
Married or committed relationship and one child £12,720
Married or committed relationship and two or more children £18,830
Divorced, separated or widowed and raising one or more children £5,250
Single raising one or more children alone £5,070
Married (net) £14,500
Raising children alone (net) £6,370
Note: figures exclude mortgage debt
Married couples have almost twice the level of personal debt than parents raising children alone.
“We have seen consumer borrowing peak this Winter with couples with more than one child registering the most debt. One of the biggest pressure points comes with the arrival of a new child, when family income often drops and spending increases out of necessity. Even so, these rising levels of borrowing are concerning, especially as the base rate will eventually go up, and consumers should understand what this will mean for their debt.”
Louise Colley, Managing director, protection, Aviva
08Aviva Family Finances Report January 2016
Savings Falling incomes have pulled in the reins on savings habits, but family pots have grown substantially over the past five years
Another possible impact of the fall in family incomes is that the average amount they are able to save each month has declined for the first time since winter 2013: falling by 7% from £113 in Summer 2015 to £105.
Nevertheless, the latest saving figures are still far stronger when compared to the aftermath of the recession in 2010, when the average family was putting away just £70 a month. Over the last five years, the amount families are able to save each month has increased by 50%.
How much families are saving from 2010-2015
Winter 2010
Winter 2011
Winter 2012
Winter 2013
Winter 2014
Winter 2015
Monthly saving / investments £70 £77 £78 £80 £99 £105
Families making no saving or investments each month 35% 38% 34% 32% 27% 25%
Total family saving pot £636 £696 £1,031 £2,016 £3,303 £3,150
The typical family savings pot has risen slightly in the six months to Winter 2015 with an increase of 1% to £3,150. Although this is a drop from the equivalent period a year ago, it compares well over the longer term as families are better able to put money away – and keep it there. The latest figure of £3,150 is almost five times the average £636 pot back in Winter 2010.
While a quarter of families (25%) are still not saving anything at all per month, this has decreased by 10 percentage points over the last five years. This measure is greatly improved compared with the peak of 38% of families who were not saving anything each month at the end of 2011.
Parents who are either single, divorced, separated or widowed are significantly more likely than parent couples not to save anything each month (35% vs. 24%). However, this is still significantly better than in winter 2010 when more than half (53%) of parents raising children alone were unable to save each month, compared with 33% of married parents.
08Aviva Family Finances Report January 2016
The amount families are able to save each month has increased by 50% over the last five years.
09Aviva Family Finances Report
January 2016
Comparing savings pots across family typesComparing family types in Winter 2015, the highest level of savings is among couples that are married and not planning to have children who have a typical pot of £4,257. This level has increased significantly by 74% since 2010 when such families held pots of £1,125 on average.
The smallest average saving pot is currently held by those parents who are divorced, widowed or separated with only £917 put away for the future. However, this amount has increased considerably since Winter 2010.
It is an encouraging sign of progress that all family types have been able to increase their average savings pot over the last five years by some margin. While the average single parent had nothing put away in Winter 2010, they now have a modest pot of £563 to fall back on.
Typical saving levels breakdown across family types from 2010 until 2015
Typical family saving potWinter 2010
Winter 2015
Married or committed relationship and don’t plan children £1,125 £4,257
Married or committed relationship and plan children £1,125 £3,265
Married or committed relationship and one child £929 £4,071
Married or committed relationship and two or more children £613 £3,758
Divorced, separated or widowed and raising one or more children £44 £917
Single raising one or more children alone £0 £563
Average savings pots are almost five times bigger now than in Winter 2010.
“A growing number of families have used the last five years as a chance to step up their savings habits. It is especially encouraging to see that savings pots have risen across all types of families, including those who typically have less income each month to save from. Even so, the typical savings pot still amounts to barely one and a half month’s income for the typical family, which can be eroded all too quickly by an unexpected change of circumstance.”
Louise Colley, Managing director, protection, Aviva
10Aviva Family Finances Report January 2016
Housing wealth Homeownership among UK families has fallen back as more find themselves living in the private rental sector
Aviva’s latest research shows that the median value of a family home rose by just 0.7% in the past 12 months from £183,100 to £184,300. This is an increase of less than 1% in the last six months, from £183,810 recorded in Summer 2015.
Since Winter 2010, house prices rose from £168,650 by 9.4%, suggesting a recent slowdown in growth compared to long-term trends. This may continue as the Government’s plan to build 400,000 affordable homes by 2020-2021 gradually comes into fruition, easing some of the supply pressures that have pushed up house prices in recent years.6
Housing wealth has increased as mortgage debt falls in the short-term
Winter 2010
Winter 2014
Summer 2015
Winter 2015
Typical housing wealth £168,650 £183,100 £183,810 £184,300
Typical mortgage debt £51,850 £58,420 £64,400 £62,850
As house prices have seen a gentle climb in the last six months, the amount owed in mortgage debt has dropped by 2% in this period, as families have succeeded in paying down some of their mortgage debt. However, in the last five years, mortgage debt is now 21% higher than the £51,850 owed in Winter 2010, meaning this kind of borrowing has seen a far greater percentage increase than the median family house price over this period.
With pressure on aspiring homeowners to raise a big enough deposit, this upwards trend in mortgage debt over the longer term may be a sign that families who have bought a new home in this period have had to take on bigger loans.
Looking ahead, the Government’s newly launched Help to Buy ISA scheme should help families looking to buy their first home to tackle the deposit savings challenge by giving them tax-free interest and a 20% bonus payment worth up to £3,000 each.
10Aviva Family Finances Report January 2016
Mortgage debt among families is 21% higher at £62,8520 compared to £51,850 five years ago.
11Aviva Family Finances Report
January 2016
Types of tenureHomeownership with a mortgage has crept up slightly over the last five years from 47% to 49%, although fewer UK families fall into this category in Winter 2015 than twelve months ago (51%). Aviva’s data suggests homeownership among UK families – either with or without a mortgage – has dropped from aggregate of 70% twelve months ago to 66% in the latest figures. The 18% currently in private rented accommodation is the highest percentage seen for three years since Winter 2012.
Families in the housing market%
Winter 2014
Summer 2015
Winter 2015
A home we own with a mortgage 51 51 49
Home owned outright 19 17 17
Private rental 17 17 18
Social housing 12 13 13
Live with family 1 – 1
While the value of families’ main homes has gently increased, the value of other properties they own has continued to fall. The average value of properties besides UK families’ main home was worth £102,120 in Winter 2015, down 16% in total since Winter 2010 when the typical second property was worth £121,090.
This does not appear to have dissuaded more families from buying an investment property to prepare themselves for the future. Just 4% of families had done this in Winter 2010, compared to 7% of families now. However, the prospects of more joining this group in future may be restricted by the Autumn Statement announcement that second homes will be liable for stamp duty at a rate that is three percentage points higher than primary residential homes. The appeal of property investment as a way to help fund retirement may diminish as a result.
Percentage of families who have bought an investment property%
Winter 2010 Winter 2014 Summer 2015 Winter 2015
4 7 6 7
The 18% of families currently in private rented accommodation is the highest percentage seen for three years.
6 HM Treasury, Spending Review and Autumn Statement 2015, November 2015, https://www.gov.uk/government/uploads/system/uploads/attachment_data/file/479749/52229_Blue_Book_PU1865_Web_Accessible.pdf
“It is promising to see mortgage debt falling in recent months, as people continue to benefit from the low rates on the market. However, the Government’s recent announcements come with good and bad news depending on your position in the housing market. The initiative to build more houses is designed to help meet unsatisfied demand for homeownership, but the stamp duty changes may limit the appeal of buying investment properties in future. With more families living in the private rental sector, there is also a need to ensure their incomes are protected so they can keep up with rent payments even if their circumstances change.”
Louise Colley, Managing director, protection, Aviva
12Aviva Family Finances Report January 2016
A look to the futureMore than one in five families (22%) now say they have made no financial preparation for the future, up from 18% a year ago
More adults in UK families are worried about the threat of serious illness to themselves, a partner or their children than was the case five years ago, which raises concerns that so many lack financial protection as the spotlight section of this report shows.
Unexpected expenses remain the biggest threat to standard of living among UK families. This has fallen in the past six months from 60% to 57%, but is still noticeably higher than the 39% of families who shared this concern five years ago in Winter 2010.
While just 13% of families were worried about higher mortgage rates back in Winter 2010, more than one in five (22%) now cite this as a concern. This may be influenced by the 21% rise in mortgage debt over the same period, and the fact that mortgaging pricing fell to record lows in 2015 and is anticipated to rise as the Bank of England considers increasing the base rate.
Although household debt has seen a significant jump in the past six months, continued low inflation has meant the financial concerns of UK families are otherwise relatively stable. Fewer families are worried about increasing prices for basic necessities, down from 51% to 49% in the past six months and significantly lower than the 65% who voiced this concern two years ago.
The fear of losing a job has also fallen in the past two years from 49% to 46% as the outlook for employment has improved, although it means slightly more families have this concern now than in Winter 2010 (45%).
12Aviva Family Finances Report January 2016
Unexpected expenses remain the biggest threat to standards of living among UK families.
“Low inflation is playing a significant role in containing people’s concerns over the basic cost of living. Nevertheless, it is worrying to see fewer families making finical preparations for the future, despite the benefits of the current low-inflation, low-interest rate environment. The threat of serious illness is clearly playing on people’s minds, but not to the extent that it is prompting more people into action to safeguard their future.”
Louise Colley, Managing director, protection, Aviva
13Aviva Family Finances Report
January 2016
How financial concerns have changed over the last five years%
Winter 2010
Winter 2015
Five year change in percentage points
Unexpected expenses (e.g. major repairs to home) 39 57 +18
Significant increase in the price of the basic necessities for living (e.g. food or utilities) 57 49 -8
Losing my/our jobs (i.e. redundancy) 45 46 +1
Serious illness (for me or my partner or children) 20 32 +12
Higher mortgage rates 13 22 +9
Loss/changes to current Government benefits 24 20 -4
Lower savings rates on savings 8 16 +8
Breakdown of relationship 7 14 +7
Inability to keep up with any debt repayments 13 13 –
Continued unemployment – 11 n/a
Paying for significant expenses such as university 5 9 +4
Loss of income from investments 3 7 +4
Aviva’s data also shows how the dip in family incomes and rise in unsecured borrowing over the last year has impacted financial preparations for the future. Compared to Winter 2014, fewer families are now saving for a rainy day (42% vs. 44%) and there has been a rise in the number who say they have not made any financial preparations for the future: 22% now say this is the case, up from 18% a year ago.
How financial preparations for the future have shifted over the last year%
Winter 2014
Winter 2015
One year change in percentage points
I am saving for a rainy day 44 42 -2
I have started a private / employer pension and am paying into it 34 33 -1
I have taken out life insurance 31 33 +2
I have made a will 25 26 +1
I have started a savings account for my children 25 25 –
I have not made any financial preparation for the future 18 22 +4
I have invested into financial products such as bonds or shares 16 16 –
I have taken out critical illness cover 11 11 –
I have bought an investment property 7 7 –
Other 2 1 -1
Compared to Winter 2014, fewer families are now saving for a rainy day.
22% of families are worried about the threat of higher mortgage rates, up from 13% five years ago
14Aviva Family Finances Report January 2016
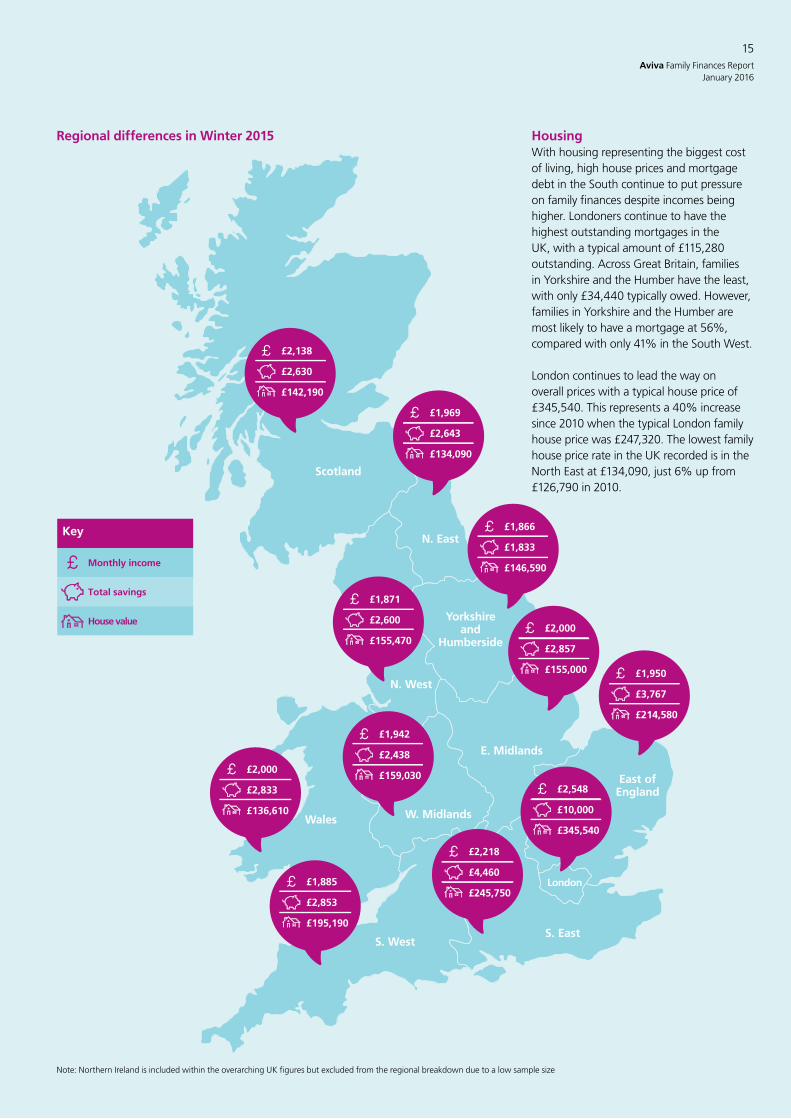
Regional variationsYorkshire and the Humber has replaced the North East as the region with the lowest level of family income, while Scottish families are most likely to have saved for a rainy day
The North-South income gapThe long-term gap in family income between the south and the north of England continues in the latest Aviva data although the figures in the six months to October 2015 show a reduction in the gap. The difference between the highest regional income (London) and lowest (Yorkshire and Humberside) was £682 in October 2015, compared with £944 in Summer 2015 (comparing London and the North East).
Yorkshire and the Humber has replaced the North East as the region with the lowest level of family income, with income decreasing by £126 to £1,866 since the Summer. While family income in London has also decreased by £191 to £2,548 in the six months to October, families in the capital still receive £330 more a month than the second highest region – the South East.
Assets and savingsAs well as having the lowest incomes, families in Yorkshire and the Humber also have the lowest saving pots in Great Britain with only £1,833 put aside. In contrast, London families have the highest saving pots with a typical safety net of £10,000. London also has the highest rate of families who own stocks or shares with 20% currently holding investments.
The East of England has the highest level of ISAs held with 47% of families holding a saving account, while the North West of England is the lowest with only a third (33%) of families holding an account.
With changes being made to ensure all employers now provide a work place pension for employees, there are healthy levels of employer pensions held by families across the UK, with the South East (53%) the highest and London (34%) the lowest.
Planning for the futureWhen it comes to having money aside to plan for unforeseen circumstances, Scottish families are well prepared as the highest region when it comes to saving for a rainy day with 47% having put money aside. Wales comes last among British regions with 37% having saved money to manage a change in circumstances.
As for acknowledging that they have not made a financial plan for the future, Welsh families come top this time with almost a third (30%) highlighting they do not have one.
14Aviva Family Finances Report January 2016
Families in Yorkshire and the Humber have the lowest incomes and smallest saving pots.
N. East
N. West
Scotland
Wales
S. WestS. East
London
East of England
W. Midlands
Yorkshire and
Humberside
E. Midlands
Key
Monthly income
Total savings
House value
£2,138
£2,630
£142,190
£1,969
£2,643
£134,090
£1,866
£1,833
£146,590
£1,871
£2,600
£155,470£2,000
£2,857
£155,000 £1,950
£3,767
£214,580
£1,942
£2,438
£159,030£2,000
£2,833
£136,610
£2,548
£10,000
£345,540
£2,218
£4,460
£245,750£1,885
£2,853
£195,190
15Aviva Family Finances Report
January 2016
HousingWith housing representing the biggest cost of living, high house prices and mortgage debt in the South continue to put pressure on family finances despite incomes being higher. Londoners continue to have the highest outstanding mortgages in the UK, with a typical amount of £115,280 outstanding. Across Great Britain, families in Yorkshire and the Humber have the least, with only £34,440 typically owed. However, families in Yorkshire and the Humber are most likely to have a mortgage at 56%, compared with only 41% in the South West.
London continues to lead the way on overall prices with a typical house price of £345,540. This represents a 40% increase since 2010 when the typical London family house price was £247,320. The lowest family house price rate in the UK recorded is in the North East at £134,090, just 6% up from £126,790 in 2010.
Regional differences in Winter 2015
Note: Northern Ireland is included within the overarching UK figures but excluded from the regional breakdown due to a low sample size
16Aviva Family Finances Report January 2016
Spotlight: the taboo of deathHow comfortable are UK families with discussing the end of life?•AlthoughtwointhreeadultsinUKfamilieshavethoughtabouttheir
own mortality, just one in five feel prepared for their own death.
•Morewomenthanmenfeelthesubjectistoopainfultoconsider, but they also worry more about not having made financial preparations for their children.
•Almosthalfofparentshavenotdiscussedwhatmighthappentotheirfamily if the worst was to happen to them.
17Aviva Family Finances Report
January 2016
Almost two in three people (62%) feel death is thought of as a taboo subject.
It is among the most sensitive subjects to confront, but safeguarding against the devastation that can come from a loss of income through serious illness or death should be a normal part of every family’s financial arrangements.
In reality, many people don’t plan in advance and leave themselves open to financial as well as emotional hardship if the worst happens. While two in three (66%) have experienced the death of a family member and a similar percentage (67%) have thought about their own mortality, only one in five (20%) feel they are prepared regarding their own death. Almost half of parents have not discussed what might happen to those they would leave behind if the worst was to happen.
Aviva’s latest research examines whether the taboo of talking about death and a culture of ‘living life to the full’ has created a society where mortality is no longer acknowledged, to adverse effect.
What stops people talking about death?Despite the emergence of pop-up ‘Death Cafes’ in recent years and Winchester having hosted the Ideal Death Show since 2011, the UK has seldom been renowned for its openness when it comes to talking about and making preparations for death.
Aviva’s data shows almost two in three people (62%) feel death is thought of as a taboo subject, which makes it hard for people to discuss their concerns. While 43% say they talk openly about death and do not view it as a taboo subject themselves, more than half (51%) say they don’t want to think or talk about their own death because they just want to enjoy their life.
Women are significantly more likely than men to feel that talking about or preparing for death is simply too painful (42% vs. 33%). Yet among those with children, women are also more likely than men to worry that they have not prepared financially to help their children if they were to die (34% vs. 26%). Parents who are raising children alone are significantly more likely to worry about this than the average across all parents (47% vs. 30%).
Despite it being an uncomfortable subject, 67% of people say they have at least thought about their mortality while 28% haven’t. Those aged 25-35 are the most likely not to have thought about it (32%), falling to 23% among 51-55 year olds. The main trigger has been the death of an older family member, followed by a death of a friend around their age, a birthday or simply getting older.
Common triggers for people to think about their mortality%
When an older family member has died 51
On a birthday, or as they get older 41
When a friend around their age has died 41
When a family member has become ill 34
When hearing about a personal tragedy in the news 30
When hearing about a news event when a number of people have died 26
When they approach the age when one of their parents died 13
7 The Observer, Anyone for tea and sympathy?, Death cafes embrace last taboo, 29 August 2015
18Aviva Family Finances Report January 2016
The dinner table is the most common place for important conversations about family life to occur: 29% of families say they do this, ahead of 21% who have these conversations in front of the television while the same percentage (21%) wait for the children to go to bed.
Funeral arrangements or life-changing illnesses rank among the topics people are most uncomfortable talking about with their parents, siblings or grown-up children. However, it is surpassed in the discomfort stakes by conversations about their sex life, debt, finances or relationship with their partner.
Most uncomfortable subjects to talk about with wider adult family%
My sex life 55
My debts and borrowing 22
My finances 21
My relationship with my partner 19
My funeral 18
A serious life-changing illness / life threatening condition 14
I am happy discussing all the above* with my family 25
* The full list included: a possible need for long-term care in the future; my will; my retirement income/pension arrangements; guardianship of children (should anything happen to me); my plans to change my housing situation (e.g. downsizing)
Even if it is not the most uncomfortable conversation people can have, Aviva’s research nevertheless shows that many families have yet to bring the topic up with those closest to them.
Among those in a relationship, barely one in three (32%) have discussed the financial impact if one of them were to die. Fewer still have discussed the practical impact (30%) or how they might address the emotional needs of the family (20%). Almost half (47%) have not discussed any aspect of the impact on the surviving partner or family. Even more parents raising at least one child alone (49%) have not discussed what might happen in the event of their death.
Within relationships, women are more likely than men not to have discussed the impact of death on the surviving family members (50% vs. 44%). However, among parents raising a family alone, it is men who are more likely than women not to have discussed what would happen to their children with anyone (61% vs. 40%). As with setting up financial or practical arrangements, a lack of urgency is a key reason why families have not discussed what would happen if they were to die: 34% feel they don’t need to face these possibilities yet.
Top five reasons why people have not discussed what would happen if they died %
I don’t think I/we need to face these possibilities yet 34
There’s always something more important to deal with 26
These issues are too big and difficult to talk about 21
I/we don’t want to put a burden on the family 14
I/we don’t think we can afford to take any measures to protect ourselves against these possibilities so there’s no point talking about it 11
Barely one in three couples (32%) have discussed the financial impact if one of them were to die.
19Aviva Family Finances Report
January 2016
The taboo surrounding death is also evident in the limited sharing of contingency plans among families and friends. More than half of people (52%) say no family member or friend has ever shared their plans with them. Encouragingly, this is less true of 25-35s (47%) than 51-55s (56%) – suggesting that younger generations may be becoming more open about these conversations.
How far do people’s experiences of bereavement shape their outlook?Among those people whose parents are both still alive, a significant number – almost two in five (39%) – have never thought to have a conversation about their parents’ wishes in the event of their death, with 38% of those aged 51-55 still saying the same. Just 12% of people have fully discussed the details of their parents’ will.
While there is an increase in the proportion of people who have discussed the details of their parent’s will to 18% among those who have experienced the death of one parent, it still leaves the majority in the dark about the details of their surviving parent’s will. The same is true of arrangements for their funeral and making decisions in the event that an illness such as dementia prevented the parent from doing this themselves. In each case, people who have lost one parent are more likely to have discussed it with their surviving parent; nonetheless, the majority still have not.
How many people have discussed arrangements for their parents’ death?%
Those with two surviving parents
Those with one surviving parent
We have fully discussed the details of their will 12 18
We have fully discussed the details of their funeral arrangements 8 16
We have discussed arrangements should they be unable to make a decision for themselves in the future (e.g. because of dementia) 7 12
The majority of UK adults experienced death for the first time with a grandparent or great grandparent (44%), while 14% did so with the death of a parent and 11% with a friend or family friend. Just 4% have never experienced death, while two in three (66%) have experienced the death of a family member. Even so, 35% do not recall any discussion about the subject when they were growing up.
Fewer than one in five say it was openly discussed within their family (18%), and there are significant differences across the regions: 36% of those in Wales recall open discussions about death when they were growing up, yet just 11% in Northern Ireland and 12% in the East of England say the same.
People who feel prepared for their own death are twice as likely as those who don’t to have grown up in a family environment where it was openly discussed (28% vs. 14%) and are less likely not to recall any discussion about the subject (26% vs. 37%).
Almost two in five people (39%) with two surviving parents have never thought to have a conversation about their wishes in the event of their death.
People who feel prepared for their own death are twice as likely as those who don’t to have grown up in a family environment where it was openly discussed (28% vs. 14%).
20Aviva Family Finances Report January 2016
Women may be less likely to have made financial or practical arrangements, but Aviva’s research indicates they undertake discussions with children around death more than men, who are more likely to avoid the subject or leave it to others.
How have you helped your children to understand and come to terms with death?%
Male Female
When we had a death in the family, I/we took time to explain what had happened in appropriate language and terms for their age 35 44
We have experienced the death of a pet, which I/we explained to our child/children in appropriate language and terms for their age 30 37
We have discussed what death is in general terms 28 33
We have answered my/our child/children’s questions about death as openly and honestly as possible since they were small 24 39
I/We avoid talking about or exposing our child/children to anything about death to avoid upset 5 3
I/We have not talked about death with our child/children as they have learnt about it from other sources 7 5
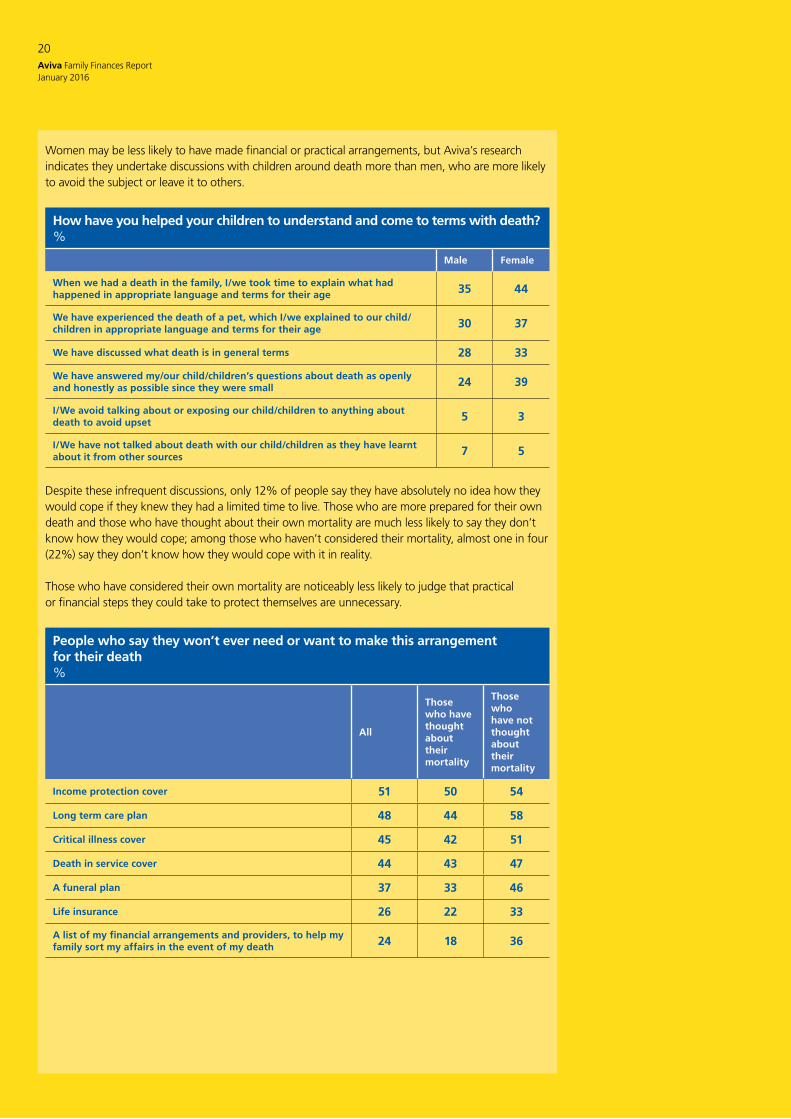
Despite these infrequent discussions, only 12% of people say they have absolutely no idea how they would cope if they knew they had a limited time to live. Those who are more prepared for their own death and those who have thought about their own mortality are much less likely to say they don’t know how they would cope; among those who haven’t considered their mortality, almost one in four (22%) say they don’t know how they would cope with it in reality.
Those who have considered their own mortality are noticeably less likely to judge that practical or financial steps they could take to protect themselves are unnecessary.
People who say they won’t ever need or want to make this arrangement for their death%
All
Those who have thought about their mortality
Those who have not thought about their mortality
Income protection cover 51 50 54
Long term care plan 48 44 58
Critical illness cover 45 42 51
Death in service cover 44 43 47
A funeral plan 37 33 46
Life insurance 26 22 33
A list of my financial arrangements and providers, to help my family sort my affairs in the event of my death 24 18 36
21Aviva Family Finances Report
January 2016
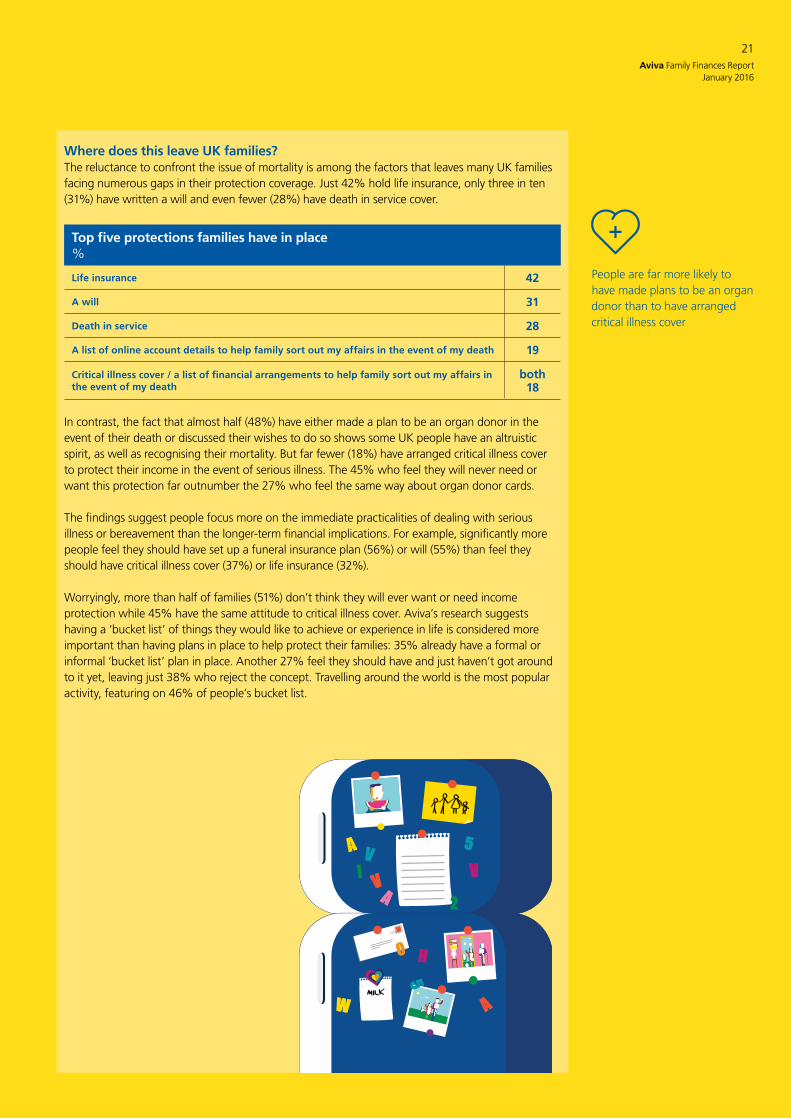
Where does this leave UK families?The reluctance to confront the issue of mortality is among the factors that leaves many UK families facing numerous gaps in their protection coverage. Just 42% hold life insurance, only three in ten (31%) have written a will and even fewer (28%) have death in service cover.
Top five protections families have in place%
Life insurance 42
A will 31
Death in service 28
A list of online account details to help family sort out my affairs in the event of my death 19
Critical illness cover / a list of financial arrangements to help family sort out my affairs in the event of my death
both 18
In contrast, the fact that almost half (48%) have either made a plan to be an organ donor in the event of their death or discussed their wishes to do so shows some UK people have an altruistic spirit, as well as recognising their mortality. But far fewer (18%) have arranged critical illness cover to protect their income in the event of serious illness. The 45% who feel they will never need or want this protection far outnumber the 27% who feel the same way about organ donor cards.
The findings suggest people focus more on the immediate practicalities of dealing with serious illness or bereavement than the longer-term financial implications. For example, significantly more people feel they should have set up a funeral insurance plan (56%) or will (55%) than feel they should have critical illness cover (37%) or life insurance (32%).
Worryingly, more than half of families (51%) don’t think they will ever want or need income protection while 45% have the same attitude to critical illness cover. Aviva’s research suggests having a ‘bucket list’ of things they would like to achieve or experience in life is considered more important than having plans in place to help protect their families: 35% already have a formal or informal ‘bucket list’ plan in place. Another 27% feel they should have and just haven’t got around to it yet, leaving just 38% who reject the concept. Travelling around the world is the most popular activity, featuring on 46% of people’s bucket list.
People are far more likely to have made plans to be an organ donor than to have arranged critical illness cover
22Aviva Family Finances Report January 2016
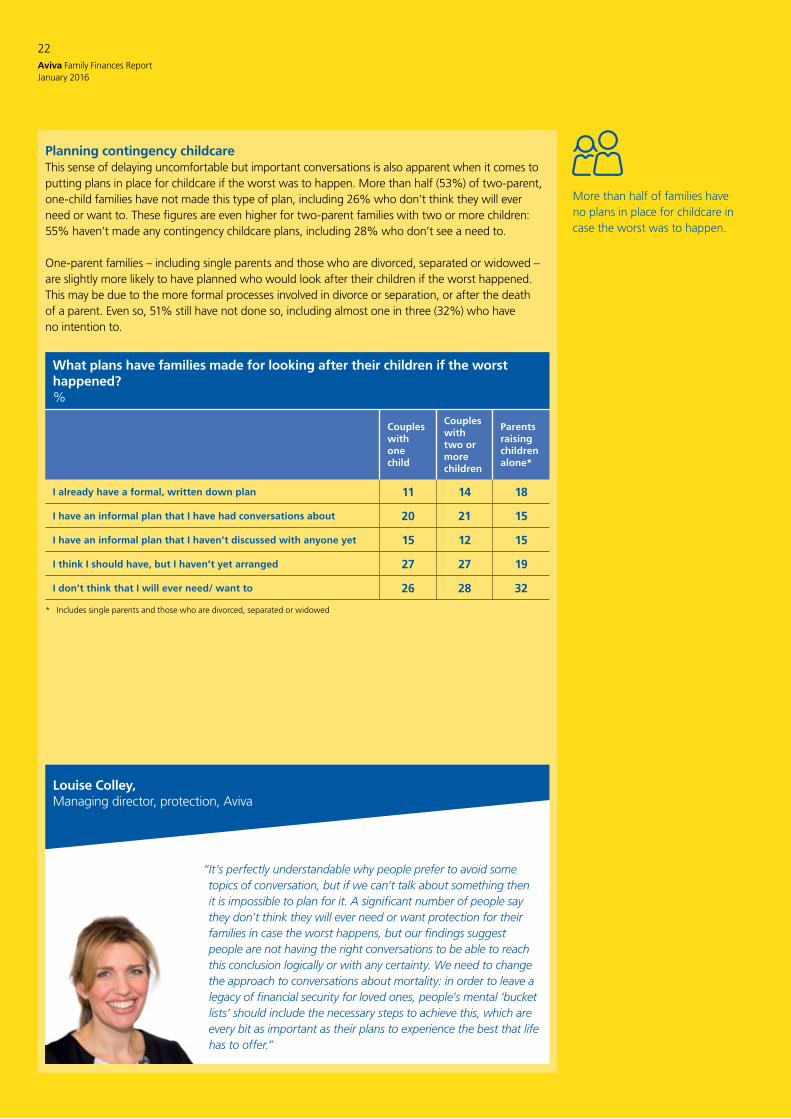
Planning contingency childcareThis sense of delaying uncomfortable but important conversations is also apparent when it comes to putting plans in place for childcare if the worst was to happen. More than half (53%) of two-parent, one-child families have not made this type of plan, including 26% who don’t think they will ever need or want to. These figures are even higher for two-parent families with two or more children: 55% haven’t made any contingency childcare plans, including 28% who don’t see a need to.
One-parent families – including single parents and those who are divorced, separated or widowed – are slightly more likely to have planned who would look after their children if the worst happened. This may be due to the more formal processes involved in divorce or separation, or after the death of a parent. Even so, 51% still have not done so, including almost one in three (32%) who have no intention to.
What plans have families made for looking after their children if the worst happened?%
Couples with one child
Couples with two or more children
Parents raising children alone*
I already have a formal, written down plan 11 14 18
I have an informal plan that I have had conversations about 20 21 15
I have an informal plan that I haven’t discussed with anyone yet 15 12 15
I think I should have, but I haven’t yet arranged 27 27 19
I don’t think that I will ever need/ want to 26 28 32
* Includes single parents and those who are divorced, separated or widowed
“It’s perfectly understandable why people prefer to avoid some topics of conversation, but if we can’t talk about something then it is impossible to plan for it. A significant number of people say they don’t think they will ever need or want protection for their families in case the worst happens, but our findings suggest people are not having the right conversations to be able to reach this conclusion logically or with any certainty. We need to change the approach to conversations about mortality: in order to leave a legacy of financial security for loved ones, people’s mental ‘bucket lists’ should include the necessary steps to achieve this, which are every bit as important as their plans to experience the best that life has to offer.”
Louise Colley, Managing director, protection, Aviva
More than half of families have no plans in place for childcare in case the worst was to happen.
23Aviva Family Finances Report
January 2016
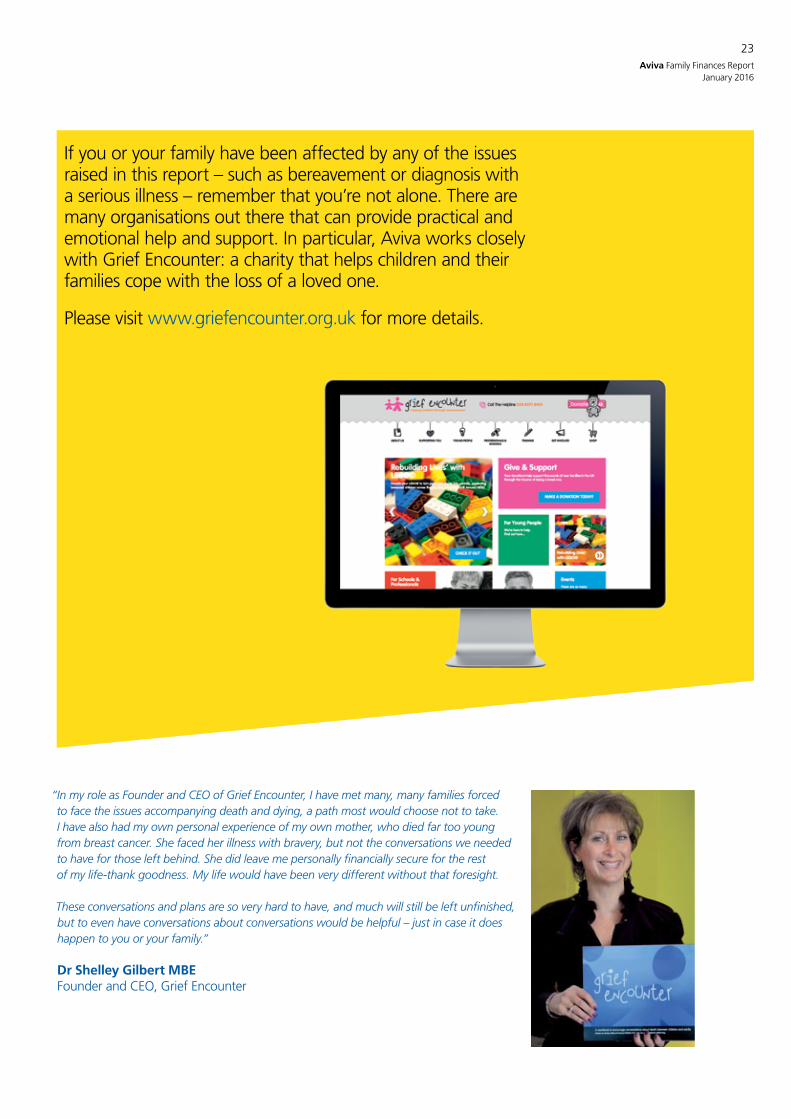
“In my role as Founder and CEO of Grief Encounter, I have met many, many families forced to face the issues accompanying death and dying, a path most would choose not to take. I have also had my own personal experience of my own mother, who died far too young from breast cancer. She faced her illness with bravery, but not the conversations we needed to have for those left behind. She did leave me personally financially secure for the rest of my life-thank goodness. My life would have been very different without that foresight.
These conversations and plans are so very hard to have, and much will still be left unfinished, but to even have conversations about conversations would be helpful – just in case it does happen to you or your family.”
Dr Shelley Gilbert MBE Founder and CEO, Grief Encounter
If you or your family have been affected by any of the issues raised in this report – such as bereavement or diagnosis with a serious illness – remember that you’re not alone. There are many organisations out there that can provide practical and emotional help and support. In particular, Aviva works closely with Grief Encounter: a charity that helps children and their families cope with the loss of a loved one.
Please visit www.griefencounter.org.uk for more details.
24Aviva Family Finances Report January 2016
Conclusion: So what does this tell us?Incomes and savings habits have stalled at a time when many families remain exposed to the threat of the unforeseen.
The last five years have been a financially turbulent time for UK families. While incomes have picked up from the low of summer 2012, there are signs in our latest data that some of the upward momentum has stalled.
Better employment figures and a lower percentage of families in receipt of benefits are perhaps an early sign of the Government’s desire to shift towards a higher wage, lower welfare economy. But clearly some are benefitting more than others from current conditions, not least in the housing market where homeowners are enjoying low cost mortgages at a time when rents are rising fast.
Low inflation has helped to drive down the costs of the weekly food shop, and higher spending on entertainment, recreation and holidays might be seen as a positive that families are more confident in their spending power as the economy improves. However, it is concerning to see savings habits dwindle in the last six months while unsecured borrowing has spiked.
Every family type examined by our research has a substantially bigger savings cushion in place than they had five years ago. Even so, one in four still do not save anything at all each month and the typical family savings pot of £3,150 pales in comparison to the average household debt among those who have it, which weighs in at £13,520.
It leaves families in a potentially precarious situation: not least because many continue to postpone important conversations about preparing for the worst. The famous quote comes to mind that nothing in this world is certain except for death and taxes, and it speaks volumes that while people pore over the detail of how tax policies will affect them, the financial impacts of death are much more easily ignored.
People’s reluctance to consider what happens to the loved ones they leave behind is perfectly understandable, but it is also illogical from a financial planning point of view. As a country the UK is famed for its reserve, but it is vital we help parents to feel more comfortable with these uncomfortable conversations, so that their wish to protect their children can withstand whatever comes.
Louise ColleyManaging Director, Protection, Aviva
Methodology
Over 2,000 people aged 18-55 who live as part of one of six family groups were interviewed to produce the report’s latest findings. In total, 28,000 UK consumers have been interviewed between December 2010 and November 2015. This data was combined with additional information from external sources cited within the main report listed below and used to form the basis of the Aviva Family Finances Report. All statistics refer to figures from the latest wave of research unless stated otherwise.
Technical notes• A median is described as the numeric value separating the upper half of a sample, a population,
or a probability distribution, from the lower half. Thus for this report, the median is the person who is the utter middle of a sample. All figures in this report are medians unless otherwise specified and are referred to as ‘typical’ rather than ‘average’ (mean).
• A mean is a single value that is derived by adding all the values on a list together and then dividing by the number of items on said list. This can be skewed by particularly high or low values.
For further information on the report or for a comment, please contact Melissa Loughran at the Aviva Press Office on 01904 452791 or [email protected]
Designed and produced by Instinctif Partners www.instinctif.com

Retirement Investments Insurance Health
For further information on the report please contact Melissa Loughran at the Aviva Press Office on:
T : 01904 452791E : [email protected]