aviva plc - interim results presentation 2005...insurance non-insurance operating profit insurance...
TRANSCRIPT
AVIVA plcInterim results 2005
11 August 2005
2© Aviva plc
Disclaimer
This presentation may contain certain “forward-looking statements” with respect to certain of Aviva’s plans and its current goals and expectations relating to its future financial condition, performance and results. By their nature, all forward-looking statements involve risk and uncertainty because they relate to future events and circumstances which are beyond Aviva’s control including among other things, UK domestic and global economic business conditions, market related risks such as fluctuations in interest rates and exchange rates, the policies and actions of regulatory authorities, the impact of competition, inflation, deflation, the timing impact and other uncertainties of future acquisitions or combinations within relevant industries, as well as the impact of tax and other legislation and other regulations in the jurisdictions in which Aviva and its affiliates operate. As a result, Aviva’s actual future financial condition, performance and results may differ materially from the plans, goals and expectations set forth in Aviva’s forward-looking statements.
Aviva undertakes no obligation to update the forward-looking statements contained in this presentation or any other forward-looking statements we may make.

3© Aviva plc
Agenda
• Overview Richard HarveyGroup Chief Executive
• Financial review Andrew MossGroup Finance Director
• Questions & Answers
4© Aviva plc
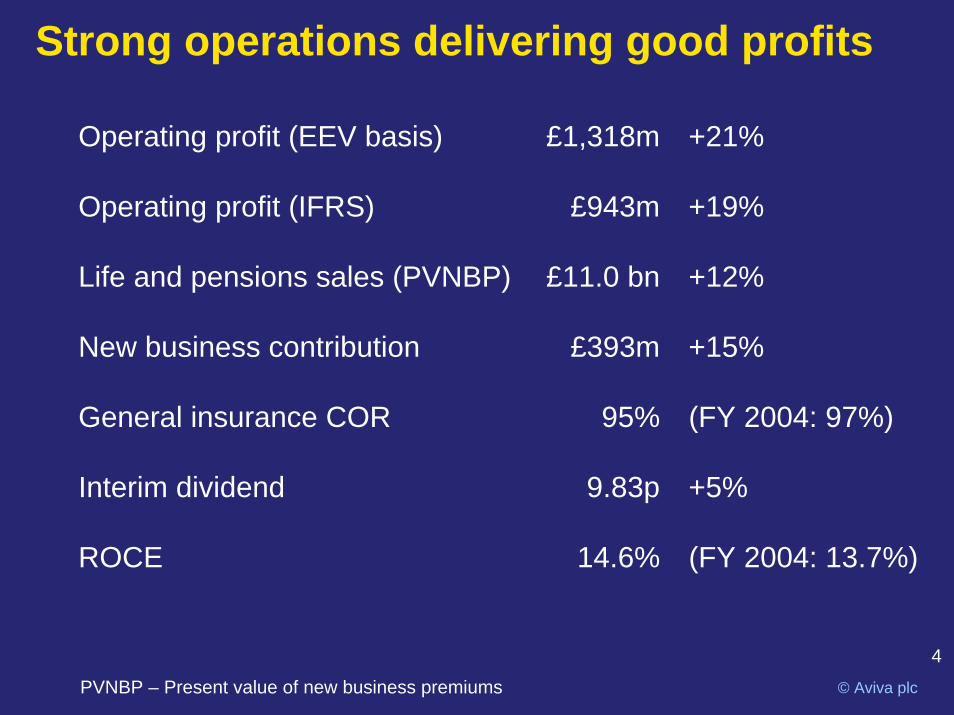
Strong operations delivering good profits
Operating profit (EEV basis) £1,318m +21%
Operating profit (IFRS) £943m +19%
Life and pensions sales (PVNBP) £11.0 bn +12%
New business contribution £393m +15%
General insurance COR 95% (FY 2004: 97%)
Interim dividend 9.83p +5%
ROCE 14.6% (FY 2004: 13.7%)
PVNBP – Present value of new business premiums

5© Aviva plc
2005 interim results: key themes
• Strong new business sales with increased value from our bancassurance network
• Strong performance in mature markets, particularly France
• Transforming our UK Life business to succeed in a competitive market
• Prospects for our developing businesses
• Excellent general insurance and health results
6© Aviva plc
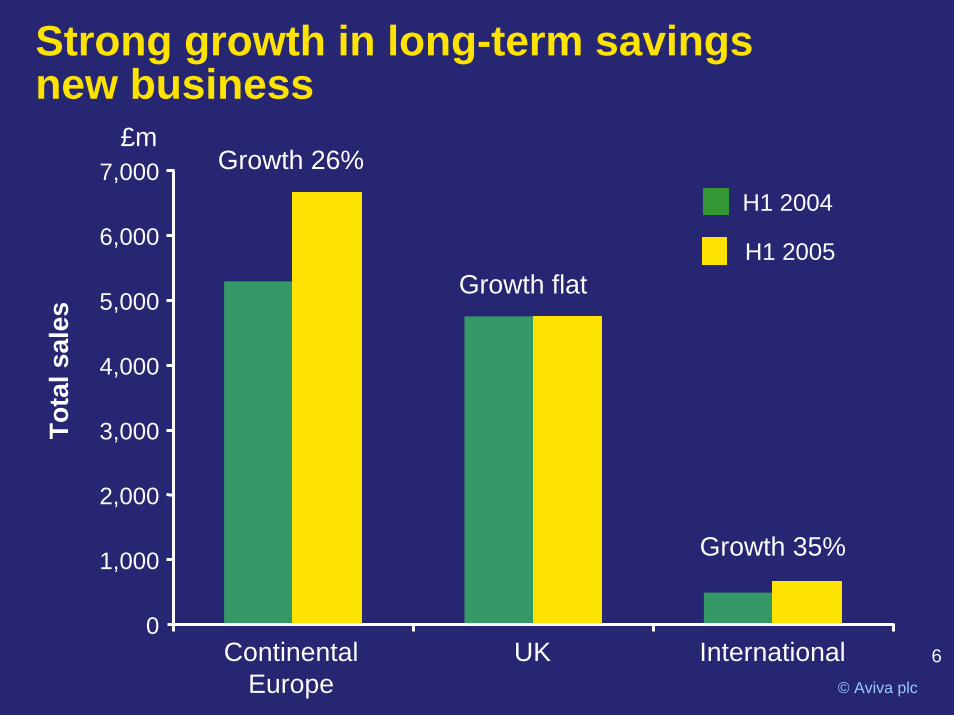
Strong growth in long-term savingsnew business
£mGrowth 26%
H1 2004
H1 2005Growth flat
InternationalContinentalEurope
UK
Tota
l sal
es
Growth 35%
0
1,000
2,000
3,000
4,000
5,000
6,000
7,000
7© Aviva plc
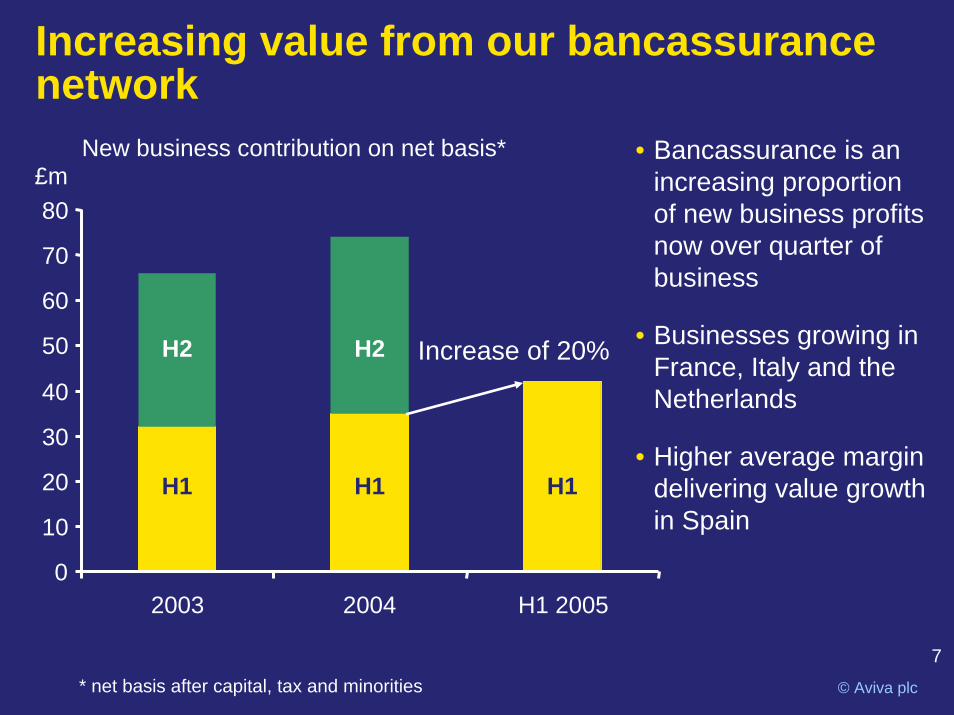
Increasing value from our bancassurance network
• Bancassurance is an increasing proportion of new business profits now over quarter of business
• Businesses growing in France, Italy and the Netherlands
• Higher average margin delivering value growth in Spain
Increase of 20%
New business contribution on net basis*£m
H1 H1 H1
H2H2
0
10
20
30
40
50
60
70
80
2003 2004 H1 2005
* net basis after capital, tax and minorities
8© Aviva plc
France: benefiting from focus on unit linked sales
• Total sales up 36% (PVNBP) to £1.9 billion– Contribution up 52% (gross) to £202 million – Total proportion of unit-linked sales now 40%
(FY 2004: 32%)– Net margin at 2.6% (FY 2004: 1.9%)
• Benefit of Crédit du Nord(commenced October 2004)
• Increased attractiveness of equity markets
• Focus on unit-linked business delivering higher margins
9© Aviva plc
UK Life: managing for value
• Operating in competitive market where growth modest
• Holding volume whilst increasing margin
• Retaining a significant presence across the product portfolio
• Achieving an IRR of 11.4% (H1 2004: 11.0%)
– IRR improves to 13.6% taking into account debt/equity mix
10© Aviva plc
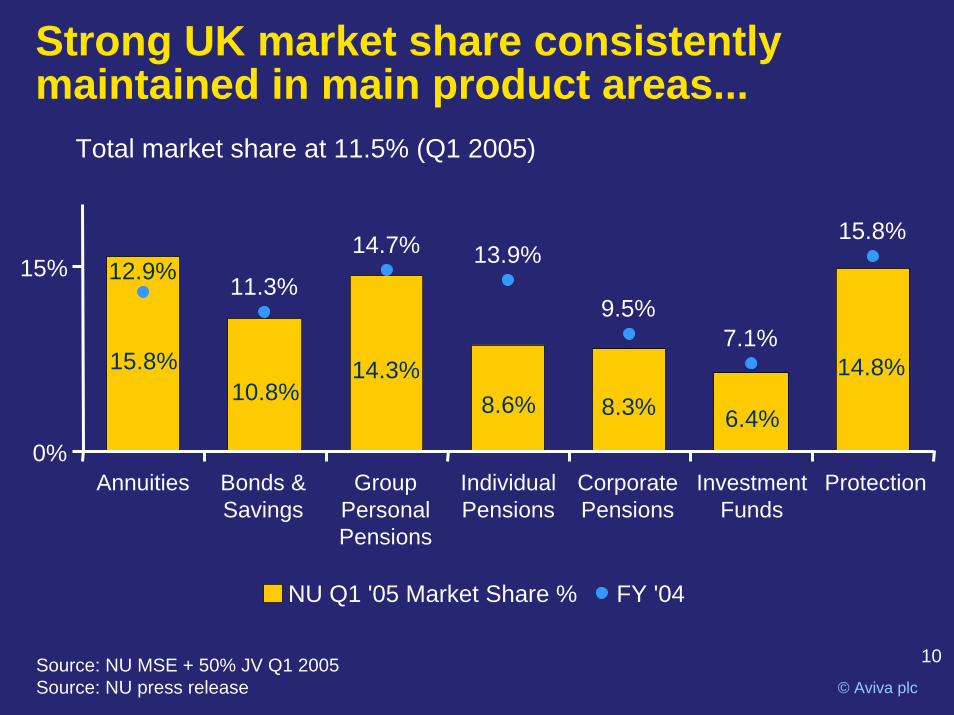
Strong UK market share consistently maintained in main product areas...
Total market share at 11.5% (Q1 2005)
15.8%10.8%
14.3%8.6% 8.3% 6.4%
14.8%
11.3%
14.7% 13.9%
9.5%7.1%
15.8%
12.9%
0%
15%
Annuities Bonds &Savings
GroupPersonalPensions
IndividualPensions
CorporatePensions
InvestmentFunds
Protection
NU Q1 '05 Market Share % FY '04
Source: NU MSE + 50% JV Q1 2005Source: NU press release
11© Aviva plc
UK Life: transforming the business forthe long-term
• Expect to see a reduction in second half margins as product mix changes
• Continue to improve underlying value drivers
– Broad distribution base
– Innovative capital management
– Aggressive transformation of the business• Offshoring• Assisted transformation of business
services• Ongoing customer servicing initiatives
12© Aviva plc
Developing our presence in other markets
• Rapid expansion in India and China:
– Total sales from operations of £82 million (2004: £29 million)
– India: working with 8 banks
– China: presence in 6 cities
• Broadening distribution and moving into new product markets in the US
• Enter new markets selectively, for example exploring entry into Russia and Taiwan
13© Aviva plc
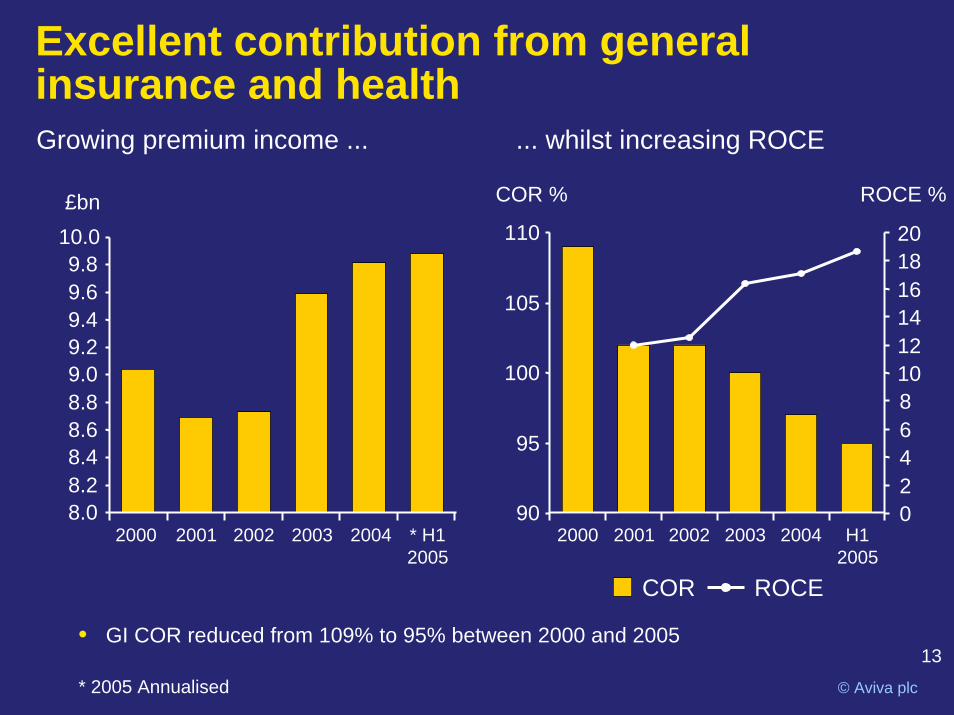
Excellent contribution from general insurance and health Growing premium income ... ... whilst increasing ROCE
COR % ROCE % £bn
90
95
100
105
110
2000 2001 2002 2003 2004 H12005
20
8.08.28.48.68.89.09.29.49.69.8
10.0
2000 2001 2002 2003 2004 * H12005
18161412
0246810
COR ROCE
• GI COR reduced from 109% to 95% between 2000 and 2005
* 2005 Annualised
14© Aviva plc
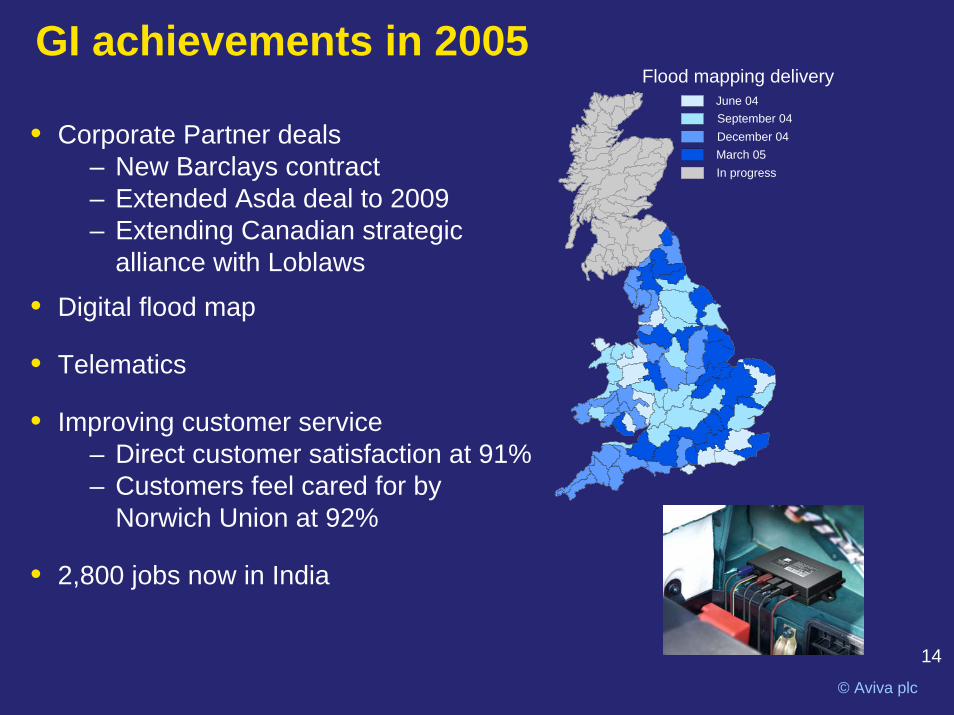
GI achievements in 2005Flood mapping delivery
In progress
June 04September 04December 04March 05
• Corporate Partner deals– New Barclays contract– Extended Asda deal to 2009– Extending Canadian strategic
alliance with Loblaws
• Digital flood map
• Telematics
• Improving customer service– Direct customer satisfaction at 91%– Customers feel cared for by
Norwich Union at 92%
• 2,800 jobs now in India
15© Aviva plc
UK: sustained profits GWP Growth in 2004
-6%-4%-2%0%2%4%6%
NUI Next 5 Market
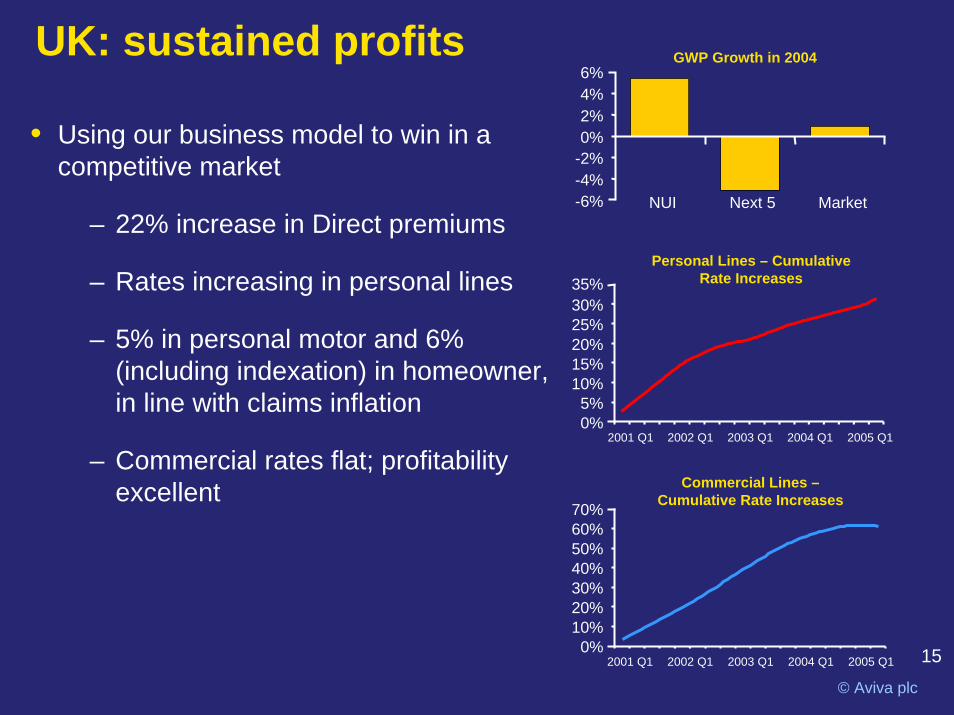
• Using our business model to win in a competitive market
– 22% increase in Direct premiums
– Rates increasing in personal lines
– 5% in personal motor and 6% (including indexation) in homeowner, in line with claims inflation
– Commercial rates flat; profitability excellent
Personal Lines – CumulativeRate Increases
0%5%
10%15%20%25%30%35%
2001 Q1 2002 Q1 2003 Q1 2004 Q1 2005 Q1
Commercial Lines –Cumulative Rate Increases
0%10%20%30%40%50%60%70%
2001 Q1 2002 Q1 2003 Q1 2004 Q1 2005 Q1
16© Aviva plc
RAC
© Aviva plc
The RAC OpportunityThe RAC Opportunity
Motor Insurance
• Car Sales
RAC Insure
• Financial Services
• Roadside• Driving training• Windscreen Services
• Vehicle inspection
• Vehicle Leasing
RAC
• No.1 UK general insurer• Proven scale advantages• Track record of delivery• 15 million policyholders
• No. 1 roadside company for customer satisfaction*
• 2.2m individual roadside customers
• 4.5m corporate roadside customers
• Vehicle History Checking
Home Insurance Travel Insurance
NUI
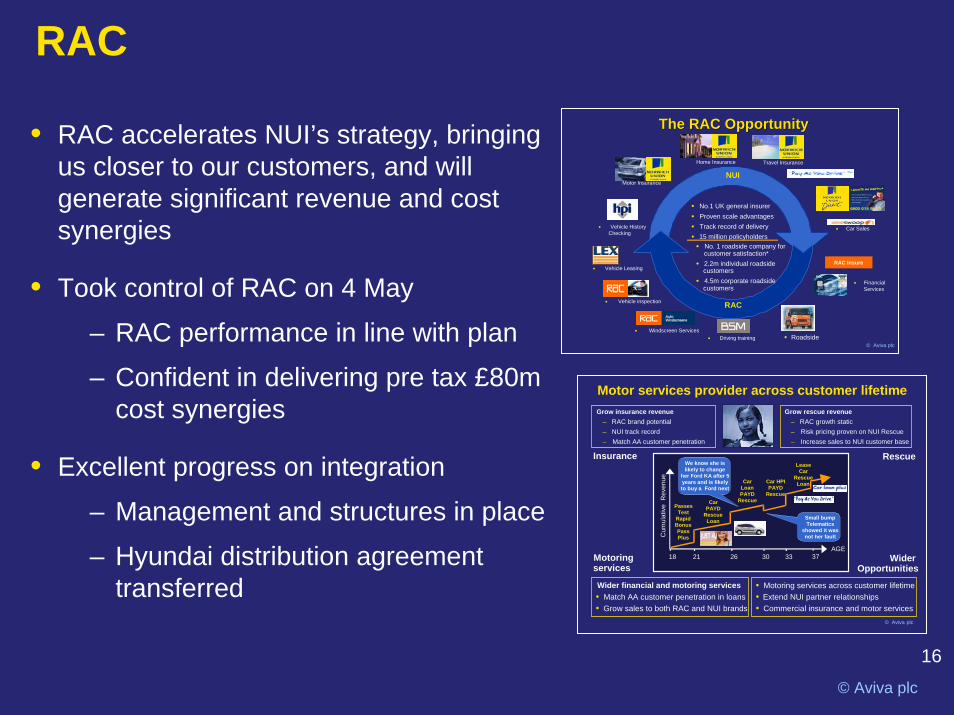
• RAC accelerates NUI’s strategy, bringing us closer to our customers, and will generate significant revenue and cost synergies
• Took control of RAC on 4 May
– RAC performance in line with plan
– Confident in delivering pre tax £80m cost synergies
• Excellent progress on integration
– Management and structures in place
– Hyundai distribution agreement transferred
© Aviva plc
• Motoring services across customer lifetime• Extend NUI partner relationships• Commercial insurance and motor services
Grow insurance revenue– RAC brand potential– NUI track record– Match AA customer penetration
Insurance
Wider financial and motoring services• Match AA customer penetration in loans • Grow sales to both RAC and NUI brands
Motoringservices
Grow rescue revenue– RAC growth static– Risk pricing proven on NUI Rescue– Increase sales to NUI customer base
Rescue
WiderOpportunities
Motor services provider across customer lifetime
Cum
ulat
ive
Rev
enue
18 21 26 30 33 37AGE
Passes Test
Rapid BonusPass Plus
Car PAYD
Rescue Loan
Car Loan PAYD
Rescue
Car HPI PAYD
Rescue
Lease Car
Rescue Loan
We know she is likely to change
her Ford KA after 5 years and is likely to buy a Ford next
Small bump Telematics
showed it was not her fault

Financial review
Andrew MossGroup Finance Director
18
© Aviva plc
Improved operational performance acrossall businesses
H1 2005 H1 2004 Growth †
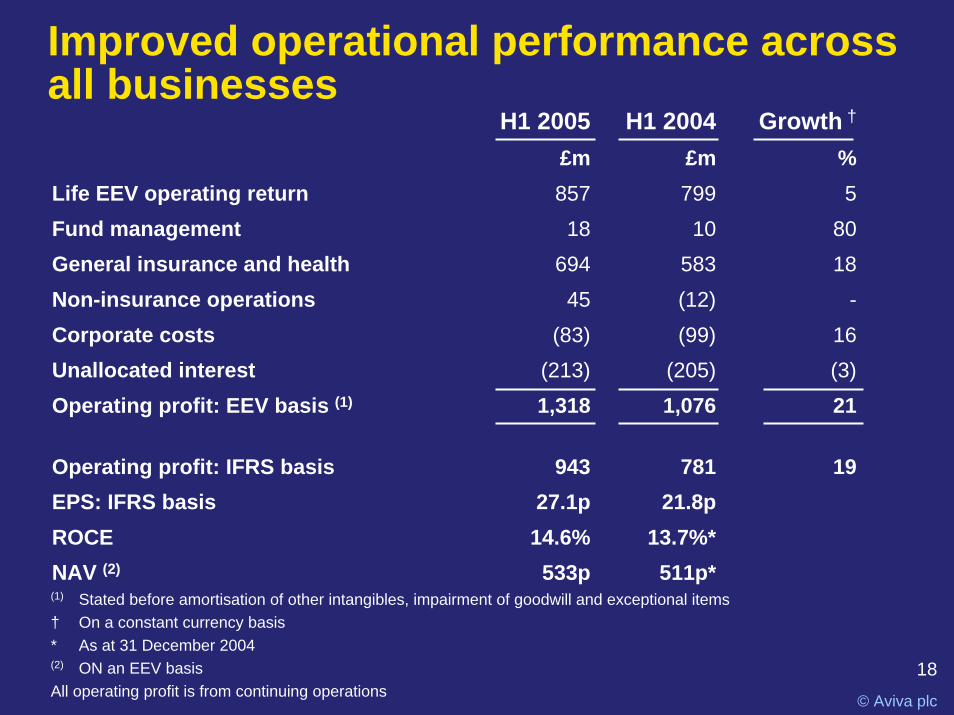
£m £m % Life EEV operating return 857 799 5Fund management 18 10 80General insurance and health 694 583 18Non-insurance operations 45 (12) -Corporate costs (83) (99) 16Unallocated interest (213) (205) (3)Operating profit: EEV basis (1) 1,318 1,076 21
Operating profit: IFRS basis 943 781 19EPS: IFRS basis 27.1p 21.8pROCE 14.6% 13.7%*NAV (2) 533p 511p*(1) Stated before amortisation of other intangibles, impairment of goodwill and exceptional items† On a constant currency basis* As at 31 December 2004(2) ON an EEV basisAll operating profit is from continuing operations
19
© Aviva plc
Growth from an international life portfolio
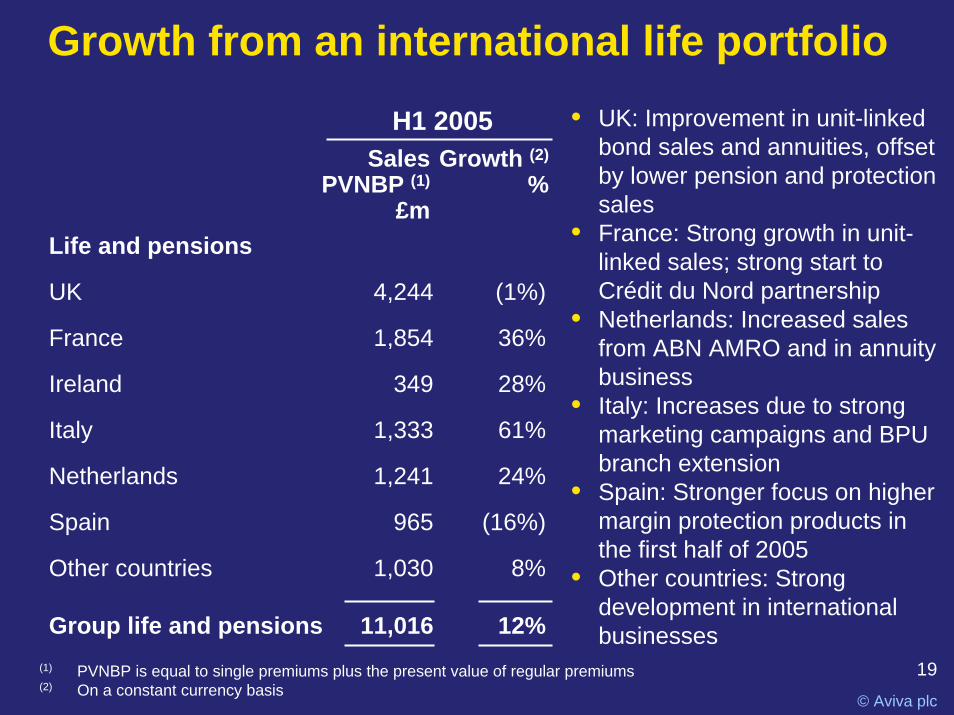
Life and pensions
UK 4,244 (1%)
France 1,854 36%
Ireland 349 28%
Italy 1,333 61%
Netherlands 1,241 24%
Spain 965 (16%)
Other countries 1,030 8%
Group life and pensions 11,016 12%
• UK: Improvement in unit-linked bond sales and annuities, offset by lower pension and protection sales
• France: Strong growth in unit-linked sales; strong start toCrédit du Nord partnership
• Netherlands: Increased sales from ABN AMRO and in annuity business
• Italy: Increases due to strong marketing campaigns and BPU branch extension
• Spain: Stronger focus on higher margin protection products in the first half of 2005
• Other countries: Strong development in international businesses
Growth (2)
%Sales
PVNBP (1)
£m
H1 2005
(1) PVNBP is equal to single premiums plus the present value of regular premiums(2) On a constant currency basis
20
© Aviva plc
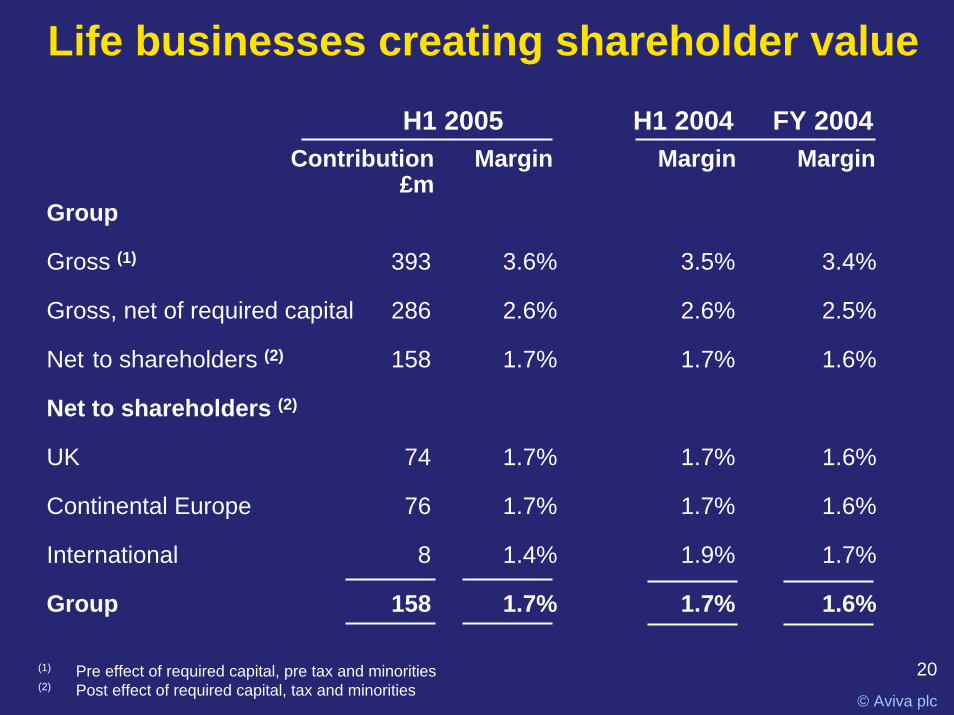
Life businesses creating shareholder value
H1 2005
Group
Gross (1) 393 3.6% 3.5% 3.4%
Gross, net of required capital 286 2.6% 2.6% 2.5%
Net to shareholders (2) 158 1.7% 1.7% 1.6%
Net to shareholders (2)
UK 74 1.7% 1.7% 1.6%
Continental Europe 76 1.7% 1.7% 1.6%
International 8 1.4% 1.9% 1.7%
Group 158 1.7% 1.7% 1.6%
MarginContribution£m
FY 2004H1 2004Margin Margin
(1) Pre effect of required capital, pre tax and minorities(2) Post effect of required capital, tax and minorities
21
© Aviva plc
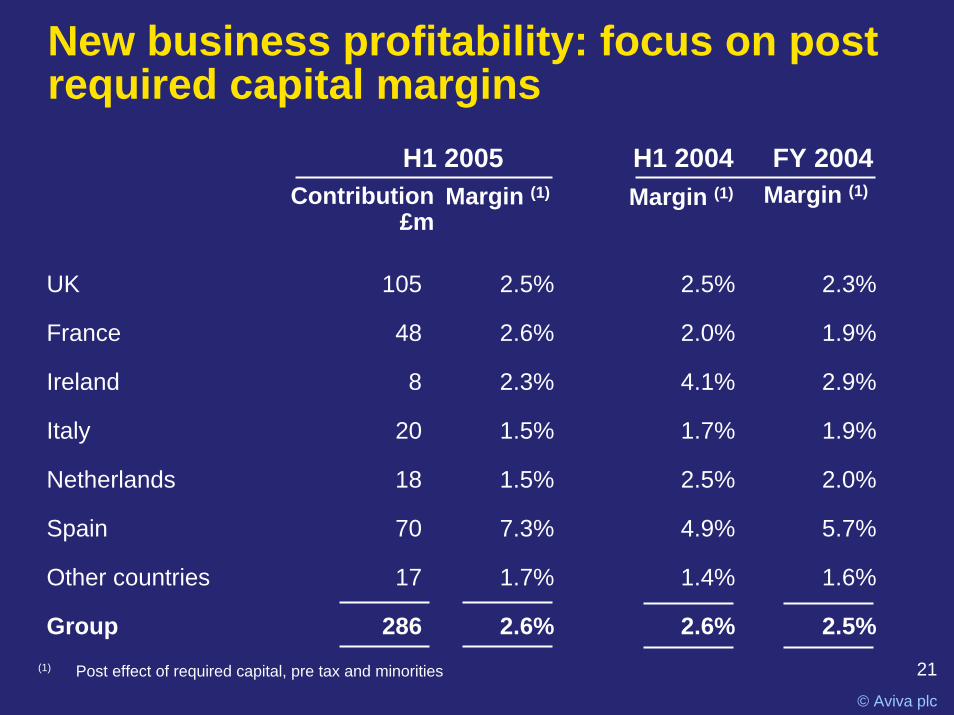
New business profitability: focus on post required capital margins
UK 105 2.5% 2.5% 2.3%
France 48 2.6% 2.0% 1.9%
Ireland 8 2.3% 4.1% 2.9%
Italy 20 1.5% 1.7% 1.9%
Netherlands 18 1.5% 2.5% 2.0%
Spain 70 7.3% 4.9% 5.7%
Other countries 17 1.7% 1.4% 1.6%
Group 286 2.6% 2.6% 2.5%
Margin (1) Margin (1)Margin (1)Contribution£m
H1 2005 FY 2004H1 2004
(1) Post effect of required capital, pre tax and minorities
22
© Aviva plc
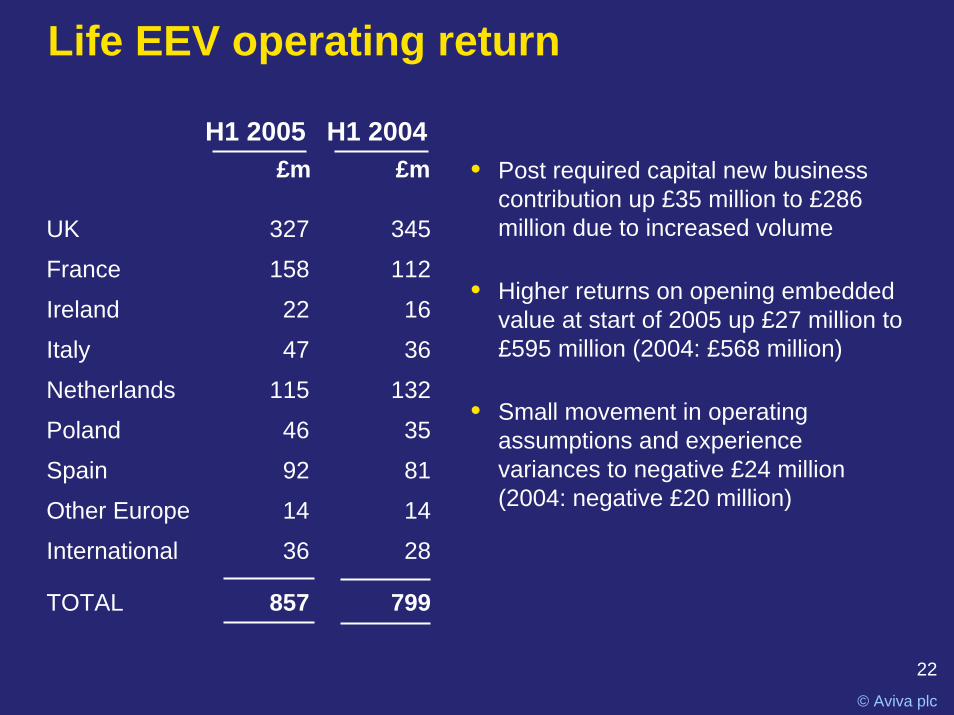
Life EEV operating return
UK 327 345
France 158 112
Ireland 22 16
Italy 47 36
Netherlands 115 132
Poland 46 35
Spain 92 81
Other Europe 14 14
International 36 28
TOTAL 857 799
• Post required capital new business contribution up £35 million to £286 million due to increased volume
• Higher returns on opening embedded value at start of 2005 up £27 million to £595 million (2004: £568 million)
• Small movement in operating assumptions and experience variances to negative £24 million(2004: negative £20 million)
£m £mH1 2005 H1 2004
23
© Aviva plc
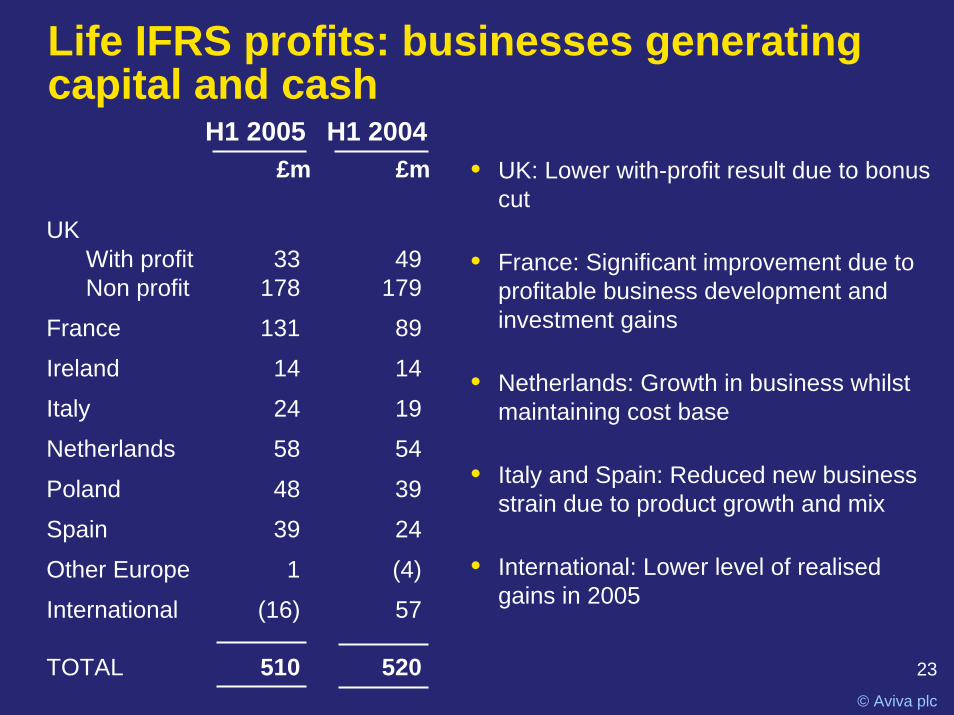
Life IFRS profits: businesses generating capital and cash
£m £mH1 2005 H1 2004
UKWith profit 33 49Non profit 178 179
France 131 89
Ireland 14 14
Italy 24 19
Netherlands 58 54
Poland 48 39
Spain 39 24
Other Europe 1 (4)
International (16) 57
TOTAL 510 520
• UK: Lower with-profit result due to bonus cut
• France: Significant improvement due to profitable business development and investment gains
• Netherlands: Growth in business whilst maintaining cost base
• Italy and Spain: Reduced new business strain due to product growth and mix
• International: Lower level of realised gains in 2005
24
© Aviva plc
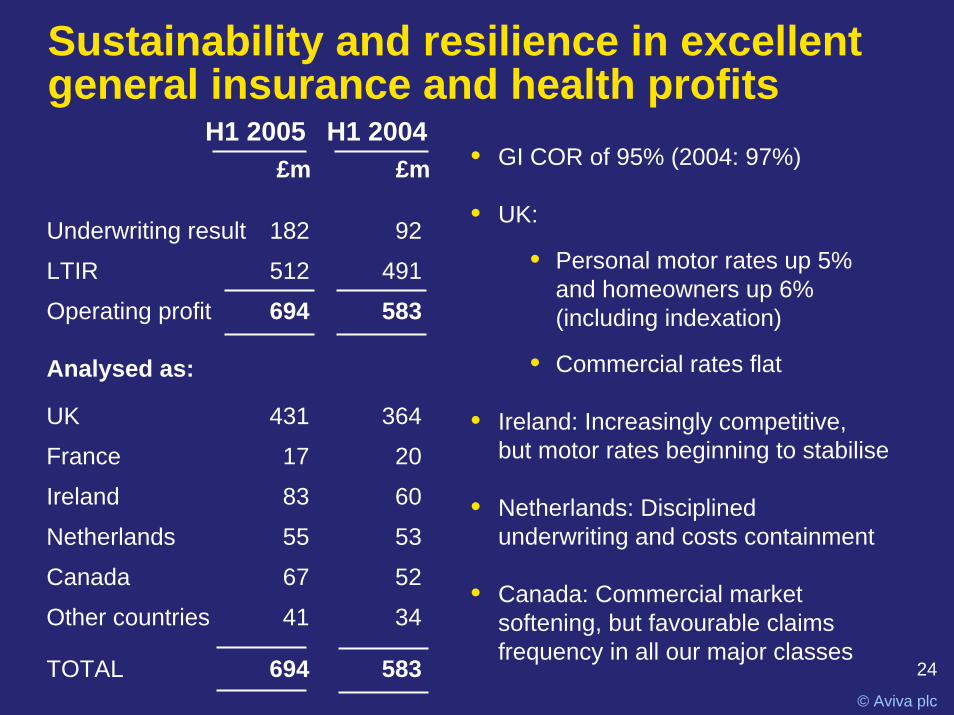
UK 431 364
France 17 20
Ireland 83 60
Netherlands 55 53
Canada 67 52
Other countries 41 34
TOTAL 694 583
Sustainability and resilience in excellent general insurance and health profits
£m £m • GI COR of 95% (2004: 97%)
• UK:
• Personal motor rates up 5% and homeowners up 6%(including indexation)
• Commercial rates flat
• Ireland: Increasingly competitive,but motor rates beginning to stabilise
• Netherlands: Disciplined underwriting and costs containment
• Canada: Commercial market softening, but favourable claims frequency in all our major classes
Underwriting result 182 92
LTIR 512 491
Operating profit 694 583
Analysed as:
H1 2005 H1 2004
25
© Aviva plc
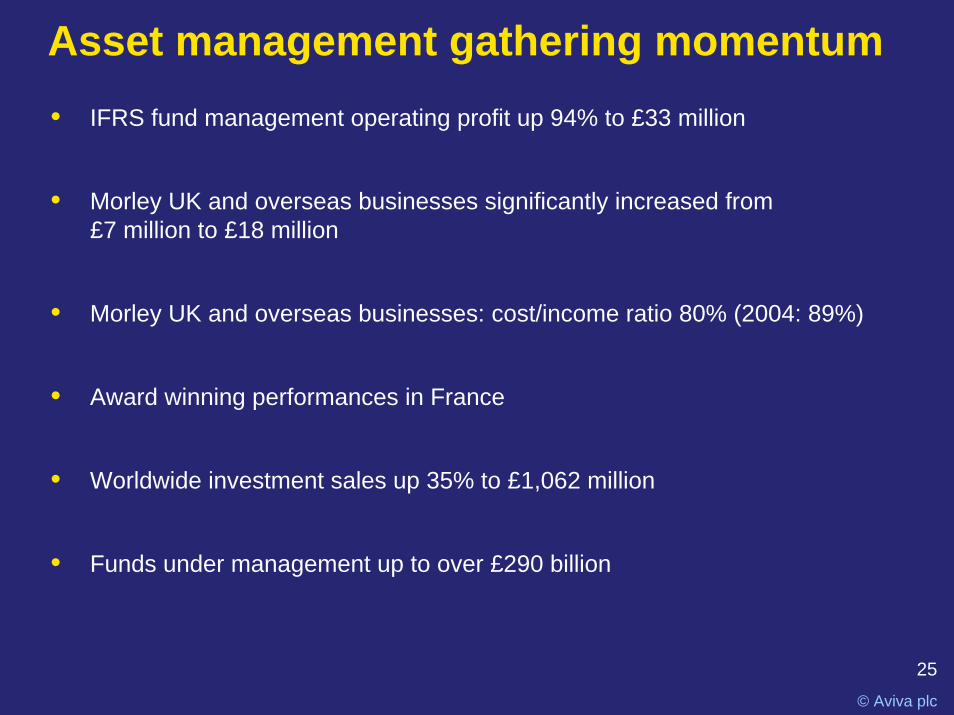
Asset management gathering momentum• IFRS fund management operating profit up 94% to £33 million
• Morley UK and overseas businesses significantly increased from£7 million to £18 million
• Morley UK and overseas businesses: cost/income ratio 80% (2004: 89%)
• Award winning performances in France
• Worldwide investment sales up 35% to £1,062 million
• Funds under management up to over £290 billion
26
© Aviva plc
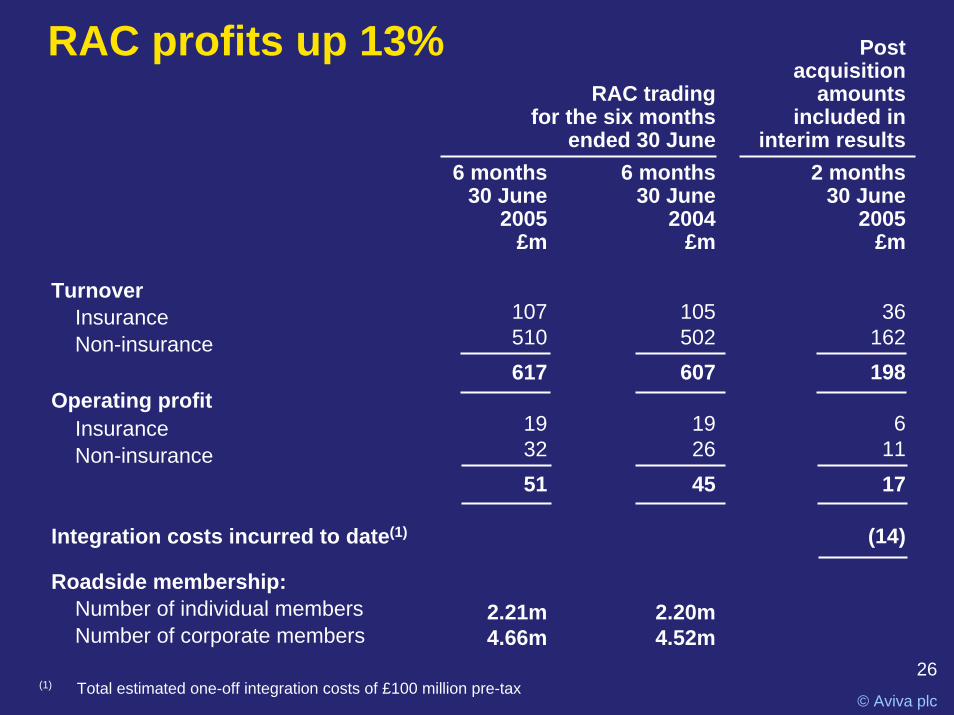
RAC profits up 13% Post acquisition
amountsincluded in
interim results2 months
30 June2005
£m
6 months30 June
2004£m
6 months30 June
2005£m
RAC tradingfor the six months
ended 30 June
TurnoverInsuranceNon-insurance
Operating profitInsuranceNon-insurance
Integration costs incurred to date(1)
Roadside membership:Number of individual membersNumber of corporate members
51
2.21m4.66m
617
1932
107510
1745
2.20m4.52m
198
611
607
1926
36162
105502
(14)
(1) Total estimated one-off integration costs of £100 million pre-tax
27
© Aviva plc
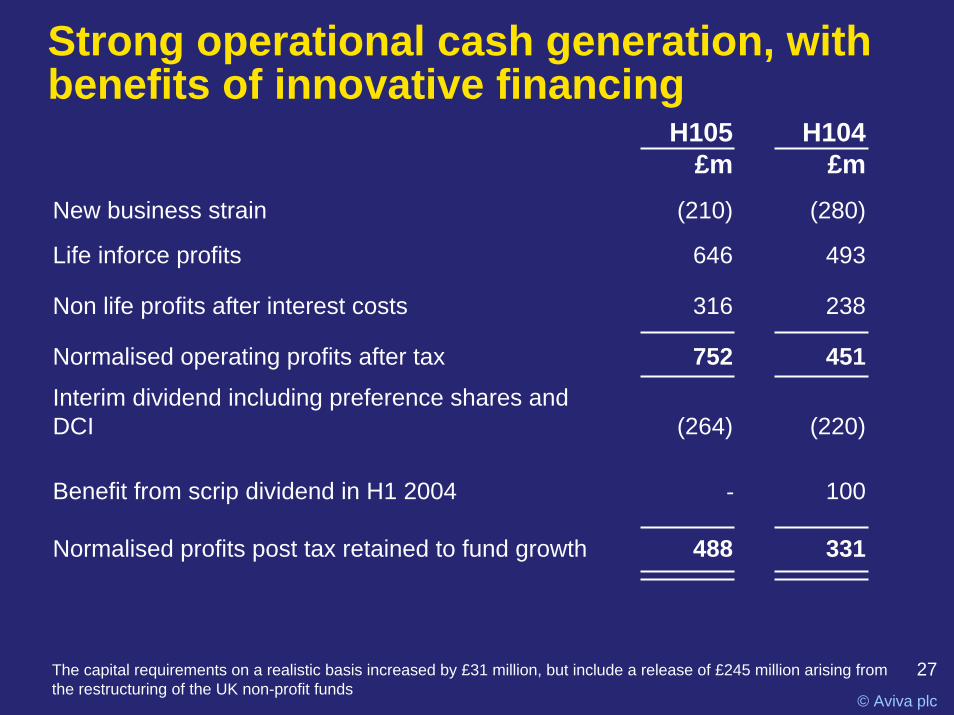
Strong operational cash generation, with benefits of innovative financing
H105£m
H104£m
New business strain (210) (280)
Life inforce profits 646 493
Non life profits after interest costs 316 238
Normalised operating profits after tax 752 451Interim dividend including preference shares and DCI (264) (220)
Benefit from scrip dividend in H1 2004
Normalised profits post tax retained to fund growth 488
100
331
-
The capital requirements on a realistic basis increased by £31 million, but include a release of £245 million arising from the restructuring of the UK non-profit funds
28
© Aviva plc
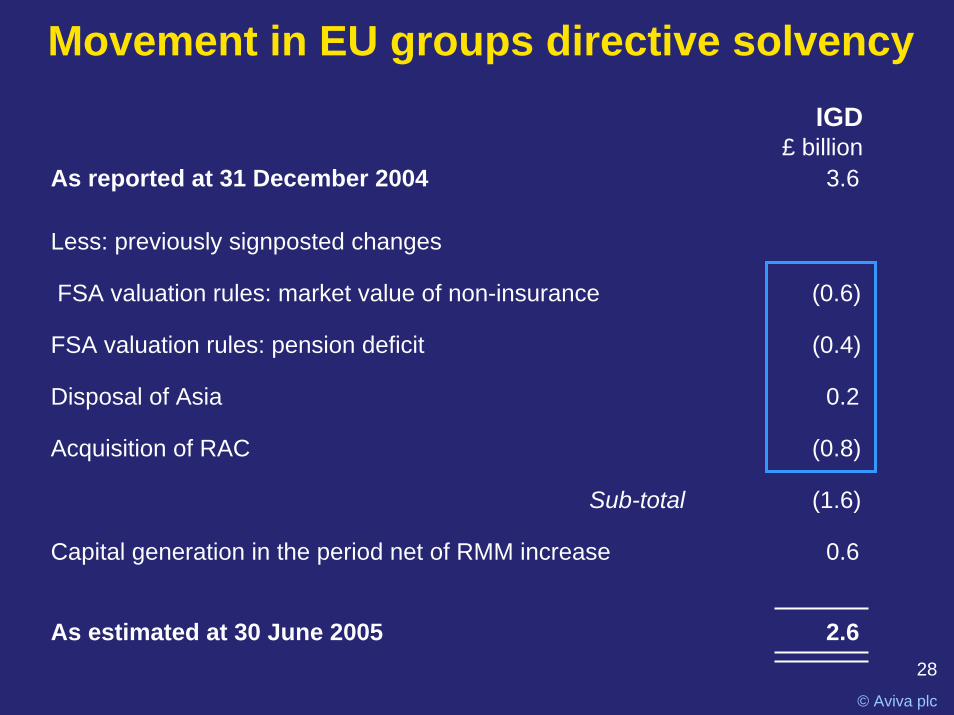
Movement in EU groups directive solvency
As reported at 31 December 2004 3.6
Less: previously signposted changes
FSA valuation rules: market value of non-insurance (0.6)
FSA valuation rules: pension deficit (0.4)
Disposal of Asia 0.2
Acquisition of RAC (0.8)
Sub-total (1.6)
Capital generation in the period net of RMM increase 0.6
As estimated at 30 June 2005 2.6
IGD£ billion
29
© Aviva plc
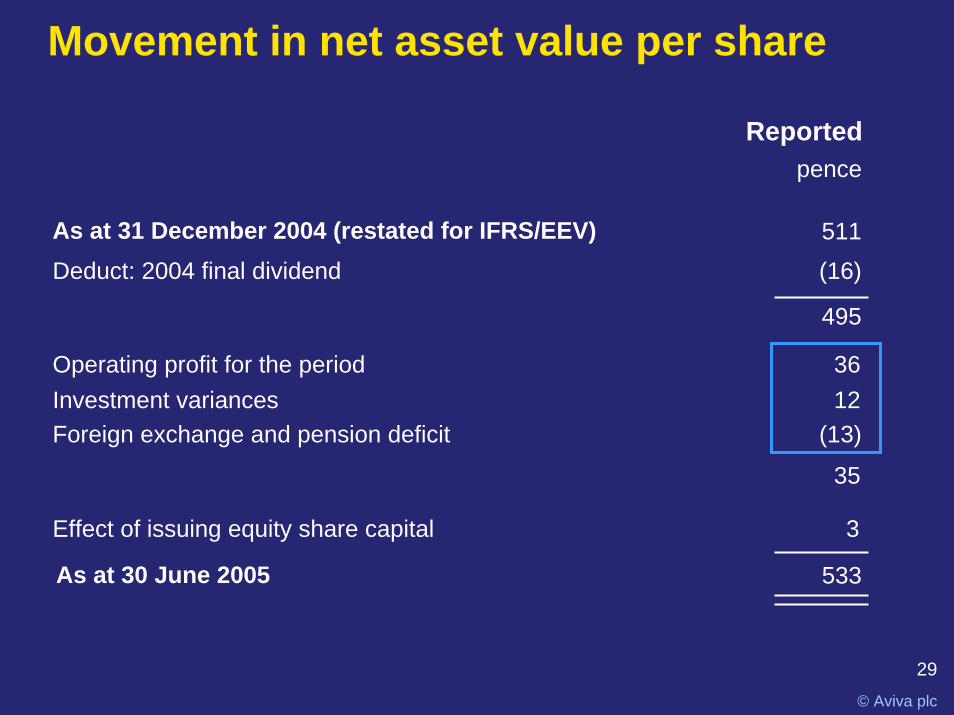
Movement in net asset value per share
As at 31 December 2004 (restated for IFRS/EEV) 511Deduct: 2004 final dividend (16)
495
Effect of issuing equity share capital 3
Operating profit for the period 36Investment variances 12Foreign exchange and pension deficit (13)
533
Reportedpence
35
As at 30 June 2005
30© Aviva plc
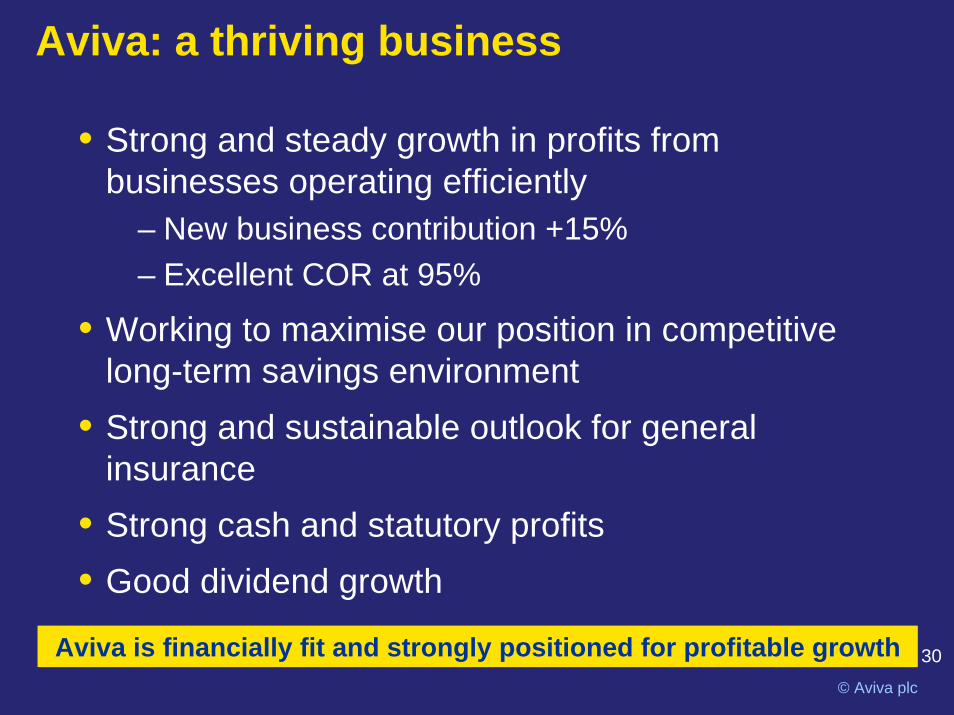
Aviva: a thriving business
• Strong and steady growth in profits from businesses operating efficiently
– New business contribution +15%– Excellent COR at 95%
• Working to maximise our position in competitive long-term savings environment
• Strong and sustainable outlook for general insurance
• Strong cash and statutory profits• Good dividend growth
Aviva is financially fit and strongly positioned for profitable growth
30 June 2005 resultsQuestions and answers