avoiding deforestation while promoting sustainable development · the report contains information,...
TRANSCRIPT


Reducing Deforestation and Forest Degradation while Promoting Sustainable Development
South American Regional Infrastructure Development, Forests and REDD: Implications for Guyana
Conservation International Climate Focus
Terracarbon LLC SarVision
Development and Policy Management Consultants JULY 2009
1

This document presents the key results of a study undertaken for the Inter‐American Development Bank (IDB) under a Technical Cooperation Agreement (ATN/NP‐10749‐GY – ATN/SF‐10750‐GY) between the IDB and the Government of Guyana. The study has produced six comprehensive technical papers titled:
• Site description and analysis of biodiversity, socio‐economic factors, and carbon stocks
• Modeling Reference Scenarios of Future Emissions • Methodology development recommendations • Analysis of the institutional and policy framework • Analysis of financial flows
The Report contains information, assessment, analysis and recommendations that represents the work and views of the Authors of the Reports and not necessarily that of the Government of Guyana.
These papers are available online at www.conservation.org.gy
2
3
CONTRIBUTORS
Eustace Alexander David Singh Conservation International, Guyana 94 Laluni & Oronoque Streets Queenstown, Georgetown Guyana Tim Killeen Marc Steininger Lisa Famolare Agustin Silvani Fabiano Godoy Benjamin Vitale Conservation International 2100 Crystal Drive, Suite 500 Arlington, VA 22202 Robert O'Sullivan Charlotte Streck Climate Focus 888 16th St. NW, Suite 800 Washington D.C. 20006 USA David Shoch TerraCarbon LLC 5901 N. Sheridan Rd. Peoria, IL 61614 USA
Neils Wielaand Sarvision Agro Business Park 10 6708 PW Wageningen The Netherlands Marciano Glasgow Mark Bynoe Development Policy and Management Consultants 271 Forshaw Street Queenstown, Georgetown Guyana David James Attorney-at-Law 47 Fourth St Cummings Lodge East Coast Demerara Guyana

4
ACKNOWLEDGEMENTS
This work has been supported by the Inter-American Development Bank (IDB). We wish to thank Mr Marco Nicola, Ms Sybille Nuenninghoff, Eirivelthon Lima and Ricardo Quiroga (IDB) for their guidance, support and assistance over the period of this work. We also wish to acknowledge the support of Commissioner James Singh (GFC), and Ms Pradeepa Bholanath, who served as the official representative of the GFC on this project, and to thank her for her active participation and guidance. We also wish to thank the Iwokrama International Centre for Rainforest Conservation and Development and in particular Mr Ken Rodney for sharing its data. We also wish to acknowledge the support and insights received from the Guyana Geology and Mines Commission (GGMC), Guyana Lands and Surveys Commission (GLSC), Mazda Mining Company (MMC) and the Ministry of Public Works and Communication. Finally we wish to thank all those who contributed in one way or the other to the preparation of these reports.
PREFACE
The Initiative for the Integration of Regional Infrastructure in South America (IIRSA) represents a vision set out by governments of South America to physically integrate their countries that will help overcome geographic impediments of development, strengthen markets and open new economic opportunities. With the upgrade of the Georgetown-Lethem Transport Corridor (GLTC), a key component of IIRSA, traditional agriculture and natural resource extraction sectors of Guyana’s economy will be expected to expand as forest resources and lands become more accessible. This expansion is also driven in part by the decreasing transportation distance for products from northern Brazil by as much as 500km to the Atlantic Ocean. Using observations from similar conditions in the region, the increasing accessibility to areas in proximity to the road infrastructure will cause an increase in deforestation and forest degradation. These real-life threats to the forests of Guyana have global climate implications, when it is considered that forest loss contributes as much as 18% of greenhouse gas (GHG) emissions, contributing to global warming and other spin-off climate change effects. Measures are therefore needed to ameliorate this scenario. It is in this context that the GLTC serves as an excellent study site to predict rates of deforestation and to develop and test mitigating measures and enabling frameworks under the Reducing Emissions from Deforestation and Degradation (REDD) Framework which is the subject of intense negotiations under the UN Framework Convention on Climate Change (UNFCCC). These negotiations have been ongoing for several years, with a number of issues expected to be resolved at the Copenhagen round of negotiations in December 2009. The implementation, management and expected benefits of activities that support REDD and the role that countries like Guyana will play are still to be determined and will form part of these negotiations. This means that there is only a narrow window of opportunity to assist the international community in shaping a suitable Climate Agreement that includes HFLD countries. Partly in response to this, Guyana launched a Low Carbon Development Strategy (LCDS) in June 2009 that proposes to maintain its forests in return for revenues that will be used to invest in low carbon development initiatives. It is expected that these revenues will be realised from a suitable REDD framework. In the absence of REDD revenues, the country will be faced with little alternative but to continue along a traditional development path which will have enormous impacts on forests. As with other poor developing countries, it is not possible to ask that the country forego the economic development opportunity provided by projects such as the GLTC for the sake of forest protection that serves the interests of the global climate but with no tangible benefit to the country, especially if there is an alternative route that can be presented by a well-defined REDD framework. It is in response to this situation, that the Inter-American Development Bank contracted Conservation International to provide assistance to the Government of Guyana (GoG) in providing a conceptual and analytical framework for assessing the needs, challenges and opportunities for

6
Guyana in the context of REDD and its impacts on national development and biodiversity conservation, with specific focus on the GLTC.1 To conduct the study CI partnered with Climate Focus, SarVision, Terracarbon LLC, Development & Policy Management Consultants (DPMC), and the Guyana Forestry Commission (GFC) to prepare the six technical papers.
• Site description and analysis of biodiversity, socio-economic factors, and carbon stocks • Modeling Reference Scenarios of Future Emissions • Methodology development recommendations • Analysis of the institutional and policy framework • Analysis of financial flows • Recommendations
This document presents a consolidated summary of these papers. The reader will find much greater detail in each of the papers that was prepared. CI hopes that these papers and recommendations provide additional guidance to policy decisions towards a path of low carbon economic development under the globally proposed REDD framework.
1 Inter‐American Development Bank technical assistance Biodiversity Mainstreaming through Avoided Deforestation –Guyana case study, GY‐T1058.

7
1. MAKING REDD WORK FOR GUYANA: INSTITUTIONAL AND POLICY ENABLING ENVIR IN GUYANAONMENT FOR REDD 2
1.1 INTRODUCTION
With up to 25 percent of global greenhouse gas (GHG) emissions coming from tropical deforestation, forest loss is a significant source of GHG emissions and one of the underlying drivers of climate change.3 If these emissions are not reduced, they have the potential to undercut reductions in energy-related and industrial GHG emissions and frustrate the objectives of the United Nations Framework Convention on Climate Change (UNFCCC). Over the last four years discussions under the UNFCCC have focused on the creation of incentives to reduce emissions from deforestation and forest degradation in developing countries. The discussions were initiated by a proposal put forward in 2005 at the eleventh session of the Conference of the Parties (COP) to the UNFCCC by the governments of Papua New Guinea and Costa Rica that advocated for incentives to be provided to countries to reduce deforestation rates in order to reduce GHG emissions.4 The formation of the Coalition for Rainforest Nations5 of which Guyana is now a member, created additional momentum to address the issue, and deforestation has since become a highly visible topic discussed at all levels including the UN Security Council. In December 2007, the Bali COP considered the topic further and adopted a decision that expanded the scope to include forest degradation. Reducing Emissions from Deforestation and Forest Degradation (REDD) is now a critical aspect of the UNFCCC discussions and is one of the key agenda items that will be discussed at the Congress of Parties (COP) 15 in Copenhagen (December 2009). Deforestation is not just about climate change - there are additional reasons why curbing deforestation is critical. Forest loss has significant negative effects on soil quality, biodiversity, local livelihoods, and indigenous communities. It destabilizes local climate and weather by disrupting historical hydrological cycles, albedo, and large-scale circulation patterns. This should be compared to forest conservation, sustainab ilitation of forests that not only le management, planting, and rehab
2 This chapter was prepared through a combination of desk reviews and interviews. The desk review included a review of relevant domestic legislation and policy documents, UNFCCC decisions, submissions and additional documentation, and literature on deforestation policy. The reader is referred to Chapter X of [ ] for a detailed presentation on this subject.
3 The figure of 25 percent was derived by using 1990 as the baseline and taking into account emissions of carbon dioxide, methane, nitrous oxide, and other chemically reactive gases that result from deforestation and subsequent uses of the land. See R. A. Houghton, “Tropical Deforestation as a Source of Greenhouse Gas Emissions,” in Tropical Deforestation and Climate Change, edited by P. Moutinho and S. Schwartzman (Amazon Institute for Environmental Research, Brazil, and Environmental Defense, Washington D.C. 2005), p 13.
4 See UNFCCC, Reducing Emissions from Deforestation in Developing Countries: Approaches to Stimulate Action, FCCC/CP/2005/MISC.1 (Hhttp://unfccc.int/resource/docs/2005/cop11/eng/misc01.pdfH). Official support for including the issue on the COP’s agenda was sent by Bolivia, the Central African Republic, Chile, Congo, the Democratic Republic of Congo, the Dominican Republic, and Nicaragua.
5 The Coalition for Rainforest Nations is a loosely knit group of developing countries with forests. Some of its members participate in joint submissions of views to the UNFCCC.
8
mitigates CO2 emissions through carbon sequestration, but also protects biodiversity, and delivers a range of socioeconomic benefits. Investing in forests to help mitigate climate change therefore has premium value because of these additional benefits that are critical elements of a sustainable future for human society.
1.2 KEY GLOBAL POLICY ISSUES FOR AN EFFECTIVE REDD AGREEMENT
There are a number of key policy issues that have to be addressed within an effective REDD agreement under the UNFCCC. These include; i) funding options; ii) setting reference levels; iii) monitoring, reporting and verification (MRV); iv) scale; v) effective participation of indigenous peoples and local communities; and vi) the role of conservation, sustainable management of forests and enhancement of forest carbon stocks. 1.2.1 Funding Options Parties’ positions on funding REDD can be broken into two broad groups. One group supports the use of both market and non-market funding, and the other advocates for non-market funding only. Both groups advocate for initial non-market funding to support developing countries developing the capacity to address REDD. Non-market approaches that have been proposed focus on establishing one or more international funds to pay for REDD. To overcome the likely shortfall in public sector funding from developed countries, a number of options for financing these funds have been proposed including i) through donations from developed countries; ii) a tax or auction proceeds from developed countries’ assigned amount units (AAUs);6 and/or iii) proceeds from auctioning off emission allowances under domestic emissions trading schemes. Funding would be used to help countries develop the capacity to monitor and account for REDD, and then also compensate them for any emissions reductions they achieve. Market approaches focus on integrating emission offset credits generated under a REDD trading mechanism into the carbon market. While creating a robust REDD credit trading market has been raised in the international discussions, advocates of market approaches also recognize that additional, non-market based funds will need to be mobilized as part of the broader REDD policy.7 This traditional fund-based financing would help develop the capacity developing countries need to engage the market. Market advocates recognize that funding will be needed to implement this capacity building to set the foundation for market activities as investors will refrain from investing in jurisdictions that do not have adequate legal, technical and political frameworks in place.
6 AAUs are the units issued by Parties who agreed to cap their emissions under Kyoto. The amount of AAUs each Party issues is equal to the number of emissions they agreed to release during the period 2008 – 2012.
7 See the summary from the AWG-LCA Accra meeting; FCCC/AWGLCA/2008/CRP.5 “Report of the workshop on policy approaches and positive incentives on issues relating to reducing emissions from deforestation and forest degradation in developing countries; and the role of conservation, sustainable management of forests and enhancement of forest carbon stocks in developing countries” at para 16.
9
1.2.2 Setting Reference Levels
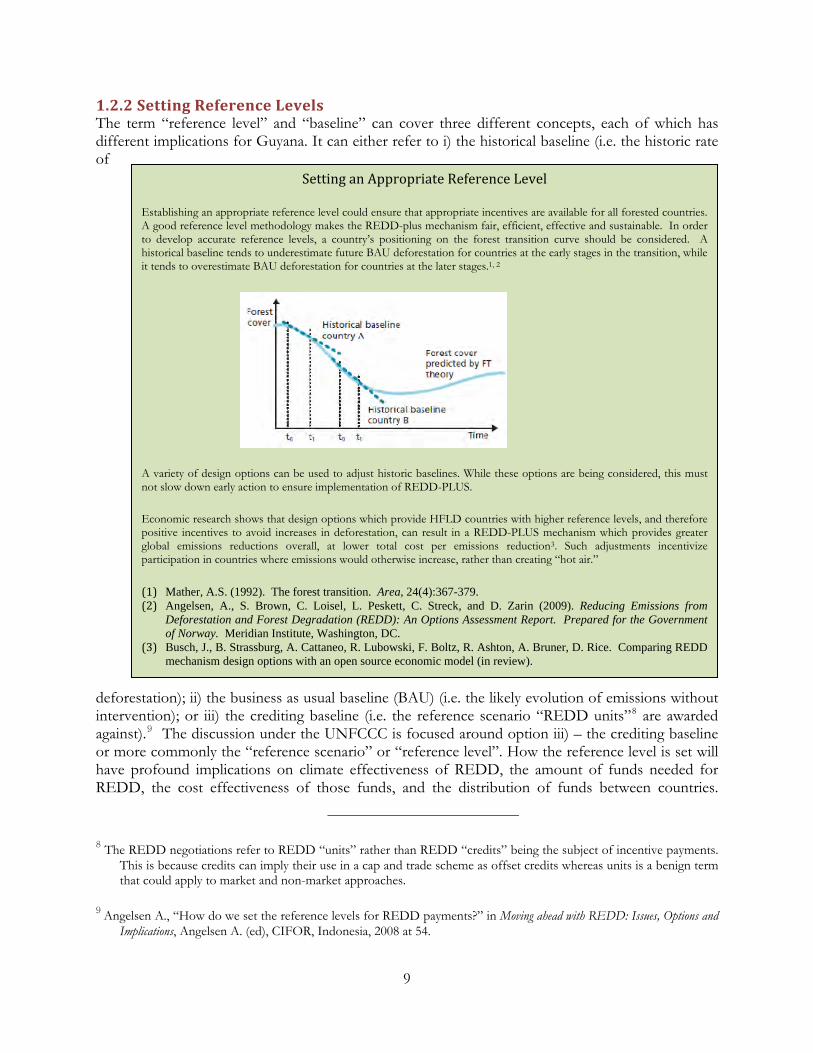
Setting an Appropriate Reference Level
Establishing an appropriate reference level could ensure that appropriate incentives are available for all forested countries. A good reference level methodology makes the REDD-plus mechanism fair, efficient, effective and sustainable. In order to develop accurate reference levels, a country’s positioning on the forest transition curve should be considered. A historical baseline tends to underestimate future BAU deforestation for countries at the early stages in the transition, while it tends to overestimate BAU deforestation for countries at the later stages.1, 2
A variety of design options can be used to adjust historic baselines. While these options are being considered, this must not slow down early action to ensure implementation of REDD-PLUS.
Economic research shows that design options which provide HFLD countries with higher reference levels, and therefore positive incentives to avoid increases in deforestation, can result in a REDD-PLUS mechanism which provides greater global emissions reductions overall, at lower total cost per emissions reduction3. Such adjustments incentivize
icipation in countries where emissions would otherwise increase, rath than creating “hot air.” part er
Mather, A.S. (1992). The forest transition. Area, 24(4):367-379. (1)(2) Angelsen, A., S. Brown, C. Loisel, L. Peskett, C. Streck, and D. Zarin (2009). Reducing Emissions from
Deforestation and Forest Degradation (REDD): An Options Assessment Report. Prepared for the Government of Norway. Meridian Institute, Washington, DC.
(3) Busch, J., B. Strassburg, A. Cattaneo, R. Lubowski, F. Boltz, R. Ashton, A. Bruner, D. Rice. Comparing REDD mechanism design options with an open source economic model (in review).
The term “reference level” and “baseline” can cover three different concepts, each of which has different implications for Guyana. It can either refer to i) the historical baseline (i.e. the historic rate of
deforestation); ii) the business as usual baseline (BAU) (i.e. the likely evolution of emissions without intervention); or iii) the crediting baseline (i.e. the reference scenario “REDD units”8 are awarded against).9 The discussion under the UNFCCC is focused around option iii) – the crediting baseline or more commonly the “reference scenario” or “reference level”. How the reference level is set will have profound implications on climate effectiveness of REDD, the amount of funds needed for REDD, the cost effectiveness of those funds, and the distribution of funds between countries.
8 The REDD negotiations refer to REDD “units” rather than REDD “credits” being the subject of incentive payments. This is because credits can imply their use in a cap and trade scheme as offset credits whereas units is a benign term that could apply to market and non-market approaches.
9 Angelsen A., “How do we set the reference levels for REDD payments?” in Moving ahead with REDD: Issues, Options and Implications, Angelsen A. (ed), CIFOR, Indonesia, 2008 at 54.

10
Factors that may affect setting reference levels include i) historic rates of national deforestation; ii) forest cover; iii) future development pathways (which may overlap/interact with forest cover); iv) GDP per capita; v) global additionality. 1.2.3 Monitoring, REDD needs to be monitored, reported, and verifiable, with the value of incentives proportionate to the level of transparency and accountability in monitoring, reporting and verification (MRV). MRV contains two separate issues that are relevant for Guyana – the subject of MRV, and carrying out MRV. Eligible activities that are subject to MRV need to be agreed. The UNFCCC contains only vague definitions for the land use sector. The Kyoto Protocol contains more precise definitions of a forest, setting parameters whereby a country chooses minimum area (0.05 – 1.0 ha), minimum tree height (2 – 5 m), and minimum crown cover (20 – 30%).
Reporting and Verification (MRV)
10 Developing countries choose parameters within these ranges as the minimum criteria for a forest for the purposes of defining eligible forest and land under the CDM for afforestation/reforestation projects. Although Guyana has defined “forest” in the new Forestry Act, it is not as precise as the above, and the country has not yet submitted a definition for forest under the Clean Development Mechanism (CDM) to the UNFCCC. It is still to be determined if the Kyoto CDM definitions of forest may be transferred over to REDD, or whether a different definition will be adopted. Alternative definitions include the FAO definition (which fits within the Kyoto parameters), or a new definition. Degradation, forest conservation, sustainable forest management, and enhancement of carbon stocks are not defined under UNFCCC or the Kyoto Protocol. Approaches to understanding these terms are still to be agreed. One likely option is to use the existing Intergovernmental Panel on Climate Change (IPCC) Good Practice Guidelines (GPG) framework that can take these categories into account. Irrespective of the final definitions agreed in REDD, Guyana will need to build substantial capacity and improve its existing technology in order to carry out MRV. This may include continuously obtaining and processing satellite data and undertaking on the ground surveys. Options for securing these funds are discussed above.
10 The complete definition of “Forest” under the CDM is “a minimum area of land of 0.05-1.0 hectares with tree crown cover (or equivalent stocking level) of more than 10-30 per cent with trees with the potential to reach a minimum height of 2-5 meters at maturity in situ. A forest may consist either of closed forest formations where trees of various storeys and undergrowth cover a high proportion of the ground or open forest. Young natural stands and all plantations which have yet to reach a crown density of 10-30 per cent or tree height of 2-5 meters are included under forest, as are areas normally forming part of the forest area which are temporarily unstocked as a result of human intervention such as harvesting or natural causes but which are expected to revert to forest”.

11
servation, sustainable management
1.2.4 Scale Most parties recognize that REDD will need to be addressed at the national level. However, there is some recognition that national level implementation will require significant capacity, and that implementation may also include sub-national activities occurring within a country.11 Sub-national activities are therefore being discussed as i) an option for engaging in REDD before national level implementation can be achieved; and ii) an option within a national scheme. To date this reference to sub-national activities is limited to demonstration activities and methodological issues, and is being considered “without prejudice” to any future COP decision on REDD. The scale at which REDD is addressed has important implications for capacity and governance requirements for REDD implementation to be successful in any country. Guyana has expressed its intention to pursue a national scheme which may include specific REDD activities. 1.2.5 Effective Participation of Indigenous Peoples and Local Communities REDD will affect the rights and interests of indigenous peoples (IPs) and local communities (LCs). As a result, IPs groups around the world have started to become very active in REDD. In addition to REDD having a direct affect on IPs and LCs, the participation of IPs and LCs will also be tied to the effectiveness of any REDD initiatives a country engages in. The recent Subsidiary Body for Scientific and Technological Advice (SBSTA) meetings in Poznan on REDD noted – in the context of future work on its agenda – the importance of “recognizing the need to promote the full and effective participation of indigenous people and local communities, taking into account national circumstances and noting relevant international agreements.”12 1.2.6 The Role of Conservation, Sustainable Management of Forests and Enhancement of Forest Carbon Stocks Conservation, sustainable management of forests, and the enhancement of carbon stocks was included late in the Bali negotiations by India, which has already gone through a period of deforestation and is now increasing its total forest cover. It can also apply to countries with high forest cover such as Guyana. When first introduced this expansion threatened to derail the entire REDD negotiations as a number of countries did not want to create an emissions trading system based on standing carbon stocks not under threat of deforestation. This was overcome by last minute compromises and agreement by the US and other countries. India pushed the issue further in Poznan, replacing with a comma the semicolon that divided the text between deforestation and degradation and the role of con of forests, and enhancement of forest carbon stocks.13
11 “Subnational” is seen by many as a euphemism for “projects”, a term that historically generated significant opposition in REDD due to concerns over the potential for leakage.
12 FCCC/SBSTA/2008/L.23, Reducing emissions from deforestation in developing countries: approaches to stimulate action, Draft conclusions proposed by the Chair, Annex, para 1(c)
13 The text therefore changed from “policy approaches and positive incentives on issues relating to reducing emissions from deforestation and forest degradation in developing countries; and the role of conservation, sustainable management of forests, and enhancement of forest carbon stocks” to “policy approaches and positive incentives on issues relating to reducing emissions from deforestation and forest degradation in developing countries, and the role of conservation, sustainable management of forests, and enhancement of forest carbon stocks”. See FCCC/SBSTA/2008/L.23, Reducing emissions from deforestation in developing countries: approaches to stimulate action, para 4.

12
REDD that includes forest conservation is known as REDD-plus (or REDD+). The term used in this report is REDD, unless there is need to distinguish between the two.
1.3 APPLYING REDD TO GUYANA
1.3.1 International Perspective
Deforestation in Guyana In Guyana’s Readiness Plan that was submitted to the World Bank’s Forest Carbon Partnership Facility (FCPF) Guyana noted its rates of deforestation are expected to increase due to the following:
1. Much of Guyana’s forest is suitable for logging and conversion to agriculture;
2. There is a growing national and regional demand for agricultural products;
3. There is a growing international demand for tropical timber and a strong presence of international logging companies in Guyana;
4. Access to Guyana’s forests will be significantly increased during this decade. Most notably, a major international highway from Brazil through southern Guyana to the north coast will be built [the Georgetown-Lethem road];
5. Brazil has a very large and dynamic human population that could rapidly move into Guyana for both logging and agricultural activities; and
6. Implementation of REDD and other conservation measures in Brazil leads to a high potential for international leakage of deforestation and degradation into Guyana, via the highway.
Guyana has very low rates of deforestation14 and is characterized as one of less than 10 developing countries with high forest cover and low rates of deforestation (HFLD). These HFLD countries are estimated to store 18% of the world’s tropical forest carbon.15 While HFLD countries may have historically low rates of deforestation, this does not mean these rates will remain low in the future. Deforestation rates may expect to rise in these countries as the domestic economy and population grow, or if countries with higher rates of deforestation start to cut emissions and the drivers of deforestation in these countries shifts across borders. At this stage in the UNFCCC negotiations, it is yet unclear how HFLD countries such as Guyana may benefit from a future REDD regime. The need to include HFLD countries within a future REDD regime has been raised within the UNFCCC negotiations and there is momentum growing internationally for inclusion of HFLD countries in the REDD financial mechanisms. As noted above the REDD agenda has expanded beyond reducing emissions from deforestation and degradation to now include “the role of conservation, sustainable management of forests and enhancement of forest carbon stocks in developing countries”. This expansion is clearly beneficial to Guyana as it opens up the possibility for financial
14 Guyana had no net deforestation recorded from 2000 – 2005 under the FAO Forest Resource Assessment for 2005. See Food and Agriculture Organization (FAO), “Global Forest Resources Assessment 2005: Progress towards Sustainable Forest Management,” Forestry Paper 147 (Rome: FAO, 2006).
15 Fonseca GABd, Rodriguez CM, Midgley G, Busch J, Hannah L, et al. (2007) “No forest left behind”, PLoS Biol 5(8): e216. doi:10.1371/journal.pbio.0050216

13
incentives to i) protect those areas of forest not under historic or imminent threat; ii) promote sustainable forest practices; and iii) restore forest areas that have been degraded and are able to be restored. It is therefore critical for HFLD countries to work together and with their respective negotiating partners under the UNFCCC framework to seek an outcome at Copenhagen that at best creates financial incentive to protect their forests, or at least ensures that the door is not closed on this matter. A second outcome of the Bali REDD decision that Guyana needs to consider is the call for demonstration activities. The scale for demonstration projects includes national as well as sub-national activities where sub-national activities “constitute a step towards the development of national approaches, reference levels and estimates".16 There are a number of different interpretations of what national and sub-national approaches means in practice. Guyana will need to determine i) how to interpret national and international approaches to REDD within the UNFCCC negotiations, and ii) how to engage in demonstration activities within Guyana. 1.3.2 Domestic Engagement A solid institutional and policy framework is critical to creating a successful enabling environment for forest conservation activities. Without an effective forest policy that is correlated with other national policies, any effort to monitor and account for emissions from deforestation as it progresses over time is meaningless. The elements of an effective policy framework include, inter alia:
• a REDD strategy supported by all relevant authorities and stakeholders; • adoption of policies that ensure continuous forest protection and address potential future
drivers of deforestation; • effective policy and institutional governance and capacity for monitoring forests and forest
activities and for enforcing forest-related policies, laws and contracts for the sale and purchase of carbon credits;
• elimination of any policy or program that undermines the ability of forest conservation projects or programs to compete economically with alternative activities;
• robust legal instruments that allow the long term protection of forests and the recognition of alienable carbon rights;
• mechanisms to ensure stakeholder consultation and benefit sharing with local communities living in or around a forest conservation project; and
• transparent procedures and criteria for the approval of forest conservation projects in Guyana if projects form part of the national policy decision.
16 See Decision 2/CP 13 “Reducing emissions from deforestation in developing countries: approaches to stimulate action”, Annex, para 7.

14
1.3.3 Implications for Existing Policy and Institutional Frameworks Most if not all countries will need to address institutional problems in order to effectively reduce deforestation and degradation. Guyana is no exception, although it has made more advances than the majority of developing countries. Guyana has been proactive domestically through it creation of a REDD Secretariat and submitting its Readiness Plan to the FCPF. More recently this proactive approach has also extended to the preparation of a low-carbon development strategy that includes REDD as a central element. This places Guyana ahead of most other countries seeking to participate in the emerging REDD regime. However, as Guyana is aware, significant work is still yet to be done to successfully implement a national REDD strategy. That said, while the elements that go into a REDD framework may be complex, the resulting management requirement follows a straightforward integrated natural resource management approach in which ecosystem services (carbon) feature alongside the more traditional forest-based industries. While it can be expected that the REDD Secretariat17 will play a significant role in implementing a national REDD-plus strategy18 that is supported by all relevant authorities and stakeholders, a number of challenges exist within Guyana’s Ministries and Agencies. Despite the efforts of the government to promote forest conservation, there is currently inadequate financial and human resources and appropriate technology, all of which will significantly constrain government’s conservation attempts. The large group of institutions created by legislation governing land and natural resources tend to operate independently and with limited coordination, except at the very highest level of decision making. This is reflected in efforts made to enhance coordination through the work of the Natural Resources and Environment Advisory Committee (NREAC) that comprises the heads of agencies 19 While this high level interaction may provide some macro-level coordination, there is overlap in many regulations which is reflected in their implementation. This is particularly evident in mining. Participation in REDD-plus policy formation and initiatives also needs to include a more representative cross-section of society which involves additional government and public agencies, trade unions, indigenous peoples’ representatives, civil society organizations, private sector representatives, and other stakeholders.
17 Located under the GFC
18 i.e. a REDD strategy that includes forest conservation
19. An example of the overlap mentioned is that it is possible for a tract of forest area to be simultaneously regulated for differing activities by the GFC, GGMC, and GLSC. Other bodies with similar or overlapping mandates are the National Parks Commission, the Wildlife Division of the Ministry of Agriculture, and the Environmental Protection Agency.

15
1.3.3.1 Legislative Implications Four main pieces of domestic legislation have direct implications for REDD implementation. These are the Forest Bill 2009, Mining Law, Amerindian Act 2006, and the Environmental Protection Act 2006. Additionally the Land Law, the Iwokrama Act, National Infrastructure Policy, and international law all have a relationship to REDD implementation. The range of pieces of legislation that govern land and forest resource use in Guyana result in the sector being regulated in a compartmentalized manner, with distinct regulatory and monitoring institutions that result in varying levels of conflict and overlap. Forestry is regulated by the GFC, mining in forests by the GGMC and agriculture within State Forests by the GLSC. It is appropriate that these bodies regulate their own industries, but there is room for better coordination between them where there is overlap. Other bodies with similar or overlapping mandates are the National Parks Commission, the Wildlife Division of the Ministry of Agriculture, the Guyana Natural Resources Agency and the Environmental Protection Agency. There would be clear advantages in harmonizing forestry and mining laws, especially regarding the administration of concessions, as well as more integrated land use planning, an integrated hinterland road network, and rehabilitation of a publicly accessible integrated geographic information system such as GINRIS. The legislation also lacks provisions for dealing with the resolution of conflicts and disputes among competing concessionaires. This situation needs attention. The rights of indigenous peoples and local communities feature as a key issue within the international negotiations. There is now need to build on the commendable steps that the government has already taken to address land ownership through land titling. Efforts of Amerindian communities to engage in conservation activities should be further supported, and their rights in areas that involve REDD should also be given further careful consideration. This should apply in particular to the rights of Amerindian communities situated along the GLTC. The Amerindian Village Councils should also be give technical and legal support to formulate regulations under the Act to conserve Village lands and resources, particularly forest resources in accordance with Section 14(1) of the Amerindian Act The government plans to implement a “comprehensive process” to engage and educate Amerindian communities on REDD-plus. This process should follow clearly established procedures regarding how indigenous rights issues should be addressed in the national REDD-plus processes. The procedures should meet applicable international and domestic standards, including free, prior and informed consent requirements.20 1.3.3.2 Negotiating an International REDD Policy that Favours Guyana The most important element dictating the scale of any REDD opportunity for Guyana and the macro-level design of its national REDD policy is the international negotiations of REDD. To ensure its interests are included in any future climate change agreement Guyana needs to play a more prominent role in the technical UNFCCC negotiations. This needs to be done through making
20 Since the writing of this technical paper, the GoG has published the draft Low Carbon Development Strategy under which the REDD Readiness Plan falls. The LCDS sets forth a process of consultation and outreach to satisfy national and international obligations and requirements.

16
formal submissions to the UNFCCC negotiating process and sending a technically skilled and focused negotiating team to every round of formal and informal REDD negotiations until an agreement is reached and the detailed rules decided. This could take several more years. Guyana should also continue to actively support and lead the formation of a negotiating block of HFLD countries to develop common negotiating positions within the UNFCCC negotiations. As the international negotiations progress, there are a number of elements of domestic legislation that can be addressed that go towards the heart of REDD. This will need to be accompanied by reform within a number of institutions principally aimed at better coordination and enforcement. The REDD Secretariat will likely play a key role in this process of getting Guyana ready for REDD 1.3.3.3 Domestic REDD policy As Guyana continues to develop and implement its national REDD policy it will inevitably need to grapple with the tension between treating forest conservation and REDD as a public good that accrues to society at large, and a rights based approach that emphasizes community or individual claims to forests and forest based assets. Precedent for addressing this tension can be found in Guyana’s recent past. Shortly after independence Guyana nationalized its main source of fiscal revenue, which was subsequently followed by a period of economic liberalization. With this philosophy of economic liberalization in mind Guyana should consider the full spectrum of national and subnational approaches to addressing REDD when deciding its national policy. This includes using sub-national approaches as a less demanding step towards national approaches. National approaches can be centralized but can also include bottom-up identification and implementation of sub-national activities that have their accounting linked into a national accounting framework. Rather than being paid the opportunity cost by the government, stakeholders could be allowed to sell REDD credits on the market directly. This type of bottom up approach that allowed direct participation in the international carbon market would also be more likely to stimulate the domestic
preserving Guyana’s forests. private sector within Guyana and attract foreign investment in

17
2. APPLYING REDD TO THE GEORGETOWN‐LETHEM TRANSPORTATION CORRIDOR GUYANA
2.1 INTRODUCTION
While Guyana has maintained a high forest cover and low rates of deforestation or degradation, this situation is expected to undergo some change with the upgrade of the GLTC, a part of the IIRSA Project, which passes through the country’s hinterland (Figure 1). The GLTC therefore serves as an excellent “pilot study- site” to predict future rates of deforestation and to develop and test mitigating measures that can be extrapolated to other areas of the country. The application of REDD within the context of the GLTC will be explored, including the implications associated with the projected change in forest cover driven by the upgrade of the GLTC in the absence of measures to mitigate the impact of forest roads observed in other parts of the Amazon Basin.
BRAZIL ATLANTIC, ROAD TRANSPORT ROUTES, A PART OF IIRSA
Source Georgetown Lethem Road Pre‐Feasibility Study (2008)

18
2.2 SITE DESCRIPTION
2.2.1 Land Use Policy, Tenure Arrangement Land tenure in Guyana can be classified into three broad categories – publicly held, privately held, and collectively held by Amerindian communities. The latter comprises of approximately 13.9 percent of Guyana’s 214,988 square kilometres of land area. Of the remainder, more than 90 percent is publicly held, with most of the private holdings located along the narrow coastal strip. Land tenure in a 16 km wide corridor centered on the existing road between Linden to Lethem is distributed between Public Land (39%); Amerindian Land (27%); and reserved to the Iwokrama International Centre (34%). Approximately one third of the GTLC (i.e. from Georgetown to Linden) is gazetted as a public road, while the other two thirds (Linden to Lethem) segment is not. Although there is no comprehensive land use policy approved by the Government, some work has been done by the GLSC in drafting such a policy. However, sector level policies do exist, such as a forest policy, mining policy, agriculture policy and energy policy. The GLSC has also prepared several regional level land use plans, including plans for the Linden to Lethem and Soesdyke to Linden road corridors. Because these have not been formally approved by the cabinet, they are not yet publicly distributed. 2.2.2 Current and Potential Land Use Activity
Detailed map showing points of interest along GLTC
The country’s economy is primarily based on the production and export of its natural resources, with agriculture, mining, and forestry accounting for most of the output of the productive sectors. Within recent years the tourism sector has also been identified as a potential source of significant revenue for Guyana. The principal land use activities along the GLTC are, forestry, mining, agriculture, settlement, biodiversity conservation and tourism. Silica and bauxite mining, recreation and agriculture are the primary land uses between Georgetown and Linden; while forestry and to a lesser extent, mining are the principal activities between Mabura and Annai. Biodiversity conservation and tourism dominates the segment between Kurupukari and Lethem. The construction of an all weather road would improve accessibility to previously unattractive terrain spurring the potential expansion in economic activities and housing developments. In the absence of effective mitigation measures, the progression of economic activity and settlements along the GLTC may also trigger an increase in unregulated logging, mining, hunting and land clearing activities by migrants or settlers that would now dwell within close

19
approximately 320 species of amph
proximity to these resources. Additionally it can also be predicted that with an improved transportation service, investments in the agricultural and recreational sectors along the road will increase. Land clearance and the consequential degradation and loss of forest, habitats and biodiversity will compromise current efforts to protect its intact forests, considered by Guyana’s Office of the President to be the country’s most valuable asset,21 and attendant biodiversity. While acknowledging that actions such as effective land use planning and monitoring and enforcement can curb excessive rates of deforestation/degradation the capacity of the existing institutional framework and the availability of resources for the management of natural resources will be seriously put to the test unless there is a game change such as a successful REDD framework. 2.2.3 Biophysical Setting Guyana is located in the Guiana Shield Region (approximately 80N; 720W), which was formed during the Precambrian era and is thus one of the most ancient geological landscapes in the world. Located at approximately 56020’;61023’W and 1010’;8035’N on the northeastern coast of South America, Guyana is bordered by Suriname to the east, Venezuela to the west, Brazil to the south and southwest, and the Atlantic Ocean to the north. Approximately 18,120 sq km or 8.4% of the total land area is made up waterways. The Essequibo River is the major drainage system, supported by the Demerara and Berbice Rivers and many creeks that dissect the landscape. The climate is seasonally tropical with an average annual rainfall ranging between 4400 - 1200mm and a national average annual temperature of 25.90C. Guyana consists of four major natural geomorphological regions - Flat Coastal Plain, the Hilly sand and clay Region; the Central and South-western savannahs; and the Highland Region. The GLTC originates at the coastal plain, passes through the hilly sand and clay region, and a narrow strip of the highland areas before terminating in the south-southwestern savannah region. The route of the existing road allows it to pass through the rainforest of central Guyana including the Programme Site for the Iwokrama International Centre for Rainforest Conservation and Development (Iwokrama) and many natural and man-made drainage channels and seasonally flooded areas such as the North Rupununi Wetlands which lies between the Essequibo River and the Kanuku Mountains. 2.2.4 Overview of Biodiversity Resources Guyana has a wealth of intact biodiversity resources resulting from a number of contributory factors, including the country’s presence within the species rich Guiana Shield Region, proximity to the biologically diverse Amazon Basin, the presence of intact tropical rainforests that occupies approximately 75% of the total land area, and low national population density (approx. 4 persons/km2) that at present creates relatively little threat to biodiversity. Although limited, current knowledge shows that the country has about 7,000 plant species, 800 bird species, 225 mammalian species, ibian and reptiles and about 700
21 Office of the President, Guyana, 2009 .Transforming Guyana’s Economy while Combating Climate Change: a Low Carbon Development Strategy.

20
fish species. Many of the identified species are endemic to Guyana and/or threatened globally. According to the IUCN Redlist (2008) there are 173 endemic plant species and 17 threatened faunal species existing in Guyana. In the absence of effective mitigating measures, the recent bridging of the Takutu River (on the border with Brazil) and the planned improvement of the GLTC are viewed as impending threats to the country’s forest and biodiversity as the intact ecosystems in the Rupununi Savannahs and forest ecosystems along the GLTC become increasingly accessible to human activities. The route of the GLTC from the Capital City to the Soesdyke Junction cuts through a fully urbanized landscape with housing development projects, industrial sites and agricultural activities. A far greater portion (Soesdyke to Lethem) of the road passes through the hinterland. Many of the major forest types mapped for the country including pioneer and other light dependent species are along the road. These plant communities combined with the biophysical ecosystems through which the road passes provide a wide range of goods and services for a great proportion of Guyana’s wildlife, surrounding communities and the world. 2.2.5 Socioeconomic Profile The total population of Guyana is small in relation to the country’s area, although the coastal zone is densely populated by around 90 percent of Guyana’s population. The GLTC passes through 3 of the nation’s 10 Administrative Regions i.e. Region 4, Demerara/Mahaica; Region 9, Upper Takatu/Upper Essequibo; and Region 10 Upper Demerara/Berbice. Region 4 has a population of 149,204 individuals; Region 9, 10,062; and Region 10, 20,035; representing 20.1%, 1.3% and 2.7% of the total population respectively.22 Apart from the short Georgetown to Linden stretch at the extreme northern end of the corridor, the population density of the road influence area is exceptionally low being dominated, almost exclusively by Amerindian communities. Amerindians number some 50,000 or approximately 7% of the national population. Most live in Regions 1, 2, 7, 8 and 9 covering the northwest and the interior districts of the country. Most are self-employed conducting traditional subsistence agriculture, hunting and logging. Literacy among the Amerindian populace is the lowest of the country’s ethnic groupings. The most prominent health concerns for this ethnic group are: malaria; respiratory tract infections; abnormal ailments, worm infestations; and acute diarrheal diseases.
TAKUTU BRIDGE. LINKING BON FIN, BRAZIL (UPPER PORTION OF PICTURE) TO LETHEM,
GUYANA (LOWER PORTION)
22 Population and Housing Census 2002.

21
2.3 ASSESSMENT OF FOREST CARBON STOCK AND HISTORICAL GHG EMISSIONS FROM LAND USE AND FOREST DEGRADATION
The purpose of assessing forest carbon stock and historical GHG emissions is to present a description of the background situation for a REDD strategy in Guyana, providing guidance on the selection of methodologies to account for reductions of emissions from deforestation and degradation. For further details and recommendations on datasets suitable for the evaluation of forest carbon stocks and biomass among forest types, and a suggested sampling intensity for the measurement and monitoring plan, the reader is referred to the detailed technical paper on the subject. 2.3.1 Methodology The methodology applied to account for reductions of emissions from deforestation and degradation (REDD) confirms to Tiers and approaches established in the IPCC 2006 Guidelines for National Greenhouse Gas Inventories for the AFOLU (Agriculture, Forestry and Other Land-use) sector. In measuring the current carbon sink levels for this effort a Tier 2 approach was applied using national datasets to replace and improve on IPCC default values. We are of the opinion however that a Tier 3 approach will be required by a market-based REDD framework. To estimate loss in forest cover (area change), Approach 3 of the IPCC 2006 Guidelines was used because specific quantification of deforestation is of interest in the REDD context. Approach 3 uses spatially-explicit data sourced from classified remote imagery that further delivers improved accuracy and credibility to accounting REDD performance. The datasets which were compiled to evaluate forest carbon stocks, variation in biomass among forest types, and required sampling intensity for a measurement and monitoring plan, were sourced from prism sampling from 1990-93 Interim Forestry Project (IFP) (national coverage); the 2003 management level inventory at Iwokrama; and plot data from 2007/8 permanent sample plots (PSP’s) at Iwokrama. Data compiled and analyzed totaled a sample size of 9,413 measurement plots and 58,091 trees. Consistent calculations and assumptions were applied to estimate live tree biomass carbon per unit area (t C ha-1). Current available datasets allowed for the analysis of live tree biomass carbon densities but raw datasets were not available for other forest carbon pools like dead wood, litter and soil carbon. Published estimates from Guyana range from 10-19 t C ha-1, 1-4 t C ha-1 and 28-158 t C ha-1, for dead wood, litter and soil carbon, respectively. Potential emissions from these pools, except in the case of peat soils, are unlikely to qualify them as key categories per IPCC GL 2006 (i.e. that constitute > 25-30% emissions/removals for the category). 2.3.2 Development of the Required Expansion and Conversion Factors Diameter at breast height (dbh) data from individual trees can be used to estimate biomass using allometric equations relating aboveground biomass to dbh and belowground biomass to

22
aboveground biomass. Since no biomass equations specific to Guyana are presently available, existing biomass equations for Guyanese forests were adapted by applying a correction factor for wood density as was used by Baker et al (2004). Specialized equations are required for palms and pioneer species with exceptionally low density wood and unique crown architecture. Equations developed by Delaney et al. (2000) can be used for trees in the Cecropiaceae family (Pourouma spp and Cecropia spp) but palms do not have the minimum measurement criteria. Root biomass density can be estimated at the plot level applying the equation developed by Cairns et al. (1997) and biomass values can be converted to carbon fraction using the coefficient of 0.47, as recommended by the Guidelines for National Greenhouse Gas Inventories (IPCC 2006). It must be noted that the value of carbon estimates for soil organic matter will vary greatly depending on soil types. 2.3.3 Baseline estimates of forest carbon stocks and greenhouse gas (GHG) emissions 2.3.3.1 Live tree biomass To estimate live tree biomass, forest carbon stocks and GHG emissions across forest types, the forest of Guyana was broadly divided into mixed forests; white sand forests and swamp forests. An analyses of datasets (for each of these three categories of forests) obtained from the Interim Forestry Project (IFP) and Iwokrama Management Level Inventory (MLI) and Permanent Sample Plots (PSP) showed that the average live tree biomass (t C ha-1) is highest in the mixed forest (211 t C ha-1) followed by the swamp (197 t C ha-1) and white sand forests (189 t C ha-1). These derived estimates were significantly higher (17 to 34%) than independent estimates calculated by ter Steege (1998) from the 1970 Great Falls inventory. This difference in estimates is due to two key factors: (1) the Lescure et al (1983) equation used by ter Steege produces biomass estimates that are less than our estimates through 95 cm dbh, which comprises the majority of stems, and (2) real differences in forest biomass stocks between the sites measured in the 1970 Great Falls inventory and the 2003 Iwokrama MLI, that could result from edaphic or topographic factors or different disturbance histories. To provide additional perspective, we conducted a literature search of forest biomass data from Guyana and other areas of the Guiana Shield region. The derived results showed that the mean live tree biomass carbon estimate for central Guyana (Iwokrama) forests, 220 t C ha-1, closely coincides with (i.e. within 10% of) Tjon’s (1998) estimate of 215-228 t C ha-1 for Suriname “high dry land forest”, and with Chave et al’s (2008) estimate of 204-228 t C ha-1 from central French Guiana, suggesting that this “biomass class” is widespread throughout the Guiana Shield Region. 2.3.3.2 Root Biomass and Dead Wood and Litter At present no direct measurements of root biomass are available but its biomass value could be estimated as a function of aboveground biomass by applying the equation developed by Cairns et al. (1997) for upland forests. Though not proven to be accurate, the outcome is conservative and acceptable for project accounting, but reveals an area worthy of further research. Measurements of dead wood and litter from Guyana forests are also limited and/or absent. As such data collected by several sources when garnered, assessed and summarized yielded a forest floor litter carbon stocks in mixed forest that range between 0.7 to 3.8 t C ha-1, and did not surpass the 2% of live tree biomass carbon stocks.

23
P)23. Four contrasting scenarios
2.3.3.3 Soil Carbon Soil carbon data gleaned and summarised from several sources indicates that carbon on forest soils in central Guyana ranges widely from 28-158 t C ha-1 in the top 20-30 cm. 2.3.3.4 Remarks on Methodology and Applications For Guyana to regularly estimate changes in biomass and carbon emissions there is need for the implementation of on-going national monitoring programme using the Tier 3 approach. Though this approach will require a higher level of effort, its use will allow the GoG to target and achieve acceptable levels of uncertainty, as well as deliver information that transcends REDD and climate relevance, delivering data equally valuable to other important objectives like conservation and timber production. To mitigate uncertainties representative sampling will be required at the scale to which estimates will be applied, and while the calculated bounds presented in the technical paper accurately stimate uncertainty for the IFP population of interest (national forest concessions), the uncertainty ounds (and estimated means) are indicative only when applied beyond that population.
eb
2.4 MODELING REFERENCE SCENARIOS OF FUTURE EMISSIONS
The GoG has expressed its intention to pursue a development strategy predicated on the conservation of the nation’s forest resources. This is based on the assumption that global carbon markets will provide revenues for maintaining the carbon stocks in those forests. The potential outcomes of that development strategy may be evaluated under different sets of conditions, one of which is driven by the availability of resources that might flow from carbon markets. The scenarios described in this study show how differences in the policy frameworks under discussion in international forums may impact development in a country such as Guyana. The Government of Guyana may wish to conserve its forests, but economic and social forces might transcend that wish or cause the Government of Guyana to reconsider its policies, particularly if the promised revenues from international carbon markets fail to materialize. In this assessment the GHG emissions caused by land-use change are estimated from the upgrade of the GLTC. Furthermore, the potential to reduce those emissions by implementation of a Social and Environmental Action Plan (SEAP) is evaluated. The ability to implement an effective SEAP will be determined by available financing, which may be from revenues from global carbon markets via the proposed mechanism to Reduce Emissions from Deforestation and Forest Degradation (REDD). 2.4.1 Methodology The potential outcomes from different land-use change scenarios along the GLTC may be compared, in order to evaluate how carbon markets might finance an effective social and environmental action plan (SEA may be developed in order to
23 The SEAP will include inter alia measures to assist forest dependent industries to reduce their impact on the forests through benefit sharing mechanisms.
24
evaluate the impact of infrastructure investments and the adequacy of revenues from a potential REDD mechanisms based on either a historical or most-probable future (modeled) land-use reference scenario. 2.4.1.1 The Nostalgic Past Scenario (1) Future development in Guyana will continue on a trajectory similar to the recent past and the rate of land-use change is based on historical trends. This is not a very likely scenario since the decision to upgrade the GLTC has already been made and financing has been considered. 2.4.1.2 Business as Usual (BAU) Scenario (2) Guyana follows a trajectory similar to other Amazonian regions where new highways trigger settlement and agricultural development.24 In spite of the development of a SEAP, the lack of financial resources limits its implementation leading to widespread deforestation. 2.4.1.3 The Insufficient REDD Scenario (3a) The Government of Guyana implements policies to conserve its forest resources based on an expanded SEAP that is linked to a REDD mechanism. However, REDD revenues are insufficient to counteract the economic drivers that accompany a modern transportation corridor. 2.4.1.4 The Effective REDD Scenario (3b) The Government of Guyana implements policies to conserve its forest resources based on an expanded SEAP that is linked to a REDD mechanism. However, REDD revenues are based on deforestation rates from a modeled “most likely future” scenario (Scenario 2), which are sufficient to limit deforestation, which are greater than historical values, but less than what might be experienced in a “business-as-usual scenario”. This scenario also includes a comparison between a forest management regime of a 30-year timber harvest cycle and a 60-year harvest cycle that maintains higher carbon stocks and, consequently, reduces green house gas emissions from forest degradation.
24 While true that the soils of the Guiana Shield are infertile, the use of technology can overcome the limitations of soil chemistry. Tropical ecologists have long held that tropical soils are infertile and not economically viable for agricultural development. However, use of modern technology is overcoming the limitations of tropical soils. By using new varieties of cultivated forage grasses, rotational grazing to control weeds, and vitamins to compensate for the lack of micronutrients, ranchers have increased profitability and enhanced sustainability. In the Cerrado Hotspot, soya farmers apply chemical lime (CaCO3), which changes the pH of soils, resolves aluminum toxicity, and mobilizes plant nutrients that were previously tightly bound to clay particles. In Bolivia, farmers rotate soya with corn or sorghum to manage fungal pathogens. Similar solutions are likely to be discovered and implemented in the Amazon to manage soil fertility and improve pest management. A report for the National Academy of Sciences contends that continuous food crop production is feasible on most Oxisols and Ultisols in the humid tropics.

25
2.4.1.5 Remote Sensing and GIS to Estimate, Carbon Stocks, Land-Use Change and GHG Emissions Using ALOS-PALSAR radar satellite imagery a precise cloud-free image mosaic for the entire country was obtained to create a prototype radar-generated spatially precise forest cover map of Guyana This was the first time that a country forest cover map was ever successfully accomplished using this technology. This was combined with the National Vegetation Map to create a Carbon Density Map with eight physiognomic categories that could be related to carbon stocks values derived from forest inventory data. Carbon stock values for each layer were derived from published and unpublished forest inventory data to provide estimates of above and below ground carbon stocks. Carbon pools were calculated by multiplying the carbon stock (tonnes ha-1) by the surface area for each biomass category.
GUYANA NATIONAL BIOMASS MAP DERIVED FROM THE GUYANA NATIONAL VEGETATION MAP WHICH WAS SIMPLIFIED INTO
PHYSIOGNOMIC CATEGORIES AND THEN SUPERIMPOSED ON THE SIMPLIFIED VERSION OF THE NATIONAL LAND COVER MAP OF GUYANA
TO PRODUCE A HYBRID PRODUCT THAT INTEGRATES SPATIALLY PRECISE LAND COVER WITH INFORMATION ON VEGETATION
STRUCTURE
All four scenarios were developed using the Idrisi-Andes ®LCM software module, which spatially distributes land-use change using numerical models based on probability functions and spatially explicit data upon which those probability functions operate. 2.4.1.6 Predicted Deforestation Rate Driven by the GLTC The scenarios model spatially distribute future deforestation based on probability functions and spatially explicit data derived from the physical, administrative, and infrastructure attributes of Guyana. The rates of change were selected to reflect the pathway of development assumed for each scenario, which ranged from: Scenario (1) 0.05% yr-1; Scenario (2) 0.5% yr-1; Scenario (3a) 0.1%

26
climbing to 0.5% yr-1 after ten years, and Scenario (3b) 0.1% yr-1.25 The CO2 emissions were calculated by comparing the forest cover model outputs for each scenario with the Carbon Density Map. The emissions from forest degradation from logging were estimated by comparing biomass in remnant forest in 30 yr traditional-certified and 60 year reformed-certified management regimes. The rates incorporated into the scenarios model reflect the 30 year history of deforestation of the Brazilian Amazon. The value of 0.5% is the approximate basin-wide average for the entire Amazon, but is also characteristic of frontier states of Pará and Acre that have been transformed by the construction of modern paved highways. The even higher rates of Mato Grosso and Rondônia were not adopted, because land-use change in those States was the result of deliberate settlement schemes and large government investments; policies that are not contemplated for Guyana. The moderate rate selected for Scenario (3b) (and the first temporal period of Scenario (3a) is characteristic of Amapá, which has adopted a policy of forest conservation. It must be noted nonetheless, that the “moderate rate is still an order of magnitude greater than the historical deforestation of Guyana. Modeling was not constrained to the GLTC, but was carried out over the entire country, given the information that was available, and the fact that the GLTC represents only a part of the infrastructural development across the country. 2.4.2 Model Output and Interpretation
A comparison of the four scenarios demonstrates how relatively small changes in the deforestation rate can lead to very large differences in the emissions of greenhouse gases and, in the process, shows the potential for generating significant revenues for Guyana based on moderate projections of deforestation.
The Nostalgic Past Scenario (1) is nominally representative of historical deforestation patterns. The main difference between the recent past and the immediate future is the improvement of the GLTC. Consequently, it is reasonable to assume that in an economic and social setting characterized by low rates of deforestation, there will be some increase in future settlement along that transportation corridor. Results show that if a historical baseline is used as a reference case for calculating reduced emissions under a REDD system Guyana would not be eligible for compensation.
25 The rates incorporated into the scenarios model reflect the 30 year history of deforestation of the Brazilian Amazon. The value of 0.5% is the approximate basin-wide average for the entire Amazon, but is also characteristic of frontier states of Pará and Acre that have been transformed by the construction of modern paved highways. We chose not to adopt the even higher rates of Mato Grosso and Rondônia, because land-use change in those States was the result of deliberate settlement schemes and large government investments; policies that are not contemplated for Guyana. Finally, the moderate rate selected for Scenario 3b (and the first temporal period of 3a) is characteristic of Amapá, which has adopted a policy of forest conservation; nonetheless, that rate is still an order of magnitude greater than the historical deforestation of Guyana.

27
The Business as Usual Scenario (2) provides a perspective of future deforestation and may actually underestimate deforestation – at both the national and corridor scale – due to the moderate assumptions incorporated into models. For example, it may be assumed that there will be an increase in the national deforestation rate, which will reach 0.5% annually within a couple of years, but that deforestation may be partitioned among the GLTC and all other existing or planned transportation corridors. A national deforestation rate was chosen and partitioned among the different regions of the country based on objective criteria. The model also recognizes that opportunities are also a driver of deforestation and that increased access can itself lead to an increase in deforestation rates, at least over the short term. While these choices and assumptions have been made it is recognized that no single modeling approach is infallible and that by varying model inputs and assumptions, one can provide a range of potential emissions scenarios and demonstrate how the improvement of infrastructure might impact the country.
The third scenario (3b) demonstrates the likely outcome of an Insufficient REDD mechanism that is contingent on reducing emissions in the context of historical baselines. In this scenario it is assumed that the economic incentives available via an overly conservative REDD initiative will not approximate the opportunity costs for avoiding deforestation. A modern transportation corridor will dramatically increase the capacity to create wealth through the occupation of the lands within the corridor and conversion to some form of agriculture. The cost of avoiding this deforestation will be substantially greater than in the past and is the fundamental reason why a modeled future deforestation scenario case is more appropriate than a historical baseline when selecting a reference case scenario for Guyana.
The fourth scenario (3b) provides an outcome similar
THE SCENARIO MODELS PROJECT DEFORESTATION OVER THREE TEMPORAL PERIODS (RED AREAS) IN EACH OF THE FOUR SCENARIO MODELS; THE TOTAL AREA DEFORESTED FOR EACH
SCENARIO IS DEPENDENT UPON THE UNDERLYING DEFORESTATION RATE, WHILE THE SPATIAL DISTRIBUTION IS A
FUNCTION OF THE CONSTRAINS AND INCENTIVES THAT DIFFERENTIATE THE SCENARIOS.
Scenario 2. Business as Usual

28
to what most objective observers hope will be the future of Guyana and demonstrates the advantages of an Effective REDD mechanism based on a reasonable expectation of what the future deforestation rate will be in Guyana (i.e., ~ 0.5% per annum) in the absence of incentives to maintain a low deforestation rate. The exact dimensions of those potential revenues would be determined in the future based on a monitoring of forest cover and the associated forest stocks in the country, but they can be estimated by comparing the linear models of CO2 emissions over time for the different scenarios for the GLTC and for the entire country.
REDD revenues could be calculated based on either Scenario 2 or Scenario 3a, both of which provide slightly different perspectives of what a future might look like. What will be included in a REDD reference will no doubt be subject to negotiation and just as protected areas may or may not be included, the deforestation rate in the reference scenario most likely will be fixed using both technical and political criteria.
Finally, the Effective REDD scenario was used to evaluate the potential impact of different forest management policies on forest degradation (the second D in REDD). Most industry professionals have been recommending management regimes based on 30-yr harvest cycles where concessions are subdivided into 30 blocks and harvested for timber once within each cycle. Although current certification schemes accept these standards as sustainable, most experienced forest ecologists recognize that 30 years is insufficient to allow for the regeneration of canopy dominants and hard-wooded species (such as Greenheart – Chlorocardium rodiei). Most of these high value timber species range between 100 to 200 years old - or greater where infertile soils and slow growing trees lead to even longer reproductive cycles and growth histories, the case in Guyana.
REDD provides an opportunity to revisit this accepted regime, offering the possibility to transition tropical forestry management to a truly sustainable management regime. To demonstrate that potential, a simple linear model that compared the impact of 30-yr and 60-yr harvest cycles with a complete moratorium on logging was applied.
THE CUMULATIVE CO2 EMISSIONS GENERATED FOR EACH SCENARIO MODEL WITHIN THE GLTC (A) AND FOR THE
REPUBLIC OF GUYANA (B); THE DIFFERENCE IN SLOPE IN THE LINE THAT DESCRIBES THE EMISSIONS FOR SCENARIOS
2 AND 3A IS A DUE TO THE DISPLACEMENT OF DEFORESTATION TO A SECOND TRANSPORTATION CORRIDOR (I.E.,., THE ACRONORTE IIRSA) WITHOUT
MODIFYING THE UNDERLYING RATE OF DEFORESTATION. SINCE THE ABSOLUTE AMOUNT OF DEFORESTATION IS THE
SAME AT THE NATIONAL LEVEL, THE RELATIVE AMOUNT THAT OCCURS WITHIN THE GLTC IS REDUCED
Nostalgic Past Business as Usual Insufficient REDD Effective REDD
Nostalgic PastBusiness as Usual Insufficient REDD Effective REDD

29
This analysis revealed that the potential REDD revenues from avoided degradation approximate the avoided emissions from avoided deforestation. In the short term, however, REDD revenues from improved forest management surpass those from avoided deforestation, while accruing the benefits from a 60-yr (or longer) rotation cycle, which truly guarantees that conservation of the natural forest ecosystem with its full compliment of high-value timber species.
The projected activity of forest management would be approximately the same or, perhaps even greater than Guyana currently experiences, because it foresees a higher intensity per unit under exploitation, that is combined with a larger total area under management (e.g., the Southern forest estate), that offsets the longer exploitation period.
It should be stressed that the selection of a 60 year logging cycle is arbitrary and the true level of intensity must be considerably less than the net primary productivity of the forest ecosystem, which must be
Emissions and avoided emissions from deforestation and forest degradation; the adoption of a 60 year logging cycle compared to a 30 yr logging cycle would avoid approximately the same amount of CO2
emissions as avoiding deforestation
Emissions from
deforestation Emissions from
Degradation Total Emissions
Scenario 1 144,164,780 1,325,024,523 1,469,189,303Scenario 2 1,489,163,324 2,923,724,169 4,412,887,493Scenario 3a 1,307,443,153 3,121,371,986 4,428,815,139
Scenario 3b/30 yr 340,553,585 2,705,911,331 3,046,464,916Scenario 3b/60 yr 340,553,585 1,218,173,555 1,558,727,139
Difference Scenario 2 -
Scenario 3b/30 yr 1,148,609,739 217,812,838 1,366,422,577Difference Scenario 2 -
Scenario 3b/60 yr 1,148,609,739 1,705,550,614 2,854,160,353
Difference from Avoided Deforestation 1,148,609,739 Difference from Avoided Degradation 1,487,737,776
THE ADOPTION OF A FOREST MANAGEMENT POLICY BASED ON A COMPARISON BETWEEN A 60-YEAR AND A 30-YEAR HARVESTING CYCLE FOR SFM WAS EXAMINED FOR THE EFFECTIVE REDD SCENARIO (3B). IN THIS VERSION OF THE MODEL, WE ASSUME THAT THE CURRENT CONCESSIONAIRE AREA AND THE REMNANT FOREST ESTATE (INCLUDING ALL STATE LANDS OUTSIDE PROTECTED AREAS AND INDIGENOUS LANDS) WOULD BE DIVIDED INTO MANAGEMENT UNITS HARVESTED ON EITHER A 30 OR 60 YEAR CYCLE WHERE LOGGING LEADS TO A ONE TIME LOSS OF 50% OF BIOMASS, WHICH THEN RECOVERED BIOMASS AT A RATE OF 2% ANNUALLY WITHIN THAT BLOCK AND A NO LOGGING REGIME IS ADDED FOR COMPARISON. THESE THREE SCENARIOS WERE THEN COMPARED TO THE NOSTALGIC PAST SCENARIO (SCENARIO 1) AND THE BUSINESS AS USUAL SCENARIO (SCENARIO 2).

30
established via traditional studies of forest ecology.
There are still many areas where the refinement of the model or additional monitoring efforts might lead to more accurate or precise estimates of future greenhouse gas emissions. The models used in this study only incorporate above and below ground biomass, and the below ground biomass estimates are reliant on Tier I coefficients based on an extremely small sample size. It is assumed that a converted landscape looses all of its biomass upon conversion, which is a methodological convenience, while common sense indicates that the loss of biomass is attenuated over time and might be replaced in party by the regeneration from second growth forest. Likewise, it is assumed that forests will be replaced by low biomass pasture or crop cover. However, future trends in tropical agroforestry will probably favour perennial tree plantations that could replace significant amounts of the biomass lost via the conversion process. This modeling exercise has provided valuable insight into the how land-use-change along transportation corridors might impact greenhouse gas emissions and thus contribute to global warming.

31
3. ANALYSIS OF FINANCIAL FLOWS FROM REDD ACTIVITIES IN GUYANA
3.1 INTRODUCTION
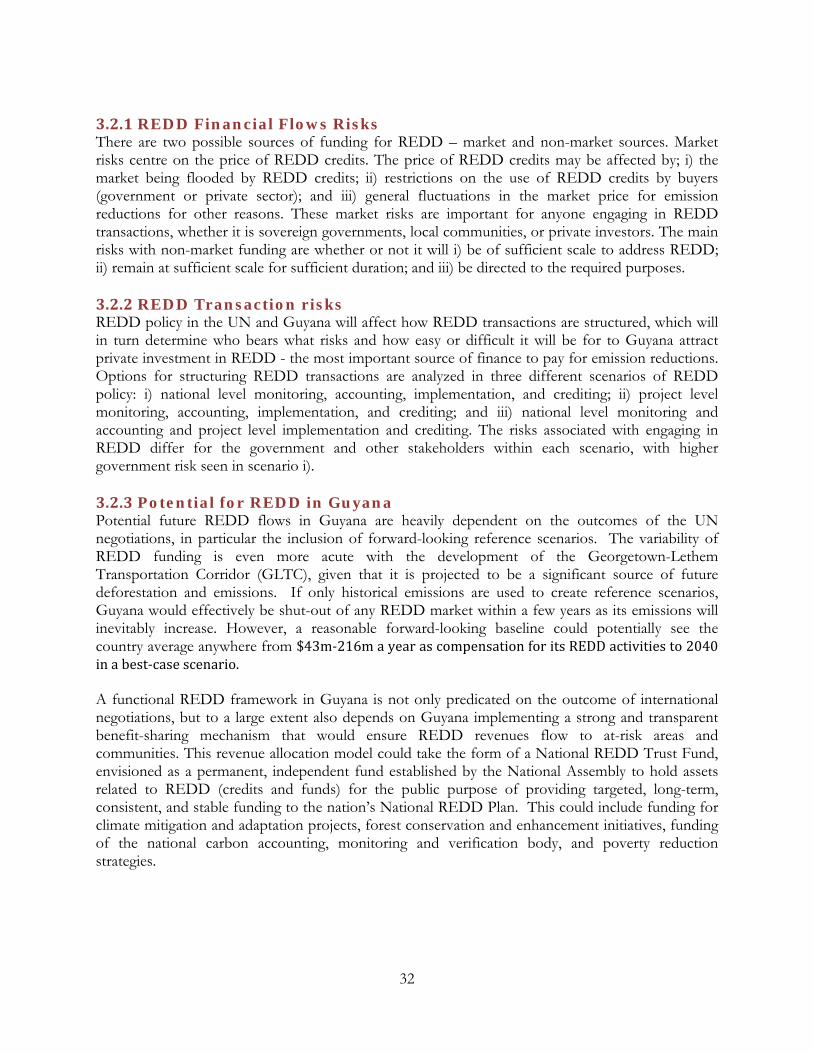
In the absence of REDD revenues, Guyana will be faced with little alternative but to continue along a traditional development path which will have enormous impacts on its standing forests. As with other poor developing countries, it is not possible to ask that the country to forego the economic development opportunity provided by projects such as the GLTC for the sake of forest protection that serves the interests of the global climate but with no tangible benefit to the country and the well-being of its citizens. This is especially apt if there is an alternative route that can be presented by a well-defined REDD framework. The purpose of this analysis is to determine what enabling financial conditions are required to bring congruence to conservation of forests and economic development spurred by IIRSA, through the application of a REDD framework. Financial needs for reducing emissions from deforestation and degradation and conserving forests (REDD-plus) will change over time and differ for each actor engaging in REDD-plus. The timing of financial needs has been described in three distinct phases that move from REDD strategy development and capacity building, to REDD implementation, to compensation for emission reductions against a reference scenario. In each of these phases the actors engaged in REDD activities – such as the central government and its ministries and agencies, regional agencies, and communities engaged in REDD activities on the ground – will have different financial needs.
3.2 REDD FINANCE: OVERVIEW OF ISSUES
Costs for REDD will vary greatly from country to country depending on demographics, ecosystems, geography, and other country-specific factors including current policy and existing government capacity and governance. Average costs for readiness have been calculated at between $13.75 million and $91.61 million per country.26 This figure should be considered, refined and included in Guyana’s REDD Readiness Preparation, which currently estimates Readiness costs at $11.22 million27.
26 Hoare et al (2008) “Estimating the Cost of Building Capacity in Rainforest Nations to Allow them to Participate in a Global REDD Mechanism” produced for the Eliasch Review by Chatham House and ProForest with input from the Overseas Development Institute and EcoSecurities.
27 Guyana R PLAN submission to the World Bank Forest Carbon Partnership Facility, 2009.
32
3.2.1 REDD Financial Flows Risks There are two possible sources of funding for REDD – market and non-market sources. Market risks centre on the price of REDD credits. The price of REDD credits may be affected by; i) the market being flooded by REDD credits; ii) restrictions on the use of REDD credits by buyers (government or private sector); and iii) general fluctuations in the market price for emission reductions for other reasons. These market risks are important for anyone engaging in REDD transactions, whether it is sovereign governments, local communities, or private investors. The main risks with non-market funding are whether or not it will i) be of sufficient scale to address REDD; ii) remain at sufficient scale for sufficient duration; and iii) be directed to the required purposes. 3.2.2 REDD Transaction risks REDD policy in the UN and Guyana will affect how REDD transactions are structured, which will in turn determine who bears what risks and how easy or difficult it will be for to Guyana attract private investment in REDD - the most important source of finance to pay for emission reductions. Options for structuring REDD transactions are analyzed in three different scenarios of REDD policy: i) national level monitoring, accounting, implementation, and crediting; ii) project level monitoring, accounting, implementation, and crediting; and iii) national level monitoring and accounting and project level implementation and crediting. The risks associated with engaging in REDD differ for the government and other stakeholders within each scenario, with higher government risk seen in scenario i). 3.2.3 Potential for REDD in Guyana Potential future REDD flows in Guyana are heavily dependent on the outcomes of the UN negotiations, in particular the inclusion of forward-looking reference scenarios. The variability of REDD funding is even more acute with the development of the Georgetown-Lethem Transportation Corridor (GLTC), given that it is projected to be a significant source of future deforestation and emissions. If only historical emissions are used to create reference scenarios, Guyana would effectively be shut-out of any REDD market within a few years as its emissions will inevitably increase. However, a reasonable forward-looking baseline could potentially see the country average anywhere from $43m‐216m a year as compensation for its REDD activities to 2040 in a best‐case scenario. A functional REDD framework in Guyana is not only predicated on the outcome of international negotiations, but to a large extent also depends on Guyana implementing a strong and transparent benefit-sharing mechanism that would ensure REDD revenues flow to at-risk areas and communities. This revenue allocation model could take the form of a National REDD Trust Fund, envisioned as a permanent, independent fund established by the National Assembly to hold assets related to REDD (credits and funds) for the public purpose of providing targeted, long-term, consistent, and stable funding to the nation’s National REDD Plan. This could include funding for climate mitigation and adaptation projects, forest conservation and enhancement initiatives, funding of the national carbon accounting, monitoring and verification body, and poverty reduction strategies.

33
3.2.4 REDD as Development Finance The conflicting tugs between development and conservation seen in countries with high forest cover such as Guyana can be mitigated to some extent by including REDD components in future infrastructure projects that may have negative implications on forests. The benefits of incorporating REDD into infrastructure project design are made clear by analyzing the payoffs resulting from “greening” the GLTC project in order to minimize deforestation along the route. Funding the estimated $2.6m needed to include a REDD component into the road project design would create REDD credits that could potentially double the financial returns for the project while maintaining Guyana firmly below its reference emissions scenario and international obligations, thus not putting development goals at odds with conservation activities. Funding for the development of the REDD component of the project could be accessed through various means: i) Bundling into development loans; ii) Third-Party Sales of future carbon credits; iii) REDD-Toll; or iii) Grant Financing. Each has its associated pros and cons that are discussed in the paper.
3.3 REDD FINANCE IN GUYANA
3.3.1 Valuing REDD in Guyana As with any future expected revenue stream, there are several ways to value potential REDD revenue for the Government of Guyana, and most approaches tend to revolve around either compensating the opportunity costs of the land, or calculating the avoided emissions in tons of CO2e and multiplying that by an estimated REDD credit price. On a stand alone basis, both of these approaches fall short of determining whether a REDD system would actually work, and be capable of reducing emissions from deforestation as predicted. Looking solely at opportunity costs may give a reasonable estimate of the minimum payments needed to alter deforestation activities in the affected areas, yet it is entirely unlikely that a REDD mechanism would work if credits would have to be sold well above market prices in order to compensate for extremely high opportunity costs. A simple opportunity costs assessment will also not capture additional issues associated with successful REDD implementation such as governance and capacity requirements. Similarly, simply calculating estimated emissions reductions may provide a rough figure of potential REDD income, but if this income comes in significantly below the land’s opportunity cost then it is unlikely that land owners will alter from their economically logical (yet ecologically detrimental) land use practices. Thus, in order to calculate potential revenues of an Effective REDD scheme, one that has the highest probability of functioning, this analysis sought to quantify the annual REDD flows that would be both sufficient to stop future projected deforestation in Guyana, while at the same time be financially feasible for the expected future REDD market to sustain.
THE OPPORTUNITY COST OF LAND IN GUYANA COMPARES FAVORABLY TO OTHER TROPICAL REGIONS THUS MAKING REDD A VIABLE MITIGATION STRATEGY FOR THE COUNTRY. SOURCES: OSIRIS CALCULATIONS,
BOUCHER 2008, OLSEN 2009
LowEnd HighEndUSD / Ha $829.23 $2,226.26USD / tCO2e $1.07 $2.87
Global Averages (Stern) $2.76 $8.28Brazil $3.90 $6.10Indonesia $1.65 $3.44
Estimated Opportunity Cost of Land for Guyana

34
3.3.2 REDD Revenues Because the GLTC has the potential to mark a major shift in Guyana’s development path and likely increase the country’s historically low deforestation rate, any potential REDD flows are to a large extent dependent upon properly defining and gaining acceptance for Guyana’s baseline or reference scenario in accordance with this future projected path. The financial implications associated with these decisions are key to the success of any REDD Plan, and may be examined here by comparing the performance of different national REDD design options under the two scenarios modeled in the previous section (referred to as the Insufficient REDD scenario, and Effective REDD scenario). Based on the projected future deforestation rates for Guyana presented in the two scenarios modeled, Effective REDD and Insufficient REDD essentially contrast the difference between a well-funded and functioning REDD system versus a non-working REDD system that fails to adequately incentivize or otherwise stop people from carrying on deforestation activities. In order to better understand what “adequate” levels of funding represent, the potential REDD revenue may be compared to the estimated opportunity cost of the land28 to determine at what price ($ tCO2) a REDD scheme could potentially work, at both the national level and project-level.
THE GLTC AREA IS PROJECTED TO ACCOUNT FOR ALMOST A QUARTER OF ALL FUTURE NATIONAL EMISSIONS IN GUYANA, AND CAN THEREFORE NOT BE OVERLOOKED IF GUYANA IS TO
STAY IN COMPLIANCE IN ANY FUTURE REDD SCHEME. AN EFFECTIVE REDD
PLAN AND TARGETED REDD PAYMENTS TOWARDS THIS HIGH‐RISK REGION WOULD MITIGATE THE RISK
OF THE INSUFFICIENT REDD SCENARIO PLAYING OUT
24%GLTCProject Total Estimated
Cumulative National Emissions in Guyana 2010-2040
~ 4.41 Gt CO2e
3.3.2.1 The Insufficient REDD Scenario The Insufficient REDD Scenario is one where REDD payments to Guyana are lower than what is necessary to fully fund the country’s REDD Plan, leading to a breakdown of forest conservation schemes and an eventual reversion to the BAU scenario. This scenario is envisioned as the consequence of either a supply-side problem by the lack of REDD credits generated by the country, or a demand-side problem caused by low credit prices or weak international markets for REDD credits. REDD credit supply issues could stem from either i) international REDD negotiations not favoring Guyana by agreeing to use historical deforestation rates as baselines , or ii) Guyana not
eing able to stop future deforestation which would result in national emissions increasing beyond n agreed-upon reference scenario.
ba
28 The opportunity cost analysis used inputs from a map of global agro-ecological zones (detailing Guyana) produced by Fischer et al 2000, determining the highest value crop type (soy, beef, etc), multiplying production value of that crop type by average 1995-2005 market rate to obtain annual revenue. OSIRIS

35
Although the Insufficient REDD scenario stems from a lack of financing, it is not necessarily predicated on a lack of supply associated with the use of a historical baselines or the GLTC development, and could just as easily be the result of demand-side market imperfections. Should REDD credits sell at extremely depressed market prices, regardless of the baseline used, the lack of financial inflows to the country would also foresee an eventual return to the BAU scenario.
1
2
.
INSUFFICIENT REDD. Due to the GLTC upgrade, emissions in Guyana will increase above historical baselines (1) leading tofuture REDD deficits and possibly no REDD payments (2). With a lack of incentives, emissions soon return to the BAUscenario. This is referred to as the “insufficient REDD scenario” where Guyana does not have the funds to fully implement itsREDD strategy or funds are not targeted correctly towards high-risk areas (the GLTC). An effective REDD plan and targetedREDD payments towards this high-risk region would mitigate the risk of the insufficient REDD scenario playing out.

36
3.3.2.2 The Effective REDD Scenario 3.3.2.2 The Effective REDD Scenario
EMISSIONS REDUCTIONS UNDER AN EFFECTIVE REDD SCENARIO.
NOTE: THE NUMBERS USED IN THIS ANALYSIS ARE ADJUSTED FROM THOSE PRESENTED IN THE PREVIOUS SECTION. ASSUMPTIONS INCLUDE LIMITLESS DEMAND
FOR REDD CREDITS AND THAT GUYANA WILL BE ABLE TO SELL ALL CERTIFIED CREDITS, EX‐ANTE, EVERY YEAR FOR THE 30 YEAR CREDITING PERIOD (EXCLUDING A 2 YEAR MONITORING START‐UP PHASE) EITHER THROUGH FORWARD TRANSACTIONS
OR IN THE SPOT MARKET AT INFLAT ON ADJUSTED PRICES (NO DECLINE) I
Cumulative National Emissions (tons CO2)BAU vs Effective REDD
Business As Usual
Effective REDD
-
500
1,000
1,500
2,000
2,500
3,000
3,500
4,000
4,500
5,000
2010
2012
2014
2016
2018
2020
2022
2024
2026
2028
2030
2032
2034
2036
2038
2040
Mill
ions
tCO
2
Mean Annual Emissions
Reductions = 87.72m tCO2
Under an Effective REDD Scenario, on the other hand, Guyana would be able to reduce projected deforestation significantly through the application of a REDD scheme and forward-looking baselines. These credits would then be sold forward to an international market with essentially limitless demand, at prices roughly trading for what forest carbon projects trade for in today’s voluntary market. Of course many of these assumptions may not play out in a future REDD regime, but the Effective REDD scenario conforms to a “best-case” scenario that would spur both supply and demand for REDD credits.
Under an Effective REDD Scenario, on the other hand, Guyana would be able to reduce projected deforestation significantly through the application of a REDD scheme and forward-looking baselines. These credits would then be sold forward to an international market with essentially limitless demand, at prices roughly trading for what forest carbon projects trade for in today’s voluntary market. Of course many of these assumptions may not play out in a future REDD regime, but the Effective REDD scenario conforms to a “best-case” scenario that would spur both supply and demand for REDD credits.
Total Reductions (t CO2) 2,719,378,243 87,721,879
$2/ton CO2 $5/ton $10/tonTotal Revenue Constant USD 4,953,091,935$ 12,382,729,837$ 24,765,459,675$ Mean Annual Revenue 159,777,159$ 399,442,898$ 798,885,796$ Mean Annual Revenue (disc) 43,194,540$ 107,986,351$ 215,972,702$
NPV @ 10% $1,346,530,690 $3,366,326,726 $6,732,653,452
30yr Emissions Reductions Achieved under Effective REDD
Mean Annual Reductions (t CO2)
Effective REDD 30yr Revenue Projections

37
3.3.3 Implications on REDD Success When taking into account the opportunity costs presented above, excluding transaction costs it would not be unreasonable to assume that for REDD to function properly in Guyana annual REDD revenues would have to be at least $93 million (avoided deforestation * opportunity cost of land). Fortunately, the mean annual revenue projected under an Effective REDD Scenario which takes into account possible emission reductions and current market prices comes in well above that minimum threshold, meaning that Guyana could very well have a functioning REDD program. At this level of funding, the income generated from the sales of REDD credits would enable the country to implement a fully functioning REDD strategy that would cover the opportunity costs of the land and account for the REDD Plan transaction and administrative costs29 which are difficult to predict but seem to be well below $1tCO2 given current available information For this scenario to play out, the demand (price per tCO2) and supply of credits must both be shored up if the best-case scenario is to be reached for Guyana. Any limits or caps placed on REDD credits would curtail this demand and force up the price of tCO2 in order to reach the target annual REDD payments of $100m ~ $200m (avoided emissions * opportunity cost of land + transaction costs). Thus it is clearly in Guyana’s best interests to not only ensure that forward-looking reference scenarios are included in the international REDD negotiations, but also that the market is free of any impediments to REDD credit demand such a partial fungebility, expiration, caps, or bankability, that have hindered the growth of the CDM forestry market thus far. 3.3.4 Alternatives to Finance the GLTC REDD Project Establishment of the REDD project and funding for the various aspects of Project Design are estimated around US$2.6m over a period of five years. This cost could theoretically be funded through a variety of financial schemes. 3.3.4.1 Bundling into development loan Perhaps the easiest option, up-front funding for the REDD project would be earmarked in the initial development loan to be repaid over the project’s lifetime either in ER credits or currency. The downside to this option is that the country ends up taking on all project risk.
29 Nepstad et al. 2007 estimate implementation costs including project level and national level costs. At full implementation of a REDD programme in the Brazilian Amazon, implementation costs are $0.58/ton CO2. Administration costs estimated by Grieg-Gran 2006 range from $4-15 per hectare ($0.01-0.04/ton CO2e). This estimate is based on national level payments for environmental services schemes in Costa Rica Mexico and Ecuador. Boucher 2008 sums Antinori and Sathaye’s estimate of transaction costs ($0.38/ton CO2), Nepstad et al.’s implementation cost estimate ($0.51/ton CO2) and Grieg-Gran’s highest administrative cost estimate ($0.04/ton CO2) to derive a total of $1/ton CO2. There is little empirical quantitative work on these costs and a number of studies argue against estimating these costs prior to more resolution on UNFCCC decisions regarding REDD in a post 2012 regime (Blaser and Robledo 2008). While there are likely to be economies of scale in implementation costs, transaction costs are likely to be fixed at the project or national level (Pagiola and Bosquet 2009). This implies that the share of transaction costs in the costs of REDD depends on the degree of success in emissions reduction; if emissions reduction is large, the fixed amount of transaction cost, expressed in terms of cost per ton CO2e will be low. (Olsen 2009)

38
3.3.4.2 Third-Party Sale Up-front funding would be secured through the forward sale of ER credits to a third party (bank, carbon fund, developer) at an agreed upon time and price. This option would involve selling the ER credits at a steep discount, yet some of the risk would also lie with the third party financier. REDD-Toll. A toll would be charged to road users to fund the REDD project start-up costs consistent with a payment for ecosystem services (the ecosystems that were destroyed by the creation of the road), and could be suspended once the REDD project was self-financed. Tolls could only be collected once the road was mostly completed, however, possibly delaying the REDD project for a number of years, and could significantly raise transportation costs depending on volume of traffic30. 3.3.4.3 Grant Financing REDD project start-up costs could apply for grant financing to a multilateral organization or through a bi-lateral agreement. This is the cheapest and least risky option, and possibly the hardest to secure. 3.3.4.4 Financial Results Strictly treating the GLTC area and it’s 100km wide “green buffer” as a REDD project, the financial results are extremely encouraging and make the clear case that the decision to “green” infrastructure investments can be the result of a logical financial decision and not simply an ecologically-wise decision. The results of such modeling can clearly indicate that a comparatively small initial investment in REDD planning and project development (estimated at $2.6m) has the potential to turn the project into a successful tool in the development of a low-carbon economy should the best-case scenario come about. Even at relatively low levels of funding, by forward selling REDD credits at a fixed $5/ton over the lifetime of the project, the inclusion of a REDD component still provides an economic advantage over traditional infrastructure investments, and does not take into account the substantial ecosystem and community benefits that forest conservation provides. Please refer to Annex 3 for a detailed analysis.
30 The IDB Prefeasibility Study projects a toll of around $70-100 to cover yearly maintenance costs.

39
Total Reductions (t CO2) 538,557,282 17,372,816
$2/ton CO2 $5/ton $10/tonTotal Revenue Constant USD 1,037,434,434$ 2,593,586,085$ 5,187,172,169$ Mean Annual Revenue 33,465,627$ 83,664,067$ 167,328,134$
NPV @ 6% $513,645,285 $1,284,113,212 $2,568,226,424NPV @ 10% $359,478,650 $898,696,625 $1,797,393,250NPV @ 12% $344,790,916 $861,977,290 $1,723,954,581NPV @ 25% $221,878,592 $554,696,479 $1,109,392,959
Mean Annual Reductions (t CO2)
GLTC REDD 30yr Revenue Projections
30yr Emissions Reductions Achieved under the GLTC REDD Project
COMPARISON OF REDD PROJECT REVENUES. NPV RATES CORRESPOND TO THE FOLLOWING: 6% GUYANA INFLATION RATE (6.4%, MAY 2009 GUYANA CENTRAL BANK), 10% ARBITRARY RATE, 12% RATE USED IN IDB GLTC PRE-FEASIBILITY STUDY, 25% REASONABLE MINIMUM RATE OF RETURN NEEDED BY A PRIVATE SECTOR INVESTOR. GREEN SQUARES REPRESENT FEASIBLE OPTIONS TO THE ALTERNATIVE LAND USE OF HIGH-END OPPORTUNITY COST VALUES (TOP 90% OF LAND
ALUE).
Low End High EndOpp Cost of Land $408,340,330 $564,635,099
V
3.4 REDD‐PLUS POTENTIAL
The move from REDD to REDD-plus by including the elements of forest conservation, sustainable forest management, and carbon stock enhancement represents a major achievement for HFLD countries. However, until the rules and modalities of REDD-plus are defined by the international community it is impossible to evaluate what sort of positive incentives will be applied to conserve standing carbon stocks. There should be more clarity emerging in the lead up to the Copenhagen round of negotiations in December 2009. The problem with quantifying the opportunity for Guyana is that the UNFCCC body was created to deal with carbon flux, that is, GHG emissions and reductions, but it is not yet fully equipped to treat pristine (and stable) carbon stocks. It is highly unlikely that stock based credits will be fungible with flux based credits traded in the global carbon market. Although arriving to any level of detail is meaningless at this “limbo” in international negotiations, what is clear is that REDD-plus offers additional potential for funding to support tropical forest conservation. Guyana’s forests, with a forest cover of roughly 85% containing over 5GtCO2 in above ground biomass, estimated forest land between 18.416 million hectares and 18.695 million hectares31 with approximately 12% designated as protected areas, stands to benefit substantially from a well funded REDD-plus scheme.
31 Guyana FCPF R‐PIN submission

40
Little analysis currently exists on the effectiveness of the REDD-plus elements, but studies have started to emerge that conclude that intact forests do indeed sequester more CO2 than previously thought32, and the Effective REDD analysis performed in this study takes into account a 60 year sustainable forest management practice instead of the current 30 year standard. Needless to say, much more study is needed on the subjects before any conclusions can be reached on the benefits of REDD-plus, but Guyana promises to become a potential “case study” to demonstrate the benefits of such an approach.
32 Lewis et al., Increasing Forest Carbon, Nature 09

41
4. RECOMMENDATIONS
4.1 APPLYING REDD TO GUYANA: INTERNATIONAL CONSIDERATIONS
Guyana’s best interests lie in examining the role of REDD in all potential large-scale development projects given its low historical deforestation rate. The country should not have to choose between development aspirations and conservation goals (and REDD revenue) but should instead focus on implementing low-carbon development plans including the greening of possible infrastructure projects. For Guyana, the best way to make their case at the international level is to develop a robust and credible reference scenario that takes into account increased emissions due to the country’s full development plans, with specific emphasis on planned mining, ranching, and timber harvesting activities. The large volumes of emissions reductions projected with GIS modeling and associated large flow of funds presented in this report can be taken as a “high water mark” and a good starting point towards defining a realistic reference scenario for Guyana. More fine-tuning is needed to better incorporate other development scenarios. Reference scenarios based on spatial modeling or economic projections are for the moment largely mutually exclusive and need to be fully integrated to arrive at a robust national deforestation rate. Land-use change patterns need to be supplemented by opportunity cost information and historical deforestation data to prevent overestimation of deforestation rates which could have serious consequences on a future REDD market. Additional financial analysis on potential funding associated with these improved reference scenarios is warranted, including the addition of REDD-plus as an alternative REDD scenario. This analysis should include a comparative assessment of potential income under four scenarios; i) low volumes of carbon credits plus low payments for forest conservation; ii) low volumes of carbon credits plus high payments for forest conservation; iii) high volume of carbon credits plus low payments for forest conservation; and iv) high volume of carbon credits plus high payments for forest conservation. This analysis would go hand in hand with more refined versions of the GIS modeling methodologies that would seek to precisely predict future expected deforestation rates due to the GLTC project. A complete analysis of these four policy scenarios would help Guyana understand the complete range of funding options under the UNFCCC associated with REDD. In the absence of this analysis, it is clear that negotiating reference scenarios that recognize future deforestation pathways is to Guyana’s benefit as is gaining the most number of additional payments under any forest conservation mechanism. However, the suggested analysis would let Guyana assess any trade-offs that may be required between forest conservation payments and generating higher volumes of emission reductions, as maximizing both payment options would likely be difficult. Furthermore, detailed studies on the opportunity costs for the nation and forest biomass studies are needed to improve upon this cursory overview, combined with new research into the sequestration potential of standing forests, SFM, and carbon stock enhancement programs for REDD-plus.

42
4.1 GENERAL RECOMMENDATIONS
The following list of recommendations has originated from the detailed studies conducted, but are grouped into political/legislative, socio-economic/cultural, technical/intellectual and ecological categories. A number of these recommendations are already being addressed, and many will require further discussion with the GFC, and therefore do not necessarily represent a consensus position that has been arrived at. The list is as follows:
Policy/legislative.
• An effective SEAP for the GLTC should be carefully developed and implemented. This SEAP may be seen as one of the early REDD projects developed under a REDD Framework, where the costs of implementation may be covered by REDD revenues.
• Natural resource management including the present concessionaire granting system should be strengthen and addressed. In particular, concessionaires along the GLTC should be invited to participate in the preparation and implementation of the proposed SEAP, given the potential impact of their operations on deforestation and forest degradation.
• Forest resource management may be strengthened and improved to address carbon stocking through consideration of a longer harvesting cycle greater than 60 years. This approach may also be considered as a REDD project, where REDD revenues may be used to support refinement in forest resource and overall natural resources management.
• A revision of the existing institutional framework should be carried out to allow for improved coordination in land lease arrangements for the extraction and/or utilization of natural resources under the jurisdiction of State Sector Agencies such as the GFC, GGMC and GLSC. This type of coordination should be facilitated by the REDD Secretariat or the GOG proposed Low Carbon Project Management Office in order to ensure that the resulting reforms support Low Carbon Development.
• A number of elements of the mining law need to be revised to improve environmental management within the context of REDD. For instance, in order to ensure that some concessions go unregulated because of size, limits should be placed on the quantity of adjacent small-scale parcels that miners may claim to avoid cumulative significant impacts. Additionally, provision could be made in the mining laws for the cancellation of leases due to environmental damage. Other recommendations for a revised mining law include the enforcing the requirement for environmental bonds and demanding compliance with environmental permits.
• Within the context of an effective REDD Framework implementation, there will be need to provide additional authority to the responsible REDD implementation agency (the GFC). This is especially the case where the GFC may observe illegal mining activities within its monitoring and enforcement programme in forests.
• Conflicts and overlaps on “exclusive rights” to natural resources in existing legislation should be reviewed and a process for resolution should be developed. This has already been highlighted in some of the feedback obtained from the LCDS consultations held recently
• The participation of some key government and non-governmental agencies in the REDD policy development appears to be insufficient. There should be greater participation and

43
involvement of institutions such as the Ministry of Finance (which should have a formal position within NCC), Ministry of Foreign Affairs, GO-INVEST, and the Private Sector Commission in the REDD Secretariat.
• As clearly articulated in the Low Carbon Development Strategy which enshrines the principles of engagement that meet applicable international and domestic standards, including free, prior and informed consent, the engagement of Amerindians and other forest-dependent peoples should follow clearly established procedures regarding how indigenous rights issues in the national REDD processes. This should be particularly applied to those forest-dependent people and Amerindian communities situated along the GLTC. The implementation of these procedures should be supported by, for example, the provision of technical and legal support to the Village Councils so that they have a comprehensive understanding of REDD.
• Efforts need to be made to ensure that the benefits of REDD are equitably distributed to the appropriate stakeholders/beneficiaries. Achieving this will require the direct participation in REDD by the local stakeholders.
• The presence of yet to be completed land use policy process allows for gaps in terms of planning with a landscape focus and this situation inhibits proper national zoning and land allocation. Hence there is need for the development and implementation of a national land-use plan using a participatory process that is a central component of the national development plan. One result of this will be the optimization of revenue flows and other intangible economic and social benefits from REDD revenues, and the other traditional sources of benefits such as timber, minerals, agriculture, and tourism.
• Because protected areas are premium carbon reserves there is need for accelerated efforts towards the enactment and implementation of a well designed National Protected Areas System (NPAS) that will not only provide support to REDD framework, but will also provide support to Amerindian communities that have expressed an interest in community-based conservation projects.
• In addition to the NPAS there is need to complete reviews and finalization of other outstanding legislations and policies such as NCSAP implementation plan, the Roads Act, the Agriculture Policy within the context of a Naitonal REDD Framework and the draft Low Carbon Development Strategy.
• REDD as a new concept to Guyana is expected to bring along many disputes and grievances among stakeholders. Hence there is need to ensure that the current policies/legislations on natural resources are reviewed and refined in a fair and transparent manner. This process has commenced with the public dissemination and consultations being undertaken for the LCDS.
• Though Guyana has so far been very active and vocal at UNFCC meetings the country will have to remain aggressive in future negotiations if it wants an international agreement on REDD to be in its favour and interests.
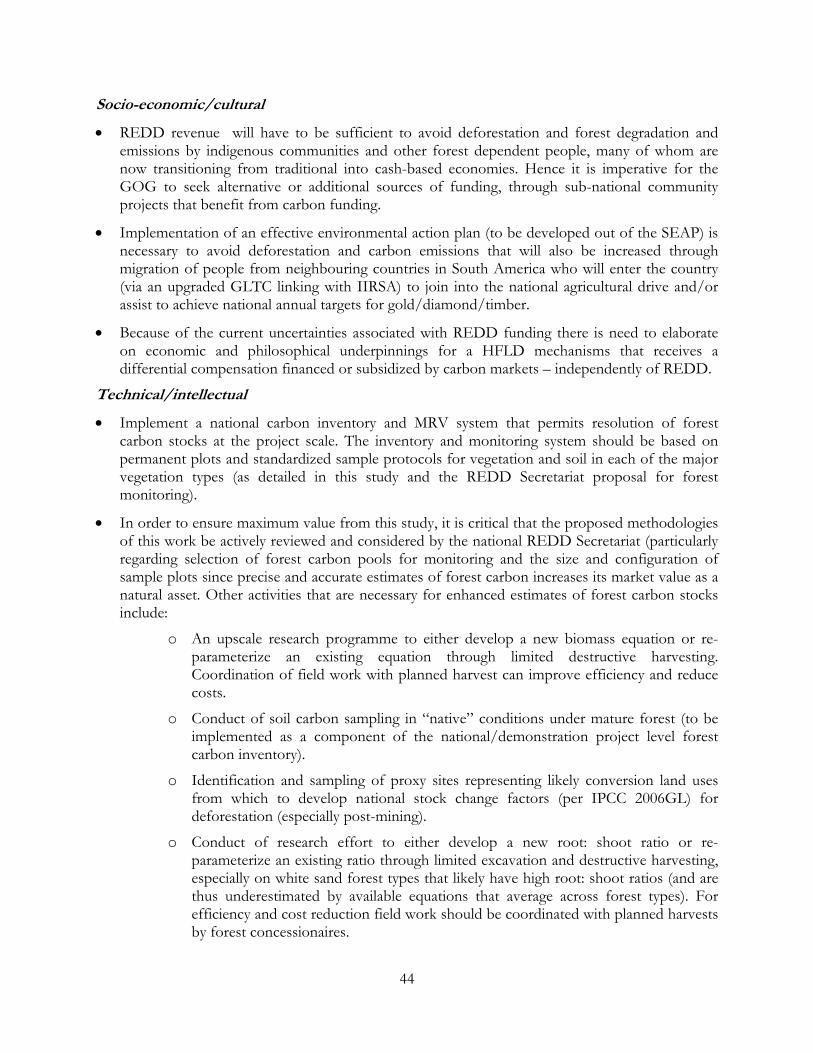
44
Socio-economic/cultural
• REDD revenue will have to be sufficient to avoid deforestation and forest degradation and emissions by indigenous communities and other forest dependent people, many of whom are now transitioning from traditional into cash-based economies. Hence it is imperative for the GOG to seek alternative or additional sources of funding, through sub-national community projects that benefit from carbon funding.
• Implementation of an effective environmental action plan (to be developed out of the SEAP) is necessary to avoid deforestation and carbon emissions that will also be increased through migration of people from neighbouring countries in South America who will enter the country (via an upgraded GLTC linking with IIRSA) to join into the national agricultural drive and/or assist to achieve national annual targets for gold/diamond/timber.
• Because of the current uncertainties associated with REDD funding there is need to elaborate on economic and philosophical underpinnings for a HFLD mechanisms that receives a differential compensation financed or subsidized by carbon markets – independently of REDD.
Technical/intellectual
• Implement a national carbon inventory and MRV system that permits resolution of forest carbon stocks at the project scale. The inventory and monitoring system should be based on permanent plots and standardized sample protocols for vegetation and soil in each of the major vegetation types (as detailed in this study and the REDD Secretariat proposal for forest monitoring).
• In order to ensure maximum value from this study, it is critical that the proposed methodologies of this work be actively reviewed and considered by the national REDD Secretariat (particularly regarding selection of forest carbon pools for monitoring and the size and configuration of sample plots since precise and accurate estimates of forest carbon increases its market value as a natural asset. Other activities that are necessary for enhanced estimates of forest carbon stocks include:
o An upscale research programme to either develop a new biomass equation or re-parameterize an existing equation through limited destructive harvesting. Coordination of field work with planned harvest can improve efficiency and reduce costs.
o Conduct of soil carbon sampling in “native” conditions under mature forest (to be implemented as a component of the national/demonstration project level forest carbon inventory).
o Identification and sampling of proxy sites representing likely conversion land uses from which to develop national stock change factors (per IPCC 2006GL) for deforestation (especially post-mining).
o Conduct of research effort to either develop a new root: shoot ratio or re-parameterize an existing ratio through limited excavation and destructive harvesting, especially on white sand forest types that likely have high root: shoot ratios (and are thus underestimated by available equations that average across forest types). For efficiency and cost reduction field work should be coordinated with planned harvests by forest concessionaires.

45
o Conduct of research effort to sample and determine dead wood density for decomposition classes employed in the forest carbon inventory.
o Conduct of research effort to identify and measure representative sites to quantify mean biomass stocks on post bauxite and gold mining sites, shifting agriculture, rice, banana plantations, sugar cane, plantation forests, and any other important conversion land use classes.
• In order for Guyana to demonstrate that it has reached and maintained a reduced level of emissions there will be need for the country to quantity and regularly monitor deforestation and drivers of deforestation (including logging and mining activities) and carbon emissions. This should be done using both remote sensing technologies and field observations. The monitoring requirement will present opportunities for the country to acquire and/or develop new and relevant technologies and as well as train personnel for its use and interpretation
• Since ground measurement can be time consuming and costly, and high resolution cloud-free optical imagery is expensive and difficult to obtain, the use of RADAR Technology should be explored. It is also recommended that this technology be used for monitoring forest cover and forest carbon density. The use of RADAR Technology will significantly reduce the costs of REDD monitoring.
• In order to assist in use of technological innovation for forest monitoring, it will be helpful to consider development of a partnership with international consortium testing new technologies such as RADAR Technology.
• A comprehensive needs assessment should be undertaken at the national scale, and capacity building programmes should be implemented and expanded for the REDD Secretariat and other state agencies that would be involved in REDD. This includes government agencies involved in policy development, monitoring, and enforcement, Amerindian Communities and Village Councils, and NGOs. In order to build sustainability these programmes should be conducted in close collaboration with the training institutions in Guyana such as the University of Guyana.
• The University of Guyana and other institutions including NGOs should become more involved in the development of training courses on REDD and integrated natural resource management and in the establishment and maintenance of data bases.
• Consideration should be given for the establishment of a dedicated management unit that will ensure long-term oversight of national forest carbon inventory and REDD monitoring.
• A database for collecting, analyzing and archiving measurement records from national/demonstration project level forest carbon inventories should be considered as a critical and important part of the design of a National REDD Framework.
• The pro’s and con’s of adopting potential definitions for forest and forest degradation under REDD in Guyana should be considered, since these could potentially differ from the national definition of forest in the Forest Act. It is imperative that a definition of forest for the purposes of the CDM should also be determined if Guyana wants to engage in CDM A/R projects.
• Given the presently available technology and the growing interest in commercial production and export of non-traditional crops such as soya bean, the agricultural capacity of Guyana’s soils

46
should be re-assessed, to gain a better understanding of the suitability and productivity of the various soil types.
Ecological
• Guyana’s historical rates of deforestation are too low to maximize compensation under the proposed REDD framework if historic reference levels are used. There is therefore urgent need to continue to aggressively participate and lobby at UNFCC negotiations to ensure reference scenarios are able take in account future rates of deforestation and/or compensation is made available for forest conservation activities. It is also critical to find partnerships and build a network of consensus around this matter.

47
ANN X 1 E
METHODOLOGY DEVELOPMENT RECOMMENDATIONS
MONITORING OF FOREST CARBON ALONG THE GEORGETOWN-LETHEM TRANSPORT CORRIDOR
INTRODUCTION
The Georgetown Lethem Transport Corridor (GLTC) crosses a vast forested region of Guyana’s interior. Planned improvements to the GLTC will benefit commerce and serve as a conduit for immigration both from within and outside Guyana, increasing access to the previously remote forests traversed by the highway. Application of a REDD framework will require rigorous forest carbon measurement and monitoring to track and report REDD performance within an eventual incentives-based mechanism. The reader is directed to the technical paper, Monitoring Of Forest Carbon Along The Georgetown-Lethem Transport Corridor, which contains the full plan.
DESCRIPTION OF MEASUREMENT AND MONITORING PLAN
Detailed protocols have been developed for sampling and measuring forest carbon pools in the field, for analyzing field data to produce estimates of forest carbon, and for ensuring quality results and sufficient documentation to allow for third party auditing. A forest carbon measurement and monitoring plan has been prepared using stratified, random sampling with nested permanent plots, sufficient to produce estimates of forest carbon with a precision target of +/-10% of the mean with 90% or 95% confidence. Estimates of forest carbon produced using these guidelines will meet the highest (Tier 3) standards set by the International Panel on Climate Change. UNFCCC definitions of deforestation, degradation and forests were taken from the Guyana 2008 Forest Bill. The monitoring objective and area of interest is first stated. Monitoring is focused on forest carbon pools accounting for the most significant emissions from deforestation and degradation, namely above- and below-ground live tree biomass, standing and lying deadwood, and soil carbon. Minor pools including understory vegetation and leaf litter are unlikely to qualify as key categories per IPCC GL 2006 and are not cost-effective to measure, and are conservatively excluded. A road impact buffer is designated 50 km on either side of the GLTC (100 km width), where change is expected to occur, reflecting the focus of REDD accounting on emissions and changes in stocks. Forest vegetation classes and their respective areas within the road impact buffer zone were identified using the 2001 National Vegetation Map of Guyana.

48
Available recent (1990) forest measurement datasets from Guyana were then compiled and analyzed to assess trends in carbon stocks across forest types. Sources of raw tree measurement data analyzed included the following:
• Data from prism sampling from 1990-93 Interim Forestry Project (IFP) (national coverage)
• Plot data from 2003 management level inventory at Iwokrama • Plot data from 2007/8 permanent sample plots (PSP’s) at Iwokrama
Effort were made to use the most recently-collected data available, and focused on datasets post-dating those used by ter Steege to produce earlier estimates using FIDS and Great Falls Inventory data collected in the 1970’s (ter Steege 1998). To our knowledge no new work at a comparable scale has been produced since the referenced report, and we set out to produce new information relevant to present day emissions accounting. In total, data were compiled and analyzed from 9,407 measurement plots and 58,091 trees. The results of the analysis were used to optimize the design of the forest carbon monitoring plan.
KEY ELEMENTS TO THE MONITORING PLAN DESIGN
Key elements of the monitoring plan are summarized below: • Approach: stratified, random sampling with permanent plots • Pools of interest: above and belowground live tree biomass, standing and lying dead
wood, mineral soil carbon • precision target: +/-10% of the mean with 95% confidence • Plot size and configuration: nested plots, adapted from Iwokrama 2003 Management
Level Inventory, with a circular plot of 8 m radius within which all stems > 10 cm dbh are measured and a circular plot of 18 m radius within which all stems > 40 cm dbh are measured (~0.1 ha)
• Sampling intensity and plot allocation: 107 or 154 sample plots (to produce estimates with precision of +/-10% of the mean with 90% and 95% confidence, respectively) with optimum allocation among 5 forest classes (detailed in Summary table below)

49
SUMMARY TABLE. AREA OF FOREST VEGETATION CLASSES WITHIN THE GEORGETOWN-LETHEM ROAD POTENTIAL IMPACT CORRIDOR AND
NUMBER OF SAMPLE PLOTS ALLOCATED IN THE FOREST CARBON MEASUREMENT AND MONITORING PLAN
GFC #
Forest vegetation class Area (ha) Preliminary estimate mean t C/ha (above and belowground live tree biomass)
Number of sample plots (95% confidence**)
Number of sample plots (90% confidence***)
1 Mixed Rain Forest 2,058,363 212 88 60 2 Vegetation on White
Sand 928,201 189 36 25
3 Swamp Forest 354,321 197 14 10 4 Mangrove 237 84 1 1 7 Pakaraimas
Montane/Submontane Forest
347,636 212 15 11
Total 3,688,758 205* 154 107 *weighted average **to achieve precision of +/-10% of the mean with 95% confidence (employing 0.1 ha sample plots) **to achieve precision of +/-10% of the mean with 90% confidence (employing 0.1 ha sample plots Based on resource needs of analogous forest inventory efforts recently conducted in Guyana, implementation of the field measurement component (not including analysis and report preparation) of the forest carbon measurement and monitoring plan within the GLTC road impact corridor is estimated to take ~2 months to complete and cost < US$10,000; difference in cost between the two sampling intensities is considered minimal due to the importance of fixed costs. The monitoring plan design provides detailed protocols guiding data collection in the field, data analysis and quality control. Estimated field measurement costs and a literature review of biomass carbon estimates for forest and conversion land-use types are also presented. The measurement and monitoring plan is designed to meet the anticipated rigorous expectations of an eventual formal REDD accounting mechanism. As such a mechanism is likely to operate at multiple scales (i.e. project scale and national), and it will be important to ensure that there is synergy in the proposed methodologies of this plan and that of the national REDD Secretariat of Guyana.

50
ALLOCATION OF SAMPLE PLOTS FOR APPLICATION OF REDD TO THE GEORGETOWN LETHEM TRANSPORT CORR DOR I

51
ANNEX 2
LIST OF ACRONYMS
AAU Assigned Amount Unit
AFOLU Agriculture, Forestry and Other Land-use
ALOS Advanced Land Observing Satellite A/R Afforestation/reforestation
ASL Above Sea Level
AWG-LCA Ad Hoc Working Group on Long-term Cooperative Action under the Convention
BAU Business as Usual
BHI Bina Hill Institute
CC Climate Change
CDM Clean Development Mechanism of the Kyoto Protocol
CEMCO Caribbean Engineering and Management Consultants Inc
CHW Community Health Workers
CI Conservation International
CIG Conservation International Guyana
CIDA Canadian International Development Agency
CMP Conference of the Parties serving as the Meeting of the Parties (to the Kyoto Protocol)
COP Conference of the Parties (to the UNFCCC)
CV Coefficient of Variation
DBH Diameter at Breast Height (measured at 1.3 m height)
DTL Demerara Timbers Limited
EFDB Emission Factor Data Base
FCPF Forest Carbon Partnership Facility
FMP Fisheries Management Plan
DTL Demerara Timbers Limited
EFDB Emission factor database
EPA Environmental Protection Agency
EU ETS European Union Emissions Trading Scheme
FAO Food and Agriculture Organization of the United Nations
FCPF Forest Carbon Partnership Facility
FIDS Forest Industries Development Survey

52
FIP Forest Investment Program
FRIU Forest Resources Information Unit
GDP Gross Domestic Product
GFC Guyana Forestry Commission
GFI Great Falls Inventory
GGMC Guyana Geology and Mines Commission
GIS Geographic Information System
GLSC Guyana Lands and Surveys Commission
GLTC Georgetown Lethem Transport Corridor
GoG Government of Guyana
GSECI Ground Structures Engineering Consultants Inc
GTA Guyana Tourism Authority
GuySuCo Guyana Sugar Cooperation
HIES Household Income and Expenditure Survey
HFCLD High Forest Cover Low Deforestation
IDB Inter-American Development Bank
IFP Interim Forestry Project
IISRA Initiative for Integration of Regional Infrastructure in South America
IPCC Intergovernmental Panel on Climate Change
IUCN International Union for Conservation of Nature
Iwokrama Iwokrama International Centre for Rainforest Conservation and Development
IISRA Initiative for Integration of Regional Infrastructure in South America
JAX Japanese Space Agency
LOE Level of effort
LULULCF Landuse, Landuse Change and Forestry
MoA Ministry of Agriculture
MOAA Ministry of Amerindian Affairs
MoF Ministry of Finance
MLI Management level inventory
MMA Mahaica Mahaicony and Abary
MMC Mekdeci Machinery and Construction Company
MRU Makushi Research Unit
MRV Monitoring, Reporting, and Verification

53
MTIC Ministry of Tourism, Industry and Commerce
NCS National Competitiveness Strategy
NCSAP National Capacity Self Assessment Project
NDCs Neighbourhood Democratic Councils
NDS National Development Strategy
NFP National Forest Plan
NGO Non-governmental Organization
NLUP National Land Use Plan
NMMAP National Mangrove Management Action Plan
NRCDT North Rupununi Credit and Development Trust
NRDDB North Rupununi District Development Board
NRMMNR Natural Resource Management and Monitoring in the North Rupununi
NTSP National Transport Sector Policy
OP Office of the President
P&HC Population and Housing Census
PALSAR Phased Array L-band Synthetic Aperture Radar PRS Poverty Reduction Strategy (World Bank)
PRSP Poverty Reduction Strategy Paper
PSP Permanent sample plot
RDCs Regional Democratic Councils
REDD Reduced Emissions from Avoided Deforestation
SBSTA Subsidiary Body for Scientific and Technical Advice
SEAP Social and Environmental Action Plan
SLM Sustainable Land Management
SBSTA Subsidiary Body for Scientific and Technical Advice
tCER temporary Certified Emission Reduction
THAG Tourism and Hospitality Association of Guyana
ToR Terms of Reference
UNDP United Nations Development Programme
WB World Bank
UNFCCC United Nations Framework Convention on Climate Change
VCS Voluntary Carbon Standard
WWF World Wildlife Fund

ANNEX 3
NATIONAL REDD FINANCIAL ANALYSIS
Emissions Reductions and REDD Payments under Effective REDD scenario
Source: modified from Tech Paper B
National Level Emissions
BAU Emissions Tons CO2 Effective REDD
Difference (Emissions Reductions) Annual Value
Year Annual Cum Annual Annual Cum $2/ton CO2 $5/ton $10/ton
2010 141,150,465 141,150,465 64,093,248 77,057,217
77,057,217 $ - $
- $ -
2011 143,604,338 284,754,803 64,004,538 79,599,800 156,657,017 $ - $
- $ -
2012 151,286,015 436,040,817 65,110,757 86,175,258 242,832,275 $ - $
- $ -
2013 169,423,301 605,464,118 68,606,835 100,816,466 343,648,741 $ 201,632,932 $
504,082,330 $
1,008,164,660
2014 177,104,978 782,569,096 69,713,054 107,391,924 451,040,665 $ 214,783,848 $
536,959,619 $
1,073,919,238
2015 174,331,046 956,900,142 68,429,415 105,901,631 556,942,296 $ 211,803,262 $
529,508,155 $
1,059,016,311
2016 171,557,060 1,128,457,201 67,145,714 104,411,346 661,353,642 $ 208,822,692 $
522,056,731 $
1,044,113,461
2017 168,783,128 1,297,240,329 65,862,074 102,921,053 764,274,696 $ 205,842,107 $
514,605,267 $
1,029,210,534
2018 166,009,196 1,463,249,525 64,578,435 101,430,761 865,705,456 $ 202,861,521 $
507,153,804 $
1,014,307,607
2019 163,235,264 1,626,484,789 63,294,796 99,940,468 965,645,924 $ 199,880,936 $
499,702,340 $
999,404,680
2020 160,461,332 1,786,946,122 62,011,157 98,450,175 1,064,096,100 $ 196,900,351 $
492,250,877 $
984,501,753 2021 157,687,400 1,944,633,522 60,727,518 96,959,883 1,161,055,982 $ 193,919,765 $ $
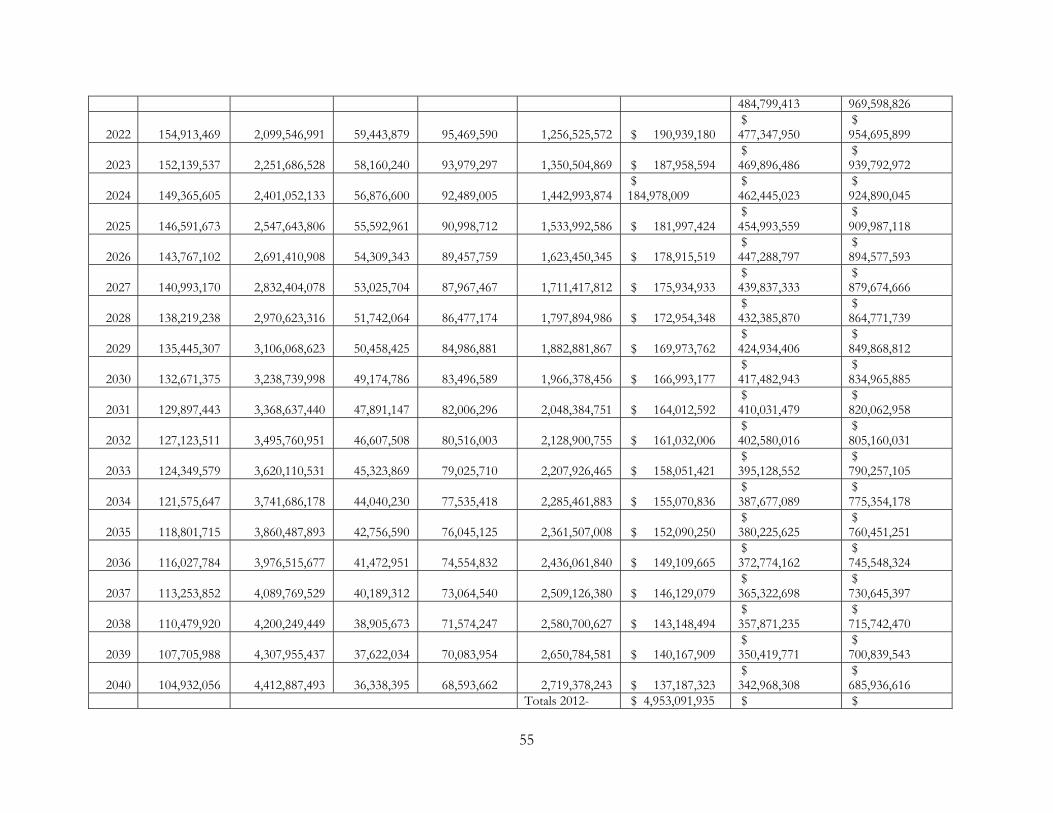
55
484,799,413 969,598,826
2022 154,913,469 2,099,546,991 59,443,879 95,469,590 1,256,525,572 $ 190,939,180 $
477,347,950 $
954,695,899
2023 152,139,537 2,251,686,528 58,160,240 93,979,297 1,350,504,869 $ 187,958,594 $
469,896,486 $
939,792,972
2024 149,365,605 2,401,052,133 56,876,600 92,489,005 1,442,993,874 $ 184,978,009
$ 462,445,023
$ 924,890,045
2025 146,591,673 2,547,643,806 55,592,961 90,998,712 1,533,992,586 $ 181,997,424 $
454,993,559 $
909,987,118
2026 143,767,102 2,691,410,908 54,309,343 89,457,759 1,623,450,345 $ 178,915,519 $
447,288,797 $
894,577,593
2027 140,993,170 2,832,404,078 53,025,704 87,967,467 1,711,417,812 $ 175,934,933 $
439,837,333 $
879,674,666
2028 138,219,238 2,970,623,316 51,742,064 86,477,174 1,797,894,986 $ 172,954,348 $
432,385,870 $
864,771,739
2029 135,445,307 3,106,068,623 50,458,425 84,986,881 1,882,881,867 $ 169,973,762 $
424,934,406 $
849,868,812
2030 132,671,375 3,238,739,998 49,174,786 83,496,589 1,966,378,456 $ 166,993,177 $
417,482,943 $
834,965,885
2031 129,897,443 3,368,637,440 47,891,147 82,006,296 2,048,384,751 $ 164,012,592 $
410,031,479 $
820,062,958
2032 127,123,511 3,495,760,951 46,607,508 80,516,003 2,128,900,755 $ 161,032,006 $
402,580,016 $
805,160,031
2033 124,349,579 3,620,110,531 45,323,869 79,025,710 2,207,926,465 $ 158,051,421 $
395,128,552 $
790,257,105
2034 121,575,647 3,741,686,178 44,040,230 77,535,418 2,285,461,883 $ 155,070,836 $
387,677,089 $
775,354,178
2035 118,801,715 3,860,487,893 42,756,590 76,045,125 2,361,507,008 $ 152,090,250 $
380,225,625 $
760,451,251
2036 116,027,784 3,976,515,677 41,472,951 74,554,832 2,436,061,840 $ 149,109,665 $
372,774,162 $
745,548,324
2037 113,253,852 4,089,769,529 40,189,312 73,064,540 2,509,126,380 $ 146,129,079 $
365,322,698 $
730,645,397
2038 110,479,920 4,200,249,449 38,905,673 71,574,247 2,580,700,627 $ 143,148,494 $
357,871,235 $
715,742,470
2039 107,705,988 4,307,955,437 37,622,034 70,083,954 2,650,784,581 $ 140,167,909 $
350,419,771 $
700,839,543
2040 104,932,056 4,412,887,493 36,338,395 68,593,662 2,719,378,243 $ 137,187,323 $
342,968,308 $
685,936,616 Totals 2012- $ 4,953,091,935 $ $

56
2040 12,382,729,837 24,765,459,675 NPV @10% $1,346,530,690 $3,366,326,726 $6,732,653,452
Mean Annual Rev $ 159,777,159
$ 399,442,898
$ 798,885,796

ANNEX 4
BIBLIOGRAPHY
AEK-Gibb. 2000. Study for Upgrading and Competition of the Guyana Brazil Road (Project no 7.ACP.GUA.13). Ministry of Finance, Georgetown
Angelsen A., 2008. “How do we set the reference levels for REDD payments?” in Moving ahead with REDD: Issues, Options and Implications, Angelsen A. (ed), CIFOR, Indonesia.
Avery, T.E. and H.E. Burkhart. 1994. Forest Measurements. Fourth Edition. McGraw Hill, Boston, Massachusetts, USA. 408 pp.
Baker, T.R., Phillips, O.L., Malhi, Y., Almeida, S., Arroyo, L., Di Fiore, A., Killeen, T., Laurance, S.G., Laurance, W.F., Lewis, S.L., Lloyd, J., Monteagudo, A., Neill, D.A., Patiño, S., Pitman, N.C.A., Silva, N., Vásquez Martínez, R. (2004) Variation in Wood Density Determines Spatial Patterns in Amazonian Forest Biomass. Global Change Biology 10:545-562.
Bernard, Deryck M., .1999. A New Geography of Guyana, London.
Bourne, G (pers. comm.) Brouwer, L. 1996. Nutrient cycling in pristine and logged
tropical rain forest: a study in Guyana. PhD Thesis, Utrecht University. Tropenbos-Guyana Series 1, Georgetown, Guyana.
Brown D., Seymour F., and Peskett L., 2008. How do we achieve REDD co-benefits and avoid doing harm? in Moving ahead with REDD: Issues, Options and Implications, Angelsen A. (ed), CIFOR, Indonesia, 2008 at 115.
Brown, S. 1997. Estimating Biomass and Biomass Change of Tropical Forests: A Primer. FAO Forestry Paper 134, Rome, Italy
Brown, S. and M. Delaney. 2000. Preliminary Carbon-Offset Report for the Guaraqueçaba Climate Action Project. Winrock International. Available from the Nature Conservancy.
Bynoe, M. 2008. The Development of a National Agriculture Sector Adaptation Strategy to Address Climate Change in Guyana: Appendix 1: Economic Review of Guyana’s Agricultural Sector To Climate Change. (Draft Report Prepared for the Mainstreaming Adaptation for Climate Change (MACC) Project). MoA. Georgetown.
Cairns, M. A., S. Brown, E. H. Helmer, and G. A. Baumgardner. 1997. Root Biomass Allocation in the World’s Upland Forests. Oecologia 111, 1-11.
Central Housing and Planning Authority, 2005. Lethem Development Plan: Planning Scheme 2005-2010, Georgetown.
Chase, J. 2008. Carbon storage in the white and brown sands of central Guyana. Project submitted for BSc in Environmental Studies, University of Guyana.
Chave, J., Olivier, J., Bongers, F.J.J.M., Chatelet, P., Forget, P.M., Meer, P.J. van der, Norden, N., Riera, B. and P. Charles-Dominique. 2008. Above-ground biomass and productivity in a rain forest of eastern South America. Journal of Tropical Ecology 24:355 - 366.
Comiskey, J.A., Aymard, G. and F. Dallmeier. 1994. Structure and composition of lowland mixed forest in the Kwakwani region of Guyana. Biottonia 10:13-28.
Constitution of the Cooperative Republic of Guyana, Article 142(1)(2)
Darwin Initiative. 2006. State of the North Rupununi Wetlands Report. Darwin Initiative Guyana Partnership
Davis H. 2008. Head of the Research Department GuySuCo: Personal Communication.
Decision 10/CP.7 Funding under the Kyoto Protocol para 2 and 3, for an example of how the Adaptation Fund was created and financed under the Clean Development Mechanism.
Delaney, M., Brown, S. and M. Powell. 2000. 1999 Carbon-Offset Report for the Noel Kempff Climate Action Project, Bolivia. The Nature Conservancy.
Eliash, J. 2008. Climate Change: Financing Global Forests, The Eliash Review, United Kingdom.
Engstrom, M. and Lim, B. 2008. Checklist of mammals of Guyana. Online www.mnh.si.edu/biodiversity/bdg/guymammals.html
Ernst, R. 2004. Herpetological Diversity of the Mabura Hill Forest Reserve: with recommendations for the Guyana Protected Area System Strategy. Guyana Forestry Commission Planning and Research Division.
Estrada M., Corbera E., and Brown K., 2007 Reducing Greenhouse Gas Emissions From Deforestation In Developing Countries: Revisiting The Assumptions, Tyndall Centre for Climate Change Research, Working Paper 115.
European Union .2005. Guyana Transport Sector Study, Working Paper #4, Georgetown
Fanshawe, D.B. 1952. The vegetation of British Guiana: a preliminary review. Institute Paper 29. Imperial Forest Institute, University of Oxford, Oxford, UK.
FAO 2005. Global Forest Resources Assessment 2005. Guyana Country Report 2005. Rome. 36 pp.
FAO, 2005. Global Forest Resources Assessment. Fearnside, P. M. 2005a. Deforestation in Brazilian
Amazonia: History, Rates, and Consequences. Conservation Biology 19, 680-688.
Fonseca G.A. B. d, Rodriguez C. M. , Midgley G, Busch J, Hannah L, et al. 2007. No forest left behind, PLoS Biol 5(8): e216. doi:10.1371/journal.pbio.0050216
Food and Agriculture Organization (FAO), 2006. Global Forest Resources Assessment 2005: Progress towards

58
Sustainable Forest Management, Forestry Paper 147 Rome.
Freese, F. 1962. Elementary Forest Sampling. USDA Handbook 232. GPO Washington, DC. 91 pp.
Freestone D., and Streck C., 2005. Legal Aspects of Implementing the Kyoto Protocol, Making Kyoto Work, (eds) Oxford.
Funk, V.; T. Hollowell, P. Berry, C. Kelloff and S.N. Alexander. 2007. Checklist of the plants of the Guiana Shield. Contributions from the United States National Herbarium, Vol. 55
Grieg-Gran, M., 2006. The Cost of Avoiding Deforestation: Report prepared for the Stern Review of the Economics of Climate Change. London: International Institute for Environment and Development.
Ground Structures Engineering Consultants Inc. 2008. Groundstar Resources Petroleum Exploration Program North Rupununi, Guyana: Environmental and Social Management Plan
Guyana Amerindian Act 2006 Guyana Bureau of Statistics. 2007. 2002 Population and
Housing Census, National Report. Georgetown Guyana Central Housing & Planning Authority
(CH&PA). 2005. Lethem Development Plan: Planning Scheme 2005-2010.Georgetown.
Guyana Draft Fisheries Management Plan 2006. Guyana Environmental Protection Act 2006 Guyana Forest Bill 2009 Guyana Forestry Commission (2008) Forestry in Guyana:
2007, Georgetown Guyana Forestry Commission Act, 1979) Guyana Forestry Commission Quick Assessment Paper,
Deforestation and Forest Degradation in Guyana, 2009.
Guyana Forestry Commission. 2001. Vegetation of Guyana map. Forest Resource Information Unit.
Guyana Georgetown-Lethem Road, IDB Pre-Feasibility Study. 2008
Guyana Initial National Communication (2002) at 3 Guyana Mining Act, 1989 Guyana National Development Strategy 2001 – 2010,
Overview, at ii Guyana National Parks Commission Act, 1977 Guyana R-Plan 2009. Submission to the World Bank’s
Forest Carbon Partnership Facility (FCPF), p.66 Guyana R-Plan Component 4: REDD Implementation
Framework Guyana The Iwokrama International Centre for Rain
Forest Conservation and Development Act, Cap 20:04, L.R.O. 3/1998]
Guyana The State Lands Act 1953 Hammond, D. 2005. Biophysical Features of the Guiana
Shield. In: “Tropical Forests of the Guiana Shield: ancient forest of the modern world” edited by D.Hammond
Hammond, D. and Forget, P. M. 2005. Rainforest Vertebrates and Plant Food Diversity in the Guianan Shield. In: “Tropical Forests of the Guiana Shield: ancient forest of the modern world” edited by D.Hammond.
Hammond, D. S., editor. 2005. Tropical forests of the Guiana shield: ancient forests in a modern world. CABI International, Wallington, UK.
Hammond, D.S., Gond, V., de Thoisy, B., Forget, P-M and B.P.E. DeDijn. 2007. Causes and consequences of a tropical forest gold rush in the Guiana Shield, South America. Ambio 36(8):661-670.
Harmon, M. E. and J. Sexton. 1996. Guidelines for Measurements of Woody Detritus in Forest Ecosystems. US LTER Publication No. 20. US LTER Network Office, University of Washington, Seattle, WA, USA.
Hoare et al 2008. Estimating the Cost of Building Capacity in Rainforest Nations to Allow them to Participate in a Global REDD Mechanism. produced for the Eliasch Review by Chatham House and ProForest with input from the Overseas Development Institute and EcoSecurities.
Hollowell, T. and Reynolds, R.P. 2005. Checklist of the Terrestrial Vertebrates of the Guiana Shield. Bulletin of the Biological Society of Washington. No. 13.
Houghton, R. A. 2005. Tropical Deforestation as a Source of Greenhouse Gas Emissions, in Tropical Deforestation and Climate Change, edited by P. Moutinho and S. Schwartzman. Amazon Institute for Environmental Research, Brazil, and Environmental Defense, Washington D.C.
http://glcf.umiacs.umd.edu/aboutUs/ http://opnew.op.gov.gy 2009. – News Bulletin
Compensation for forests can bring hundreds of millions for Development Projects.
http://unfccc.int/methods_and_science/lulucf/items/4123.php
Inter-American Development Bank (2008) Support for a Second Low Income Settlement Program: Plan of Operations, Washington, D.C.
Inter-American Development Bank, 2002 Country Strategy with Guyana.
Inter-American Development Bank, Country Strategy with Guyana, 2008 – 2012
Inter-American Institute for Cooperation in Agriculture (IICA) (1991) Guyana Agricultural Sector Assessment, Georgetown
International Human Rights Clinic, Human Rights Program, Harvard Law School, Cambridge, Massachusetts, March 2007 - All That Glitters: Gold Mining in Guyana: The Failure of Government Oversight and the Human Rights of Amerindian Communities.
International Offset Credits; Sec. 754 (d)(6) Requirements for International Deforestation Reduction Program

59
IPCC , 2007. Summary for Policymakers, in Climate Change 2007: The Physical Science Basis, edited by S. Solomon et al.
IPCC 2003. Supplementary Methods and Good Practice Guidance Arising from the Kyoto Protocol: Methods for Estimation, Measurement, Monitoring and Reporting of Land-use, Land-use Change and Forestry (LULUCF) Activities under Article 3.3 and 3.4 Chapter 4.
IPCC 2006 Guidelines for National Greenhouse Gas Inventories. Chapter 4 AFOLU (Agriculture, Forestry and Other Land-use).
IPCC, 2007: Climate Change 2007: Mitigation. Contribution of Working Group III to the Fourth Assessment Report of the Intergovernmental Panel on Climate Change edited by B. Metz, O.R. Davidson, P.R. Bosch, R. Dave, L.A. Meyer, (Cambridge University Press, Cambridge, United Kingdom and New York, NY, USA.).
IUCN 2008. Redlist of Threatened Species. Iwokrama Centre for Rainforest Research and
Conservation. 2002. Annual Report 2002. Iwokrama International Centre for Rainforest
Conservation and Development, 2007. Procedures for Establishing Permanent Sample Plots for Forest Monitoring in the Iwokrama Forest. Georgetown: Iwokrama.
Johnston, M. and M. Gillman. 1995. Tree population studies I. Low diversity forests, Guyana. I. Floristic composition and stand structure. Biodiversity and Conservation 4: 339-362.
Kaufmann D., Kraay A., Mastruzzi M., 2008. Governance Matters VII: Aggregate and Individual Governance Indicators 1996-2007, The World Bank Development Research Group Macroeconomics and Growth Team & World Bank Institute Global Governance Program, Policy Research Working Paper 4654.
Khan S. M. 2006. The National Capacity Self Assessment Project (NCSAP), Stock-Taking and Thematic Assessment, United Nations Framework Convention on Climate Change, (prepared for the Guyana EPA)
Killeen T.J. 2007. A Perfect Storm in the Amazon Wilderness, Development and Conservation in the Context of the Initiative for Integration of the Regional Infrastructure of South America (IIRSA), Applications in Applied Biodiversity Science, Center for Applied Biodiversity Science, Washing ton, DC
Killeen, T.J., Guerra, A.., Calderon, V., Calzada M., Correa, L., Soria, L., Quezada, B, Steininger, M.. 2007. Total historical land-use change in Bolivia, who, where, why and how much. Ecology & Society 3, #36.
Lescure, J.P., Puig, H., Riera, B., Leclerc, D., Beekman, A. and A. Beneteau. 1983. La phytomassa epigee d’une forest dense en Guyana francaise. Acta Oecologia 4: 237-251.
Lewis et al., Increasing Forest Carbon, Nature 09
Lic. Lilian Soria, Departamento de Geografía, Museo de Historia Natural Noel Kempff Mercado, Universidad Gabriel René Moreno, Santa Cruz, Bolivia
MacDicken, K.G. 1997. A Guide to Monitoring Carbon Storage in Forestry and Agroforestry Projects. Winrock International Institute for Agricultural Development.
Marland, G et al, 2003. “The Climatic Impacts of Land Surface Change and Carbon Management, and the Implications for Climate-Change Mitigation Policy,” Climate Policy 3.
Meridian Institute, 2009. Reducing Emissions from Deforestation and Degradation: An Options Assessment Report,
Millennium Ecosystem Assessment, 2005. Ecosystems and Human Well-being: Synthesis (Island Press, Washington D.C.
Ministry of Agriculture. 2005. Agricultural Export Diversification Program: Agricultural Export Diversification Programme. IDB/GoG, Georgetown. 17 pp.
Ministry of Public Works and Communications, Guyana: Transport Sector Study, December 2005
Ministry of Public Works and Communications, Guyana: Transport Sector Study, December 2005 at XIII
Ministry of Tourism, Industry & Commerce (Official Website). 2005.Tourism: Tourism Trends. Web source: http://www.mintic.gov.gy/tourism_trends.html, Accessed: October 8, 2008.
Ministry of Tourism, Industry & Commerce (Official Website). 2005. Industry Legislation: Overview of Tourism in Guyana 1986-2005. Web source: http://www.mintic.gov.gy/legislation.html#industry, Accessed: October 8, 2008.
Montambault, J. R. and Missa, O. (Eds.) 2002. A biodiversity Assessment of the Eastern Kanuku Mountains, lower Kwitao River Guyana. RAP Bulletin of Biological Assessment 26. Conservation International, Washington DC.
Mott MacDonald and CEMCO Inc. 2008. Georgetown-Lethem Road Pre-Feasibility Study (Technical Cooperation ATN/OC-10165-GY). Government of Guyana Inter-American Development Bank, Georgetown
Moura Costa, P. And Ebeling J., 2008. Ecosecurities Position Statement Reducing Emissions From Deforestation And Degradation, Ecosecurities.
National Vegetation map of Guyana, http://www.forestry.gov.gy/vegmap.htm
Nelson, D.W., and L.E. Sommers. 1982. Total carbon, organic carbon, and organic matter. p. 539–580. In A.L. Page et al. (ed.) Methods of soil Analysis. Part 2. 2nd ed. Agron. Monogr. 9. ASA and SSSA, Madison, WI.
North Rupununi District Development Board (NRDDB). 2002. Natural Resource Management and Monitoring in the North Rupununi: Briefing Note for

60
Director of the Environmental Protection Agency, Tuesday, October 22, 2002
NRDDB. 2006. Guidelines for Community-Based Natural Resource Management North Rupununi
O’Sullivan, R. 2008. Reducing Emissions From Deforestation: an Introduction” in Climate Change and Forests, Emerging Policy and Market Opportunities, ed. Streck, O’Sullivan, Janson-Smith, and Tarasofsky, Brookings/Chatham House.
Office of the President, Republic of Guyana, Saving the World’s Forests Today; Creating Incentives to Avoid Deforestation, December 2008
Ogonowski, M., 2008. et al Reducing Emissions from Deforestation and Degradation: The Dual Markets Approach, Centre for Clean Air Policy, (2007); and Hare B., Macey K., Tropical Deforestation Emission Reduction Mechanism A Discussion Paper, Greenpeace International.
Olson, J.S., Watts, J.A., and L.J. Allison. 1983. Carbon in Live Vegetation of Major World Ecosystems. Oak Ridge National Laboratory. U.S. Department of Energy Conract No. W-7405-ENG-26. 152 pp.
Osborne, T. and C. Kiker. 2005. Carbon offsets as an economic alternative to large-scale logging: a case study in Guyana. Ecological Economics 52: 481-496.
Pancel, L., ed. 1993. Tropical forestry handbook. Berlin, Germany, Springer-Verlag. 1 738 pp. (Two volumes)
Parker, T.A. et al. 1993. A Biological Assessment of the Kanuku Mountains Region of Southwestern Guyana. Conservation International, RAP working Papers 5.
Parsram, K. 2002. Quantification of the short-term carbon stock responses to reduced impact logging and conventional logging practice in Guyana. MSc Thesis University of the West Indies.
Pearson, T., Walker, S. and Brown, S. 2005. Sourcebook for Land Use, Land-Use Change and Forestry Projects. Winrock International and the World Bank Biocarbon Fund. 57pp. Available at: http://www.winrock.org/Ecosystems/files/Winrock-BioCarbon_Fund_Sourcebook-compressed.pdf
Permaul D.., 2008. Permanent Secretary Ministry of Agriculture: Personal Communication.
Peterson, G.D. and M. Heemskerk. 2001. Deforestation and forest regeneration following small-scale gold mining in the Amazon: the case of Suriname. Environmental Conservation 28(2):117-126
Point Carbon 2008. Carbon 2008 - Post-2012 is now, Røine, K., E. Tvinnereim and H. Hasselknippe (eds.).
Potter K.E.D. 1978. The Functions and Organizational Structure of the Hydrometeorological Service’, HyM-GAP.
Potvin, C., Guay, B., and Pedroni, L., 2008. “Is reducing emissions from deforestation financially feasible? A Panamanian case study”, Climate Policy, 8.
Proisy, C., Couteron, P., Fromard, F., 2007. Predicting and mapping mangrove biomass from canopy grain analysis using Fourier-based textural ordination
(FOTO) of IKONOS images. Remote Sensing of Environment, 109 (3): 379-392.
Ramdin, N and Steele, J.G. 1966. Soil Survey Of The Atkinson-Mckenzie Area. Minitry of Agriculture, British Guiana.
Rodney, K.P. 2003. SUA Management Level Inventory Report. Iwokrama International Centre for Rainforest Conservation and Development.
Saatchi, S. S., Houghton, R. A., Dos Santos Alvalá, R. C., Soares, J. V. and Y. Yu. 2007. Distribution of aboveground live biomass in the Amazon basin. Global Change Biology 13: 816 – 837.
Saunders J., and Nussbaum R., 2007. Forest Governance and Reduced Emissions from Deforestation and Degradation (REDD), Chatham House Briefing Paper, Energy Environment and Development Programme, EEDP LOG BP 07/03.
Sayer J., et al., 2008. Local Rights and Tenure for Forests; Opportunity or Threat for Conservation, Rights and Resources Initiative, Washington D.C.
Scholtz S., and Noble I., 2005. Generation of Sequestration Credits under the CDM and Bosquet B., “Specific Features of Land Use, Land-Use Change, and Forestry Transactions”, both in Freestone D., and Streck C. (eds) Legal Aspects of Implementing the Kyoto Protocol Mechanisms, Making Kyoto Work, Oxford.
Shutt, Harry, Moore, David and Bynoe, Mark (2007) Social Impact Assessment of the Guyana National Action Plan on Sugar (Final Report), Georgetown.
Spetich, M., S. Shifley, and G. Parker. 1999. Regional distribution and dynamics of coarse woody debris in Midwestern old-growth forests. Forest Science 45: 302-313.
Srivastava, P. 1994: Progress Report from Iwokrama. The Iwokrama Rainforest Programme, Guyana.
ter Steege, et al 1996. Ecology and Logging in a Rainforest in Guyana: with Recommendations for Forest Management. Tropenbos Series 14. The Tropenbos Foundation, Wageningen. Netherlands.
ter Steege, H. 1998. Biomass Estimates for Forests in Guyana and their Use in Carbon Offsets. Iwokrama International Centre, Georgetown, Guyana.
ter Steege, H., Jetten, V., Polak, M. and M. Werger. 1993. The tropical rain forest types and soils of a watershed in Guyana, South America. Journal of Vegetation Science 4:705-716.
ter Steege, Hans, Lilwah, Ramesh, Ek, Renske, van der Hout, Peter, Thomas, Raquel, van Essen, Jessica and Jetten, Victor, 1999. Composition and diversity of the rain forest in Central Guyana: An addendum to ‘Soils of the rainforest in Central Guyana’. Tropenbos Guyana Reports 99-2. Tropenbos-Guyana Programme. Utrecht University.
ter Steege, Ivan Welch and Roderick Zagt 2002. Long-term effect of timber harvesting in the Bartica Triangle,

61
Central Guyana. Forest Ecology and Management 170: 127-144.
Thomas, R. 2001. Forest productivity and resource availability in lowland tropical forests in Guyana. Tropenbos-Guyana Series 7. Tropenbos-Guyana Programme, Georgetown, Guyana.
Tjon, K. 1998. Monitoring tropical rainforest in Suriname: Internal Memorandum NARENA/CELOS
Tomaselli, I 2006. Brief Study on Funding and Finance for Forestry and Forest-Based Sector, report prepared for the United Nations Forum on Forests.
Trines, E. et al, 2006. Integrating Agriculture, Forestry and Other Land Use in Future Climate Regimes: Methodological Issues and Policy Options, Climate Change Scientific Assessment and Policy Analysis report 500102002 (Netherlands, Netherlands Environmental Protection Agency, 2006); UN Doc Distr General A/AC.237/18 (Part II)/Add.1, 15 May 1992.
Tropenbos. Timber Trees of Guiana. UNDP Guyana. March 2008. Project name: Capacity
Development and Mainstreaming for Sustainable Land Management. Web Source: http://www.undp.org.gy/project00047476.html, Accessed: October 1, 2008.
UNFCCC AWG-LCA Accra meeting; FCCC/AWGLCA/2008/CRP.5 Report of the workshop on policy approaches and positive incentives on issues relating to reducing emissions from deforestation and forest degradation in developing countries; and the role of conservation, sustainable management of forests and enhancement of forest carbon stocks in developing countries.
UNFCCC AWGLCA/2009/MISC.4 (Part I) Ideas and proposals on the elements contained in paragraph 1 of the Bali Action Plan (Guyana submission); FCCC/AWGLCA/2009/MISC.1/Add.4 Ideas and proposals on the elements contained in paragraph 1 of the Bali Action Plan (Coalition for Rainforest Nations Submission)
UNFCCC SBSTA/2008/13 UNFCCC SBSTA/2008/L.23, Reducing emissions from
deforestation in developing countries: approaches to stimulate action, Draft conclusions proposed by the Chair.
UNFCCC SBSTA/2008/L.23, Reducing emissions from deforestation in developing countries: approaches to stimulate action.
UNFCCC, Reducing Emissions from Deforestation in Developing Countries: Approaches to Stimulate Action, FCCC/CP/2005/MISC.1 (http://unfccc.int/resource/docs/2005/cop11/eng/misc01.pdf). Official support for including the issue on the COP’s agenda was sent by Bolivia, the Central African Republic, Chile, Congo, the Democratic Republic of Congo, the Dominican Republic, and Nicaragua.
van Andel, T. 2001. Floristic composition and diversity of mixed primary and secondary forest in northwest Guyana. Biodiversity and Conservation 10:1645-1682.
Van Kekem, A.J., Pulles, J.H.M. and Z. Khan. 1996. Soils of the Rainforest in Central Guyana. Tropenbos Guyana Series 2. Tropenbos Guyana Programme. Georgetown.
Van kekem, A.J.; Pulles, J.H.M. and Khan, Z. 1996. Soils of the Rainforest of Central Guyana. Tropenbos-Guyana, Georgetown.
Van Wagner, C.E. (1968). The line-intersect method in forest fuel sampling. Forest Science 14: 20-26.
Voluntary Carbon Standard. 2008. VCS Guidance for Agriculture, Forestry and Other Land Use Projects. Available at http://www.v-c-s.org/docs/Guidance%20for%20AFOLU%20Projects.pdf
Warren, W.G. and Olsen, P.F. (1964) A line intersect technique for assessing logging waste. Forest Science 10: 267-276.
Watson C, Stewart, D (pers. comm.). Wemaere M., and Streck C., 2005. Legal Ownership and
Nature of Kyoto Units and EU Allowances in Legal Aspects of Implementing the Kyoto Protocol, Making Kyoto Work, Freestone D., and Streck C., (eds) Oxford.
Wilder, M., Crittenden, J. 2008. Bringing the Forests to Market: Structuring Avoided Deforestation Projects Climate Change and Forests, Emerging Policy and Market Opportunities, ed. Streck, O’Sullivan, Janson-Smith, and Tarasofsky, Brookings/Chatham House.
Williams, M., Shimabukuro, Y. E., Herbert, D. A., Pardi Lacruz, S., Renno, C. and E. B. Rastetter. 2002. Heterogeneity of Soils and Vegetation in an Eastern Amazonian Rain Forest: Implications for Scaling Up Biomass and Production. Ecosystems 5:0692-0704.
World Bank, 2006. Guyana poverty reduction strategy paper second annual progress report and joint IDA/IMF staff assessment, (Report No. 35759-GY)
World Bank. 2003. Guyana Development Policy Review.World Bank, Washington
Yadvinder, M et al. 2006. The regional variation of aboveground live biomass in old-growth Amazonian forests. Global Change Biology 12(7): 1107-1138.