avon products, inc. (avp): ding dong, avon … avp analysis.pdf · low double-digit operating...
TRANSCRIPT
WWW.GREYVM.COM © PROPERTY OF GREY VALUE MANAGEMENT, LLC 1
AVON PRODUCTS, INC. (AVP):DING DONG, AVON SHARES CALLING?
SEPTEMBER 2015
WWW.GREYVM.COM © PROPERTY OF GREY VALUE MANAGEMENT, LLC 2
Synopsis
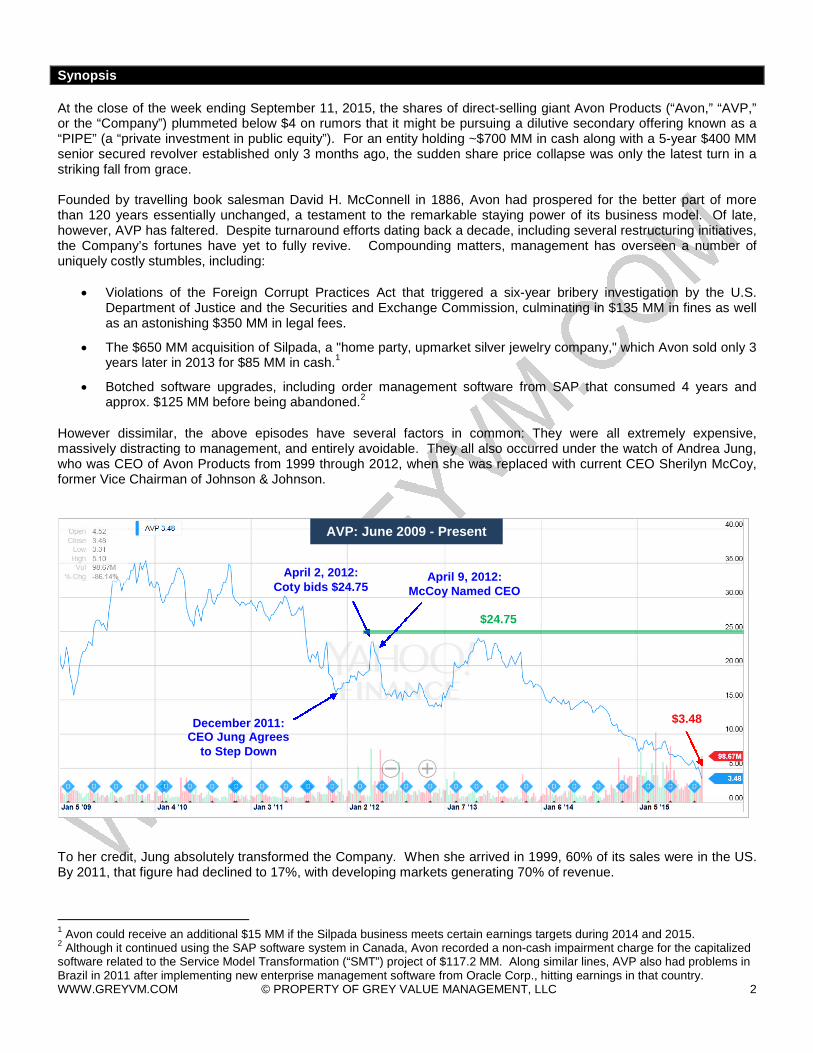
At the close of the week ending September 11, 2015, the shares of direct-selling giant Avon Products (“Avon,” “AVP,”or the “Company”) plummeted below $4 on rumors that it might be pursuing a dilutive secondary offering known as a“PIPE” (a “private investment in public equity”). For an entity holding ~$700 MM in cash along with a 5-year $400 MMsenior secured revolver established only 3 months ago, the sudden share price collapse was only the latest turn in astriking fall from grace.
Founded by travelling book salesman David H. McConnell in 1886, Avon had prospered for the better part of morethan 120 years essentially unchanged, a testament to the remarkable staying power of its business model. Of late,however, AVP has faltered. Despite turnaround efforts dating back a decade, including several restructuring initiatives,the Company’s fortunes have yet to fully revive. Compounding matters, management has overseen a number ofuniquely costly stumbles, including:
Violations of the Foreign Corrupt Practices Act that triggered a six-year bribery investigation by the U.S.Department of Justice and the Securities and Exchange Commission, culminating in $135 MM in fines as wellas an astonishing $350 MM in legal fees.
The $650 MM acquisition of Silpada, a "home party, upmarket silver jewelry company," which Avon sold only 3years later in 2013 for $85 MM in cash.
1
Botched software upgrades, including order management software from SAP that consumed 4 years andapprox. $125 MM before being abandoned.
2
However dissimilar, the above episodes have several factors in common: They were all extremely expensive,massively distracting to management, and entirely avoidable. They all also occurred under the watch of Andrea Jung,who was CEO of Avon Products from 1999 through 2012, when she was replaced with current CEO Sherilyn McCoy,former Vice Chairman of Johnson & Johnson.
To her credit, Jung absolutely transformed the Company. When she arrived in 1999, 60% of its sales were in the US.By 2011, that figure had declined to 17%, with developing markets generating 70% of revenue.
1Avon could receive an additional $15 MM if the Silpada business meets certain earnings targets during 2014 and 2015.
2Although it continued using the SAP software system in Canada, Avon recorded a non-cash impairment charge for the capitalized
software related to the Service Model Transformation (“SMT”) project of $117.2 MM. Along similar lines, AVP also had problems inBrazil in 2011 after implementing new enterprise management software from Oracle Corp., hitting earnings in that country.
AVP: June 2009 - Present
December 2011:CEO Jung Agrees
to Step Down
April 2, 2012:Coty bids $24.75
$24.75
April 9, 2012:McCoy Named CEO
$3.48
WWW.GREYVM.COM © PROPERTY OF GREY VALUE MANAGEMENT, LLC 3
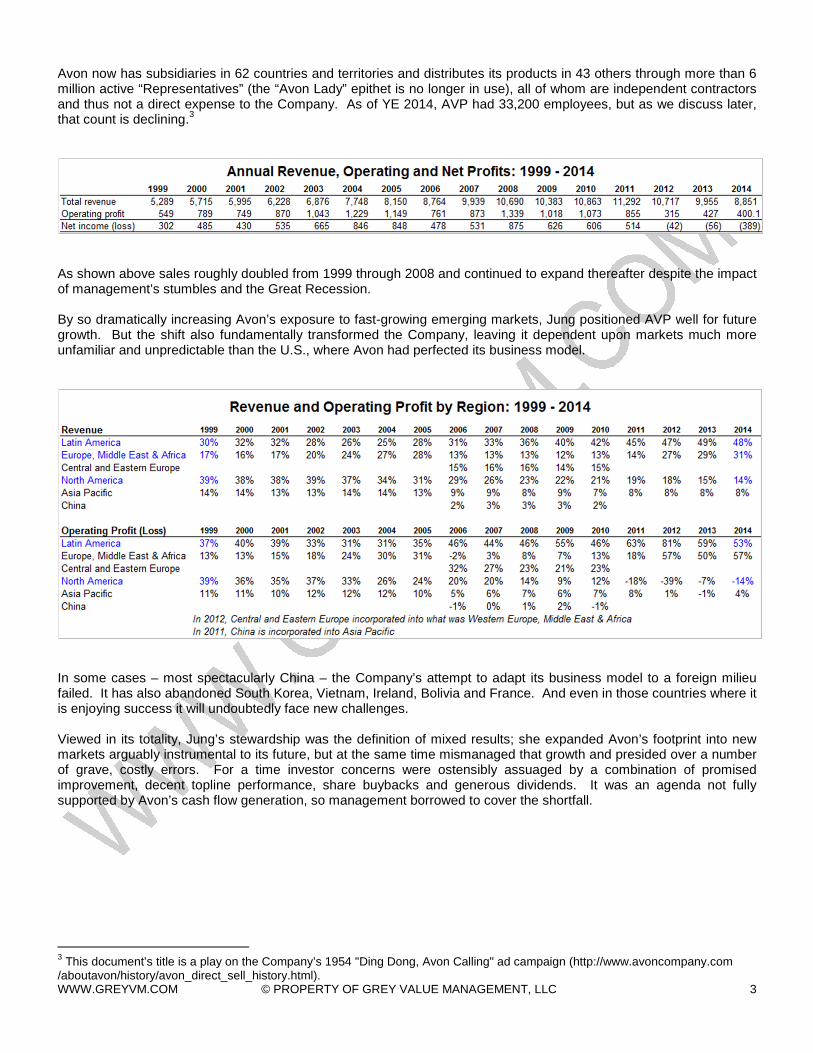
Avon now has subsidiaries in 62 countries and territories and distributes its products in 43 others through more than 6million active “Representatives” (the “Avon Lady” epithet is no longer in use), all of whom are independent contractorsand thus not a direct expense to the Company. As of YE 2014, AVP had 33,200 employees, but as we discuss later,that count is declining.
3
As shown above sales roughly doubled from 1999 through 2008 and continued to expand thereafter despite the impactof management’s stumbles and the Great Recession.
By so dramatically increasing Avon’s exposure to fast-growing emerging markets, Jung positioned AVP well for futuregrowth. But the shift also fundamentally transformed the Company, leaving it dependent upon markets much moreunfamiliar and unpredictable than the U.S., where Avon had perfected its business model.
In some cases – most spectacularly China – the Company’s attempt to adapt its business model to a foreign milieufailed. It has also abandoned South Korea, Vietnam, Ireland, Bolivia and France. And even in those countries where itis enjoying success it will undoubtedly face new challenges.
Viewed in its totality, Jung’s stewardship was the definition of mixed results; she expanded Avon’s footprint into newmarkets arguably instrumental to its future, but at the same time mismanaged that growth and presided over a numberof grave, costly errors. For a time investor concerns were ostensibly assuaged by a combination of promisedimprovement, decent topline performance, share buybacks and generous dividends. It was an agenda not fullysupported by Avon’s cash flow generation, so management borrowed to cover the shortfall.
3This document’s title is a play on the Company’s 1954 "Ding Dong, Avon Calling" ad campaign (http://www.avoncompany.com
/aboutavon/history/avon_direct_sell_history.html).
WWW.GREYVM.COM © PROPERTY OF GREY VALUE MANAGEMENT, LLC 4
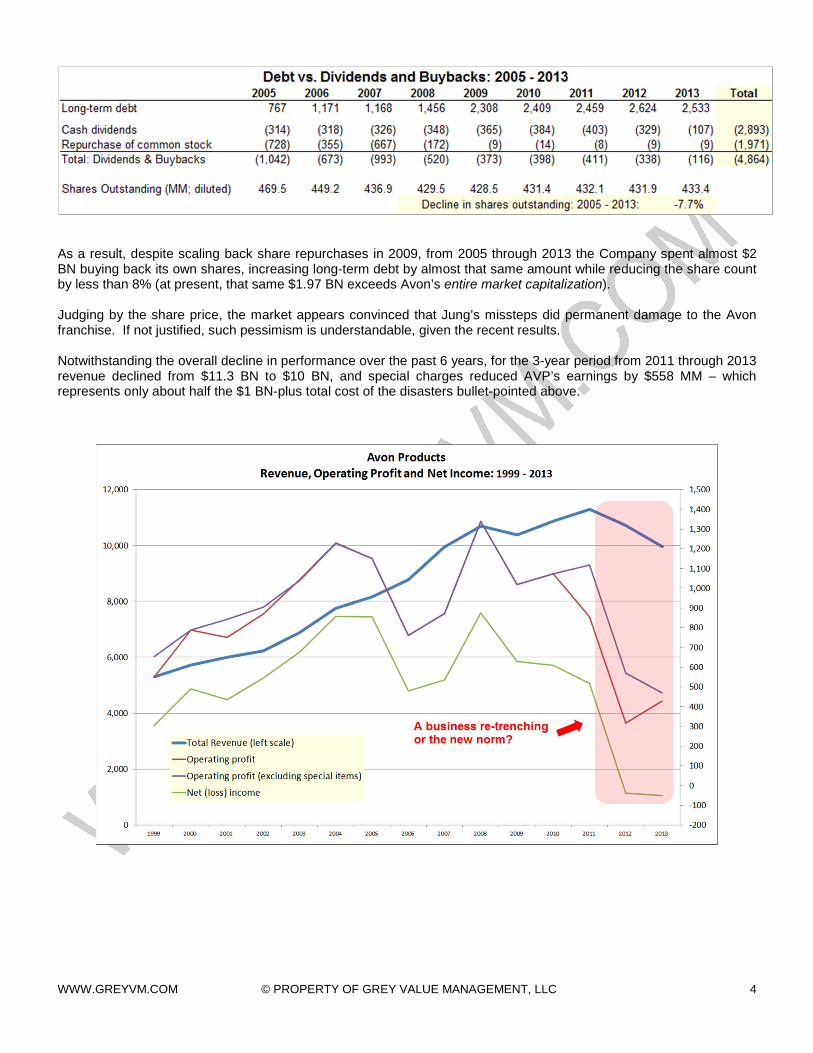
As a result, despite scaling back share repurchases in 2009, from 2005 through 2013 the Company spent almost $2BN buying back its own shares, increasing long-term debt by almost that same amount while reducing the share countby less than 8% (at present, that same $1.97 BN exceeds Avon’s entire market capitalization).
Judging by the share price, the market appears convinced that Jung’s missteps did permanent damage to the Avonfranchise. If not justified, such pessimism is understandable, given the recent results.
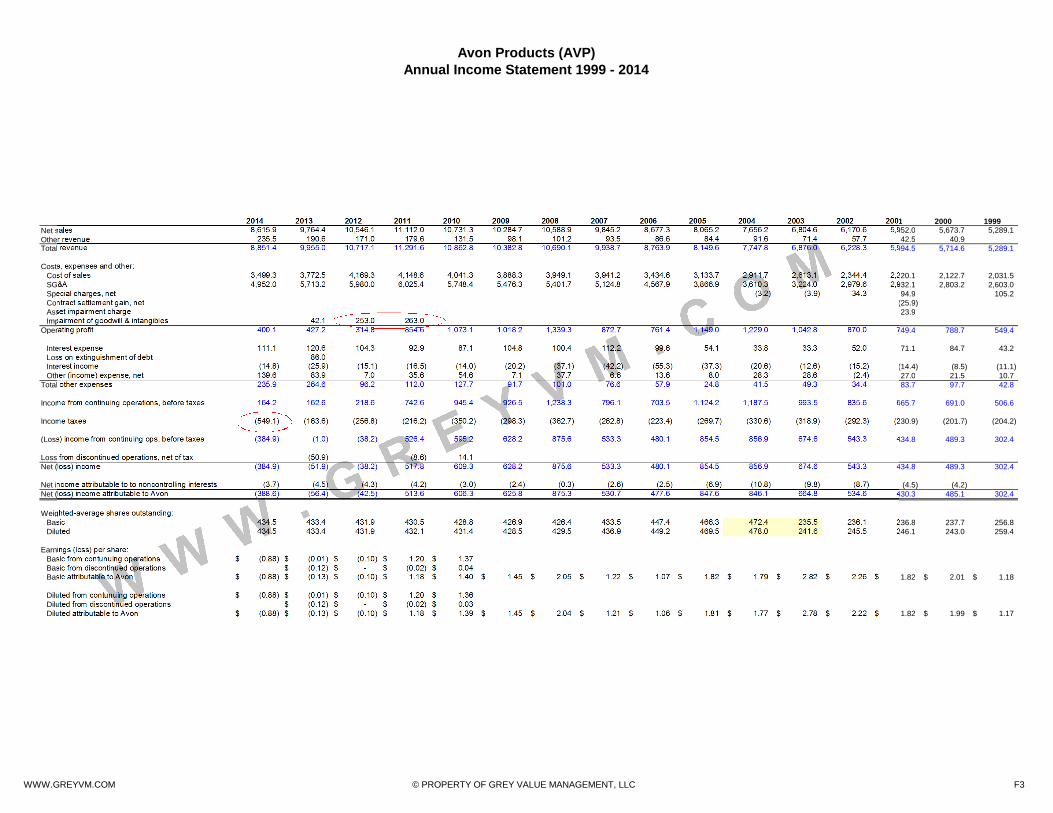
Notwithstanding the overall decline in performance over the past 6 years, for the 3-year period from 2011 through 2013revenue declined from $11.3 BN to $10 BN, and special charges reduced AVP’s earnings by $558 MM – whichrepresents only about half the $1 BN-plus total cost of the disasters bullet-pointed above.
WWW.GREYVM.COM © PROPERTY OF GREY VALUE MANAGEMENT, LLC 5
But like Jung, the bribery scandal, disastrous acquisition and botched software upgrade are history. However costly inthe short term, they didn’t fundamentally impair the underlying business or the balance sheet, and thus have littlebearing on the Company’s long-term future. AVP’s more serious problem is of a much more mundane, persistentnature:
Despite having essentially been in overhaul mode for over a decade,Avon continues to underperform.
The $400 MM Cost Savings Initiative announced in 2012 was only the latest of a series that includes restructuringefforts announced in 2002, 2005 and 2009, including its Product Line Simplification Program and its Strategic SourcingInitiative.
4
Based on her own assessment, the Avon Sherilyn McCoy inherited in May 2012 needed work on virtually every front:“It has lost market share; missed expectations; it has operational and strategic issues; the rate of growth has declined;and cash generation and cost management needs to improve.”
5After laboring on those issues for over a year and a
half, she was forced to acknowledge the obvious – that “…frankly, some parts of the turnaround have been morechallenging than anticipated.”
6While commendable on management’s part, such candor only reinforced the
perception that Avon’s decline might be more than transient.
However, when one examines the numbers closely, management’s specific goals of mid-single-digit revenue growth, alow double-digit operating margin, and annualized savings of $165 MM to $170 MM (before taxes) by 2016 lookentirely achievable.
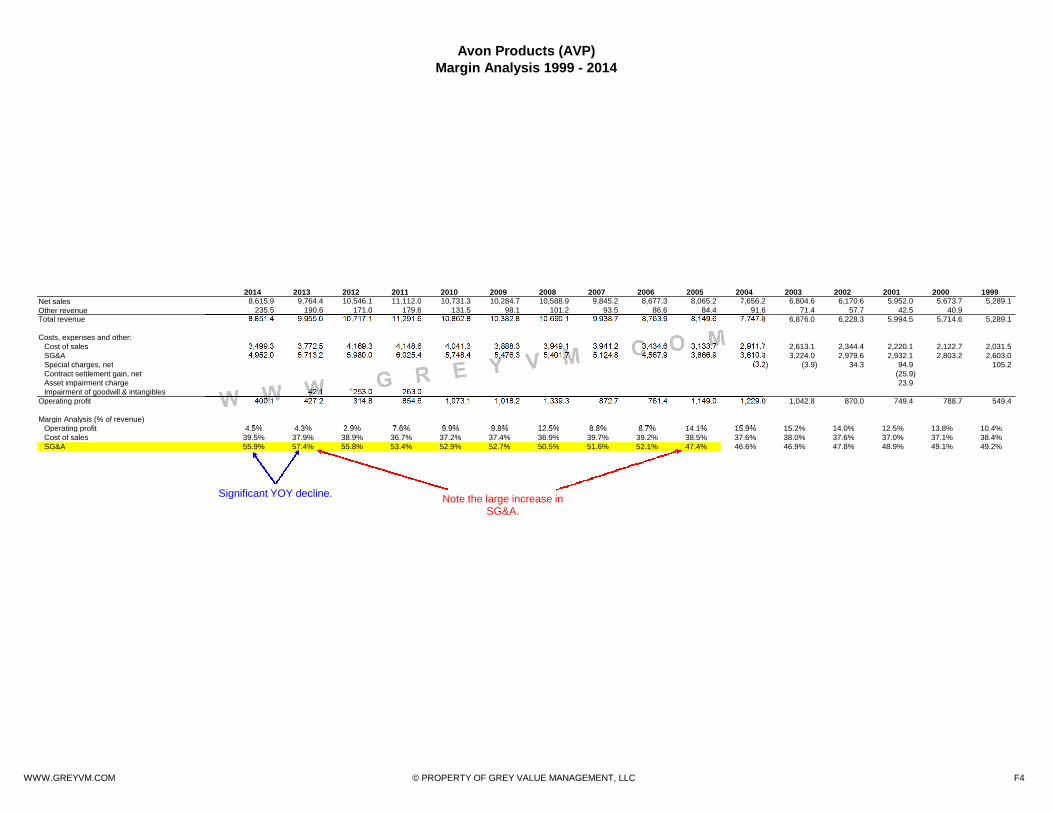
The restructuring actions primarily consist of global headcount reductions and closing/reorganizing some of AVP’ssmaller, underperforming markets. Given the amount by which overhead had swelled prior to McCoy’s arrival – in thespace of a decade, SG&A increased from 47% to 57% of revenue – there would appear ample room to reduceexpenses. Note that based on FY13 revenue of $10 BN, each 1% decline in SG&A as a percentage of revenue isequivalent to approx. $100 MM.
With Avon’s turnaround not yet complete, impatience with McCoy is building. This is understandable but alsosomewhat ironic, given the fact that she has largely delivered on the ambitious medium-term goals she articulated:
Avon has reduced global headcount by 15% and achieved its cost-savings target of $400 MM (before taxes).7
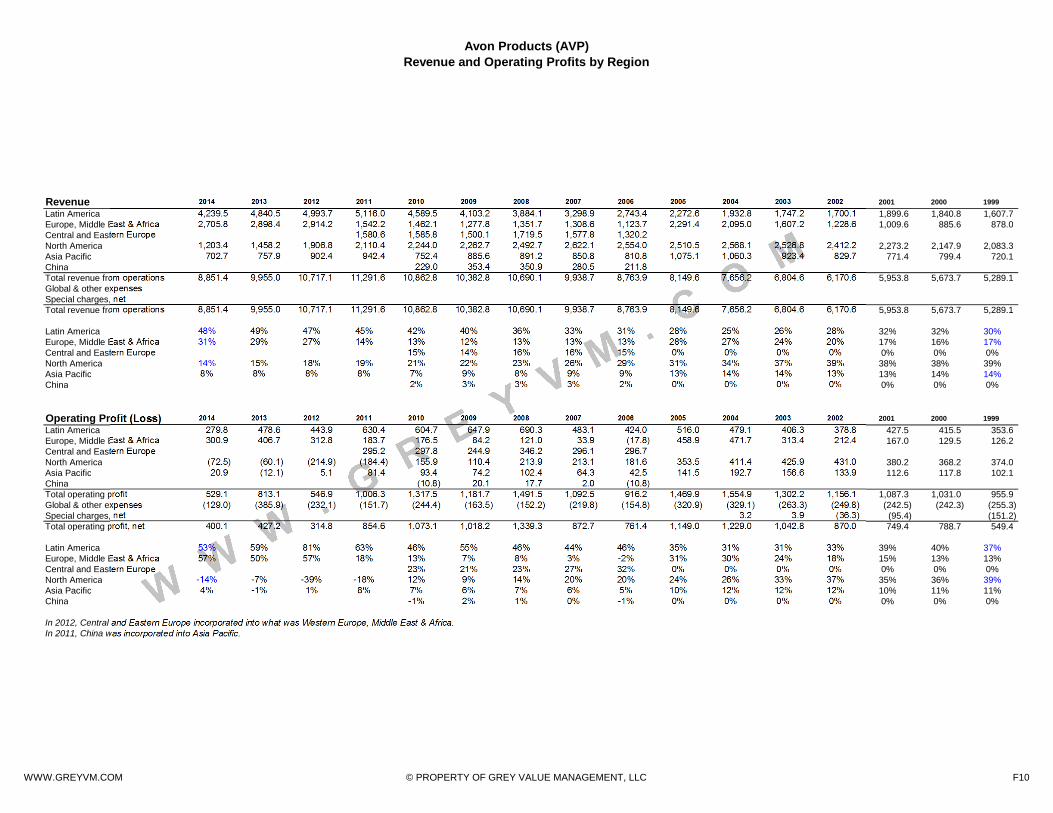
Downsizing can be expensive, and the costs naturally precede the savings. SG&A was $45 MM lower in 2Q14 than2Q13, but as McCoy said during the call, “Our financial performance is not yet benefiting significantly from the actionswe've taken as part of our turnaround journey.” While revenue in North America was down 20%, AVP essentiallyachieved breakeven in the quarter, and expects the North American business to return to profitability in 2015. Effortsto expand revenue elsewhere have been stymied by economic headwinds in several key markets, particularly in LatinAmerica, which for 2013 accounted for 49% of Avon’s revenue and 59% of its operating profits (see page F11).
Given the focus with which McCoy is attacking Avon’s swollen overhead, common sense suggests her actions shouldimprove profitability. As for when and to what extent performance will rebound, management has offered crediblyconservative guidance – look to 2016 and beyond. To encourage their patience, shareholders receive a 6% dividendyield ($0.24 per $4 share), which compares quite well with the 2.2% being offered by the 10-year U.S. Treasury.
That said, with recent rumors of a secondary offering, investors drawn to AVP purely for the dividend yield are advisedto tread carefully. After all, why would a company in such need of capital that it (apparently) entertains a dilutive PIPEdeal continue paying out ~$26 mm per quarter in dividends? They can raise ~$100 MM in cash annually by simplynot distributing it.
4The current $400 MM restructuring program will cost $45 mm to $50 MM before taxes, $40 MM of which will be charged to 2Q14;
$40 MM of that restructuring cost will be cash charges. See 8-K filed June 23, 2014.5
“Pressure on new chief for Avon makeover,” Financial Times, May 21, 2012.6
Avon Products Q4 2013 Earnings Call Transcript, SeekingAlpha, February 13, 2014.7
FY14 10-K filed February 24, 2015, pg. 6.
WWW.GREYVM.COM © PROPERTY OF GREY VALUE MANAGEMENT, LLC 6
ValuationBased on a careful analysis of AVP’s long-term history, including the last 16 years of its financial performance, thisvaluation relies upon three very narrow assumptions:
(1) The bribery scandal, Silpada acquisition, and SAP software disaster are indeed what they appear to be – one-time events that, however costly, damaged AVP’s credibility with Wall Street much more than the underlyingfranchise;
(2) The direct sales business model has not suddenly become obsolete (plenty of other direct sellers, such asAmway and NuSkin, are thriving); and
(3) However persistent, Avon’s underperformance can be resolved by effective management, which appears to bein place. It will definitely take more time, but the Company can be fixed.
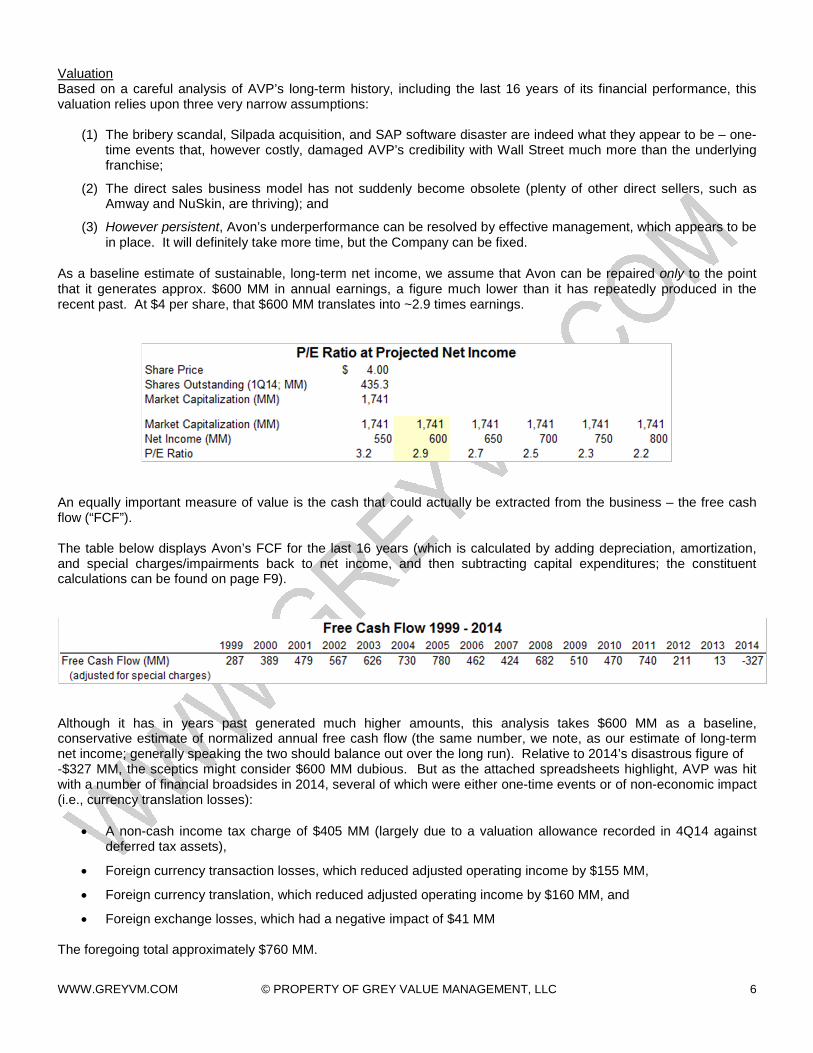
As a baseline estimate of sustainable, long-term net income, we assume that Avon can be repaired only to the pointthat it generates approx. $600 MM in annual earnings, a figure much lower than it has repeatedly produced in therecent past. At $4 per share, that $600 MM translates into ~2.9 times earnings.
An equally important measure of value is the cash that could actually be extracted from the business – the free cashflow (“FCF”).
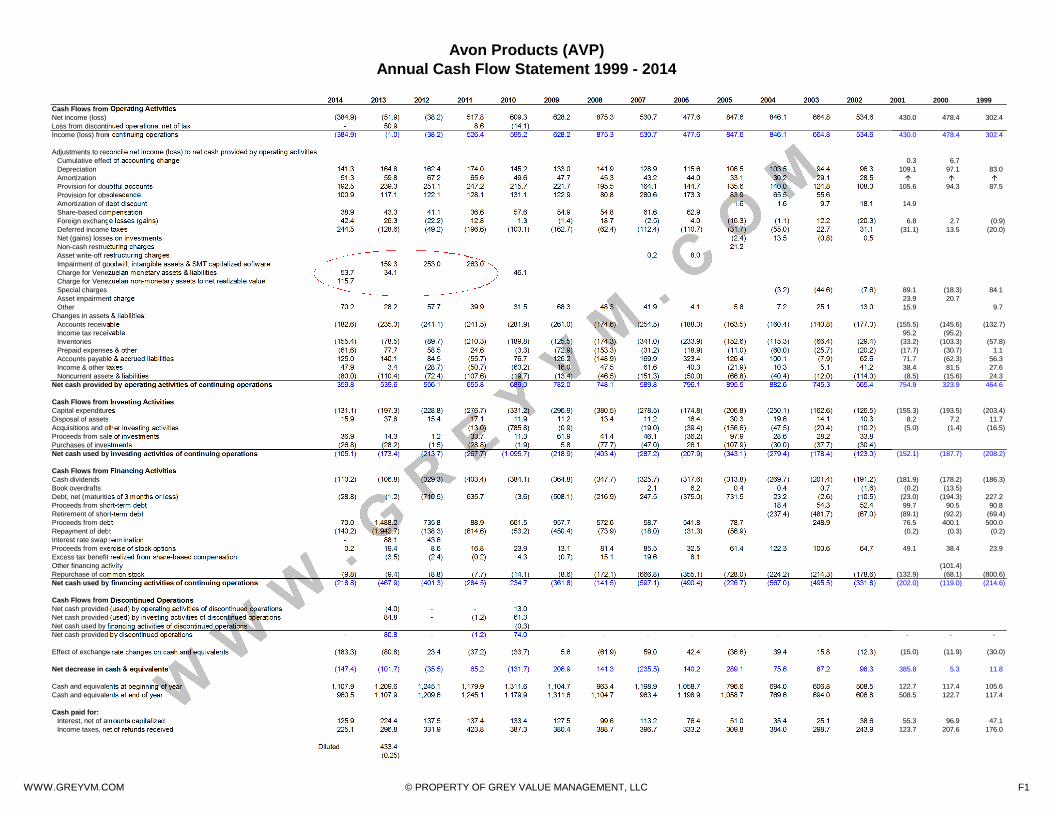
The table below displays Avon’s FCF for the last 16 years (which is calculated by adding depreciation, amortization,and special charges/impairments back to net income, and then subtracting capital expenditures; the constituentcalculations can be found on page F9).
Although it has in years past generated much higher amounts, this analysis takes $600 MM as a baseline,conservative estimate of normalized annual free cash flow (the same number, we note, as our estimate of long-termnet income; generally speaking the two should balance out over the long run). Relative to 2014’s disastrous figure of-$327 MM, the sceptics might consider $600 MM dubious. But as the attached spreadsheets highlight, AVP was hitwith a number of financial broadsides in 2014, several of which were either one-time events or of non-economic impact(i.e., currency translation losses):
A non-cash income tax charge of $405 MM (largely due to a valuation allowance recorded in 4Q14 againstdeferred tax assets),
Foreign currency transaction losses, which reduced adjusted operating income by $155 MM,
Foreign currency translation, which reduced adjusted operating income by $160 MM, and
Foreign exchange losses, which had a negative impact of $41 MM
The foregoing total approximately $760 MM.
WWW.GREYVM.COM © PROPERTY OF GREY VALUE MANAGEMENT, LLC 7
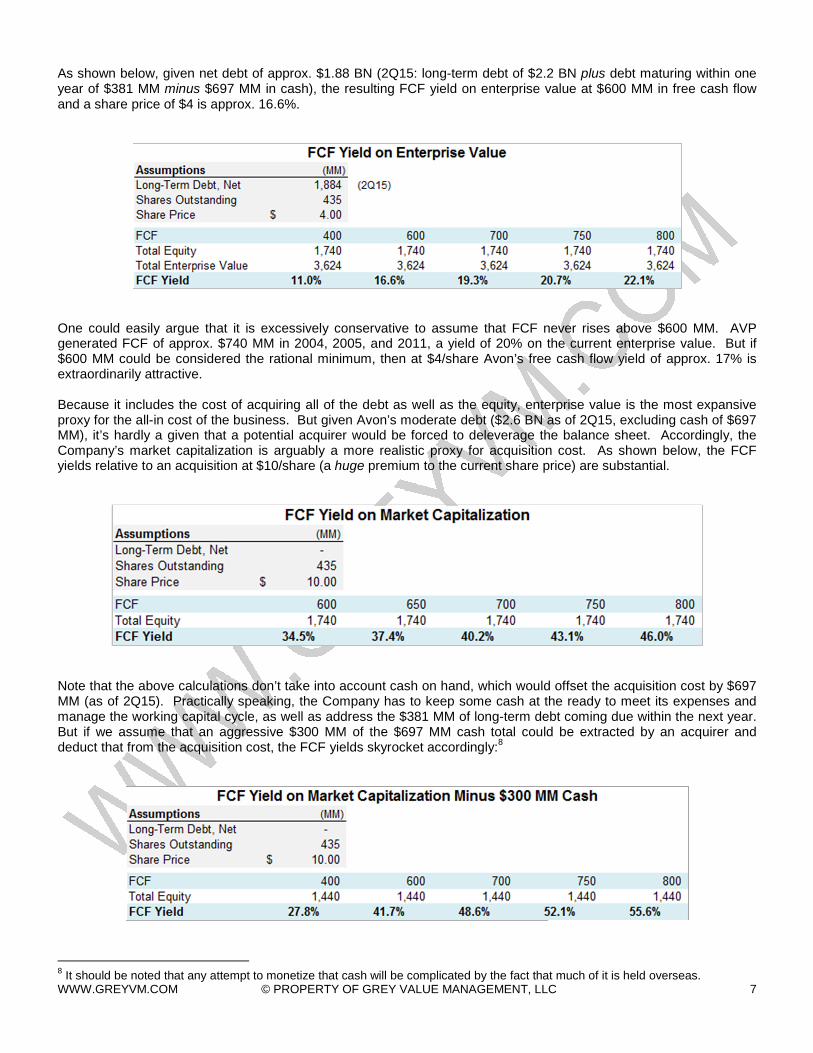
As shown below, given net debt of approx. $1.88 BN (2Q15: long-term debt of $2.2 BN plus debt maturing within oneyear of $381 MM minus $697 MM in cash), the resulting FCF yield on enterprise value at $600 MM in free cash flowand a share price of $4 is approx. 16.6%.
One could easily argue that it is excessively conservative to assume that FCF never rises above $600 MM. AVPgenerated FCF of approx. $740 MM in 2004, 2005, and 2011, a yield of 20% on the current enterprise value. But if$600 MM could be considered the rational minimum, then at $4/share Avon’s free cash flow yield of approx. 17% isextraordinarily attractive.
Because it includes the cost of acquiring all of the debt as well as the equity, enterprise value is the most expansiveproxy for the all-in cost of the business. But given Avon’s moderate debt ($2.6 BN as of 2Q15, excluding cash of $697MM), it’s hardly a given that a potential acquirer would be forced to deleverage the balance sheet. Accordingly, theCompany’s market capitalization is arguably a more realistic proxy for acquisition cost. As shown below, the FCFyields relative to an acquisition at $10/share (a huge premium to the current share price) are substantial.
Note that the above calculations don’t take into account cash on hand, which would offset the acquisition cost by $697MM (as of 2Q15). Practically speaking, the Company has to keep some cash at the ready to meet its expenses andmanage the working capital cycle, as well as address the $381 MM of long-term debt coming due within the next year.But if we assume that an aggressive $300 MM of the $697 MM cash total could be extracted by an acquirer anddeduct that from the acquisition cost, the FCF yields skyrocket accordingly:
8
8It should be noted that any attempt to monetize that cash will be complicated by the fact that much of it is held overseas.

WWW.GREYVM.COM © PROPERTY OF GREY VALUE MANAGEMENT, LLC 8
It’s the value investor’s habit to evaluate a business as if s/he were buying it entirely rather than some fraction of theshares. But as indicated in the chart on the first page, in April 2012 Coty Inc. in fact offered to buy AVP for$24.75/share, over six times the current price. Apparently the deal stalled there because Avon management refusedto allow due diligence without a firm offer, and Coty was hesitant to commit absent a more detailed grasp of AVP’sinner workings.
That was over 3 years ago, and there’s no way of knowing whether Coty would have gone forward had it known thenwhat it knows now. All that’s certain is that Coty is more informed today than it was in April 2012. In fact, in May Avonand Coty entered into a marketing partnership by which certain Coty fragrances would be marketed and sold throughAvon Brazil's network of Representatives.
To be clear, we’re not suggesting that the possibility of a second bid justifies buying AVP shares. However intriguingor plausible that proposition, an investment’s margin of safety derives from the discount to its intrinsic value, not theprobability of a takeover.
AVP was at approx. $20 when Coty offered to pay $24.75/share in a bid backed by Warren Buffett (an investor notknown to overpay for acquisitions).
9Naturally, the fact that Coty and Buffett were willing to pay $24.75 in 2012 is no
guarantee that paying $10/share is advisable in 2015. But that bid does pose an interesting question when it comes togauging the downside:
Has Avon’s core business diminished so much in value that it’s worth substantially lessthan $10, less than half the price Coty and Buffett were willing to pay only 3 years ago?
Either Avon has taken a dramatic turn for the worse, sparing Buffett from one of the worst mistakes of his vauntedinvestment career, or in the very least the upside to AVP’s shares at $4 far exceeds the downside.
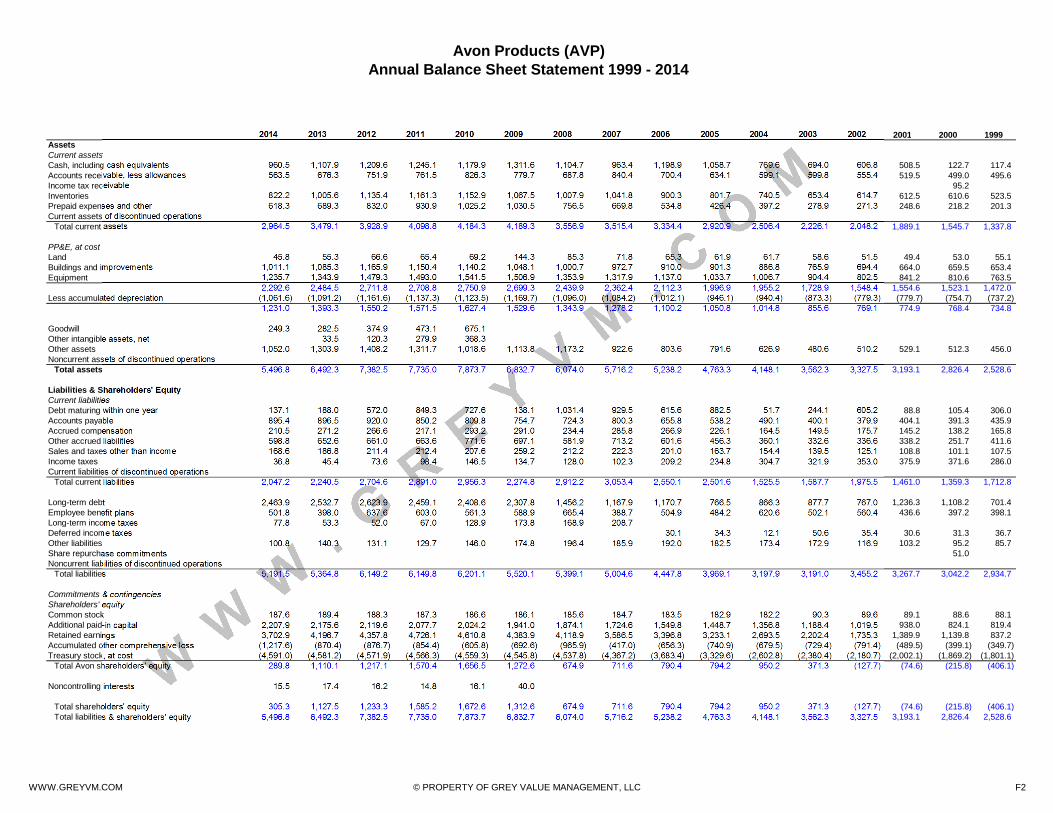
Close readers of the financials will have noticed another interesting datapoint relevant to the margin of safetydiscussion: The Company values its most important asset, the Avon brand, at only $116 MM. As shown below, thatgoodwill constitutes only 2% of total assets.
9Berkshire Hathaway was to provide $2.5 BN of the $10.69 BN bid. Coty was advised by BDT, a firm run by Byron Trott, who is
known to be Buffett’s favorite banker and was also providing equity financing.

WWW.GREYVM.COM © PROPERTY OF GREY VALUE MANAGEMENT, LLC 9
Ultimately, the worth of any business is a function of its ability to generate excess cash, which depends on more thanjust its brand(s). Still, given how central the Avon emblem is to the overall enterprise, the $116 MM valuation seemsstrangely low, even taking into account the Company’s poor performance of late.
Note in the table above that, excluding cash and current assets (which are naturally offset by current liabilities), theonly material assets AVP possesses are its PP&E ($1.04 BN) and Other Assets ($974 MM). And of the latter, $188MM are deferred tax assets (specifically, tax loss carryforwards and excess foreign tax credit carryforwards).
Those carryforwards have material value in terms of their ability to shield future income from taxation (potentialstrategic acquirers take note), but they’re a consequence rather than a source of revenue.
In other words,
Excluding PP&E, the only long-term asset central to Avon’s business is its brand,which is carried at only $116 MM.
By way of rough comparison, Coty – which had revenue of $4.4 BN in FYE 6/15, less than half of Avon’s $9.9 BN –values its goodwill at $1.5 BN, more than 12 times AVP’s $116 MM.
10
The Avon brand may not be worth $3.5 BN. But it has to be worth much, much more than $116 MM.
[Next Page]
10According to its most recent 10K (FYE 6/15), Coty valued its goodwill at $1.53 BN and its net other intangibles at $1.9 BN. Coty’s
net income was $259 MM in 2015, ($64) MM in 2014, and $202 MM in 2013.
WWW.GREYVM.COM © PROPERTY OF GREY VALUE MANAGEMENT, LLC 10
Conclusion
Which is more indicative of Avon’s future – the last 48 months or the past 120 years?
That’s the question at the crux of the investment decision.
Based on the current price, the market apparently considers AVP’s recent underperformance more indicative of itspotential than the century of success that preceded it. After a decade of serial restructurings, this is not anunreasonable conclusion. After all,
If Avon can be fixed, why hasn’t it been by now?
However, in light of the dire condition of the Company several years ago, a more logical question might be: Why wouldit have been?
McCoy – the first credible agent of change – took the helm only about 3 years ago. When considered in context, hertenure has only confirmed what any astute investor should already have known: Avon was never going to be turnedaround overnight. But in a market that functions as a discounting mechanism, expectations – however misguided –are everything. At $4/share, expectations are in the sub-basement. And therein lies the opportunity, because
For a company so apparently troubled, Avon needs toaccomplish surprisingly little to prove a monumental bargain at $4.
We don’t expect revenue to bounce back to peak levels anytime soon, but it doesn’t have to for profits to risesignificantly. As mentioned, SG&A ballooned from 47% to 57% of revenue over the past decade. Improving profitmargins by simply bringing that overhead back in line is low-hanging fruit that McCoy is already aggressively pursuing.The numbers may not yet reflect it, but her progress on the operational level is unmistakable.
It will be a number of quarters before net profits fully reflect operational gains. But the potential price appreciationmore than compensates investors for their patience.
We’re as wary as anyone of a potentially dilutive secondary offering, but gauge both the likelihood and size of thatprospective event relative to the Company’s considerable liquidity – particularly with respect to the dividend, which ifsuspended would reduce cash outflows by $100 MM per year.
There’s no question the business has taken quite a beating. But those eager to read the Avon Lady her last ritesshould take that as a warning. There’s something suspiciously resilient about a business that could endure theshocking missteps, the Great Recession, the subsequent economic downturn of its most important overseas markets(particularly Brazil), the years of poor management – the phrase “hard to kill” comes to mind. Any business thatsurvived over a century would have to be, wouldn’t it?
Steven R. Grey (September 2015)
DisclosureThis synopsis summarizes a much longer analysis conducted over several years and documented in2015. Excluding historical financial data and certain industry statistical data, unless otherwiseindicated it has not been updated to reflect subsequent developments. Please see Disclaimer onthe final page.

WWW.GREYVM.COM © PROPERTY OF GREY VALUE MANAGEMENT, LLC 11
DISCLAIMER
These materials shall not constitute an offer to sell or the solicitation of an offer to buy any interests in Grey ValueManagement or any of its affiliates. Such an offer to sell or solicitation to buy interests may only be made pursuant toa definitive agreement between Grey Value Management and an investor.
The information set forth in this synopsis has been obtained from publicly-available sources. It is provided forinformational purposes only and should not be deemed as a recommendation to buy or sell the securities mentioned orto invest in any investment product. The information has not been independently verified by Grey Value Managementor any of its affiliates. Neither Grey Value Management nor any of its affiliates makes any representations orwarranties regarding, nor do they assume any responsibility for the accuracy, reliability, completeness or applicabilityof, any information, calculations, estimates or projections contained or reflected herein.
The information in this synopsis is provided as of the date hereof and is subject to change at any time thereafter.
Grey Value Management may have a position in any of the securities discussed in this presentation. Grey ValueManagement may reevaluate its holdings thereof and purchase, sell or cover certain positions.
NOTICE AND DISCLAIMER
As a matter of principle and practice, Grey Value Management assembles financial data based upon the original filings. Accordingly, restated results are not adopted.This may result in disparities between the financial data as presented by the subject company vs. Grey Value Management.
These materials shall not constitute an offer to sell or the solicitation of an offer to buy any interests in Grey Value Management or any of its affiliates. Such an offer tosell or solicitation to buy interests may only be made pursuant to a definitive agreement between Grey Value Management and an investor.
The information set forth in this synopsis has been obtained from publicly-available sources. It is provided for informational purposes only and should not be deemedas a recommendation to buy or sell the securities mentioned or to invest in any investment product. The information has not been independently verified by GreyValue Management or any of its affiliates. Neither Grey Value Management nor any of its affiliates makes any representations or warranties regarding, nor do theyassume any responsibility for the accuracy, reliability, completeness or applicability of, any information, calculations, estimates or projections contained or reflectedherein.
The information in this synopsis is provided as of the date hereof and is subject to change at any time thereafter.
Grey Value Management may have a position in any of the securities discussed in this presentation. Grey Value Management may reevaluate its holdings thereof and
AVON PRODUCTS, INC. (AVP):DING DONG, AVON SHARES CALLING?
FINANCIALS
September 2015
WWW.GREYVM.COM © PROPERTY OF GREY VALUE MANAGEMENT, LLC
Avon Products (AVP)Annual Cash Flow Statement 1999 - 2014
2014 2013 2012 2011 2010 2009 2008 2007 2006 2005 2004 2003 2002 2001 2000 1999Cash Flows from Operating ActivitiesNet income (loss) (384.9) (51.9) (38.2) 517.8 609.3 628.2 875.3 530.7 477.6 847.6 846.1 664.8 534.6 430.0 478.4 302.4Loss from discontinued operations, net of tax - 50.9 8.6 (14.1)Income (loss) from continuing operations (384.9) (1.0) (38.2) 526.4 595.2 628.2 875.3 530.7 477.6 847.6 846.1 664.8 534.6 430.0 478.4 302.4
Adjustments to reconcile net income (loss) to net cash provided by operating activitiesCumulative effect of accounting change 0.3 6.7Depreciation 141.3 164.8 162.4 174.0 145.2 133.0 141.9 128.9 115.6 106.5 103.5 94.4 96.3 109.1 97.1 83.0Amortization 51.3 59.8 67.2 65.6 49.6 47.7 45.3 43.2 44.0 33.1 30.2 29.1 28.5 Provision for doubtful accounts 192.5 239.3 251.1 247.2 215.7 221.7 195.5 164.1 144.7 135.6 140.0 124.8 108.3 105.6 94.3 87.5Provision for obsolescence 100.9 117.1 122.1 128.1 131.1 122.9 80.8 280.6 173.3 83.9 65.5 55.6Amortization of debt discount 1.6 1.6 9.7 18.1 14.9Share-based compensation 38.9 43.3 41.1 36.6 57.6 54.9 54.8 61.6 62.9Foreign exchange losses (gains) 42.4 26.3 (22.2) 12.8 1.3 (1.4) 18.7 (2.5) 4.0 (16.3) (1.1) 12.2 (20.3) 6.8 2.7 (0.9)Deferred income taxes 244.5 (128.6) (49.2) (196.6) (103.1) (162.7) (62.4) (112.4) (110.7) (31.7) (55.0) 22.7 31.1 (31.1) 13.5 (20.0)Net (gains) losses on investments (2.4) 13.5 (0.8) 0.5Non-cash restructuring charges 21.2Asset write-off restructuring charges 0.2 8.0Impairment of goodwill, intangible assets & SMT capitalized software 159.3 253.0 263.0Charge for Venezuelan monetary assets & liabilities 53.7 34.1 46.1Charge for Venezuelan non-monetary assets to net realizable value 115.7Special charges (3.2) (44.6) (7.6) 89.1 (18.3) 84.1Asset impairment charge 23.9 20.7Other 70.2 28.2 57.7 39.9 31.5 68.3 48.3 41.9 4.1 5.8 7.2 25.1 13.0 15.9 9.7
Changes in assets & liabilities:Accounts receivable (182.6) (235.3) (241.1) (241.5) (281.9) (261.0) (174.6) (254.5) (188.3) (163.5) (160.4) (140.8) (177.3) (155.5) (145.6) (132.7)Income tax receivable 95.2 (95.2)Inventories (155.4) (78.5) (89.7) (210.3) (189.8) (125.5) (174.3) (341.0) (233.9) (152.6) (115.3) (66.4) (29.4) (33.2) (103.3) (57.8)Prepaid expenses & other (61.6) 77.7 58.5 24.6 (3.3) (72.9) (153.3) (31.2) (18.9) (11.0) (60.0) (25.7) (20.2) (17.7) (30.7) 1.1Accounts payable & accrued liabilities 125.0 140.1 84.5 (55.7) 76.7 126.2 (148.9) 169.9 323.4 126.4 100.1 (7.9) 62.6 71.7 (62.3) 56.3Income & other taxes 47.9 3.4 (28.7) (50.7) (63.2) 16.0 47.5 61.6 40.3 (21.9) 10.3 5.1 41.2 38.4 81.5 27.6Noncurrent assets & liabilities (80.0) (110.4) (72.4) (107.6) (19.7) (13.4) (46.5) (151.3) (50.0) (66.8) (40.4) (12.0) (114.0) (8.5) (15.6) 24.3
Net cash provided by operating activities of continuing operations 359.8 539.6 556.1 655.8 689.0 782.0 748.1 589.8 796.1 895.5 882.6 745.3 565.4 754.9 323.9 464.6
Cash Flows from Investing ActivitiesCapital expenditures (131.1) (197.3) (228.8) (276.7) (331.2) (296.9) (380.5) (278.5) (174.8) (206.8) (250.1) (162.6) (126.5) (155.3) (193.5) (203.4)Disposal of assets 15.9 37.8 15.4 17.1 11.9 11.2 13.4 11.2 16.4 30.3 19.6 14.1 10.3 8.2 7.2 11.7Acquisitions and other investing activities (13.0) (785.8) (0.9) (19.0) (39.4) (156.6) (47.5) (20.4) (10.2) (5.0) (1.4) (16.5)Proceeds from sale of investments 36.9 14.3 1.2 33.7 11.3 61.9 41.4 46.1 (36.2) 97.9 28.6 28.2 33.8Purchases of investments (26.8) (28.2) (1.5) (28.8) (1.9) 5.8 (77.7) (47.0) 26.1 (107.9) (30.0) (37.7) (30.4)Net cash used by investing activities of continuing operations (105.1) (173.4) (213.7) (267.7) (1,095.7) (218.9) (403.4) (287.2) (207.9) (343.1) (279.4) (178.4) (123.0) (152.1) (187.7) (208.2)
Cash Flows from Financing ActivitiesCash dividends (110.2) (106.8) (329.3) (403.4) (384.1) (364.8) (347.7) (325.7) (317.6) (313.8) (269.7) (201.4) (191.2) (181.9) (178.2) (186.3)Book overdrafts 2.1 6.2 0.4 0.4 0.7 (1.6) (0.2) (13.5)Debt, net (maturities of 3 months or less) (28.8) (1.2) (710.5) 635.7 (3.6) (508.1) (216.9) 247.5 (375.0) 731.5 23.2 (2.6) (10.5) (23.0) (194.3) 227.2Proceeds from short-term debt 18.4 54.3 52.4 99.7 90.5 90.8Retirement of short-term debt (237.4) (481.7) (67.0) (89.1) (92.2) (69.4)Proceeds from debt 70.0 1,488.2 735.8 88.9 661.5 957.7 572.6 58.7 541.8 78.7 248.9 76.5 400.1 500.0Repayment of debt (140.2) (1,942.7) (138.3) (614.6) (53.2) (450.4) (73.9) (18.0) (31.3) (56.9) (0.2) (0.3) (0.2)Interest rate swap termination - 88.1 43.6Proceeds from exercise of stock options 0.2 19.4 8.6 16.8 23.9 13.1 81.4 85.5 32.5 61.4 122.3 100.6 64.7 49.1 38.4 23.9Excess tax benefit realized from share-based compensation (3.5) (2.4) (0.2) 4.3 (0.7) 15.1 19.6 8.1Other financing activity (101.4)Repurchase of common stock (9.8) (9.4) (8.8) (7.7) (14.1) (8.6) (172.1) (666.8) (355.1) (728.0) (224.2) (214.3) (178.6) (132.9) (68.1) (800.6)Net cash used by financing activities of continuing operations (218.8) (467.9) (401.3) (284.5) 234.7 (361.8) (141.5) (597.1) (490.4) (226.7) (567.0) (495.5) (331.8) (202.0) (119.0) (214.6)
Cash Flows from Discontinued OperationsNet cash provided (used) by operating activities of discontinued operations (4.0) - - 13.0Net cash provided (used) by investing activities of discontinued operations 84.8 - (1.2) 61.3Net cash used by financing activities of discontinued operations (0.3)Net cash provided by discontinued operations - 80.8 - (1.2) 74.0 - - - - - - - - - - -
Effect of exchange rate changes on cash and equivalents (183.3) (80.8) 23.4 (37.2) (33.7) 5.6 (61.9) 59.0 42.4 (36.6) 39.4 15.8 (12.3) (15.0) (11.9) (30.0)
Net decrease in cash & equivalents (147.4) (101.7) (35.5) 65.2 (131.7) 206.9 141.3 (235.5) 140.2 289.1 75.6 87.2 98.3 385.8 5.3 11.8
Cash and equivalents at beginning of year 1,107.9 1,209.6 1,245.1 1,179.9 1,311.6 1,104.7 963.4 1,198.9 1,058.7 796.6 694.0 606.8 508.5 122.7 117.4 105.6Cash and equivalents at end of year 960.5 1,107.9 1,209.6 1,245.1 1,179.9 1,311.6 1,104.7 963.4 1,198.9 1,058.7 769.6 694.0 606.8 508.5 122.7 117.4
Cash paid for:Interest, net of amounts capitalized 125.9 224.4 137.5 137.4 133.4 127.5 99.6 113.2 76.4 51.0 35.4 25.1 38.6 55.3 96.9 47.1Income taxes, net of refunds received 225.1 296.8 331.9 423.8 387.3 380.4 388.7 396.7 333.2 309.8 384.0 298.7 243.9 123.7 207.6 176.0
Diluted 433.4(0.25)
WWW.GREYVM.COM © PROPERTY OF GREY VALUE MANAGEMENT, LLC F1
Avon Products (AVP)Annual Balance Sheet Statement 1999 - 2014
2014 2013 2012 2011 2010 2009 2008 2007 2006 2005 2004 2003 2002 2001 2000 1999AssetsCurrent assetsCash, including cash equivalents 960.5 1,107.9 1,209.6 1,245.1 1,179.9 1,311.6 1,104.7 963.4 1,198.9 1,058.7 769.6 694.0 606.8 508.5 122.7 117.4Accounts receivable, less allowances 563.5 676.3 751.9 761.5 826.3 779.7 687.8 840.4 700.4 634.1 599.1 599.8 555.4 519.5 499.0 495.6Income tax receivable 95.2Inventories 822.2 1,005.6 1,135.4 1,161.3 1,152.9 1,067.5 1,007.9 1,041.8 900.3 801.7 740.5 653.4 614.7 612.5 610.6 523.5Prepaid expenses and other 618.3 689.3 832.0 930.9 1,025.2 1,030.5 756.5 669.8 534.8 426.4 397.2 278.9 271.3 248.6 218.2 201.3Current assets of discontinued operations
Total current assets 2,964.5 3,479.1 3,928.9 4,098.8 4,184.3 4,189.3 3,556.9 3,515.4 3,334.4 2,920.9 2,506.4 2,226.1 2,048.2 1,889.1 1,545.7 1,337.8
PP&E, at costLand 45.8 55.3 66.6 65.4 69.2 144.3 85.3 71.8 65.3 61.9 61.7 58.6 51.5 49.4 53.0 55.1Buildings and improvements 1,011.1 1,085.3 1,165.9 1,150.4 1,140.2 1,048.1 1,000.7 972.7 910.0 901.3 886.8 765.9 694.4 664.0 659.5 653.4Equipment 1,235.7 1,343.9 1,479.3 1,493.0 1,541.5 1,506.9 1,353.9 1,317.9 1,137.0 1,033.7 1,006.7 904.4 802.5 841.2 810.6 763.5
2,292.6 2,484.5 2,711.8 2,708.8 2,750.9 2,699.3 2,439.9 2,362.4 2,112.3 1,996.9 1,955.2 1,728.9 1,548.4 1,554.6 1,523.1 1,472.0Less accumulated depreciation (1,061.6) (1,091.2) (1,161.6) (1,137.3) (1,123.5) (1,169.7) (1,096.0) (1,084.2) (1,012.1) (946.1) (940.4) (873.3) (779.3) (779.7) (754.7) (737.2)
1,231.0 1,393.3 1,550.2 1,571.5 1,627.4 1,529.6 1,343.9 1,278.2 1,100.2 1,050.8 1,014.8 855.6 769.1 774.9 768.4 734.8
Goodwill 249.3 282.5 374.9 473.1 675.1Other intangible assets, net 33.5 120.3 279.9 368.3Other assets 1,052.0 1,303.9 1,408.2 1,311.7 1,018.6 1,113.8 1,173.2 922.6 803.6 791.6 626.9 480.6 510.2 529.1 512.3 456.0Noncurrent assets of discontinued operations
Total assets 5,496.8 6,492.3 7,382.5 7,735.0 7,873.7 6,832.7 6,074.0 5,716.2 5,238.2 4,763.3 4,148.1 3,562.3 3,327.5 3,193.1 2,826.4 2,528.6
Liabilities & Shareholders' EquityCurrent liabilitiesDebt maturing within one year 137.1 188.0 572.0 849.3 727.6 138.1 1,031.4 929.5 615.6 882.5 51.7 244.1 605.2 88.8 105.4 306.0Accounts payable 895.4 896.5 920.0 850.2 809.8 754.7 724.3 800.3 655.8 538.2 490.1 400.1 379.9 404.1 391.3 435.9Accrued compensation 210.5 271.2 266.6 217.1 293.2 291.0 234.4 285.8 266.9 226.1 164.5 149.5 175.7 145.2 138.2 165.8Other accrued liabilities 598.8 652.6 661.0 663.6 771.6 697.1 581.9 713.2 601.6 456.3 360.1 332.6 336.6 338.2 251.7 411.6Sales and taxes other than income 168.6 186.8 211.4 212.4 207.6 259.2 212.2 222.3 201.0 163.7 154.4 139.5 125.1 108.8 101.1 107.5Income taxes 36.8 45.4 73.6 98.4 146.5 134.7 128.0 102.3 209.2 234.8 304.7 321.9 353.0 375.9 371.6 286.0Current liabilities of discontinued operations
Total current liabilities 2,047.2 2,240.5 2,704.6 2,891.0 2,956.3 2,274.8 2,912.2 3,053.4 2,550.1 2,501.6 1,525.5 1,587.7 1,975.5 1,461.0 1,359.3 1,712.8
Long-term debt 2,463.9 2,532.7 2,623.9 2,459.1 2,408.6 2,307.8 1,456.2 1,167.9 1,170.7 766.5 866.3 877.7 767.0 1,236.3 1,108.2 701.4Employee benefit plans 501.8 398.0 637.6 603.0 561.3 588.9 665.4 388.7 504.9 484.2 620.6 502.1 560.4 436.6 397.2 398.1Long-term income taxes 77.8 53.3 52.0 67.0 128.9 173.8 168.9 208.7Deferred income taxes 30.1 34.3 12.1 50.6 35.4 30.6 31.3 36.7Other liabilities 100.8 140.3 131.1 129.7 146.0 174.8 196.4 185.9 192.0 182.5 173.4 172.9 116.9 103.2 95.2 85.7Share repurchase commitments 51.0Noncurrent liabilities of discontinued operations
Total liabilities 5,191.5 5,364.8 6,149.2 6,149.8 6,201.1 5,520.1 5,399.1 5,004.6 4,447.8 3,969.1 3,197.9 3,191.0 3,455.2 3,267.7 3,042.2 2,934.7
Commitments & contingenciesShareholders' equityCommon stock 187.6 189.4 188.3 187.3 186.6 186.1 185.6 184.7 183.5 182.9 182.2 90.3 89.6 89.1 88.6 88.1Additional paid-in capital 2,207.9 2,175.6 2,119.6 2,077.7 2,024.2 1,941.0 1,874.1 1,724.6 1,549.8 1,448.7 1,356.8 1,188.4 1,019.5 938.0 824.1 819.4Retained earnings 3,702.9 4,196.7 4,357.8 4,726.1 4,610.8 4,383.9 4,118.9 3,586.5 3,396.8 3,233.1 2,693.5 2,202.4 1,735.3 1,389.9 1,139.8 837.2Accumulated other comprehensive loss (1,217.6) (870.4) (876.7) (854.4) (605.8) (692.6) (965.9) (417.0) (656.3) (740.9) (679.5) (729.4) (791.4) (489.5) (399.1) (349.7)Treasury stock, at cost (4,591.0) (4,581.2) (4,571.9) (4,566.3) (4,559.3) (4,545.8) (4,537.8) (4,367.2) (3,683.4) (3,329.6) (2,602.8) (2,380.4) (2,180.7) (2,002.1) (1,869.2) (1,801.1)
Total Avon shareholders' equity 289.8 1,110.1 1,217.1 1,570.4 1,656.5 1,272.6 674.9 711.6 790.4 794.2 950.2 371.3 (127.7) (74.6) (215.8) (406.1)
Noncontrolling interests 15.5 17.4 16.2 14.8 16.1 40.0
Total shareholders' equity 305.3 1,127.5 1,233.3 1,585.2 1,672.6 1,312.6 674.9 711.6 790.4 794.2 950.2 371.3 (127.7) (74.6) (215.8) (406.1)Total liabilities & shareholders' equity 5,496.8 6,492.3 7,382.5 7,735.0 7,873.7 6,832.7 6,074.0 5,716.2 5,238.2 4,763.3 4,148.1 3,562.3 3,327.5 3,193.1 2,826.4 2,528.6
WWW.GREYVM.COM © PROPERTY OF GREY VALUE MANAGEMENT, LLC F2
Avon Products (AVP)Annual Income Statement 1999 - 2014
2014 2013 2012 2011 2010 2009 2008 2007 2006 2005 2004 2003 2002 2001 2000 1999Net sales 8,615.9 9,764.4 10,546.1 11,112.0 10,731.3 10,284.7 10,588.9 9,845.2 8,677.3 8,065.2 7,656.2 6,804.6 6,170.6 5,952.0 5,673.7 5,289.1
Other revenue 235.5 190.6 171.0 179.6 131.5 98.1 101.2 93.5 86.6 84.4 91.6 71.4 57.7 42.5 40.9Total revenue 8,851.4 9,955.0 10,717.1 11,291.6 10,862.8 10,382.8 10,690.1 9,938.7 8,763.9 8,149.6 7,747.8 6,876.0 6,228.3 5,994.5 5,714.6 5,289.1
Costs, expenses and other:Cost of sales 3,499.3 3,772.5 4,169.3 4,148.6 4,041.3 3,888.3 3,949.1 3,941.2 3,434.6 3,133.7 2,911.7 2,613.1 2,344.4 2,220.1 2,122.7 2,031.5SG&A 4,952.0 5,713.2 5,980.0 6,025.4 5,748.4 5,476.3 5,401.7 5,124.8 4,567.9 3,866.9 3,610.3 3,224.0 2,979.6 2,932.1 2,803.2 2,603.0Special charges, net (3.2) (3.9) 34.3 94.9 105.2Contract settlement gain, net (25.9)Asset impairment charge 23.9Impairment of goodwill & intangibles 42.1 253.0 263.0
Operating profit 400.1 427.2 314.8 854.6 1,073.1 1,018.2 1,339.3 872.7 761.4 1,149.0 1,229.0 1,042.8 870.0 749.4 788.7 549.4
Interest expense 111.1 120.6 104.3 92.9 87.1 104.8 100.4 112.2 99.6 54.1 33.8 33.3 52.0 71.1 84.7 43.2Loss on extinguishment of debt 86.0Interest income (14.8) (25.9) (15.1) (16.5) (14.0) (20.2) (37.1) (42.2) (55.3) (37.3) (20.6) (12.6) (15.2) (14.4) (8.5) (11.1)Other (income) expense, net 139.6 83.9 7.0 35.6 54.6 7.1 37.7 6.6 13.6 8.0 28.3 28.6 (2.4) 27.0 21.5 10.7
Total other expenses 235.9 264.6 96.2 112.0 127.7 91.7 101.0 76.6 57.9 24.8 41.5 49.3 34.4 83.7 97.7 42.8
Income from continuing operations, before taxes 164.2 162.6 218.6 742.6 945.4 926.5 1,238.3 796.1 703.5 1,124.2 1,187.5 993.5 835.6 665.7 691.0 506.6
Income taxes (549.1) (163.6) (256.8) (216.2) (350.2) (298.3) (362.7) (262.8) (223.4) (269.7) (330.6) (318.9) (292.3) (230.9) (201.7) (204.2)
(Loss) income from continuing ops, before taxes (384.9) (1.0) (38.2) 526.4 595.2 628.2 875.6 533.3 480.1 854.5 856.9 674.6 543.3 434.8 489.3 302.4
Loss from discontinued operations, net of tax (50.9) (8.6) 14.1Net (loss) income (384.9) (51.9) (38.2) 517.8 609.3 628.2 875.6 533.3 480.1 854.5 856.9 674.6 543.3 434.8 489.3 302.4
Net income attributable to to noncontrolling interests (3.7) (4.5) (4.3) (4.2) (3.0) (2.4) (0.3) (2.6) (2.5) (6.9) (10.8) (9.8) (8.7) (4.5) (4.2)Net (loss) income attributable to Avon (388.6) (56.4) (42.5) 513.6 606.3 625.8 875.3 530.7 477.6 847.6 846.1 664.8 534.6 430.3 485.1 302.4
Weighted-average shares outstanding:Basic 434.5 433.4 431.9 430.5 428.8 426.9 426.4 433.5 447.4 466.3 472.4 235.5 236.1 236.8 237.7 256.8Diluted 434.5 433.4 431.9 432.1 431.4 428.5 429.5 436.9 449.2 469.5 478.0 241.6 245.5 246.1 243.0 259.4
Earnings (loss) per share:Basic from contunuing operations (0.88)$ (0.01)$ (0.10)$ 1.20$ 1.37$Basic from discontinued operations (0.12)$ -$ (0.02)$ 0.04$Basic attributable to Avon (0.88)$ (0.13)$ (0.10)$ 1.18$ 1.40$ 1.45$ 2.05$ 1.22$ 1.07$ 1.82$ 1.79$ 2.82$ 2.26$ 1.82$ 2.01$ 1.18$
Diluted from contunuing operations (0.88)$ (0.01)$ (0.10)$ 1.20$ 1.36$Diluted from discontinued operations (0.12)$ -$ (0.02)$ 0.03$Diluted attributable to Avon (0.88)$ (0.13)$ (0.10)$ 1.18$ 1.39$ 1.45$ 2.04$ 1.21$ 1.06$ 1.81$ 1.77$ 2.78$ 2.22$ 1.82$ 1.99$ 1.17$
WWW.GREYVM.COM © PROPERTY OF GREY VALUE MANAGEMENT, LLC F3
Avon Products (AVP)Margin Analysis 1999 - 2014
2014 2013 2012 2011 2010 2009 2008 2007 2006 2005 2004 2003 2002 2001 2000 1999Net sales 8,615.9 9,764.4 10,546.1 11,112.0 10,731.3 10,284.7 10,588.9 9,845.2 8,677.3 8,065.2 7,656.2 6,804.6 6,170.6 5,952.0 5,673.7 5,289.1
Other revenue 235.5 190.6 171.0 179.6 131.5 98.1 101.2 93.5 86.6 84.4 91.6 71.4 57.7 42.5 40.9Total revenue 8,851.4 9,955.0 10,717.1 11,291.6 10,862.8 10,382.8 10,690.1 9,938.7 8,763.9 8,149.6 7,747.8 6,876.0 6,228.3 5,994.5 5,714.6 5,289.1
Costs, expenses and other:Cost of sales 3,499.3 3,772.5 4,169.3 4,148.6 4,041.3 3,888.3 3,949.1 3,941.2 3,434.6 3,133.7 2,911.7 2,613.1 2,344.4 2,220.1 2,122.7 2,031.5SG&A 4,952.0 5,713.2 5,980.0 6,025.4 5,748.4 5,476.3 5,401.7 5,124.8 4,567.9 3,866.9 3,610.3 3,224.0 2,979.6 2,932.1 2,803.2 2,603.0Special charges, net (3.2) (3.9) 34.3 94.9 105.2Contract settlement gain, net (25.9)Asset impairment charge 23.9Impairment of goodwill & intangibles 42.1 253.0 263.0
Operating profit 400.1 427.2 314.8 854.6 1,073.1 1,018.2 1,339.3 872.7 761.4 1,149.0 1,229.0 1,042.8 870.0 749.4 788.7 549.4
Margin Analysis (% of revenue)Operating profit 4.5% 4.3% 2.9% 7.6% 9.9% 9.8% 12.5% 8.8% 8.7% 14.1% 15.9% 15.2% 14.0% 12.5% 13.8% 10.4%Cost of sales 39.5% 37.9% 38.9% 36.7% 37.2% 37.4% 36.9% 39.7% 39.2% 38.5% 37.6% 38.0% 37.6% 37.0% 37.1% 38.4%SG&A 55.9% 57.4% 55.8% 53.4% 52.9% 52.7% 50.5% 51.6% 52.1% 47.4% 46.6% 46.9% 47.8% 48.9% 49.1% 49.2%
Note the large increase inSG&A.
Significant YOY decline.
WWW.GREYVM.COM © PROPERTY OF GREY VALUE MANAGEMENT, LLC F4

Avon Products (AVP)Quarterly Cash Flow Statement
2Q15 1Q15 4Q14 3Q14 2Q14 1Q14 4Q13 3Q13 2Q13 1Q13 4Q12 3Q12 2Q12 1Q12
Cash Flows from Operating Activities
Net income (loss) (116.7) (146.4) (384.9) (55.3) (147.3) (167.2) (51.9) 15.8 21.6 (12.6) (38.2) 122.9 90.3 27.6
Loss from discontinued operations, net of tax 50.9 50.9 51.5
Income (loss) from continuing operations (116.7) (146.4) (384.9) (55.3) (147.3) (167.2) (1.0) 66.7 73.1 (12.6) (38.2) 122.9 90.3 27.6
Adjustments to reconcile net income (loss) to net cash provided by operating activities
Cumulative effect of accounting change
Depreciation 60.7 31.8 141.3 144.8 97.7 47.0 164.8 174.9 119.8 57.0 162.4 172.2 118.3 60.5
Amortization 18.9 9.5 51.3 59.8 67.2
Provision for doubtful accounts 73.5 38.7 192.5 146.9 105.7 50.8 239.3 175.6 113.4 52.0 251.1 191.3 134.6 74.0
Provision for obsolescence 26.9 15.7 100.9 67.6 43.8 26.4 117.1 84.6 53.7 29.6 122.1 83.8 59.7 28.3
Amortization of debt discount -
Share-based compensation 11.9 (0.1) 38.9 28.4 24.9 11.5 43.3 35.9 26.2 11.8 41.1 34.7 23.2 10.7
Foreign exchange losses (gains) 6.4 6.4 42.4 26.3 (22.2)
Deferred income taxes 29.4 28.4 244.5 (87.9) (50.1) (10.4) (128.6) (49.2) (27.4) (2.8) (49.2) (102.0) (72.0) (26.2)
Net (gains) losses on investments
Non-cash restructuring charges
Asset write-off restructuring charges
Impairment of goodwill, intangible assets & SMT capitalized software 159.3 42.1 253.0 44.0
Charge for Venezuelan monetary assets & liabilities (4.2) (4.2) 53.7 53.7 53.7 53.7 34.1 34.1 34.1 34.1
Charge for Venezuelan non-monetary assets to their net realizable value 101.7 101.7 115.7 115.7 115.7 115.7
Special charges
Asset impairment charge
Other 20.9 9.0 70.2 76.9 54.5 16.1 28.2 43.4 30.1 21.6 57.7 44.4 21.0 13.4
Changes in assets & liabilities: -
Accounts receivable (79.9) (27.6) (182.6) (120.0) (91.0) (41.7) (235.3) (164.8) (103.3) (62.9) (241.1) (186.8) (94.7) (44.0)
Income tax receivable -
Inventories (81.4) (73.1) (155.4) (229.7) (126.4) (97.8) (78.5) (224.0) (154.3) (111.3) (89.7) (222.5) (166.7) (80.1)
Prepaid expenses & other (52.8) (6.7) (61.6) (64.1) (10.4) (41.3) 77.7 58.7 67.6 (0.5) 58.5 68.2 44.3 37.2
Accounts payable & accrued liabilities (69.5) (149.1) 125.0 100.0 14.6 (29.1) 140.1 (61.7) (65.8) (98.8) 84.5 73.0 (0.5) (60.7)
Income & other taxes (26.8) (14.1) 47.9 31.6 (10.0) (3.4) 3.4 (36.8) (28.6) (15.3) (28.7) (39.0) (73.5) (46.6)
Noncurrent assets & liabilities (28.9) (18.0) (80.0) (82.8) (82.5) (42.9) (110.4) (83.2) (68.9) (20.8) (72.4) (64.6) (42.9) (27.1)
Net cash provided by operating activities of continuing operations (109.9) (198.1) 359.8 125.8 (7.1) (112.6) 539.6 96.3 69.7 (118.9) 556.1 219.6 41.1 (33.0)
Cash Flows from Investing Activities
Capital expenditures (42.1) (22.4) (131.1) (88.2) (58.6) (29.6) (197.3) (118.2) (75.8) (43.5) (228.8) (134.9) (87.7) (45.7)
Disposal of assets 4.3 2.4 15.9 7.0 5.4 2.6 37.8 15.5 12.8 9.3 15.4 13.2 9.5 4.5
Acquisitions and other investing activities -
Proceeds from sale of investments 0.6 0.6 36.9 18.4 10.8 6.2 14.3 6.4 0.2 (4.2) 1.2 2.0
Purchases of investments (11.9) (4.6) (26.8) (22.9) (13.4) (5.8) (28.2) (23.7) (14.2) 2.5 (1.5) (1.9) (0.8) (0.1)
Net cash used by investing activities of continuing operations (49.1) (24.0) (105.1) (85.7) (55.8) (26.6) (173.4) (120.0) (77.0) (35.9) (213.7) (121.6) (79.0) (41.3)
Cash Flows from Financing Activities
Cash dividends (53.6) (26.2) (110.2) (81.9) (54.6) (28.7) (106.8) (79.8) (53.9) (26.2) (329.3) (300.6) (199.2) (100.0)
Book overdrafts -
Debt, net (maturities of 3 months or less) (5.9) (6.3) (28.8) 9.8 3.4 2.2 (1.2) 49.0 31.6 118.7 (710.5) (624.5) (343.1) 50.2
Proceeds from short-term debt -
Retirement of short-term debt -
Proceeds from debt 7.6 70.0 9.1 9.2 6.0 1,488.2 1,481.1 1,478.8 1,485.3 735.8 713.7 638.4 66.4
Repayment of debt (8.9) (2.9) (140.2) (95.3) (92.0) (17.0) (1,942.7) (1,927.9) (1,796.2) (1,173.3) (138.3) (90.0) (71.2) (41.1)
Interest rate swap termination - 88.1 88.1 88.1 88.1 43.6 43.6 43.6 43.6
Proceeds from exercise of stock options 0.2 0.2 0.2 0.2 19.4 18.2 16.8 9.5 8.6 7.9 7.6 4.2
Excess tax benefit realized from share-based compensation - (3.5) (0.7) 0.1 (0.1) (2.4) (3.4) (2.6) (2.2)
Other financing activity (5.8) -
Repurchase of common stock (2.5) (1.9) (9.8) (9.4) (8.6) (6.5) (9.4) (8.4) (7.6) (6.8) (8.8) (8.5) (8.1) (7.4)
Net cash used by financing activities of continuing operations (69.1) (37.3) (218.8) (167.5) (142.4) (43.8) (467.9) (380.4) (242.3) 495.2 (401.3) (261.8) 65.4 13.7
Cash Flows from Discontinued Operations
Net cash provided (used) by operating activities of discontinued operations (4.0) (4.0) (0.5)
Net cash provided (used) by investing activities of discontinued operations 84.8 84.8 (0.2)
Net cash used by financing activities of discontinued operations
Net cash provided by discontinued operations - - - - - - 80.8 80.8 (0.7) - - - - -
Effect of exchange rate changes on cash and equivalents (29.4) (32.2) (183.3) (154.5) (125.1) (129.8) (80.8) (78.0) (81.0) (61.6) 23.4 16.2 3.8 30.7
Net decrease in cash & equivalents (257.5) (291.6) (147.4) (281.9) (330.4) (312.8) (101.7) (401.3) (331.3) 278.8 (35.5) (147.6) 31.3 (29.9)
Cash and equivalents at beginning of year 960.5 960.5 1,107.9 1,107.9 1,107.9 1,107.9 1,209.6 1,209.6 1,209.6 1,209.6 1,245.1 1,245.1 1,245.1 1,245.1
Cash and equivalents at end of year 703.0 668.9 960.5 826.0 777.5 795.1 1,107.9 808.3 878.3 1,488.4 1,209.6 1,097.5 1,276.4 1,215.2
WWW.GREYVM.COM © PROPERTY OF GREY VALUE MANAGEMENT, LLC F5
Avon Products (AVP)Quarterly Balance Sheet
2Q15 1Q15 4Q14 3Q14 2Q14 1Q14 4Q13 3Q13 2Q13 1Q13 4Q12 3Q12 2Q12 1Q12AssetsCurrent assetsCash, including cash equivalents 696.9 668.9 960.5 826.0 777.5 795.1 1,107.9 808.3 873.2 1,488.4 1,209.6 1,097.5 1,276.4 1,215.2Accounts receivable, less allowances 523.7 509.4 563.5 590.0 634.0 632.3 676.3 690.2 691.7 742.9 751.9 758.8 714.1 760.1Income tax receivableInventories 818.7 824.5 822.2 994.0 965.7 944.8 1,005.6 1,200.0 1,154.3 1,214.2 1,135.4 1,302.7 1,244.8 1,250.8Prepaid expenses and other 632.3 589.9 618.3 679.4 663.3 689.1 689.3 733.5 707.6 787.1 832.0 856.6 917.8 917.8Assets of businesses held for sale 191.1Current assets of discontinued operations 36.1
Total current assets 2,862.7 2,592.7 2,964.5 3,089.4 3,040.5 3,061.3 3,479.1 3,432.0 3,462.9 4,232.6 3,928.9 4,015.6 4,153.1 4,143.9
PP&E, at cost 2,042.6 2,065.4 2,292.6 2,402.1 2,514.6 2,480.2 2,499.8 2,496.7 2,618.0 2,646.4 2,634.7 2,779.2Land 55.3 66.6Buildings and improvements 1,085.3 1,165.9Equipment 1,343.9 1,479.3
2,042.6 2,065.4 2,292.6 2,402.1 2,514.6 2,480.2 2,484.5 2,499.8 2,496.7 2,618.0 2,711.8 2,646.4 2,634.7 2,779.2Less accumulated depreciation (1,006.2) (1,007.6) (1,061.6) (1,102.4) (1,149.3) (1,111.7) (1,091.2) (1,110.6) (1,102.8) (1,116.9) (1,161.6) (1,142.0) (1,144.7) (1,189.9)
1,036.4 1,057.8 1,231.0 1,299.7 1,365.3 1,368.5 1,393.3 1,389.2 1,393.9 1,501.1 1,550.2 1,504.4 1,490.0 1,589.3
Goodwill 115.7 235.6 249.3 273.0 288.9 280.9 282.5 279.6 311.3 361.2 374.9 443.8 483.0 487.3Other intangible assets, net 33.0 33.5 33.1 36.4 115.8 120.3 263.3 268.2 275.0Other assets 973.8 986.2 1,052.0 1,428.3 1,420.5 1,341.2 1,303.9 1,394.4 1,413.4 1,363.0 1,408.2 1,424.9 1,308.3 1,287.8Noncurrent assets of discontinued operations 67.4
Total assets 4,988.6 4,872.3 5,496.8 6,090.4 6,115.2 6,084.9 6,492.3 6,528.3 6,685.3 7,573.7 7,382.5 7,652.0 7,702.6 7,783.3
Liabilities & Shareholders' EquityCurrent liabilitiesDebt maturing within one year 381.1 378.8 137.1 156.9 154.1 180.8 188.0 243.1 263.2 949.4 572.0 684.5 952.4 1,180.7Accounts payable 809.6 820.0 895.4 937.4 876.3 861.1 896.5 865.2 861.1 890.3 920.0 946.4 846.0 849.1Accrued compensation 180.2 167.2 210.5 216.9 213.2 203.9 271.2 266.5 241.1 222.3 266.6 245.6 226.8 214.1Other accrued liabilities 538.0 461.4 598.8 627.0 674.9 635.6 652.6 551.4 564.7 585.7 661.0 633.2 634.3 647.9Sales and taxes other than income 155.1 152.0 168.6 170.8 167.8 191.4 186.8 180.8 187.7 215.9 211.4 227.2 201.5 236.2Income taxes 2.1 27.4 36.8 44.1 21.2 22.8 45.4 47.8 46.4 43.8 73.6 41.3 9.9 26.1Liabilities of businesses held for sale 21.4Current liabilities of discontinued operations 16.1
Total current liabilities 2,087.5 2,006.8 2,047.2 2,153.1 2,107.5 2,095.6 2,240.5 2,154.8 2,180.3 2,907.4 2,704.6 2,778.2 2,870.9 3,154.1
Long-term debt 2,203.6 2,208.2 2,463.9 2,472.8 2,480.5 2,525.9 2,532.7 2,541.2 2,634.8 2,685.5 2,623.9 2,628.3 2,581.1 2,201.8Employee benefit plans 476.6 478.4 501.8 363.1 390.3 371.7 398.0 541.7 568.3 616.0 637.6 592.3 624.9 590.2Long-term income taxes 72.6 78.7 77.8 76.2 75.3 56.4 53.3 49.0 49.8 51.9 52.0 60.5 64.6 64.8Deferred income taxesOther liabilities 86.1 87.5 100.8 100.2 102.0 103.8 140.3 114.0 119.0 117.9 131.1 126.1 122.1 120.9Share repurchase commitmentsNoncurrent liabilities of discontinued operations 0.1
Total liabilities 4,926.4 4,859.6 5,191.5 5,165.4 5,155.6 5,153.4 5,364.8 5,400.7 5,552.3 6,378.7 6,149.2 6,185.4 6,263.6 6,131.8
Commitments & contingenciesShareholders' equityCommon stock 187.8 187.8 187.6 187.6 187.6 187.5 189.4 189.4 189.3 189.3 188.3 188.3 188.3 188.2Additional paid-in capital 2,219.0 2,206.1 2,207.9 2,199.0 2,196.2 2,184.5 2,175.6 2,169.2 2,159.5 2,138.3 2,119.6 2,111.5 2,100.7 2,089.0Retained earnings 3,531.9 3,529.3 3,702.9 4,060.6 3,995.3 4,002.4 4,196.7 4,292.1 4,323.8 4,318.1 4,357.8 4,544.3 4,613.3 4,652.3Accumulated other comprehensive loss (1,298.4) (1,333.6) (1,217.6) (948.0) (846.3) (871.1) (870.4) (959.3) (977.0) (889.2) (876.7) (821.3) (908.0) (719.5)Treasury stock, at cost (4,593.5) (4,592.8) (4,591.0) (4,590.5) (4,589.8) (4,587.7) (4,581.2) (4,580.1) (4,579.3) (4,578.6) (4,571.9) (4,571.5) (4,571.3) (4,573.9)
Total Avon shareholders' equity 46.8 (3.2) 289.8 908.7 943.0 915.6 1,110.1 1,111.3 1,116.3 1,177.9 1,217.1 1,451.3 1,423.0 1,636.1
Noncontrolling interests 15.4 15.9 15.5 16.3 17.1 15.9 17.4 16.3 16.7 17.1 16.2 15.3 16.0 15.4
Total shareholders' equity 62.2 12.7 305.3 925.0 960.1 931.5 1,127.5 1,127.6 1,133.0 1,195.0 1,233.3 1,466.6 1,439.0 1,651.5Total liabilities & shareholders' equity 4,988.6 4,872.3 5,496.8 6,090.4 6,115.7 6,084.9 6,492.3 6,528.3 6,685.3 7,573.7 7,382.5 7,652.0 7,702.6 7,783.3
WWW.GREYVM.COM © PROPERTY OF GREY VALUE MANAGEMENT, LLC F6

Avon Products (AVP)
Quarterly Income Statement
2Q15 1Q15 4Q14 3Q14 2Q14 1Q14 4Q13 3Q13 2Q13 1Q13 4Q12 3Q12 2Q12 1Q12Net sales 1,789.8 1,762.5 2,275.4 2,059.0 2,139.8 2,141.7 2,600.3 2,265.3 2,466.8 2,432.0 2,955.7 2,509.4 2,548.2 2,532.8Other revenue 33.6 31.7 65.6 79.2 48.8 41.9 39.2 57.6 42.1 51.7 43.40 41.5 43.5 42.6Total revenue 1,823.4 1,794.2 2,341.0 2,138.2 2,188.6 2,183.6 2,639.5 2,322.9 2,508.9 2,483.7 2,999.1 2,550.9 2,591.7 2,575.4
Costs, expenses and other:Cost of sales 713.4 707.3 919.3 813.9 810.7 955.4 1,023.8 871.7 935.4 941.6 1,204.5 990.5 964.5 1,009.8SG&A 1,018.2 1,124.5 1,251.8 1,136.4 1,284.7 1,279.1 1,631.0 1,340.9 1,371.3 1,370.0 1,574.9 1,410.4 1,500.6 1,494.1Special charges, netContract settlement gain, netAsset impairment chargeImpairment of goodwill & intangibles - 42.1 209.0 44.0
Operating profit 91.8 (37.6) 169.9 187.9 93.2 (50.9) (15.3) 68.2 202.2 172.1 10.7 106.0 126.6 71.5
Interest expense 31.0 28.6 27.4 27.5 28.7 27.5 29.8 30.3 31.1 29.4 27.50 27.3 24.9 24.6Loss on extinguishment of debt - 13.0 73.0Interest income (3.1) (3.0) (3.4) (3.8) (3.8) (3.8) (17.7) (3.4) (2.8) (2.0) (4.5) (3.8) (2.8) (3.9)Other (income) expense, net 0.8 19.4 50.8 19.8 2.6 66.4 14.2 9.7 15.6 44.4 (21.4) 4.6 13.8 10.0
Total other expenses 28.7 45.0 74.8 43.5 27.5 90.1 26.3 36.6 56.9 144.8 1.6 28.1 35.9 30.7
Income from continuing operations, before taxes 63.1 (82.6) 95.1 144.4 65.7 (141.0) (41.6) 31.6 145.3 27.3 9.1 77.9 90.7 40.8
Income taxes (33.4) (63.8) (424.7) (52.4) (45.8) (26.2) (25.0) (38.0) (60.7) (39.9) (170.3) (45.3) (28.0) (13.2)
(Loss) income from continuing ops, before taxes 29.7 (146.4) (329.6) 92.0 19.9 (167.2) (66.6) (6.4) 84.6 (12.6) (161.2) 32.6 62.7 27.6
Loss from discontinued operations, net of tax (1.1) 0.6 (50.4)Net (loss) income 29.7 (146.4) (329.6) 92.0 19.9 (167.2) (67.7) (5.8) 34.2 (12.6) (161.2) 32.6 62.7 27.6
Net income attributable to to noncontrolling interests (0.9) (0.9) (1.1) (0.6) (0.9) (1.1) (1.4) 0.3 (2.3) (1.1) (1.1) (1.0) (1.1) (1.1)Net (loss) income attributable to Avon 28.8 (147.3) (330.7) 91.4 19.0 (168.3) (69.1) (5.5) 31.9 (13.7) (162.3) 31.6 61.6 26.5
Weighted-average shares outstanding:Basic 435.3 435.1 434.5 434.7 434.6 434.4 433.4 433.8 433.7 433.1 431.9 432.2 432.1 431.8Diluted
(4Q figures derived by subtracting first three calendar quarters from annual totals provided in 10-Ks)
WWW.GREYVM.COM © PROPERTY OF GREY VALUE MANAGEMENT, LLC F7

Avon Products (AVP)
Modified Annual Income Statement 1999 - 2014
1999 2000 2001 2002 2003 2004 2005 2006 2007 2008 2009 2010 2011 2012 2013 2014Net sales 5,289.1 5,673.7 5,952.0 6,170.6 6,804.6 7,656.2 8,065.2 8,677.3 9,845.2 10,588.9 10,284.7 10,731.3 11,112.0 10,546.1 9,764.4 8,615.9Other revenue 40.9 42.5 57.7 71.4 91.6 84.4 86.6 93.5 101.2 98.1 131.5 179.6 171.0 190.6 235.5Total revenue 5,289.1 5,714.6 5,994.5 6,228.3 6,876.0 7,747.8 8,149.6 8,763.9 9,938.7 10,690.1 10,382.8 10,862.8 11,291.6 10,717.1 9,955.0 8,851.4
Costs, expenses and other:Cost of sales 2,031.5 2,122.7 2,220.1 2,344.4 2,613.1 2,911.7 3,133.7 3,434.6 3,941.2 3,949.1 3,888.3 4,041.3 4,148.6 4,169.3 3,772.5 3,499.3SG&A 2,603.0 2,803.2 2,932.1 2,979.6 3,224.0 3,610.3 3,866.9 4,567.9 5,124.8 5,401.7 5,476.3 5,748.4 6,025.4 5,980.0 5,713.2 4,952.0Special charges, net 105.2 94.9 34.3 (3.9) (3.2)Contract settlement gain, net (25.9)Asset impairment charge 23.9Impairment of goodwill & intangibles 263.0 253.0 42.1
Operating profit 654.6 788.7 842.3 904.3 1,038.9 1,225.8 1,149.0 761.4 872.7 1,339.3 1,018.2 1,073.1 1,117.6 567.8 469.3 400.1
Interest expense 43.2 84.7 71.1 52.0 33.3 33.8 54.1 99.6 112.2 100.4 104.8 87.1 92.9 104.3 120.6 111.1Loss on extinguishment of debt 86.0Interest income (11.1) (8.5) (14.4) (15.2) (12.6) (20.6) (37.3) (55.3) (42.2) (37.1) (20.2) (14.0) (16.5) (15.1) (25.9) (14.8)Other (income) expense, net 10.7 21.5 27.0 (2.4) 28.6 28.3 8.0 13.6 6.6 37.7 7.1 54.6 35.6 7.0 83.9 139.6
Total other expenses 42.8 97.7 83.7 34.4 49.3 41.5 24.8 57.9 76.6 101.0 91.7 127.7 112.0 96.2 178.6 235.9
Income from continuing operations, before taxes 611.8 691.0 758.6 869.9 989.6 1,184.3 1,124.2 703.5 796.1 1,238.3 926.5 945.4 1,005.6 471.6 290.7 164.2
Income taxes (not adjusted from historical figures) (204.2) (201.7) (230.9) (292.3) (318.9) (330.6) (269.7) (223.4) (262.8) (362.7) (298.3) (350.2) (216.2) (256.8) (163.6) (549.1)
(Loss) income from continuing ops, before taxes 407.6 489.3 527.7 577.6 670.7 853.7 854.5 480.1 533.3 875.6 628.2 595.2 789.4 214.8 127.1 (384.9)
Loss from discontinued operations, net of tax 14.1 (8.6) (50.9)Net (loss) income (adjusted as shown) 407.6 489.3 527.7 577.6 670.7 853.7 854.5 480.1 533.3 875.6 628.2 595.2 789.4 214.8 127.1 (384.9)
VS.Net (loss) income (historical) 302.4 489.3 434.8 543.3 674.6 856.9 854.5 480.1 533.3 875.6 628.2 609.3 517.8 (38.2) (51.9) (384.9)
Special charges losses & impairments 105.2 - 92.9 34.3 (3.9) (3.2) - - - - - - 263.0 253.0 42.1 -558.1
Assumptions:Normalized Net Income (MM) 600Shares Oustanding (dil.) 434.5Current Share Price: 4.00$Implied EPS 1.38$Implied P/E 2.9Implied Earnings Yield 34.5%
The issue for current investors is what constitutes "normalized" performance after so many years oftumult and "one-time" charges and impairments.
The blue row above shows net income adjusted to exclude special charges and impairments (graycells) versus reported net income (yellow row).
As shown at left, if one assumes normalized net income of $600 MM, based on the current priceand shares outstanding, the Company is trading at roughly 2.9 times earnings.
Gray cells show special charges and impairments reversed in these calculations.
WWW.GREYVM.COM © PROPERTY OF GREY VALUE MANAGEMENT, LLC F8
Avon Products (AVP)Free Cash Flow Analysis
FCF: Net Income- Based 1999 2000 2001 2002 2003 2004 2005 2006 2007 2008 2009 2010 2011 2012 2013 2014 TOTAL
Net (loss) income attributable to Avon 302.4 485.1 430.3 534.6 664.8 846.1 847.6 477.6 530.7 875.3 625.8 606.3 513.6 (42.5) (56.4) (388.6)+ Depreciation 83.0 97.1 109.1 96.3 94.4 103.5 106.5 115.6 128.9 141.9 133.0 145.2 174.0 162.4 164.8 141.3+ Amortization 28.5 29.1 30.2 33.1 44.0 43.2 45.3 47.7 49.6 65.6 67.2 59.8 51.3- Cap Ex (203.4) (193.5) (155.3) (126.5) (162.6) (250.1) (206.8) (174.8) (278.5) (380.5) (296.9) (331.2) (276.7) (228.8) (197.3) (131.1)
Free Cash Flow 182.0 388.7 384.1 532.9 625.7 729.7 780.4 462.4 424.3 682.0 509.6 469.9 476.5 (41.7) (29.1) (327.1) 6,250.3
Special Charges / Impairments 105.2 94.9 34.3 263.0 253.0 42.1Free Cash Flow 287.2 388.7 479.0 567.2 625.7 729.7 780.4 462.4 424.3 682.0 509.6 469.9 739.5 211.3 13.0 (327.1)
(adjusted for special charges)
Shares Outstanding (MM; diluted) 259.4 243.0 246.1 245.5 241.6 478.0 469.5 449.2 436.9 429.5 428.5 431.4 432.1 431.9 433.4 434.5FCF (adj.) per Share 1.11$ 1.60$ 1.95$ 2.31$ 2.59$ 1.53$ 1.66$ 1.03$ 0.97$ 1.59$ 1.19$ 1.09$ 1.71$ 0.49$ 0.03$ (0.75)$
Deconstructed OCF 1999 2000 2001 2002 2003 2004 2005 2006 2007 2008 2009 2010 2011 2012 2013 2014 TOTAL
Operating Cash Flow 464.6 323.9 754.9 565.4 745.3 882.6 895.5 796.1 589.8 748.1 782.0 689.0 655.8 556.1 539.6 359.8 10,348.5- Cap Ex (203.4) (193.5) (155.3) (126.5) (162.6) (250.1) (206.8) (174.8) (278.5) (380.5) (296.9) (331.2) (276.7) (228.8) (197.3) (131.1) (3,594.0)OCF Minus Cap Ex 261.2 130.4 599.6 438.9 582.7 632.5 688.7 621.3 311.3 367.6 485.1 357.8 379.1 327.3 342.3 228.7 6,754.5
- Dividends (186.3) (178.2) (181.9) (191.2) (201.4) (269.7) (313.8) (317.6) (325.7) (347.7) (364.8) (384.1) (403.4) (329.3) (106.8) (110.2) (4,212.1)OCF Minus Cap Ex & Dividends 74.9 (47.8) 417.7 247.7 381.3 362.8 374.9 303.7 (14.4) 19.9 120.3 (26.3) (24.3) (2.0) 235.5 118.5 2,542.4
- Share Repurchases (800.6) (68.1) (132.9) (178.6) (214.3) (224.2) (728.0) (355.1) (666.8) (172.1) (8.6) (14.1) (7.7) (8.8) (9.4) (9.8) (3,599.1)OCF Minus Cap Ex, Dividends (725.7) (115.9) 284.8 69.1 167.0 138.6 (353.1) (51.4) (681.2) (152.2) 111.7 (40.4) (32.0) (10.8) 226.1 108.7 (1,056.7)
& Repurchases
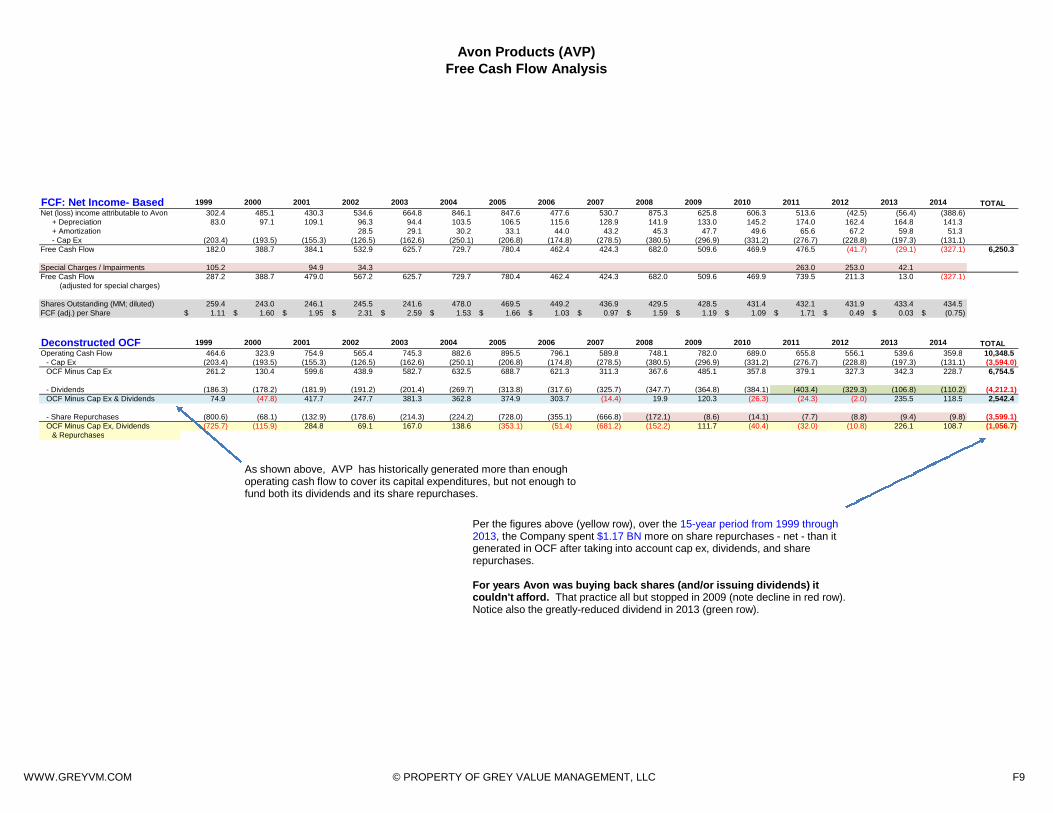
Per the figures above (yellow row), over the 15-year period from 1999 through2013, the Company spent $1.17 BN more on share repurchases - net - than itgenerated in OCF after taking into account cap ex, dividends, and sharerepurchases.
For years Avon was buying back shares (and/or issuing dividends) itcouldn't afford. That practice all but stopped in 2009 (note decline in red row).Notice also the greatly-reduced dividend in 2013 (green row).
As shown above, AVP has historically generated more than enoughoperating cash flow to cover its capital expenditures, but not enough tofund both its dividends and its share repurchases.
WWW.GREYVM.COM © PROPERTY OF GREY VALUE MANAGEMENT, LLC F9
Avon Products (AVP)
Revenue and Operating Profits by Region
Revenue 2014 2013 2012 2011 2010 2009 2008 2007 2006 2005 2004 2003 2002 2001 2000 1999
Latin America 4,239.5 4,840.5 4,993.7 5,116.0 4,589.5 4,103.2 3,884.1 3,298.9 2,743.4 2,272.6 1,932.8 1,747.2 1,700.1 1,899.6 1,840.8 1,607.7Europe, Middle East & Africa 2,705.8 2,898.4 2,914.2 1,542.2 1,462.1 1,277.8 1,351.7 1,308.6 1,123.7 2,291.4 2,095.0 1,607.2 1,228.6 1,009.6 885.6 878.0Central and Eastern Europe 1,580.6 1,585.8 1,500.1 1,719.5 1,577.8 1,320.2North America 1,203.4 1,458.2 1,906.8 2,110.4 2,244.0 2,262.7 2,492.7 2,622.1 2,554.0 2,510.5 2,568.1 2,526.8 2,412.2 2,273.2 2,147.9 2,083.3Asia Pacific 702.7 757.9 902.4 942.4 752.4 885.6 891.2 850.8 810.8 1,075.1 1,060.3 923.4 829.7 771.4 799.4 720.1China 229.0 353.4 350.9 280.5 211.8Total revenue from operations 8,851.4 9,955.0 10,717.1 11,291.6 10,862.8 10,382.8 10,690.1 9,938.7 8,763.9 8,149.6 7,656.2 6,804.6 6,170.6 5,953.8 5,673.7 5,289.1Global & other expensesSpecial charges, netTotal revenue from operations 8,851.4 9,955.0 10,717.1 11,291.6 10,862.8 10,382.8 10,690.1 9,938.7 8,763.9 8,149.6 7,656.2 6,804.6 6,170.6 5,953.8 5,673.7 5,289.1
Latin America 48% 49% 47% 45% 42% 40% 36% 33% 31% 28% 25% 26% 28% 32% 32% 30%Europe, Middle East & Africa 31% 29% 27% 14% 13% 12% 13% 13% 13% 28% 27% 24% 20% 17% 16% 17%Central and Eastern Europe 15% 14% 16% 16% 15% 0% 0% 0% 0% 0% 0% 0%North America 14% 15% 18% 19% 21% 22% 23% 26% 29% 31% 34% 37% 39% 38% 38% 39%Asia Pacific 8% 8% 8% 8% 7% 9% 8% 9% 9% 13% 14% 14% 13% 13% 14% 14%China 2% 3% 3% 3% 2% 0% 0% 0% 0% 0% 0% 0%
Operating Profit (Loss) 2014 2013 2012 2011 2010 2009 2008 2007 2006 2005 2004 2003 2002 2001 2000 1999
Latin America 279.8 478.6 443.9 630.4 604.7 647.9 690.3 483.1 424.0 516.0 479.1 406.3 378.8 427.5 415.5 353.6Europe, Middle East & Africa 300.9 406.7 312.8 183.7 176.5 84.2 121.0 33.9 (17.8) 458.9 471.7 313.4 212.4 167.0 129.5 126.2Central and Eastern Europe 295.2 297.8 244.9 346.2 296.1 296.7North America (72.5) (60.1) (214.9) (184.4) 155.9 110.4 213.9 213.1 181.6 353.5 411.4 425.9 431.0 380.2 368.2 374.0Asia Pacific 20.9 (12.1) 5.1 81.4 93.4 74.2 102.4 64.3 42.5 141.5 192.7 156.6 133.9 112.6 117.8 102.1China (10.8) 20.1 17.7 2.0 (10.8)Total operating profit 529.1 813.1 546.9 1,006.3 1,317.5 1,181.7 1,491.5 1,092.5 916.2 1,469.9 1,554.9 1,302.2 1,156.1 1,087.3 1,031.0 955.9Global & other expenses (129.0) (385.9) (232.1) (151.7) (244.4) (163.5) (152.2) (219.8) (154.8) (320.9) (329.1) (263.3) (249.8) (242.5) (242.3) (255.3)Special charges, net 3.2 3.9 (36.3) (95.4) (151.2)Total operating profit, net 400.1 427.2 314.8 854.6 1,073.1 1,018.2 1,339.3 872.7 761.4 1,149.0 1,229.0 1,042.8 870.0 749.4 788.7 549.4
Latin America 53% 59% 81% 63% 46% 55% 46% 44% 46% 35% 31% 31% 33% 39% 40% 37%Europe, Middle East & Africa 57% 50% 57% 18% 13% 7% 8% 3% -2% 31% 30% 24% 18% 15% 13% 13%Central and Eastern Europe 23% 21% 23% 27% 32% 0% 0% 0% 0% 0% 0% 0%North America -14% -7% -39% -18% 12% 9% 14% 20% 20% 24% 26% 33% 37% 35% 36% 39%Asia Pacific 4% -1% 1% 8% 7% 6% 7% 6% 5% 10% 12% 12% 12% 10% 11% 11%China -1% 2% 1% 0% -1% 0% 0% 0% 0% 0% 0% 0%
In 2012, Central and Eastern Europe incorporated into what was Western Europe, Middle East & Africa.In 2011, China was incorporated into Asia Pacific.
WWW.GREYVM.COM © PROPERTY OF GREY VALUE MANAGEMENT, LLC F10