award number: w81xwh-13-1-0361 a novel tumor antigen … · award number: w81xwh-13-1-0361 title: a...
TRANSCRIPT
AWARD NUMBER: W81XWH-13-1-0361
TITLE: A Novel Tumor Antigen and Foxp3 Dual-Targeting Tumor Cell Vaccine Enhances the Immunotherapy in a Murine Model of Renal Cell Carcinoma
PRINCIPAL INVESTIGATOR: Li Shen Ph.D.
CONTRACTING ORGANIZATION: Health Research, Inc.
Buffalo, NY 14263
REPORT DATE: December 2015
TYPE OF REPORT: Final Report
PREPARED FOR: U.S. Army Medical Research and Materiel Command Fort Detrick, Maryland 21702-5012
DISTRIBUTION STATEMENT: Approved for Public Release; Distribution Unlimited
The views, opinions and/or findings contained in this report are those of the author(s) and should not be construed as an official Department of the Army position, policy or decision unless so designated by other documentation.
1

REPORT DOCUMENTATION PAGE Form Approved
OMB No. 0704-0188 Public reporting burden for this collection of information is estimated to average 1 hour per response, including the time for reviewing instructions, searching existing data sources, gathering and maintaining the data needed, and completing and reviewing this collection of information. Send comments regarding this burden estimate or any other aspect of this collection of information, including suggestions for reducing this burden to Department of Defense, Washington Headquarters Services, Directorate for Information Operations and Reports (0704-0188), 1215 Jefferson Davis Highway, Suite 1204, Arlington, VA 22202-4302. Respondents should be aware that notwithstanding any other provision of law, no person shall be subject to any penalty for failing to comply with a collection of information if it does not display a currently valid OMB control number. PLEASE DO NOT RETURN YOUR FORM TO THE ABOVE ADDRESS. 1. REPORT DATEDecember 2015
2. REPORT TYPEFinal
3. DATES COVERED 15 Sep 2013 - 14 Sep 2015
4. TITLE AND SUBTITLEA Novel Tumor Antigen and Foxp3 Dual-Targeting Tumor Cell Vaccine
5a. CONTRACT NUMBER
Enhances the Immunotherapy in a Murine Model of Renal Cell Carcinoma 5b. GRANT NUMBER W81XWH-13-1-03615c. PROGRAM ELEMENT NUMBER
6. AUTHOR(S)
5d. PROJECT NUMBER
Li Shen 5e. TASK NUMBER
E-Mail: [email protected]
5f. WORK UNIT NUMBER
7. PERFORMING ORGANIZATION NAME(S) AND ADDRESS(ES)
8. PERFORMING ORGANIZATION REPORTNUMBER
Health Research Incorporated, Roswell Park Cancer Institute Buffalo, New York 14263-0001
9. SPONSORING / MONITORING AGENCY NAME(S) AND ADDRESS(ES) 10. SPONSOR/MONITOR’S ACRONYM(S)
U.S. Army Medical Research and Materiel Command Fort Detrick, Maryland 21702-5012 11. SPONSOR/MONITOR’S REPORT
NUMBER(S)
12. DISTRIBUTION / AVAILABILITY STATEMENT
Approved for Public Release; Distribution Unlimited
13. SUPPLEMENTARY NOTES
14. ABSTRACTA major barrier in vaccine therapy is represented by the presence of immunosuppressive factors predominant in cancer patients, such as regulatory T cells (Tregs) and suppressive myeloid cells, including myeloid derived suppressor cells (MDSCs) and tumor associated macrophages (TAMs). Here we report a tumor cell vaccine designed to target both tumor cells and Tregs by using Foxp3, a Treg-functional protein as an antigen in tumor cell vaccine.
During first year of the project, we have demonstrated that the dual target vaccine had anti-tumor activity against established tumor. During last year, we tested a combination strategy to target suppressive myeloid cells (MDSCs and TAMs) with a pharmacological approach, tasquinimod, combined with dual targeting vaccine. The combination strategy prolonged survival, compared to vaccine single treatment. Overall, our results suggest that targeting immunosuppressive cells with vaccine or pharmacological strategies, results in greater anti-tumor activity and therapeutic efficacy, and provides foundation to test the strategy in clinical setting for patients with advanced, metastatic kidney cancer.
15. SUBJECT TERMSRenal Cell carcinoma (RCC), Tumor Cell Vaccine, Regulatory T cells (Tregs),Myeloid Derived Suppressor Cells (MDSCs), Tumor Associated Macrophage (TAMs),Tumor Microenviroment 16. SECURITY CLASSIFICATION OF: 17. LIMITATION
OF ABSTRACT 18. NUMBEROF PAGES
19a. NAME OF RESPONSIBLE PERSONUSAMRMC
a. REPORT
U
b. ABSTRACT
U
c. THIS PAGE
U UU 56
19b. TELEPHONE NUMBER (include area code)
Standard Form 298 (Rev. 8-98) Prescribed by ANSI Std. Z39.18
2
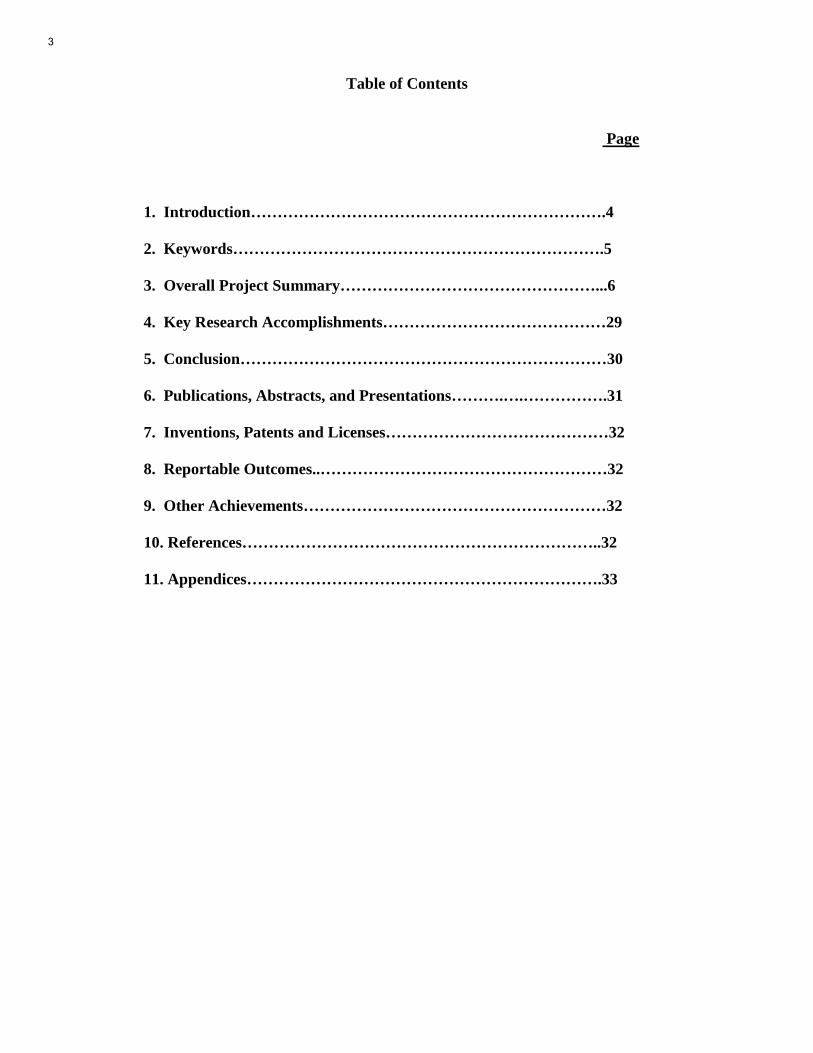
Table of Contents
Page
1. Introduction………………………………………………………….4
2. Keywords…………………………………………………………….5
3. Overall Project Summary…………………………………………...6
4. Key Research Accomplishments……………………………………29
5. Conclusion……………………………………………………………30
6. Publications, Abstracts, and Presentations……….….…………….31
7. Inventions, Patents and Licenses……………………………………32
8. Reportable Outcomes..………………………………………………32
9. Other Achievements…………………………………………………32
10. References…………………………………………………………..32
11. Appendices………………………………………………………….33
3

Introduction: Renal cell carcinoma (RCC) is the most common type of kidney cancer and a relatively more immunogenic cancer, as compared to other types of cancer. Therefore, immunotherapy such as cytokine and vaccine therapy represents an interest for treatment of RCC. A major barrier in vaccine therapy is represented by the presence of immunosuppressive factors predominant in cancer patients, such as regulatory T cells (Tregs) and suppressive myeloid cells, including myeloid derived suppressor cells (MDSCs) and tumor associated macrophages (TAMs). Here we report a tumor cell vaccine designed to target both tumor cells and Tregs by using Foxp3, a Treg-functional protein as an antigen in tumor cell vaccine. The vaccine is tested in a mouse orthotopic, syngeneic kidney cancer model, and in different treatment schedules. During first year of the project, we have demonstrated that the dual target vaccine had anti-tumor activity against established tumor. During last year, we tested a combination strategy to target suppressive myeloid cells (MDSCs and TAMs) with a pharmacological approach, tasquinimod, combined with dual targeting vaccine. The combination strategy prolonged survival, compared to vaccine single treatment. Overall, our results suggest that targeting immunosuppressive cells with vaccine or pharmacological strategies, results in greater anti-tumor activity and therapeutic efficacy, and provides foundation to test the strategy in clinical setting for patients with advanced, metastatic kidney cancer. .
4
Keywords:
Renal Cell carcinoma (RCC)
Tumor Cell Vaccine
Regulatory T cells (Tregs)
Myeloid Derived Suppressor Cells (MDSCs)
Tumor Associated Macrophage (TAMs)
Tumor Microenviroment
RNA sequencing
5
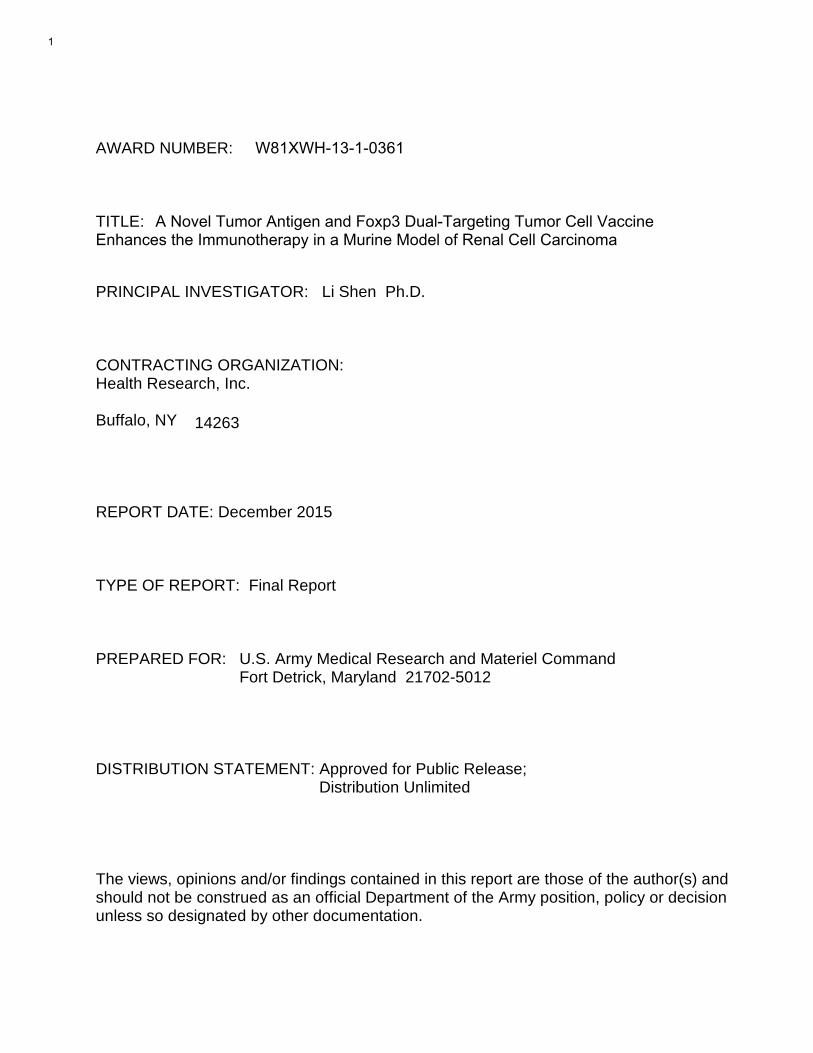
Overall project Summary: During the first year period of the project, we’ve determined the anti-tumor activity of the dual-targeting tumor cell vaccine in a murine RCC model, RENCA, and to evaluate the immuno-modulatory activity of the vaccine in the model (see Appendix 1, fist annual report). We discovered that in a prevention treatment schedule, both RENCA cell lysate vaccine and Foxp3 RENCA cell vaccine (the dual targeting vaccine) can inhibit the tumor growth. However, in an intervention treatment schedule, only Foxp3 RENCA vaccine had anti-tumor activity against established tumor orthotopic.growth. In addition, Foxp3 RENCA vaccine reduced tumor infiltrating Tres without affect peripheral Treg accumulation. Our analysis of tumor microenvironment indicate RENCA tumor accumulate myeloid suppressive cells, which are much more abundant than Tregs in tumor. Foxp3 RENCA vaccine therapy didn’t affect these immunosuppressive myeloid populations. This supports our rationale to target these populations to enhance anti-tumor activity of vaccine, which is the plan for second year award period. These experiments of the second year are listed as part of the specific Aim1, Aim 2, and part of specific Aim3. Here I summarize our activities and accomplishment as listed under the Specific Aims and Tasks. Specific Aim 1: To determine the anti-tumor activity of the dual-targeting tumor cell vaccine in a murine orthotopic RCC model, RENCA. (Month 1-14) Task 1: Generate a RENCA Foxp3 cell line. (Month 1-4) (accomplished during first year period) Task 2: Vaccine generation. (Month 5-10) (accomplished during first year period) Task 3: Conduct therapy experiment to test the RENCA Foxp3 cell derived vaccines in the orthotopic RENCA models. (Month 5-10) Task 4: Correlated studies. (Month 5-12) Task 5: Data collection and statistical analysis. (Month 10-12) During first award period, all the tasks in specific Aim 1 were accomplished except for test vaccine in dendritic cell (DC) form. There was a delay on DC vaccine during first year, as we hoped to further improve RENCA model to a metastatic model, with nephrectomy procedure. However, the development of lung metastasis is still not consistent. So we performed vaccine therapy in the second year period. Again, majority of task 4 was in parallel with Task 5. The end part of Task 4 and the Task 5 will be data analysis of experiments in Task3. Therefore, the accomplishment from these tasks is summarized together here. First, we compared the anti-tumor activity of RENCA Foxp3 vaccine in form of DCs with that of vaccine in lysate form. In this experiement, tumor lysate vaccine was prepared as before. RENCA Foxp3 cells were sonicated in PBS without carrier protein, and then the lysates were mixed with Montanide® and injected with GM-CSF. To produce RENCA Foxp3 vaccine, mouse bone marrow cells were isolated from femurs, and put in culture supplemented with 20ng/ml GM-CSF. Lymphocytes and granulocytes floated and were discard from the culture after 2 or 4 days, respectively. On day 6, the DCs were collected and pulsed with RENCA Foxp3 cell lysate for 1.5 hours, and re-plated in 10cm plates with 20ng/ml GM-CSF and 40ng/ml CD40L overnight to promote maturation. Each mouse received 1 x 10⁶ pulsed, mature DCs. Immuno-fluorescent staining and flow cytometry have been performed to phenotype resulted DCs (Figure 1). Result showed that 89.3% of live cells derived from bone marrow are CD11c+ dendritic cells (Fig. 1A). In DC cells, 43% were expressing antigen presenting molecule MHC and 45% were expressing co-stimulation molecule CD86 (Fig. 1B). This indicates that we’ve successfully derived DCs from marrow, and substantial portion of DCs are activated, mature,
6
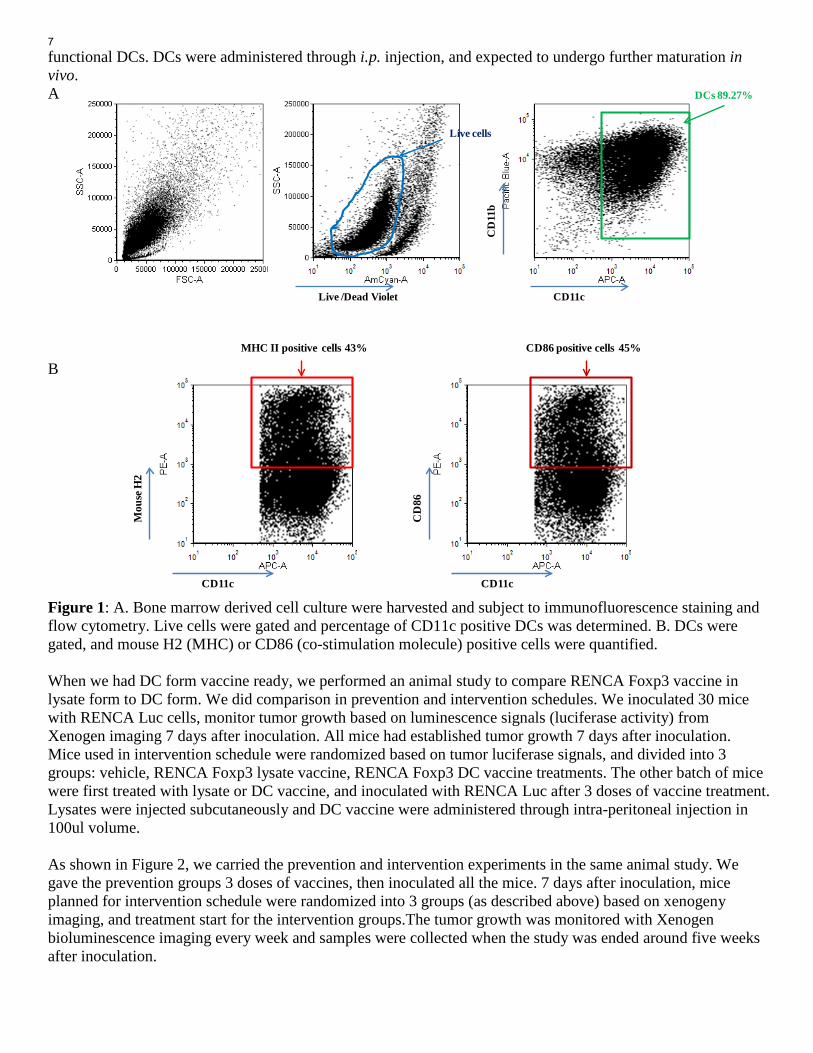
functional DCs. DCs were administered through i.p. injection, and expected to undergo further maturation in vivo. A B Figure 1: A. Bone marrow derived cell culture were harvested and subject to immunofluorescence staining and flow cytometry. Live cells were gated and percentage of CD11c positive DCs was determined. B. DCs were gated, and mouse H2 (MHC) or CD86 (co-stimulation molecule) positive cells were quantified. When we had DC form vaccine ready, we performed an animal study to compare RENCA Foxp3 vaccine in lysate form to DC form. We did comparison in prevention and intervention schedules. We inoculated 30 mice with RENCA Luc cells, monitor tumor growth based on luminescence signals (luciferase activity) from Xenogen imaging 7 days after inoculation. All mice had established tumor growth 7 days after inoculation. Mice used in intervention schedule were randomized based on tumor luciferase signals, and divided into 3 groups: vehicle, RENCA Foxp3 lysate vaccine, RENCA Foxp3 DC vaccine treatments. The other batch of mice were first treated with lysate or DC vaccine, and inoculated with RENCA Luc after 3 doses of vaccine treatment. Lysates were injected subcutaneously and DC vaccine were administered through intra-peritoneal injection in 100ul volume. As shown in Figure 2, we carried the prevention and intervention experiments in the same animal study. We gave the prevention groups 3 doses of vaccines, then inoculated all the mice. 7 days after inoculation, mice planned for intervention schedule were randomized into 3 groups (as described above) based on xenogeny imaging, and treatment start for the intervention groups.The tumor growth was monitored with Xenogen bioluminescence imaging every week and samples were collected when the study was ended around five weeks after inoculation.
Live /Dead Violet
Live cells
DCs 89.27%
CD11c
CD
11b
CD11c
Mou
se H
2
CD11c
CD
86
MHC II positive cells 43% CD86 positive cells 45%
7
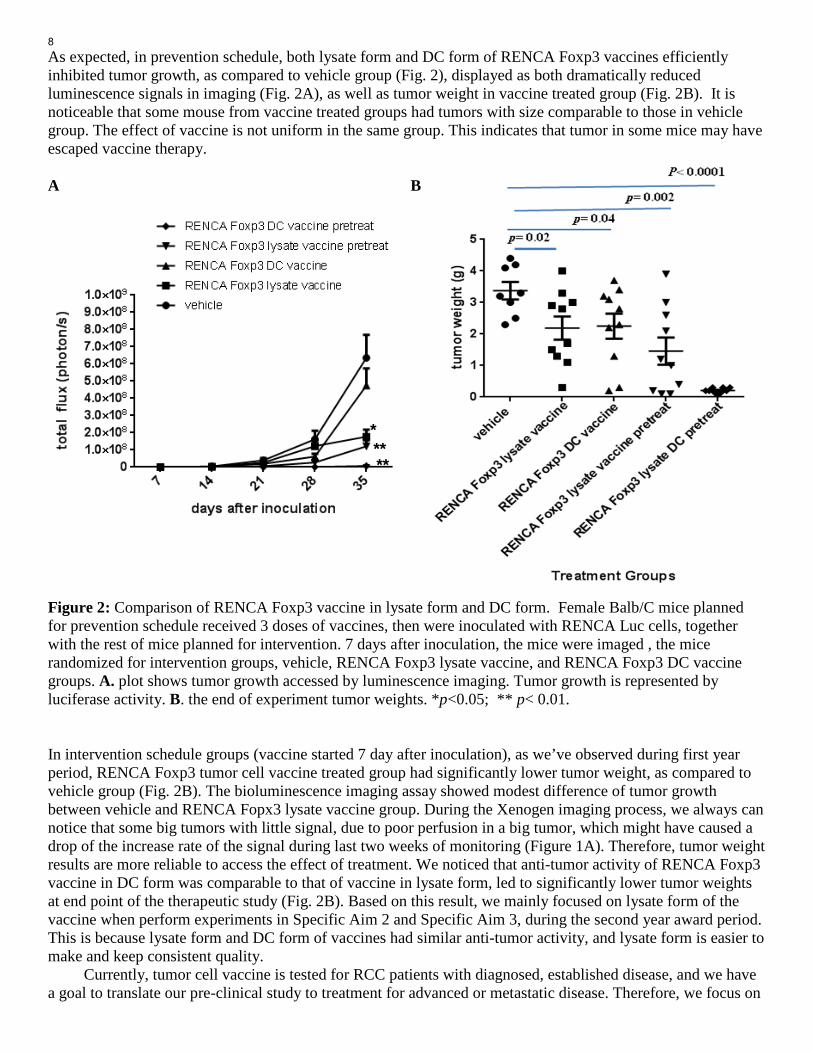
As expected, in prevention schedule, both lysate form and DC form of RENCA Foxp3 vaccines efficiently inhibited tumor growth, as compared to vehicle group (Fig. 2), displayed as both dramatically reduced luminescence signals in imaging (Fig. 2A), as well as tumor weight in vaccine treated group (Fig. 2B). It is noticeable that some mouse from vaccine treated groups had tumors with size comparable to those in vehicle group. The effect of vaccine is not uniform in the same group. This indicates that tumor in some mice may have escaped vaccine therapy. A B Figure 2: Comparison of RENCA Foxp3 vaccine in lysate form and DC form. Female Balb/C mice planned for prevention schedule received 3 doses of vaccines, then were inoculated with RENCA Luc cells, together with the rest of mice planned for intervention. 7 days after inoculation, the mice were imaged , the mice randomized for intervention groups, vehicle, RENCA Foxp3 lysate vaccine, and RENCA Foxp3 DC vaccine groups. A. plot shows tumor growth accessed by luminescence imaging. Tumor growth is represented by luciferase activity. B. the end of experiment tumor weights. *p<0.05; ** p< 0.01. In intervention schedule groups (vaccine started 7 day after inoculation), as we’ve observed during first year period, RENCA Foxp3 tumor cell vaccine treated group had significantly lower tumor weight, as compared to vehicle group (Fig. 2B). The bioluminescence imaging assay showed modest difference of tumor growth between vehicle and RENCA Fopx3 lysate vaccine group. During the Xenogen imaging process, we always can notice that some big tumors with little signal, due to poor perfusion in a big tumor, which might have caused a drop of the increase rate of the signal during last two weeks of monitoring (Figure 1A). Therefore, tumor weight results are more reliable to access the effect of treatment. We noticed that anti-tumor activity of RENCA Foxp3 vaccine in DC form was comparable to that of vaccine in lysate form, led to significantly lower tumor weights at end point of the therapeutic study (Fig. 2B). Based on this result, we mainly focused on lysate form of the vaccine when perform experiments in Specific Aim 2 and Specific Aim 3, during the second year award period. This is because lysate form and DC form of vaccines had similar anti-tumor activity, and lysate form is easier to make and keep consistent quality. Currently, tumor cell vaccine is tested for RCC patients with diagnosed, established disease, and we have a goal to translate our pre-clinical study to treatment for advanced or metastatic disease. Therefore, we focus on
*****
8
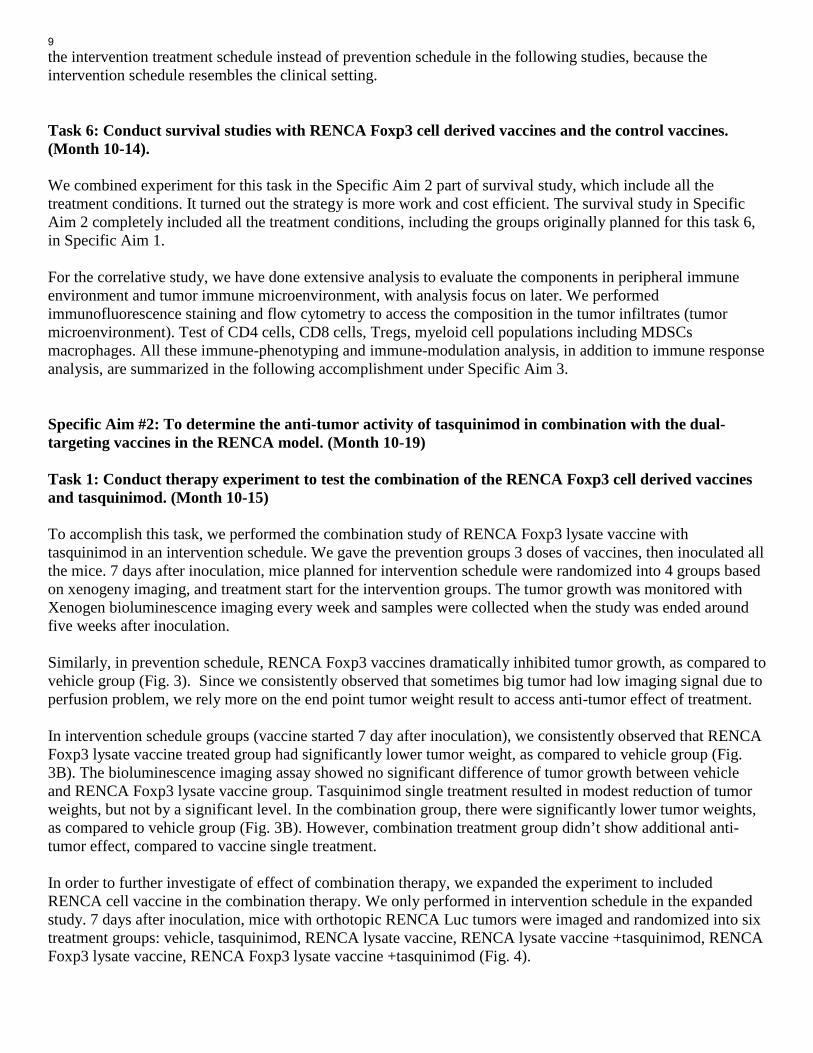
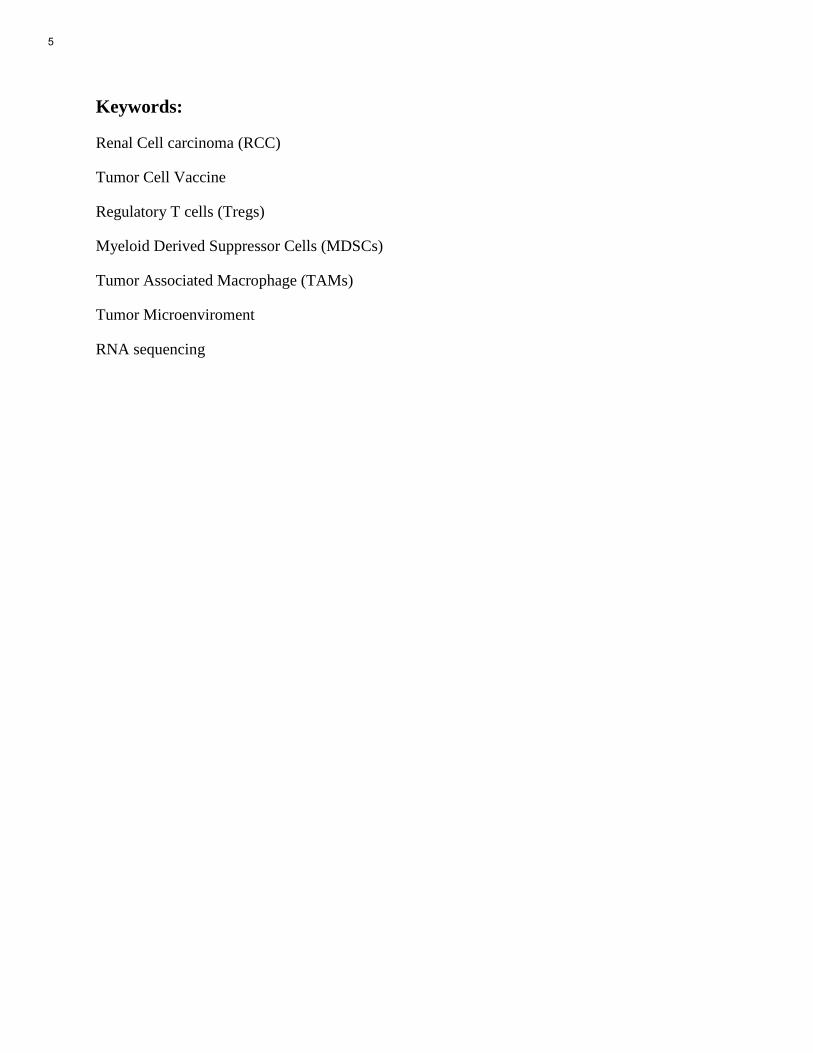
the intervention treatment schedule instead of prevention schedule in the following studies, because the intervention schedule resembles the clinical setting. Task 6: Conduct survival studies with RENCA Foxp3 cell derived vaccines and the control vaccines. (Month 10-14). We combined experiment for this task in the Specific Aim 2 part of survival study, which include all the treatment conditions. It turned out the strategy is more work and cost efficient. The survival study in Specific Aim 2 completely included all the treatment conditions, including the groups originally planned for this task 6, in Specific Aim 1. For the correlative study, we have done extensive analysis to evaluate the components in peripheral immune environment and tumor immune microenvironment, with analysis focus on later. We performed immunofluorescence staining and flow cytometry to access the composition in the tumor infiltrates (tumor microenvironment). Test of CD4 cells, CD8 cells, Tregs, myeloid cell populations including MDSCs macrophages. All these immune-phenotyping and immune-modulation analysis, in addition to immune response analysis, are summarized in the following accomplishment under Specific Aim 3. Specific Aim #2: To determine the anti-tumor activity of tasquinimod in combination with the dual-targeting vaccines in the RENCA model. (Month 10-19) Task 1: Conduct therapy experiment to test the combination of the RENCA Foxp3 cell derived vaccines and tasquinimod. (Month 10-15) To accomplish this task, we performed the combination study of RENCA Foxp3 lysate vaccine with tasquinimod in an intervention schedule. We gave the prevention groups 3 doses of vaccines, then inoculated all the mice. 7 days after inoculation, mice planned for intervention schedule were randomized into 4 groups based on xenogeny imaging, and treatment start for the intervention groups. The tumor growth was monitored with Xenogen bioluminescence imaging every week and samples were collected when the study was ended around five weeks after inoculation. Similarly, in prevention schedule, RENCA Foxp3 vaccines dramatically inhibited tumor growth, as compared to vehicle group (Fig. 3). Since we consistently observed that sometimes big tumor had low imaging signal due to perfusion problem, we rely more on the end point tumor weight result to access anti-tumor effect of treatment. In intervention schedule groups (vaccine started 7 day after inoculation), we consistently observed that RENCA Foxp3 lysate vaccine treated group had significantly lower tumor weight, as compared to vehicle group (Fig. 3B). The bioluminescence imaging assay showed no significant difference of tumor growth between vehicle and RENCA Foxp3 lysate vaccine group. Tasquinimod single treatment resulted in modest reduction of tumor weights, but not by a significant level. In the combination group, there were significantly lower tumor weights, as compared to vehicle group (Fig. 3B). However, combination treatment group didn’t show additional anti-tumor effect, compared to vaccine single treatment. In order to further investigate of effect of combination therapy, we expanded the experiment to included RENCA cell vaccine in the combination therapy. We only performed in intervention schedule in the expanded study. 7 days after inoculation, mice with orthotopic RENCA Luc tumors were imaged and randomized into six treatment groups: vehicle, tasquinimod, RENCA lysate vaccine, RENCA lysate vaccine +tasquinimod, RENCA Foxp3 lysate vaccine, RENCA Foxp3 lysate vaccine +tasquinimod (Fig. 4).
9
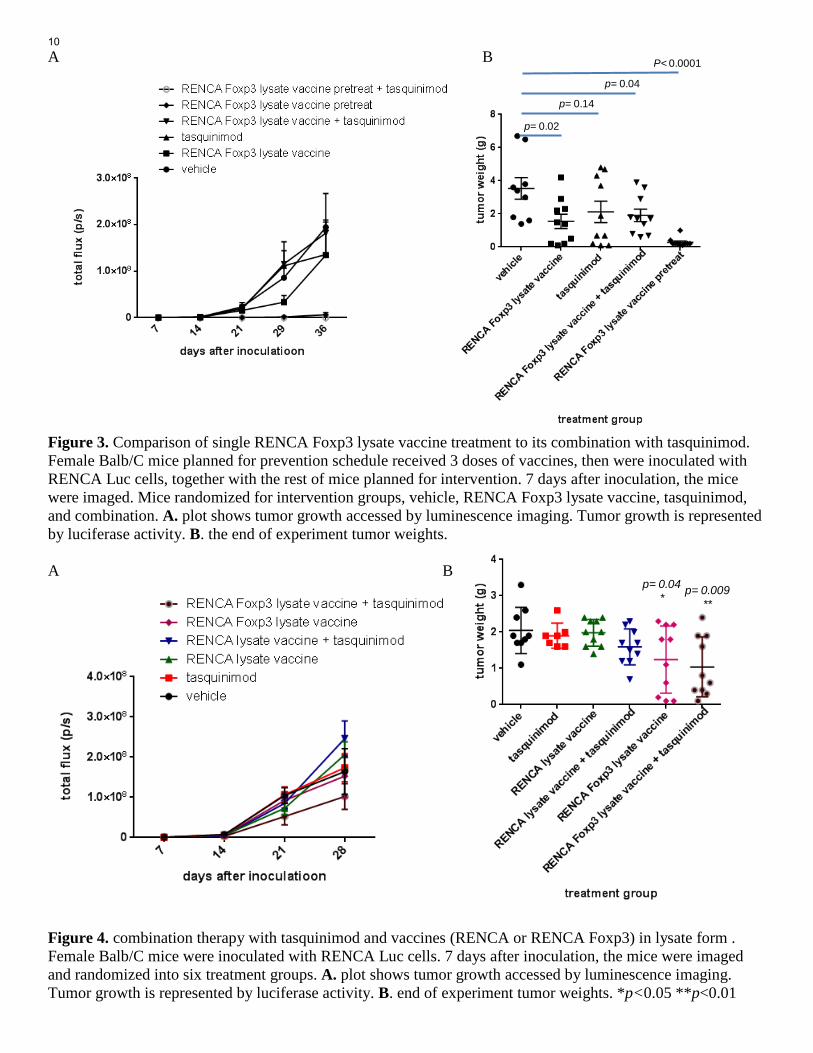
A B Figure 3. Comparison of single RENCA Foxp3 lysate vaccine treatment to its combination with tasquinimod. Female Balb/C mice planned for prevention schedule received 3 doses of vaccines, then were inoculated with RENCA Luc cells, together with the rest of mice planned for intervention. 7 days after inoculation, the mice were imaged. Mice randomized for intervention groups, vehicle, RENCA Foxp3 lysate vaccine, tasquinimod, and combination. A. plot shows tumor growth accessed by luminescence imaging. Tumor growth is represented by luciferase activity. B. the end of experiment tumor weights. A B Figure 4. combination therapy with tasquinimod and vaccines (RENCA or RENCA Foxp3) in lysate form . Female Balb/C mice were inoculated with RENCA Luc cells. 7 days after inoculation, the mice were imaged and randomized into six treatment groups. A. plot shows tumor growth accessed by luminescence imaging. Tumor growth is represented by luciferase activity. B. end of experiment tumor weights. *p<0.05 **p<0.01
p= 0.02
p= 0.14
p= 0.04
P< 0.0001
p= 0.04* p= 0.009
**
10
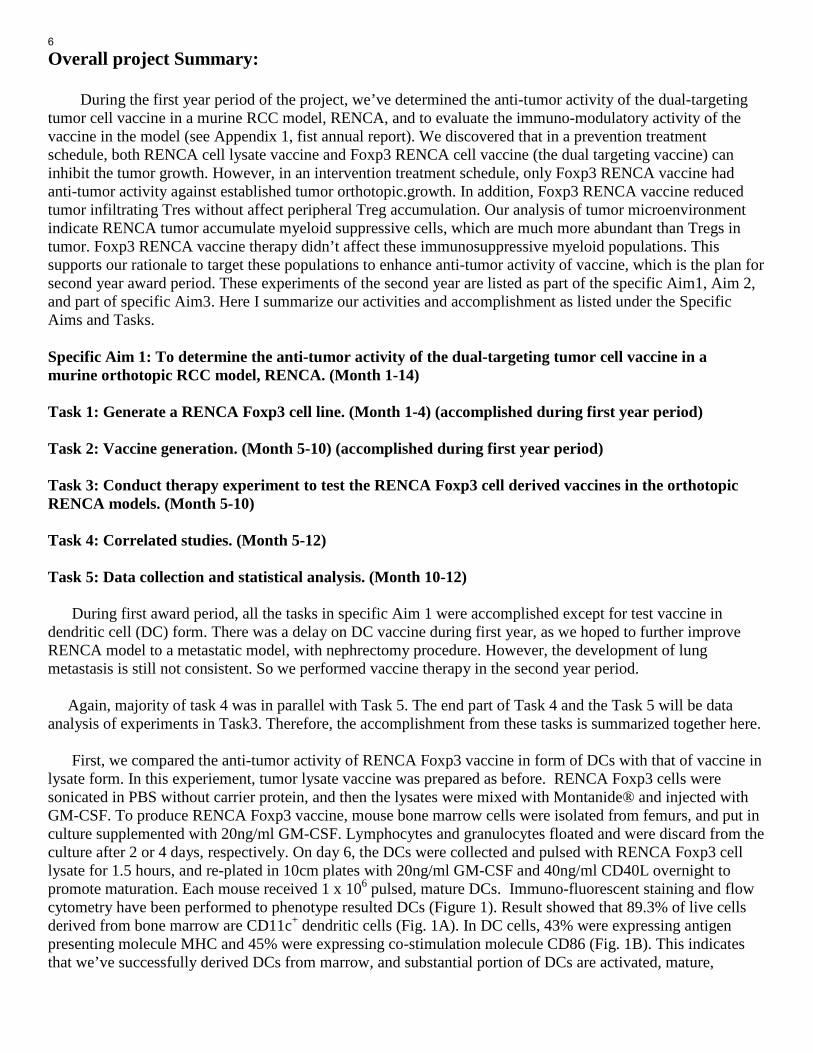
As shown in Figure 4, neither RENCA lysate vaccine nor its combination with tasquinimod had significant antitumor activity (Figure 4). On the contrary, both RENCA Foxp3 lysate vaccine and its combination with tasquinimod had significant anti-tumor activity as shown as lower end of experiment tumor weights (Fig. 4B). It is possible that the model is very aggressive tumor model and there was not enough time window for combination strategy to show additional anti-tumor response, compared to vaccine single treatment. We went ahead to perform survival study to find out effects of vaccines and their combination with tasquinimod in a prolonged experiment setting ( see task 4). Task 2: Correlated studies. (Month 10-17) Task 3: Data collection and statistical analysis. (Month 15-17) Correlative studies and data analysis were completed in parallel with animal study, and statistical analysis of anti-tumor activities of therapies have been shown in above Figures. During and at the end of these therapeutic studies, we have done extensive analysis to evaluate the components in peripheral immune environment and tumor immune microenvironment, such as CD4 cells, CD8 cells, Tregs, myeloid cell populations including MDSCs, TAM macrophages, via immunofluorescence staining and flow cytometry analysis and other approached. The tissue and cells harvested from Aim 2 studies has been used to test anti-tumor immune responses, and also to test function of effectors cells. All these immune response and immunomodulation test results are summarized in the following accomplishment under Specific Aim 3. Task 4: Conduct survival studies to test the combination of the RENCA Foxp3 cell derived vaccines and tasquinimod. (Month 15-19) We designed survival study include six experiment arms at the same time: Vehicle, tasquinimod, RENCA lysate vaccine, RENCA lysate vaccine and tasquinimod, RENCA Foxp3 lysate vaccine, RENCA Foxp3 lysate vaccine and tasquinimod. Therefore, in this survival study, we can compare RENCA to RENCA Foxp3 vaccine, as well as compare vaccine only to vaccine and tasquinimod combination. This design included Task 6 in Specific Aim 1. In survival study, tumor inoculation and animal randomization were performed as described in therapeutic study. Mice were count as end of survival from following situation: 1. Mouse found dead. 2. Mouse was euthanized when consider lethargic or moribund, according to institutional IACUC. 3. Mouse that was experiencing pain and/or stress and not showing any sign of improvement. The conduct of survival study is also based on the approved ACURO animal protocol. As shown in Figure 5, treatments including tasquinimod, RENCA lysate vaccine, and RENCA lysate vaccine and tasquinimod combination didn’t lead to any improvement of animal survival. Mice treated with RENCA Foxp3 lysate vaccine showed prolonged survival, as compared to vehicle group. Excitingly, mice treated with RENCA Foxp3 lysate vaccine and tasquinimod combination had additional improvement of survival, as compared to RENCA Foxp3 lysate vaccine only group. By day 58 on treatment, 3 mice were still alive and active in the RENCA Foxp3 lysate vaccine and tasquinimod combination. These mice were euthanized (on the day of end of award period). and it was observed all 3 mice have small, less than 0.4 gram tumor. In summary, tasquinimod didn’t have additional anti-tumor growth activity in end point therapeutic study, but further improved survival when added to RENCA Foxp3 vaccine therapy. It is possible that a longer treatment duration in survival study have given more time for the combination to take into effect. In addition,we have reported that tasquinimod reduced numbers an inhibited function of immunosuppressive MDSCs and TAMs in tumor microenvironment (Shen et al. Cancer Immunology Research, 2015, attached in Appendics), and may have anti-metastasis activity (unpublished result). Interestingly, 2-3 mice (out of 10) were found with lung and/or diaphragm metastasis from other groups, but not in RENCA Foxp3 and tasquinimod combination group.
11

The anti-metastatic activity of anti-inflammatory agent, tasquinimod is worth future investigation and tests in linical settings.
p values: vehicle vs. RENCA Foxp3 lysate vaccine: p = 0.035 vehicle vs. RENCA Foxp3 lysate vaccine and tasquinimod combination: p < 0.001 RENCA Foxp3 lysate vaccine vs. RENCA Foxp3 lysate vaccine and tasquinimod combination: P = 0.008
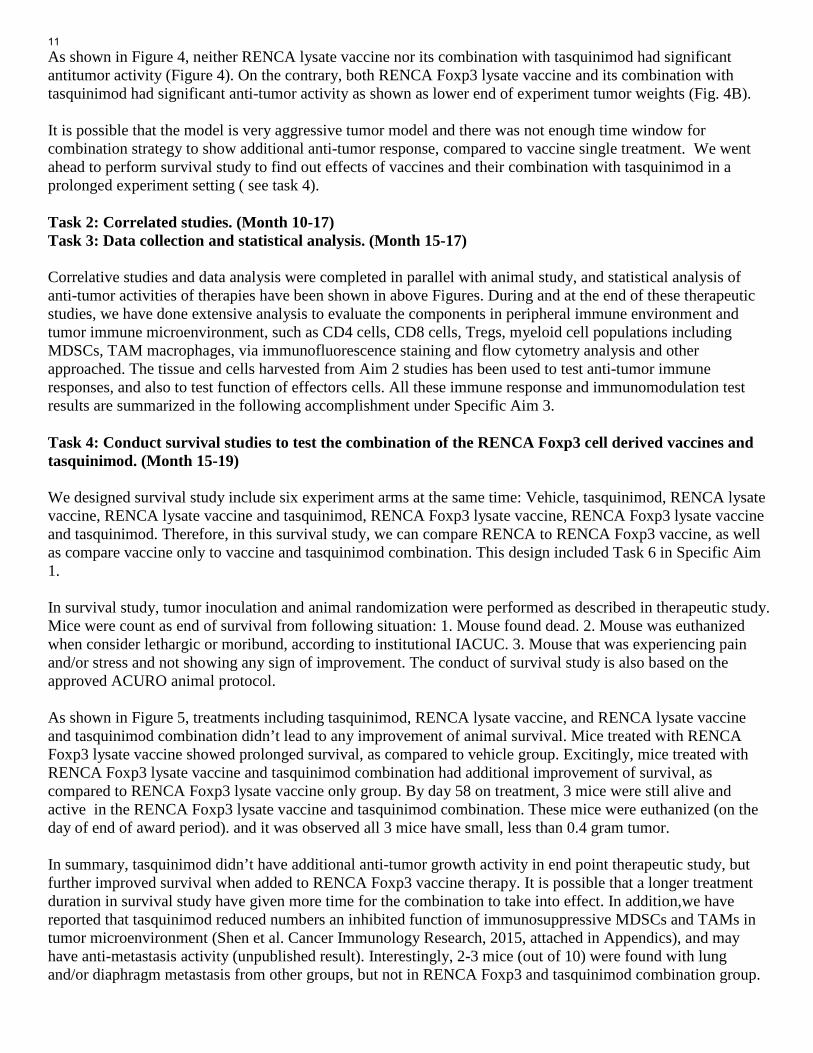
Figure 5. Test RENCA, RENCA Foxp3 lysate vaccines and their combination with tasquinimod in survival study. Tumor inoculation and group set up were done as described above. Kaplan-Meier curves is derived to compare survival in different treatment groups and a log-rank test is used to measure the statistical significance. Specific Aim #3: To assess tumor-specific immune response after the delivery of the dual-targeting vaccine alone or in combination with tasquinimod. (Month 6-24) Task 1: Assess tumor-specific responses in therapy experiments. (Test after dual targeting vaccine single therapy: Month 10-14; test after combination studies: Month 15-19) In order to access anti-tumor responses and effector cell function induced by vaccine or combination treatment, we performed three tests: 1). Cytotoxicity of lymphocytes against RENCA luc tumor cells. 2). Interferon gamma expression in effector CD8 cells; 3) Granzyme B expression in effector CD8 cells. Splenocytes were isolated from tumor-bearing mice of different treatment groups. Some splenocytes were stimulated in CD3 (1ug/ml) and CD28 (0.5ug/ml)—coated plates, and put in culture with fluorescence (Dio)-labeled target RENCA Luc tumor cells. Propidium iodide was used to detected cell death after 5 hours of co-culture. Tumor cell killing then was measured and quantified with flow cytometry analysis. We found that splenocytes from mice with vaccine therapy (RENCA or RENCA Foxp3) had similar tumor cell killing capacity as those from mice of vehicle group. Tasquinimod single treatment didn’t change the cytotoxicity of splenocytes, either. However, tasquinimod in combination with vaccine can improve tumor cytotoxicity of splenocytes from treated mice, when compare RENCA vaccine + tasquinimod with RENCA vaccine, or compare RENCA Foxp3 vaccine +tasquinimod with RENCA Foxp3. Interestingly, when compared together, splenocytes from RENCA Foxp3 vaccine and tasquinimod combination group had significant higher
12
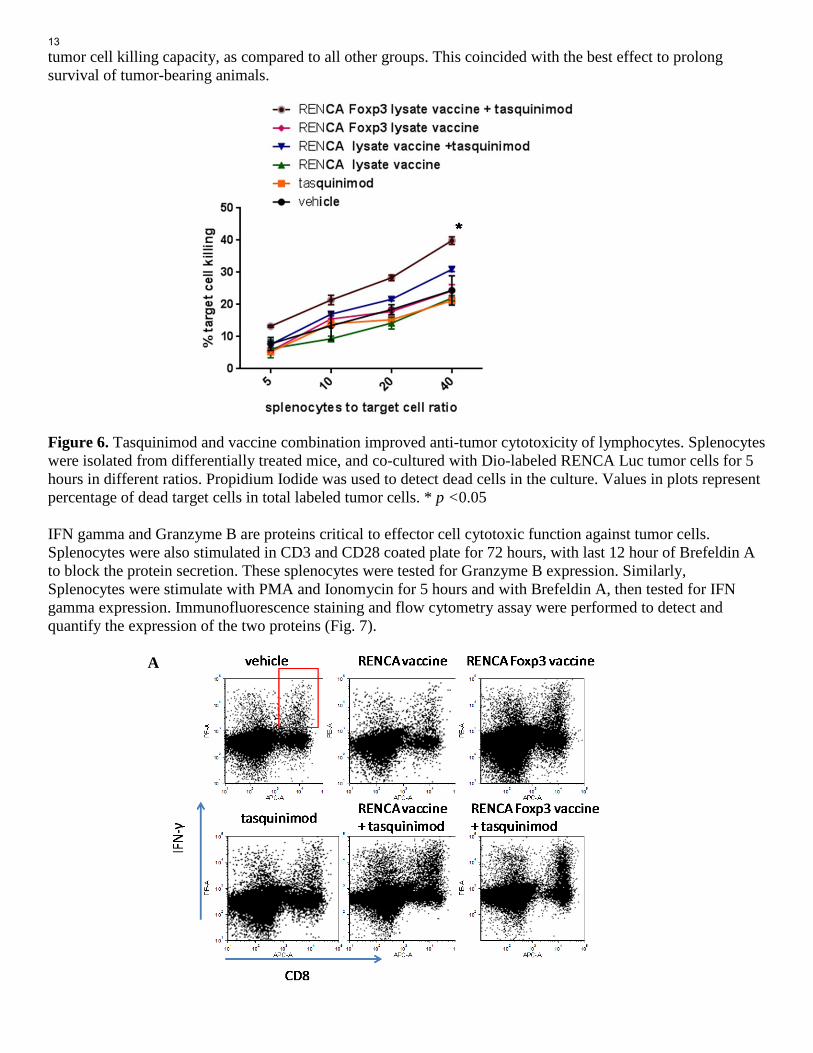
tumor cell killing capacity, as compared to all other groups. This coincided with the best effect to prolong survival of tumor-bearing animals. Figure 6. Tasquinimod and vaccine combination improved anti-tumor cytotoxicity of lymphocytes. Splenocytes were isolated from differentially treated mice, and co-cultured with Dio-labeled RENCA Luc tumor cells for 5 hours in different ratios. Propidium Iodide was used to detect dead cells in the culture. Values in plots represent percentage of dead target cells in total labeled tumor cells. * p <0.05 IFN gamma and Granzyme B are proteins critical to effector cell cytotoxic function against tumor cells. Splenocytes were also stimulated in CD3 and CD28 coated plate for 72 hours, with last 12 hour of Brefeldin A to block the protein secretion. These splenocytes were tested for Granzyme B expression. Similarly, Splenocytes were stimulate with PMA and Ionomycin for 5 hours and with Brefeldin A, then tested for IFN gamma expression. Immunofluorescence staining and flow cytometry assay were performed to detect and quantify the expression of the two proteins (Fig. 7). A
13
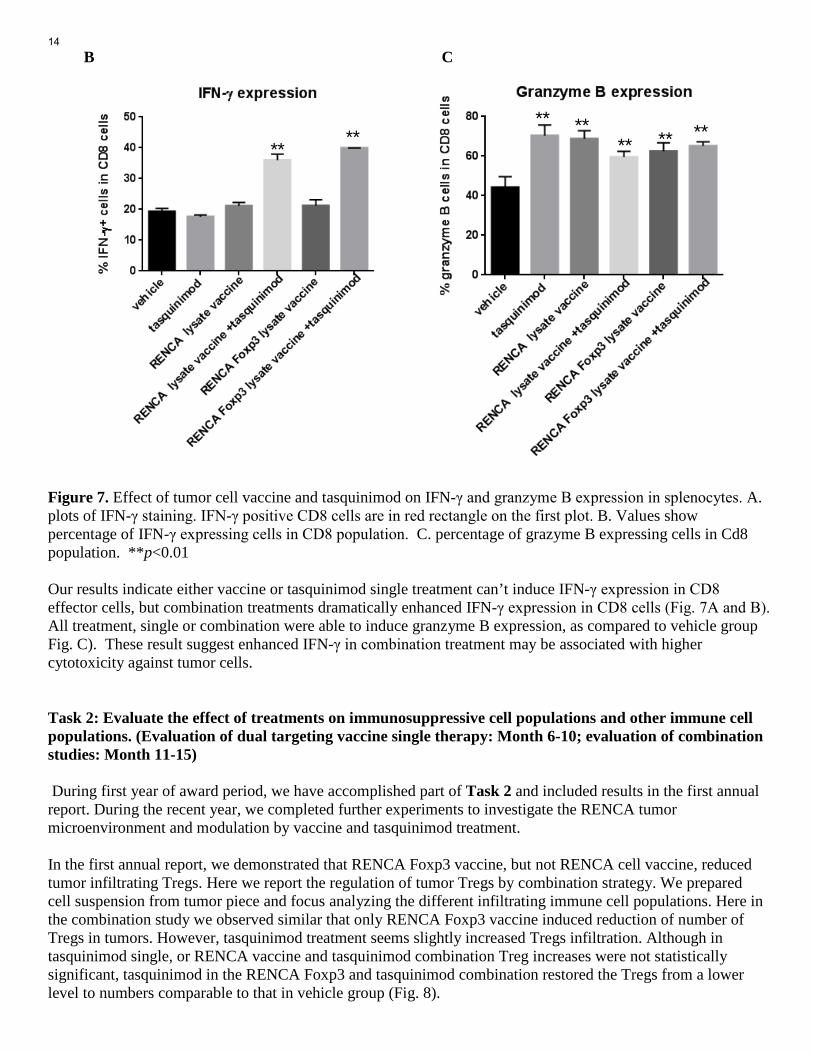
B C Figure 7. Effect of tumor cell vaccine and tasquinimod on IFN-γ and granzyme B expression in splenocytes. A. plots of IFN-γ staining. IFN-γ positive CD8 cells are in red rectangle on the first plot. B. Values show percentage of IFN-γ expressing cells in CD8 population. C. percentage of grazyme B expressing cells in Cd8 population. **p<0.01 Our results indicate either vaccine or tasquinimod single treatment can’t induce IFN-γ expression in CD8 effector cells, but combination treatments dramatically enhanced IFN-γ expression in CD8 cells (Fig. 7A and B). All treatment, single or combination were able to induce granzyme B expression, as compared to vehicle group Fig. C). These result suggest enhanced IFN-γ in combination treatment may be associated with higher cytotoxicity against tumor cells. Task 2: Evaluate the effect of treatments on immunosuppressive cell populations and other immune cell populations. (Evaluation of dual targeting vaccine single therapy: Month 6-10; evaluation of combination studies: Month 11-15) During first year of award period, we have accomplished part of Task 2 and included results in the first annual report. During the recent year, we completed further experiments to investigate the RENCA tumor microenvironment and modulation by vaccine and tasquinimod treatment. In the first annual report, we demonstrated that RENCA Foxp3 vaccine, but not RENCA cell vaccine, reduced tumor infiltrating Tregs. Here we report the regulation of tumor Tregs by combination strategy. We prepared cell suspension from tumor piece and focus analyzing the different infiltrating immune cell populations. Here in the combination study we observed similar that only RENCA Foxp3 vaccine induced reduction of number of Tregs in tumors. However, tasquinimod treatment seems slightly increased Tregs infiltration. Although in tasquinimod single, or RENCA vaccine and tasquinimod combination Treg increases were not statistically significant, tasquinimod in the RENCA Foxp3 and tasquinimod combination restored the Tregs from a lower level to numbers comparable to that in vehicle group (Fig. 8).
****
** **** ** **
14

A B Figure 8 Effect of vaccine and tasquinimod on tumor infiltrating Tregs. Tumors were harvested from differentially treated mice. Single cell suspensions then were prepared from tumor pieces and subject to immunofuorescence staining and flow analysis. A. flow plots show gating of the infiltrating Tregs. Example: the population in red rectangle in the first plot. B. Quantification of infiltrating Tregs with different treatment. ** p < 0.01. This “side effect” of tasquinimod was probably responsible to the result that tasqunimod didn’t further enhance the anti-tumor effect of RENCA Foxp3 vaccine, although tasquinimod has potential to inhibite or modulate multiple myeloid immunosuppressive population in tumors. Tasquinimod did added further benefit in survival study. The slightly “Tregs-promoting” effect compromised its benefit in therapeutic study, probably due to shorter treatment time span. We also measured the Tregs cells in peripheral blood sample. Tasquinimod slightly increased Tregs in blood, shown in Figure 9B as increased numbers (changes were not significant between RENCA only and RENCA, tasquinimod combination). Interestingly, tasquinimod moderately, but significantly reduced Foxp3 expression level (as Foxp3 MFI) in combination, as compared to vaccine single treatments (Fig. 9C). We have reported that tasquinimode had Tregs promoting effect in other model (Appendices).
15

A B C Figure 9 Effect of vaccine and tasquinimod on peripheral blood Tregs. Blood samples were harvested from differentially treated mice and subject to immunofluorescence staining and flow analysis. A. flow plots show gating of the infiltrating Tregs. Example: the population in red rectangle in the first plot. B. Quantification of numberinfiltrating Tregs with different treatment. C. quantification of Foxp3 level in Tregs. (as mean fluorescence intensity). * p < 0.05, ** p < 0.01.
16

Next, we characterized the phenotype of tumor infiltrating myeloid populations, and access modulation of these populations by different treatments. Again we first focused on myeloid population in the tumor microenvironment (Fig. 10). A B C Figure 10 Effect of vaccine and tasquinimod on tumor infiltrating macrophages. Tumors were harvested from differentially treated mice. Single cell suspensions then were prepared from tumor pieces and subject to immunofuorescence staining with macrophage surface markers (F/80 and CD206, etc.) and flow analysis. A.
17

flow plots show gating of the infiltrating macrophage (F4/80), as well as M2 polarized macrophage (CD206 positive macrophages (upper right). B. Quantification of numbers of infiltrating M2 polarized macrophages with different treatment. C. quantification of CD206 expression level (as MFI) in total macrophage populations ** p < 0.01. As shown in Figure 10, tasquinimod treatment, as single or in combinations) significantly reduced immunosuppressive, M2 polarized macrophages, as reduced numbers or as overall lower CD206 level in total macrophages (CD206 is a surface marker for M2 polarized macrophages). This strong M2 macrophage targeting effect of tasquinimod may counteract with its modest Treg promoting “side effect” to show benefit in survival study. We also access MDSC populations in the tumor microenvironment. Tasquinimod also reduced tumor infiltrating Gr1+CD11b+ MDSCs, as single treatment, even more dramatically when in combination with vaccine treatment (Fig. 11). A B Figure 11. Effect of vaccine and tasquinimod on tumor infiltrating MDSCs. Tumors were harvested from differentially treated mice. Single cell suspensions then were prepared from tumor pieces and subject to immunofuorescence staining and flow analysis. A. flow plots show gating of the infiltrating MDSCs: the population in red rectangle in the first plot. B. Quantification of infiltrating MDSCs with different treatments. *p < 0.05, ** p < 0.01. In addition to FACS analysis of tumor suspension, we also tried as planned to access tumor microenvironment in situ with Immunohistochemistry (IHC). Some antigen staining worked, such as CD206 M2 macrophage staining. The IHC results demonstrated significant reduction of CD206 cells in the tumor sections (Fig. 12). This result supported our result from flow cytometry experiment (Fig. 10).
vehicle RENCA Foxp3 RENCA
TasquinimodRENCA Foxp3 +tasquinimod
RENCA +tasquinimod
Gr1
CD
11b
*
** **
18
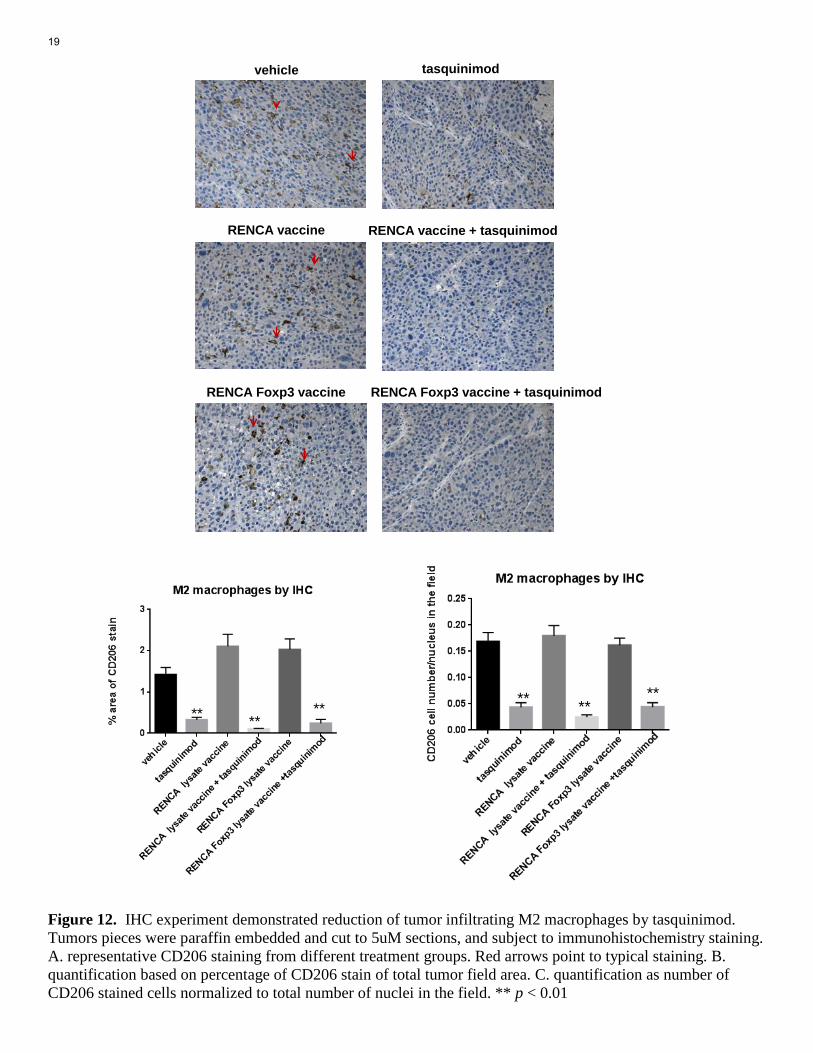
Figure 12. IHC experiment demonstrated reduction of tumor infiltrating M2 macrophages by tasquinimod. Tumors pieces were paraffin embedded and cut to 5uM sections, and subject to immunohistochemistry staining. A. representative CD206 staining from different treatment groups. Red arrows point to typical staining. B. quantification based on percentage of CD206 stain of total tumor field area. C. quantification as number of CD206 stained cells normalized to total number of nuclei in the field. ** p < 0.01
vehicle tasquinimod
RENCA vaccine RENCA vaccine + tasquinimod
RENCA Foxp3 vaccine RENCA Foxp3 vaccine + tasquinimod
** ****
** ****
19

In addition, we have perform several other antigens, including activated caspase 3 (apoptosis marker), IL-10 (immunosuppressive cytokine), CD4 (effector T cell infiltrates), Foxp3 (Tregs), Gr1 (MDSCs). During test run, all the antigen staining were successful (see Figure 13). However, the staining of whole sets of the samples later were not working. We tried 3 times and used three different protocols, including different signal applification systems. These efforts were not successful. IHC was proposed as an alternative or supporting method to FACS analysis of tumor microenvironment. We did have success on FACS analysis, so we can work on IHC when we publish the study. Figure 13. IHC stainings of multiple antigens to analyze in situ tumor immune microenvironment . Tumors pieces were paraffin embedded and cut to 5uM sections, and subject to immunohistochemistry staining. Red arrows point to typical staining.
activated caspase 3 IL-10 CD4
20X
40X
Foxp3 Gr1 CD206
20X
40X
20

Task 3: Study the mechanisms by which tasquinimod suppresses MDSCs, and search additional molecular targets. (Month 17-24) Results from this study and from our other reports (Appendices) suggests anti-inflammatory agent tasquinimod has potent activity to inhibit suppressive myeloid cells in the tumor microenvironment, modulate immune response and facilitating cancer immunotherapies. Specifically, tasquinimod reduces infiltration of MDSCs and M2 polarized macrophages in tumor, and impair their suppressive functions. The direct molecular target of tasquinimod is S100A9, an inflammatory protein. Receptors for S100A9 include TLR4 and RAGE, which are expressed on myeloid cells (monocytes, DC, MDSCs, macrophages) and endothelial cell, tumor cells. Both TLR4 and RAGE signing pathways are involved in myeloid cell accumulation, differentiation, and function. We planned to investigate regulation of suppressive myeloid cell through a high throughput approach, RNA sequencing, or whole transcriptome shotgun sequencing. Here we present the results from RNA Seq analysis of tumor infiltrating myeloid cells. RENCA Luc tumor bearing mice were treated with vehicle or tasquinimod for 2.5 weeks. Tumors were excised and prepared into cell suspension. Infiltrating myeloid cells were isolated from suspension with anti-CD11b magnetic beads (Miltenyi Biotec). RNA were extracted from isolated CD11b cells and used for sequencing experiment. We have prepared six biological repeats for each treatment group. Here is the working flow for the experiment and analysis (Fig. 14). Figure 14. RNA sequencing work flow.
Two batches (6 samples of each) of RNA Sequence data generated by Illumina Hiseq 2000
CoSAVA was used to generate fastq
Star was used to generate Bam file, Bam file is also used for checking the mapping quality
HTSeq summarized the count for each exon
Filtering (remove 0 read across all the samples, 31041 probes left)
DESeq2 for DE test: annotateed by Mus_GRCm38.80.gtf
GSAA for pathway analysis (15918 probes mapped to human)
21

Probe-by-probe analysis revealed differential expressed genes from treated vs.vehicle group. Tasquinimod treatment led to 1723 up regulated with at least 2 fold change, and 1996 down regulated with at least 2 fold change. We checked differentially expressed genes in pathways in GSAA database, with focus on immunological signature collection. GSAA pathway analysis show up-regulation of 137 gene sets are significantly associated with tasquinimod treated expression phenotype at nominal p value <0.01. With tasquinimod treated expression phenotype, up-regulation of 275 gene sets are significantly associated at nominal p value <0.05. On the other hand, 87 gene sets and 153 gene sets are significantly down-regulated at nominal p value <0.01 and <0.05, respectively. In Figure 15 and Figure 16, we summarized top 20 significantly up-regulated or down-regulated gene sets, respectively. Figure 15 In infiltrating myel;oid cells, top 20 up-regulated gene sets by tasquinimod treatment.
GS GS SIZE AS NAS NOM p-val FDR q-val FWER p- RANK AT follow link to MSigDB
1 GOLDRATH_EFF_VS_MEMORY_CD8_TCELL_UP Details ... 190 -0.41771 -1.87305 0 0.003966552 0.018 3438
2 GSE17974_IL4_AND_ANTI_IL12_VS_UNTREATED_12H_ACT_CD4_TCELL_DN Details ... 141 -0.43209 -1.88436 0 0.00470121 0.016 2430
3 GSE30962_PRIMARY_VS_SECONDARY_ACUTE_LCMV_INF_CD8_TCELL_UP Details ... 189 -0.41399 -1.84729 0 0.005825564 0.032 4262
4 GSE20366_EX_VIVO_VS_DEC205_CONVERSION_NAIVE_CD4_TCELL_UP Details ... 186 -0.42452 -1.89124 0 0.006183968 0.014 1981
5 GSE17721_0.5H_VS_24H_CPG_BMDM_DN Details ... 190 -0.39336 -1.78015 0 0.007275989 0.096 1781
6 GSE29618_MONOCYTE_VS_MDC_DAY7_FLU_VACCINE_DN Details ... 179 -0.39793 -1.77466 0 0.00732606 0.102 2046
7 GSE11864_CSF1_PAM3CYS_VS_CSF1_IFNG_PAM3CYS_IN_MAC_DN Details ... 161 -0.40159 -1.76838 0 0.007437471 0.112 2547
8 GSE1432_CTRL_VS_IFNG_24H_MICROGLIA_DN Details ... 163 -0.39938 -1.7868 0 0.007456577 0.09 3443
9 GSE2706_2H_VS_8H_LPS_STIM_DC_DN Details ... 157 -0.40422 -1.78696 0 0.008202235 0.09 3079
10 GSE36476_CTRL_VS_TSST_ACT_40H_MEMORY_CD4_TCELL_YOUNG_DN Details ... 189 -0.39165 -1.78939 0 0.008526932 0.084 4358
11 GSE2706_UNSTIM_VS_8H_R848_DC_DN Details ... 169 -0.3905 -1.75083 0 0.008671427 0.153 2648
12 GSE24142_EARLY_THYMIC_PROGENITOR_VS_DN2_THYMOCYTE_DN Details ... 190 -0.39634 -1.79512 0 0.008816197 0.077 3476
13 GSE15750_DAY6_VS_DAY10_TRAF6KO_EFF_CD8_TCELL_UP Details ... 186 -0.42812 -1.92434 0 0.008824304 0.01 3881
14 GSE22886_NAIVE_CD8_TCELL_VS_MONOCYTE_UP Details ... 174 -0.39411 -1.75258 0 0.009048041 0.15 3759
15 GSE22886_TCELL_VS_BCELL_NAIVE_DN Details ... 164 -0.4075 -1.79903 0.00128866 0.009200472 0.071 2357
16 GSE14000_UNSTIM_VS_4H_LPS_DC_DN Details ... 168 -0.39098 -1.73888 0 0.009367971 0.174 2775
17 GSE16755_CTRL_VS_IFNA_TREATED_MAC_DN Details ... 174 -0.40284 -1.80259 0 0.009563476 0.063 3481
18 GSE1432_CTRL_VS_IFNG_6H_MICROGLIA_DN Details ... 175 -0.39152 -1.75299 0 0.009592192 0.149 3197
19 GSE20715_0H_VS_6H_OZONE_TLR4_KO_LUNG_DN Details ... 188 -0.38156 -1.73395 0 0.009849959 0.19 3246
20 GSE360_DC_VS_MAC_T_GONDII_UP Details ... 163 -0.38475 -1.71945 0 0.012179547 0.237 1969
22
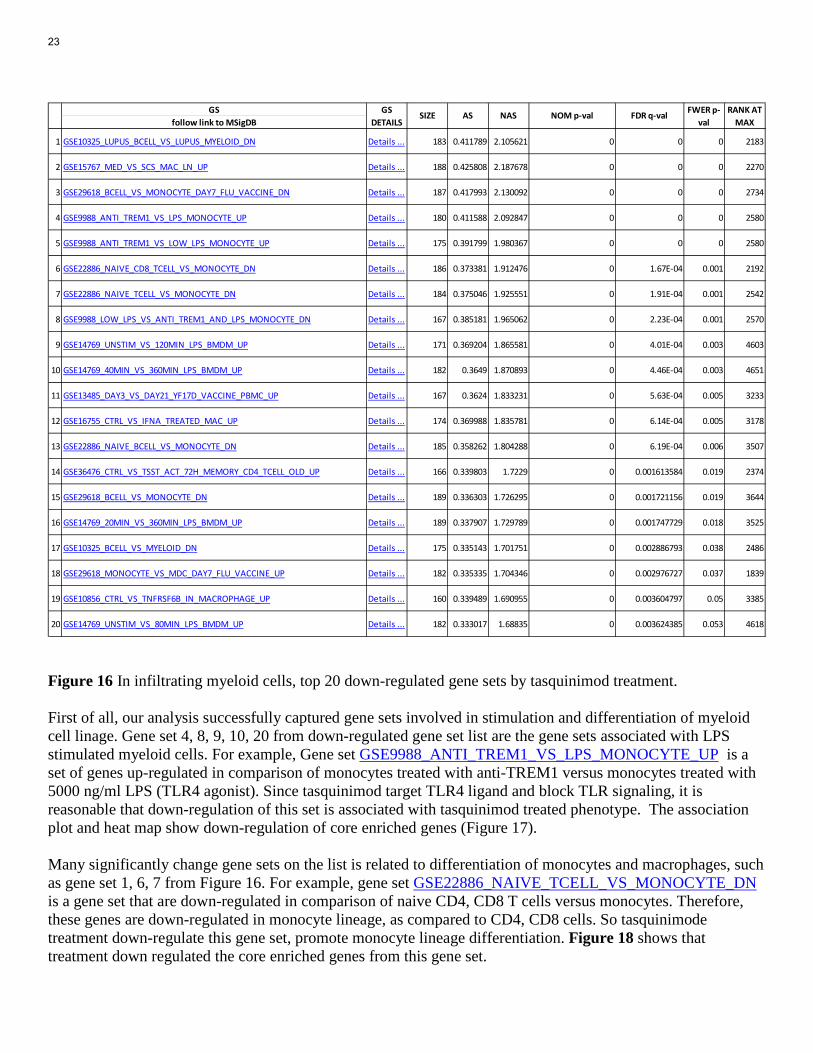
Figure 16 In infiltrating myeloid cells, top 20 down-regulated gene sets by tasquinimod treatment. First of all, our analysis successfully captured gene sets involved in stimulation and differentiation of myeloid cell linage. Gene set 4, 8, 9, 10, 20 from down-regulated gene set list are the gene sets associated with LPS stimulated myeloid cells. For example, Gene set GSE9988_ANTI_TREM1_VS_LPS_MONOCYTE_UP is a set of genes up-regulated in comparison of monocytes treated with anti-TREM1 versus monocytes treated with 5000 ng/ml LPS (TLR4 agonist). Since tasquinimod target TLR4 ligand and block TLR signaling, it is reasonable that down-regulation of this set is associated with tasquinimod treated phenotype. The association plot and heat map show down-regulation of core enriched genes (Figure 17). Many significantly change gene sets on the list is related to differentiation of monocytes and macrophages, such as gene set 1, 6, 7 from Figure 16. For example, gene set GSE22886_NAIVE_TCELL_VS_MONOCYTE_DN is a gene set that are down-regulated in comparison of naive CD4, CD8 T cells versus monocytes. Therefore, these genes are down-regulated in monocyte lineage, as compared to CD4, CD8 cells. So tasquinimode treatment down-regulate this gene set, promote monocyte lineage differentiation. Figure 18 shows that treatment down regulated the core enriched genes from this gene set.
GSfollow link to MSigDB
1 GSE10325_LUPUS_BCELL_VS_LUPUS_MYELOID_DN Details ... 183 0.411789 2.105621 0 0 0 2183
2 GSE15767_MED_VS_SCS_MAC_LN_UP Details ... 188 0.425808 2.187678 0 0 0 2270
3 GSE29618_BCELL_VS_MONOCYTE_DAY7_FLU_VACCINE_DN Details ... 187 0.417993 2.130092 0 0 0 2734
4 GSE9988_ANTI_TREM1_VS_LPS_MONOCYTE_UP Details ... 180 0.411588 2.092847 0 0 0 2580
5 GSE9988_ANTI_TREM1_VS_LOW_LPS_MONOCYTE_UP Details ... 175 0.391799 1.980367 0 0 0 2580
6 GSE22886_NAIVE_CD8_TCELL_VS_MONOCYTE_DN Details ... 186 0.373381 1.912476 0 1.67E-04 0.001 2192
7 GSE22886_NAIVE_TCELL_VS_MONOCYTE_DN Details ... 184 0.375046 1.925551 0 1.91E-04 0.001 2542
8 GSE9988_LOW_LPS_VS_ANTI_TREM1_AND_LPS_MONOCYTE_DN Details ... 167 0.385181 1.965062 0 2.23E-04 0.001 2570
9 GSE14769_UNSTIM_VS_120MIN_LPS_BMDM_UP Details ... 171 0.369204 1.865581 0 4.01E-04 0.003 4603
10 GSE14769_40MIN_VS_360MIN_LPS_BMDM_UP Details ... 182 0.3649 1.870893 0 4.46E-04 0.003 4651
11 GSE13485_DAY3_VS_DAY21_YF17D_VACCINE_PBMC_UP Details ... 167 0.3624 1.833231 0 5.63E-04 0.005 3233
12 GSE16755_CTRL_VS_IFNA_TREATED_MAC_UP Details ... 174 0.369988 1.835781 0 6.14E-04 0.005 3178
13 GSE22886_NAIVE_BCELL_VS_MONOCYTE_DN Details ... 185 0.358262 1.804288 0 6.19E-04 0.006 3507
14 GSE36476_CTRL_VS_TSST_ACT_72H_MEMORY_CD4_TCELL_OLD_UP Details ... 166 0.339803 1.7229 0 0.001613584 0.019 2374
15 GSE29618_BCELL_VS_MONOCYTE_DN Details ... 189 0.336303 1.726295 0 0.001721156 0.019 3644
16 GSE14769_20MIN_VS_360MIN_LPS_BMDM_UP Details ... 189 0.337907 1.729789 0 0.001747729 0.018 3525
17 GSE10325_BCELL_VS_MYELOID_DN Details ... 175 0.335143 1.701751 0 0.002886793 0.038 2486
18 GSE29618_MONOCYTE_VS_MDC_DAY7_FLU_VACCINE_UP Details ... 182 0.335335 1.704346 0 0.002976727 0.037 1839
19 GSE10856_CTRL_VS_TNFRSF6B_IN_MACROPHAGE_UP Details ... 160 0.339489 1.690955 0 0.003604797 0.05 3385
20 GSE14769_UNSTIM_VS_80MIN_LPS_BMDM_UP Details ... 182 0.333017 1.68835 0 0.003624385 0.053 4618
FDR q-val FWER p-val
RANK AT MAX
GS DETAILS
SIZE AS NAS NOM p-val
23
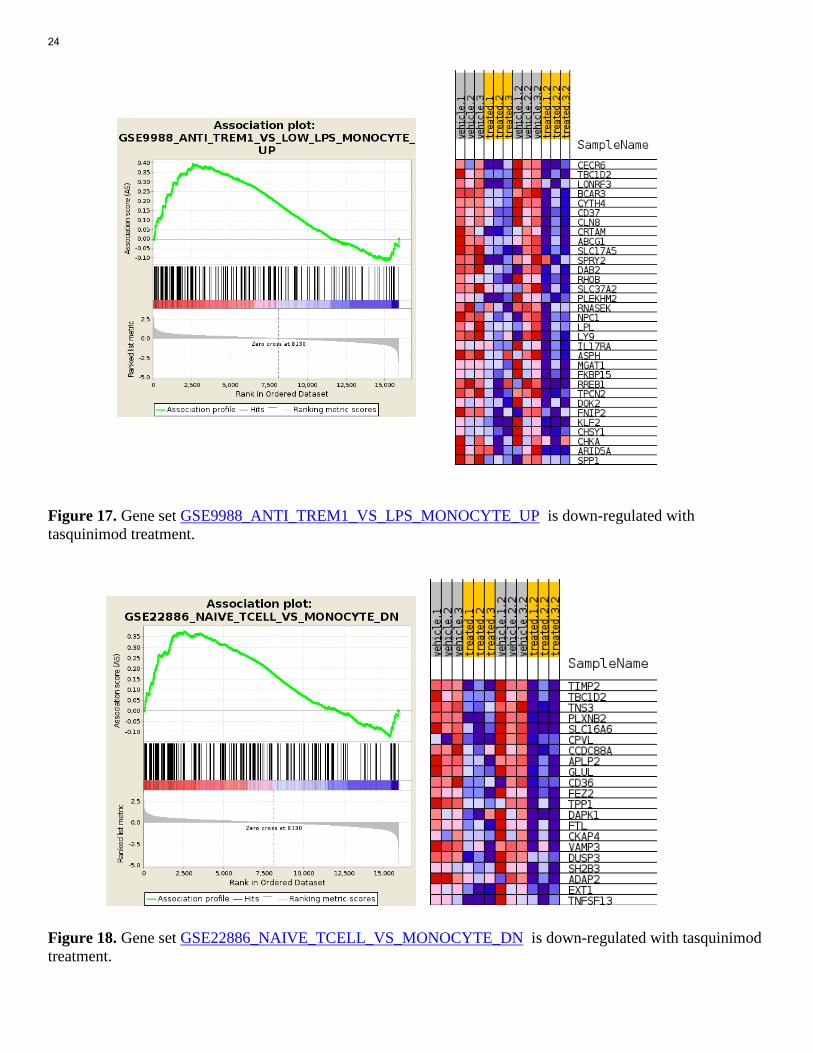
Figure 17. Gene set GSE9988_ANTI_TREM1_VS_LPS_MONOCYTE_UP is down-regulated with tasquinimod treatment. Figure 18. Gene set GSE22886_NAIVE_TCELL_VS_MONOCYTE_DN is down-regulated with tasquinimod treatment.
24
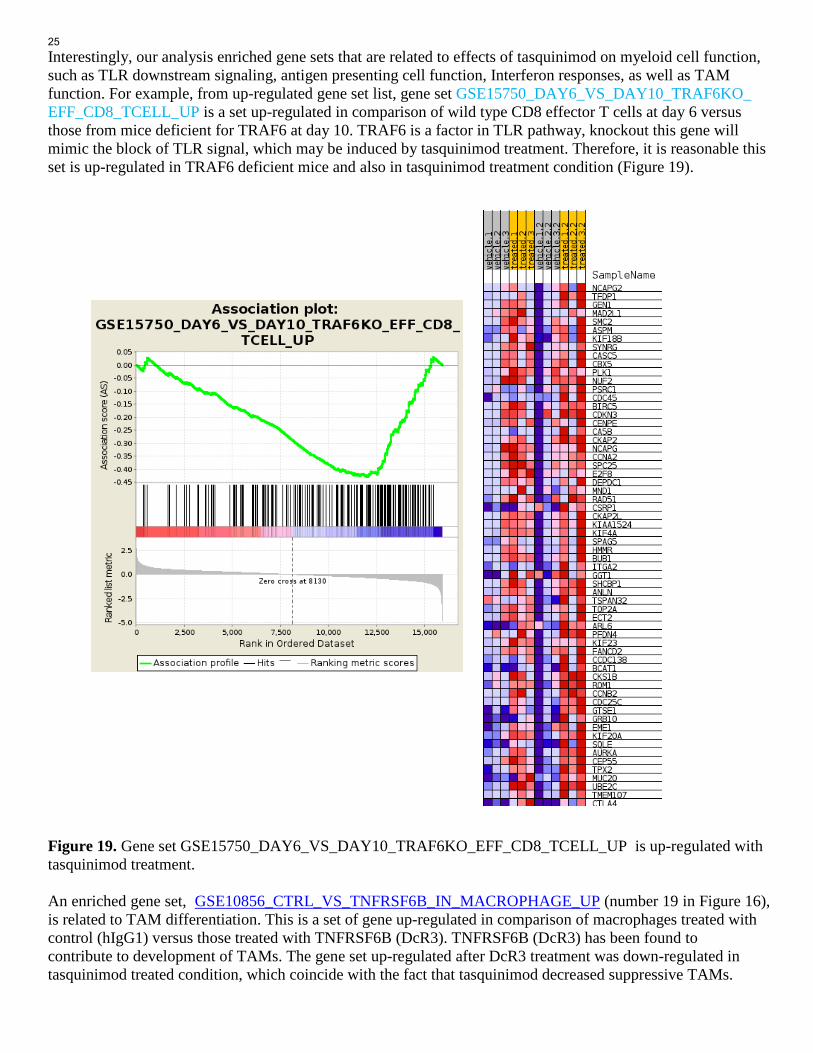
Interestingly, our analysis enriched gene sets that are related to effects of tasquinimod on myeloid cell function, such as TLR downstream signaling, antigen presenting cell function, Interferon responses, as well as TAM function. For example, from up-regulated gene set list, gene set GSE15750_DAY6_VS_DAY10_TRAF6KO_ EFF_CD8_TCELL_UP is a set up-regulated in comparison of wild type CD8 effector T cells at day 6 versus those from mice deficient for TRAF6 at day 10. TRAF6 is a factor in TLR pathway, knockout this gene will mimic the block of TLR signal, which may be induced by tasquinimod treatment. Therefore, it is reasonable this set is up-regulated in TRAF6 deficient mice and also in tasquinimod treatment condition (Figure 19). Figure 19. Gene set GSE15750_DAY6_VS_DAY10_TRAF6KO_EFF_CD8_TCELL_UP is up-regulated with tasquinimod treatment. An enriched gene set, GSE10856_CTRL_VS_TNFRSF6B_IN_MACROPHAGE_UP (number 19 in Figure 16), is related to TAM differentiation. This is a set of gene up-regulated in comparison of macrophages treated with control (hIgG1) versus those treated with TNFRSF6B (DcR3). TNFRSF6B (DcR3) has been found to contribute to development of TAMs. The gene set up-regulated after DcR3 treatment was down-regulated in tasquinimod treated condition, which coincide with the fact that tasquinimod decreased suppressive TAMs.
25

Figure 20 display that the core enriched genes in this gene set are down-regulated in tasquinimod treated condition. Figure 20. Gene set GSE10856_CTRL_VS_TNFRSF6B_IN_MACROPHAGE_UP is down-regulated with tasquinimod treatment. Most excitingly, RNASeq experiment can reveal multiple unexpected, previously unknown clues, or mechanism of action of tasquinimod, such as regulation of interferon responses, regulation of memory status of effector cells, and answers to how tasquinimod regulate Tregs, which we previously didn’t understand through cellular experiments. For example, gene set GOLDRATH_EFF_VS_MEMORY_CD8_TCELL_UP (number 1 set in Figure 15 is a set of gene up-regulated in comparison of effector CD8 T cells versus memory CD8 T cells. Core enriched genes in this gene set is up-regulated in tasquinimod condition (Figure 21), which suggest that tasquinimod may promote memory status of effector cells. Another example is gene set GSE20366_EX_VIVO_VS_DEC205_CONVERSION_NAIVE_CD4_TCELL_UP (number 4 gene set in Figure 15). This gene set is up-regulated in comparison of TconvLP versus DEC-Pept CD25-. DEC-Pept CD25- can convert CD4+ CD25- cells to Tregs in vivo. Since tasquinimod up-regulated genes (core enriched ones) in this set (Figure 22) and show activity to promote Tregs, investigate core enriched genes in this set can potentially reveal the critical genes and mechanism underlying tasquinimod’s Treg-promoting activity.
26

Figure 21. Gene set GOLDRATH_EFF_VS_MEMORY_CD8_TCELL_UP is up-regulated with tasquinimod treatment. In summary, RNASeq experiment revealed multiple mechanisms for immunomodulatory activities of tasquinimod. The analysis enriched genes and signaling pathways worth further future investigation. Some of them are not previously identified for tasquinimod through ours and other’s work. Task 4: Data collection and statistical analysis. (Month 8-24) Data collection and statistical analysis has been completed and incorporated in descrption of tasks above.
27

Figure 22. Gene set GSE20366_EX_VIVO_VS_DEC205_CONVERSION_NAIVE_CD4_TCELL_UP is up-regulated with tasquinimod treatment.
28

Key Research Accomplishment: 1. During second year of award period, our research team demonstrated tasquinimod, a S100A9 inhibitor and anti- inflammatory agent, potently modulated tumor immune microenvironment, and enhanced vaccine therapy by prolonged survival of tumor bearing host. 2. RNA sequence experiment with tumor infiltrating myeloid cells reveals novel mechanisms underlying tasquinimod actions. This is one of limited reported gene profiling with immune infiltrate, not with tumor cells. Critical pathway analysis provides foundation for future development of more specific approach to target immune suppressive populations.
29

Conclusions: Our results showed the novel, tumor cell and Treg dual-targeting, RENCA Foxp3 tumor cell vaccine had significant anti-tumor activity against established tumor growth in an intervention setting of experiment. Novel anti-inflammatory agent, tasquinimod, had further benefit to prolong survival of tumor-bearing host. This accomplishment and finding from the research are exciting. Since the study focus on targeting established tumor, our approach can be readily translated into clinical setting, to benefit patient with establish disease and may have higher success rate in patient with advanced and metastatic disease. The strategy is also expected to be a candidate therapy for patients who have surgery to prevent recurrent and metastatic disease. Importantly, we proved that a specific vaccine strategy can be used to target immunosuppressive Tregs in cancer therapy setting, which have not been reported previously by other groups. We demonstrated the potential potent immunomodulatory activity of tasquinimod, and suggesting novel actions of the agent such as modulation of Tregs and effector T cell memory status. Moreover, our study is one of the very limited reported studies to perform gene profiling of tumor infiltrating immune cell populations, which are most relevant components of tumor microenvironment. All these accomplishments, supported by this career development award, will have important impact in the immunotherapy and kidney cancer research field.
30

Publications, abstracts, and presentations: A few publications/abstract resulted from the supported study. 1. Li Shen, Ashley Orillion, Remi Adelaiye, Eric Ciamporcero, Swathi Ramakrishnan, and Roberto Pili.
Activity of a novel Foxp3-tumor cell vaccine in a murine model of renal cell carcinoma. Poster presentation. AACR annual meeting 2015.
There are two peer-reviewed journal publications during the award period. Although the experiments in the published papers are not directly supported by the award, there are overlap investigations on immunomodulatory activities of tasquinimod in both project supported by this award and published papers.
These papers are:
2. Shen L, Sundstedt A, Ciesielski M et al. Tasquinimod modulates suppressive myeloid cells and enhances cancer immunotherapies in murine models. Cancer Immunol Res 3(2), 136-148 (2015).
3. Shen L. and Pili R. Tasquinimod targets suppressive myeloid cells in the tumor microenvironment. OncoImmunology. 2015 DOI: 10.1080/2162402X.2015.1072672
31
Inventions, Patents, and Licenses: Nothing to report. Reportable outcomes: RENCA Foxp3 cells were made to prepare vaccine. Other Achievements: Nothing to report. References: Nothing to report . Brief Description of Career Development: PI of the study has completed proposed career/professional development activities during the award- supported period, as proposed in the award application. First, PI kept regular meetings with mentor to discuss the project and progress, including regular weekly lab meeting and one on one meeting with mentor. Teleconferences were held when mentor was not local. Discussions were also held with other investigators/key personnel to promote progress of the supported project. PI closely worked with key facilities, such as mouse model core facility, flow cytometry and image core facility, and bioinformatics and biostatistics faculties. Second, PI regularly participated and presented at seminars of GU program and Immunology program. Attended new technology development workshops, such as next generation sequencing, image stream, nanostring, etc… PI also trained in workshops for professional development, such as one-on-one train for oral presentation, leadership workshop. PI was invited to give a talk at new faculty session of 2014 annual RPCI science retreat. Career development award also supported PI to attend 2015 AACR annual meeting to present results from supported project, and communicate with our researchers. PI was recently appointed Assistant Professor of Oncology at RPCI upon completion of the award supported research.
32

Appendices: See attached one poster and two peer-reviewed journal publications.
33
Activity of a novel Foxp3-tumor cell vaccine in a murine model of renal cell carcinoma
Li Shen1, Ashley Orillion1, Remi Adelaiye1,2, Eric Ciamporcero1, Swathi Ramakrishnan1, and Roberto Pili1,2 1Genitourinary Program, Roswell Park Cancer Institute, Buffalo NY. 2Department of Medicine, Indiana University, Indianapolis, IN
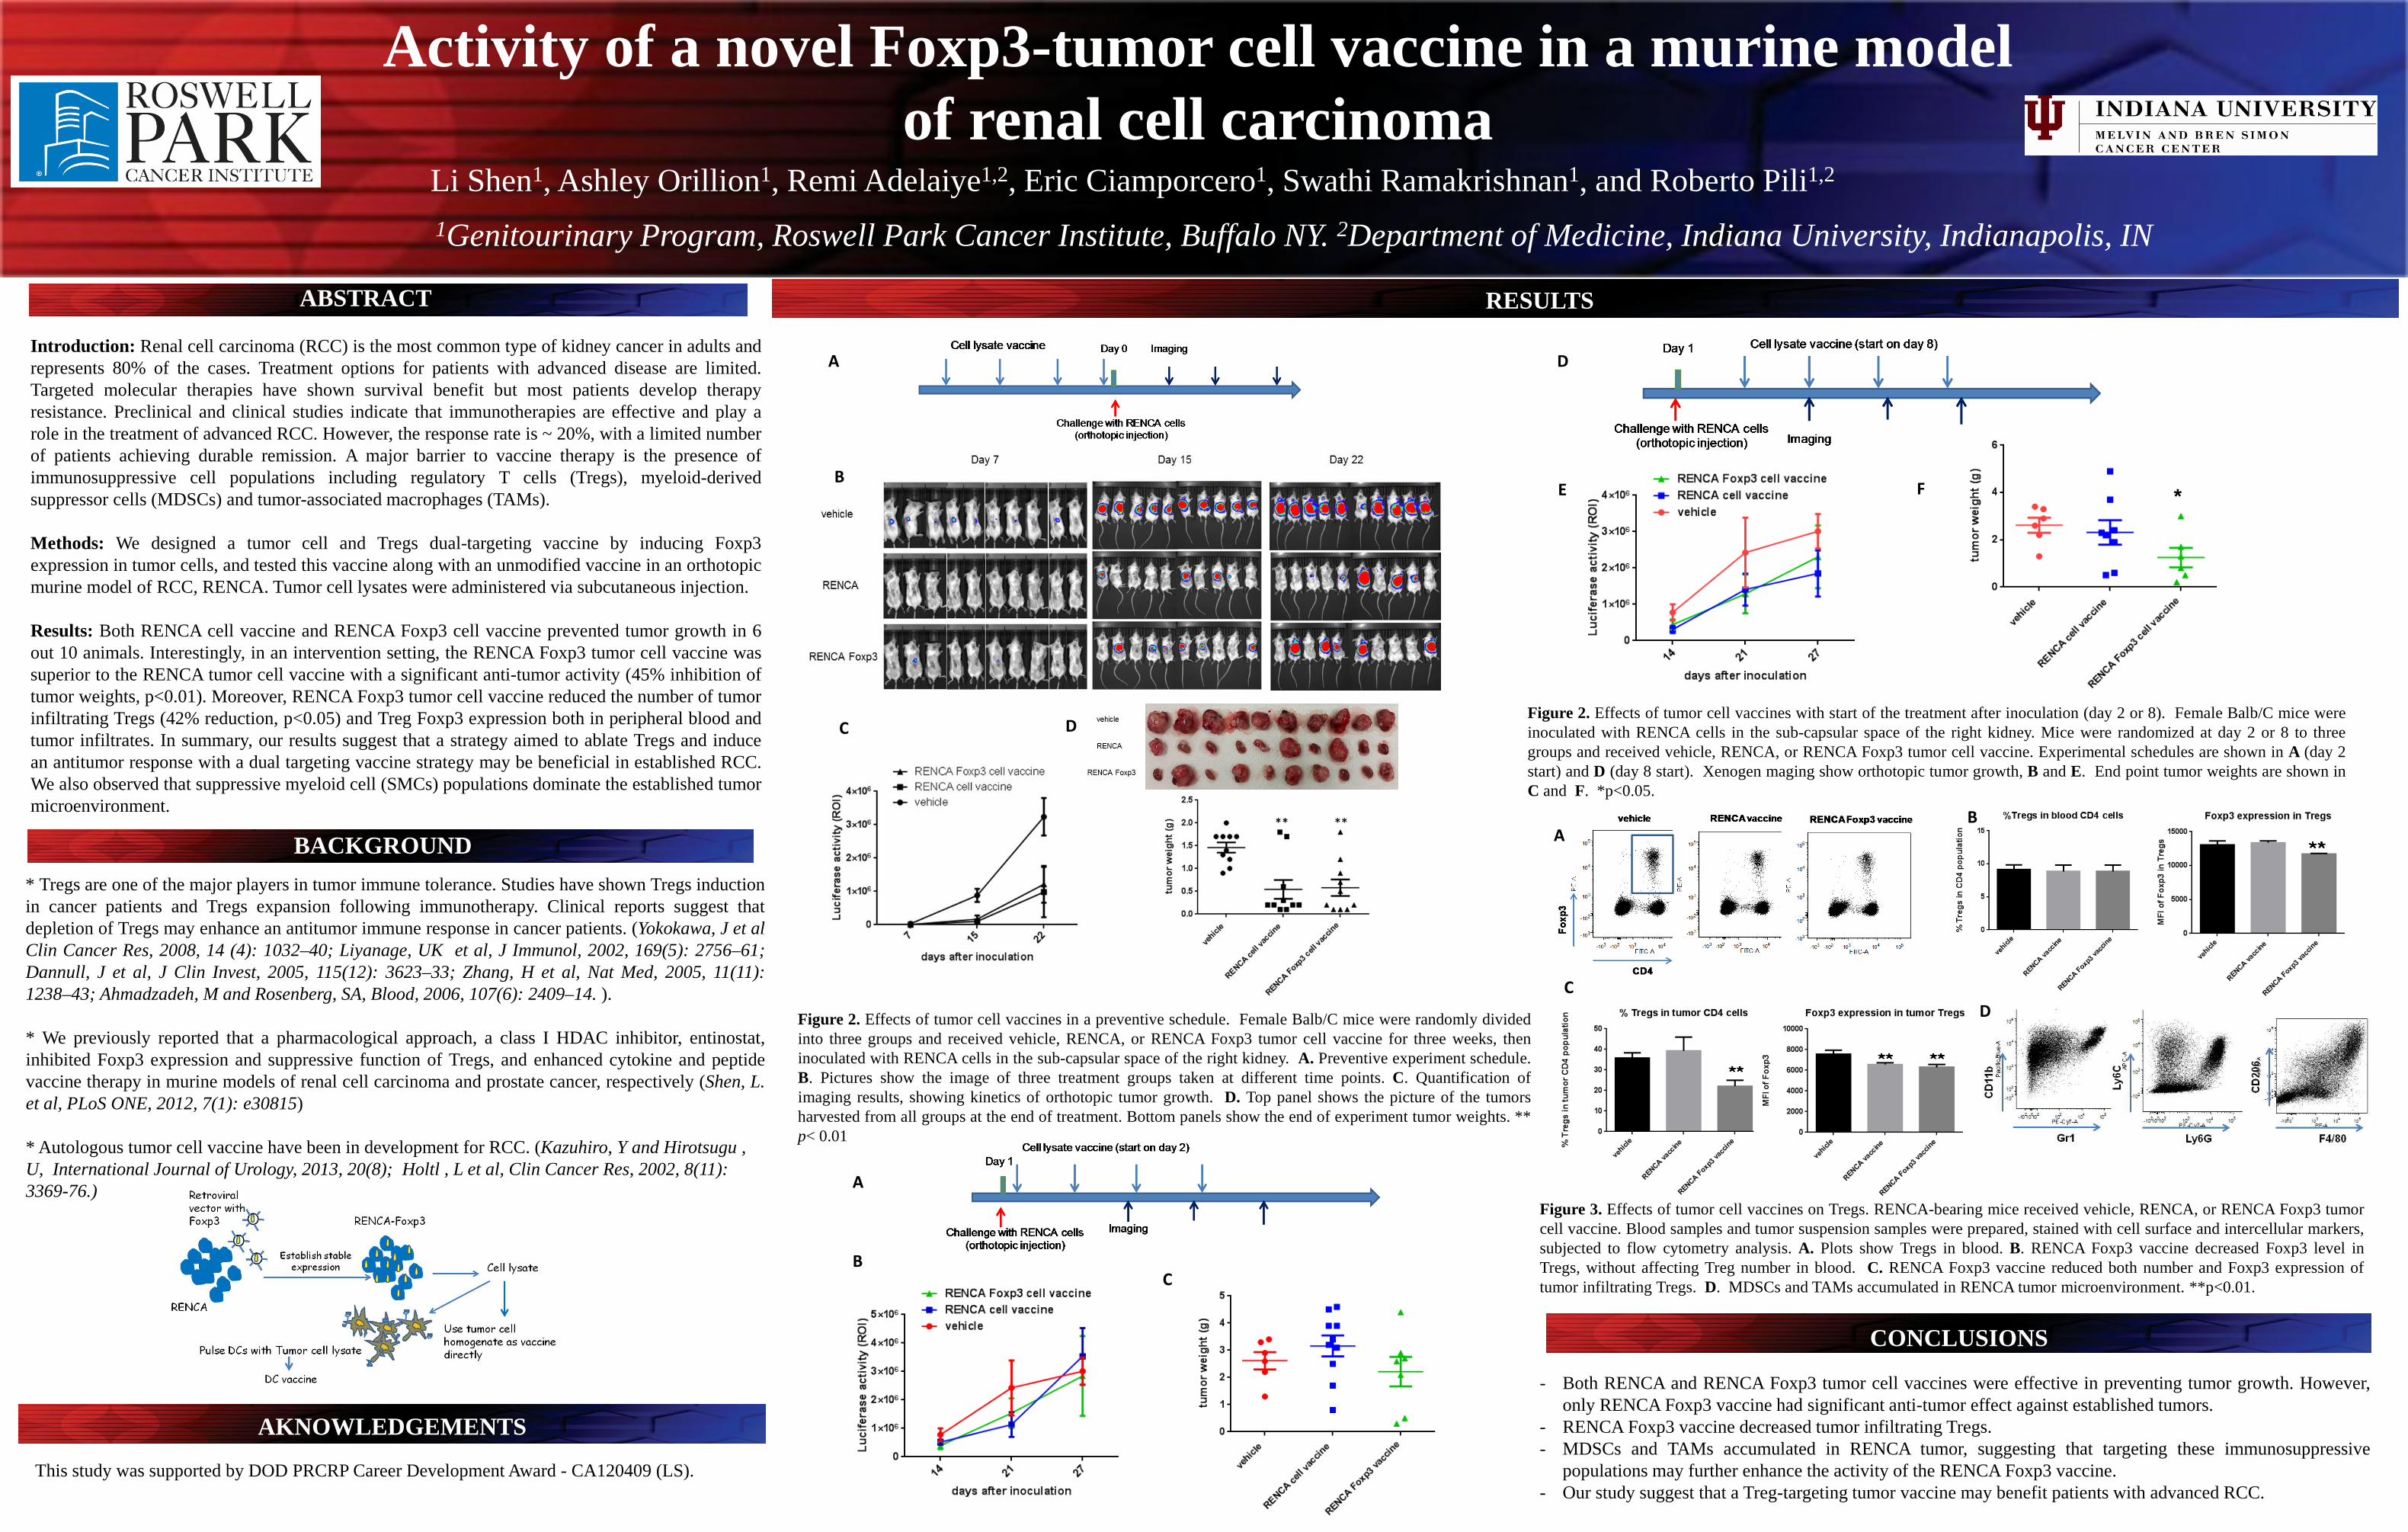
Introduction: Renal cell carcinoma (RCC) is the most common type of kidney cancer in adults and represents 80% of the cases. Treatment options for patients with advanced disease are limited. Targeted molecular therapies have shown survival benefit but most patients develop therapy resistance. Preclinical and clinical studies indicate that immunotherapies are effective and play a role in the treatment of advanced RCC. However, the response rate is ~ 20%, with a limited number of patients achieving durable remission. A major barrier to vaccine therapy is the presence of immunosuppressive cell populations including regulatory T cells (Tregs), myeloid-derived suppressor cells (MDSCs) and tumor-associated macrophages (TAMs). Methods: We designed a tumor cell and Tregs dual-targeting vaccine by inducing Foxp3 expression in tumor cells, and tested this vaccine along with an unmodified vaccine in an orthotopic murine model of RCC, RENCA. Tumor cell lysates were administered via subcutaneous injection. Results: Both RENCA cell vaccine and RENCA Foxp3 cell vaccine prevented tumor growth in 6 out 10 animals. Interestingly, in an intervention setting, the RENCA Foxp3 tumor cell vaccine was superior to the RENCA tumor cell vaccine with a significant anti-tumor activity (45% inhibition of tumor weights, p<0.01). Moreover, RENCA Foxp3 tumor cell vaccine reduced the number of tumor infiltrating Tregs (42% reduction, p<0.05) and Treg Foxp3 expression both in peripheral blood and tumor infiltrates. In summary, our results suggest that a strategy aimed to ablate Tregs and induce an antitumor response with a dual targeting vaccine strategy may be beneficial in established RCC. We also observed that suppressive myeloid cell (SMCs) populations dominate the established tumor microenvironment.
ABSTRACT
BACKGROUND
RESULTS
CONCLUSIONS
This study was supported by DOD PRCRP Career Development Award - CA120409 (LS).
- Both RENCA and RENCA Foxp3 tumor cell vaccines were effective in preventing tumor growth. However, only RENCA Foxp3 vaccine had significant anti-tumor effect against established tumors.
- RENCA Foxp3 vaccine decreased tumor infiltrating Tregs. - MDSCs and TAMs accumulated in RENCA tumor, suggesting that targeting these immunosuppressive
populations may further enhance the activity of the RENCA Foxp3 vaccine. - Our study suggest that a Treg-targeting tumor vaccine may benefit patients with advanced RCC.
* Tregs are one of the major players in tumor immune tolerance. Studies have shown Tregs induction in cancer patients and Tregs expansion following immunotherapy. Clinical reports suggest that depletion of Tregs may enhance an antitumor immune response in cancer patients. (Yokokawa, J et al Clin Cancer Res, 2008, 14 (4): 1032–40; Liyanage, UK et al, J Immunol, 2002, 169(5): 2756–61; Dannull, J et al, J Clin Invest, 2005, 115(12): 3623–33; Zhang, H et al, Nat Med, 2005, 11(11): 1238–43; Ahmadzadeh, M and Rosenberg, SA, Blood, 2006, 107(6): 2409–14. ). * We previously reported that a pharmacological approach, a class I HDAC inhibitor, entinostat, inhibited Foxp3 expression and suppressive function of Tregs, and enhanced cytokine and peptide vaccine therapy in murine models of renal cell carcinoma and prostate cancer, respectively (Shen, L. et al, PLoS ONE, 2012, 7(1): e30815)
* Autologous tumor cell vaccine have been in development for RCC. (Kazuhiro, Y and Hirotsugu , U, International Journal of Urology, 2013, 20(8); Holtl , L et al, Clin Cancer Res, 2002, 8(11): 3369-76.)
Figure 2. Effects of tumor cell vaccines with start of the treatment after inoculation (day 2 or 8). Female Balb/C mice were inoculated with RENCA cells in the sub-capsular space of the right kidney. Mice were randomized at day 2 or 8 to three groups and received vehicle, RENCA, or RENCA Foxp3 tumor cell vaccine. Experimental schedules are shown in A (day 2 start) and D (day 8 start). Xenogen maging show orthotopic tumor growth, B and E. End point tumor weights are shown in C and F. *p<0.05.
Figure 2. Effects of tumor cell vaccines in a preventive schedule. Female Balb/C mice were randomly divided into three groups and received vehicle, RENCA, or RENCA Foxp3 tumor cell vaccine for three weeks, then inoculated with RENCA cells in the sub-capsular space of the right kidney. A. Preventive experiment schedule. B. Pictures show the image of three treatment groups taken at different time points. C. Quantification of imaging results, showing kinetics of orthotopic tumor growth. D. Top panel shows the picture of the tumors harvested from all groups at the end of treatment. Bottom panels show the end of experiment tumor weights. ** p< 0.01
AKNOWLEDGEMENTS *
B
D C
A
A
B C
D
E F
Figure 3. Effects of tumor cell vaccines on Tregs. RENCA-bearing mice received vehicle, RENCA, or RENCA Foxp3 tumor cell vaccine. Blood samples and tumor suspension samples were prepared, stained with cell surface and intercellular markers, subjected to flow cytometry analysis. A. Plots show Tregs in blood. B. RENCA Foxp3 vaccine decreased Foxp3 level in Tregs, without affecting Treg number in blood. C. RENCA Foxp3 vaccine reduced both number and Foxp3 expression of tumor infiltrating Tregs. D. MDSCs and TAMs accumulated in RENCA tumor microenvironment. **p<0.01.
A B
C D
*

Research Article
Tasquinimod Modulates Suppressive MyeloidCells and Enhances Cancer Immunotherapies inMurine ModelsLi Shen1, Anette Sundstedt2, Michael Ciesielski3, Kiersten Marie Miles1, Mona Celander2,Remi Adelaiye1, Ashley Orillion1, Eric Ciamporcero1, Swathi Ramakrishnan1, Leigh Ellis1,Robert Fenstermaker3, Scott I. Abrams4, Helena Eriksson2, Tomas Leanderson2,5,Anders Olsson2, and Roberto Pili1
Abstract
A major barrier for cancer immunotherapy is the presence ofsuppressive cell populations in patients with cancer, such asmyeloid-derived suppressor cells (MDSC) and tumor-associatedmacrophages (TAM), which contribute to the immunosuppres-sive microenvironment that promotes tumor growth and metas-tasis. Tasquinimod is a novel antitumor agent that is currently atan advanced stage of clinical development for treatment ofcastration-resistant prostate cancer. A target of tasquinimod isthe inflammatory protein S100A9, which has been demonstratedto affect the accumulation and function of tumor-suppressivemyeloid cells. Here, we report that tasquinimod provided asignificant enhancement to the antitumor effects of two differentimmunotherapeutics in mouse models of cancer: a tumor vac-cine (SurVaxM) for prostate cancer and a tumor-targeted super-antigen (TTS) for melanoma. In the combination strategies,
tasquinimod inhibited distinct MDSC populations and TAMsof the M2-polarized phenotype (CD206þ). CD11bþ myeloidcells isolated from tumors of treated mice expressed lower levelsof arginase-1 and higher levels of inducible nitric oxide synthase(iNOS), and were less immunosuppressive ex vivo, which trans-lated into a significantly reduced tumor-promoting capacity invivo when these cells were coinjected with tumor cells. Tumor-specific CD8þ T cells were increased markedly in the circulationand in tumors. Furthermore, T-cell effector functions, includingcell-mediated cytotoxicity and IFNg production, were potentiat-ed. Taken together, these data suggest that pharmacologic target-ing of suppressive myeloid cells by tasquinimod induces ther-apeutic benefit and provide the rationale for clinical testing oftasquinimod in combination with cancer immunotherapies.Cancer Immunol Res; 3(2); 136–48. �2014 AACR.
IntroductionImmunotherapies have gained momentum in cancer
therapeutics following the recent approvals of drugs for thetreatment of prostate cancer and melanoma. Sipuleucel-Tdendritic cell (DC) vaccine is now available for treatment ofpatients with asymptomatic or minimally symptomatic,metastatic, and castration-resistant prostate cancer (1). Clinicalobservations have indicated that melanoma is an immunogenictumor (2), and extended survival data have led to the approval ofthe immune checkpoint inhibitor ipilimumab for the treatment of
metastaticmelanoma(3).However, despite these clinical advances,immunotherapies for these diseases and solid tumors, in general,benefit only a subset of patients, as intrinsic or acquired tumorimmune tolerance remains a major hurdle.
A significant barrier in vaccine therapy is the presence ofimmunosuppressive soluble and cellular components, includingmyeloid-derived suppressor cells (MDSC; ref. 4) and tumor-associated macrophages (TAM; ref. 5), which are induced bytumor- and stroma-secreted inflammatory mediators (6–8).MDSCs facilitate tumor progression by impairing T-cell andnatural killer (NK)–cell activation (9) and by modulatingangiogenesis. Preclinical data have suggested a role for MDSCsin suppressing T-cell responses and inducing tolerance againsttumor-associated antigens (TAA; ref. 9). In addition, by secretingIL10 and TGFb, MDSCs induce the accumulation of otherimmunosuppressive cell populations such as regulatory T cells(Treg; refs. 10–12). Similarly, the presence of TAMs in the tumormicroenvironment (TME) may inhibit the immune response (13).Taken together, there is strong evidence indicating that targetingimmunosuppressiveMDSCsandTAMsandmodifying theTMEcanimprove the efficacy of immunotherapy.
Tasquinimod, a quinoline-3-carboxyamide analogue, is inclinical development for treatment of prostate cancer and othersolid tumors. In a placebo-controlled, phase II randomized trial,tasquinimod doubled themedian progression-free survival (PFS)period and prolonged survival of patients with metastatic,
1Genitourinary Program, Roswell Park Cancer Institute, Buffalo, NewYork. 2Active Biotech AB, Lund, Sweden. 3Department of Neurosur-gery, Roswell ParkCancer Institute, Buffalo,NewYork. 4DepartmentofTumor Immunology, Roswell Park Cancer Institute, Buffalo, New York.5Immunology Group, Lund University, Lund, Sweden.
Note: Supplementary data for this article are available at Cancer ImmunologyResearch Online (http://cancerimmunolres.aacrjournals.org/).
L. Shen and A. Sundstedt contributed equally to this article.
Corresponding Authors: Roberto Pili, Roswell Park Cancer Institute, Universityat Buffalo, Elm & Carlton Streets, Buffalo, NY 14263-0001. Phone: 716-845-3851;Fax: 716-845-4620; E-mail: [email protected]; and Anders Olsson,Active Biotech AB, Lund, Sweden. E-mail: [email protected]
doi: 10.1158/2326-6066.CIR-14-0036
�2014 American Association for Cancer Research.
CancerImmunologyResearch
Cancer Immunol Res; 3(2) February 2015136

castration-resistant prostate cancer (14, 15). A phase III clinicaltrial to test the effect of tasquinimod in the same patientpopulation is ongoing (NCT01234311). Tasquinimod has beenshown to inhibit prostate cancer growth andmetastasis in animalmodels (16–18). Results from these studies have suggestedthat the antiangiogenic property of this molecule may beresponsible for its antitumor activity, because tumor growthinhibition was associated with reduced microvasculaturedensity, increased expression, and secretion of the angiogenesisinhibitor thrombospondin-1 (TSP-1), and downregulation ofVEGF and hypoxia-inducible factor-1a (HIF1a; refs. 19, 20).More recent data have suggested that tasquinimod may affectHIF by interfering with histone deacetylase 4 (HDAC 4; ref. 21).However, in an orthotopic, metastatic prostate cancer model,tasquinimod reduced the rate of metastasis without affectingmicrovessel density in the primary tumor (18). Therefore,mechanisms other than impairing angiogenesis may play animportant role in the antitumor and antimetastatic activities oftasquinimod.
S100A9, a Ca2þ-binding inflammatory protein, has beenidentified as a potential target of tasquinimod. S100A9 interactswith proinflammatory receptors Toll-like receptor 4 (TLR4)and receptor of advanced glycation end products (RAGE),and this interaction is inhibited by the specific binding oftasquinimod to S100A9 (22, 23). These receptors are expressedon the surface of multiple myeloid-cell populations, includingMDSCs, macrophages, DCs, and endothelial cells. Functionally,S100A9 regulates the accumulation of MDSCs and inhibitsDC differentiation (24, 25), which may lead to suppression ofimmune responses and tumor progression. Therefore, bytargeting S100A9, tasquinimod has immunomodulatory activityand the potential to regulate multiple myeloid populations.
In this study, we tested the effect of tasquinimod onimmunosuppressive myeloid-cell populations and investigatedits immunomodulatory activity. We conducted preclinicalstudies of tasquinimod in combination with two differentimmunotherapeutic approaches in mouse models of prostatecancer and melanoma. Our results suggest that treatment withtasquinimod affects the TME by modulating suppressive myeloid-cell populations, leading to augmented immune responses andenhanced antitumor effects of immunotherapies.
Materials and MethodsTumor cells
The development of castration-resistant Myc-CaP cell line hasbeen reportedpreviously (26).Castration-resistantMyc-CaPcell linewas cultured in DMEM (Mediatech, Inc.) with 10% FBS. The 5T4-tranfected murine B16-F10 melanoma cell line (B16-h5T4; ref. 27)was kindly provided by Peter Stern (Paterson Institute for CancerResearch,Manchester,UK) andwas cultured inR10medium[RPMI-1640 with Ultra glutamine (BioWhittaker/Lonza); supplementedwith 10% FBS (Fisher Scientific), 1 mmol/L sodium pyruvate, 10mmol/L HEPES, 0.1 mg/mL gentamicin sulfate, and 50 mmol/Lb-mercaptoethanol]. The castration-resistant Myc-CaP and B16-h5T4 cell lines were tested to be Mycoplasma free; no otherauthentication assay was performed.
In vivo tumor growthThe animal protocolswere approved by the Institutional Animal
Care andUse Committee at Roswell Park Cancer Institute (Buffalo,
NY; protocol 1137 M), or by the Bioethics Committee in Lund,Sweden (M60-10), as indicated, and were in accordance with theNIHGuide for theCare andUse of Laboratory Animals. Castration-resistant Myc-CaP cells (1 � 106) were inoculated subcutaneously(s.c.) in the right flank of castrated male FVB mice. Animals weredistributed randomly into four treatment groups (7–9 animals/group): vehicle, vaccine (SurVaxM), tasquinimod (10 mg/kg/din drinking water), or the combination. Mice were given 100 mgof SurVaxM peptide and 100 ng of GM-CSF by s.c. injection, onceperweek. The tumor sizewasmeasuredby a caliper twice aweek. Atthe end of the 3- to 4-week experiment, tumors and spleens werecollected and analyzed. B16-h5T4 cells were cultured as describedabove, counted, resuspended, and maintained in ice-cold Matrigel(BD Biosciences) at a concentration of 0.3 � 105 cells/mL. Tumorcellswere implanted s.c. into the hindflankofC57Bl/6mice onday0 in a volume of 0.1 mL Matrigel. Mice were treated withtasquinimod (30 mg/kg/d in drinking water) either from day 0or 1 after tumor inoculation and throughout the experiments. Fortumor-targeted superantigen (TTS) treatment, mice were givendaily injections of 5T4Fab-SEA (25 mg/kg) on days 3 to 6, or ondays 9 to 11 for analysis of TTS-reactive T cells in the tumors.Experimentswere terminated between days 16 and 21. Tumor sizesweremeasured twice a week and tumor volumeswere calculated asvolume¼ L�W2� 0.4,where L is the length (mm) andW (mm) isthe width of the tumor (L > W; ref. 28). Animal experiments andcorrelative studies in the castration-resistant Myc-CaP and the B16-h5T4 models were conducted at Roswell Park Cancer Institute andActive Biotech AB, respectively.
Splenocytes and tumor suspension preparationFor isolation of splenocytes, spleens were harvested, mashed
on, and passed through a 70-mm strainer. These cell suspensionswere centrifuged at 300 � g for 10 minutes at 4�C. Cellpellets were treated with ACK lysing buffer (Biosource).Splenocytes were then resuspended and cultured in completemedia [RPMI supplemented with 10% FBS, 1 mmol/L sodiumpyruvate, 100 mmol/L nonessential amino acid, 2 mmol/LL-glutamine, Pen (100 U/mL)–Strep (100 mg/mL), and 55mmol/L b-mecaptoethanol]. Single-cell suspensions wereprepared from tumors with mouse tumor dissociation kit(Miltenyi Biotec). Briefly, tumors were cut into small piecesand incubated in an enzyme-cocktail solution for 40 minutesat 37�C with agitation, followed by meshing the tumors in a 70-mm cell strainer. Alternatively, the tumors were cut into smallpieces and incubated in 0.5 mg/mL collagenase IV (WorthingtonBiochemical Corporation) and 0.1% DNase (Sigma-Aldrich) for45 minutes at 37�C, followed by meshing the tumors in a 70-mmcell strainer.
Cell staining and flow cytometrySplenocytes, tumor single-cell suspensions, or peripheral blood
cells were washed with flow buffer (PBS with 1% of FBS and2mmol/L of EDTA), then incubatedwith an Fc-blocking antibody(anti-mouse CD16/CD32 mAb 2.4G2; BD Biosciences), andstained with fluorescence-conjugated antibodies against surfacemarkers. Cells were then fixed in Fix/Perm buffer (eBioscience)and stained with antibodies against intracellular proteins. Thefollowingfluorochrome-labeled antibodieswere used:Gr1 (cloneRB6-8C5), CD11b (cloneM1/70), Ly6G (clone 1A8), Ly6C (cloneAL-21), F4/80 (clone BM8), CD206 (clone C068C2), Arg 1(polyclonal antibody; R&D Systems; Cat: IC5868A), iNOS
Tasquinimod Enhances Cancer Immunotherapies
www.aacrjournals.org Cancer Immunol Res; 3(2) February 2015 137

(clone CXNFT), CD4 (clone RM4-5), CD8a (clone 53-6.7), TCR-Vb3 (clone KJ25), and TCR-Vb8 (clone F23.1) were purchasedfrom BD Biosciences, eBioscience, BioLegend, and R&D Systems.Cells stained with specific antibodies, as well as isotype-control–stained cells, were assayed on a FACSCalibur, a FACSCantoII, or aLSR II flow cytometer (BD Biosciences). Data analysis wasperformed using the FCS Express (De Novo Software) or FACSDiva software (BD Biosciences).
IFNg induction assaySplenocytes (1 � 106) were cultured with stimulation of PMA
(Sigma; 20 ng/mL) and ionomycin (Sigma; 1 mg/mL) for 5 hours.Brefeldin A (Sigma) was added to the cultures to block proteinsecretion. Cells were harvested and stained for surface markers,then fixed and stained for intracellular IFNg (eBioscience), andanalyzed by flow cytometry.
Granzyme B induction assaySplenocytes (1 � 106) were cultured with stimulation of CD3
(eBioscience; 1 mg/mL) and CD28 (0.5 mg/mL) for 72 hours.Brefeldin A (Sigma) was added to the cultures during the last 5hours of culture to block protein secretion. Cells were harvestedand stained for surface markers, then fixed and stained forintracellular Granzyme B (eBioscience) and analyzed by flowcytometry.
T-cell suppression assaysT cells (1� 105; isolated with a Pan T cell isolation kit; Miltenyi
Biotec) were cultured in plates coated with CD3 (eBioscience;1 mg/mL) and CD28 (0.5 mg/mL) for 72 hours. Different numbersof magnetic beads–purified CD11bþ cells from tumors wereadded to the culture at the beginning. 3H-thymidine (1 mCi)was added to the culture for the last 12 hours. Cells were thenharvested and the incorporated 3H-thymidine was detected withscintillation counting. Alternatively, CD11bþ cells were added toCFSE-(Vybrant CFDA SE Cell Tracer Kit; Molecular Probes)–labeled T cells (isolated from na€�ve spleens using a Pan T cellisolation kit; Miltenyi Biotec) activated by anti–CD3/anti–CD28-coated beads (Dynabeads; Dynal) and incubated for 72 hours.The frequencies of divided CD4þ and CD8þ T cells weredetermined by FACS analysis.
Splenocyte- and CD8 T cell–mediated cytotoxicity assayCytotoxicity assay was performed by using LIVE/DEAD cell-
mediated cytotoxicity kit (Invitrogen). Castration-resistant Myc-CaP cells were labeledwithDio and cultured in completemedium.Splenocytes or isolated CD8þ T cells were added to the culture indifferent ratios to tumor cells. After 5-hour incubation, all cells inculture were harvested and propidium iodide (PI) staining wasperformed to detect dead cells. Cell cytotoxicity was analyzed bycalculating percentage of dead cells with Dio label compared withthe whole-cell population with Dio label. Cell events wereacquired using LSRII and FACSDiva. Data were analyzed withFCS Express (De Novo Software).
Antigen-specific tetramer binding assayBlood samples (100 mL) and splenocytes (1 � 106 cells) were
incubated for 30minutes with 10 mL of iTAgMHC Class I MurineH2-Kb Tetramer-SA-PE bound by MFFCFKEL peptide withspecificity for SurVaxM (Beckman Coulter) or iTAg MHC ClassI Murine H2-Kb Tetramer-SA-PE bound by SIINFEKL ovalbumin
peptide to represent negative control (BeckmanCoulter). Sampleswere also labeled with 10 mL of anti–CD8-FITC (clone 53.6.7;BioLegend). Following incubation, 1 mL of iTAg MHC TetramerLyse Reagent (Beckman Coulter) supplemented with 25 mL ofiTAgMHC Tetramer Fix Reagent (Beckman Coulter) was added tothe samples, which were then incubated for 10 minutes at roomtemperature, subsequently washed with PBS, and resuspended in400 mL of FluoroFix Buffer (BioLegend).
Immunofluorescence staining of tumor sectionsSnap-frozen tumors were sliced into 8-mm frozen sections
and fixed in cold acetone for 10 minutes, before fluorescencelabeling. Primary antibody, rat anti-mouse CD31 (BD, Mec 13.3;1:1,000) and secondary antibody, goat anti-rat Alexa Fluor-555(Invitrogen; AF555; 1:500) in PBS (5% and 2% mouse serum,respectively) were used, and slides were washed in PBS andmounted with fluorescence mounting medium (Dako; S3023).The sections were analyzed in a Leica DMRX-E microscope.Representative photos were taken and the density of CD31-positive cells (fluorescence) was measured with Leica QWinimage analysis system.
Immunohistochemistry stainingTissue specimens were fixed for 24-hour, paraffin-embedded
and 4-mm sections were prepared. Sections were deparaffinizedand rehydrated through graded alcohol washes. Antigenunmasking was achieved by boiling slides in sodium citratebuffer (pH, 6.0). Sections were further incubated in hydrogenperoxide to reduce endogenous activity. Then tissue sections wereblocked with 2.5% horse serum (Vector Laboratories) andincubated overnight in primary antibodies against CD31(1:100; Dianova). Following anti-CD31 incubation, tissuesections were incubated in horseradish peroxidase-conjugatedanti-rat antibody according to the manufacturer's protocol(Vector Laboratories) followed by enzymatic development indiaminobenzidine (DAB) and counterstained in hematoxylin.Sections were dehydrated and mounted with cytoseal 60(Thermo Scientific). Corresponding isotype negative controlswere used for evaluation of specific staining. Stained sectionswere analyzed under bright field using the Zeiss Axiomicroscope.The number of positive cells was determined in a blinded fashionby analyzing four random 20� fields per tissue and quantifiedusing ImageJ software.
Quantitative real-time PCRmRNA was extracted from CD11bþ cells that were isolated as
anti-CD11bþmagnetic bead fractions from single-cell suspensionsof B16-h5T4 tumors. mRNA extraction was performed usingthe RNeasy Mini Kit (Qiagen) and RNA concentration andpurity was determined through measurement of A260/A280ratios with a NanoDrop ND-1000 spectrophotometer. cDNAwas prepared using the iScript Kit (Bio-Rad) and qPCR wasperformed using a CFX384 real-time PCR detection system (Bio-Rad)witha three-stepPCRprotocol (95�Cfor10minutes, followedby45 cycles of 95�C for 10 seconds, and58�C for 30 seconds) usingSYBR Green (SsoFast EvaGreen; Bio-Rad) as fluorophore andexpression levels were calculated (CFX Manager software; Bio-Rad) as normalized DCt expression values between the targetgene and the two "housekeeping" genes b-actin and Ywhaz.Data were presented as fold-induction (2DDCt) levels of treatedtumors compared with control tumors (DDCt). The primers used
Shen et al.
Cancer Immunol Res; 3(2) February 2015 Cancer Immunology Research138

for target geneswere:b-actin_fw50-ATGCTC CCC GGG CTG TAT-30, b-actin_rev 50-CAT AGG AGT CCT TCT GAC CCA TTC-30;Ywhaz_fw 50-AAC AGC TTT CGA TGA AGC CAT-30 Ywhaz_rev50-TGG GTA TCC GAT GTC CAC AAT-30; CD206_fw 50-GCAAAT GGA GCC GTC TGT GC-30, CD206_rev 50-CTC GTG GATCTC CGT GAC AC-30; Arg-1_fw 50-GTG AAG AAC CCA CGGTCT GT-30, Arg-1_rev 50-CTG GTT GTC AGG GGA GTG TT-30;iNOS_fw 50-TGG TGG TGA CAA GCA CAT TT-30, iNOS_rev 50-AAG GCC AAA CAC AGC ATA CC-30; Cxcl9_fw 50-TCA ACAAAA GAG CTG CCA AA-30, Cxcl9_rev 50-GCA GAG GCC AGAAGA GAG AA-30; CxCl10_fw 50-TCTGAGTCCTCGCTCAAGTG-30, CxCl10_rev 50-CCTTGGGAAGATGGTGGTTA-30; Cxcl11_fw50-TCC TTT CCC CAA ATA TCA CG-30, Cxcl11_rev 50-CAG CCATCC CTA CCA TTC AT-30; Ccr2_fw 50-ACT TTT CCG AAG GACCGT CT-30, Ccr2_rev 50-GTA ACA GCA TCC GCC AGT TT-30;Ccl2_fw 50-CAGGTCCCTGTCATGCTTCT-30, Ccl2_rev 50-GTCAGCACAGAC CTCTCTCT-30; S100A9_fw 50-CAG CATAAC CAC CAT CAT CG-30, S100A9_rev 50-GCC AAC TGTGCT TCC ACC AT-30; S100A8_fw 50-GCT CCG TCT TCAAGA CAT CGT-30, S100A8_rev 50-GGC TGT CTT TGT GAGATG CC-30; and IL12b_fw 50-GAAAGACCCTGACCATCACT-30, IL12b_rev 50-CCTTCTCTGCAGACAGAGAC-30.
Nitric oxide synthase activity assayThe assay was performed with an ultra-sensitive assay for nitric
oxide synthase (NOS) from Oxford Biomedical Research (Cat:NB78). Briefly, lysates from isolated CD11b cells were firstincubated with substrates and cofactors. Then, the mixtureswere incubated with nitrate reductase to transform nitrate tonitrite, and mixed with coloring reagent to quantify total end-product concentration. These reactions were performed in a 96-well plate and absorbance was read at 540 nm.
Statistical analysisThe difference in tumor weight between treatment groups was
statistically evaluated by the nonparametric Mann–Whitney Utest. Differences between experimental groups were tested byeither the Student t test or for variances by ANOVA. P < 0.05was considered statistically significant.
ResultsTasquinimod enhances immunotherapy in castration-resistant prostate cancer and melanoma models
Results from previous studies in experimental tumor modelsindicated that immunomodulatory effects of tasquinimodmay contribute to its antitumor activity (23). To investigatethe potential immunomodulatory activities of tasquinimod,we tested this agent in combination with a survivin peptidevaccine (SurVaxM) in a survivin-expressing castration-resistantMyc-CaP prostate cancer model and with a TTS in a B16melanoma model.
Survivin is an intracellular TAA expressed in several solidtumors, including prostate cancer (29). SurVaxM is a modifiedsurvivin peptide vaccine SVN53-67/M57-KLH (30) that wehave tested previously in multiple tumor models (31). FVBmice were inoculated with castration-resistant Myc-CaP cellss.c. Tumor-bearing mice were divided into four groups andtreated with vehicle, SurVaxM (1 dose/wk), tasquinimod (10mg/kg/d in drinking water), or the combination of SurVaxMand tasquinimod. In the castration-resistant Myc-CaP model,
SurVaxM and tasquinimod single treatments displayed modestantitumor effect but did not induce significant change in tumorgrowth (Fig. 1A, left). However, the combination of SurVaxMand tasquinimod significantly inhibited tumor growth(58% reduction; combination vs. vehicle; P ¼ 0.0002). Thecombination treatment also significantly inhibited tumorgrowth compared with that of single treatment groups(tasquinimod vs. combination, P ¼ 0.009; survivin vs.combination, P ¼ 0.017). Similarly, both SurVaxM andtasquinimod single treatments induced modest, but notstatistically significant, reductions of tumor weight at theendpoint of the study, whereas the combination inducedmore than additive effect, a 65% reduction from vehiclelevel (Fig. 1A, right; vehicle vs. combination; P ¼ 0.0002).
In parallel, we tested tasquinimod in combination with adifferent immunotherapy approach, TTS in a transplantableB16 melanoma model. TTS immunotherapy activates anddirects T lymphocytes to attack tumor cells by means of fusionproteins between bacterial superantigens, such as staphylococcalenterotoxin A (SEA) and Fab-fragments of tumor-reactivemonoclonal antibodies (mAb; ref. 32). Superantigensactivate a high number of CD4þ and CD8þ T cells expressingparticular T-cell receptor (TCR)-Vb chains (33). In this study,B16-h5T4–expressing tumors were treated with tasquinimod(30 mg/kg/d in drinking water), the TTS fusion protein 5T4Fab-SEA at a suboptimal therapeutic dose (25 mg/kg), or thecombination. Tasquinimod treatment began the day aftertumor-cell inoculation, and 5T4Fab-SEA was administeredon days 3 to 6. Although both TTS and tasquinimod single-agent treatments elicited substantial antitumor effects, thecombination regimen led to a significant reduction in tumorsize at the endpoint (>75% reduction; vehicle vs. combination;P < 0.0001; Fig. 1B). Thus, the combination of tasquinimodwith two different immunotherapeutic strategies resulted in asignificant enhancement of antitumor effects.
Enhanced immunotherapy is associated with induction ofeffector T cells and increased antitumor immune responses
To determine whether the observed inhibition of tumorgrowth induced by the combination strategy was associatedwith improved immune responses, we examined CD8þ Tcells harvested at the end of the experiment. First, using asurvivin vaccine-specific peptide-MHC class I tetramer bindingassay, we showed that the survivin vaccine, as a single treat-ment or in combination with tasquinimod, induced antigen-specific CD8þ T cells (Supplementary Fig. S1). We also testedthe cellular expression of IFNg and Granzyme B, which arecritical for CD8þ effector T-cell functions. Splenocytes wereisolated from differentially treated mice, stimulated, andthen stained for cell-surface markers and intracellularproteins. IFNg expression was increased slightly in CD8þ Tcells from combination-treated animals as compared withvehicle group (Fig. 2A), while no significant changes wereobserved in CD8þ T cells from single agent–treated animals.Similarly, when compared with vehicle- and single agent–treated groups, Granzyme B expression in CD8þ T cellsfrom combination-treated animals was significantly higher(Fig. 2B).
To determine whether the changes in specific CD8þ T cells wereassociated with an improvement in cytotoxic T lymphocyte (CTL)activity, we tested ex vivo the ability of splenocytes and purified
Tasquinimod Enhances Cancer Immunotherapies
www.aacrjournals.org Cancer Immunol Res; 3(2) February 2015 139
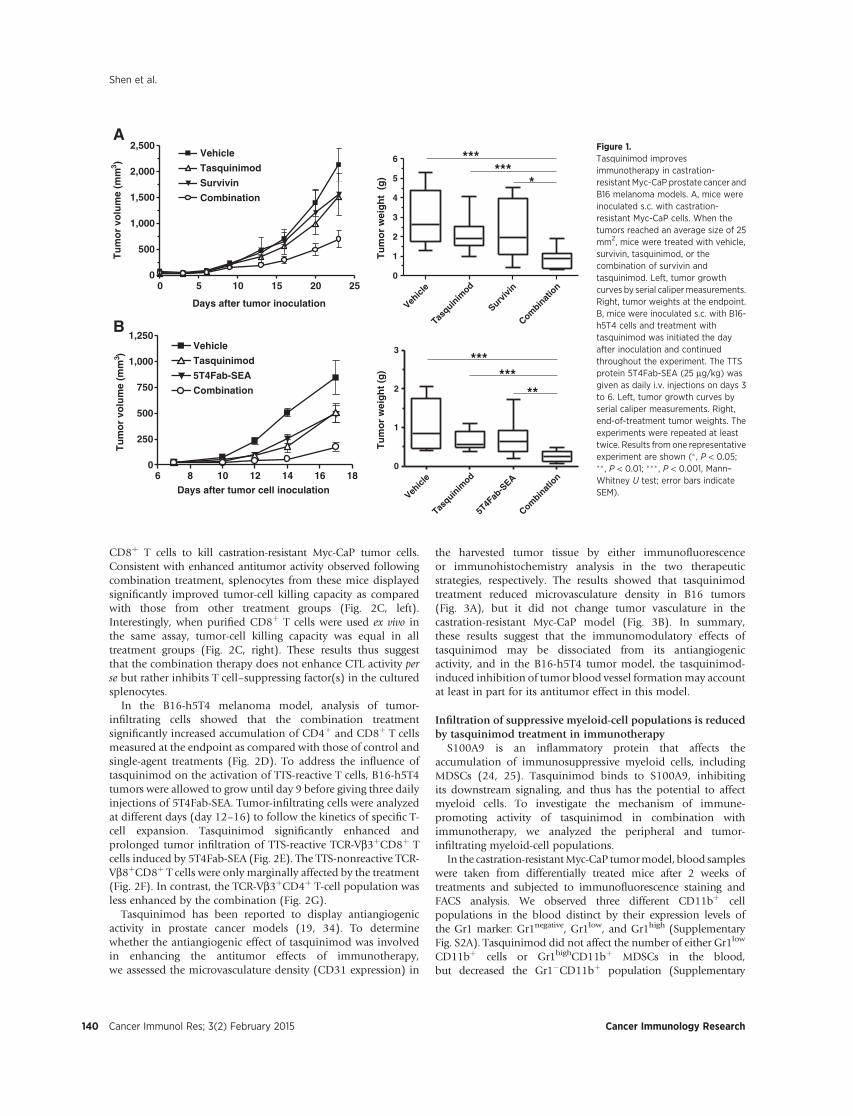
CD8þ T cells to kill castration-resistant Myc-CaP tumor cells.Consistent with enhanced antitumor activity observed followingcombination treatment, splenocytes from these mice displayedsignificantly improved tumor-cell killing capacity as comparedwith those from other treatment groups (Fig. 2C, left).Interestingly, when purified CD8þ T cells were used ex vivo inthe same assay, tumor-cell killing capacity was equal in alltreatment groups (Fig. 2C, right). These results thus suggestthat the combination therapy does not enhance CTL activity perse but rather inhibits T cell–suppressing factor(s) in the culturedsplenocytes.
In the B16-h5T4 melanoma model, analysis of tumor-infiltrating cells showed that the combination treatmentsignificantly increased accumulation of CD4þ and CD8þ T cellsmeasured at the endpoint as compared with those of control andsingle-agent treatments (Fig. 2D). To address the influence oftasquinimod on the activation of TTS-reactive T cells, B16-h5T4tumors were allowed to grow until day 9 before giving three dailyinjections of 5T4Fab-SEA. Tumor-infiltrating cells were analyzedat different days (day 12–16) to follow the kinetics of specific T-cell expansion. Tasquinimod significantly enhanced andprolonged tumor infiltration of TTS-reactive TCR-Vb3þCD8þ Tcells induced by 5T4Fab-SEA (Fig. 2E). The TTS-nonreactive TCR-Vb8þCD8þ T cells were only marginally affected by the treatment(Fig. 2F). In contrast, the TCR-Vb3þCD4þ T-cell population wasless enhanced by the combination (Fig. 2G).
Tasquinimod has been reported to display antiangiogenicactivity in prostate cancer models (19, 34). To determinewhether the antiangiogenic effect of tasquinimod was involvedin enhancing the antitumor effects of immunotherapy,we assessed the microvasculature density (CD31 expression) in
the harvested tumor tissue by either immunofluorescenceor immunohistochemistry analysis in the two therapeuticstrategies, respectively. The results showed that tasquinimodtreatment reduced microvasculature density in B16 tumors(Fig. 3A), but it did not change tumor vasculature in thecastration-resistant Myc-CaP model (Fig. 3B). In summary,these results suggest that the immunomodulatory effects oftasquinimod may be dissociated from its antiangiogenicactivity, and in the B16-h5T4 tumor model, the tasquinimod-induced inhibition of tumor blood vessel formationmay accountat least in part for its antitumor effect in this model.
Infiltration of suppressive myeloid-cell populations is reducedby tasquinimod treatment in immunotherapy
S100A9 is an inflammatory protein that affects theaccumulation of immunosuppressive myeloid cells, includingMDSCs (24, 25). Tasquinimod binds to S100A9, inhibitingits downstream signaling, and thus has the potential to affectmyeloid cells. To investigate the mechanism of immune-promoting activity of tasquinimod in combination withimmunotherapy, we analyzed the peripheral and tumor-infiltrating myeloid-cell populations.
In the castration-resistantMyc-CaP tumormodel, blood sampleswere taken from differentially treated mice after 2 weeks oftreatments and subjected to immunofluorescence staining andFACS analysis. We observed three different CD11bþ cellpopulations in the blood distinct by their expression levels ofthe Gr1 marker: Gr1negative, Gr1low, and Gr1high (SupplementaryFig. S2A). Tasquinimod did not affect the number of either Gr1low
CD11bþ cells or Gr1highCD11bþ MDSCs in the blood,but decreased the Gr1�CD11bþ population (Supplementary
A
B
6 8 10 12 14 16 180
250
500
750
1,000
1,250Vehicle
5T4Fab-SEA
Combination
Tasquinimod
Days after tumor cell inoculation
Tu
mo
r vo
lum
e (m
m3 )
Vehicl
e
Tasquin
imod
Survivi
n
Combin
atio
n0
1
2
3
4
5
6 ******
*
Tu
mo
r w
eig
ht
(g
)
Vehicl
e
Tasquin
imod
5T4F
ab-S
EA
Combin
atio
n0
1
2
3***
*****
Tu
mo
r w
eig
ht
(g)
0 5 10 15 20 250
500
1,000
1,500
2,000
2,500Vehicle
Tasquinimod
Combination
Survivin
Days after tumor inoculation
Tu
mo
r vo
lum
e (m
m3 )
Figure 1.Tasquinimod improvesimmunotherapy in castration-resistant Myc-CaP prostate cancer andB16 melanoma models. A, mice wereinoculated s.c. with castration-resistant Myc-CaP cells. When thetumors reached an average size of 25mm2, mice were treated with vehicle,survivin, tasquinimod, or thecombination of survivin andtasquinimod. Left, tumor growthcurves by serial calipermeasurements.Right, tumor weights at the endpoint.B, mice were inoculated s.c. with B16-h5T4 cells and treatment withtasquinimod was initiated the dayafter inoculation and continuedthroughout the experiment. The TTSprotein 5T4Fab-SEA (25 mg/kg) wasgiven as daily i.v. injections on days 3to 6. Left, tumor growth curves byserial caliper measurements. Right,end-of-treatment tumor weights. Theexperiments were repeated at leasttwice. Results from one representativeexperiment are shown (� , P < 0.05;�� , P < 0.01; ��� , P < 0.001, Mann–Whitney U test; error bars indicateSEM).
Shen et al.
Cancer Immunol Res; 3(2) February 2015 Cancer Immunology Research140
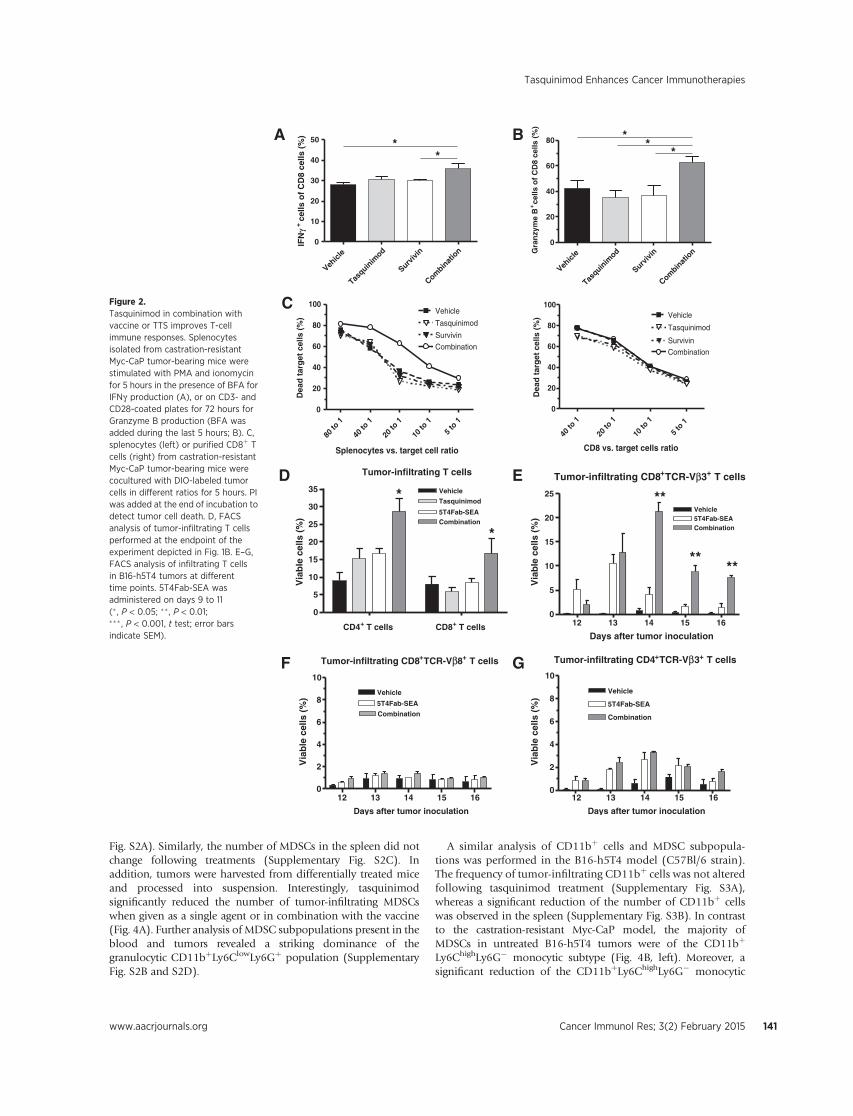
Fig. S2A). Similarly, the number of MDSCs in the spleen did notchange following treatments (Supplementary Fig. S2C). Inaddition, tumors were harvested from differentially treated miceand processed into suspension. Interestingly, tasquinimodsignificantly reduced the number of tumor-infiltrating MDSCswhen given as a single agent or in combination with the vaccine(Fig. 4A). Further analysis of MDSC subpopulations present in theblood and tumors revealed a striking dominance of thegranulocytic CD11bþLy6ClowLy6Gþ population (SupplementaryFig. S2B and S2D).
A similar analysis of CD11bþ cells and MDSC subpopula-tions was performed in the B16-h5T4 model (C57Bl/6 strain).The frequency of tumor-infiltrating CD11bþ cells was not alteredfollowing tasquinimod treatment (Supplementary Fig. S3A),whereas a significant reduction of the number of CD11bþ cellswas observed in the spleen (Supplementary Fig. S3B). In contrastto the castration-resistant Myc-CaP model, the majority ofMDSCs in untreated B16-h5T4 tumors were of the CD11bþ
Ly6ChighLy6G� monocytic subtype (Fig. 4B, left). Moreover, asignificant reduction of the CD11bþLy6ChighLy6G� monocytic
A B
C
D E
F G
Tumor-infiltrating T cells
CD4+ T cells CD8+ T cells
0
5
10
15
20
25
30
35 Vehicle
Tasquinimod
Combination
*
*
5T4Fab-SEA
Tumor-infiltrating CD8+TCR-Vβ3+ T cells
12 13 14 15 160
5
10
15
20
25
5T4Fab-SEACombination
Vehicle**
****
Days after tumor inoculation
Vehicl
e
Tasquin
imod
Survivi
n
Combin
atio
n0
10
20
30
40
50 **
IFN
γ+
cells
of
CD
8 ce
lls (
%)
Vehicl
e
Tasquin
imod
Survivi
n
Combin
atio
n0
20
40
60
80 **
*
Gra
nzy
me
B+ce
lls o
f C
D8
cells
(%
)
80 to
1
40 to
1
20 to
1
10 to
1
5 to
10
20
40
60
80
100Vehicle
Tasquinimod
Survivin
Combination
Splenocytes vs. target cell ratio
Dea
d t
arg
et c
ells
(%
)
40 to
1
20 to
1
10 to
1
5 to
1
0
20
40
60
80
100
Combination
Vehicle
Survivin
Tasquinimod
CD8 vs. target cells ratio
Dea
d t
arg
et c
ells
(%
)
Tumor-infiltrating CD8+TCR-Vβ8+ T cells
12 13 14 15 160
2
4
6
8
10
Vehicle
5T4Fab-SEA
Combination
Days after tumor inoculation
Via
ble
cel
ls (
%)
Via
ble
cel
ls (
%)
Via
ble
cel
ls (
%)
Via
ble
cel
ls (
%)
Tumor-infiltrating CD4+TCR-Vβ3+ T cells
12 13 14 15 160
2
4
6
8
10
5T4Fab-SEA
Combination
Vehicle
Days after tumor inoculation
Figure 2.Tasquinimod in combination withvaccine or TTS improves T-cellimmune responses. Splenocytesisolated from castration-resistantMyc-CaP tumor-bearing mice werestimulated with PMA and ionomycinfor 5 hours in the presence of BFA forIFNg production (A), or on CD3- andCD28-coated plates for 72 hours forGranzyme B production (BFA wasadded during the last 5 hours; B). C,splenocytes (left) or purified CD8þ Tcells (right) from castration-resistantMyc-CaP tumor-bearing mice werecocultured with DIO-labeled tumorcells in different ratios for 5 hours. PIwas added at the end of incubation todetect tumor cell death. D, FACSanalysis of tumor-infiltrating T cellsperformed at the endpoint of theexperiment depicted in Fig. 1B. E–G,FACS analysis of infiltrating T cellsin B16-h5T4 tumors at differenttime points. 5T4Fab-SEA wasadministered on days 9 to 11(� , P < 0.05; �� , P < 0.01;��� , P < 0.001, t test; error barsindicate SEM).
Tasquinimod Enhances Cancer Immunotherapies
www.aacrjournals.org Cancer Immunol Res; 3(2) February 2015 141

subpopulation was observed while the proportion of CD11bþ
Ly6ClowLy6Gþ granulocytic MDSCs increased in tumors upontasquinimod treatment (Fig. 4B). A comparable picture was alsoseen in the spleen (Supplementary Fig. S3C). Interestingly, thetumor-infiltrating CD11bþLy6ChighLy6G� MDSCs expressed highlevels of the angiopoietin receptor Tie2 (data not shown), whichplays a key role in tumor angiogenesis (35). Thus, the decrease inmicrovasculature density by tasquinimod in the B16 model couldbe the consequence of reducing proangiogenic monocytic cellswithin the tumors.
TAMs are important components of the immunosuppressiveTME. Immature monocytes and monocytic MDSCs migrate to
the tumor in response to inflammatory mediators releasedfrom the TME. When infiltrating the tumor tissue, thesecells adapt to the environment and differentiate into TAMsby losing Gr1 marker expression and gaining an even moreimmunosuppressive M2 macrophage phenotype (36–38).Therefore, we assessed the effect of tasquinimod onTAMs. Results from the castration-resistant Myc-CaP modelshowed that tasquinimod treatment led to a reduction ofinfiltrating CD206þ M2 TAMs (Fig. 4C). Similarly, analysisof macrophages in B16-h5T4 tumors also revealed a strongreduction of this subpopulation in tasquinimod-treated mice(Fig. 4D).
Vehicle
Survivin
Tasquinimod
Combination
B
Vehicl
e
Tasquin
imod
5T4F
ab-S
EA
Combin
atio
n0
1
2
3
4
5
6
**
**
Fluo
resc
ence
sta
inin
g%
sta
inin
g in
tum
or
A
200 mm
Vehicle Tasquinimod
5T4Fab-SEA Combination
Vehicl
e
Tasquin
imod
Survivi
n
Combin
atio
n0.0
0.5
1.0
1.5
2.0
2.5
Are
a of
CD
31 s
tain
ing
(%
)
Figure 3.Tasquinimod effects on tumor vasculature (CD31) in B16-h5T4 and castration-resistant Myc-CaP tumors. A, immunofluorescence staining of CD31þ vasculature inB16-h5T4 tumors. B, immunohistochemistry staining of CD31þ vasculature in castration-resistant Myc-CaP tumors. The experiments were repeated at least twice.Results from one representative experiment are shown (�� , P < 0.01, t test; error bars indicate SEM).
Shen et al.
Cancer Immunol Res; 3(2) February 2015 Cancer Immunology Research142
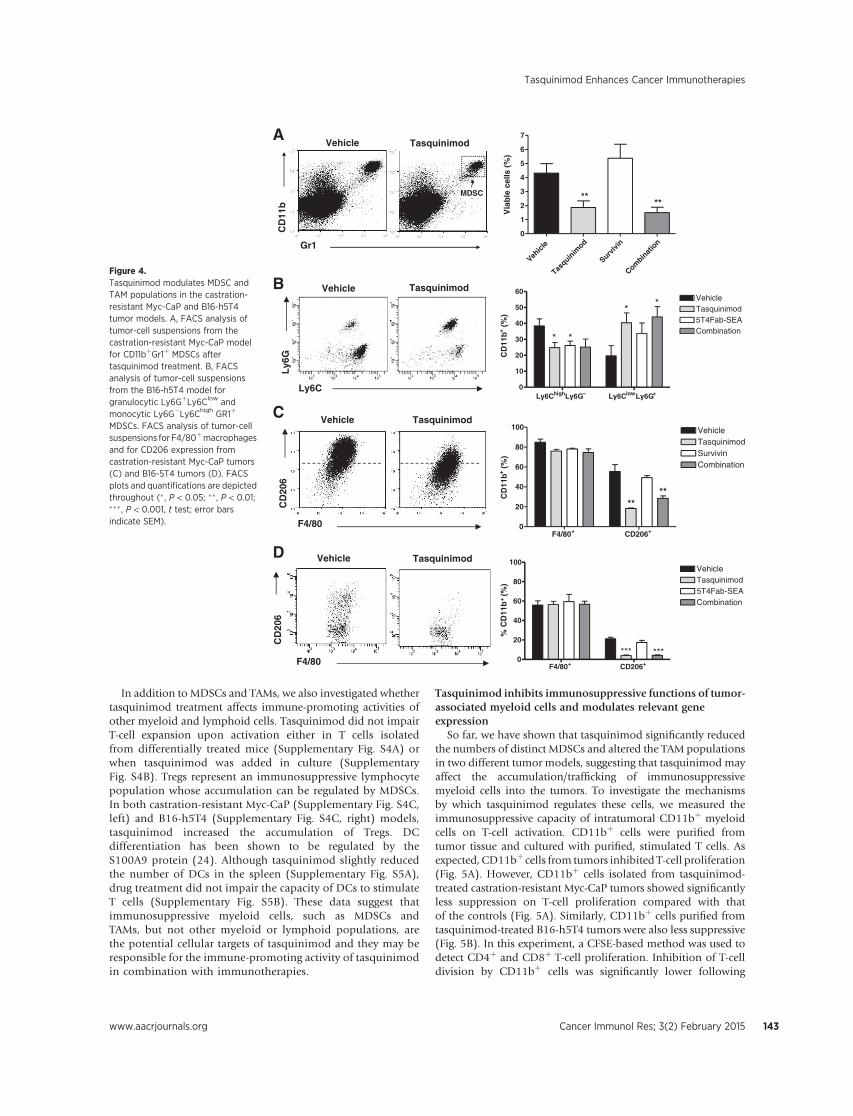
In addition to MDSCs and TAMs, we also investigated whethertasquinimod treatment affects immune-promoting activities ofother myeloid and lymphoid cells. Tasquinimod did not impairT-cell expansion upon activation either in T cells isolatedfrom differentially treated mice (Supplementary Fig. S4A) orwhen tasquinimod was added in culture (SupplementaryFig. S4B). Tregs represent an immunosuppressive lymphocytepopulation whose accumulation can be regulated by MDSCs.In both castration-resistant Myc-CaP (Supplementary Fig. S4C,left) and B16-h5T4 (Supplementary Fig. S4C, right) models,tasquinimod increased the accumulation of Tregs. DCdifferentiation has been shown to be regulated by theS100A9 protein (24). Although tasquinimod slightly reducedthe number of DCs in the spleen (Supplementary Fig. S5A),drug treatment did not impair the capacity of DCs to stimulateT cells (Supplementary Fig. S5B). These data suggest thatimmunosuppressive myeloid cells, such as MDSCs andTAMs, but not other myeloid or lymphoid populations, arethe potential cellular targets of tasquinimod and they may beresponsible for the immune-promoting activity of tasquinimodin combination with immunotherapies.
Tasquinimod inhibits immunosuppressive functions of tumor-associated myeloid cells and modulates relevant geneexpression
So far, we have shown that tasquinimod significantly reducedthe numbers of distinct MDSCs and altered the TAM populationsin two different tumor models, suggesting that tasquinimod mayaffect the accumulation/trafficking of immunosuppressivemyeloid cells into the tumors. To investigate the mechanismsby which tasquinimod regulates these cells, we measured theimmunosuppressive capacity of intratumoral CD11bþ myeloidcells on T-cell activation. CD11bþ cells were purified fromtumor tissue and cultured with purified, stimulated T cells. Asexpected, CD11bþ cells from tumors inhibited T-cell proliferation(Fig. 5A). However, CD11bþ cells isolated from tasquinimod-treated castration-resistant Myc-CaP tumors showed significantlyless suppression on T-cell proliferation compared with thatof the controls (Fig. 5A). Similarly, CD11bþ cells purified fromtasquinimod-treated B16-h5T4 tumors were also less suppressive(Fig. 5B). In this experiment, a CFSE-based method was used todetect CD4þ and CD8þ T-cell proliferation. Inhibition of T-celldivision by CD11bþ cells was significantly lower following
A
B
C
D
Gr1
CD
11b
MDSC
Vehicle Tasquinimod
Ly6
G
Ly6C
Vehicle Tasquinimod
F4/80
Vehicle Tasquinimod
CD
206
F4/80
CD
206
Vehicle Tasquinimod
Ly6ChighLy6G– Ly6ClowLy6G+0
10
20
30
40
50
60VehicleTasquinimod5T4Fab-SEACombination
*
*
*
*
CD
11b
(%
)+
CD
11b
(%
)+
F4/80+ CD206+0
20
40
60
80
100VehicleTasquinimod5T4Fab-SEACombination
*** ***
% C
D11
b+
(%)
Vehicl
e
Tasquin
imod
Survivi
n
Combin
atio
n0
1
2
3
4
5
6
7
****
Via
ble
cel
ls (
%)
F4/80+ CD206+0
20
40
60
80
100 Vehicle
SurvivinCombination
Tasquinimod
****
Figure 4.Tasquinimod modulates MDSC andTAM populations in the castration-resistant Myc-CaP and B16-h5T4tumor models. A, FACS analysis oftumor-cell suspensions from thecastration-resistant Myc-CaP modelfor CD11bþGr1þ MDSCs aftertasquinimod treatment. B, FACSanalysis of tumor-cell suspensionsfrom the B16-h5T4 model forgranulocytic Ly6GþLy6Clow andmonocytic Ly6G�Ly6Chigh GR1þ
MDSCs. FACS analysis of tumor-cellsuspensions for F4/80þmacrophagesand for CD206 expression fromcastration-resistant Myc-CaP tumors(C) and B16-5T4 tumors (D). FACSplots and quantifications are depictedthroughout (� , P < 0.05; �� , P < 0.01;��� , P < 0.001, t test; error barsindicate SEM).
Tasquinimod Enhances Cancer Immunotherapies
www.aacrjournals.org Cancer Immunol Res; 3(2) February 2015 143
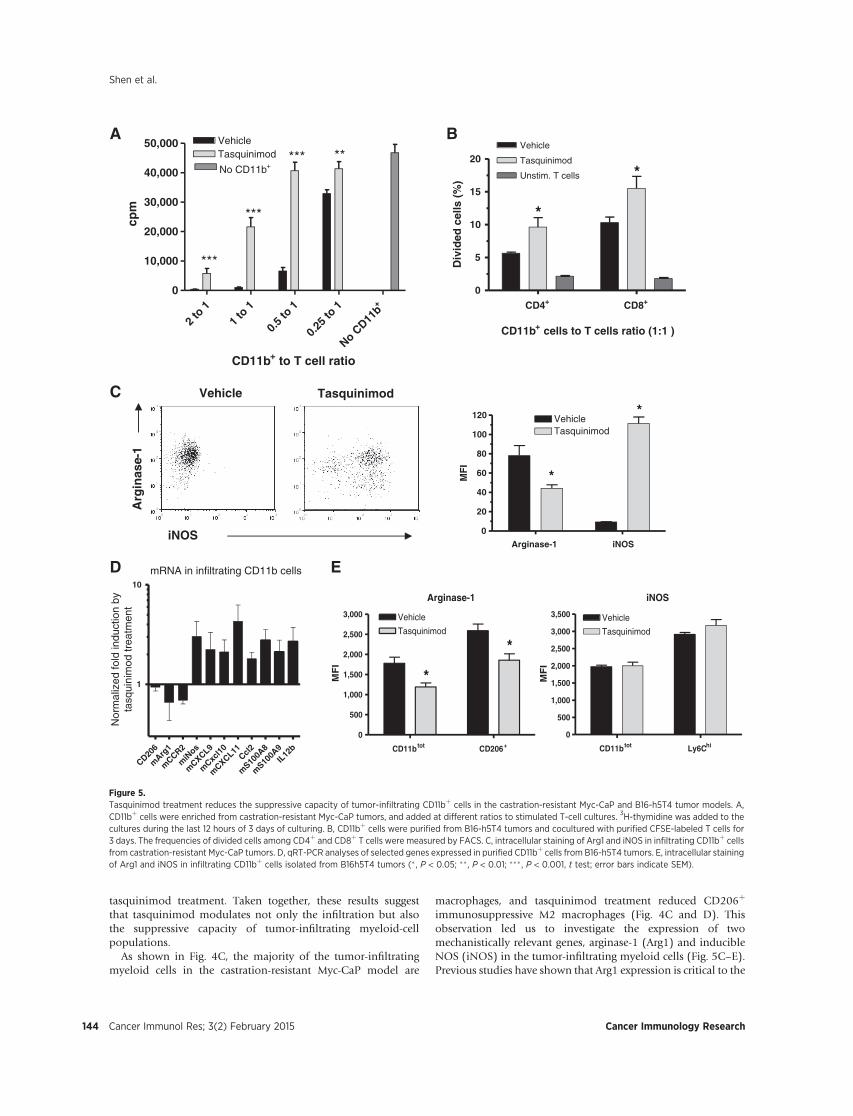
tasquinimod treatment. Taken together, these results suggestthat tasquinimod modulates not only the infiltration but alsothe suppressive capacity of tumor-infiltrating myeloid-cellpopulations.
As shown in Fig. 4C, the majority of the tumor-infiltratingmyeloid cells in the castration-resistant Myc-CaP model are
macrophages, and tasquinimod treatment reduced CD206þ
immunosuppressive M2 macrophages (Fig. 4C and D). Thisobservation led us to investigate the expression of twomechanistically relevant genes, arginase-1 (Arg1) and inducibleNOS (iNOS) in the tumor-infiltrating myeloid cells (Fig. 5C–E).Previous studies have shown that Arg1 expression is critical to the
A B
C
D E
Arginase-1
CD11btot CD206+
0
500
1,000
1,500
2,000
2,500
3,000 Vehicle
Tasquinimod
*
*
MF
I
iNOS
CD11btot Ly6Chi
0
500
1,000
1,500
2,000
2,500
3,000
3,500 Vehicle
Tasquinimod
MF
I
mRNA in infiltrating CD11b cells
CD206
mArg
1
mCCR2
miN
os
mCXCL9
mCxc
l10
mCXCL11
Ccl2
mS10
0A8
mS10
0A9IL
12b
1
10
Nor
mal
ized
fold
indu
ctio
n by
tasq
uini
mod
trea
tmen
t
2 to 1
1 to 1
0.5 to
1
0.25 t
o 1 +
No CD11
b
0
10,000
20,000
30,000
40,000
50,000Tasquinimod
No CD11b+
Vehicle
***
*** **
***
CD11b+ to T cell ratio
cpm
CD4+ CD8+0
5
10
15
20Vehicle
Tasquinimod
Unstim. T cells *
*
CD11b+ cells to T cells ratio (1:1 )
Div
ided
cel
ls (
%)
Arginase-1 iNOS
0
20
40
60
80
100
120 VehicleTasquinimod
*
*MF
I
iNOS
Arg
inas
e-1
Vehicle Tasquinimod
Figure 5.Tasquinimod treatment reduces the suppressive capacity of tumor-infiltrating CD11bþ cells in the castration-resistant Myc-CaP and B16-h5T4 tumor models. A,CD11bþ cells were enriched from castration-resistant Myc-CaP tumors, and added at different ratios to stimulated T-cell cultures. 3H-thymidine was added to thecultures during the last 12 hours of 3 days of culturing. B, CD11bþ cells were purified from B16-h5T4 tumors and cocultured with purified CFSE-labeled T cells for3 days. The frequencies of divided cells among CD4þ and CD8þ T cells were measured by FACS. C, intracellular staining of Arg1 and iNOS in infiltrating CD11bþ cellsfrom castration-resistant Myc-CaP tumors. D, qRT-PCR analyses of selected genes expressed in purified CD11bþ cells from B16-h5T4 tumors. E, intracellular stainingof Arg1 and iNOS in infiltrating CD11bþ cells isolated from B16h5T4 tumors (� , P < 0.05; �� , P < 0.01; ��� , P < 0.001, t test; error bars indicate SEM).
Shen et al.
Cancer Immunol Res; 3(2) February 2015 Cancer Immunology Research144

suppressive function of MDSCs and TAMs. It has been reportedthat Arg1 gene expression can be regulated by the TLR4 pathway(39), which is a target receptor for S100A9. The iNOSmarker can be used to differentiate cytotoxic M1 macrophagesfrom immunosuppressiveM2macrophages. Intracellular stainingand flow cytometry analysis of castration-resistant Myc-CaPtumors showed that tasquinimod reduced Arg1 expressionin myeloid cells and induced significant iNOS expression,which indicates an increase in immune-promoting M1macrophages (Fig. 5C). In the B16-5T4 model, mRNA analysisalso indicated that tasquinimod shifted an M2 macrophage(immunosuppressive) gene expression signature into an M1macrophage signature (Fig. 5D). FACS analysis confirmed thereduction of Arg1 expression and the induction of iNOS in tumor-infiltrating Ly6Chighmonocytic cells, although not as dramaticallyas those in the castration-resistant Myc-Cap model (Fig. 5E).
We also tested the enzymatic activities of NOS and Arg1 ininfiltrating myeloid cells. Tasquinimod treatment in vivo led to asignificant increase of NOS activity, as compared with vehicletreatment (Supplementary Fig. S6). The arginase activity assaydid not reveal a significant change between these two conditions(data not shown).
Tasquinimod treatment reduces the ability of suppressivemyeloid cells to support tumor growth
In the therapeutic studies, tasquinimod treatment enhancedimmune responses and vaccine effects (Figs. 1 and 2 andSupplementary Fig S1). We hypothesized that suppressivemyeloid cells, including MDSCs and TAMs and not theother populations, are potential targets of tasquinimodimmunomodulatory activity (Figs. 4 and 5 and SupplementaryFigs. S4 and S5). To test this hypothesis, castration-resistant Myc-CaP cells were inoculated into FVB mice as described. Whentumor growth was established, mice were randomized into twogroups receiving either vehicle or tasquinimod treatment for 4weeks. CD11bþ myeloid cells, isolated from tumors that wereharvested from different treatment groups, were mixed with fresh
castration-resistant Myc-CaP cells and inoculated into recipientFVB mice receiving SurVaxM vaccine therapy. As shown in Fig. 6,inoculations containing tasquinimod-treated tumor-derivedmyeloid cells induced significantly slower tumor growth, ascompared with those containing vehicle-treated tumor-derivedmyeloid cells. These data indicate that tasquinimod directlyimpairs the tumor-promoting activity of immunosuppressivemyeloid cells.
DiscussionThe aim of immunotherapy is to induce durable and effective
immune responses. MDSCs and TAMs contribute to immunetolerance in the TME and consequently affect the efficacyof immunotherapies. Our study provides evidence supportingthe development of tasquinimod as a novel approach to targetthe immunosuppressive TME and facilitate immunotherapy.The data were generated in parallel in two differentlaboratories, providing evidence for reproducibility of ourobservations.
We tested two different immunotherapeutic strategies incombination with tasquinimod in two murine tumor models,and observed a similar immune-promoting effect by tasquinimodcoupled to modulation of tumor-infiltrating MDSCs and TAMs.These myeloid populations express receptors for S100A9 and arelikely cellular targets for tasquinimod. Furthermore, wedemonstrated that the adoptively transferred tasquinimod-treated myeloid cells were sufficient to delay tumor growth invaccinated animals, as compared with tumor inoculates withvehicle-treated myeloid cells (Fig. 6). There were differences inthe subpopulations of tumor-induced myeloid cells in the twomodels, possibly due to the different tumor origins. GranulocyticMDSCs are prevalent in the castration-resistant Myc-CaPmodel on FVB background, whereas monocytic MDSCscomprise the major population in B16-h5T4 mouse melanomaon C57Bl/6 background. Upon tasquinimod treatment, theLy6ChighLy6G� monocytic MDSCs were reduced in the
0 5 10 15 20 25 30 35 40
0
500
1,000
1,500CD11b+: vehicle
CD11b+: tasquinimod
Days after inoculation
Tu
mo
r vo
lum
e (m
m3 )
: veh
icle
+
CD11b
: tas
quin
imod
+
CD11b
0
1
2
3
4 *
Tu
mo
r w
eig
ht
(g)
Figure 6.Tasquinimod treatment reduces the ability of suppressive myeloid cells to support tumor growth. CD11bþ cells were isolated from tumors collected from eithervehicle or tasquinimod-treated donor mice, mixed with fresh castration-resistant Myc-CaP cells (mixture contained 1.5 � 106 castration-resistant Myc-CaPcells and 0.75 � 106 CD11b cells), and inoculated s.c. into recipient mice receiving SurVaxM vaccine. Recipient mice received two doses of the vaccine beforeinoculation and two additional doses were administered after tumor-cell inoculation. Left, tumor growth curves by serial caliper measurements. Right, end oftreatment tumor weights (� , P < 0.05, Mann–Whitney U test; error bars indicate SEM).
Tasquinimod Enhances Cancer Immunotherapies
www.aacrjournals.org Cancer Immunol Res; 3(2) February 2015 145

B16-h5T4 tumors (Fig. 4B), and the total number of Gr1þ
CD11bþ MDSCs was reduced in castration-resistant Myc-CaPtumors (Fig 4A). At peripheral sites, tasquinimod treat-ment led to depletion of Gr1�CD11bþ monocytes incastration-resistant Myc-CaP tumor-bearing mice (Supple-mentary Fig. S2A), and a significant reduction of the CD11bþ
Ly6ChighLy6G� and CD11bþLy6ClowLy6G� monocytic popu-lations in the B16-h5T4 tumor-bearing animals (SupplementaryFig. S3 and data not shown). These observations suggest thatimmature monocytes are potential targets for tasquinimod.Because monocytic MDSCs or immature monocytes can beprecursors of TAMs (38), the reduction of monocytes atperipheral sites could lead to an altered profile of TAMsobserved in both models (Fig. 4C and D).
As shown in Fig. 2C, splenocytes from mice treated with thecombined regimen of vaccine and tasquinimod presentedincreased tumor-cell killing ex vivo, compared with that ofvehicle and single treatment groups. However, the purifiedCD8þ effector T cells from mice treated with the combinedregimen did not show a significant difference in cytotoxicityagainst tumor cells. This result suggests that the combinedtreatment does not affect effector T-cell functions directly butinstead it relieves the immunosuppression present in the cultures,such as the inhibition by immunosuppressive MDSCs. Weobserved no inhibition of T-cell proliferation ex vivo or whentasquinimod was added to culture at high concentrations(Supplementary Fig. S4). The effect of combination treatmenton specific T-cell activation in tumors was addressed in the B16-h5T4 model. Tracking of superantigen-reactive T cells by TCR-Vbexpression demonstrated increased and prolonged presence ofTTS-activated CD8þ T cells in tumors following tasquinimodcotreatment, further supporting the induction of a lessimmunosuppressive environment. A similar increase in tumor-infiltrating CTLs in B16 tumors was reported recently followingTTS therapy in combination with anti–CTLA-4 checkpointblockade (40).
Previous reports have shown that MDSC-targeting strategiesaffect systemic or peripheral MDSC accumulation (25, 41). Forexample, mAbGB3.1, an antibody against the carboxylated N-glycan on RAGE, reduced MDSC accumulation in blood,spleen, and lymph nodes in 4T1 tumor-bearing animals, butnot in the metastatic site. However, this antibody treatmentdid not affect the suppressive function of MDSCs (25). In ourcastration-resistant Myc-CaP model, tasquinimod did notchange the number of Gr1þCD11bþ MDSCs at peripheralsites (Supplementary Fig. S2), which would suggest thattasquinimod does not affect the generation or expansionof MDSCs. However, tasquinimod reduced tumor-infiltratingMDSCs (Fig. 4A). This observation suggests that tasquinimodmay inhibit MDSC trafficking/accumulation in the tumor,leading to modulation of the TME and relief of immunetolerance. In support of this finding, S100A9 signaling hasbeen reported to regulate both expansion and migration ofMDSCs (24, 25). It has also been shown that intracellularS100A9 expression in myeloid progenitor cells induces MDSCexpansion (24, 42). However, extracellular (secreted) S100A9protein binds to carboxylated N-glycan receptors (RAGE) thatare expressed on the surface of MDSCs and promotes MDSCmigration to the site of tumors (25, 43). Taken together, ourresults provide evidence supporting a mechanism of action bytasquinimod in blocking extracellular S100A9 and receptor
signaling that may be critical to MDSC tumor infiltration viacell surface receptors such as TLR4 (23) and RAGE (22).
The notion of a cross-talk between different regulatorymyeloid cells is well established (44). Aside from thereduction and modulation of tumor-associated MDSCs,tasquinimod treatment resulted in decreased numbers ofCD206þ M2-polarized TAMs and reduced the suppressivefunction of CD11b-expressing myeloid infiltrates (Figs. 4and 5). Macrophages are categorized as either the classicallyactivated, cytotoxic M1 macrophages, or the alternativelyactivated, suppressive M2 macrophages. The M2-polarizedTAMs are enriched in hypoxic tumor areas with a superiorproangiogenic activity in vivo, a limited capacity to presentantigen, and the ability to suppress adaptive immune responsessuch as T-cell activation (38, 45). In the castration-resistant Myc-CaP and B16-5T4 models, F4/80þ macrophages represent themajor population of tumor infiltrates and a large component ofthese infiltratingmacrophages areCD206þ,M2-like type,which issignificantly reduced upon tasquinimod treatment (Fig. 4C andD). The function of macrophages depends on the expression ofArg1 and iNOS. Although classically activated M1-polarizedmacrophages express both Arg1 and iNOS, suppressive TAMsonly express Arg1, which is critical for the immunosuppressivefunction. As shown in Fig. 5, tasquinimod treatment reducedArg1expression in CD11bþ cells in both models (Fig. 5C–E), whichcould explain the reduced suppressive function of these cells (Fig.5A andB). An important regulator of Arg1 gene expression is TLR4signaling (39), which is a receptor for a tasquinimod-targetprotein, S100A9. Potentially, the S100A9–TLR4–Arg1 pathwaymay be involved in tasquinimod-induced changes of suppressivemyeloid cells. Interestingly, in the castration-resistant Myc-CaPmodel, tasquinimod induced iNOS expression in CD11bþ cells(Fig. 5C). An assay testing NOS enzyme also showed thattasquinimod-treated CD11b cells had higher NOS activity(Supplementary Fig. S6). iNOS is mainly expressed inmacrophages and monocytic MDSCs, whereas granulocyticMDSCs have low iNOS. Therefore, the increase of iNOS inCD11b cells is likely due to an increase of M1 macrophages inthe tumor, rather than an induction ofmonocyticMDSCs becausethe vast majority of MDSCs in the tumors of this model are of thegranulocytic type (Supplementary Fig. S2D).
Tasquinimod has pleiotropic effects that contribute to itsantitumor activity, including antiangiogenesis, immuno-modulation, and inhibition of metastasis. As demonstrated inthis study, modulation of suppressive myeloid cells mayrepresent a critical biologic mechanism of action oftasquinimod and the common target giving rise to the diverseeffects. Immunosuppressive myeloid cells (MDSCs and TAMs)secrete multiple factors, including VEGF and MMP9, whichpromote angiogenesis (46). In a hypoxic microenvironment,myeloid cells can also recruit endothelial cells and theirprecursors (47). MDSCs have also been reported to promotetumor-cell dissemination (48) and cancer stemness (49). Inaddition, MDSCs and TAMs have the potential to prime distalsites to promote the seeding of metastatic tumor cells (50–52).Moreover, MDSCs have been found to promote cancer cellsurvival upon chemotherapy by producing certain chemokines(53). These findings suggest that suppressive myeloid popula-tions represent key mediators of multiple critical aspects ofcancer immune tolerance, metastasis, and drug resistance. Theinhibitory effects of tasquinimod on tumor-infiltrating
Shen et al.
Cancer Immunol Res; 3(2) February 2015 Cancer Immunology Research146

immunosuppressive myeloid cells, and, in particular, onthe M2-polarized TAMs, have been observed in preclinicalsyngeneic tumor models. These biologic properties oftasquinimod support the further development of this agentfor clinical combination strategies with immunotherapies suchas vaccines and immune checkpoint inhibitors. On the basis ofour preliminary data, a clinical trial of tasquinimod incombination with sipuleucel-T in patients with metastaticcastration-resistant prostate cancer is planned to open in 2014.
In conclusion, tasquinimod is a small-molecule inhibitor witha potentially unique mechanism of action that targets the TME.Future preclinical and clinical testing of this agent will define itsapplication in a wide range of therapeutic strategies includingimmunotherapies, antiangiogenic agents, and antimetastatic drugs.
Disclosure of Potential Conflicts of InterestA. Sundstedt, M. Celander, H. Eriksson, T. Leanderson, and A. Olsson have
ownership interest (including patents) in Active Biotech. R. Pili reports receivinga commercial research grant fromActiveBiotech AB and is a consultant/advisoryboard member for Ipsen. M. Ciesielski has ownership interest (includingpatents) in MimiVax, LLC. R. Fenstermaker is the founder of MimiVax LLC.No potential conflicts of interest were disclosed by the other authors.
Authors' ContributionsConception and design: L. Shen, A. Sundstedt, M. Ciesielski, M. Celander, H.Eriksson, T. Leanderson, A. Olsson, R. PiliDevelopment of methodology: L. Shen, A. Sundstedt, M. Ciesielski, M. Celan-der, A. Olsson, R. Pili
Acquisition of data (provided animals, acquired and managed patients,provided facilities, etc.): L. Shen, A. Sundstedt, M. Ciesielski, K.M. Miles,M. Celander, R. Adelaiye, A. Orillion, E. Ciamporcero, L. Ellis, A. Olsson, R. PiliAnalysis and interpretation of data (e.g., statistical analysis, biostatistics,computational analysis): L. Shen, A. Sundstedt, M. Ciesielski, M. Celander,R. Adelaiye, E. Ciamporcero, R. Fenstermaker, S.I. Abrams, T. Leanderson,A. Olsson, R. PiliWriting, review, and/or revision of the manuscript: L. Shen, A. Sundstedt,R. Fenstermaker, S.I. Abrams, H. Eriksson, T. Leanderson, A. Olsson, R. PiliAdministrative, technical, ormaterial support (i.e., reporting or organizing data,constructing databases): L. Shen, R. Adelaiye, S. Ramakrishnan, A. Olsson, R. PiliStudy supervision: T. Leanderson, A. Olsson, R. Pili
AcknowledgmentsThe authors thank Anneli Nilsson, Jan Nilsson, Therese Blidberg,
and Martin Stenstr€om for excellent technical assistance, and Dr. LennartOhlsson (MicroMorph Histology Services, Lund, Sweden) for performingimmunohistochemistry.
Grant SupportThis study was supported in part by the National Cancer Institute
grant P50-CA58236 (to R. Pili) and by a research grant from Active Biotech(to R. Pili).
The costs of publication of this article were defrayed in part by the paymentof page charges. This article must therefore be hereby marked advertisementin accordance with 18 U.S.C. Section 1734 solely to indicate this fact.
Received March 5, 2014; revised September 25, 2014; accepted October 14,2014; published OnlineFirst November 4, 2014.
References1. Small EJ, Schellhammer PF,HiganoCS, RedfernCH,Nemunaitis JJ, Valone
FH, et al. Placebo-controlled phase III trial of immunologic therapy withsipuleucel-T (APC8015) in patients with metastatic, asymptomatic hor-mone refractory prostate cancer. J Clin Oncol 2006;24:3089–94.
2. Smith JL Jr, Stehlin JS Jr. Spontaneous regression of primary malignantmelanomas with regional metastases. Cancer 1965;18:1399–415.
3. Culver ME, Gatesman ML, Mancl EE, Lowe DK. Ipilimumab: a noveltreatment for metastatic melanoma. Ann Pharmacother 2011;45:510–9.
4. GabrilovichDI,Nagaraj S.Myeloid-derived suppressor cells as regulators ofthe immune system. Nat Rev Immunol 2009;9:162–74.
5. Oosterling SJ, van der Bij GJ, Meijer GA, Tuk CW, van Garderen E, vanRooijen N, et al. Macrophages direct tumour histology and clinical out-come in a colon cancer model. J Pathol 2005;207:147–55.
6. Pan PY, Wang GX, Yin B, Ozao J, Ku T, Divino CM, Chen SH. Reversion ofimmune tolerance in advanced malignancy: modulation of myeloid-derived suppressor cell development by blockade of stem-cell factorfunction. Blood 2008;111:219–28.
7. Sinha P, Clements VK, Fulton AM, Ostrand-Rosenberg S. Prostaglandin E2promotes tumor progression by inducing myeloid-derived suppressorcells. Cancer Res 2007;67:4507–13.
8. Song X, Krelin Y, Dvorkin T, Bjorkdahl O, Segal S, Dinarello CA, et al.CD11bþ/Gr-1þ immature myeloid cells mediate suppression of T cells inmice bearing tumors of IL-1beta–secreting cells. J Immunol 2005;175:8200–8.
9. Solito S, Bronte V, Mandruzzato S. Antigen specificity of immune suppres-sion by myeloid-derived suppressor cells. J Leukoc Biol 2011;90:31–6.
10. Huang B, Pan PY, Li Q, Sato AI, Levy DE, Bromberg J, et al. Gr-1þCD115þ
immature myeloid suppressor cells mediate the development of tumor-induced T regulatory cells and T-cell anergy in tumor-bearing host. CancerRes 2006;66:1123–31.
11. Serafini P, Mgebroff S, Noonan K, Borrello I. Myeloid-derived suppressorcells promote cross-tolerance in B-cell lymphoma by expanding regulatoryT cells. Cancer Res 2008;68:5439–49.
12. Yang Z, Zhang B, Li D, Lv M, Huang C, Shen GX, Huang B. Mast cellsmobilize myeloid-derived suppressor cells and Treg cells in tumor micro-
environment via IL-17 pathway in murine hepatocarcinoma model. PLoSONE 2010;5:e8922.
13. Mills CD, Kincaid K, Alt JM, Heilman MJ, Hill AM. M-1/M-2 macrophagesand the Th1/Th2 paradigm. J Immunol 2000;164:6166–73.
14. Pili R,H€aggmanM, StadlerWM,Gingrich JR, Assikis VJ, Bj€ork A, et al. PhaseII randomized, double-blind, placebo-controlled study of tasquinimod inmen with minimally symptomatic metastatic castrate-resistant prostatecancer. J Clin Oncol 2011;29:4022–8.
15. Armstrong AJ, H€aggman M, Stadler WM, Gingrich JR, Assikis V, Polikoff J,et al. Long-term survival and biomarker correlates of tasquinimod efficacyin a multicenter randomized study of men with minimally symptomaticmetastatic castration-resistant prostate cancer. Clin Cancer Res 2013;19:6891–901.
16. Dalrymple SL, Becker RE, Isaacs JT. The quinoline-3-carboxamide anti-angiogenic agent, tasquinimod, enhances the anti-prostate cancer efficacyof androgen ablation and taxotere without effecting serum PSA directly inhuman xenografts. Prostate 2007;67:790–7.
17. Dalrymple SL, Becker RE, Zhou H, DeWeese TL, Isaacs JT. Tasquinimodprevents the angiogenic rebound induced by fractionated radiation result-ing in an enhanced therapeutic response of prostate cancer xenografts.Prostate 2012;72:638–48.
18. Jennbacken K, Wel�en K, Olsson A, Axelsson B, T€orngren M, Damber JE,et al. Inhibition ofmetastasis in a castration resistant prostate cancermodelby the quinoline-3-carboxamide tasquinimod (ABR-215050). Prostate2012;72:913–24.
19. Isaacs JT, Pili R, Qian DZ, Dalrymple SL, Garrison JB, Kyprianou N, et al.Identification of ABR-215050 as lead second generation quinoline-3-carboxamide anti-angiogenic agent for the treatment of prostate cancer.Prostate 2006;66:1768–78.
20. Olsson A, Bj€ork A, Vallon-Christersson J, Isaacs JT, Leanderson T. Tasqui-nimod (ABR-215050), a quinoline-3-carboxamide anti-angiogenic agent,modulates the expression of thrombospondin-1 in human prostatetumors. Mol Cancer 2010;9:107.
21. Isaacs JT, Antony L, Dalrymple SL, Brennen WN, Gerber S, Hammers H,et al. Tasquinimod is an allosteric modulator of HDAC4 survival signaling
Tasquinimod Enhances Cancer Immunotherapies
www.aacrjournals.org Cancer Immunol Res; 3(2) February 2015 147

within the compromised cancer microenvironment. Cancer Res 2013;73:1386–99.
22. Bjork P, Bj€ork A, Vogl T, Stenstr€om M, Liberg D, Olsson A, et al. Identi-fication of human S100A9 as a novel target for treatment of autoimmunedisease via binding to quinoline-3-carboxamides. PLoS Biol 2009;7:e97.
23. Kallberg E, Vogl T, Liberg D, Olsson A, Bj€ork P, Wikstr€om P, et al. S100A9interactionwith TLR4 promotes tumor growth. PLoSONE 2012;7:e34207.
24. ChengP,CorzoCA, LuettekeN, YuB,Nagaraj S, BuiMM, et al. Inhibitionofdendritic cell differentiation and accumulation of myeloid-derived sup-pressor cells in cancer is regulated by S100A9 protein. J Exp Med 2008;205:2235–49.
25. Sinha P, Okoro C, Foell D, Freeze HH, Ostrand-Rosenberg S, Srikrishna G.Proinflammatory S100 proteins regulate the accumulation of myeloid-derived suppressor cells. J Immunol 2008;181:4666–75.
26. Ellis L, Lehet K, Ramakrishnan S, Adelaiye R, Pili R. Development of acastrate resistant transplant tumor model of prostate cancer. Prostate2011;72:587–91.
27. Mulryan K, Ryan MG, Myers KA, Shaw D, Wang W, Kingsman SM, et al.Attenuated recombinant vaccinia virus expressing oncofetal antigen(tumor-associated antigen) 5T4 induces active therapy of establishedtumors. Mol Cancer Ther 2002;1:1129–37.
28. Attia MA, Weiss DW. Immunology of spontaneous mammary carcino-mas in mice. V. Acquired tumor resistance and enhancement in strainA mice infected with mammary tumor virus. Cancer Res 1966;26:1787–800.
29. KishiH, IgawaM,KikunoN, Yoshino T,Urakami S, ShiinaH. Expression ofthe survivin gene in prostate cancer: correlation with clinicopathologicalcharacteristics, proliferative activity and apoptosis. J Urol 2004;171:1855–60.
30. CiesielskiMJ, AhluwaliaMS,Munich SA,OrtonM,Barone T, Chanan-KhanA, et al. Antitumor cytotoxic T-cell response induced by a survivin peptidemimic. Cancer Immunol Immunother 2010;59:1211–21.
31. Shen L, CiesielskiM, Ramakrishnan S,Miles KM, Ellis L, Sotomayor P, et al.Class I histonedeacetylase inhibitor entinostat suppresses regulatory T cellsand enhances immunotherapies in renal and prostate cancermodels. PLoSONE 2012;7:e30815.
32. DohlstenM,Abrahms�enL, Bj€orkP, LandoPA,HedlundG, ForsbergG, et al.Monoclonal antibody-superantigen fusion proteins: tumor-specific agentsfor T-cell-based tumor therapy. Proc Natl Acad Sci U S A 1994;91:8945–9.
33. Kappler J, Kotzin B, Herron L, Gelfand EW, Bigler RD, Boylston A, et al. Vbeta-specific stimulationof humanT cells by staphylococcal toxins. Science1989;244:811–3.
34. RaymondE,DalgleishA,Damber JE, SmithM, Pili R.Mechanismsof actionof tasquinimod on the tumour microenvironment. Cancer ChemotherPharmacol 2014;73:1–8.
35. De Palma M, Venneri MA, Galli R, SergiSergi L, Politi LS, Sampaolesi M,et al. Tie2 identifies a hematopoietic lineage of proangiogenic monocytesrequired for tumor vessel formation and a mesenchymal population ofpericyte progenitors. Cancer Cell 2005;8:211–26.
36. Sica A, Bronte V. Altered macrophage differentiation and immune dys-function in tumor development. J Clin Invest 2007;117:1155–66.
37. Peranzoni E, Zilio S,Marigo I, Dolcetti L, Zanovello P,Mandruzzato S, et al.Myeloid-derived suppressor cell heterogeneity and subset definition. CurrOpin Immunol 2010;22:238–44.
38. Movahedi K, Guilliams M, Van den Bossche J, Van den Bergh R, GysemansC, Beschin A, et al. Identification of discrete tumor-induced myeloid-derived suppressor cell subpopulations with distinct T cell-suppressiveactivity. Blood 2008;111:4233–44.
39. El Kasmi KC, Qualls JE, Pesce JT, Smith AM, Thompson RW, Henao-Tamayo M, et al. Toll-like receptor-induced arginase 1 in macrophagesthwarts effective immunity against intracellular pathogens. Nat Immunol2008;9:1399–406.
40. Sundstedt A, Celander M, Eriksson H, T€orngren M, Hedlund G. Mono-therapeutically nonactive CTLA-4 blockade results in greatly enhancedantitumor effects when combined with tumor-targeted superantigens in aB16 melanoma model. J Immunother 2012;35:344–53.
41. Rigamonti N, Capuano G, Ricupito A, Jachetti E, Grioni M, Generoso L,et al. Modulators of arginine metabolism do not impact on peripheral T-cell tolerance and disease progression in a model of spontaneous prostatecancer. Clin Cancer Res 2011;17:1012–23.
42. Chen X, Eksioglu EA, Zhou J, Zhang L, Djeu J, FortenberyN, et al. Inductionof myelodysplasia by myeloid-derived suppressor cells. J Clin Invest2013;123:4595–611.
43. Ichikawa M, Williams R, Wang L, Vogl T, Srikrishna G. S100A8/A9 activatekey genes and pathways in colon tumor progression. Mol Cancer Res2011;9:133–48.
44. Ostrand-Rosenberg S, Sinha P, Beury DW, Clements VK. Cross-talkbetween myeloid-derived suppressor cells (MDSC), macrophages, anddendritic cells enhances tumor-induced immune suppression. SeminCancer Biol 2012;22:275–81.
45. De Palma M, Lewis CE. Macrophage regulation of tumor responses toanticancer therapies. Cancer Cell 2013;23:277–86.
46. Murdoch C, Muthana M, Coffelt SB, Lewis CE. The role of myeloid cells inthe promotion of tumour angiogenesis. Nat Rev Cancer 2008;8:618–31.
47. Li B, Vincent A,Cates J, Brantley-SiedersDM, PolkDB, Young PP. Low levelsof tumor necrosis factor alpha increase tumor growth by inducing anendothelial phenotype of monocytes recruited to the tumor site. CancerRes 2009;69:338–48.
48. Toh B, Wang X, Keeble J, Sim WJ, Khoo K, Wong WC, et al. Mesenchymaltransition and dissemination of cancer cells is driven by myeloid-derivedsuppressor cells infiltrating the primary tumor. PLoS Biol 2011;9:e1001162.
49. Cui TX, Kryczek I, Zhao L, Zhao E, Kuick R, RohMH, et al. Myeloid-derivedsuppressor cells enhance stemness of cancer cells by inducing micro-RNA101 and suppressing the corepressor CtBP2. Immunity 2013;39:611–21.
50. Hiratsuka S, Watanabe A, Aburatani H, Maru Y. Tumour-mediated upre-gulation of chemoattractants and recruitment of myeloid cells predeter-mines lung metastasis. Nat Cell Biol 2006;8:1369–75.
51. Sawant A, Deshane J, Jules J, Lee CM, Harris BA, Feng X, et al. Myeloid-derived suppressor cells function as novel osteoclast progenitors enhancingbone loss in breast cancer. Cancer Res 2013;73:672–82.
52. Kaplan RN, Riba RD, Zacharoulis S, Bramley AH, Vincent L, Costa C, et al.VEGFR1-positive haematopoietic bone marrow progenitors initiate thepre-metastatic niche. Nature 2005;438:820–7.
53. Acharyya S, Oskarsson T, Vanharanta S,Malladi S, Kim J,Morris PG, et al. ACXCL1 paracrine network links cancer chemoresistance and metastasis.Cell 2012;150:165–78.
Cancer Immunol Res; 3(2) February 2015 Cancer Immunology Research148
Shen et al.

Full Terms & Conditions of access and use can be found athttp://www.tandfonline.com/action/journalInformation?journalCode=koni20
Download by: [Roswell Park Cancer Institute] Date: 16 December 2015, At: 14:34
OncoImmunology
ISSN: (Print) 2162-402X (Online) Journal homepage: http://www.tandfonline.com/loi/koni20
Tasquinimod targets suppressive myeloid cells inthe tumor microenvironment
Li Shen & Roberto Pili
To cite this article: Li Shen & Roberto Pili (2015): Tasquinimod targets suppressive myeloidcells in the tumor microenvironment, OncoImmunology, DOI: 10.1080/2162402X.2015.1072672
To link to this article: http://dx.doi.org/10.1080/2162402X.2015.1072672
Accepted author version posted online: 12Aug 2015.
Submit your article to this journal
Article views: 2
View related articles
View Crossmark data

1
Tasquinimod modulates tumor microenvironment
Tasquinimod targets suppressive myeloid cells in the tumor microenvironment
Li Shen1,*, Roberto Pili1,2,**
1Genitourinary Program, Roswell Park Cancer Institute, Buffalo NY
2Department of Medicine, Indiana University-Simon Cancer Center, Indianapolis IN
*Corresponding authors: Li Shen Ph.D., Roswell Park Cancer Institute,
**Corresponding authors: Roberto Pili MD, Indiana University-Simon Cancer Center,
Key Words
tasquinimod, suppressive myeloid cells (SMCs), immunotherapy, S100A9, myeloid-derived
suppressor cells (MDSCs), tumor associated macrophages (TAMs).
Abstract
Infiltrating myeloid derived suppressor cells and tumor associated macrophages are important
components of the immunosuppressive tumor microenvironment. We recently reported that
tasquinimod, which binds to S100A9, impairs both infiltration and function of these cells.
Here we discuss the underlying mechanisms responsible for targeting multiple suppressive
populations and the modulation of the tumor microenvironment.
Dow
nloa
ded
by [
Ros
wel
l Par
k C
ance
r In
stitu
te]
at 1
4:34
16
Dec
embe
r 20
15

2
Suppressive myeloid cells (SMCs), including myeloid-derived suppressor cells
(MDSCs) and tumor associated macrophages (TAMs), are associated with tumor progression
and metastasis1. MDSCs expand and accumulate in many cancers 1, whereas TAMs are
differentiated from immature monocytes or MDSCs when these precursors infiltrate and
adapt to the tumor environment2. Both MDSCs and TAMs are critical components of the
immunosuppressive tumor microenvironment that can directly inhibit activation and function
of T and NK cells3. Therefore, modulating and/or depleting these cells in the tumor
environment is expected to help counteracting SMC-associated immunosuppression, tumor
progression, and metastasis.
Previous reports have shown different approaches to deplete MDSCs or to affect their
expansion4. While reduction of peripheral MDSCs has been observed, few of these efforts
have been able to reduce infiltration of MDSCs in the tumor sites or impair their suppressive
function4. Tasquinimod is an orally active synthetic quinoline-3-carboxamide derivate that
has shown effect in a phase II clinical trial in patients with castration resistance prostate
cancer (CRPC)5. We have recently reported that tasquinimod reduced tumor infiltrating
MDSCs and M2 polarized macrophages and impaired the suppressive function of these
infiltrating myeloid cells in two different experimental cancer models, namely the CR Myc-
CaP prostate cancer model and the B16-5T4 melanoma model6. Combining tasquinimod with
two different immunotherapy strategies in these models clearly showed an enhanced effect on
tumor growth in both models. Interestingly, tasquinimod did not affect accumulation of
MDSCs in the peripheral sites in CR Myc-CaP model, but slightly reduced MDSCs in spleen
in the B16-5T4 model, suggesting that modulation of SMCs in tumors is sufficient to
facilitate immunotherapies
The composition and suppressive function of tumor-infiltrating myeloid cells are usually
different from those of peripheral suppressive myeloid cells. In the CR Myc-CaP prostate
Dow
nloa
ded
by [
Ros
wel
l Par
k C
ance
r In
stitu
te]
at 1
4:34
16
Dec
embe
r 20
15

3
cancer model, Gr1+CD11b+ MDSCs accumulate in peripheral blood with tumor growth.
Gr1lowCD11b+ and Gr1-- CD11b+ immature monocytes are also present in peripheral blood6,
In CR Myc-CaP tumors, Gr1+CD11b+ MDSCs are one of the major populations, and
Ly6G+Ly6C- granulocytic MDSCs are the major subpopulation. However, the majority of
tumor infiltrating Gr1-- CD11b+ cells are F4/80+ macrophages (up to 80% of CD11b+ cells),
and most of these are M2 polarized TAMs6, We have compared the suppressive function of
peripheral and tumor infiltrating myeloid cells. The CD11b+ cells isolated from Myc-CaP
tumors efficiently inhibited T cell proliferation upon CD3 and CD28 stimulation6, whereas
the CD11b+ cells from spleen did not have inhibitory effect on T cell proliferation upon the
same stimulation (data not shown). These observations are consistent with the report from
another showing that tumor and peripheral site MDSCs have different functions7.
Importantly, we observed that tasquinimod treatment not only reduced CD206+Arginase-1high
M2 macrophages, but also induced iNOShigh macrophages with M1 polarized phenotype. This
indicates that tasquinimod may switch the differentiation of tumor infiltrating macrophages
from M2 polarized immunosuppressive phenotype to M1 phenotype. As compared to
infiltrating MDSCs, M2 polarized TAM may represent an even more important component of
tumor-promoting, immunosuppressive environment. To confirm our hypothesis, we isolated
infiltrating myeloid cells from vehicle or tasquinimod treated tumors from donor mice, and
mixed them with fresh tumor cells to make inoculates in recipient mice. We observed that
transferred SMCs from tasquinimod-treated tumor were less supportive of tumor growth. 6
The analysis of the composition of tumor immune microenvironment specific to different
models or diseases of interest may be critical to develop effective strategies to modulate the
environment and facilitate the development of anti-tumor therapies.
Our study provides clues to the underlying mechanism for myeloid cell
modulation by tasquinimod (Figure 1). S100A9 is a potential target of tasquinimod that may
Dow
nloa
ded
by [
Ros
wel
l Par
k C
ance
r In
stitu
te]
at 1
4:34
16
Dec
embe
r 20
15

4
be involved in immuno-modulatory activity8, and S100A9 has been shown to regulate
accumulation of MDSCs4, 9. Tasquinimod binds to S100A910, and blocks the interaction of
this ligand with its receptors, including receptor for advanced glycation end product (RAGE)
and Toll-like receptor (TLR)-4 and EMMPRIN. In an additional, metastatic model, we
observed that tasquinimod was able to dramatically reduce M2 macrophages in renal cell
tumors and at the metastatic site (lung; unpublished data). This observation suggests that
tasquinimod may act through inhibiting the trafficking of MDSCs, via inhibition of S100A9,
into the tumor in our tested models. However, a previous report showed that antibody against
RAGE, mAbGB3.1, inhibited the accumulation of MDSCs in peripheral sites, but not in the
metastatic tumor site (the primary tumors were resected)4. The discrepancy between these
results may originate from the fact that tasquinimod binds and inhibits the ligand, S100A9,
whereas mAbGB3.1 blocks one of receptors for the ligand, RAGE. Therefore, the other
receptor for S100A9, TLR4 and/or EMMPRIN, may mediate the SMC-targeting activity of
tasquinimod. At the same time, other tumor or stroma-secreted inflammatory factors may still
induce peripheral MDSC expansion when S100A9 protein ligand is blocked. We have also
demonstrated that expression of suppressive function-related genes, Arginase-1 (reduction)
and iNOS (induction) was regulated by tasquinimod treatment. It has been reported that TLR-
4 pathway is an important regulator of Arginase-1 expression. This finding would suggest
that tasquinimod may affect function and polarization of SMCs by inhibiting S100A9—
TLR4—Arginase axis. Though tasquinimod did not change accumulation of Gr1+CD11b+
MDSCs in blood, it depleted Gr1--CD11b+ monocytes from peripheral blood. Therefore,
tasquinimod may also reduce the CD206+ M2 TAMs through depletion of these Gr1--CD11b+
precursor cells from blood.
In summary, tasquinimod is an agent that has the potential of overcoming the
suppressive tumor environment. Targeting the suppressive tumor microenvironment
Dow
nloa
ded
by [
Ros
wel
l Par
k C
ance
r In
stitu
te]
at 1
4:34
16
Dec
embe
r 20
15

5
continues to be an active field of exploration to address management of metastatic cancers as
part of immuno-oncology at large.
Dow
nloa
ded
by [
Ros
wel
l Par
k C
ance
r In
stitu
te]
at 1
4:34
16
Dec
embe
r 20
15

6
References cited
1. Gabrilovich DI, Nagaraj S. Myeloid-derived suppressor cells as regulators of the immune
system. Nat Rev Immunol 2009; 9:162-74.
2. Sica A, Bronte V. Altered macrophage differentiation and immune dysfunction in tumor
development. J Clin Invest 2007; 117:1155-66.
3. Solito S, Bronte V, Mandruzzato S. Antigen specificity of immune suppression by
myeloid-derived suppressor cells. J Leukoc Biol 2011.
4. Sinha P, Okoro C, Foell D, Freeze HH, Ostrand-Rosenberg S, Srikrishna G.
Proinflammatory S100 proteins regulate the accumulation of myeloid-derived suppressor
cells. J Immunol 2008; 181:4666-75.
5. Pili R, Haggman M, Stadler WM, Gingrich JR, Assikis VJ, Bjork A, Nordle O, Forsberg
G, Carducci MA, Armstrong AJ. Phase II randomized, double-blind, placebo-controlled
study of tasquinimod in men with minimally symptomatic metastatic castrate-resistant
prostate cancer. J Clin Oncol 2011; 29:4022-8.
6. Shen L, Sundstedt A, Ciesielski M, Miles KM, Celander M, Adelaiye R, Orillion A,
Ciamporcero E, Ramakrishnan S, Ellis L, et al. Tasquinimod modulates suppressive myeloid
cells and enhances cancer immunotherapies in murine models. Cancer Immunol Res 2015;
3:136-48.
7. Corzo CA, Condamine T, Lu L, Cotter MJ, Youn JI, Cheng P, Cho HI, Celis E, Quiceno
DG, Padhya T, et al. HIF-1alpha regulates function and differentiation of myeloid-derived
suppressor cells in the tumor microenvironment. J Exp Med 2010; 207:2439-53.
8. Bjork P, Bjork A, Vogl T, Stenstrom M, Liberg D, Olsson A, Roth J, Ivars F, Leanderson
T. Identification of human S100A9 as a novel target for treatment of autoimmune disease via
binding to quinoline-3-carboxamides. PLoS Biol 2009; 7:e97.
Dow
nloa
ded
by [
Ros
wel
l Par
k C
ance
r In
stitu
te]
at 1
4:34
16
Dec
embe
r 20
15

7
9. Cheng P, Corzo CA, Luetteke N, Yu B, Nagaraj S, Bui MM, Ortiz M, Nacken W, Sorg C,
Vogl T, et al. Inhibition of dendritic cell differentiation and accumulation of myeloid-derived
suppressor cells in cancer is regulated by S100A9 protein. J Exp Med 2008; 205:2235-49.
10. Kallberg E, Vogl T, Liberg D, Olsson A, Bjork P, Wikstrom P, Bergh A, Roth J, Ivars F,
Leanderson T. S100A9 interaction with TLR4 promotes tumor growth. PLoS One 2012;
7:e34207.
Dow
nloa
ded
by [
Ros
wel
l Par
k C
ance
r In
stitu
te]
at 1
4:34
16
Dec
embe
r 20
15

8
Figure 1 Proposed potential mechanisms underlying modulation of tumor microenvironment
by tasquinimod. Tasquinimod binds to S100A9 homodimers in a 1:1 fashion10 and blocks its
interaction with receptors expressed on multiple myeloid cell populations. The blockade may
lead to depletion of Gr1--CD11b+ blood monocytes, which are one of the precursors of
TAMs. In addition, the trafficking of Gr1+CD11b+ MDSCs to tumor sites is inhibited.
Tasquinimod also induce M2 to M1 polarization of macrophages in the tumors, associated
with down-regulation of Arginase-1 and induction of iNOS expression in these cells. Thus,
tasquinimod may impair the suppressive function of infiltrating SMCs through blockade of
S100A9-TLR4-Arginase-1 signaling.
Dow
nloa
ded
by [
Ros
wel
l Par
k C
ance
r In
stitu
te]
at 1
4:34
16
Dec
embe
r 20
15