aweu-net: an attention-aware weight excitation u-net for
TRANSCRIPT

Article
AWEU-Net: An Attention-Aware Weight Excitation U-Net for LungNodule SegmentationSyeda Furruka Banu1*, Md. Mostafa Kamal Sarker 2, Mohamed Abdel-Nasser1,3, Domenec Puig 1, Hatem A. Raswan 1
�����������������
Citation: Banu, S.F.; Sarker, M.M.K.;
Abdel-Nasser, M.; Puig, D.; Rashwan, H.A.
AWEU-Net: An Attention-Aware Weight
Excitation U-Net for Lung Nodule
Segmentation. Preprints 2021, 1, 0.
https://doi.org/
Received:
Accepted:
Published:
Publisher’s Note: MDPI stays neutral with
regard to jurisdictional claims in published
maps and institutional affiliations.
1 Departament d’Enginyeria Informàtica i Matemàtiques, Universitat Rovira i Virgili, 43007 Tarragona, Spain;[email protected], [email protected], [email protected], [email protected]
2 National Subsea Centre, Robert Gordon University, Aberdeen, AB10 7GJ, UK; [email protected],3 Department of Electrical Engineering, Aswan University, Aswan 81542, Egypt; [email protected]* Correspondence: [email protected]
Abstract: Lung cancer is deadly cancer that causes millions of deaths every year around the world. Accuratelung nodule detection and segmentation in computed tomography (CT) images is the most important part ofdiagnosing lung cancer in the early stage. Most of the existing systems are semi-automated and need to manuallyselect the lung and nodules regions to perform the segmentation task. To address these challenges, we proposed afully automated end-to-end lung nodule detection and segmentation system based on a deep learning approach.In this paper, we used Optimized Faster R-CNN; a state-of-the-art detection model to detect the lung noduleregions in the CT scans. Furthermore, we proposed an attention-aware weight excitation U-Net, called AWEU-Net, for lung nodule segmentation and boundaries detection. To achieve more accurate nodule segmentation,in AWEU-Net, we proposed position attention-aware weight excitation (PAWE), and channel attention-awareweight excitation (CAWE) blocks to highlight the best aligned spatial and channel features in the input featuremaps. The experimental results demonstrate that our proposed model yields a Dice score of 89.79% and 90.35%,and an intersection over union (IoU) of 82.34% and 83.21% on the publicly LUNA16 and LIDC-IDRI datasets,respectively.
Keywords: Artificial Intelligence; Computer-Aided Diagnosis; Computed Tomography; Lung Cancer; DeepLearning; Lung Nodule Detection; Lung Nodule Segmentation
1. IntroductionAccording to the World Health Organization (WHO), lung cancer is the leading cause of cancer
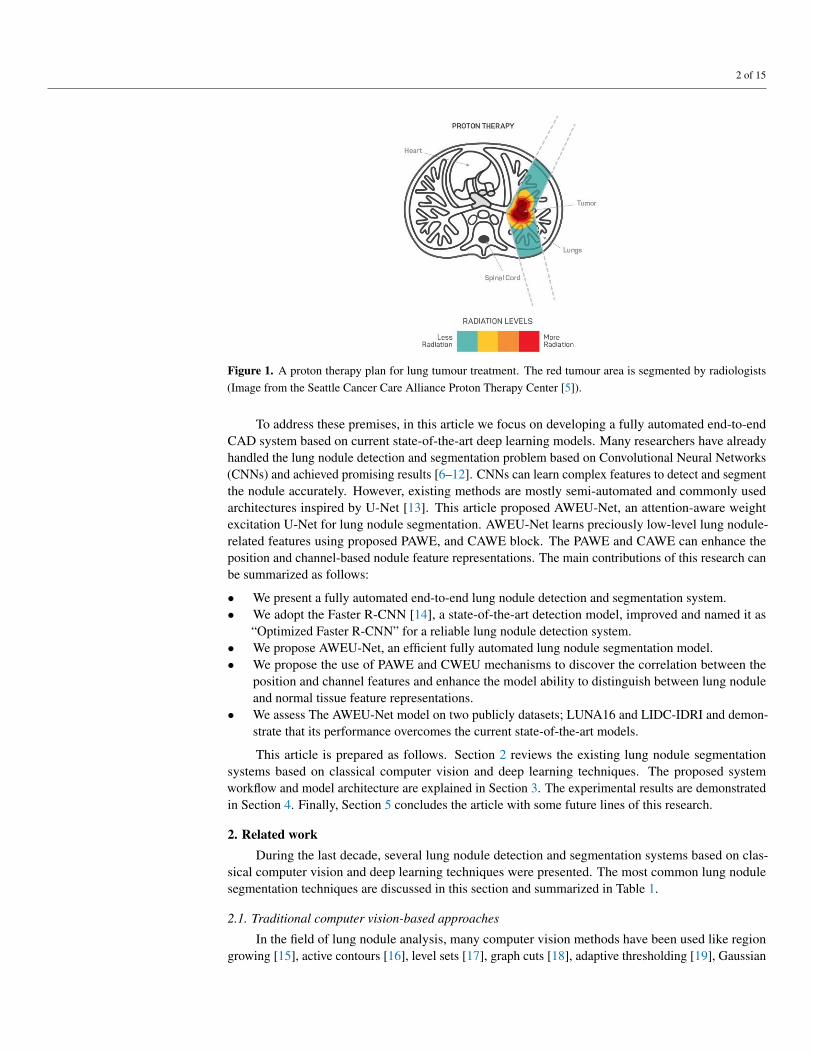
deaths at 1.80 million in 2020 [1]. The estimated new cases rise to 2.89 million with the deathprojected to reach 2.45 million worldwide by 2030 [2]. These deaths could be avoidable by an earlydiagnosis with a quick treatment plan. The National Lung Screening Trial (NLST) showed that themorality of lung cancer is reduced by 20% for emphasising the significance of nodule detectionand assessment [3]. Currently, the efficient investigation to discover pulmonary nodules is based onComputed Tomography (CT) imaging technology that generates hundred images of the lung within asecond by a single scan. It is a very difficult and tedious job for radiologists to detect the nodules fromthese images manually. However, computer-aided diagnosis (CAD) systems have assisted radiologistsin the automated diagnosis of lung cancer and pulmonary diseases over the last years. These CADsystems mainly depend on the detection and segmentation of various pulmonary parts. They consist oftwo subsystems, namely; Computer-aided detection (CADe) and segmentation (CASe), respectively. Inthe lung cancer screening CAD system, the CADe system identifies the region of interest in the lungnodule and CASe segments the region of the nodule. The detection and segmentation of lung nodulesare always challenging tasks because of their heterogeneity in CT images. However, automated analysisis necessary to measure the properties of the lung nodule for identifying the malignancy of the tumour.The lung nodule segmentation system can determine the malignancy by analysing nodule size, shapeand change rate [4]. It should be noted that the use of an accurate lung nodule screening CAD systemcan accelerate the entire diagnosis and radiotherapy process where patients can perform the requiredradiation or photon therapy (shown in Figure 1) on the same day.
arX
iv:2
110.
0514
4v1
[ee
ss.I
V]
11
Oct
202
1
2 of 15
Figure 1. A proton therapy plan for lung tumour treatment. The red tumour area is segmented by radiologists(Image from the Seattle Cancer Care Alliance Proton Therapy Center [5]).
To address these premises, in this article we focus on developing a fully automated end-to-endCAD system based on current state-of-the-art deep learning models. Many researchers have alreadyhandled the lung nodule detection and segmentation problem based on Convolutional Neural Networks(CNNs) and achieved promising results [6–12]. CNNs can learn complex features to detect and segmentthe nodule accurately. However, existing methods are mostly semi-automated and commonly usedarchitectures inspired by U-Net [13]. This article proposed AWEU-Net, an attention-aware weightexcitation U-Net for lung nodule segmentation. AWEU-Net learns preciously low-level lung nodule-related features using proposed PAWE, and CAWE block. The PAWE and CAWE can enhance theposition and channel-based nodule feature representations. The main contributions of this research canbe summarized as follows:
• We present a fully automated end-to-end lung nodule detection and segmentation system.• We adopt the Faster R-CNN [14], a state-of-the-art detection model, improved and named it as
“Optimized Faster R-CNN” for a reliable lung nodule detection system.• We propose AWEU-Net, an efficient fully automated lung nodule segmentation model.• We propose the use of PAWE and CWEU mechanisms to discover the correlation between the
position and channel features and enhance the model ability to distinguish between lung noduleand normal tissue feature representations.
• We assess The AWEU-Net model on two publicly datasets; LUNA16 and LIDC-IDRI and demon-strate that its performance overcomes the current state-of-the-art models.
This article is prepared as follows. Section 2 reviews the existing lung nodule segmentationsystems based on classical computer vision and deep learning techniques. The proposed systemworkflow and model architecture are explained in Section 3. The experimental results are demonstratedin Section 4. Finally, Section 5 concludes the article with some future lines of this research.
2. Related workDuring the last decade, several lung nodule detection and segmentation systems based on clas-
sical computer vision and deep learning techniques were presented. The most common lung nodulesegmentation techniques are discussed in this section and summarized in Table 1.
2.1. Traditional computer vision-based approaches
In the field of lung nodule analysis, many computer vision methods have been used like regiongrowing [15], active contours [16], level sets [17], graph cuts [18], adaptive thresholding [19], Gaussian

3 of 15
Table 1: Summary of existing lung nodule segmentation methods. The undeclared information ismarked with dashes (-) in the referred literature.
References Methods/Architectures Dataset Pre-Processing Post-Processing
Classical computer vision-based
[15] Region growing PRIVATE Local Contrast & Hole Filling -[16] Active contours LIDC-IDRI Thresholding & morphological operations Markov random field[17] Level sets LIDC-IDRI Statistical intensity Region condition[18] Graph cuts PRIVATE Gaussian smoothing -[19] Adaptive thresholding LIDC-IDRI Histogram equalization & noise filtering Morphological operations[20] GMM fuzzy C-means LIDC-IDRI & GHGZMCPLA Non-local mean filter & gaussian pyramid Random walker[21] Region-based fast marching LIDC-IDRI Convex hulls Mean threshold
Deep learning-based
[6] U-Net LIDC-IDRI Nodule ROI selection -[7] iW-Net LIDC-IDRI Nodule ROI selection -[8] U-Det LUNA16 Data augmentation -[9] Nodulenet LIDC-IDRI & LUNA16 Nodule ROI selection & Data augmentation -[10] DB-ResNet LIDC-IDRI Nodule ROI selection & Data augmentation Remove the noisy voxel[12] MRRN TCIA & MSKCC & LIDC-IDRI Nodule ROI selection & Data augmentation -
mixture model (GMM) with fuzzy C-means [20], and region-based fast marching [21]. For instance, acontrast-based region growing method and fuzzy connectivity map of the object of interest were usedin [15] to segment the various types of pulmonary nodules. This method did not perform well withirregular nodules because of the merging criterion in the region growing technique that needs accuratesettings. A geometric active contours with a marker-controlled watershed as well as Markov randomfield (MRF) was used in [16] to segment the lung nodule. This method depends on manually selects aregion of interest (ROI) in the nodule region. [17] used the shape prior hypothesis along with levelsets that iteratively minimizes the energy to segment the juxtapleural nodules. The precision of thismethod also depends on the selection of the ROIs. A graph cuts with the expectation-maximization(EM) algorithm was proposed in [18] for lung segmentation on chest CT images. This algorithm hasa high computational cost because its main focus is on the Gaussian mixture model(GMM) trainingmethod and the creation of the corresponding graph. [19] used the adaptive thresholding along withwatershed transform to detect the nodules. This approach mainly relies on several image pre- andpost-processing procedures. [20] combined GMM earlier knowledge within the conventional fuzzy C-means method to improve the robustness of pulmonary nodules segmentation. The major disadvantageof fuzzy C-means algorithms is that they are sensitive to noise, outliers and primary cluster selection.A region-based approach was introduced in [21] by using the fast marching method, which gives aprecise segmentation of the nodule and can properly handle juxtapleural and juxtavascular nodules. Allthese above-mentioned traditional approaches are semi-automated or depend on several image pre- andpost-processing methods.
2.2. Deep learning-based approaches
Recently, many researchers have developed various deep learning-based systems for lung noduledetection and segmentation. [6] presented a simple U-Net for for lung nodule segmentation by utilizinghalf of the convolutional layers normally used in the original U-Net [13]. The model has many windowwidths and window centres enhancing the nodule features. It improves the model performance overthe original U-Net by 2% in Dice Score Coefficient (DSC). [7] combined two U-Net models (namediW-Net) that can be used with and without user interaction. In the first instance, the user selects thenodules ROI and the corresponding end-point to produce a weight map for developing the prediction ofthe model. The architecture is designed by considering the expected round shape of the nodules. Theloss function is also combined with the weight map and the feature of the model output. [12] presenteda multiple resolution residual network (MRRN) that is a modification of the ResNet [22] based on theU-Net model. A slightly transformed version of U-Net called U-Det was presented in [8], where manyhidden layers were used to filter the residuals blocks located within the encoder and decoder. U-Det alsoapplies the Mish activation function. An end-to-end 3D Deep-CNN called NoduleNet was presented
4 of 15
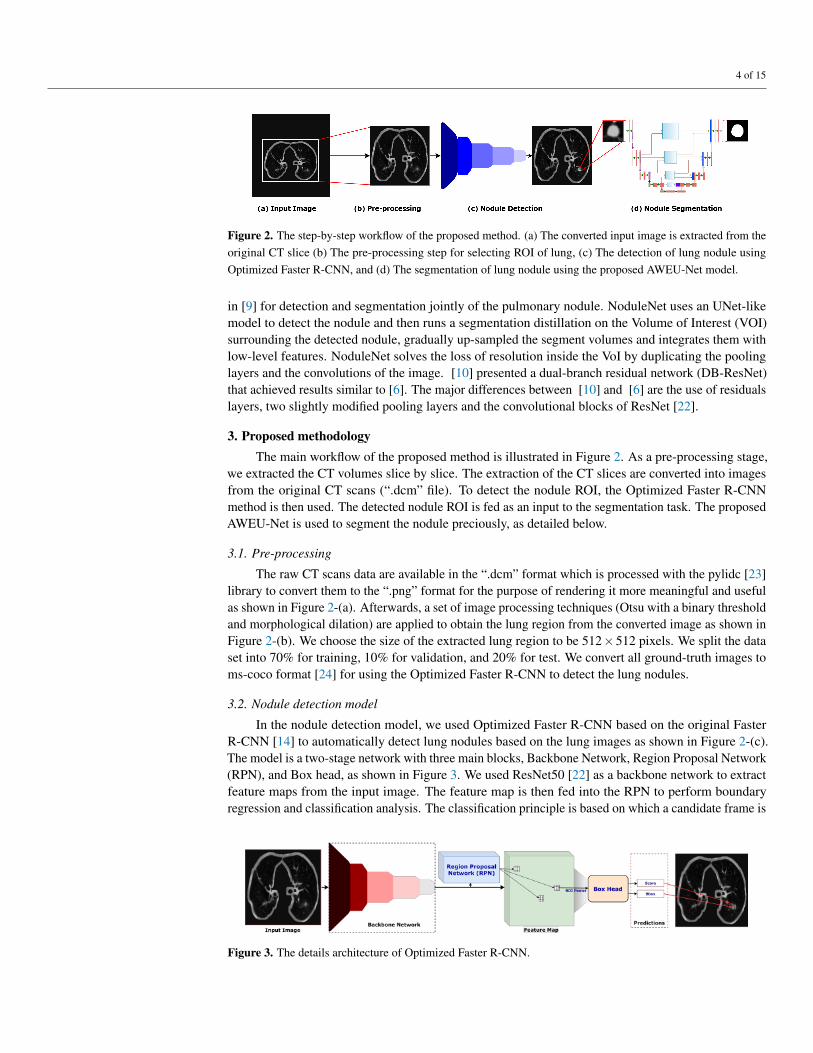
Figure 2. The step-by-step workflow of the proposed method. (a) The converted input image is extracted from theoriginal CT slice (b) The pre-processing step for selecting ROI of lung, (c) The detection of lung nodule usingOptimized Faster R-CNN, and (d) The segmentation of lung nodule using the proposed AWEU-Net model.
in [9] for detection and segmentation jointly of the pulmonary nodule. NoduleNet uses an UNet-likemodel to detect the nodule and then runs a segmentation distillation on the Volume of Interest (VOI)surrounding the detected nodule, gradually up-sampled the segment volumes and integrates them withlow-level features. NoduleNet solves the loss of resolution inside the VoI by duplicating the poolinglayers and the convolutions of the image. [10] presented a dual-branch residual network (DB-ResNet)that achieved results similar to [6]. The major differences between [10] and [6] are the use of residualslayers, two slightly modified pooling layers and the convolutional blocks of ResNet [22].
3. Proposed methodologyThe main workflow of the proposed method is illustrated in Figure 2. As a pre-processing stage,
we extracted the CT volumes slice by slice. The extraction of the CT slices are converted into imagesfrom the original CT scans (“.dcm” file). To detect the nodule ROI, the Optimized Faster R-CNNmethod is then used. The detected nodule ROI is fed as an input to the segmentation task. The proposedAWEU-Net is used to segment the nodule preciously, as detailed below.
3.1. Pre-processing
The raw CT scans data are available in the “.dcm” format which is processed with the pylidc [23]library to convert them to the “.png” format for the purpose of rendering it more meaningful and usefulas shown in Figure 2-(a). Afterwards, a set of image processing techniques (Otsu with a binary thresholdand morphological dilation) are applied to obtain the lung region from the converted image as shown inFigure 2-(b). We choose the size of the extracted lung region to be 512×512 pixels. We split the dataset into 70% for training, 10% for validation, and 20% for test. We convert all ground-truth images toms-coco format [24] for using the Optimized Faster R-CNN to detect the lung nodules.
3.2. Nodule detection model
In the nodule detection model, we used Optimized Faster R-CNN based on the original FasterR-CNN [14] to automatically detect lung nodules based on the lung images as shown in Figure 2-(c).The model is a two-stage network with three main blocks, Backbone Network, Region Proposal Network(RPN), and Box head, as shown in Figure 3. We used ResNet50 [22] as a backbone network to extractfeature maps from the input image. The feature map is then fed into the RPN to perform boundaryregression and classification analysis. The classification principle is based on which a candidate frame is
Figure 3. The details architecture of Optimized Faster R-CNN.

5 of 15
Figure 4. The architecture of the proposed AWEU-Net. The PAWE and CAWE block refers the position attention-aware weight excitation and channel attention-aware weight excitation, respectively.
either related to background or to the object. The position and score of the RPN outputs on the candidateframe are sent to the Box head, where the final regression and classification of the object is performed.Finally, the prediction will show the bounding box of the target (nodule) with the classification score.
3.3. Nodule segmentation model
We crop the ROI based on the detection box suggested by the nodule detection model introducedabove. We resize the ROI to 224×224 and feed it into the proposed nodule segmentation model. Wepropose an attention-aware weight excitation U-Net, AWEU-Net, for our lung nodule segmentation(Figure 4). The network is based on the U-Net [13], which is a well-known deep learning modelfor medical image segmentation. The AWEU-Net model learns to segment the input sub-images bydetermining the boundaries of the nodule region to discriminate between normal and abnormal tissues.One of the main contributions in this article is to develop a PAWE block in the AWEU-Net model tocapture the contextual positional features of the input image. We also propose another CAWE block toenhance the channel-wise feature maps that are coming from each layer of the AWEU-Net model. Thedetails about PAWE and CAWE will be discussed in Section 3.3.1 and Section 3.3.2, respectively.
The AWEU-Net architecture is composed of two successive networks: encoder and decoder.The encoder consists of a sequence of PAWE blocks and max-pooling layers. Each encoder layer iscomposed of a PAWE block with a 3× 3 convolutional layer followed by a ReLU as an activationfunction. Four down-sample blocks with 2×2 max-pooling followed by a stride of 2 are used aftereach block of the encoder. The decoder consists of a sequence of up-convolutions and concatenationwith the corresponding high-resolution features from the CAWE blocks that provide a high-resolutionoutput segmentation map. The features coming from encoder layers are also upsampled (Up1, Up3and Up5) and concatenated with CAWE blocks. The same features coming from CAWE blocks alsoupsampled (Up2, Up4, and Up6) and concatenated with corresponding decoder layers. The decodernetwork consists of four layers similar to the encoder. Each layer also consists of a PAWE block with a3×3 convolutional layer followed by a ReLU and a 2×2 up-conv layer. After each decoder layer, thefeature maps are upsampled to the same size of the CAWE block output to keep the consistency andconcatenate it. This mechanism enhances the positional and channel attention-based features learnedfrom the encoder phase and utilises them for the reconstruction means in the decoder network. Thefinal output layer of the model applies a 1×1 convolutional layer to map the final 64 feature vectorto the number of targeted segmentation classes. It should be noted that in our case the segmentationclasses are the background and lung nodule (two classes).
6 of 15
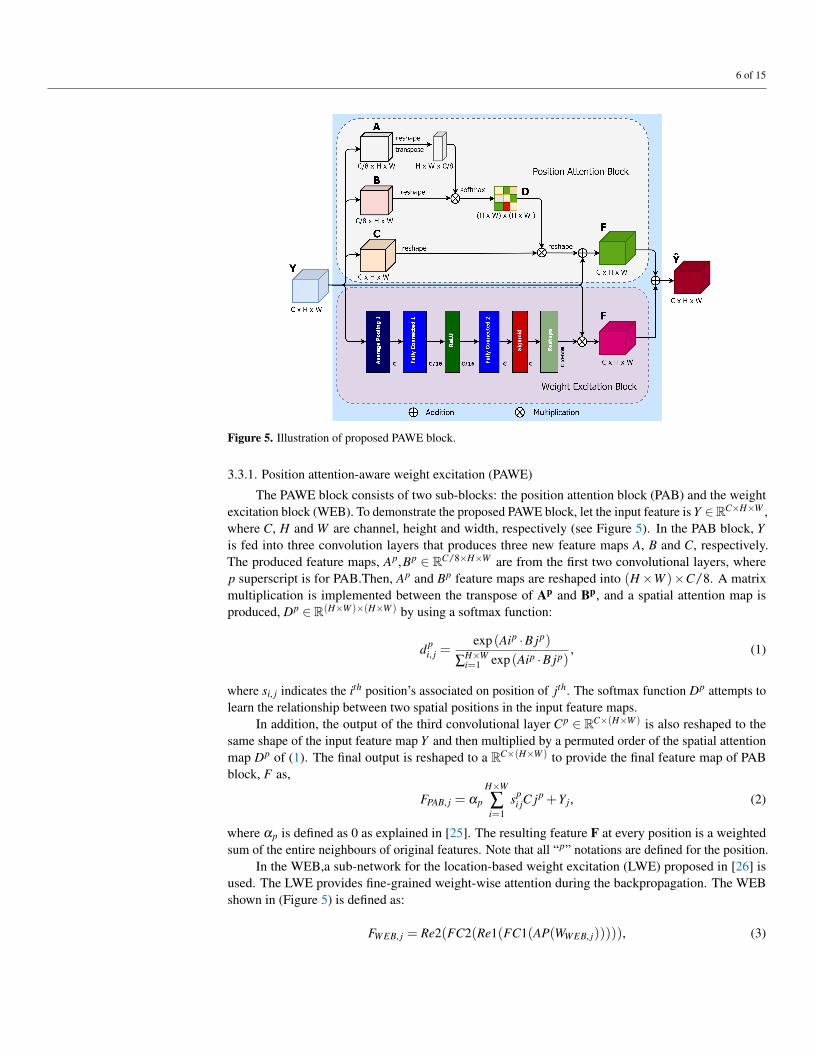
Figure 5. Illustration of proposed PAWE block.
3.3.1. Position attention-aware weight excitation (PAWE)
The PAWE block consists of two sub-blocks: the position attention block (PAB) and the weightexcitation block (WEB). To demonstrate the proposed PAWE block, let the input feature is Y ∈RC×H×W ,where C, H and W are channel, height and width, respectively (see Figure 5). In the PAB block, Yis fed into three convolution layers that produces three new feature maps A, B and C, respectively.The produced feature maps, Ap,Bp ∈ RC/8×H×W are from the first two convolutional layers, wherep superscript is for PAB.Then, Ap and Bp feature maps are reshaped into (H×W )×C/8. A matrixmultiplication is implemented between the transpose of Ap and Bp, and a spatial attention map isproduced, Dp ∈ R(H×W )×(H×W ) by using a softmax function:
dpi, j =
exp (Aip ·B jp)
∑H×Wi=1 exp (Aip ·B jp)
, (1)
where si, j indicates the ith position’s associated on position of jth. The softmax function Dp attempts tolearn the relationship between two spatial positions in the input feature maps.
In addition, the output of the third convolutional layer Cp ∈ RC×(H×W ) is also reshaped to thesame shape of the input feature map Y and then multiplied by a permuted order of the spatial attentionmap Dp of (1). The final output is reshaped to a RC×(H×W ) to provide the final feature map of PABblock, F as,
FPAB, j = αp
H×W
∑i=1
spi jC jp +Yj, (2)
where αp is defined as 0 as explained in [25]. The resulting feature F at every position is a weightedsum of the entire neighbours of original features. Note that all “p” notations are defined for the position.
In the WEB,a sub-network for the location-based weight excitation (LWE) proposed in [26] isused. The LWE provides fine-grained weight-wise attention during the backpropagation. The WEBshown in (Figure 5) is defined as:
FWEB, j = Re2(FC2(Re1(FC1(AP(WWEB, j))))), (3)

7 of 15
where WWEB, j is the weights across the jth output channel. The average pooling layer, AP, averages thevalues of each H×W . Re1 and Re2 are two ReLu activation functions. FC1 and FC2 are two fullyconnected layers.
The output feature from WEB is reshaped and multiplied to the input feature map. Finally, anelement-wise sum operation is performed between the features maps from the PAB and WEB to producethe final PAWE features as follows:
YPAWE, j = FPAB, j +FWEB, j, (4)
This process generates a global contextual description and aggregates the context according to a spatialweighted attention map by creating relevant weighted features that can produce common weight-excitation and enhance the intra-class semantic coherence.
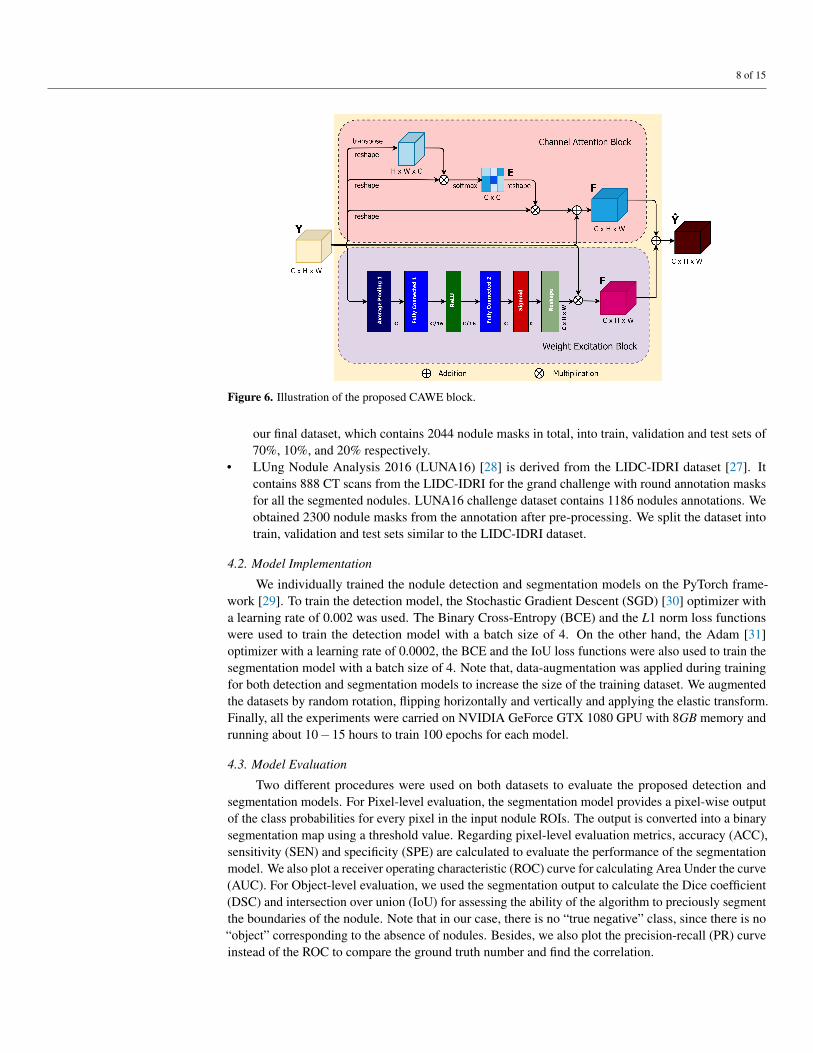
3.3.2. Channel attention-aware weight excitation (CAWE)
Like PAWE, the proposed CAWE block includes two sub-blocks, a channel attention block (CAB)and a weight excitation block (WEB). In the CAB block, the input Y ∈ RC×H×W is reshaped in theinitial two steps and permuted in the second part into Y c
1 ∈ R(H×W )×C and Y c2 ∈ RC×(H×W ), where the
superscript c is defined for CAB. Afterwards, a matrix multiplication between Y c1 and Y c
2 is performed.The channel attention map Ec ∈ RC×C is defined as:
eci, j =
exp (Y c1,i ·Y c
2, j)
∑Ci=1 exp (Y c
1,i ·Y c2, j)
, (5)
where the outcome of the ith channel on the jth is produced by eci, j. A multiplication of transposed version
of the input feature maps, Y c3 reshaped to RC×(H×W ), and the resulted Ec is performed. Consequently,
the final channel attention map can be defined as:
FCAB, j = αc
C
∑i=1
eci jY
c3, j +Yj, (6)
where αc quantify the weight of the channel attention map by the input feature map Y . The final WEBsub-network feature map can be obtained from the Equation 3.
Finally an element-wise sum operation is performed between the CAB and WEB output featuresmaps to produce the final CAWE features as follows:
YCAWE, j = FCAB, j +FWEB, j, (7)
This process emphasizes class-dependent feature maps using weighted excitation versions of the featuresof all the channels and boosting the feature difference among the classes. Note that all “c” notations aredefined for the channel.
4. Experimental results and discussion4.1. Datasets
In this work, we used two publicly available datasets:
• Lung Image Database Consortium image collection (LIDC-IDRI) [27] consists of 1018 CT scansperformed on 1010 patients from seven different organisations. Each CT scan has been analysedby four radiologists, who individually identified the nodule and manually segmented the region ofall the nodules with a diameter larger than three millimetres. Each CT scan can include one ormore nodule regions, so the total segmented masks are 5066. Looking close at the dataset, manynodules are very small and not satisfied the malignancy index. Therefore, we used a diameterthreshold larger than 20 mm to excluded all tiny nodules from our dataset. Afterwards, we split
8 of 15
Figure 6. Illustration of the proposed CAWE block.
our final dataset, which contains 2044 nodule masks in total, into train, validation and test sets of70%, 10%, and 20% respectively.
• LUng Nodule Analysis 2016 (LUNA16) [28] is derived from the LIDC-IDRI dataset [27]. Itcontains 888 CT scans from the LIDC-IDRI for the grand challenge with round annotation masksfor all the segmented nodules. LUNA16 challenge dataset contains 1186 nodules annotations. Weobtained 2300 nodule masks from the annotation after pre-processing. We split the dataset intotrain, validation and test sets similar to the LIDC-IDRI dataset.
4.2. Model Implementation
We individually trained the nodule detection and segmentation models on the PyTorch frame-work [29]. To train the detection model, the Stochastic Gradient Descent (SGD) [30] optimizer witha learning rate of 0.002 was used. The Binary Cross-Entropy (BCE) and the L1 norm loss functionswere used to train the detection model with a batch size of 4. On the other hand, the Adam [31]optimizer with a learning rate of 0.0002, the BCE and the IoU loss functions were also used to train thesegmentation model with a batch size of 4. Note that, data-augmentation was applied during trainingfor both detection and segmentation models to increase the size of the training dataset. We augmentedthe datasets by random rotation, flipping horizontally and vertically and applying the elastic transform.Finally, all the experiments were carried on NVIDIA GeForce GTX 1080 GPU with 8GB memory andrunning about 10−15 hours to train 100 epochs for each model.
4.3. Model Evaluation
Two different procedures were used on both datasets to evaluate the proposed detection andsegmentation models. For Pixel-level evaluation, the segmentation model provides a pixel-wise outputof the class probabilities for every pixel in the input nodule ROIs. The output is converted into a binarysegmentation map using a threshold value. Regarding pixel-level evaluation metrics, accuracy (ACC),sensitivity (SEN) and specificity (SPE) are calculated to evaluate the performance of the segmentationmodel. We also plot a receiver operating characteristic (ROC) curve for calculating Area Under the curve(AUC). For Object-level evaluation, we used the segmentation output to calculate the Dice coefficient(DSC) and intersection over union (IoU) for assessing the ability of the algorithm to preciously segmentthe boundaries of the nodule. Note that in our case, there is no “true negative” class, since there is no“object” corresponding to the absence of nodules. Besides, we also plot the precision-recall (PR) curveinstead of the ROC to compare the ground truth number and find the correlation.
9 of 15
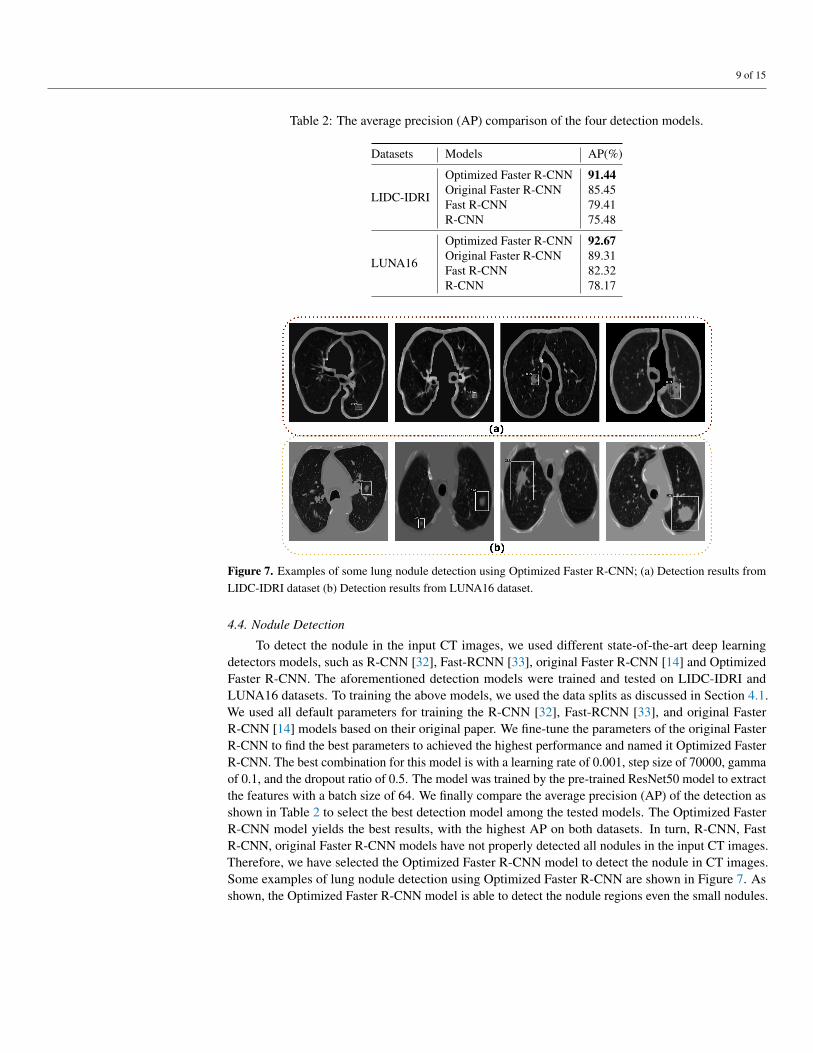
Table 2: The average precision (AP) comparison of the four detection models.
Datasets Models AP(%)
LIDC-IDRI
Optimized Faster R-CNN 91.44Original Faster R-CNN 85.45Fast R-CNN 79.41R-CNN 75.48
LUNA16
Optimized Faster R-CNN 92.67Original Faster R-CNN 89.31Fast R-CNN 82.32R-CNN 78.17
Figure 7. Examples of some lung nodule detection using Optimized Faster R-CNN; (a) Detection results fromLIDC-IDRI dataset (b) Detection results from LUNA16 dataset.
4.4. Nodule Detection
To detect the nodule in the input CT images, we used different state-of-the-art deep learningdetectors models, such as R-CNN [32], Fast-RCNN [33], original Faster R-CNN [14] and OptimizedFaster R-CNN. The aforementioned detection models were trained and tested on LIDC-IDRI andLUNA16 datasets. To training the above models, we used the data splits as discussed in Section 4.1.We used all default parameters for training the R-CNN [32], Fast-RCNN [33], and original FasterR-CNN [14] models based on their original paper. We fine-tune the parameters of the original FasterR-CNN to find the best parameters to achieved the highest performance and named it Optimized FasterR-CNN. The best combination for this model is with a learning rate of 0.001, step size of 70000, gammaof 0.1, and the dropout ratio of 0.5. The model was trained by the pre-trained ResNet50 model to extractthe features with a batch size of 64. We finally compare the average precision (AP) of the detection asshown in Table 2 to select the best detection model among the tested models. The Optimized FasterR-CNN model yields the best results, with the highest AP on both datasets. In turn, R-CNN, FastR-CNN, original Faster R-CNN models have not properly detected all nodules in the input CT images.Therefore, we have selected the Optimized Faster R-CNN model to detect the nodule in CT images.Some examples of lung nodule detection using Optimized Faster R-CNN are shown in Figure 7. Asshown, the Optimized Faster R-CNN model is able to detect the nodule regions even the small nodules.
10 of 15
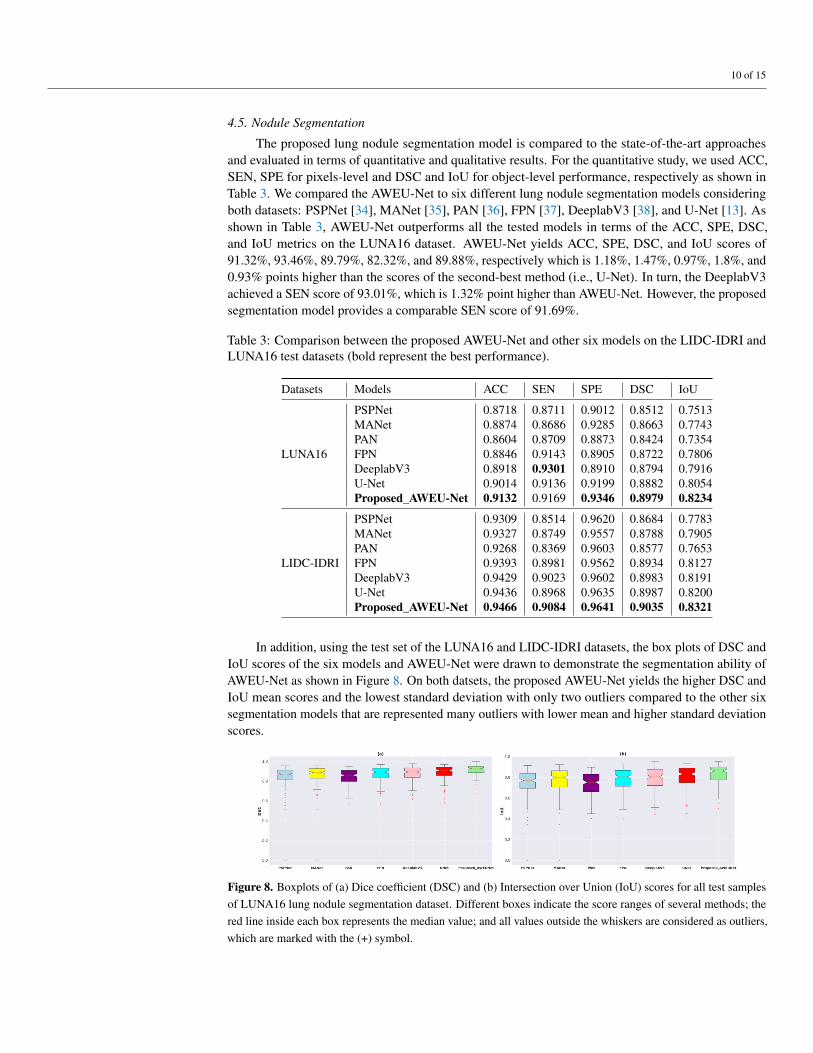
4.5. Nodule Segmentation
The proposed lung nodule segmentation model is compared to the state-of-the-art approachesand evaluated in terms of quantitative and qualitative results. For the quantitative study, we used ACC,SEN, SPE for pixels-level and DSC and IoU for object-level performance, respectively as shown inTable 3. We compared the AWEU-Net to six different lung nodule segmentation models consideringboth datasets: PSPNet [34], MANet [35], PAN [36], FPN [37], DeeplabV3 [38], and U-Net [13]. Asshown in Table 3, AWEU-Net outperforms all the tested models in terms of the ACC, SPE, DSC,and IoU metrics on the LUNA16 dataset. AWEU-Net yields ACC, SPE, DSC, and IoU scores of91.32%, 93.46%, 89.79%, 82.32%, and 89.88%, respectively which is 1.18%, 1.47%, 0.97%, 1.8%, and0.93% points higher than the scores of the second-best method (i.e., U-Net). In turn, the DeeplabV3achieved a SEN score of 93.01%, which is 1.32% point higher than AWEU-Net. However, the proposedsegmentation model provides a comparable SEN score of 91.69%.
Table 3: Comparison between the proposed AWEU-Net and other six models on the LIDC-IDRI andLUNA16 test datasets (bold represent the best performance).
Datasets Models ACC SEN SPE DSC IoU
LUNA16
PSPNet 0.8718 0.8711 0.9012 0.8512 0.7513MANet 0.8874 0.8686 0.9285 0.8663 0.7743PAN 0.8604 0.8709 0.8873 0.8424 0.7354FPN 0.8846 0.9143 0.8905 0.8722 0.7806DeeplabV3 0.8918 0.9301 0.8910 0.8794 0.7916U-Net 0.9014 0.9136 0.9199 0.8882 0.8054Proposed_AWEU-Net 0.9132 0.9169 0.9346 0.8979 0.8234
LIDC-IDRI
PSPNet 0.9309 0.8514 0.9620 0.8684 0.7783MANet 0.9327 0.8749 0.9557 0.8788 0.7905PAN 0.9268 0.8369 0.9603 0.8577 0.7653FPN 0.9393 0.8981 0.9562 0.8934 0.8127DeeplabV3 0.9429 0.9023 0.9602 0.8983 0.8191U-Net 0.9436 0.8968 0.9635 0.8987 0.8200Proposed_AWEU-Net 0.9466 0.9084 0.9641 0.9035 0.8321
In addition, using the test set of the LUNA16 and LIDC-IDRI datasets, the box plots of DSC andIoU scores of the six models and AWEU-Net were drawn to demonstrate the segmentation ability ofAWEU-Net as shown in Figure 8. On both datsets, the proposed AWEU-Net yields the higher DSC andIoU mean scores and the lowest standard deviation with only two outliers compared to the other sixsegmentation models that are represented many outliers with lower mean and higher standard deviationscores.
Figure 8. Boxplots of (a) Dice coefficient (DSC) and (b) Intersection over Union (IoU) scores for all test samplesof LUNA16 lung nodule segmentation dataset. Different boxes indicate the score ranges of several methods; thered line inside each box represents the median value; and all values outside the whiskers are considered as outliers,which are marked with the (+) symbol.

11 of 15
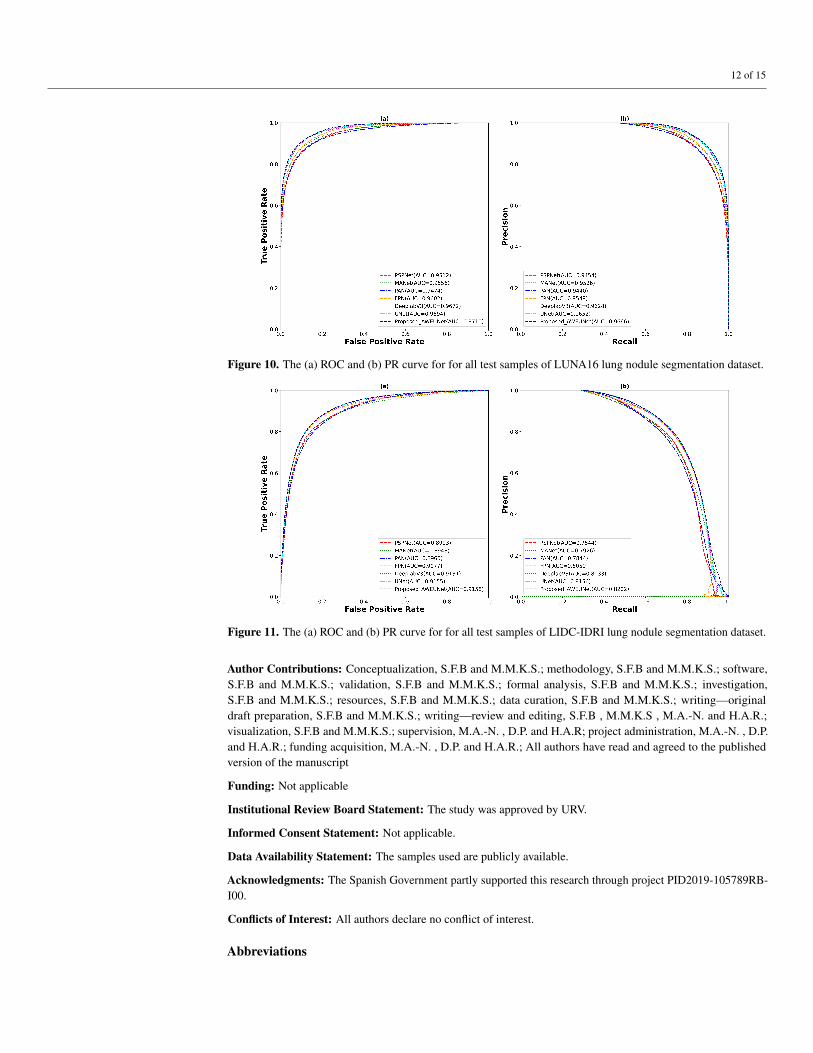
Furthermore, to predict the probability of the binary segmented masks, the ROC and PR curveswere constructed as shown in Figure 10. Using the LUNA16 test set, the proposed AWEU-Net yieldsthe highest AUC and PR of 97.10%, and 96.66%, respectively among the seven segmentation modelstested.
On the other hand, AWEU-Net outperforms all the tested models in terms of all evaluation metricson the LIDC-IDRI dataset. The proposed model yields the ACC, SEN, SPE, DSC, and IoU scoresof 94.66%, 90.84%, 96.41%, 90.35%, and 83.21%, respectively. Its improved 0.3%, 1.16%, 0.06%,0.48%, and 1.21% of ACC, SEN, SPE, DSC, and IoU scores from the original U-Net. Again, thebox plots of DSC and IoU scores of the LIDC-IDRI dataset to compare the models performance isdisplayed in Figure 9. Likewise, the proposed AWEU-Net highest DSC and IoU mean scores and thesmall standard deviation with only one outlier. The proposed model achieved the AUC of ROC and PRon the LIDC-IDRI test dataset are 91.58%, and 82.02%, respectively shown in Figure 11.
Finally, a qualitative comparison of the segmentation results of the AWEU-Net and the sixsegmentation models is shown in Figure 12. The segmentation results of the input nodule ROIs ofCT images with a variety of difficult levels: illumination variations, irregular shape and boundaryof the nodule regions were presented. As shown in Figure 12, four examples from the two datasetsalong with the ground truth and the predicted mask of the six tested models were compared to theproposed AWEU-Net model. AWEU-Net provides segmentation results very close to the ground truthwith an average similarity of > 86% (True Positive (TP)). Our segmentation method also provides thelowest degrees of False Negative (FN) and False Positive (FP) compared to the rest of the models. TheAWEU-Net model yields regular borders compared to PSPNet, MANet, FPN, since our model strivesfor higher accuracy on nodule region boundaries. The resulting segmentation of the six tested modelsmay significantly differ from the ground truth in some cases, e.g., the second example of the LUNA16dataset.
5. ConclusionsThis article proposed a reliable system for lung nodule detection and segmentation. The system
contains two deep learning models. Firstly, the Optimized Faster R-CNN model [14] trained with lungCT scan images was used for detecting the nodule region in a CT image as an initial step. Secondly, asegmentation model, AWEU-Net, was proposed for segmenting the nodule boundaries of the detectednodule region. The proposed segmentation model, AWEU-Net includes PAWE and CAWE blocksto improve the segmentation performance. Compared to the state-of-the-art models, the proposedAWEU-Net yields the best segmentation accuracy with DSC and IoU scores of 89.79%, 90.35%, and82.34%, 83.21% on the LUNA16 and LIDC-IDRI datasets, respectively. In future work, we willdevelop a comprehensive end-to-end nodule segmentation system and it will be able to classify andgrade the nodule malignancy.
Figure 9. Boxplots of (a) Dice coefficient (DSC) and (b) Intersection over Union (IoU) scores for all test samplesof LIDC-IDRI lung nodule segmentation dataset. Different boxes indicate the score ranges of several methods; thered line inside each box represents the median value; and all values outside the whiskers are considered as outliers,which are marked with the (+) symbol.
12 of 15
Figure 10. The (a) ROC and (b) PR curve for for all test samples of LUNA16 lung nodule segmentation dataset.
Figure 11. The (a) ROC and (b) PR curve for for all test samples of LIDC-IDRI lung nodule segmentation dataset.
Author Contributions: Conceptualization, S.F.B and M.M.K.S.; methodology, S.F.B and M.M.K.S.; software,S.F.B and M.M.K.S.; validation, S.F.B and M.M.K.S.; formal analysis, S.F.B and M.M.K.S.; investigation,S.F.B and M.M.K.S.; resources, S.F.B and M.M.K.S.; data curation, S.F.B and M.M.K.S.; writing—originaldraft preparation, S.F.B and M.M.K.S.; writing—review and editing, S.F.B , M.M.K.S , M.A.-N. and H.A.R.;visualization, S.F.B and M.M.K.S.; supervision, M.A.-N. , D.P. and H.A.R; project administration, M.A.-N. , D.P.and H.A.R.; funding acquisition, M.A.-N. , D.P. and H.A.R.; All authors have read and agreed to the publishedversion of the manuscript
Funding: Not applicable
Institutional Review Board Statement: The study was approved by URV.
Informed Consent Statement: Not applicable.
Data Availability Statement: The samples used are publicly available.
Acknowledgments: The Spanish Government partly supported this research through project PID2019-105789RB-I00.
Conflicts of Interest: All authors declare no conflict of interest.
Abbreviations

13 of 15
Figure 12. Examples of segmentation results by different state-of-the-art models (a) segmentation results onLIDC-IDRI dataset and (b) segmentation results on LUNA16 dataset. The colors of segmentation visualizationresults are presented as follows: TP (orange), TN (background), FP (green), and FN (red).
The following abbreviations are used in this manuscript:
CAD Computer-aided DiagnosisCADe Computer-aided DetectionCASe Computer-aided SegmentationCT Computed TomographyAI Artificial IntelligenceGMM Gaussian Mixture ModelCNNs Convolutional Neural NetworksR-CNN Region-based Convolutional Neural NetworkROI Region of Interest (ROI)RPN Region Proposal NetworkFPN Feature Pyramid NetworkReLU Rectified Linear UnitSGD Stochastic Gradient DescentBCE Binary Cross-EntropyDice Dice CoefficientIoU Intersection Over UnionROC Receiver Operating CharacteristicAUC Area Under the CurveACC AccuracySEN SensitivitySPE SpecificityGPU Graphics Processing UnitGB GigabytesDL Deep Learning
References1. Cancer. https://www.who.int/news-room/fact-sheets/detail/cancer/, accessed on 08.08.2021.
14 of 15
2. World Lung Cancer Day 2020 Fact Sheet. https://www.chestnet.org/newsroom/chest-news/2020/07/world-lung-cancer-day-2020-fact-sheet/,accessed on 08.08.2021.
3. Team, N.L.S.T.R. Reduced lung-cancer mortality with low-dose computed tomographic screening. New England Journal of Medicine 2011,365, 395–409.
4. Callister, M.; Baldwin, D.; Akram, A.; Barnard, S.; Cane, P.; Draffan, J.; Franks, K.; Gleeson, F.; Graham, R.; Malhotra, P.; others. BritishThoracic Society guidelines for the investigation and management of pulmonary nodules: accredited by NICE. Thorax 2015, 70, ii1–ii54.
5. Seattle Cancer Care Alliance Proton Therapy Center. https://www.sccaprotontherapy.com/cancers-treated/lung-cancer-treatment, accessed on08.08.2021.
6. Wu, B.; Zhou, Z.; Wang, J.; Wang, Y. Joint learning for pulmonary nodule segmentation, attributes and malignancy prediction. 2018 IEEE 15thInternational Symposium on Biomedical Imaging (ISBI 2018). IEEE, 2018, pp. 1109–1113.
7. Aresta, G.; Jacobs, C.; Araújo, T.; Cunha, A.; Ramos, I.; van Ginneken, B.; Campilho, A. iW-Net: an automatic and minimalistic interactive lungnodule segmentation deep network. Scientific reports 2019, 9, 1–9.
8. Keetha, N.V.; Annavarapu, C.S.R.; others. U-Det: A Modified U-Net architecture with bidirectional feature network for lung nodule segmentation.arXiv preprint arXiv:2003.09293 2020.
9. Tang, H.; Zhang, C.; Xie, X. Nodulenet: Decoupled false positive reduction for pulmonary nodule detection and segmentation. InternationalConference on Medical Image Computing and Computer-Assisted Intervention. Springer, 2019, pp. 266–274.
10. Cao, H.; Liu, H.; Song, E.; Hung, C.C.; Ma, G.; Xu, X.; Jin, R.; Lu, J. Dual-branch residual network for lung nodule segmentation. Applied SoftComputing 2020, 86, 105934.
11. Kumar Singh, V.; Abdel-Nasser, M.; Pandey, N.; Puig, D. Lunginfseg: Segmenting covid-19 infected regions in lung ct images based on areceptive-field-aware deep learning framework. Diagnostics 2021, 11, 158.
12. Jiang, J.; Hu, Y.c.; Liu, C.J.; Halpenny, D.; Hellmann, M.D.; Deasy, J.O.; Mageras, G.; Veeraraghavan, H. Multiple resolution residually connectedfeature streams for automatic lung tumor segmentation from CT images. IEEE transactions on medical imaging 2018, 38, 134–144.
13. Ronneberger, O.; Fischer, P.; Brox, T. U-net: Convolutional networks for biomedical image segmentation. International Conference on Medicalimage computing and computer-assisted intervention. Springer, 2015, pp. 234–241.
14. Ren, S.; He, K.; Girshick, R.; Sun, J. Faster R-CNN: towards real-time object detection with region proposal networks. IEEE transactions onpattern analysis and machine intelligence 2016, 39, 1137–1149.
15. Dehmeshki, J.; Amin, H.; Valdivieso, M.; Ye, X. Segmentation of pulmonary nodules in thoracic CT scans: a region growing approach. IEEEtransactions on medical imaging 2008, 27, 467–480.
16. Tan, Y.; Schwartz, L.H.; Zhao, B. Segmentation of lung lesions on CT scans using watershed, active contours, and Markov random field. Medicalphysics 2013, 40, 043502.
17. Farag, A.A.; Abd El Munim, H.E.; Graham, J.H.; Farag, A.A. A novel approach for lung nodules segmentation in chest CT using level sets. IEEETransactions on Image Processing 2013, 22, 5202–5213.
18. Dai, S.; Lu, K.; Dong, J.; Zhang, Y.; Chen, Y. A novel approach of lung segmentation on chest CT images using graph cuts. Neurocomputing 2015,168, 799–807.
19. Navya, K.; Pradeep, G. Lung Nodule Segmentation Using Adaptive Thresholding and Watershed Transform. 2018 3rd IEEE InternationalConference on Recent Trends in Electronics, Information & Communication Technology (RTEICT). IEEE, 2018, pp. 630–633.
20. Li, X.; Li, B.; Liu, F.; Yin, H.; Zhou, F. Segmentation of pulmonary nodules using a GMM fuzzy C-means algorithm. Ieee Access 2020,8, 37541–37556.
21. Savic, M.; Ma, Y.; Ramponi, G.; Du, W.; Peng, Y. Lung nodule segmentation with a region-based fast marching method. Sensors 2021, 21, 1908.22. He, K.; Zhang, X.; Ren, S.; Sun, J. Deep residual learning for image recognition. Proceedings of the IEEE conference on computer vision and
pattern recognition, 2016, pp. 770–778.23. Hancock, M.C.; Magnan, J.F. Lung nodule malignancy classification using only radiologist-quantified image features as inputs to statistical
learning algorithms: probing the Lung Image Database Consortium dataset with two statistical learning methods. Journal of Medical Imaging2016, 3, 044504.
24. Lin, T.Y.; Maire, M.; Belongie, S.; Hays, J.; Perona, P.; Ramanan, D.; Dollár, P.; Zitnick, C.L. Microsoft coco: Common objects in context.European conference on computer vision. Springer, 2014, pp. 740–755.
25. Fu, J.; Liu, J.; Tian, H.; Li, Y.; Bao, Y.; Fang, Z.; Lu, H. Dual attention network for scene segmentation. Proceedings of the IEEE Conference onComputer Vision and Pattern Recognition, 2019, pp. 3146–3154.
26. Quader, N.; Bhuiyan, M.M.I.; Lu, J.; Dai, P.; Li, W. Weight Excitation: Built-in Attention Mechanisms in Convolutional Neural Networks.European Conference on Computer Vision. Springer, 2020, pp. 87–103.
27. Armato III, S.G.; McLennan, G.; Bidaut, L.; McNitt-Gray, M.F.; Meyer, C.R.; Reeves, A.P.; Zhao, B.; Aberle, D.R.; Henschke, C.I.; Hoffman,E.A.; others. The lung image database consortium (LIDC) and image database resource initiative (IDRI): a completed reference database of lungnodules on CT scans. Medical physics 2011, 38, 915–931.
15 of 15
28. Setio, A.A.A.; Traverso, A.; De Bel, T.; Berens, M.S.; Van Den Bogaard, C.; Cerello, P.; Chen, H.; Dou, Q.; Fantacci, M.E.; Geurts, B.; others.Validation, comparison, and combination of algorithms for automatic detection of pulmonary nodules in computed tomography images: theLUNA16 challenge. Medical image analysis 2017, 42, 1–13.
29. Paszke, A.; Gross, S.; Massa, F.; Lerer, A.; Bradbury, J.; Chanan, G.; Killeen, T.; Lin, Z.; Gimelshein, N.; Antiga, L.; others. Pytorch: Animperative style, high-performance deep learning library. Advances in neural information processing systems 2019, 32, 8026–8037.
30. Gulcehre, C.; Sotelo, J.; Bengio, Y. A robust adaptive stochastic gradient method for deep learning. Neural Networks (IJCNN), 2017 InternationalJoint Conference on. IEEE, 2017, pp. 125–132.
31. Kingma, D.P.; Ba, J. Adam: A method for stochastic optimization. arXiv preprint arXiv:1412.6980 2014.32. Girshick, R.; Donahue, J.; Darrell, T.; Malik, J. Rich feature hierarchies for accurate object detection and semantic segmentation. Proceedings of
the IEEE conference on computer vision and pattern recognition, 2014, pp. 580–587.33. Girshick, R. Fast r-cnn. Proceedings of the IEEE international conference on computer vision, 2015, pp. 1440–1448.34. Zhao, H.; Shi, J.; Qi, X.; Wang, X.; Jia, J. Pyramid scene parsing network. Proceedings of the IEEE conference on computer vision and pattern
recognition, 2017, pp. 2881–2890.35. Fan, T.; Wang, G.; Li, Y.; Wang, H. Ma-net: A multi-scale attention network for liver and tumor segmentation. IEEE Access 2020, 8, 179656–
179665.36. Li, H.; Xiong, P.; An, J.; Wang, L. Pyramid attention network for semantic segmentation. arXiv preprint arXiv:1805.10180 2018.37. Lin, T.Y.; Dollár, P.; Girshick, R.; He, K.; Hariharan, B.; Belongie, S. Feature pyramid networks for object detection. Proceedings of the IEEE
conference on computer vision and pattern recognition, 2017, pp. 2117–2125.38. Chen, L.C.; Papandreou, G.; Schroff, F.; Adam, H. Rethinking atrous convolution for semantic image segmentation. arXiv preprint
arXiv:1706.05587 2017.