axial flow turbines for ocean current and wave power systems. von backstrom_axial flow...
TRANSCRIPT
Axial flow turbines for ocean current and wave power systems.
Theo von Backström
Department of Mechanical and Mechatronic Engineering
Univeversity of Stellenbosch
Introduction
• Renewable energy turbines:– Solar chimney– Wind turbines– Ocean current turbines– Ocean current turbines– Shrouded ocean current turbines– SWEC turbine
Figures in this presentation were sourced from:Undergraduate final year projects of:
Josh Reinecke, Richard Stanford, Thomas Lewis, Pieka Grobelaar
MScEng theses of:Warrick PierceJosh Reinecke,Paul AckermanPaul Ackerman
PhD thesis of:Tom Fluri
Co-supervisors:Prof. Wikus van Niekerk, Prof. Gerhard Venter,Mr. Johan van der Spuy, MS. Nicola Cencelli.
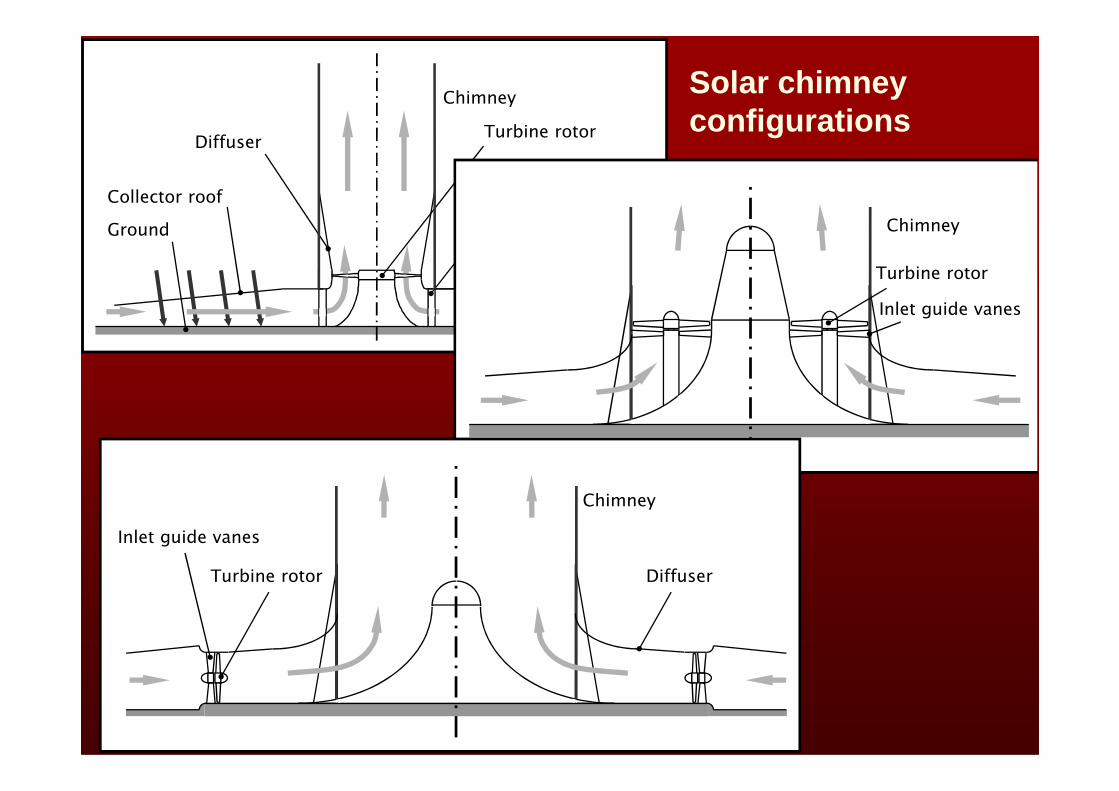
Solar chimney configurations
IntroductionIntroductionIntroductionIntroduction
Chimney
Turbine rotor
Solar irradiation
Diffuser
Ground
Collector roof
Inlet guide vanes
Turbine rotor
Chimney
Inlet guide vanes
Turbine rotor Diffuser
Chimney
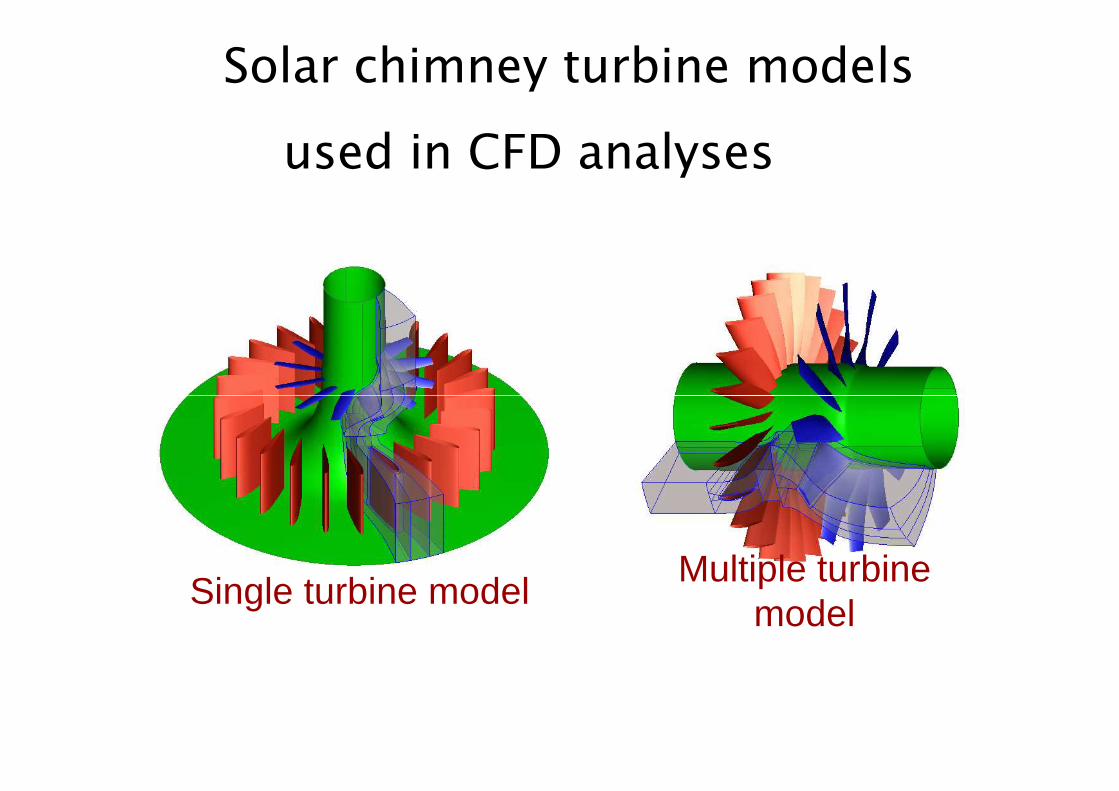
Solar chimney turbine models
used in CFD analyses
Single turbine modelMultiple turbine
model
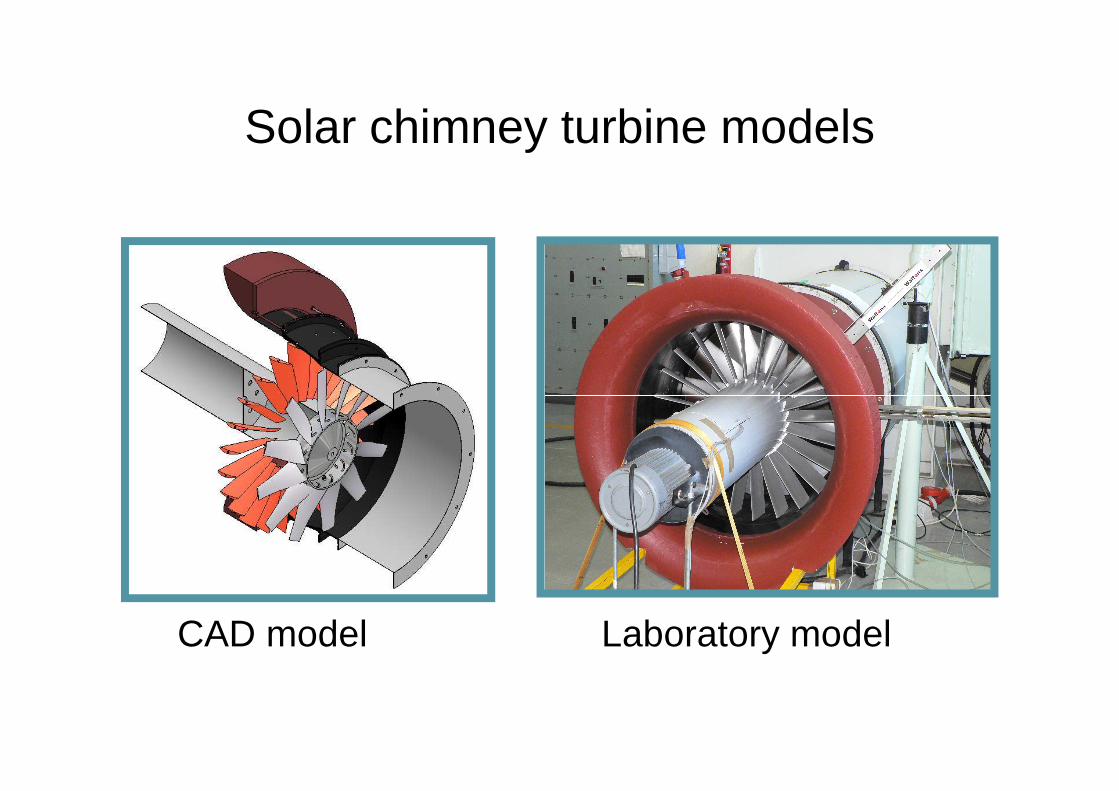
Solar chimney turbine models
CAD model Laboratory model
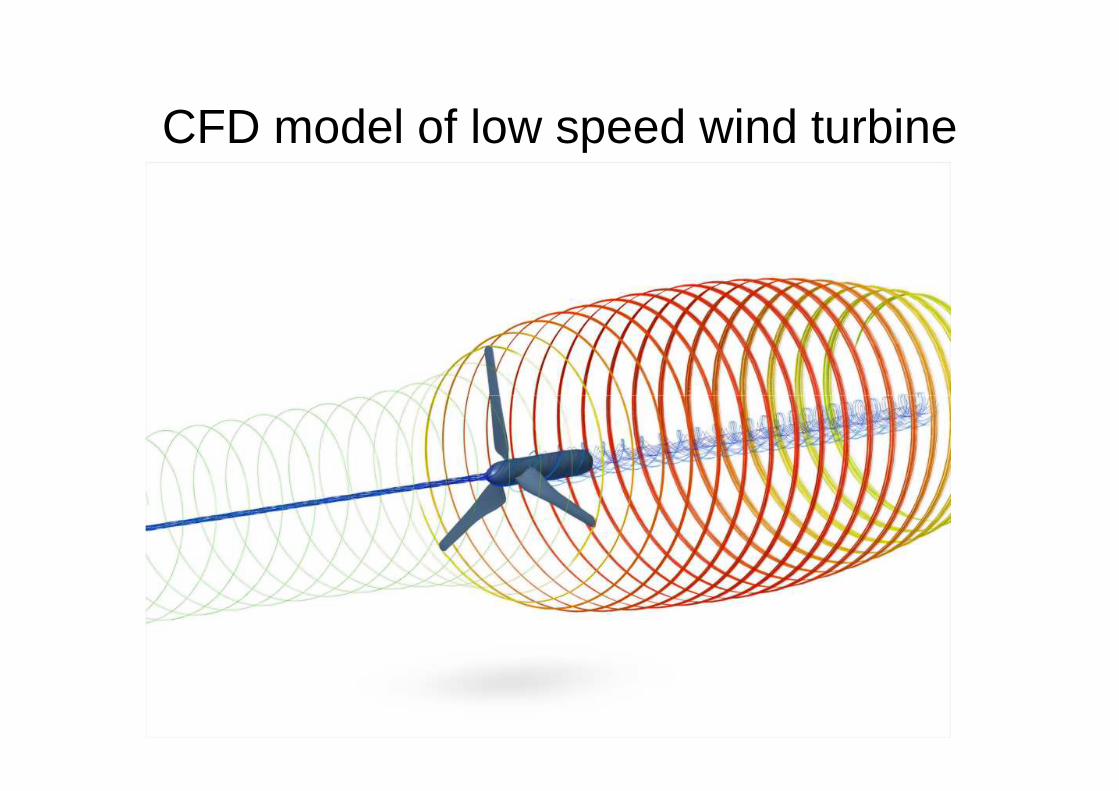
CFD model of low speed wind turbine
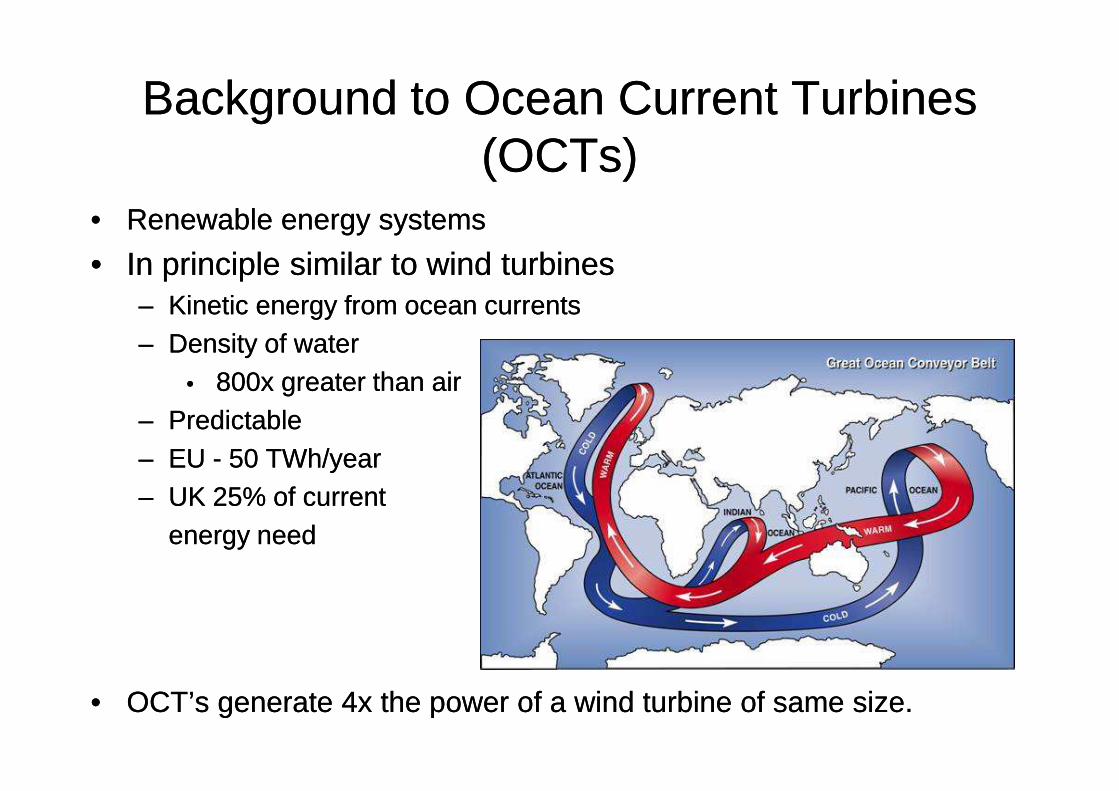
Background to Ocean Current Turbines Background to Ocean Current Turbines (OCTs)(OCTs)
•• Renewable energy systemsRenewable energy systems
•• In principle similar to wind turbinesIn principle similar to wind turbines–– Kinetic energy from ocean currentsKinetic energy from ocean currents–– Density of water Density of water
•• 800x greater than air800x greater than air800x greater than air800x greater than air–– PredictablePredictable–– EU EU -- 50 TWh/year50 TWh/year–– UK 25% of current UK 25% of current
energy needenergy need
•• OCT’s generate 4x the power of a wind turbine of same size.OCT’s generate 4x the power of a wind turbine of same size.
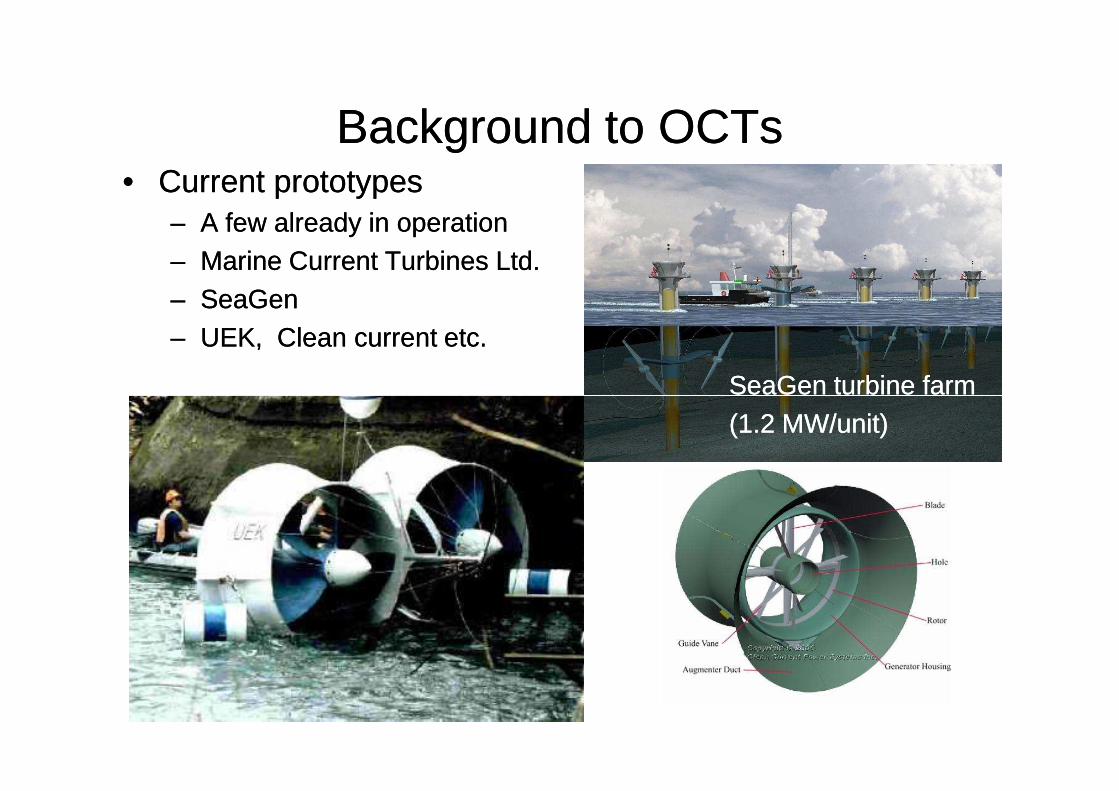
Background to OCTsBackground to OCTs•• Current prototypesCurrent prototypes
–– A few already in operationA few already in operation–– Marine Current Turbines Ltd.Marine Current Turbines Ltd.–– SeaGenSeaGen–– UEK, Clean current etc. UEK, Clean current etc.
SeaGen turbine farm SeaGen turbine farm SeaGen turbine farm SeaGen turbine farm (1.2 MW/unit)(1.2 MW/unit)
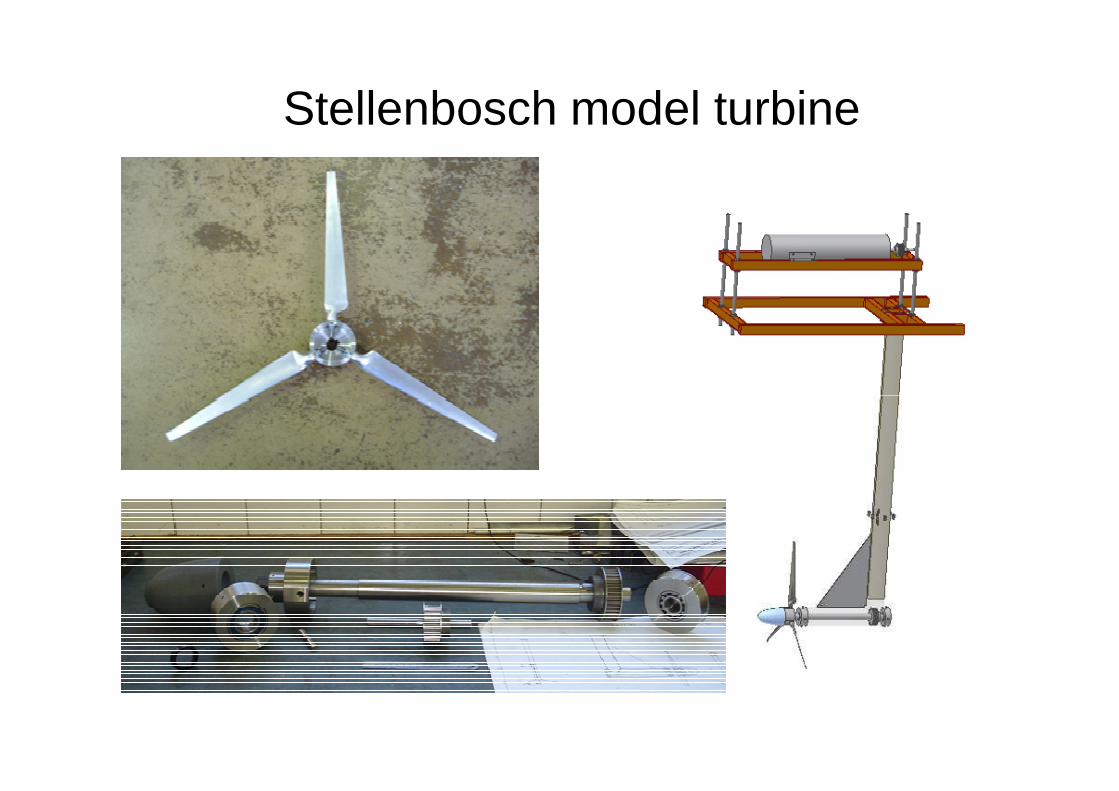
Stellenbosch model turbine
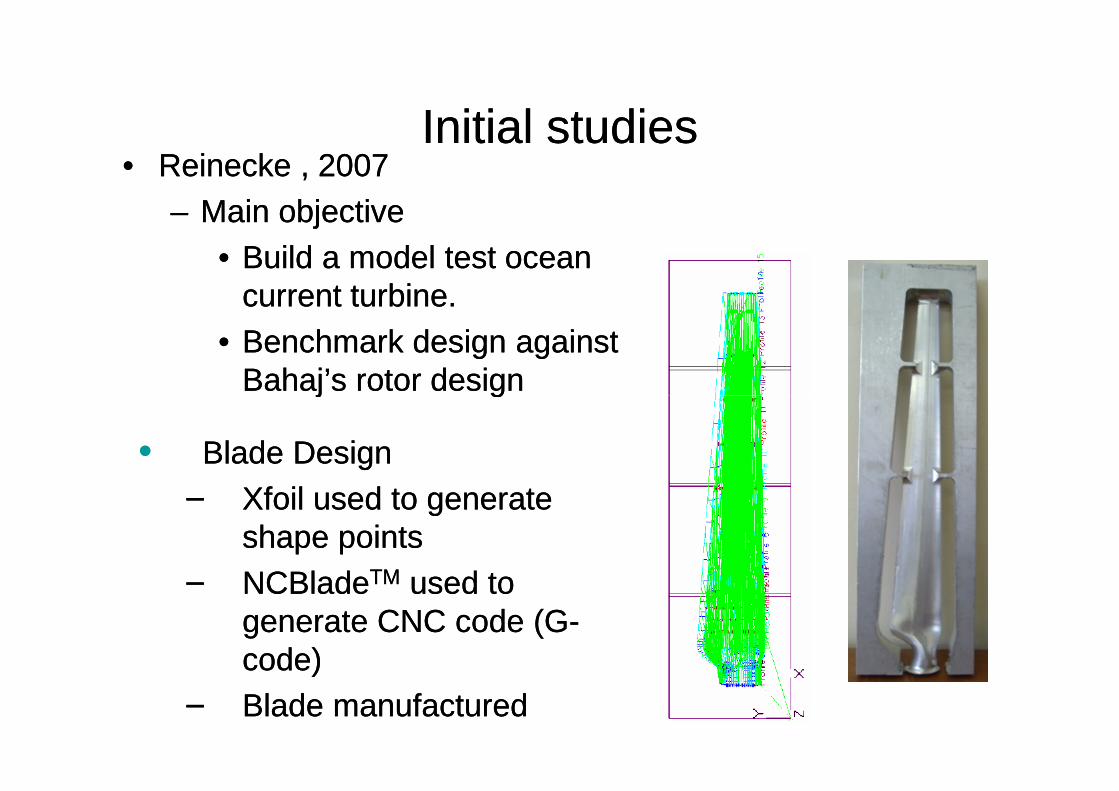
Initial studiesInitial studies•• Reinecke , 2007Reinecke , 2007
–– Main objectiveMain objective•• Build a model test ocean Build a model test ocean
current turbine.current turbine.•• Benchmark design against Benchmark design against
Bahaj’s rotor designBahaj’s rotor designBahaj’s rotor designBahaj’s rotor design
•• Blade DesignBlade Design–– Xfoil used to generate Xfoil used to generate
shape pointsshape points–– NCBladeNCBladeTMTM used to used to
generate CNC code (Ggenerate CNC code (G--code)code)
–– Blade manufacturedBlade manufactured
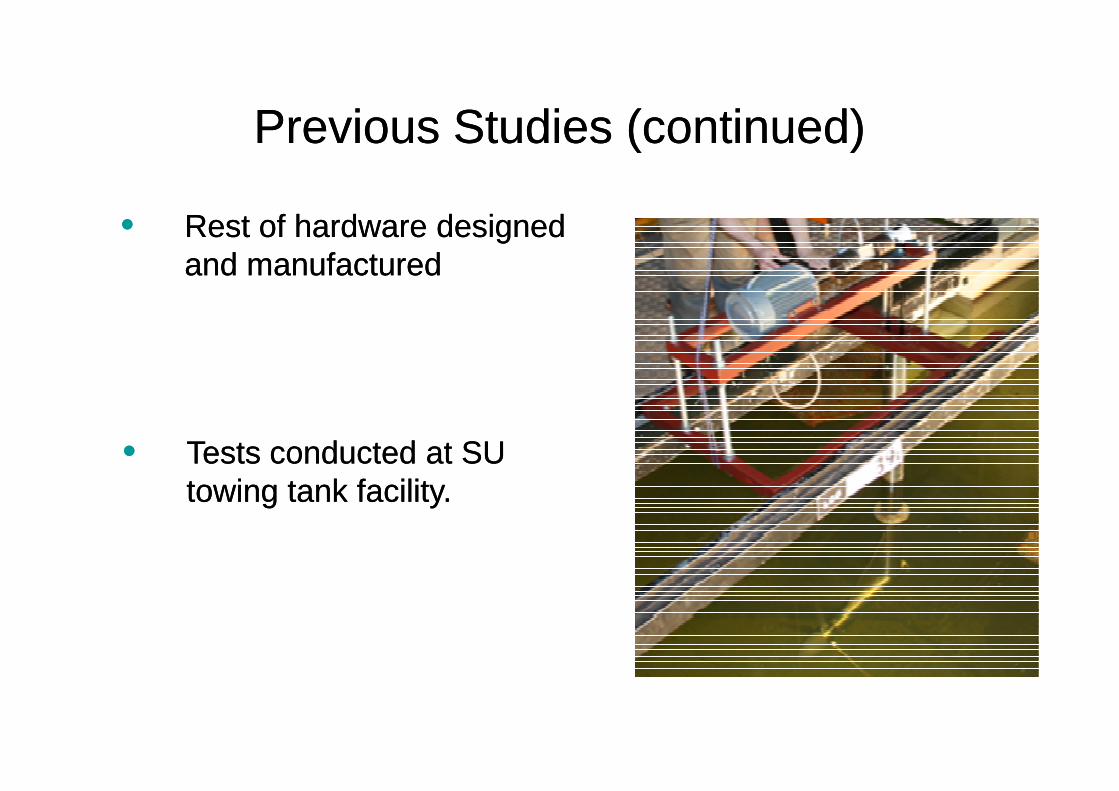
Previous Studies (continued)Previous Studies (continued)
•• Rest of hardware designed Rest of hardware designed and manufacturedand manufactured
•• Tests conducted at SU Tests conducted at SU towing tank facility.towing tank facility.
Previous Studies (continued)Previous Studies (continued)
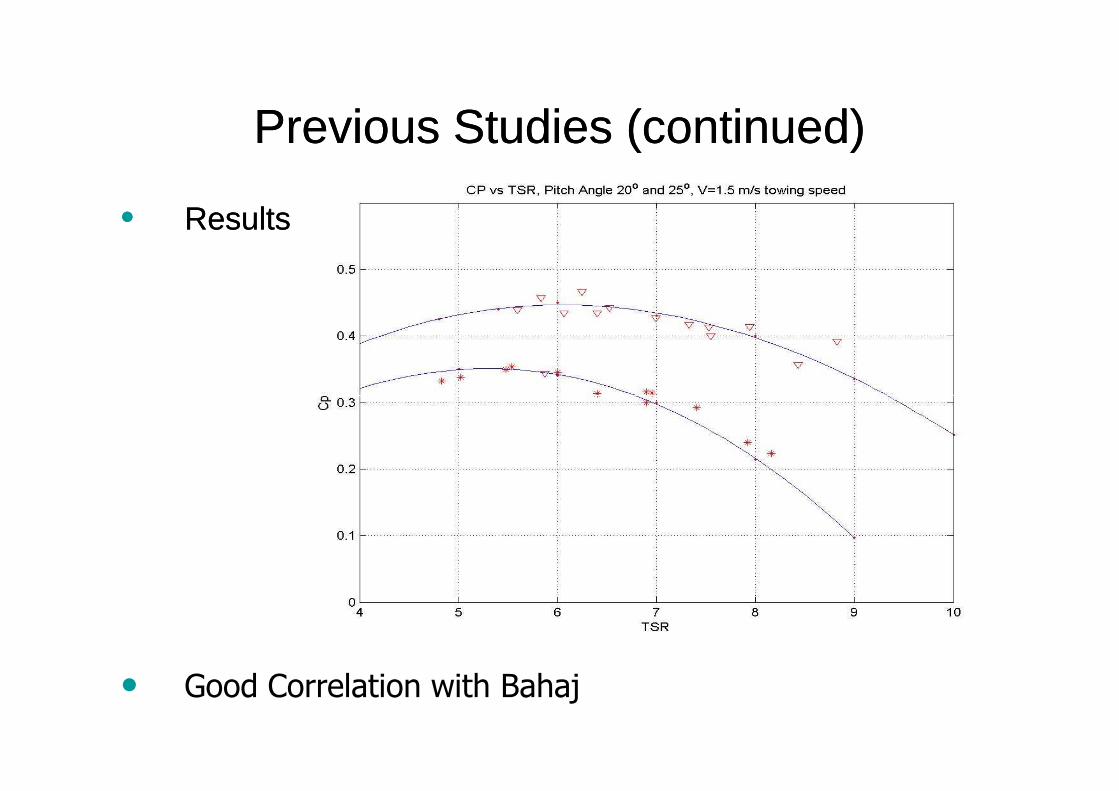
•• ResultsResults
• Good Correlation with Bahaj
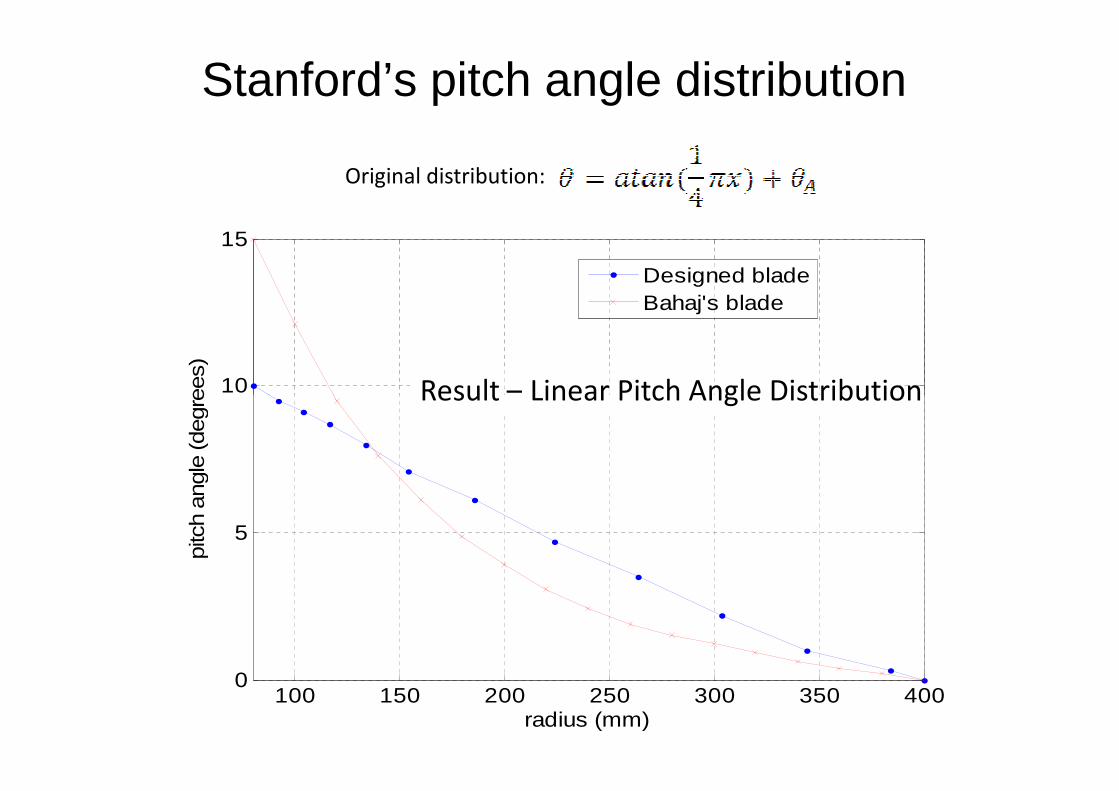
Stanford’s pitch angle distribution
10
15
pitc
h angl
e (d
egre
es)
Designed bladeBahaj's blade
Result – Linear Pitch Angle Distribution
Original distribution:
100 150 200 250 300 350 4000
5
10
radius (mm)
pitc
h angl
e (d
egre
es)
Result – Linear Pitch Angle Distribution
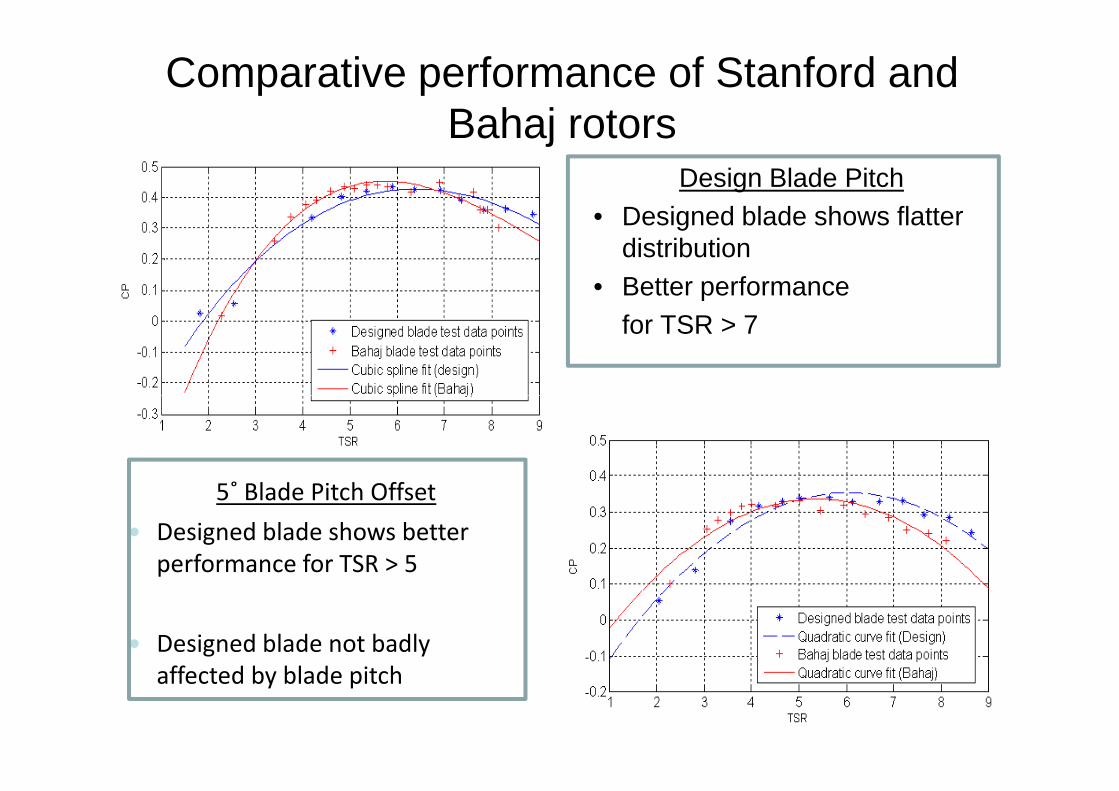
Comparative performance of Stanford and Bahaj rotors
Design Blade Pitch• Designed blade shows flatter
distribution• Better performance
for TSR > 7
5˚ Blade Pitch Offset
� Designed blade shows better
performance for TSR > 5
� Designed blade not badly
affected by blade pitch
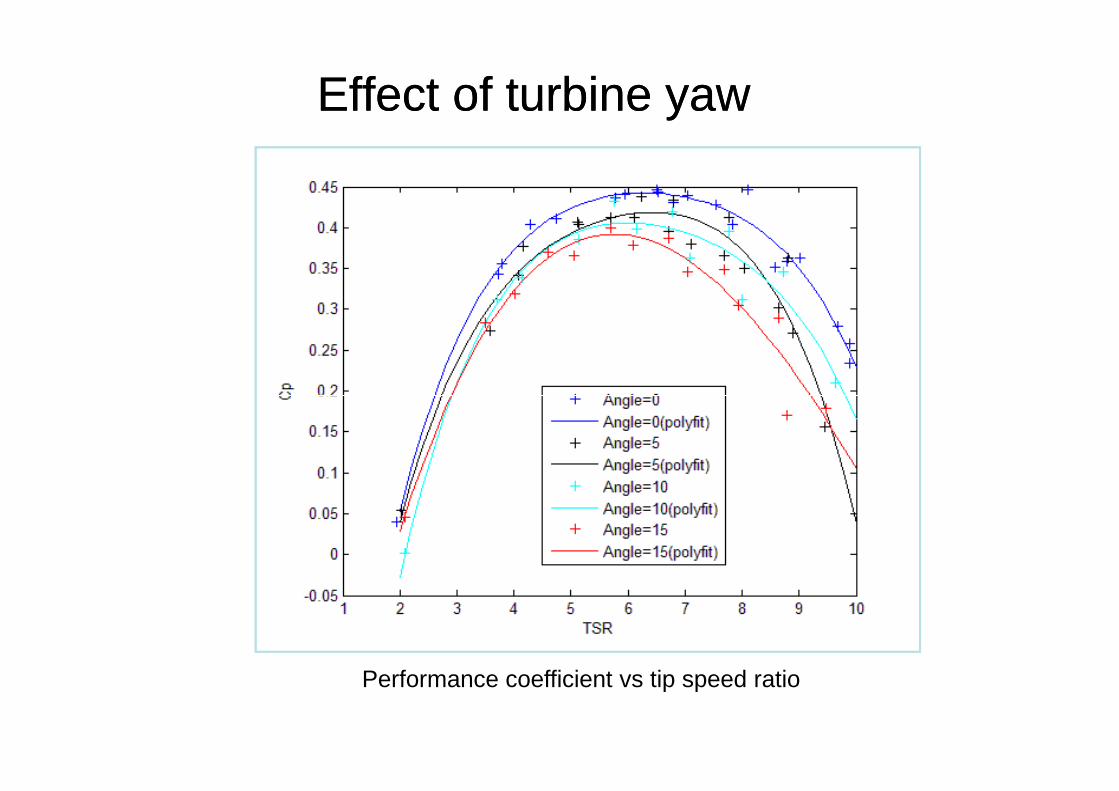
Effect of turbine yawEffect of turbine yaw
Performance coefficient vs tip speed ratio
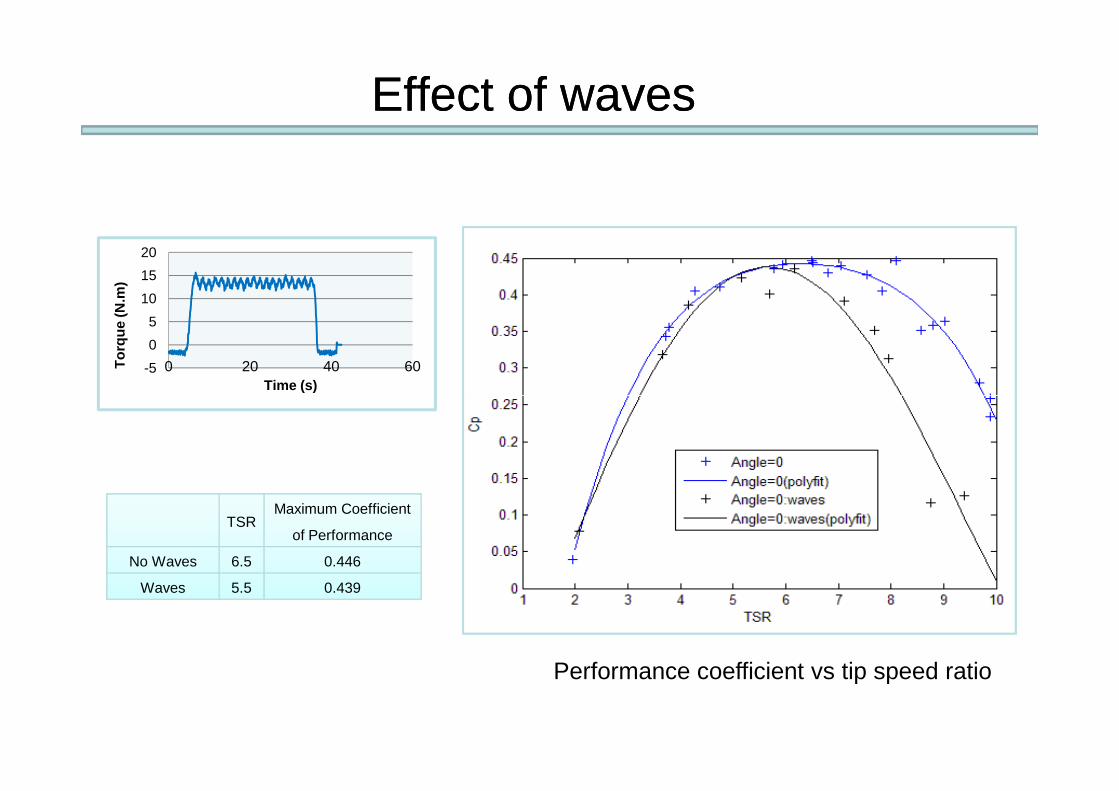
Effect of wavesEffect of waves
-5
0
5
10
15
20
0 20 40 60Tor
que
(N.m
)
Time (s)
TSRMaximum Coefficient
of Performance
No Waves 6.5 0.446
Waves 5.5 0.439
Performance coefficient vs tip speed ratio
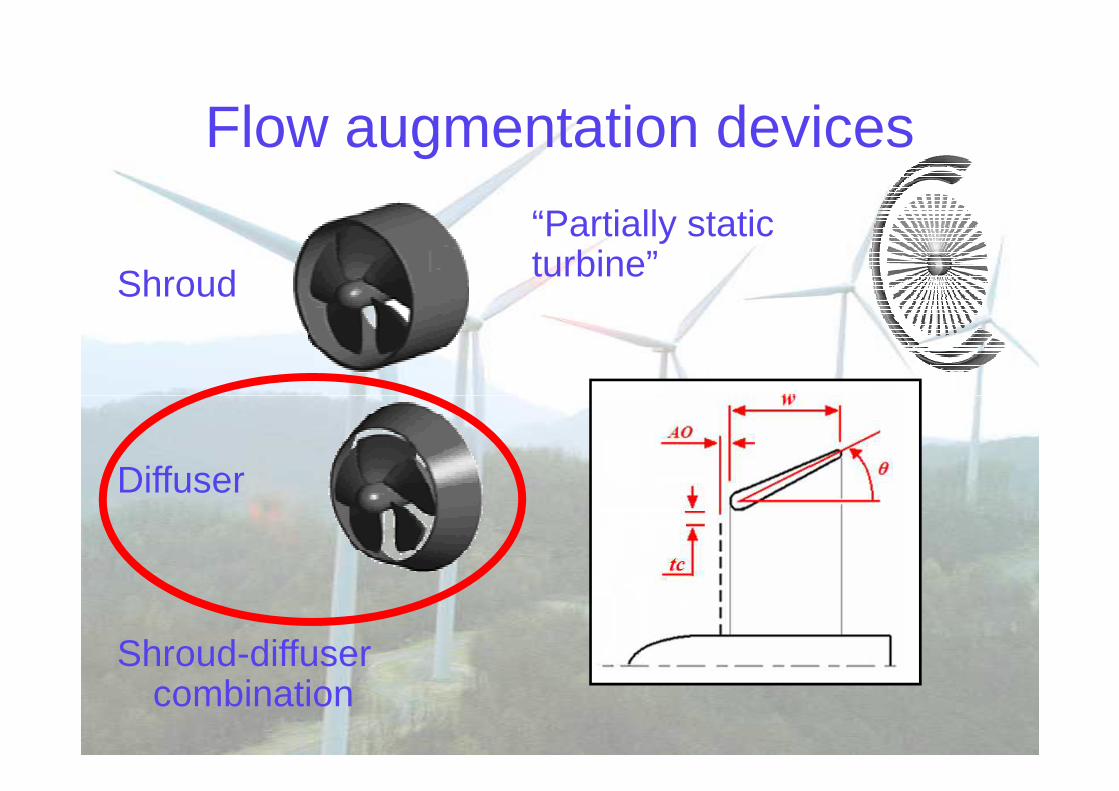
Flow augmentation devices
Shroud
“Partially static turbine”
Diffuser
Shroud-diffuser combination
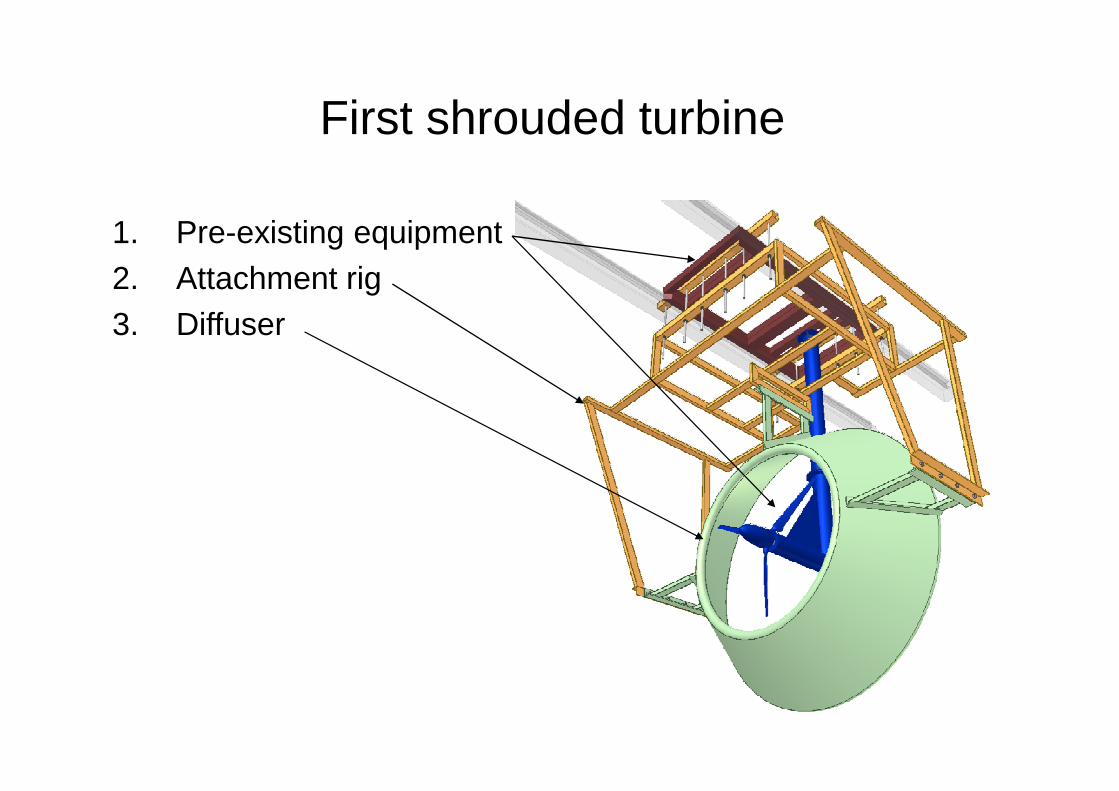
First shrouded turbine
1. Pre-existing equipment2. Attachment rig3. Diffuser

Experimental Setup
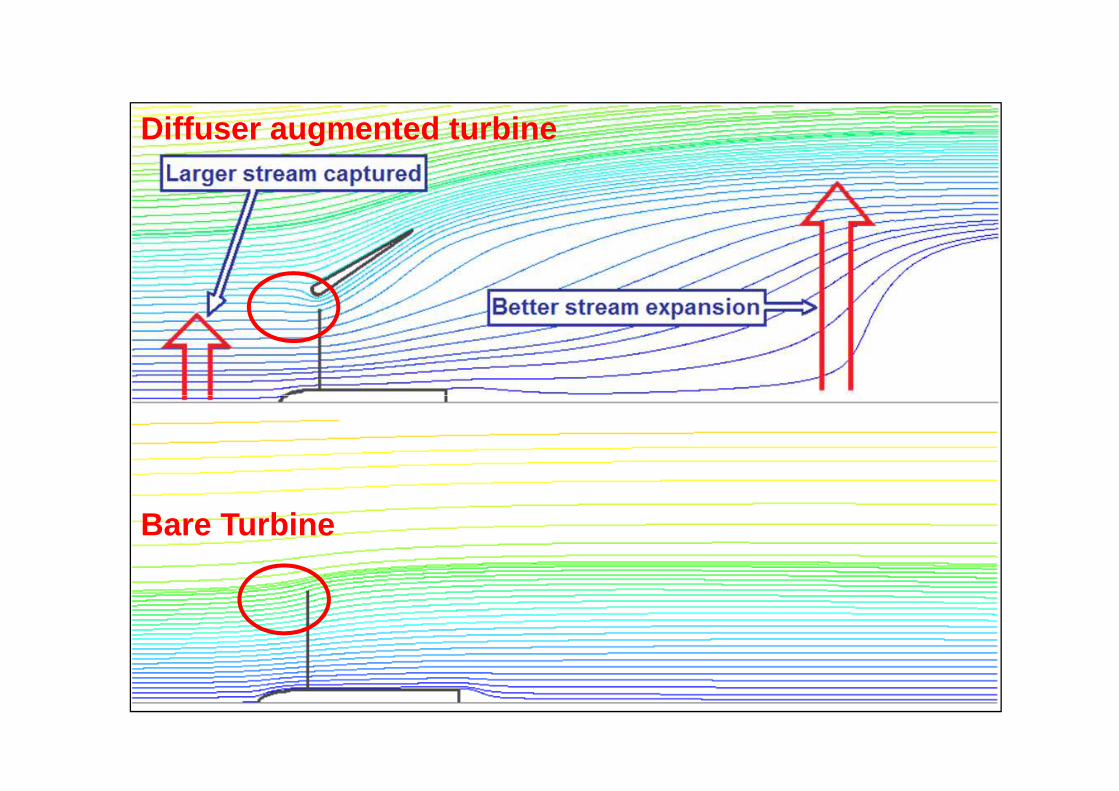
Diffuser augmented turbine
Bare Turbine

Previous studiesPrevious studies
• Power increase between 44% and 87%!
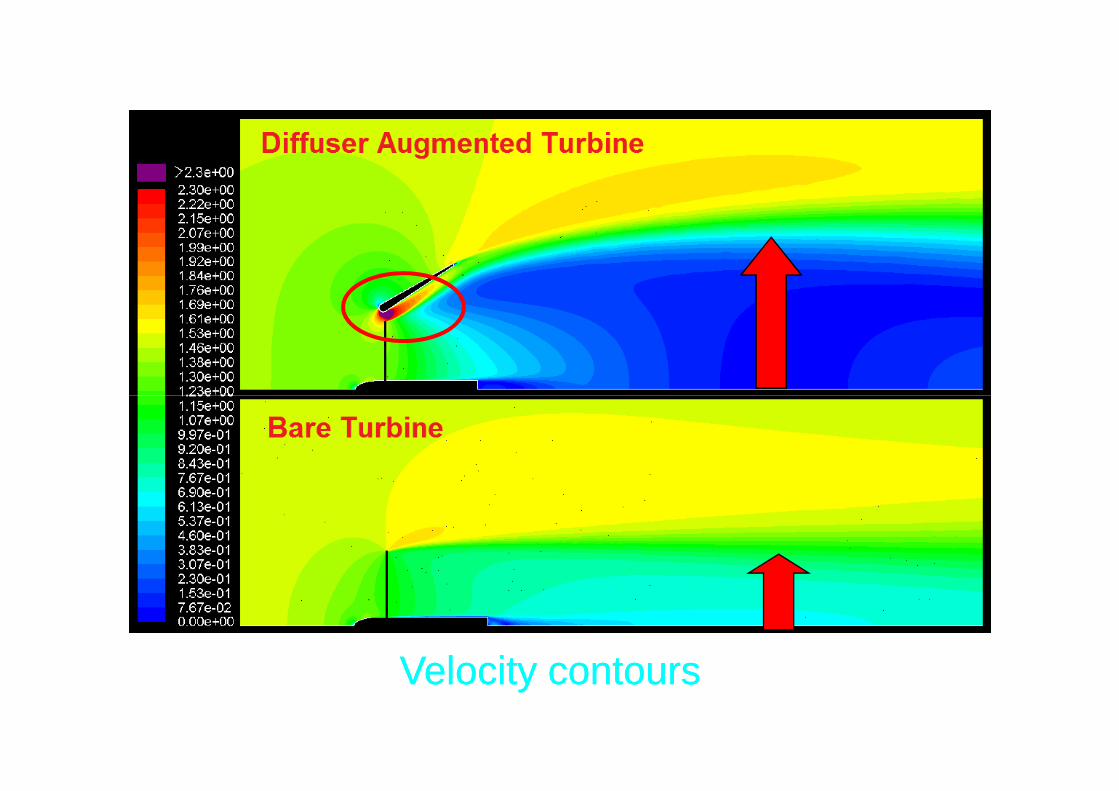
Velocity contoursVelocity contours
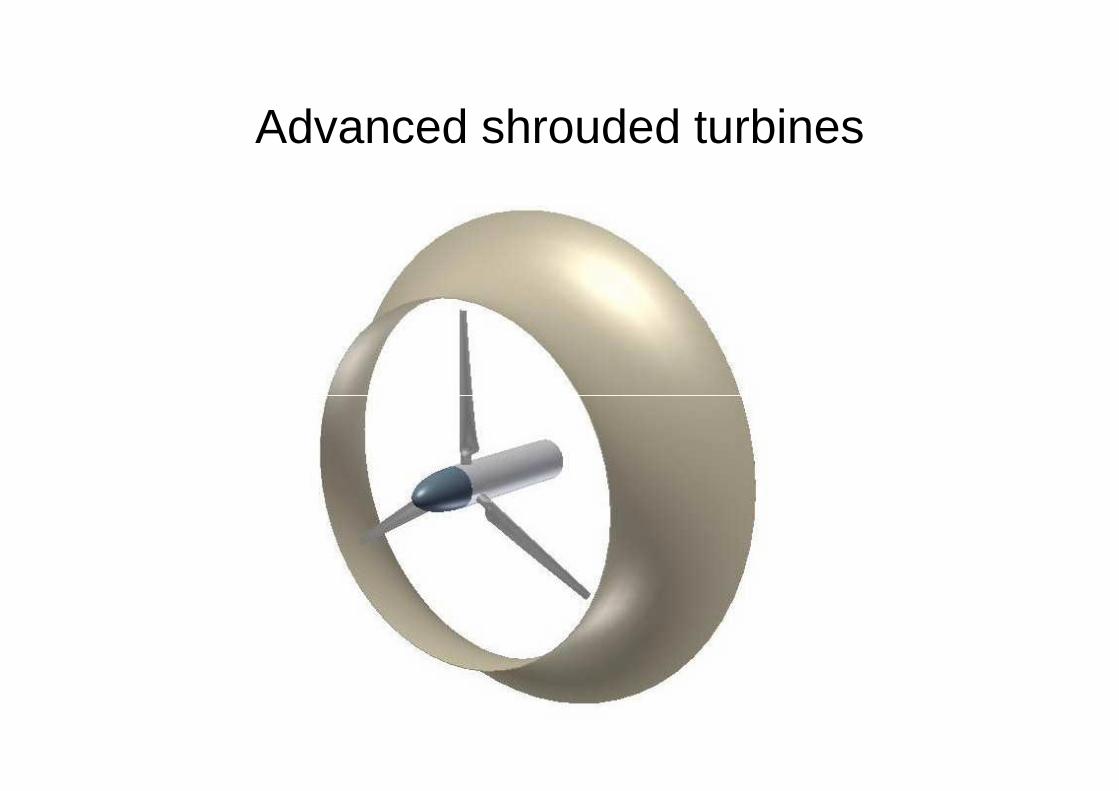
Advanced shrouded turbines
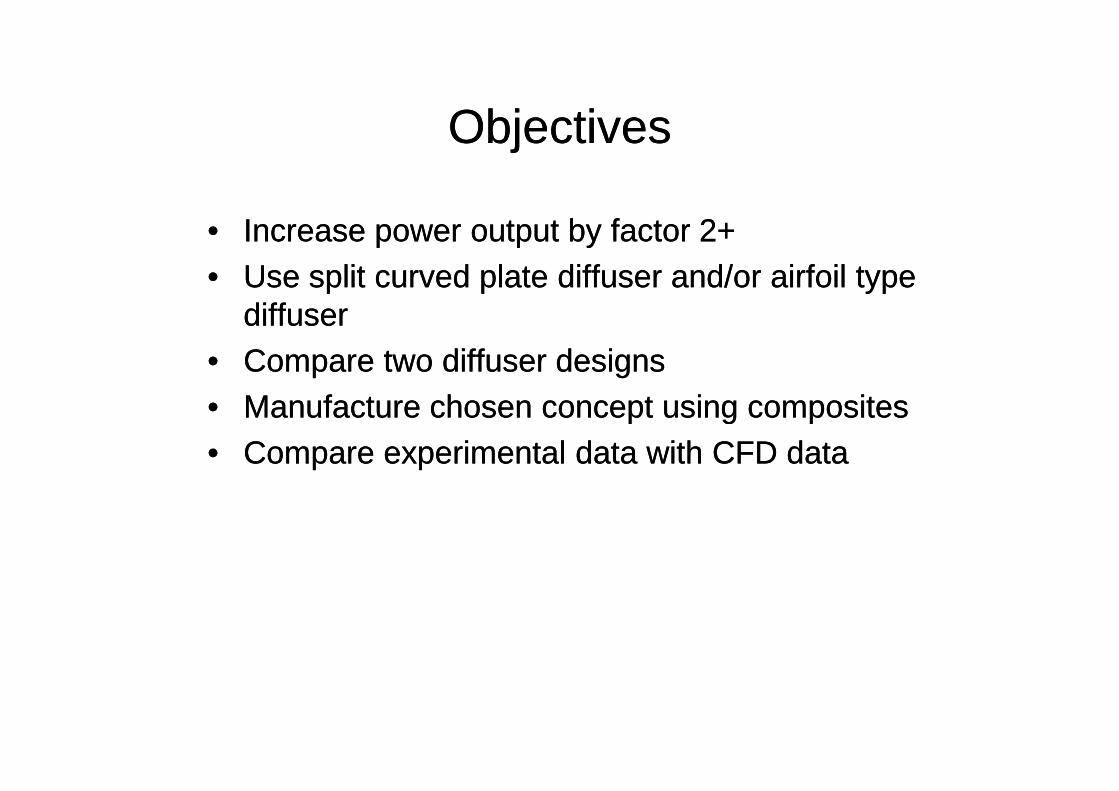
ObjectivesObjectives
•• Increase power output by factor 2+Increase power output by factor 2+•• Use split curved plate diffuser and/or airfoil type Use split curved plate diffuser and/or airfoil type
diffuserdiffuser•• Compare two diffuser designsCompare two diffuser designs•• Manufacture chosen concept using compositesManufacture chosen concept using composites•• Manufacture chosen concept using compositesManufacture chosen concept using composites•• Compare experimental data with CFD dataCompare experimental data with CFD data

Results so farResults so far•• Literature study completedLiterature study completed
–– Boundary layer bleed slots found to reduce Boundary layer bleed slots found to reduce flow separationflow separation
–– Preliminary studies using diffuser shows Preliminary studies using diffuser shows increase of 20%increase of 20%--85%85%
–– Diffuser momentum theory in infancy. Diffuser momentum theory in infancy. –– Diffuser momentum theory in infancy. Diffuser momentum theory in infancy. Theoretical understanding limitedTheoretical understanding limited
–– Application of optimization to diffuser Application of optimization to diffuser problems no significant increase over DOEproblems no significant increase over DOE
–– Economically more feasible for OCT’sEconomically more feasible for OCT’s–– Prototype complexities, installation and Prototype complexities, installation and
maintenancemaintenance
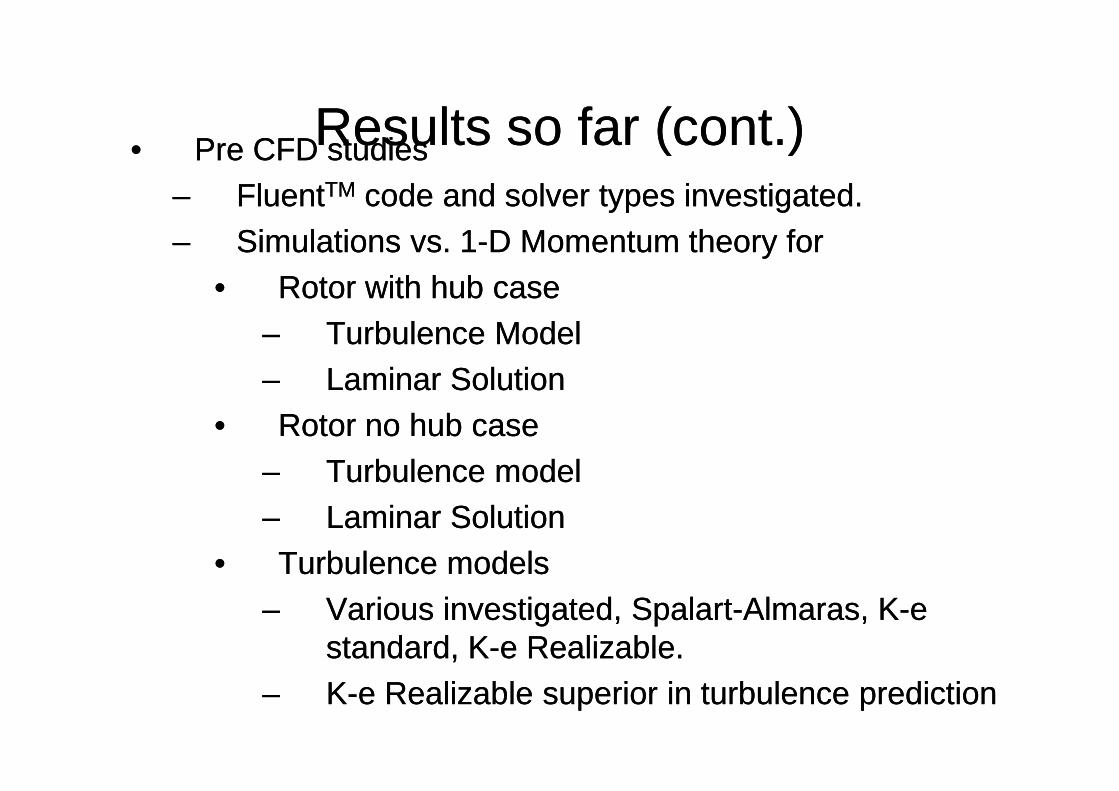
•• Pre CFD studiesPre CFD studies–– FluentFluentTMTM code and solver types investigated.code and solver types investigated.–– Simulations vs. 1Simulations vs. 1--D Momentum theory forD Momentum theory for
•• Rotor with hub caseRotor with hub case–– Turbulence Model Turbulence Model –– Laminar SolutionLaminar Solution
Results so far (cont.)Results so far (cont.)
–– Laminar SolutionLaminar Solution•• Rotor no hub caseRotor no hub case
–– Turbulence modelTurbulence model–– Laminar SolutionLaminar Solution
•• Turbulence modelsTurbulence models–– Various investigated, SpalartVarious investigated, Spalart--Almaras, KAlmaras, K--e e
standard, Kstandard, K--e Realizable.e Realizable.–– KK--e Realizable superior in turbulence predictione Realizable superior in turbulence prediction
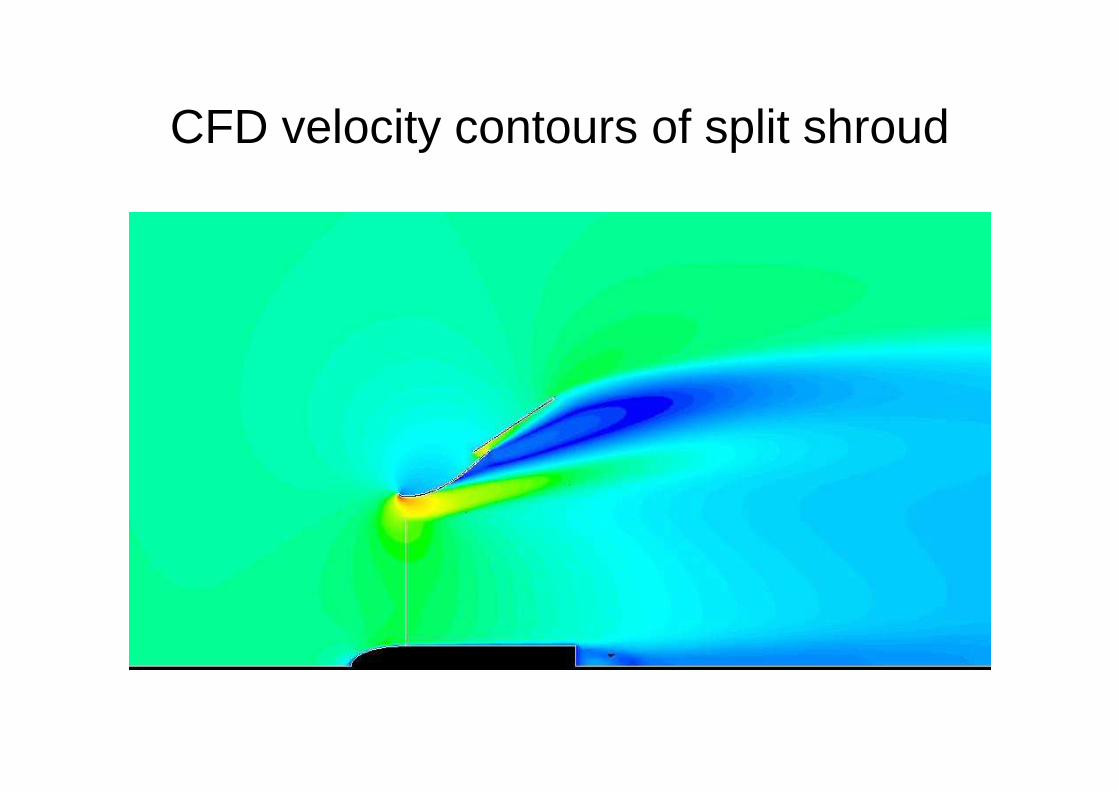
CFD velocity contours of split shroud
Conclusions of this section
• Shrouds can be used to to increase power developed• More studies are necessary to determine if shrouds are
economically competitive with increasing the turbine rotor diameter
• Turbine shroud optimisation is proceeding• Turbine shroud optimisation is proceeding• For more detail and the very latest developments ask
Josh Reinecke
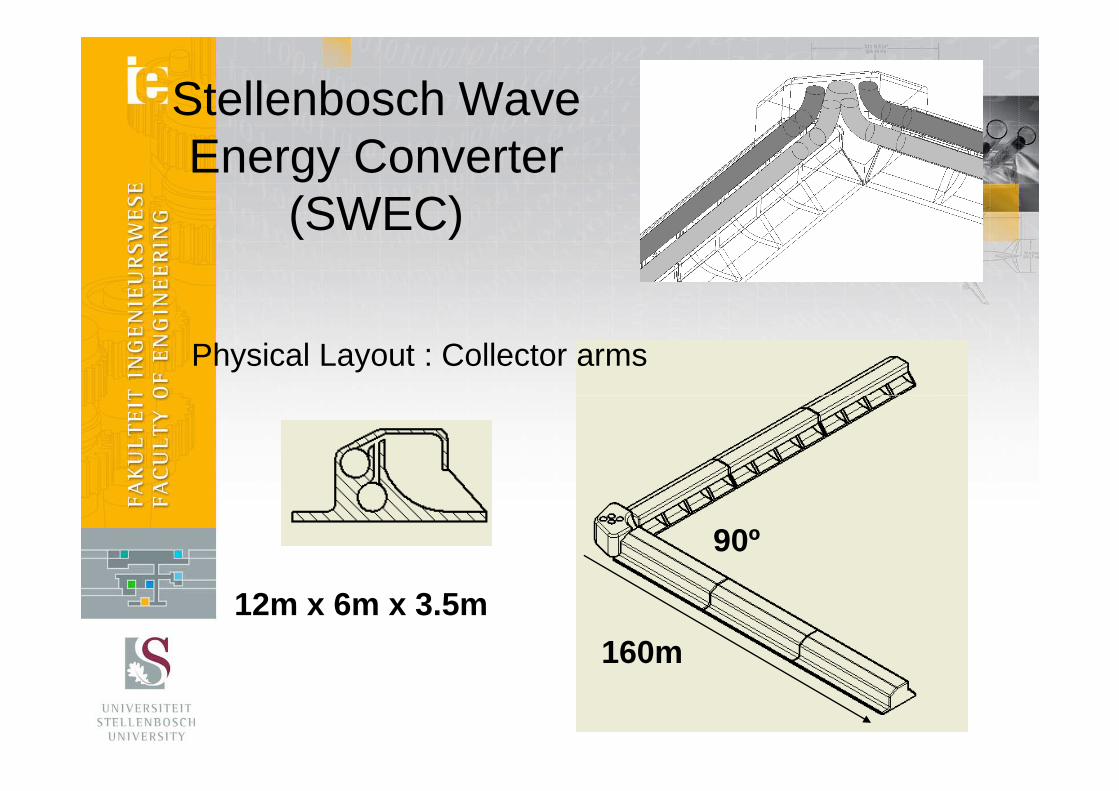
Stellenbosch Wave Energy Converter
(SWEC)
Physical Layout : Collector arms
160m
90º
12m x 6m x 3.5m

Introduction
SWEC Energy extraction principalSubsurface pressure/velocity fluctuations
TurbineHP LP
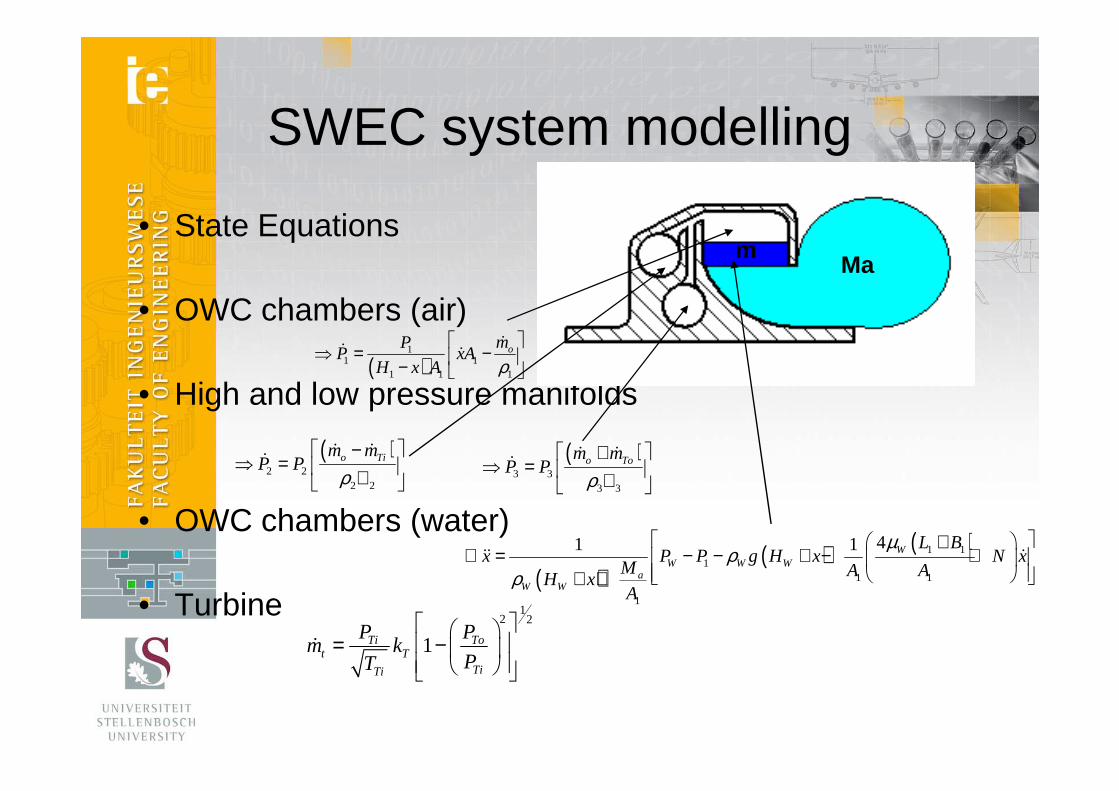
SWEC system modelling
• State Equations
• OWC chambers (air)
• High and low pressure manifolds( )
11 1
1 1 1
omPP xA
H x A ρ
⇒ = − −
&& &
mMa
• High and low pressure manifolds
• OWC chambers (water)
• Turbine
( )2 2
2 2
o Tim mP P
ρ −
⇒ = ∀
& && ( )
3 33 3
o Tom mP P
ρ +
⇒ = ∀
& &&
12 2
1Ti Tot T
TiTi
P Pm k
PT
= −
&
( )( ) ( )1 1
11 1
1
41 1 WW W W
aW W
L Bx P P g H x N x
M A AH xA
µρ
ρ
+∴ = − − + − +
+ +&& &

SWEC turbine design procedure
• Next slide• Also ask Paul Ackerman
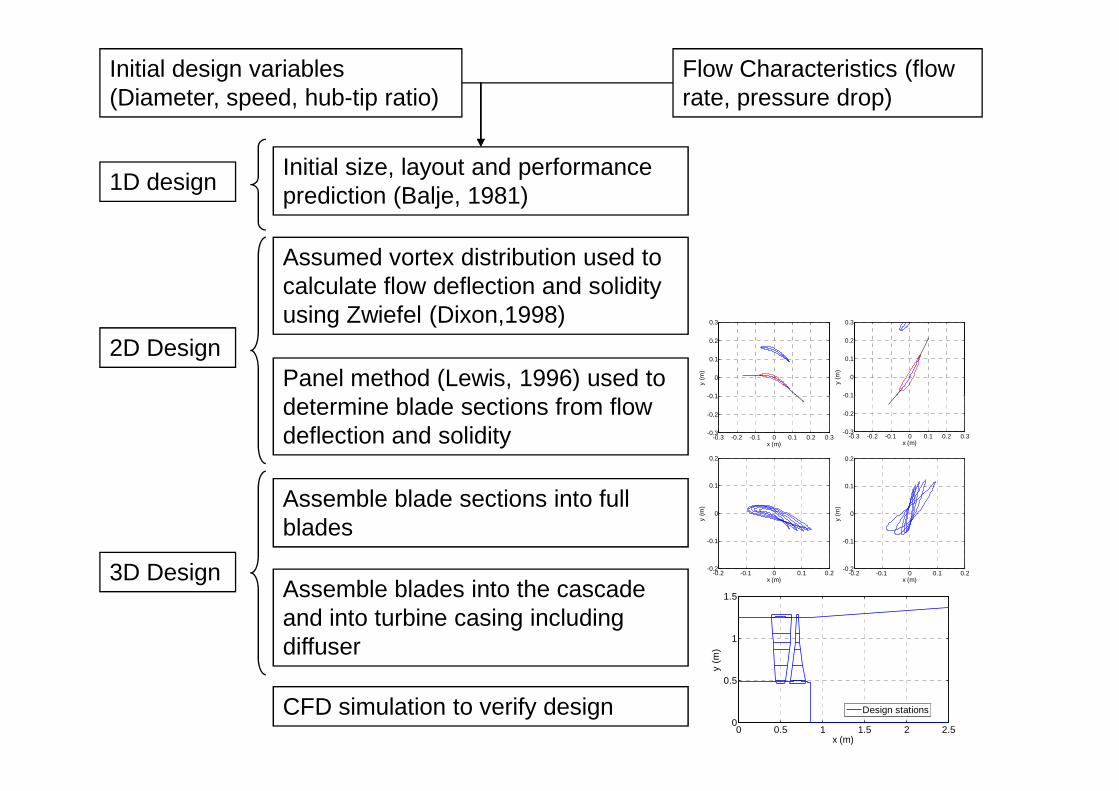
Flow Characteristics (flow rate, pressure drop)
Initial design variables (Diameter, speed, hub-tip ratio)
Initial size, layout and performance prediction (Balje, 1981)
Assumed vortex distribution used to calculate flow deflection and solidity using Zwiefel (Dixon,1998)
Panel method (Lewis, 1996) used to determine blade sections from flow
-0.1
0
0.1
0.2
0.3
y (m
)
-0.1
0
0.1
0.2
0.3
y (m
)
1D design
2D Design
determine blade sections from flow deflection and solidity
Assemble blade sections into full blades
Assemble blades into the cascade and into turbine casing including diffuser
CFD simulation to verify design0 0.5 1 1.5 2 2.5
0
0.5
1
1.5
x (m)
y (m
)
Design stations
-0.3 -0.2 -0.1 0 0.1 0.2 0.3-0.3
-0.2
-0.1
x (m)-0.3 -0.2 -0.1 0 0.1 0.2 0.3
-0.3
-0.2
-0.1
x (m)
-0.2 -0.1 0 0.1 0.2-0.2
-0.1
0
0.1
0.2
x (m)
y (m
)
-0.2 -0.1 0 0.1 0.2-0.2
-0.1
0
0.1
0.2
x (m)
y (m
)
3D Design
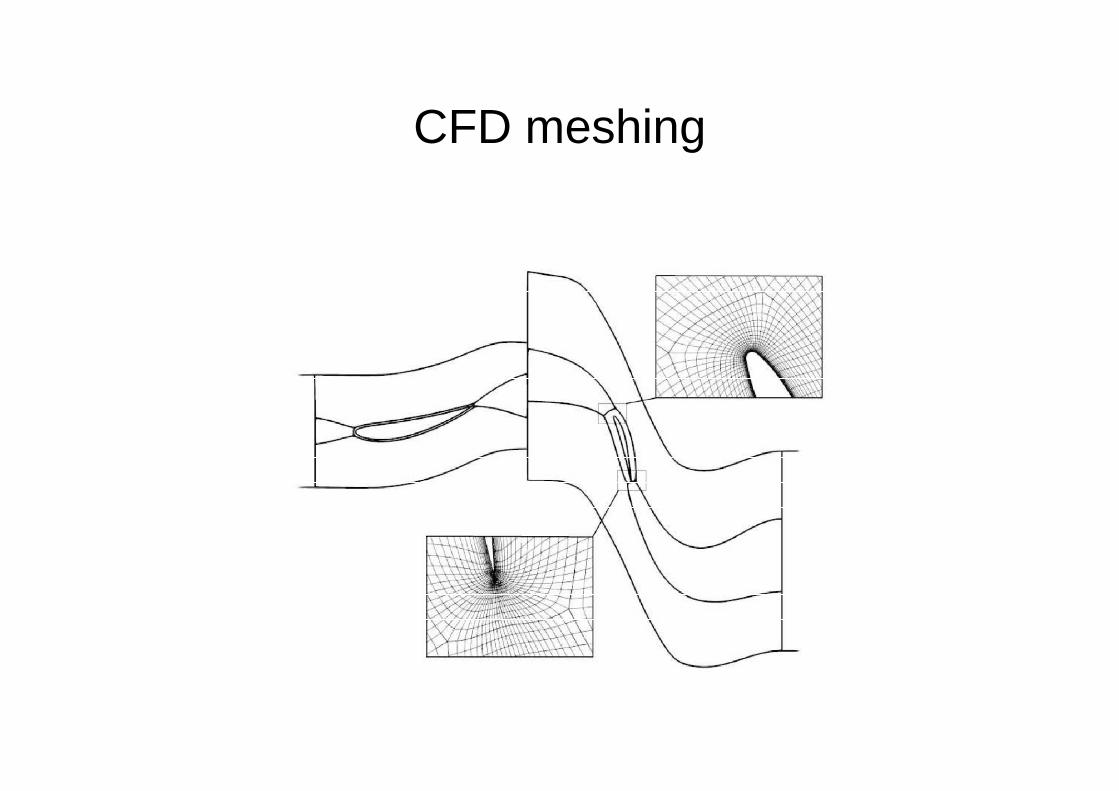
CFD meshing
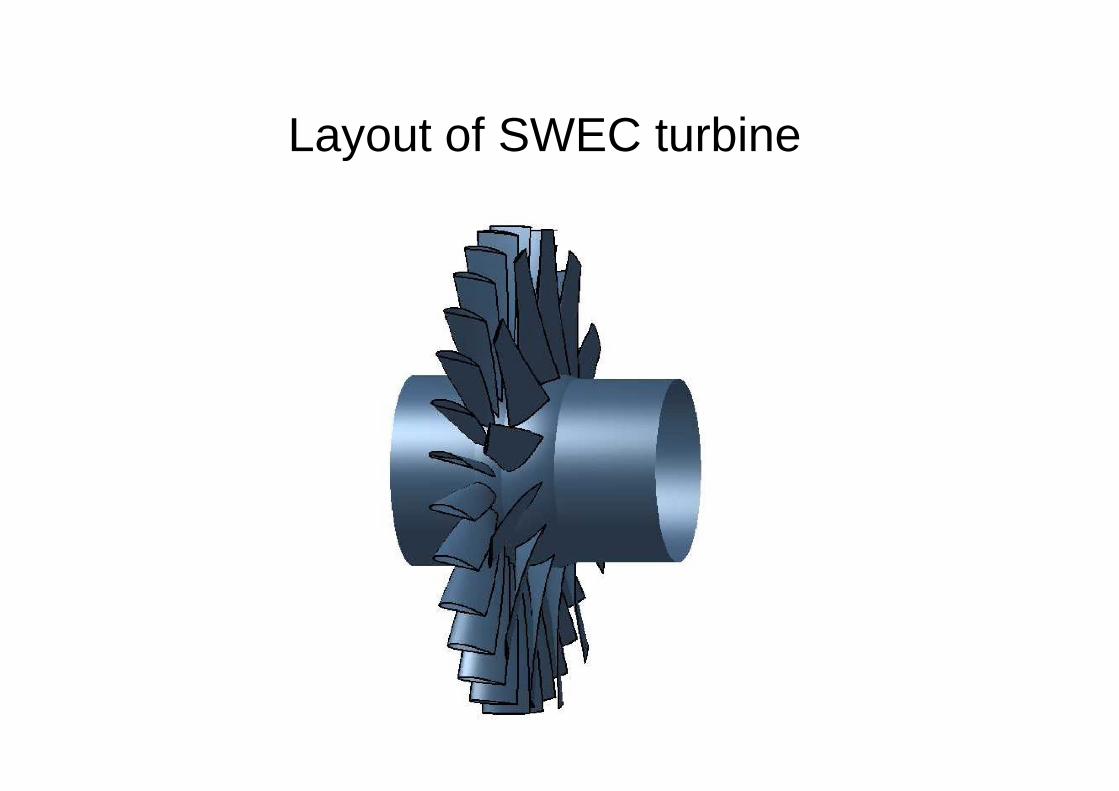
Layout of SWEC turbine
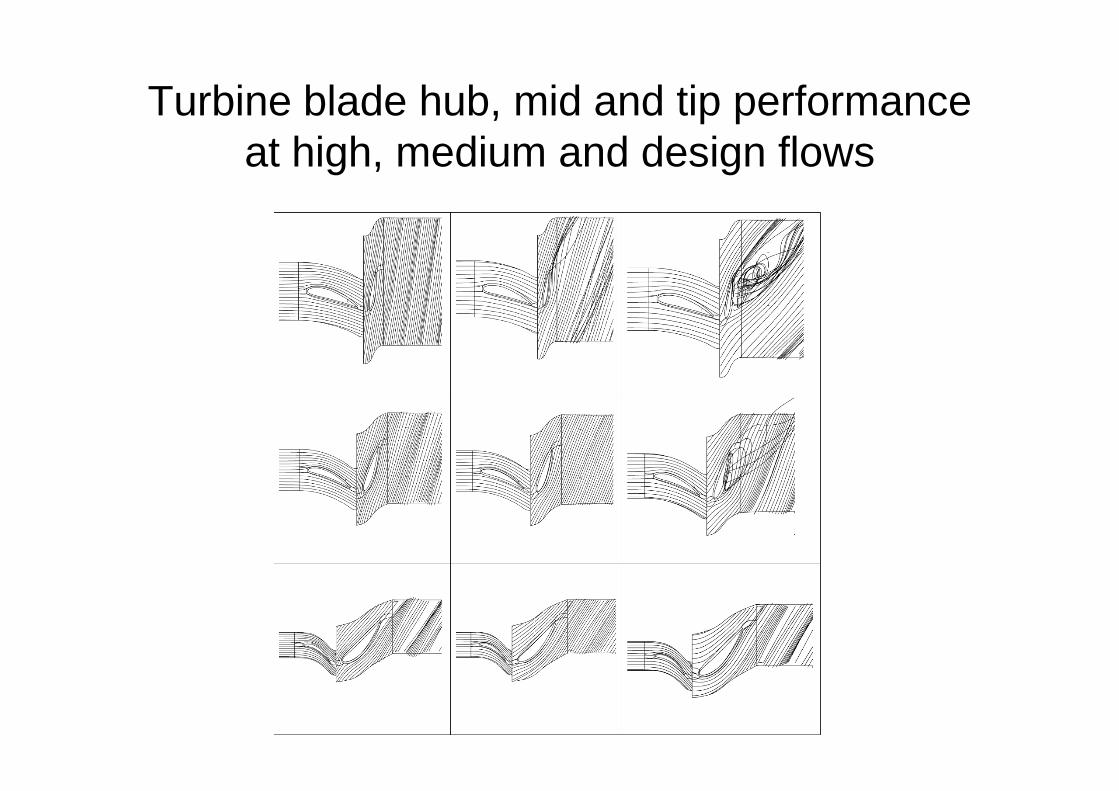
Turbine blade hub, mid and tip performance at high, medium and design flows
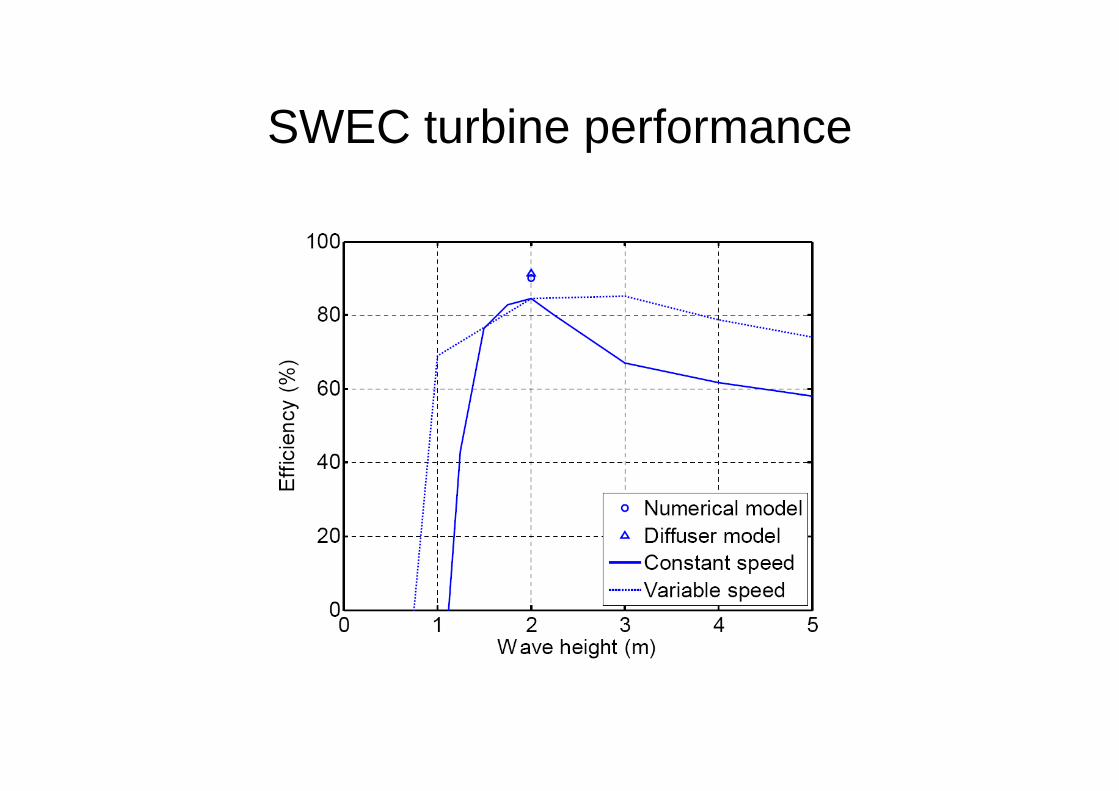
SWEC turbine performance
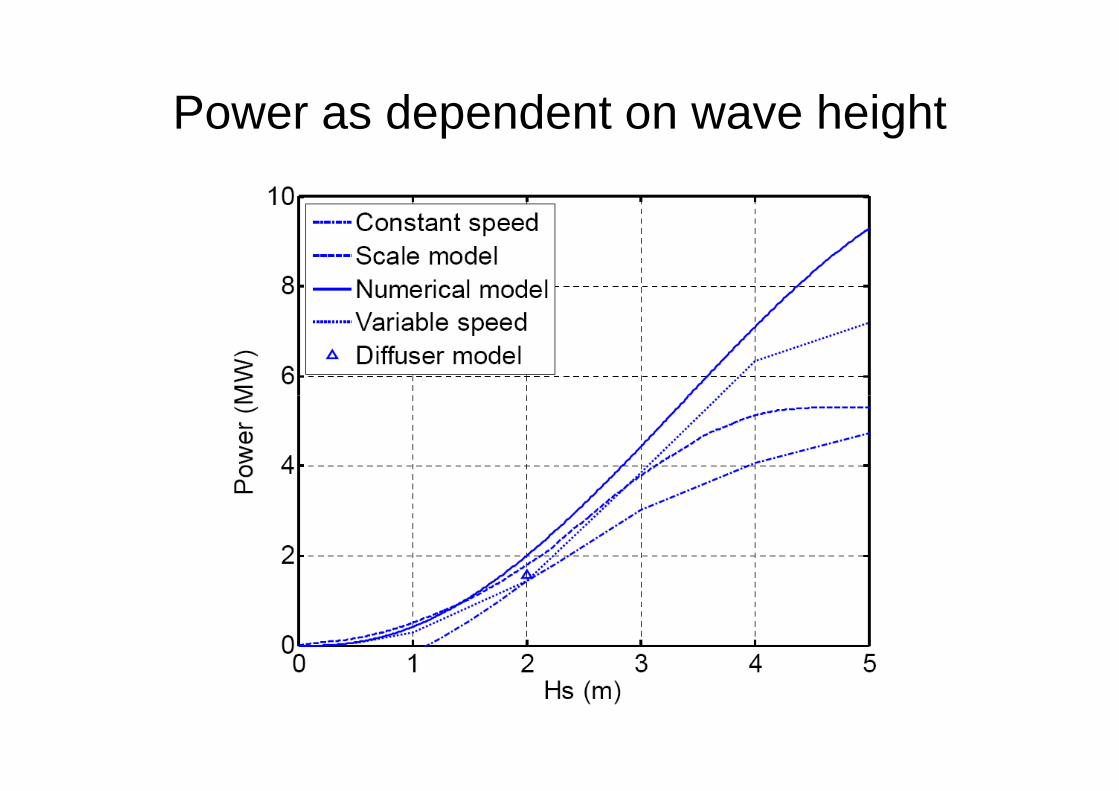
Power as dependent on wave height

Conclusion of this section
This work has shown that:• The one-dimensional dynamic system model agrees well
with the previous model studies• A highly efficient turbine can be developed• The generator should preferably be of the variable-speed• The generator should preferably be of the variable-speed
type
Conclusion of the talk
• Work done at Stellenbosch over the last few years on ocean current and wave system turbines has been presented.
• Students have designed, built and analysed various open and shrouded turbines.open and shrouded turbines.