axisymmetric single shear element combustion … single shear element combustion instability...
TRANSCRIPT

NASATechni¢_aI M_em0randurn 106327
AIAA-93-1953m
..... c
Axisymmetric Single Shear ElementCombustion Instability Experiment
Kevin J. Breisacher p_Lewis Research Center _ CO
Cleveland, Ohio _ C 01{ I_ __
T
Prepared for the29th Joint Propulsion Conference and Exhibit
cosponsored by the AIAA, SAE, ASME, and ASEE
Monterey; California, June 28-30, 1993
"O-NationalAeronauticsandSpaceAdministratiOn
i
2 (NASA-TM-I06]2?) AXIS Y-IglMETRiC
SINGLE SHEAR ELEMENT COMBUSTIONINSTABILITY EXPERIMENT (NASA)
10 p
G3120
m
N94-I0763 i
Unclas
0185029
https://ntrs.nasa.gov/search.jsp?R=19940006308 2018-06-30T03:58:41+00:00Z


Axisymmetric single Shear ElementCombustion Instability Experiment
by
.... Kevin J. Breisacher
NASA Lewis Research Center
Abstract
The combustion stability characteristics of a combustor consist-
ing of a single shear element and a cylindrical chamber utilizing
LOX and gaseous hydrogen as propellants are presented. Thecombustor geometry and the resulting longitudinal mode Instabili-
ty are axisymmetric. Hydrogen injection temperature and pyrotech-nic pulsing were used to determine stability boundaries. Mixture
ratio, fuel annulus gap, and LOX post configuration were varied.Performance and stability data are presented for chamber pres-
sures of 300 and i000 psia.
Introduction
Currently, a rigorous calculation of the combustion stability of
a large liquid rocket engine is not feasible. Computationallythese calculations are infeasible due to the inherent three
dimensionality of the most common instability mode shapes andthe fact that flight engines typically contain several hundred
injection elements. Parallel computing may offer some hope ofresolving this computational dilemma. However, even if sufficient
computational resources were brought to bear on the problem, thelack of validated models for atomization, droplet dynamics, and
droplet combustion in a rocket combustor environment would still
prevent a rigorous solution from being obtained. One of the
problems of validating such models for combustion instability is
that the majority of existing experimental data is for threedimensional, multi-element geometries. Even "2D combustors" are
three dimensional from a modeling standpoint. The ability to do
"numerical experiments" to devei6pl-and validate new models
without gross simplifications of the actualphenomena is severely
limited by the existing experimental database. Complex multi-
element geometries also make it difficult to apply diagnostics toobtain data for model validation. Finally, the cost of obtaining
data from multi-element har_w_re!s prohibitive.
The goal of this experimental program was to obtain data from a
simple system that could be driven unstable yet retain theessential physics of the instability phenomena in a two dimen-
sional geometry. This data would provide a unique validation testcase for combustion instability models. By maintaining a true two
can take advantage of the inherentdimensional geometry, models
computational efficiencies of two dimensional calculationswithout unrealistic physical assumptions. The simplest system, of

course, would contain a single element. SP-194', the historical
monograph on combustion instability, does not include single
element engines in its section on research hardware. There does
not appear to be a great amount of documentation devoted tosingle element instability experiments in the open literature. 2'3
However, the incentives to perform single element stability tests
in the past were not as great as they are today.
A single shear coaxial element and a long, narrow cylindricalchamber were selected for this test program. The element was not
recessed to further simplify the atomization process. Instabil-
ities were to be initiated using low temperature hydrogen injec-
tion and pyrotechnic pulsing. Hydrogen temperature ramping is awell established method of inducing instabilities. The fuel side
of a coaxial injection element can be thought of as a high pass
filter whose gain is increased as hydrogen temperature is de-creased. As the fuel side response is increased, so is the chance
of triggering an instability. The LOX post was designed to have aresonance corrresponding to the first longitudinal (IL) mode of
the chamber. Although the first tangential is the most common
mode of concern, the first longitudinal was selected to preservethe two dimensionality of the experiment. It is understood that
at the most fundamental level LOX jet oscillations and jet
surface wave phenomena may violate the two dimensionality of the
experimental setup. However, at present, the necessity of includ-
ing these phenomena in instabilty models is unclear.
Test Engine
The test engine consisted of a single, coaxial injection elementand a heat sink chamber (Figures 1 and 2). The chamber was 2.055"
in diameter andwas 18.25" in length from the injector face to
the nozzle throat. The chamber consisted of a short injector
section, a long main chamber assembly made of Hastalloy, and thethroat section. A schematic representation of the engine is
provided in Figure 3. The throat diameter was .592" and .296" for300 and I000 psia respectively. The chamber was instrumented with
an array of seven high frequency, piezoelectric, pressure trans-
ducers (Figure 4.). The transducers were flush-mount, helium
cooled, and had flat response to 20KHz. Three transducers werelocated circumferentially around the chamber 1.75" downstream of
the injector face. The remaining four transducers were placed
axially along the chamber. In addition to the high frequency
pressure transducers, an array of nine static pressure transduc-
ers were placed axially along the chamber (Figure 4.). Thesetransducers were of the strain gauge bridge type and were accu-
rate to 1/2%.
The injection element consisted of a two piece LOX post assembly
(Figure 2.) and a faceplate with an opening for the fuel annulus.
The injection element was designed to be modular. Fuel annulus
diameter (Dr) could be varied by changing the faceplate. LOX postorifice location and injection tip diameter could be varied by

interchanging pieces of the two piece LOX post assembly. ThreeLOX post configurations were selected for testing (Figure 5.).All three configurations are 9.24" in length and are fed by a I"diameter dome. This length was chosen so that the resonance ofthe LOX post would match the resonance of the chamber (approxi-mately 1800 Hz).LOX post configuration 1 in Figure 5 has a simple .9375" diametertube with no orifice and was selected for its low LOX side
pressure drop. Configuration 2 has a .0625" diameter orifice at
the top of the tube. Configuration 2 represents the preferred
configuration of engine manufacturers. Configuration 3 which hasa .0625" diameter orifice at the bottom of the tube is similar to
a design used in the Lewis LOX/H 2 instability test programs of
the 1960's.
Test Facility and Operating Procedure
The tests were conducted at the Lewis Research Center Rocket
Engine Test Facility. This is a 50,000 Ibf sea-level rocket test
stand equipped with an exhaust-gas muffler and scrubber. A
pressurized propellant system was utilized to deliver the propel-lants to the engine from the storage tanks. The engine was
mounted on the thruststand to fire vertically into the scrubber
where the exhaust gases were sprayed with water for
cooling and sound suppresion. The oxygen propellant line wasimmersed in a liquid nitrogen bath. In addition, a LOX pre-chill
of the engine hardware was required before ignition to ensure
that liquid oxygen was flowing to the engine. Obtaining low
temperature hydrogen at the engine was also critical in the
performance of this test program. Due to the relatively smallsize of the hardware in relation to the facility, this was
sometimes difficult. A plastic type foam was used to insulate the
hydrogen line. For the tests with the lowest hydrogen injectiontemperatures, a "pre-stage" condition (low Pc) was maintained forseveral seconds to chill the hardware in order to obtain low
temperature hydrogen at the engine. Liquid helium was alsoutilized to chill the hardwar@in an unsuccessful attempt to
obtain even lower hydrogen temperatures. Ignition was obtained
with a GH2/GOX torch igniter placed 3.31" downstream of the
faceplate on the side of the engine.
During 22 tests the engine was pulsed (bombed) using electricallydetonated RDX pellets. Although several tests were conducted
using I0 grain pellets, 2.5 and 5 grain pellets were adequate todisturb the engine. The bomb port was located 3.25 inches down-
stream of the faceplate and was directed radially into the
chamber. It was necessary to cover the RDX pellets with a thin
layer of putty to protect them from pre-detonation due to the LOX
pre-chill.
3

Results
Tests were conducted with LOX post configurations 1,2, and 3 at
300 psi and configurations 1 and 3 at i000 psi. Fuel to oxidizer
velocity ratio and fuel side pressure drop were varied by chang"
ing fuel annulus gap. Tests were conducted with hydrogen at
ambient temperatures and at the lowest hydrogen temperatureobtainable in the facility. Typically, mixture ratio was varied
from 2.0 to 6.0 for each configuration tested.
C" efficiency was calculated by determining the expermintal C"
from the following equation:
where
Pc - is the chamber pressure
- is the throat area
W_ - is the propellant flowrate
(The chamber pressure used in this equation is the staticpres-sure measurement nearest to the beginning of the contraction sec-
tion.)
and dividing by the theoretical C" determined for the operatingconditions of the test. An array of nine pressure tranducers were
used to obtain an axial static pressure profile along the engine.
Before each day's testing, a plate was placed over the nozzle of
the engine and the chamber was pressurized. Readings were takenwith the static pressure transducer array at five pressurization
levels that bracketed the target chamber pressure for the tests.
A calibration curve was then developed using these in place
readings. Figure 15. displays three axial pressure profiles for
typical tests. Even when using the in place calibrations, thescatter is significant. The phenomena that is to be measured and
the accuracy of the instrumentation are of the same order.
However, it does appear that a zone of recirculation or energyrelease is detectable near the injector face.
The operating conditions and stability for selected tests are
displayed in TableskI-IV. In these tables, operating conditionssuch as propellant flowrates and pressure drops, chamber_s _
sure, and hydrogen injection temperature are presented. Perfor-mance is characterized by the C" efficiency. An injection veloci-
ty ratio and a density weighted velocity ratio are provided toindicate the operating regime of the injection element. The
geometry tested in a particular run is indicated by a LOX post
configuration number (corresponding to Figure 5 ) and a fuel
4

annulus diameter (Dr). Bomb tests are indicated by a small "b'
next to the test number. A stability classification, an estimate
of the amplitude and the frequency of any oscillation are also
provided in the tables. Classically, an engine is declared unsta-ble if an organized oscillation exceeds ten percent of chamber
pressure. Above ten percent of chamber pressure the possibilityof hardware damage becomes a real concern. In some research pro-
grams, an instability was said to have occurred if the amplitudeof an organized oscillation exceeded the noise level of the
combustor. For purposes of this paper, the stability of the
engine is categorized as follows based on oscillation amplitude:
0 - 5% Pc stable
5 - 10% Pc marginally stable
> 10% Pc unstable.
The amplitude and frequency of the oscillations were obtained
from expanded digitized traces of the high frequency pressure
measurements.
The 300 psi chamber pressure data for configurations 2 and 3 are
presented in Table I. The ambient temperature hydrogen tests with
all the configurations tested were always stable. In Table I,
ambient temperature hydrogen tests for configuration 2 (orifice
at the top of the LOX post) are presented. For two of the tests,
no organized oscillation was detectable. The remaining tests hadoscillations that were 2-3 percent of chamber pressure. The fuel
and LOX side pressure drops as a percentage of chamber pressurefor these tests were very high. These high pressure drops for
ambient temperature testing resulted from the fact that the same
injection element hardware was to be used for low hydrogen
temperature and i000 psi cha_er pressure tests.
The most interesting stability behavior of this test program was
encountered with configuration 3 (orifice at the bottom of the
LOX post) and a fuel annulus diameter of .235". With this config-
uration, instabilities with amplitudes greater than 10% of
chamber pressure were obtained. All of the instabilities encoun-tered with this configuration were spontaneously unstable. The
oscillations are present from the beginning of mainstage and
persist throughout the run with little frequency shift. This can
clearly be seen in Figure 6 which displays the frequency contentand relative amplitude (pressure) of the oscillation as the test
progresses (time axis). The frequency content of the oscillations
integrated over the duration of the test is provided in Figure 7.
Figures 6 and 7 were obtained by applying Fourier Transforms to
the digital samplings taken from the analog recordings of the
high frequency pressure measurements. From Figure 7, the frequen-
cy and bandwidth of the oscillations are evident. The secondharmonic is clearly present (Figures 6 and 7) and a trace of the
third harmonic appears to be present also. To ensure that the two
dimensionality of the oscillations was not being corrupted, Tests
286 and 292 were digitized at a sufficiently high rate to resolve

the first tangential mode for this combustor (17,100 Hz). Therewas no indication that a tangential mode of oscillation was
occurrlng.The waveforms produced by the unstable test cases are fairly
complex. For test 286, very pronounced beating occurred (Figure
8). A comparison of Figure 8 and 9 suggests the beating is
occurring between oscillations at approximately 1780 Hz and 1858
Hz. These modes probably correspond to the natural modes of the
chamber and the LOX post. A higher beat frequency also appears to
be occurring in Figure 8. and is produced by the first and secondharmonics of the chamber oscillation. The oscillations appear to
be limit cycle oscillations and do not appear to be very steepfronted. A number of the tests with this configuration had
significant oscillation amplitudes but were not classicallyunstable. Figure i0. shows a plot of oscillation amplitude versus
mixture ratio for configuration 3 with a fuel annulus diameter of
.235". Injector pressure drop or hydrogen injection temperatureeffects are not shown on the plot, resulting in some of the
scatter. However, the appearance of distinct operation regimes is
clear. In particular, a tuning region between a mixture ratio of
approximately 5 to 6 exists in which classic instabilities occur.
Retaining the same LOX post configuration but decreasing the fuelannulus diameter to .210" and .205" resulted in generally stable
operation (Table I). Although an oscillation is present, its
amplitude is between 3 and 5 percent of chamber pressure.
Configurations 2 and 3, both with orifices, had very high pres-
sure drops. Eliminating the orifice, and utilizing a straight
tube post (configuration i) lowers the LOX side pressure drop.The results for configuration 1 are presented in Table II. The
tests are generally stable. While the LOX side pressure drop is
down, the fuel side pressure drops as a percentage of chamber
pressure for the configurations in Table II are relatively high
(greater than fifteen percent). The only test with an oscillation
approaching significant amplitude (test 266), also has theminimum fuel side pressure drop. It would have been interesting
to test this configuration with a larger fuel annulus gap.
By changing the throat diameter from .592" to .296", tests wererun at a nominal chamber pressure of a I000 psi with the same
injection element hardware and propellant flowrates that wereused at 300 psi. A chamber pressure of i000 psi was selectedbecause it is above the critical pressure of pure liquid oxygen.
Test results for a chamber pressure of a I000 psi are presented
in Tables III and IV. When configuration 3 was run at i000 psi
the tests were very stable. In the majority of tests no organized
oscillation is even detectable. It is interesting to note that
when configuration 3 was tested at i000 psi with a fuel annulusdiameter of .235", the tests were stable. The same configuration
was unstable at 300 psi. It is stable at i000 psi even though the
LOX and fuel side pressure drops as a percentage of chamber
pressure are much lower than they were at 300 psi. Figure ii
displays the frequency content and amplitude relative to the
6

combustion noise level of an oscillation occurring during Test
369. Figure 12 provides the frequency and bandwidth of this
oscillation integrated over the test duration. Figures 11 and 12indicate that for configuration 1, while stable (Table III), an
organized oscillation above the noise level of the combustor is
clearly present. No harmonics of this oscillation are present. A
comparison of Figures 11 and 12 with Figures 6 and 7, show thatthe oscillation occurring with configuration 1 at i000 psi is of
a narrower bandwidth. Plotting the variation of the oscillation
amplitude with mixture_ratio for this configuration there is
significant scatter (Figure 13.). The scatter is not suprisingsince this oscillation is somewhat marginal to begin with.
However, the trend is very similar to that of Figure 10. with a
tuning region between a mixture ratio of 5 to 6.5 and falloff at
higher and lower mixture ratios.
Bomb tests were performed during the test program (10 bomb tests
are included in the tables). The bomb was triggered one half to
one second before the end of a two second duration test. This
timing provided ample time for a disturbance to organize and also
permitted useful data to be taken before the bomb was triggered.Bomb overpressures ranged from 30 to 120 percent of chamber
pressure. None of the bomb tests initiated an instability oraltered the strength of an existing oscillation. The decay from a
typical bomb pulse is shown in Figure 14.
Computational Models
A computational model of the test engine was made by modifyingthe KIVA II computer code. 4 The LOX tube flow was modeled using
the one-dimensional "water hammer" equations. The LOX tube model
provided the spray velocity and mass flowrate boundary condi-tions. The fuel side was modeled using a lumped parameter ap-
proach with the property variations during hydrogen temperature
ramping being taken into account. The fuel side model provided a
velocity boundary condition for KIVA II. A constant mass flowrate
was imposed upstream of the LOX and fuel sides of the injectionelement. No attempt was made to resolve the atomization process
computationally. A "blob" injection model with a dropsize corre"lation based on the work of Wu and Faeth 5 and a stochastic break-
up model was employed. Results from the model for a stable,ambient temperature test and an unstable low temperature test are
presented in Figure 16. The simulation of the high temperaturetest case exhibits small amplitude pressure oscillations whose
frequency content is dominated by the first longitudinal oscilla-tion. The low temperature simulation produces first longitudinal
oscillations of an amplitude similar to those obtained experimen-
tally for Test 286. It also appears as if beating is beginning tooccur between the first and second harmonics (between 4.5 and 5.5
milliseconds in Figure 16). While the preliminary results look
encouraging, the simulation should be carried out for longer thana few milliseconds. The initial goal is to reproduce the stabili-

ty (and corresponding performance) map shown in Figure i0. with a
single dropsize correlation.
Summary
An axisymmetric LOX/GH2 research engine with a single injectionelement was sucessfully test fired over a range of operating
conditions. Stable and unstable combustion were observed when
fuel annulus gap, LOX post design, mixture ratio, and chamber
pressure were varied. Pulsing the engine wi.th, pyrotechnics didnot induce instabilities. While no instabillties were triggered
at a chamber pressure of a 1000 psi, interesting similarities
with the unstable operating regimes encountered at
300 psi were noted.
Concluding Remarks
The data obtained in this test program provide a unique set of
test cases for the validation of combustion instability codes,
particularly CFD based models. Ultimately, it is hoped thatvalidated instability codes could be used to design and predict
the stability characteristics of future single element tests, a
step on the path to reliable stability design codes for large
liquid rocket engines.References
1. Harrje, D. T. and Reardon, F. H., "Liquid Propellant Rocket
Combustion Instability", NASA SP-194, 1972.
2. Harrje, D. T.,Reardon, F. H., and Crocco, L., ,,Combustion
Instability in Liquid Propellant Rocket Motors", Princeton Univ.
Aero. Eng. Rept. No. 216, Nov 1960.
3. Auble, C. M., "A Study of Injection Processes for Liquid
Oxygen and Gaseous Hydrogen in a 200-Pound-Thrust Rocket En-
gine",NASA RM E56125a, Jan. 1957.
4. Amsden, A. A., O'Rourke, P. J., and Butler, T. D., "KIVA II: A
Computer Program for Chemically Reactive Flows with Sprays", LA-
I1560-MS, May i989.
5. Wu, P. K., Hsiang, L. P., and Faeth, G. M., ,,AerodynamicEffects on Primary and Secondary Spray Breakup", First Interna-
tional Symposium on Liquid Rocket Combustion Instability, Penn-
sylvania State University, University Park, Pa.,Jan. 1993.

TABLE I.--_ RF__ULTS FOR CONFIGURATIONS 2 AND 3 AT 300 psi
45 492 t36 .079 .31 3.92 735 455 }3.6 47 85 2 .210 $
54 1497 311 0639 .30 4.69 504 416 96.1 48 67 " S 2.5-3.0 1755
57 495 305 .059 .305 5.17 470 422 96.1 48 62 " S 2_5-3.0 1663
58 496 306 .056 .309 5.51 424 424 95.4 47 60 " S
90 497 303 .065 .30 4.96 464 414 94.9 48 68 " S 2.5-3.0 1777
91 498 301 .056 304 5.42 430 443 94.7 48 59 " S 2.5-3.0 1738
93 498 303 .059 .31 5.25 448 436 93.3 47 64 " S 2.0-2.5 1650
155 86 323 ._ .283 3.22 111 584 _8.7 3.8 136 3, .205 S 3.5 1755
159 b 85 322 .061 .274 3.38 95 589 100.5 3.6 121 " iS 3.0 2068
161 105 307 .060 .335 5..58 72 755 _1.0 3.2 ll0 " S 4.0 1630
1163 108 302 .056 .315 5.63 75 787 94.5 3.4 97 " S 2.5 _-780 __
206 72 272 .081 .251 3.1 73 404 91.3 3.3 111 " S 3.0 1743
208 92 252 .052 .282 5.42 54 552 87 .5 3.4 80 " S 3.0-4.5 1755
210 89 260 .053 .288 5.43 53 534 89.1 3.1 84 " S 3.0 1759
212 89 272 _a .314 5.92 48 621 87.1 2.86 91 " S 3.0 1752
214 92 257 .054 .29 5.4 52 533 87.1 3.36 85 " S 3..5-4.0 1807
216 b 91 261 .054 .33 6.16 54 669 85.6 12.9 97 " S 3.0 1776
221 68 283 .085 .24 2.82 68 391 93.8 2.49 103 3, .210 MS 5.0 1770
223 67 276 .085 _62 3.08 i58 405 89.3 2.22 113 " S 4.5-5.0 1777
225 b 68 278 .086 1.26 3.02 53 420 87.7 2.42 114 " S 3.5 1753
234 [75 295 .058 .32 5.51 40 625 90.6 1.7 94 " S 4.0 1754
276 71 294 .097 .243 2.51 38 384 95.8 2.28 86 3, .235 S 2.5-3.0 1751
282 b 67 288 .096 .269 2.80 33 451 89.3 1.59 94 " MS 6.0-7.0 1745
286 b 72 283 .061 .316 5.18 26 626 85.9 1.23 70 " U 17.0 1782
288 71 292 .064 .328 5.13 22 644 85.7 1.13 77 " MS 8.0 1860
292 75 301 .058 1.345 5.94 25 715 87.4 1.10 73 " U 13.0 1786
318 75 264 .081 .252 3.11 37 400 88.8 2.55 75 " MS 6.5-7.0 1851
320 70 280 .080 .277 3.46 26 458 87.4 1.7 80 " MS 7.0-7.5 1742
324 79 268 .062 .352 5.67 23 758 76.5 1.54 80 " U 11.5 1822
326 78 289 .063 .361 5.73 24 791 79.3 1.34 83 U 10.5 1843
328 77 283 .057 .362 6.35 22 785 80.1 1.21 75 " MS 5.0-5.5 1805
330 75 278 .056 .372 6.64 22 824 78.9 1.10 76 MS 9.0-9.5 1803
332 b 74 286 .057 1.369 6.47 22 814 81.2 1.05 76 " MS 7.0-7.5 1798
Note: A "b" next to a zest number indicates a bomb test. A dash indicates that no discernible oscillation was present.
9
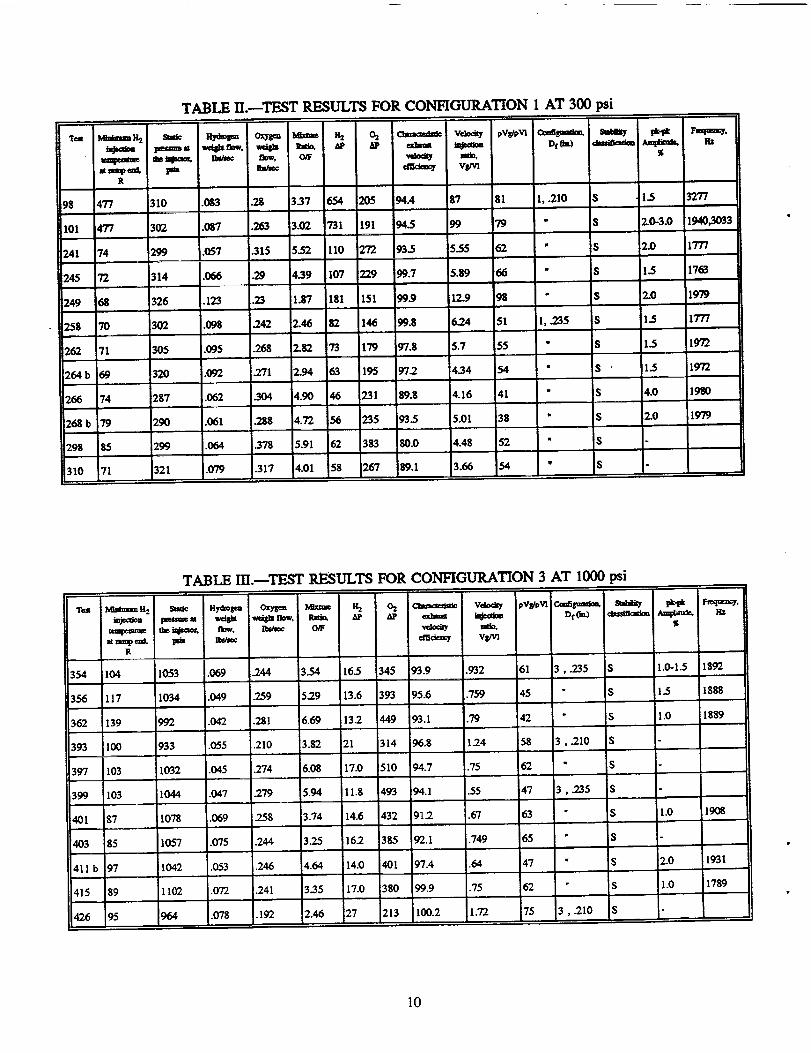
TABLE II._TEST RESULTS FOR CONFIGURATION 1 AT 300 psi
98 477 310 .083 .28 3.37 654 205 94A 87 81 1, .210 S 1.5 3277
101 477 302 .087 .263 3.02 731 191 94.5 99 79 " S 2.0-3.0 1940,3033
241 74 299 .057 .315 5.52 110 272 93.5 5.55 62 " S 2.0 1777
245 72 314 .066 .29 4.39 107 229 99.7 5.89 66 " S 1.5 17_.
249 68 326 .123 .23 1.87 181 151 99.9 12.9 98 " i$ 2.0 1979
258 170 302 .098 .242 2.46 82 146 99.8 6.24 51 1, .235 S 1.5 1777
262 71 305 .095 .268 '_ _ 73 179 97.8 5.7 55 " S 1.5 1972
264 b 69 320 .092 .271 2.94 63 195 97..2 4.34 54 " S ' 1.5 1972
i266 74 287 .062 .304 4.90 46 231 89.8 4.16 41 " S 4.0 1980
268 b 79 290 .061 .288 4.72 56 _35 93.5 5.01 38 " S 2.0 1979
298 85 299 .064 .378 5.91 62 383 80.0 4.48 52 " S
310 71 321 .079 1.317 4.01 58 267 189.1 3.66 54 " S
TABLE m'.nTESW RESULTS FOR CONFIGUIL_TION 3 AT 1000 psi
the _ecm_ _. a_ec Off _ m_
.069 .244 3.54 16.5 345 93.9 .932 61 3, .235 8 1.0-1.5 1892
.049 .259 5.29 13.6 393 95.6 .759 i45 " S 1.5 1888
.042 .281 6.69 3.2 449 93.1 .79 42 " S il.0 1889
.055 .210 3.82 21 314 96.8 L.24 58 3, .210 S
.045 .274 6.08 17.0 510 94.7 .75 62 " S
.047 .279 i5.94 11.8 493 94.1 .55 47 3 , .235 S_._
.069 .258 |.74 14.6 432 91.2 .67 63 S 1.0 1908
•075 .244 3.25 16.2 385 72.1 .749 65 " S
.053 .246 4.64 14.0 i401 97.4 ,64 47 " S 2.0 1931
.072 .241 3.35 17.0 380 99.9 .75 62 " S 1.0 1789
.078 .192 2.46 27 213 100.2 t.72 75 3 , .210 IS
_ ramp era. pmR
354 104 1053
356 117 1034
[362 139 _)2
393 100 933
397 103 1032
399 103 1044
401 _87 1078
403 85 11057
411 b 97 1042
415 89 1102
426 95 964
lO

TABLE IV._TEST P.F._ULTS FOR CONFIGUN_TION 1 AT 1000 psi
•*m_emkit
337 95
369 107
373 101
375 94
377 97
379 89
382 111
384 105
388 105
405 g8
409b 89
42O 93
1058 .O55 .296 5.38
1016 .047 .282 6.0
.04s
1001 044 .304 6.91
924 .033 338 10.2
958 .(B9 .324 8.31
962 .053 .263 4.97
997 .052 .281 5.40
978 .05 1 .283 5.55
1110 .063 .318 5.05
1135 .058 .309 5.33
921 .095 .183 L93
23 224 86.0 1.59 _35
18.7 205 90.6 1.78 28
17.7 244 77.4 1.53 33
16.5 215 87.4 1.27 28
13.9 267 84.7 .96 23
15.7 247 84.6 .99 27
21 173 86.2 2.39 30
19.7 190 85.9 1.95 31
22 20O 184.9 1.93 31
,23 241 g4.0 L.48 43
22 233 89.0 1.41 38
24 220 _4.8 4.75 37
1, .23.5 S 3.0-3.5 1879
" iS 4.0 1821
" S 3.0 1820
• S 3.0 18.56
" S 1.-% 1838
" S 1.0 1847
• S 1.5 1883
" S 1.0 1856
" S 3.0 1865
• S 1.0 1878
• :S 1.0 1870
• S
C-92 03_22
Figure 1 .--Single element test engine hardware.
11

C-92-03421
Figure 2.---LOX post assembly,
Fuel .32"
manifold --_ I I
HII_ --,i _1-- Fue,_°nu,us
iO" __ diameter, DI
I i\LFaceplate
.68"
2.055"
L18.25"
'_2.23"-'---_
.592" [300 psi)
J %.592"R
/-.296"R
iI
_,---2.o23"-_,.Figure &--Schematic representation of combustion chamber hardware,
]2

StaticpressuretransducerlocationsI1 25.625"8751.375 2.75 3.0 3.0 3.0 1.25
Illlll f I 1t-_ 3.31 ,_1 Igniter
-__ 3.25 ,'7 Bomb port
I] I I ] T1.75 / 3.935 3.0 3.0 3.0
/ High frequency pressure transducer locations/L. 3 transducers circumferentlally
located at 0, 90, and 315 degrees
Rgure 4.mPressure transducer locations.
All dimensionsin inches
I_1 .O0"--_ I
.Ts'gr-1
9.4'
1
.0625" dla -7 LOX dome --
\ -7
_-- 75".9375" dia dia
II
.9375" dia
25" dia
.16" .16" .125"
Configuration I Configuration 2 Configuration 3
Figure 5.--Schematics of LOX post configurations.
]3

304
302
30O
298
298
-- O
f
I I I I o
282 -
280
27e
2760,.
I I 1 I
274
261 F D
259_
2sel I 1 I l I I I I0 2 4 6 8 10 12 14 16
Axial distance, in.
Figure 6.--Axial static pressure distribution.
80 m
60
40
o
E -20
-4O
-6O] i [ I I
1.1 20 1.1 24 1.1 28 1.1 32 1.1 36 1.140
Time, sec
Figure 7.--Pressure history after 2.5 grain pulse (test 216).
]4

-- _ 2.728
I
__ 2.387
_ 2.1146
______--'=_--_ 1.705. _'_-TT_. Li_tEL._- :,kL _'7 ------"7
• _. . . _ 1.364 0¢'
_ __ 0.341_ _0 ,
300 1300 2300 3300 4300 5300
Frequency
Figure 8._Cascade plot of pressure for unstable test 292.
0°g m
0.8
0.7
0.6
(R
0.5
0.4=="o
0.3¢n 0.2
0.1
0 6OOO1000 2000 3000 4000 5000
Frequency, Hz
Figure 9.--Power spectral density plot for unstable test 292.
15

25--
20--
15
_r_ 5
or_.-s
-10
-15 --
-200.220 0.224 0.228 0.232
Time, sec
Figure 10.--Expanded digitized pressure trace for unstabletest 286.
I0.236
0.6 m
1800 1840 1880
Frequency, Hz
Figure 11 .DPower spectral density plot for unstable test 286.
16
_.- 14
8
m13 6
O
18--
O
O
Y4
2' I I I I I2.5 3.0 3.5 4.0 4.5 50
Mixture ratio
0
I I I I5.5 6.0 6.5 7.0
Figure 12.--Variation of oscillation amplitude with mixture ratio(configuration 3, Df - .235").
]6

I I I I
300 1300 2300 3300 4300 5300
Frequency
0.2273
Figure 13.--Cascade plot of pressure for test 369.
1.364
1.137
0.4_7
7 :D
N
6-
5--cr(n
4--
3 --
_ 2-
w
i, I I I I I ,_1000 2000 3000 4000 5000
Frequency, Hz
Figure 14.--Power spectral density plot for test 369.
I6220
]?

4o0 --
IE 3.5--¢D
E_. 3.0--
2.5--
15 2.0--D.
_ 1.5--
-_ 1-° f_ 0.5
01
/°2 3 4
GO
1 I I I I I J5 6 7 8 9 10 11
Mixture ratio
Rgure 15.--Variation of oscillation amplitude with mixture ratio(conflgumUon 3, Df- .235").
400
380
o. 340
"_ 320
'300
280
= 260(3
O240
Testnumber
286135
- O.dll_l,i. ,r"",f _,l,li"z'"'"'Jl_zj'*l I'''''j'qh''°',jtl=r-I
I I I ! I I3.0 3.5 4.0 4.5 50 5.5
13me, msec
220 I I2.5 6.0 6.5
Figure 16.--Computed pressure trace for stable and unstabletest cases.
]8


Form ApprovedREPORT DOCUMENTATION PAGE OMB No. 0704-0188
Public reporting burden for this collection of information is estimated to average t hour per response, including the time for reviewing instructions, searching existing data sources.
gathering and maintaining the data needed, and completing and review_g the c_,lectionof information. Spnd comments regarding thisburden eatimat.orany othera_ j_effO_ tohnScollection of information, including suggestions for reducing this burden, to Washington Headquarters Ser.,nces, u=rectotate mr reformat=on uperatmns ana Hepons, "1;¢1:)Je • sDavis Highway, Suite 1204, Arlington, VA 22202-4302, and to the Office of Management and Budget. Paperwork Reduction Project (0704-0188), Washington, DC 20503.
1. AGENCY USE ONLY (Leave blank) 2. REPORT DATE 3. REPORT TYPE AND DATE_ COVERED
December 1994
4. TITLE AND SUBTITLE
Axisymmetric Single Shear Element Combustion Instability Experiment
6. AUTHOR(S)
Kevin J. Breisacher
7. PERFORMING ORGANIZATION NAME(S) AND ADDRESS(ES)
National Aeronautics and Space Administration
Lewis Research Center
Cleveland, Ohio 44135-3191
9. SPONSORING/MONITORING AGENCY NAME(S) AND ADDRESS(ES)
National Aeronautics and Space Administration
Washington, D.C. 20546-0001
Technical Memorandum
5. FUNDING NUMBERS
WU-584-03--I 1
8. PERFORMING ORGANIZATION
REPORT NUMBER
E-8082
10. SPONSORING/MONITORING
AGENCY REPORT NUMBER
NASA TM- 106327
AIAA-93-1953
Corrected Copy
11. SUPPLEMENTARY NOTES
Prepared for the 29th Joint Propulsion Conference and Exhibit, cosponsored by the AIAA, SAE, ASME, and ASEE,
Monterey, California, June 28-30, 1993. Responsible person, Kevin L Breisacher, (216) 977-7475.
12a. DISTRIBUTION/AVAILABILITY STATEMENT
Unclassified - Unlimited
Subject Category 20
12b. Di._iH1BUTION CODE
13, ABSTRACT _(/laxlmum 200 words)
The combustion stability characteristics of a combustor consisting of a single shear element and a cylindrical chamber
utilizing LOX and gaseous hydrogen as propellants are presented. The combustor geometry and the resulting longitu-
dinal mode instability are axisymmetric. Hydrogen injection temperature and pyrotechnic pulsing were used to deter-
mine stability boundaries. Mixture ratio, fuel annulus gap, and LOX post configuration were varied. Performance and
stability data are presented for chamber pressures of 300 and I000 psia.
14. SUBJECT TERMS
Combustion instability; Rocket engines
17. SECURITY CLASSIFICATION 18. SECURITY CLASSIFICATION
OF REPORT OF THIS PAGE
Unclassified Unclassified
NSN 7540-01-280-5500
19. SECURITY CLASSIRCATION
OF ABSTRACT
Unclassified
15. NUMBER OF PAGES
20
16. PRICE CODE
A03
20. LIMITATION OF ABSTRACT
Standard Form 298 (Rev. 2-89)
Prescribed by ANSI Std. Z39-18298-102