azerbaijan: private sector financing and the role of … · azerbaijan private sector financing and...
TRANSCRIPT
AzerbaijanPrivate Sector Financing
And The Role Of Risk-bearing InstrumentsNovember 2013

Private Sector Financing In The Eastern Partnership Countries And The Role Of Risk‐bearing Instruments
Country report: Azerbaijan November 2013
BFC Max-Högger-Strasse 6 Phone: +41 44 784 22 22 [email protected] CH-8048 Zurich, Switzerland Fax: +41 44 784 23 23 www.bfconsulting.com
EPTATF VISIBILITY
"The present study was commissioned by the European Investment Bank (EIB). The study is financed under the Eastern Partnership Technical Assistance Trust Fund, EPTATF. This Fund, which was established in 2010, to provide TA for investment projects (pre‐feasibility studies and feasibility studies, institutional and legal appraisals, environmental and social impact assessments, project management and borrower support), develop local capacity as well as financing upstream studies and horizontal activities. It focuses on the four priority sectors energy, environment, transport and telecommunication with climate change and urban development as cross‐cutting issues.”
DISCLAIMER
"The authors take full responsibility for the contents of this report. The opinions expressed do not necessarily reflect the view of the European Investment Bank. "
Table of contents About this report ........................................................................................................................... 1
1. Executive summary .................................................................................................................... 2
2. Macroeconomic environment .................................................................................................... 3
2.1 Economic development and growth.......................................................................................................... 3
2.2 The structure of the economy ................................................................................................................... 4
2.3 Inflation and asset prices .......................................................................................................................... 4
2.4 Balance of payments ................................................................................................................................. 5
2.5 The fiscal and political situation ................................................................................................................ 5
3. Financial sector overview ........................................................................................................... 7
3.1 Financial sector overview .......................................................................................................................... 7
3.2 Banking sector .......................................................................................................................................... 8
3.3 Microfinance institutions ........................................................................................................................ 11
3.3 Private equity and venture capital .......................................................................................................... 13
4.4 Other financial sector institutions ........................................................................................................... 14
4. Demand analysis ....................................................................................................................... 16
4.1 Size and growth of the segment .............................................................................................................. 16
4.2 Characteristics of SMEs ........................................................................................................................... 17
4.3 Performance ........................................................................................................................................... 19
4.4 Institutional and regulatory environment ............................................................................................... 19
4.5 Innovation ............................................................................................................................................... 20
4.6 Demand for finance ................................................................................................................................ 21
5. Supply analysis .......................................................................................................................... 25
5.1 Number and type of intermediaries ........................................................................................................ 25
5.2 Type of funding instruments ................................................................................................................... 26
5.3 Characteristics of funding recipients ....................................................................................................... 28
5.4 Institutional and regulatory issues .......................................................................................................... 29
5.5 Funding of intermediaries ....................................................................................................................... 30
5.6 Supply estimate ...................................................................................................................................... 31
6. Gaps in private sector financing ................................................................................................ 33
6.1 Gaps by instrument ................................................................................................................................. 33
6.2 Gaps by type of SME ............................................................................................................................... 33
6.3 Gaps in funding of intermediaries ........................................................................................................... 34
6.4 Potential and capability of DFIs to fill gaps .............................................................................................. 34
Annex 1: Macroeconomic indicators ............................................................................................. 36
Annex 2: Banking sector indicators ............................................................................................... 37
Annex 3: Prudential ratios for banks ............................................................................................. 38
Annex 4: Key banking regulations ................................................................................................. 39
Annex 5: The largest lending institutions in Azerbaijan ................................................................. 41
Annex 6: AMFA’s Matrix Report .................................................................................................... 42
Annex 7: World Bank Doing Business Indicators (2013) ................................................................. 43
Annex 8: Prospects of the large enterprise sector ......................................................................... 44
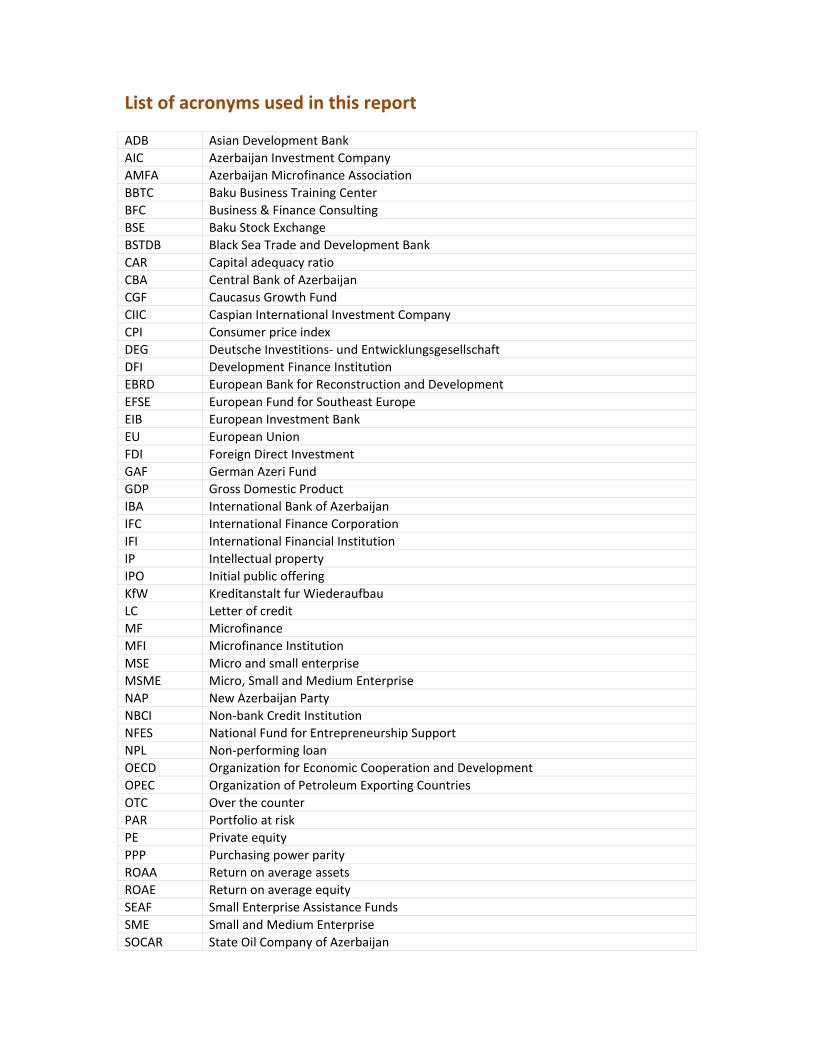
List of acronyms used in this report
ADB Asian Development Bank
AIC Azerbaijan Investment Company
AMFA Azerbaijan Microfinance Association
BBTC Baku Business Training Center
BFC Business & Finance Consulting
BSE Baku Stock Exchange
BSTDB Black Sea Trade and Development Bank
CAR Capital adequacy ratio
CBA Central Bank of Azerbaijan
CGF Caucasus Growth Fund
CIIC Caspian International Investment Company
CPI Consumer price index
DEG Deutsche Investitions‐ und Entwicklungsgesellschaft
DFI Development Finance Institution
EBRD European Bank for Reconstruction and Development
EFSE European Fund for Southeast Europe
EIB European Investment Bank
EU European Union
FDI Foreign Direct Investment
GAF German Azeri Fund
GDP Gross Domestic Product
IBA International Bank of Azerbaijan
IFC International Finance Corporation
IFI International Financial Institution
IP Intellectual property
IPO Initial public offering
KfW Kreditanstalt fur Wiederaufbau
LC Letter of credit
MF Microfinance
MFI Microfinance Institution
MSE Micro and small enterprise
MSME Micro, Small and Medium Enterprise
NAP New Azerbaijan Party
NBCI Non‐bank Credit Institution
NFES National Fund for Entrepreneurship Support
NPL Non‐performing loan
OECD Organization for Economic Cooperation and Development
OPEC Organization of Petroleum Exporting Countries
OTC Over the counter
PAR Portfolio at risk
PE Private equity
PPP Purchasing power parity
ROAA Return on average assets
ROAE Return on average equity
SEAF Small Enterprise Assistance Funds
SME Small and Medium Enterprise
SOCAR State Oil Company of Azerbaijan
US United States
USAID United States Agency for International Development
VAT Value added tax
VC Venture capital
WTO World Trade Organization
YE Year end
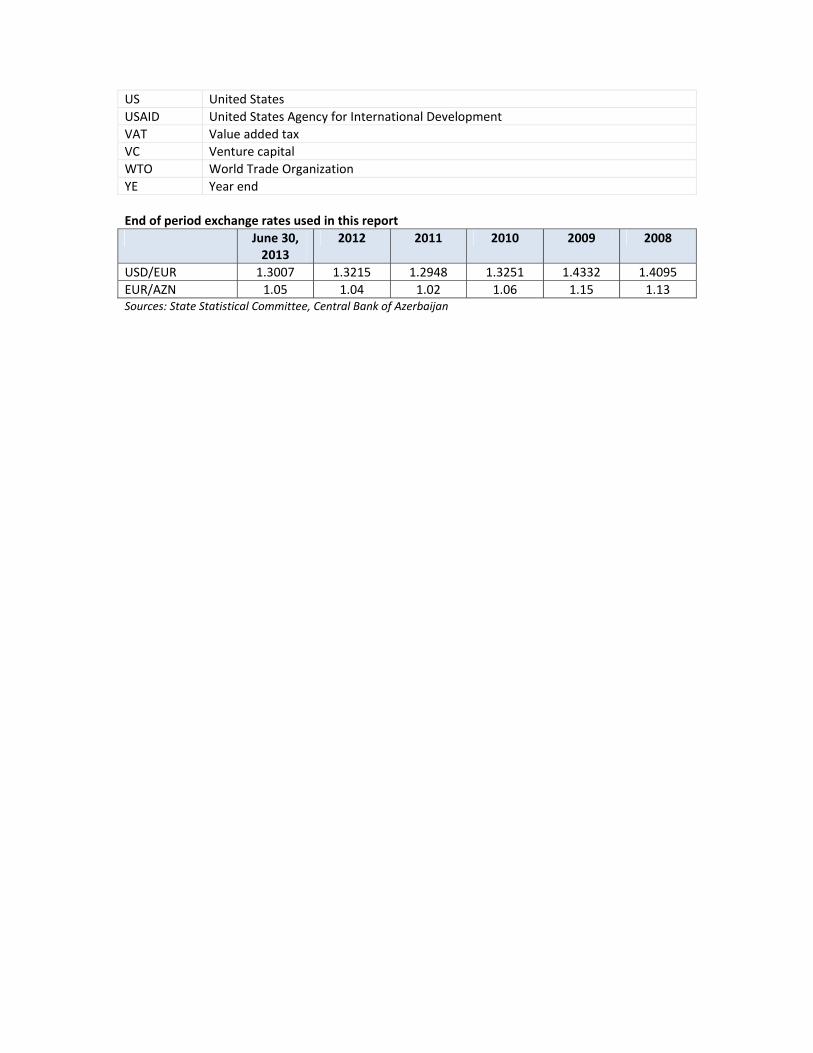
End of period exchange rates used in this report
June 30, 2013
2012 2011 2010 2009 2008
USD/EUR 1.3007 1.3215 1.2948 1.3251 1.4332 1.4095
EUR/AZN 1.05 1.04 1.02 1.06 1.15 1.13 Sources: State Statistical Committee, Central Bank of Azerbaijan

PRIVATE SECTOR FINANCING IN THE EASTERN PARTNERSHIP COUNTRIES AND THE ROLE OF RISK‐BEARING INSTRUMENTS
Country Report: Azerbaijan Page 1
ABOUT THIS REPORT
This report is one of a series of reports produced by Business & Finance Consulting GmbH (BFC) for European Investment Bank (EIB) as part of the project “Private Sector Financing In The Eastern Partnership Countries And The Role Of Risk‐bearing Instruments.” The series of reports includes individual country reports on Armenia, Azerbaijan, Georgia, Moldova, and Ukraine, as well as a synthesis report which considers the results from all five countries. The purpose of the project is to assess the financing needs of SMEs in the Eastern Partnership countries and identify market failures that prevent the development of the SME sector. The project was carried out from June 3, 2013 to November 1, 2013 by a team of four experts from BFC. Onsite visits were conducted for each country in order to meet with representatives from financial institutions, development institutions, the government, and other relevant actors who can comment on the SME sector and its access to finance. The visit to Azerbaijan took place from July 15 to July 23, 2013, during which time meetings were held with representatives from 21 organizations, including 14 local financial institutions, 5 international development institutions, one government body, and one association. The authors take full responsibility for the contents of this report. The opinions expressed do not necessarily reflect the view of the European Investment Bank. The study is financed under the Eastern Partnership Technical Assistance Trust Fund.
PRIVATE SECTOR FINANCING IN THE EASTERN PARTNERSHIP COUNTRIES AND THE ROLE OF RISK‐BEARING INSTRUMENTS
Country Report: Azerbaijan Page 2
1. EXECUTIVE SUMMARY
Economic conditions in Azerbaijan are generally conducive to the development of the SME sector. Tremendous oil wealth has led to rapid growth in all areas of the economy and muted the effects of the global financial crisis, which was less severe in Azerbaijan than in many neighboring countries. The fiscal position of the government is quite strong thanks to the oil sector, enabling it to redirect resources to the development of the regions and other sectors of the economy, as well as maintain a stable exchange rate. Inflation has been moderate to low in recent years, but the well‐being of the economy is heavily dependent on changes in oil prices. In certain business activities, the alleged presence of large, politically connected businesses which unfairly inhibit competition can create major risks and additional hurdles for SMEs. The Azerbaijan financial sector consists of 181 licensed institutions which can grant loans, including 43 banks, 108 credit unions, and 30 other non‐bank credit institutions (NBCIs), most of which are MFIs. Banks are the dominant players in the sector, accounting for 95% of total assets. There are two private equity firms operating in Azerbaijan, and a foreign PE fund is expected to enter the market later in 2013. The financial sector grew rapidly in the mid‐2000s, consistent with the country’s rapid economic growth, and has managed to continue to grow, although at a more moderate pace, following the 2008 global financial crisis. Since that time, the performance of banks has deteriorated somewhat, with the banking sector posting an overall loss in 2011, mainly in connection with poor portfolio quality and the associated loan loss provisions. In 2013 lenders are poised for solid growth and improving profitability. Official government statistics report that there were 224,830 micro and small enterprises at the end of 2011, the largest proportion of which are engaged in trade and located in Baku. The SME sector is healthy in terms of profitability and growth, following some weakness in 2009 and 2010 as a result of the global slowdown. Great improvements have been made in the regulatory and institutional environment for SMEs in the past ten years, although some constraints remain, such as a confusing system of permits and licenses, a slow and expensive customs system, and weaknesses in resolving insolvency. The demand for loans from micro and small businesses in Azerbaijan is estimated at roughly EUR 3.5 billion, which is equivalent to 6.8% of 2012 GDP and 28.8% of the outstanding loans of all financial institutions in Azerbaijan at year‐end 2012. In terms of supply, bank loans are by far the main source of funding to SMEs. A number of MFIs have introduced small business lending in recent years, but the overall supply of MFI lending to SMEs is limited. The leasing, credit union, and private equity sectors make a relatively minor contribution to SME funding. Trade finance products such as letters of credit and guarantees comprise a small proportion of total SME funding, with most trade finance activity dominated by the country’s largest bank; however, demand for such products among SMEs is growing. SME funding recipients tend to be engaged in trading, although the agriculture and service sectors are also well represented. A significant majority of recipients are male and are located in Baku. Financial intermediaries generally have ample access to funding to support SME portfolio growth, although a few leasing companies and some of the smaller banks and MFIs have experienced fund‐raising difficulties in recent years. There are no government programmes lending directly to SMEs, but the government actively supports the sector through various on‐lending funds. The main gaps in the financing of SMEs are noted for agricultural enterprises, rural enterprises (especially in remote areas), and enterprises without real estate to offer as collateral.
PRIVATE SECTOR FINANCING IN THE EASTERN PARTNERSHIP COUNTRIES AND THE ROLE OF RISK‐BEARING INSTRUMENTS
Country Report: Azerbaijan Page 3
2. MACROECONOMIC ENVIRONMENT
Conclusion: Economic conditions in Azerbaijan are generally conducive to the development of the SME sector, with high non‐oil GDP growth, a historically stable exchange rate, a strong fiscal position, political stability, and substantial government support of the non‐oil sector. However, close relationships between the government and certain large business groups may result in challenging competitive conditions. Key findings:
Non‐oil GDP growth has been consistently high in recent years, with the exception of a dip to 3.7% in 2009 at the peak of the global financial crisis.
The most unique feature of the structure of Azerbaijan’s economy is the dominance of the oil sector; most SMEs have minimal direct exposure to the oil sector.
The economy is reportedly heavily influenced by large, politically connected business groups which use their connections and wealth to inhibit competition from SMEs in certain sectors.
Although overall inflation has been moderate in recent years, the price of food products has been somewhat volatile.
Thanks to its oil production, Azerbaijan runs an enormous trade surplus equivalent to 41.1% of GDP, which in turn drives a 27.7% surplus in the current account.
As a result of its revenues from the oil sector, the government’s fiscal position is strong, characterized by a small budget deficit, low public debt, and high international reserves.
Key macroeconomic indicators for the country are presented in Annex 1. Unless otherwise noted, all data in this section is taken from the State Statistical Committee of Azerbaijan or the Central Bank of Azerbaijan’s Statistical Bulletin.
2.1 Economic development and growth
Although the rapid GDP growth that occurred in Azerbaijan in the mid‐2000s was primarily driven by the oil sector, it ultimately led to strong growth in all sectors of the economy, benefiting SMEs as well as oil companies. Oil wealth helped mitigate the negative impact of the global financial crisis, with solid growth observed from 2008 to 2010. Real GDP growth was slow in 2011 (0.1%) and 2012 (2.2%), but these weak results were driven by repairs on the main oil pipeline, which limited total output. Non‐oil GDP growth has been consistently high in recent years, with the exception of a dip to 3.7% in 2009 at the peak of the global financial crisis. The economy is on pace for another good year in 2013, with 10.9% non‐oil growth in the first half of the year. Oil production is anticipated to peak in 2015, after which the government support to the non‐oil sector and the associated trickle‐down benefits to SMEs may moderate or even reduce.1 Real GDP growth rate for by sector
Sector H1 2013 2012 2011 2010 2009 2008
Oil and gas sector n/a ‐5.0% ‐9.3% 1.8% 14.0% 6.8%
Non‐oil sectors 10.9% 9.7% 9.4% 7.9% 3.7% 15.9%
Overall 5.0% 2.2% 0.1% 5.0% 9.3% 10.8%Source: Central Bank of Azerbaijan Statistical Bulletin
1 Asian Development Bank. “Azerbaijan: Financial Sector Assessment”. ADB Central and West Asia Working Paper Series, 2012.
PRIVATE SECTOR FINANCING IN THE EASTERN PARTNERSHIP COUNTRIES AND THE ROLE OF RISK‐BEARING INSTRUMENTS
Country Report: Azerbaijan Page 4
Economic growth has led to rapidly rising incomes, which creates opportunities for SMEs in the consumer goods sector. Nominal GDP per capita was EUR 5,523 in 2012 (EUR 8,039 on a PPP basis), up from EUR 3,995 in 2008 (EUR 6,180 on a PPP basis). In 2008, the last year that it was calculated by the World Bank, the Gini coefficient stood at 34%, higher than Armenia (31%) but lower than Georgia (42%), suggesting that income inequality is not a severe problem. Unemployment is relatively low at 5.4% in 2011, and extreme poverty has been mostly eradicated, with 0.4% of the population earning less than USD 1.25 per day in 2008.2
2.2 The structure of the economy
The most unique feature of the structure of Azerbaijan’s economy is the dominance of the oil sector, which accounted for 51.5% of GDP in 2012. Some SMEs which provide relocation services and catering services have positioned themselves to work directly with oil companies. Other SMEs operating in a variety of fields have set up business along the pipeline to serve the communities of pipeline workers. However, most SMEs have no such direct exposure to the oil sector, instead benefiting indirectly from the trickle‐down effects of higher income of oil sector employees and increased government revenues. Annex 1 presents the breakdown of GDP by sector. Aside from oil production, which is included in the “industry and manufacturing” category, other sectors account for less than 10% of GDP each. Construction is a major contributor to GDP at 9.2%. The slowdown in construction activity which followed the global financial crisis in 2008 negatively affected many SMEs which provided construction‐related products and services. Agriculture contributes just 5.2% of GDP despite employing 37.9% of the labor force, highlighting the need for further support of SMEs in this sector. SOEs accounted for 17.5% of GDP in 2011, according to the State Statistical Committee. Over time, the role of SOEs in the economy is gradually decreasing – by comparison, SOEs contributed 52% of GDP in 1996 and 26.5% in 2004. The involvement of SOEs is particularly high in the construction, transportation, and communications sectors, contributing roughly 25‐30% of output within those sectors. The economy is reportedly heavily influenced by large, politically connected business groups which use their connections and wealth to inhibit competition from SMEs, which in turn discourages innovation. This contributes to Azerbaijan’s low rank of 139 out of 176 on Transparency International’s Corruption Perceptions Index.3 As reported by the US Department of State, “Politically connected businesses benefit from government regulatory and other decisions to achieve effective control over lucrative sectors of the economy.”4 To the extent that this characterization is accurate, it potentially represents the main structural challenge for SMEs in Azerbaijan, particularly for medium‐sized enterprises with further growth aspirations.
2.3 Inflation and asset prices
Following high consumer price inflation of 16.7% in 2007 and 20.8% in 2008 during the peak of the country’s economic boom, inflation has moderated, averaging 4.0% annually from 2009 to 2012. The first half of 2013 saw inflation of just 2.0% compared to the first half of 2012. Although overall inflation has been moderate in recent years, the price of food products has been somewhat volatile,
2 World Bank, World Development Indicators 3 http://www.transparency.org/country#AZE 4 United States Department of State. “2013 Investment Climate Statement.” March 2013.
PRIVATE SECTOR FINANCING IN THE EASTERN PARTNERSHIP COUNTRIES AND THE ROLE OF RISK‐BEARING INSTRUMENTS
Country Report: Azerbaijan Page 5
fluctuating from 10.4% in 2011 to 0.8% in 2012, creating a challenging environment for the many SMEs engaging in food production, processing and related services. Real estate prices declined in 2009 by 20‐30% in connection with the global financial crisis, but have since recovered to their former levels. The CBA reports that turnover in residential real estate increased 35% in the first half of 2013 compared to the first half of 2012. The recovery of the real estate market is critical for SMEs connected to the construction sector, such as trading enterprises which sell construction materials.
2.4 Balance of payments
Thanks to its oil production, Azerbaijan runs an enormous trade surplus equivalent to 41.1% of GDP in 2012, which in turn drives a 27.7% surplus in the current account. Oil and gas exports of EUR 29.5 billion accounted for 94.1% of total exports in 2012. Outside of the oil sector, however, the picture is quite different, with a non‐oil trade deficit equivalent to 13.8% of GDP in 2012. Rising incomes have led to strong demand for high‐quality foreign goods and luxury items. It is relatively less capital intensive and less risky for SMEs to engage in import trade to satisfy this demand rather than try to engage in manufacturing operations to produce products of comparable quality. Azerbaijan has free trade agreements in effect with Georgia, Russia, Moldova and Ukraine. Agreements with Kazakhstan, Uzbekistan, and Turkmenistan are signed but not yet in effect.5 The country is not yet a member of WTO, despite first applying for membership in 1997; the latest round of bilateral negotiations was held from June to July 2013. Foreign direct investment has been a significant contributor to Azerbaijan’s economic growth in recent years. Gross FDI inflows of EUR 5.2 billion represented a substantial 9.8% of GDP in 2012 and were up significantly from EUR 4.3 million in 2011. Historically, a large part of FDI inflows are attributable to the oil sector, including in 2012, so it is unlikely that SMEs have directly benefited on a meaningful scale.
2.5 The fiscal and political situation
As a result of its revenues from the oil sector, the government’s fiscal position is strong. In the past five years, it ran a surplus in 2009 and 2010 and only small deficits in the other years (with deficits not exceeding 0.6% of GDP in any year). External public debt represented just 7.5% of GDP in 2011.6 For SMEs, this provides some assurance that the government will not need to raise taxes to generate revenues in the near future. The country’s foreign exchange reserves, including both central bank reserves and reserves of the State Oil Fund, are very high at EUR 34.7 billion at the end of 2012, representing 67% of GDP. The government has used its strong reserve position to support exchange rate stability. In 2011, USD 4 billion was sterilized to prevent the appreciation of the manat. As a result, annual changes in the EUR‐AZN exchange rate have been less than ±10% over the past four years, with virtually no change in the USD‐AZN rate.7 Exchange rate stability has an overall positive effect on the economy and the SME sector; in particular, exporters have benefited, since without intervention the manat would have strengthened significantly.
5 Asian Development Bank, Asia Regional Integration Center. aric.adb.org. 6 World Bank, World Development Indicators. 7 The manat was allowed to strengthen against the dollar gradually from 2004‐2008 by roughly 20%, but since then has been held stable.
PRIVATE SECTOR FINANCING IN THE EASTERN PARTNERSHIP COUNTRIES AND THE ROLE OF RISK‐BEARING INSTRUMENTS
Country Report: Azerbaijan Page 6
Azerbaijan’s political environment is stable. President Ilham Aliyev, who was been in power since 2003, is expected to win the October 2013 presidential elections with no serious opposition. The previous presidential elections in 2008 were boycotted by the opposition, and presidential term limits were abolished in 2009. The president’s New Azerbaijan Party (NAP) holds a significant majority in parliament, with other MPs generally voting in line with the NAP. The main opposition parties have very little representation in parliament.
PRIVATE SECTOR FINANCING IN THE EASTERN PARTNERSHIP COUNTRIES AND THE ROLE OF RISK‐BEARING INSTRUMENTS
Country Report: Azerbaijan Page 7
3. FINANCIAL SECTOR OVERVIEW
Conclusion: The Azeri financial sector is dominated by its banks, which have generally performed well in recent years, although profitability has been weak since 2010. The level of overall financial intermediation is somewhat low, but the sector is poised for strong growth in the coming years. Key findings:
Banks are the dominant players in the financial sector, accounting for 95% of total assets.
The overall level of financial intermediation in Azerbaijan is low, with a ratio of loans to GDP of 22.7% in 2012 and a ratio of deposits to GDP of 14.3%
Regulatory and institutional conditions for lenders are generally good and do not present serious impediments to sector growth.
The banking sector is currently characterized by high capital adequacy and good liquidity, but profitability is somewhat weak following overall losses in the banking sector in 2011. The MFI sector is performing well overall.
The leasing sector is under‐developed, hampered by tax disadvantages in comparison with lending.
The private equity sector consists of two firms, both locally registered and with full or partial government ownership.
3.1 Financial sector overview
The Azerbaijan financial sector consists of 181 licensed institutions which can grant loans, including 43 banks, 108 credit unions, and 30 other non‐bank credit institutions (NBCIs), most of which are MFIs. Banks are the dominant players in the sector, accounting for about 95% of total assets. There are two private equity firms operating in Azerbaijan, and a foreign PE fund is expected to enter the market later in 2013. The financial sector grew rapidly in the mid‐2000s, consistent with the country’s rapid economic growth, and has managed to continue to grow, although at a more moderate pace, following the 2008 global financial crisis. Since that time, the performance of banks has deteriorated somewhat, mainly in connection with poor portfolio quality and the associated loan loss provisions. In 2013 lenders are poised for solid growth and improving profitability. The overall level of financial intermediation in Azerbaijan is low, with a ratio of loans to GDP of 22.7% in 2012, up from 17.9% in 2008, and a ratio of deposits to GDP of 14.3% in 2012, up from 10.1% in 2008. However, more than half of GDP is attributable to the oil sector, which operates like a closed system, since nearly all funding comes from international sources. Therefore, a better metric of financial intermediation may be loans and deposits to non‐oil GDP. These ratios for 2012 were 46.8% (loans) and 29.5% (deposits), much higher than the previous calculation and in line with the other Eastern Partnership countries. Regulatory and institutional conditions for lenders are generally good and do not present serious impediments to sector growth, although the sector would benefit from the establishment of a collateral registry for movable property. Minimum capital requirements for banks will increase from AZN 10 million (about EUR 10 million) to 50 million on January 1, 2014, which may result in the closure of some of the smallest banks.
PRIVATE SECTOR FINANCING IN THE EASTERN PARTNERSHIP COUNTRIES AND THE ROLE OF RISK‐BEARING INSTRUMENTS
Country Report: Azerbaijan Page 8
3.2 Banking sector8
Key banking sector indicators are presented in Annex 2. The list of the largest banks in Azerbaijan is presented in Annex 5.
3.2.1 Structure
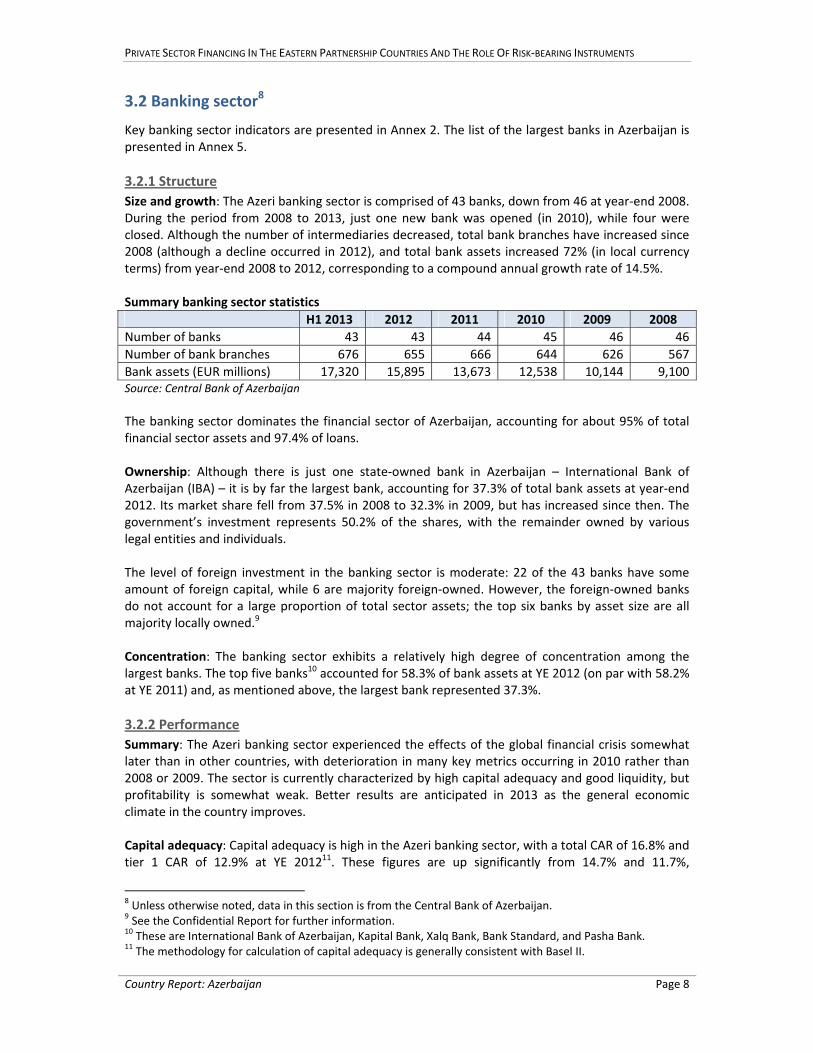
Size and growth: The Azeri banking sector is comprised of 43 banks, down from 46 at year‐end 2008. During the period from 2008 to 2013, just one new bank was opened (in 2010), while four were closed. Although the number of intermediaries decreased, total bank branches have increased since 2008 (although a decline occurred in 2012), and total bank assets increased 72% (in local currency terms) from year‐end 2008 to 2012, corresponding to a compound annual growth rate of 14.5%. Summary banking sector statistics
H1 2013 2012 2011 2010 2009 2008
Number of banks 43 43 44 45 46 46
Number of bank branches 676 655 666 644 626 567
Bank assets (EUR millions) 17,320 15,895 13,673 12,538 10,144 9,100Source: Central Bank of Azerbaijan
The banking sector dominates the financial sector of Azerbaijan, accounting for about 95% of total financial sector assets and 97.4% of loans. Ownership: Although there is just one state‐owned bank in Azerbaijan – International Bank of Azerbaijan (IBA) – it is by far the largest bank, accounting for 37.3% of total bank assets at year‐end 2012. Its market share fell from 37.5% in 2008 to 32.3% in 2009, but has increased since then. The government’s investment represents 50.2% of the shares, with the remainder owned by various legal entities and individuals. The level of foreign investment in the banking sector is moderate: 22 of the 43 banks have some amount of foreign capital, while 6 are majority foreign‐owned. However, the foreign‐owned banks do not account for a large proportion of total sector assets; the top six banks by asset size are all majority locally owned.9 Concentration: The banking sector exhibits a relatively high degree of concentration among the largest banks. The top five banks10 accounted for 58.3% of bank assets at YE 2012 (on par with 58.2% at YE 2011) and, as mentioned above, the largest bank represented 37.3%.
3.2.2 Performance
Summary: The Azeri banking sector experienced the effects of the global financial crisis somewhat later than in other countries, with deterioration in many key metrics occurring in 2010 rather than 2008 or 2009. The sector is currently characterized by high capital adequacy and good liquidity, but profitability is somewhat weak. Better results are anticipated in 2013 as the general economic climate in the country improves. Capital adequacy: Capital adequacy is high in the Azeri banking sector, with a total CAR of 16.8% and tier 1 CAR of 12.9% at YE 201211. These figures are up significantly from 14.7% and 11.7%,
8 Unless otherwise noted, data in this section is from the Central Bank of Azerbaijan. 9 See the Confidential Report for further information. 10 These are International Bank of Azerbaijan, Kapital Bank, Xalq Bank, Bank Standard, and Pasha Bank. 11 The methodology for calculation of capital adequacy is generally consistent with Basel II.
PRIVATE SECTOR FINANCING IN THE EASTERN PARTNERSHIP COUNTRIES AND THE ROLE OF RISK‐BEARING INSTRUMENTS
Country Report: Azerbaijan Page 9
respectively, at YE 2011. The Central Bank of Azerbaijan’s announcement of an increase in minimum capital requirements (see below) has caused many smaller banks to scramble to raise capital, which should continue to push up average CAR figures in 2013. Profitability: Banks experienced somewhat weak profitability in 2012, with an ROAA of 0.9% and ROAE of 5.6%. This represents a recovery from 2011, when the banking sector suffered losses equivalent to ‐1.2% of average assets, driven mainly by high loan loss provisions. Much of the loss in 2011 was attributable to one bank which lost nearly EUR 50 million. The banking sector had enjoyed high profitability until 2010, when ROAA dropped to 1.0% following a strong 2.3% in 2009. Liquidity: The liquidity position of Azeri banks was moderate at YE 2012. At that time liquid assets represented 15% of total assets and 67% of current liabilities, down from 17% and 79%, respectively, at YE 2011. Banks rely heavily on borrowing to fund their loan portfolios, as evidenced by a net loan to deposit ratio of 138.5% at YE 2012. This reliance on borrowing generally does not expose the banks to excessive liquidity risk, however, as a large proportion of borrowings comes from development finance institutions and from the government, which lend at longer maturities and are not likely to dramatically reduce funding during difficult periods. This partly explains why banks’ liquidity positions remained mostly stable throughout the crisis. Another factor in funding stability is the consistent growth of customer deposits, which increased by 29.2% in 2011 and 15.5% in 201212. Credit risk: The central bank reports that banks’ portfolio quality is at an acceptable level and has been stable in recent years, with a rate of overdue loans of 6.5% at YE 2012, up just slightly from 6.4% at YE 2011.13 Several financial institutions reported that many of the problem loans on their books are legacy loans which are several years old, and that the portfolio of more recent loans is in relatively better condition. Loan portfolio growth has slowed in recent years after extremely high growth in the boom years of the mid‐2000s (e.g. 55% growth14 in 2008). Loan growth was particularly slow in 2011 (3.2%) as banks attempted to focus on portfolio quality, then picked up again in 2012 with growth of 20.7%. In the first six months of 2013, loan growth accelerated further to 35.0% on an annualized basis. The main credit‐related risk at present is the aggressive expansion of banks’ consumer lending portfolios. In an effort to secure market share quickly in this segment, some banks may be compromising their credit quality standards, which could lead to higher NPLs in the future. Market and other risk: As a result of CBA intervention in currency markets to maintain the stability of the manat and relatively strict limits for banks’ open foreign currency positions, the Azeri banking sector has not suffered significant currency‐related losses in recent years. Nevertheless, the level of lending and deposit‐taking in foreign currencies is substantial. 39.6% of deposits were denominated in foreign currency at year‐end 2012, down from 43.1% a year earlier. Foreign currency loans accounted for 33% of all loans at year‐end 2012.
3.2.3 Regulation and state support
The regulatory framework is generally conducive to the development of the banking sector, and the state has provided effective, timely support to banks in the past in times of stress. Banking regulations are mostly in line with international standards, with no unusually burdensome requirements. The most significant institutional constraint noted by banks is the absence of a collateral registry system for movable collateral (other than vehicles). As a result, collateral requirements tend to be somewhat strict in Azerbaijan. Most lenders require that a significant
12 Growth rates are calculated on a local currency basis. 13 See the confidential report for further information. 14 All growth figures are calculated based on net loans in local currency terms.
PRIVATE SECTOR FINANCING IN THE EASTERN PARTNERSHIP COUNTRIES AND THE ROLE OF RISK‐BEARING INSTRUMENTS
Country Report: Azerbaijan Page 10
portion of the loan value be covered by real estate collateral, and several only accept real estate collateral in practice. A draft law for a movable collateral registry has been prepared in consultation with IFC. A few other constraints are present, although they are less critical than the collateral registry issue. The public credit bureau, which is managed by the central bank, does not include information from public utilities, cell phone companies, and other providers which would be relevant for assessing credit risk and avoidance of over‐indebtedness. There is currently an effort underway to start Azerbaijan’s first private bureau, which may help to resolve this issue. Another constraint is the slow time to resolve bankruptcy and low average recovery rates (2.7 years and 30.6 cents on the dollar, respectively, according to World Bank’s Doing Business 2013), which discourages lending, particularly to higher risk applicants such as startup companies. The most significant upcoming regulatory change for banks is the increase in minimum capital requirements from AZN 10 million at present to AZN 50 million, effective January 1, 2014. The purpose of this change is to encourage consolidation in the banking sector. However, at the time of writing, no serious merger talks have taken place and it is unclear to what extent consolidation will happen, if at all. Most of the banks below the limit have been aggressively raising capital in order to meet the requirement. The state has been active and effective in providing support to the banking sector during challenging periods. In particular, the CBA and the government reacted quickly to the change in global economic and financial conditions in 2008. Some of the key measures they took to ensure bank stability and encourage lending are as follows:
Reserve requirements were reduced, from 12% in late 2008 to just 0.5% in early 2009, in order to stimulate bank lending. The reserve requirement currently stands at 3% of deposits.
The CBA refinancing rate was reduced from 13% at year‐end 2007 to 2% at year‐end 2009, after which it has gradually increased.
The deposit insurance program was broadened.
The government gave direct support to large borrowers with payment difficulties, thus benefiting the banks with exposure to them.15
The list of prudential ratios for banks applied by the central bank is presented in Annex 3. A short description of key regulations is presented in Annex 4.
3.2.4 Funding
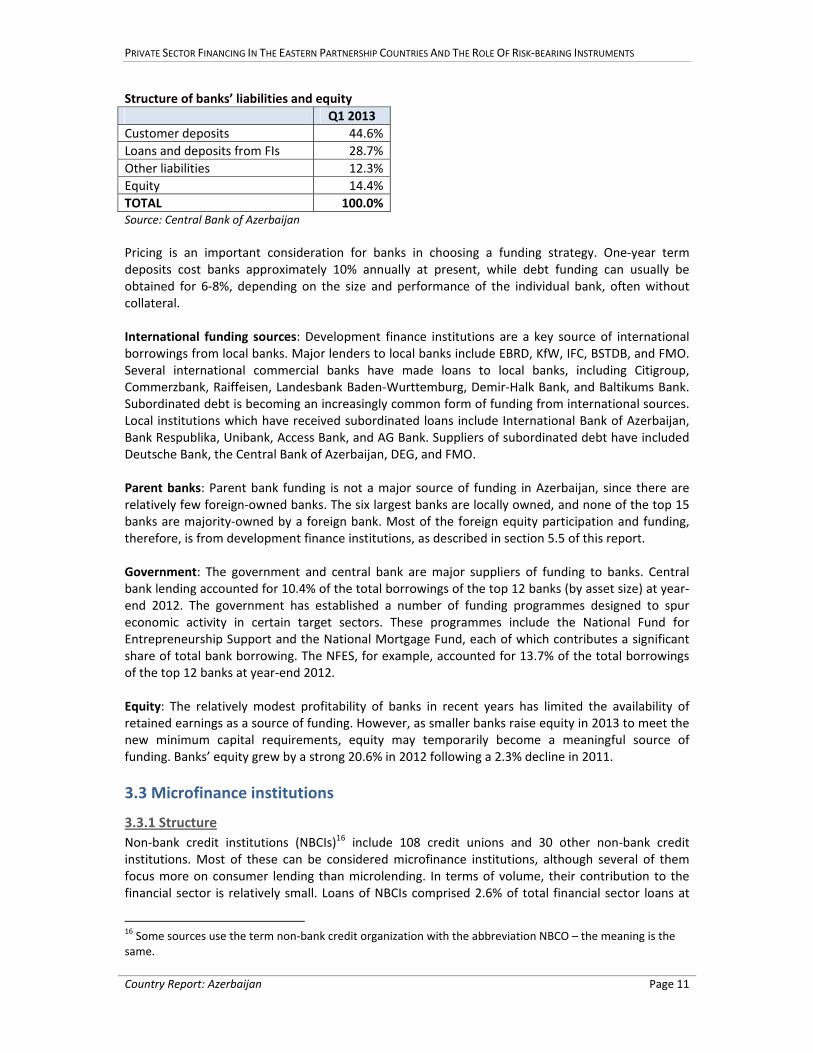
Deposits: Customer deposits are the largest source of funding for banks, but they account for less than half of banks’ total liabilities and equity. With a net loan to deposit ratio of 137% at Q1 2013, banks rely heavily on borrowing in addition to deposits to fund their loan portfolios. This is not surprising given the low ratio of customer deposits to GDP in Azerbaijan of 14.3% at year‐end 2012; a very high proportion of savings are held outside of the banking system in the form of cash. Nevertheless, deposit growth rates have been high in recent years (with the exception of 5.9% growth in 2009), providing a stable source of funding for loan portfolio growth. The structure of banks’ liabilities and equity at Q1 2013 was as follows:
15 Asian Development Bank. “Azerbaijan: Financial Sector Assessment”. ADB Central and West Asia Working Paper Series, 2012.
PRIVATE SECTOR FINANCING IN THE EASTERN PARTNERSHIP COUNTRIES AND THE ROLE OF RISK‐BEARING INSTRUMENTS
Country Report: Azerbaijan Page 11
Structure of banks’ liabilities and equity
Q1 2013
Customer deposits 44.6%
Loans and deposits from FIs 28.7%
Other liabilities 12.3%
Equity 14.4%
TOTAL 100.0%Source: Central Bank of Azerbaijan
Pricing is an important consideration for banks in choosing a funding strategy. One‐year term deposits cost banks approximately 10% annually at present, while debt funding can usually be obtained for 6‐8%, depending on the size and performance of the individual bank, often without collateral. International funding sources: Development finance institutions are a key source of international borrowings from local banks. Major lenders to local banks include EBRD, KfW, IFC, BSTDB, and FMO. Several international commercial banks have made loans to local banks, including Citigroup, Commerzbank, Raiffeisen, Landesbank Baden‐Wurttemburg, Demir‐Halk Bank, and Baltikums Bank. Subordinated debt is becoming an increasingly common form of funding from international sources. Local institutions which have received subordinated loans include International Bank of Azerbaijan, Bank Respublika, Unibank, Access Bank, and AG Bank. Suppliers of subordinated debt have included Deutsche Bank, the Central Bank of Azerbaijan, DEG, and FMO. Parent banks: Parent bank funding is not a major source of funding in Azerbaijan, since there are relatively few foreign‐owned banks. The six largest banks are locally owned, and none of the top 15 banks are majority‐owned by a foreign bank. Most of the foreign equity participation and funding, therefore, is from development finance institutions, as described in section 5.5 of this report. Government: The government and central bank are major suppliers of funding to banks. Central bank lending accounted for 10.4% of the total borrowings of the top 12 banks (by asset size) at year‐end 2012. The government has established a number of funding programmes designed to spur economic activity in certain target sectors. These programmes include the National Fund for Entrepreneurship Support and the National Mortgage Fund, each of which contributes a significant share of total bank borrowing. The NFES, for example, accounted for 13.7% of the total borrowings of the top 12 banks at year‐end 2012. Equity: The relatively modest profitability of banks in recent years has limited the availability of retained earnings as a source of funding. However, as smaller banks raise equity in 2013 to meet the new minimum capital requirements, equity may temporarily become a meaningful source of funding. Banks’ equity grew by a strong 20.6% in 2012 following a 2.3% decline in 2011.
3.3 Microfinance institutions
3.3.1 Structure
Non‐bank credit institutions (NBCIs)16 include 108 credit unions and 30 other non‐bank credit institutions. Most of these can be considered microfinance institutions, although several of them focus more on consumer lending than microlending. In terms of volume, their contribution to the financial sector is relatively small. Loans of NBCIs comprised 2.6% of total financial sector loans at
16 Some sources use the term non‐bank credit organization with the abbreviation NBCO – the meaning is the same.
PRIVATE SECTOR FINANCING IN THE EASTERN PARTNERSHIP COUNTRIES AND THE ROLE OF RISK‐BEARING INSTRUMENTS
Country Report: Azerbaijan Page 12
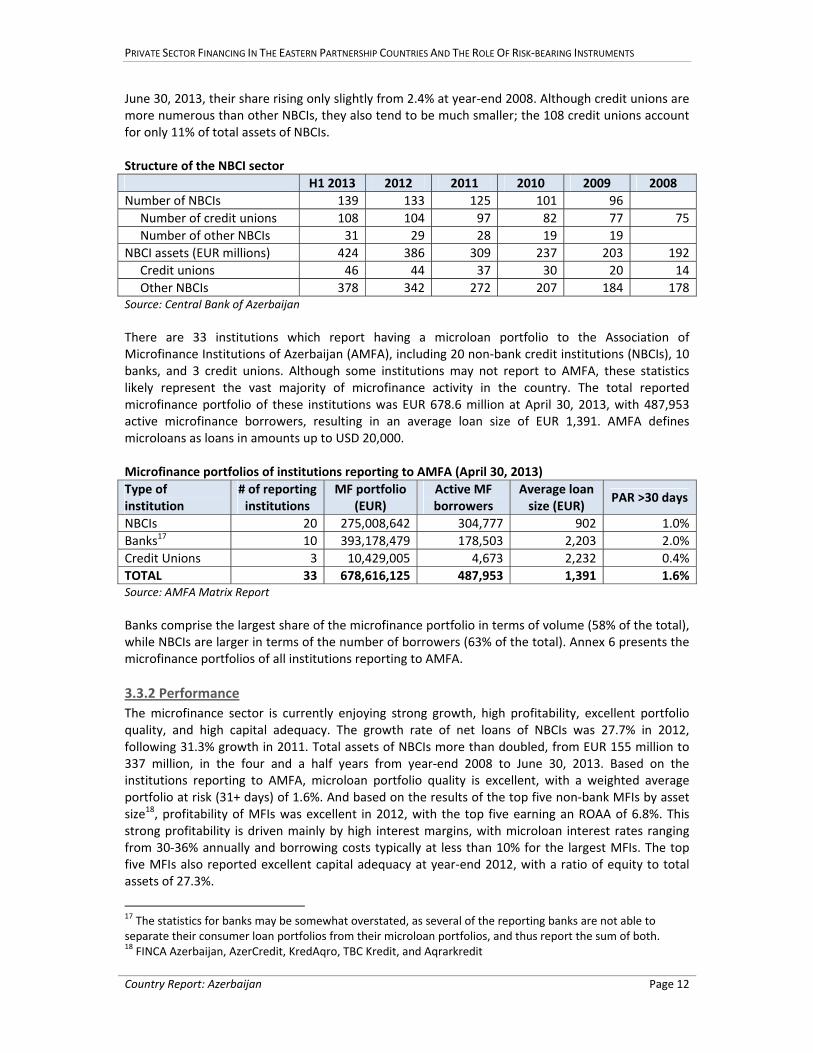
June 30, 2013, their share rising only slightly from 2.4% at year‐end 2008. Although credit unions are more numerous than other NBCIs, they also tend to be much smaller; the 108 credit unions account for only 11% of total assets of NBCIs. Structure of the NBCI sector
H1 2013 2012 2011 2010 2009 2008
Number of NBCIs 139 133 125 101 96
Number of credit unions 108 104 97 82 77 75
Number of other NBCIs 31 29 28 19 19
NBCI assets (EUR millions) 424 386 309 237 203 192
Credit unions 46 44 37 30 20 14
Other NBCIs 378 342 272 207 184 178Source: Central Bank of Azerbaijan
There are 33 institutions which report having a microloan portfolio to the Association of Microfinance Institutions of Azerbaijan (AMFA), including 20 non‐bank credit institutions (NBCIs), 10 banks, and 3 credit unions. Although some institutions may not report to AMFA, these statistics likely represent the vast majority of microfinance activity in the country. The total reported microfinance portfolio of these institutions was EUR 678.6 million at April 30, 2013, with 487,953 active microfinance borrowers, resulting in an average loan size of EUR 1,391. AMFA defines microloans as loans in amounts up to USD 20,000. Microfinance portfolios of institutions reporting to AMFA (April 30, 2013)
Type of institution
# of reporting institutions
MF portfolio (EUR)
Active MF borrowers
Average loan size (EUR)
PAR >30 days
NBCIs 20 275,008,642 304,777 902 1.0%
Banks17 10 393,178,479 178,503 2,203 2.0%
Credit Unions 3 10,429,005 4,673 2,232 0.4%
TOTAL 33 678,616,125 487,953 1,391 1.6%Source: AMFA Matrix Report
Banks comprise the largest share of the microfinance portfolio in terms of volume (58% of the total), while NBCIs are larger in terms of the number of borrowers (63% of the total). Annex 6 presents the microfinance portfolios of all institutions reporting to AMFA.
3.3.2 Performance
The microfinance sector is currently enjoying strong growth, high profitability, excellent portfolio quality, and high capital adequacy. The growth rate of net loans of NBCIs was 27.7% in 2012, following 31.3% growth in 2011. Total assets of NBCIs more than doubled, from EUR 155 million to 337 million, in the four and a half years from year‐end 2008 to June 30, 2013. Based on the institutions reporting to AMFA, microloan portfolio quality is excellent, with a weighted average portfolio at risk (31+ days) of 1.6%. And based on the results of the top five non‐bank MFIs by asset size18, profitability of MFIs was excellent in 2012, with the top five earning an ROAA of 6.8%. This strong profitability is driven mainly by high interest margins, with microloan interest rates ranging from 30‐36% annually and borrowing costs typically at less than 10% for the largest MFIs. The top five MFIs also reported excellent capital adequacy at year‐end 2012, with a ratio of equity to total assets of 27.3%.
17 The statistics for banks may be somewhat overstated, as several of the reporting banks are not able to separate their consumer loan portfolios from their microloan portfolios, and thus report the sum of both. 18 FINCA Azerbaijan, AzerCredit, KredAqro, TBC Kredit, and Aqrarkredit
PRIVATE SECTOR FINANCING IN THE EASTERN PARTNERSHIP COUNTRIES AND THE ROLE OF RISK‐BEARING INSTRUMENTS
Country Report: Azerbaijan Page 13
3.3.3 Regulation
There is no specific regulatory definition of microfinance, nor any specific regulation for microfinance institutions. Instead, non‐bank MFIs register as NBCIs. NBCIs are regulated by the Law of the Republic of Azerbaijan on Non‐Banking Credit Institutions, enacted in 2009.19 They are supervised by the Central Bank, which can issue additional rules, such as the prudential guidelines for NBCIs, issued in 2010. The new law and prudential guidelines were partly a response to the increasing commercialization of the microfinance sector, which had more of a humanitarian focus in its early years. Several key features of the law are that NBCIs are not permitted to accept deposits, they can offer various non‐loan products, such as leasing, factoring, and guarantees, and they are required to participate in the central bank’s Centralized Credit Registry, the official credit bureau. In comparison with banks, NBCIs are subject to much more lenient prudential regulations. For example, there are no capital adequacy or liquidity guidelines for NBCIs. The minimum authorized capital for a for‐profit NBCI is AZN 300,000; for non‐profits it is AZN 30,000.
3.3.4 Funding
Since NBCIs cannot accept deposits, they depend on borrowings and equity to fund the growth of their portfolios. The main funding sources are development‐oriented institutions such as EBRD, IFC, KfW, responsAbility, Developing World Markets, Symbiotics, Blue Orchard, Oikocredit, Triodos, and Incofin. NBCIs are much less likely than banks to make use of government funding sources. For example, only one MFI had access to the National Fund for Entrepreneurship Support in 2012. Borrowing conditions are usually medium and long term (3‐5 years) at interest rates ranging from roughly 6‐10% annually, depending on the size of the loan and the financial performance of the borrower. Most borrowings are in USD, but a few funding sources have offered local currency loans to Azeri MFIs. Subordinated debt is a small but increasingly important source of funding for NBCIs. The three largest NBCIs (FINCA, AzerCredit, and KredAqro) all had some sub‐debt at year‐end 2012 from sources such as Deutsche Bank, IFC, Developing World Markets, and KfW.
3.3 Private equity and venture capital
3.2.1 Sector overview
There are two private equity firms domiciled in Azerbaijan: Azerbaijan Investment Company (AIC) and Caspian International Investment Company (CIIC). AIC was established by the government of Azerbaijan (under the Ministry of Economic Development) and is 100% state‐owned. CIIC was founded by AIC and the Islamic Development Bank with the intention to invest in Azeri firms according to Shariah principles. Neither of these companies manages an investment fund, so outside investors are invited to participate by co‐investing with AIC directly in the investee companies. Co‐investors have included EBRD, the State Oil Company of Azerbaijan (SOCAR), and several industrial companies based in Switzerland, Singapore and Germany. A third entity, the Caucasus Growth Fund (CGF), is expecting to start investing in Azerbaijan in the near future. The CGF is registered in the Cayman Islands and is managed by US‐based Small Enterprise Assistance Funds (SEAF). The CGF will invest in growth‐oriented SMEs in Georgia, Armenia and Azerbaijan, but Azerbaijan is expected to receive the smallest share of the portfolio. The ultimate fund size is expected to be USD 75.0 million. Investors include SEAF itself as well as several DFIs (EBRD, IFC, FMO, and BSTDB). CGF will focus on straight equity investments in more established companies.
19 Credit unions are also considered NBCIs but are regulated by a separate law, the Law of the Republic of Azerbaijan on Credit Unions.
PRIVATE SECTOR FINANCING IN THE EASTERN PARTNERSHIP COUNTRIES AND THE ROLE OF RISK‐BEARING INSTRUMENTS
Country Report: Azerbaijan Page 14
There are no firms or funds engaging in early‐stage venture capital financing.
3.2.2 Ecosystem
Azerbaijan lacks private supporting institutions for venture capital such as incubators or angel investor networks. In the absence of such private sector organizations, the government has taken the leading role in trying to spur the development of private equity and venture capital. The main initiative of the government in this regard was the creation of the AIC, which in turn established the CIIC, the only two private equity firms in Azerbaijan. For the future, the Ministry of Communications and Information Technologies is preparing to open a Regional Innovation Zone in cooperation with Booz Allen Hamilton which will provide office space and other resources to entrepreneurs, similar to an incubator. The Innovation Zone is expected to be operational in 2014.
3.2.3 Regulation
Azerbaijan is characterized by a liberal investment regime with appropriate protections for foreign investors. The World Bank ranks Azerbaijan as 25th among all countries for “protecting investors.”20 The main laws regulating investment are the Law on Investment Activity (1995) and the Law on Protection of Foreign Investments (1992). Investment funds are regulated under the Law on Investment Funds (2010). There are no significant restrictions on foreign investment, other than the prohibition of land ownership by foreigners and restrictions on investment in sectors which are considered vital for national security. Full repatriation of profits on foreign investment after payment of taxes is guaranteed by law. Investment regulation has been greatly simplified in recent years, and there are no special registration requirements or permits needed for foreign investment,21 although firms wishing to hire foreign staff must obtain a license from the Ministry of Labor.
4.4 Other financial sector institutions
4.4.1 Leasing companies
The leasing sector in Azerbaijan is relatively small, consisting of about seven active companies.22 Although banks are permitted to provide leases to customers, only a few do so, and in small volumes. Instead, banks which engage in leasing generally prefer to establish a subsidiary company. Joint Leasing, Unileasing, Standard Leasing, and AG Leasing, which are among the largest leasing companies in Azerbaijan, are all subsidiaries of local banks (respectively: International Bank of Azerbaijan, Unibank, Bank Standard and AG Bank). Other active leasing companies include Parex Leasing, Ansar Leasing, and Qavqaz Leasing. These companies tend to be quite small relative to banks; the largest leasing companies have lease portfolios of less than EUR 50 million. Although the central bank does not maintain statistics on leasing, the OECD reports that leases represented just 0.25% of GDP in 2010, which was about EUR 100 million at the time.23 There is no leasing law in Azerbaijan. Instead, the relevant legislation is in the Civil Code (chapter 38) and Tax Code (Article 140). Previously there was a law on leasing, but in 2006 this was rescinded and most of the relevant legislation was shifted to the Civil Code and Tax Code. The most important
20 World Bank. 2013. Doing Business 2013: Smarter Regulations for Small and Medium‐Size Enterprises. Washington, DC: World Bank Group. 21 See Confidential Report for additional information. 22 There are several other companies present in the market, but they are reportedly either inactive or very small in size. 23 OECD, et al. (2012), SME Policy Index: Eastern Partner Countries 2012: Progress in the Implementation of the Small Business Act for Europe, OECD Publishing.
PRIVATE SECTOR FINANCING IN THE EASTERN PARTNERSHIP COUNTRIES AND THE ROLE OF RISK‐BEARING INSTRUMENTS
Country Report: Azerbaijan Page 15
effect of this change was that leasing lost its special tax status, by which leasing companies were exempted from VAT on imported equipment. This places a significant cost penalty on leasing compared to lending, since companies can benefit from various VAT exemptions when importing equipment for their own use. Access to funding is a constraint to the development of specialized leasing companies, which cannot accept deposits and are thus dependent on their ability to attract debt financing. Due to the small size and mediocre performance of the sector, some leasing companies are struggling to attract funds.
4.4.2 The stock exchange
Trading in equities, corporate bonds, and government securities takes place on the Baku Stock Exchange (BSE), which began operation in 2000. Secondary trading of equities and corporate bonds is limited in volume, and the exchange is mainly used for the issuance of T‐bills and Central Bank notes, of which there were about EUR 214 million outstanding at June 30, 2013. Only one company is listed on the BSE, although trading takes place for a larger group of companies on the OTC market. According to the World Bank, the most active trading of unlisted equity securities surrounds about 500 companies that were privatized in the 1990s.24 Corporate bonds (mostly of banks and leasing companies) are also traded in small volumes. As trading is concentrated among a relatively small group of large companies, the BSE is generally not considered a viable source of capital for medium enterprises which are attempting to scale up.
24 World Bank Group. “Azerbaijan Partnership Program Snapshot.” April 2013.
PRIVATE SECTOR FINANCING IN THE EASTERN PARTNERSHIP COUNTRIES AND THE ROLE OF RISK‐BEARING INSTRUMENTS
Country Report: Azerbaijan Page 16
4. DEMAND ANALYSIS
Conclusion: The SME sector is healthy in terms of profitability and growth, following some weakness in 2009 and 2010 as a result of the global slowdown. Nevertheless, the sector makes a relatively small contribution to the economy, partially due to the size of the oil sector. Great improvements have been made in the regulatory and institutional environment for SMEs in the past ten years. Key findings:
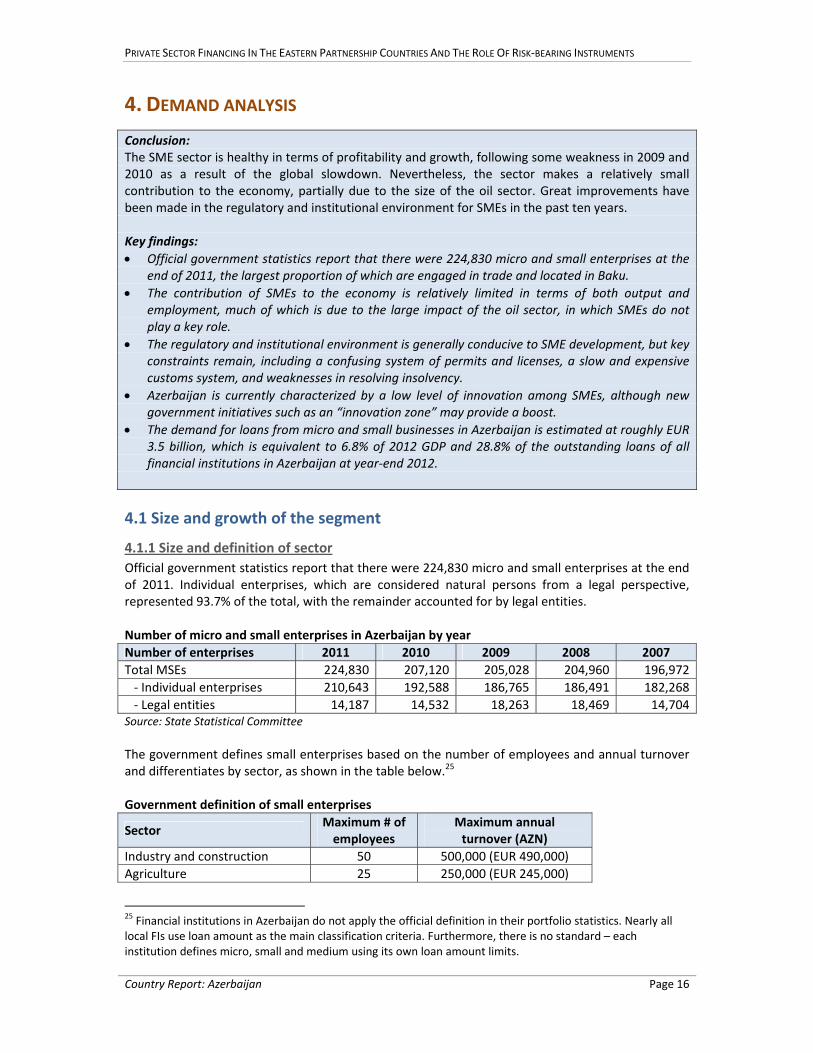
Official government statistics report that there were 224,830 micro and small enterprises at the end of 2011, the largest proportion of which are engaged in trade and located in Baku.
The contribution of SMEs to the economy is relatively limited in terms of both output and employment, much of which is due to the large impact of the oil sector, in which SMEs do not play a key role.
The regulatory and institutional environment is generally conducive to SME development, but key constraints remain, including a confusing system of permits and licenses, a slow and expensive customs system, and weaknesses in resolving insolvency.
Azerbaijan is currently characterized by a low level of innovation among SMEs, although new government initiatives such as an “innovation zone” may provide a boost.
The demand for loans from micro and small businesses in Azerbaijan is estimated at roughly EUR 3.5 billion, which is equivalent to 6.8% of 2012 GDP and 28.8% of the outstanding loans of all financial institutions in Azerbaijan at year‐end 2012.
4.1 Size and growth of the segment
4.1.1 Size and definition of sector
Official government statistics report that there were 224,830 micro and small enterprises at the end of 2011. Individual enterprises, which are considered natural persons from a legal perspective, represented 93.7% of the total, with the remainder accounted for by legal entities. Number of micro and small enterprises in Azerbaijan by year
Number of enterprises 2011 2010 2009 2008 2007
Total MSEs 224,830 207,120 205,028 204,960 196,972
‐ Individual enterprises 210,643 192,588 186,765 186,491 182,268
‐ Legal entities 14,187 14,532 18,263 18,469 14,704Source: State Statistical Committee
The government defines small enterprises based on the number of employees and annual turnover and differentiates by sector, as shown in the table below.25 Government definition of small enterprises
Sector Maximum # of employees
Maximum annual turnover (AZN)
Industry and construction 50 500,000 (EUR 490,000)
Agriculture 25 250,000 (EUR 245,000)
25 Financial institutions in Azerbaijan do not apply the official definition in their portfolio statistics. Nearly all local FIs use loan amount as the main classification criteria. Furthermore, there is no standard – each institution defines micro, small and medium using its own loan amount limits.
PRIVATE SECTOR FINANCING IN THE EASTERN PARTNERSHIP COUNTRIES AND THE ROLE OF RISK‐BEARING INSTRUMENTS
Country Report: Azerbaijan Page 17
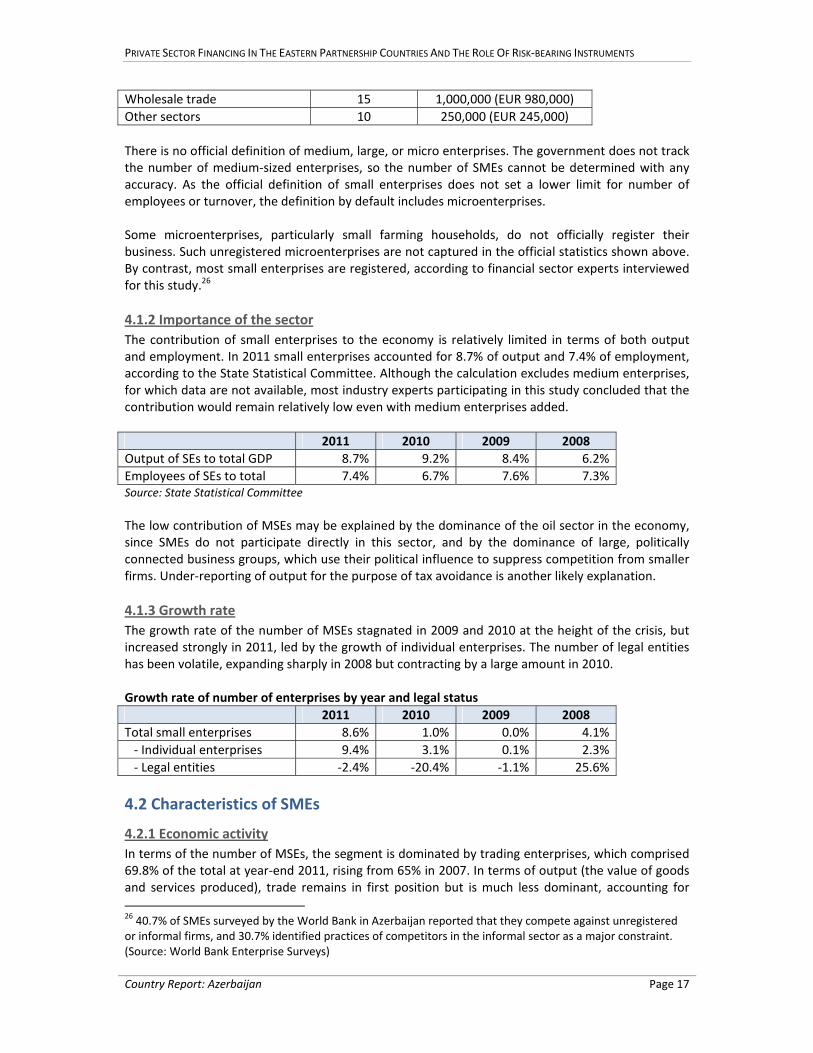
Wholesale trade 15 1,000,000 (EUR 980,000)
Other sectors 10 250,000 (EUR 245,000)
There is no official definition of medium, large, or micro enterprises. The government does not track the number of medium‐sized enterprises, so the number of SMEs cannot be determined with any accuracy. As the official definition of small enterprises does not set a lower limit for number of employees or turnover, the definition by default includes microenterprises. Some microenterprises, particularly small farming households, do not officially register their business. Such unregistered microenterprises are not captured in the official statistics shown above. By contrast, most small enterprises are registered, according to financial sector experts interviewed for this study.26
4.1.2 Importance of the sector
The contribution of small enterprises to the economy is relatively limited in terms of both output and employment. In 2011 small enterprises accounted for 8.7% of output and 7.4% of employment, according to the State Statistical Committee. Although the calculation excludes medium enterprises, for which data are not available, most industry experts participating in this study concluded that the contribution would remain relatively low even with medium enterprises added.
2011 2010 2009 2008
Output of SEs to total GDP 8.7% 9.2% 8.4% 6.2%
Employees of SEs to total 7.4% 6.7% 7.6% 7.3% Source: State Statistical Committee
The low contribution of MSEs may be explained by the dominance of the oil sector in the economy, since SMEs do not participate directly in this sector, and by the dominance of large, politically connected business groups, which use their political influence to suppress competition from smaller firms. Under‐reporting of output for the purpose of tax avoidance is another likely explanation.
4.1.3 Growth rate
The growth rate of the number of MSEs stagnated in 2009 and 2010 at the height of the crisis, but increased strongly in 2011, led by the growth of individual enterprises. The number of legal entities has been volatile, expanding sharply in 2008 but contracting by a large amount in 2010. Growth rate of number of enterprises by year and legal status
2011 2010 2009 2008
Total small enterprises 8.6% 1.0% 0.0% 4.1%
‐ Individual enterprises 9.4% 3.1% 0.1% 2.3%
‐ Legal entities ‐2.4% ‐20.4% ‐1.1% 25.6%
4.2 Characteristics of SMEs
4.2.1 Economic activity
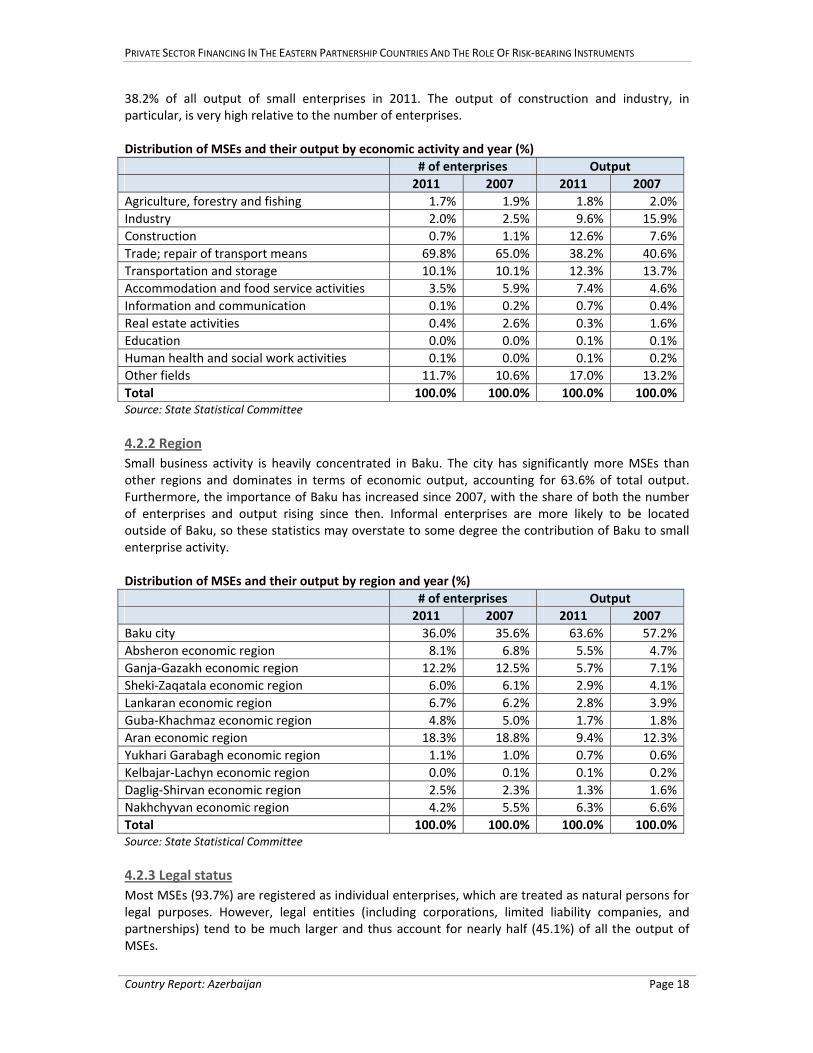
In terms of the number of MSEs, the segment is dominated by trading enterprises, which comprised 69.8% of the total at year‐end 2011, rising from 65% in 2007. In terms of output (the value of goods and services produced), trade remains in first position but is much less dominant, accounting for
26 40.7% of SMEs surveyed by the World Bank in Azerbaijan reported that they compete against unregistered or informal firms, and 30.7% identified practices of competitors in the informal sector as a major constraint. (Source: World Bank Enterprise Surveys)
PRIVATE SECTOR FINANCING IN THE EASTERN PARTNERSHIP COUNTRIES AND THE ROLE OF RISK‐BEARING INSTRUMENTS
Country Report: Azerbaijan Page 18
38.2% of all output of small enterprises in 2011. The output of construction and industry, in particular, is very high relative to the number of enterprises. Distribution of MSEs and their output by economic activity and year (%)
# of enterprises Output
2011 2007 2011 2007
Agriculture, forestry and fishing 1.7% 1.9% 1.8% 2.0%
Industry 2.0% 2.5% 9.6% 15.9%
Construction 0.7% 1.1% 12.6% 7.6%
Trade; repair of transport means 69.8% 65.0% 38.2% 40.6%
Transportation and storage 10.1% 10.1% 12.3% 13.7%
Accommodation and food service activities 3.5% 5.9% 7.4% 4.6%
Information and communication 0.1% 0.2% 0.7% 0.4%
Real estate activities 0.4% 2.6% 0.3% 1.6%
Education 0.0% 0.0% 0.1% 0.1%
Human health and social work activities 0.1% 0.0% 0.1% 0.2%
Other fields 11.7% 10.6% 17.0% 13.2%
Total 100.0% 100.0% 100.0% 100.0%Source: State Statistical Committee
4.2.2 Region
Small business activity is heavily concentrated in Baku. The city has significantly more MSEs than other regions and dominates in terms of economic output, accounting for 63.6% of total output. Furthermore, the importance of Baku has increased since 2007, with the share of both the number of enterprises and output rising since then. Informal enterprises are more likely to be located outside of Baku, so these statistics may overstate to some degree the contribution of Baku to small enterprise activity. Distribution of MSEs and their output by region and year (%)
# of enterprises Output
2011 2007 2011 2007
Baku city 36.0% 35.6% 63.6% 57.2%
Absheron economic region 8.1% 6.8% 5.5% 4.7%
Ganja‐Gazakh economic region 12.2% 12.5% 5.7% 7.1%
Sheki‐Zaqatala economic region 6.0% 6.1% 2.9% 4.1%
Lankaran economic region 6.7% 6.2% 2.8% 3.9%
Guba‐Khachmaz economic region 4.8% 5.0% 1.7% 1.8%
Aran economic region 18.3% 18.8% 9.4% 12.3%
Yukhari Garabagh economic region 1.1% 1.0% 0.7% 0.6%
Kelbajar‐Lachyn economic region 0.0% 0.1% 0.1% 0.2%
Daglig‐Shirvan economic region 2.5% 2.3% 1.3% 1.6%
Nakhchyvan economic region 4.2% 5.5% 6.3% 6.6%
Total 100.0% 100.0% 100.0% 100.0%Source: State Statistical Committee
4.2.3 Legal status
Most MSEs (93.7%) are registered as individual enterprises, which are treated as natural persons for legal purposes. However, legal entities (including corporations, limited liability companies, and partnerships) tend to be much larger and thus account for nearly half (45.1%) of all the output of MSEs.
PRIVATE SECTOR FINANCING IN THE EASTERN PARTNERSHIP COUNTRIES AND THE ROLE OF RISK‐BEARING INSTRUMENTS
Country Report: Azerbaijan Page 19
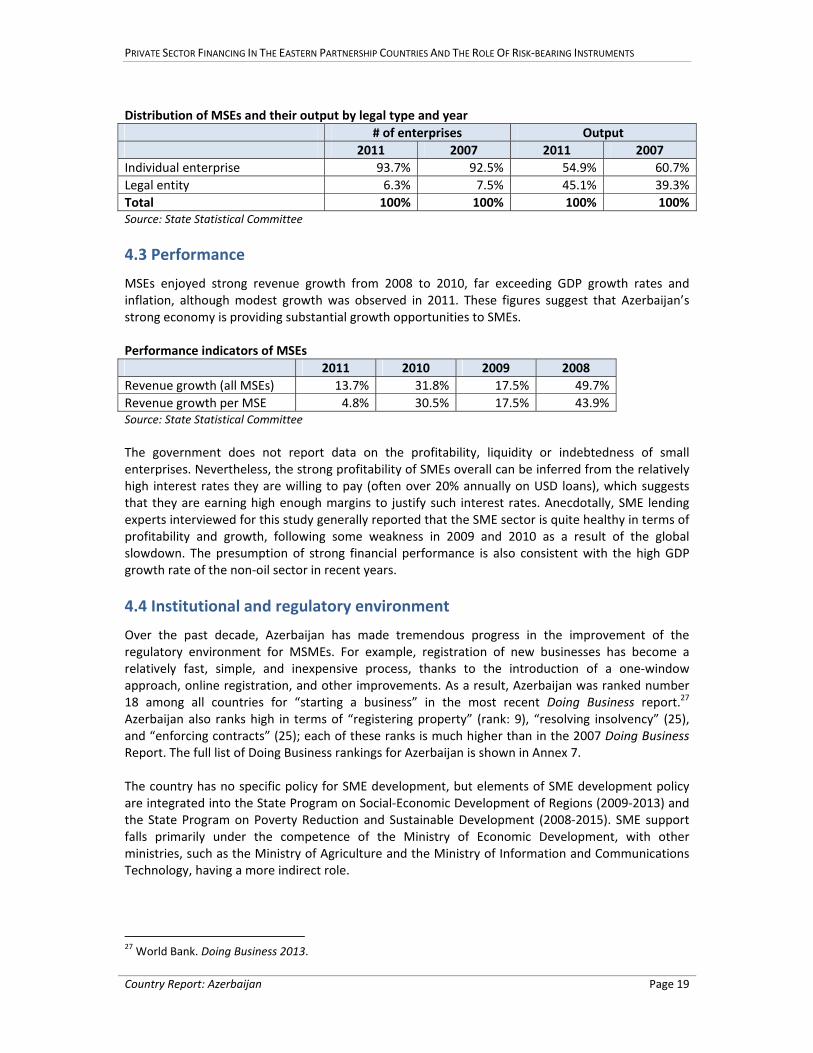
Distribution of MSEs and their output by legal type and year
# of enterprises Output
2011 2007 2011 2007
Individual enterprise 93.7% 92.5% 54.9% 60.7%
Legal entity 6.3% 7.5% 45.1% 39.3%
Total 100% 100% 100% 100%Source: State Statistical Committee
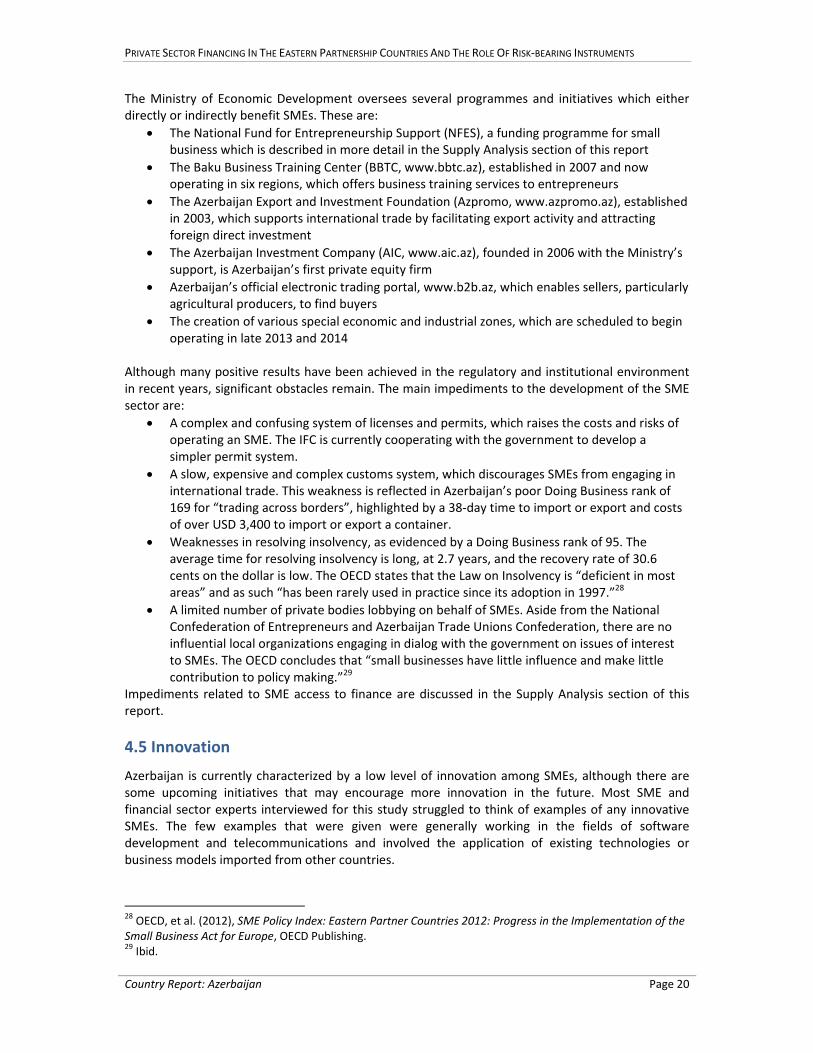
4.3 Performance
MSEs enjoyed strong revenue growth from 2008 to 2010, far exceeding GDP growth rates and inflation, although modest growth was observed in 2011. These figures suggest that Azerbaijan’s strong economy is providing substantial growth opportunities to SMEs. Performance indicators of MSEs
2011 2010 2009 2008
Revenue growth (all MSEs) 13.7% 31.8% 17.5% 49.7%
Revenue growth per MSE 4.8% 30.5% 17.5% 43.9% Source: State Statistical Committee The government does not report data on the profitability, liquidity or indebtedness of small enterprises. Nevertheless, the strong profitability of SMEs overall can be inferred from the relatively high interest rates they are willing to pay (often over 20% annually on USD loans), which suggests that they are earning high enough margins to justify such interest rates. Anecdotally, SME lending experts interviewed for this study generally reported that the SME sector is quite healthy in terms of profitability and growth, following some weakness in 2009 and 2010 as a result of the global slowdown. The presumption of strong financial performance is also consistent with the high GDP growth rate of the non‐oil sector in recent years.
4.4 Institutional and regulatory environment
Over the past decade, Azerbaijan has made tremendous progress in the improvement of the regulatory environment for MSMEs. For example, registration of new businesses has become a relatively fast, simple, and inexpensive process, thanks to the introduction of a one‐window approach, online registration, and other improvements. As a result, Azerbaijan was ranked number 18 among all countries for “starting a business” in the most recent Doing Business report.27 Azerbaijan also ranks high in terms of “registering property” (rank: 9), “resolving insolvency” (25), and “enforcing contracts” (25); each of these ranks is much higher than in the 2007 Doing Business Report. The full list of Doing Business rankings for Azerbaijan is shown in Annex 7. The country has no specific policy for SME development, but elements of SME development policy are integrated into the State Program on Social‐Economic Development of Regions (2009‐2013) and the State Program on Poverty Reduction and Sustainable Development (2008‐2015). SME support falls primarily under the competence of the Ministry of Economic Development, with other ministries, such as the Ministry of Agriculture and the Ministry of Information and Communications Technology, having a more indirect role.
27 World Bank. Doing Business 2013.
PRIVATE SECTOR FINANCING IN THE EASTERN PARTNERSHIP COUNTRIES AND THE ROLE OF RISK‐BEARING INSTRUMENTS
Country Report: Azerbaijan Page 20
The Ministry of Economic Development oversees several programmes and initiatives which either directly or indirectly benefit SMEs. These are:
The National Fund for Entrepreneurship Support (NFES), a funding programme for small business which is described in more detail in the Supply Analysis section of this report
The Baku Business Training Center (BBTC, www.bbtc.az), established in 2007 and now operating in six regions, which offers business training services to entrepreneurs
The Azerbaijan Export and Investment Foundation (Azpromo, www.azpromo.az), established in 2003, which supports international trade by facilitating export activity and attracting foreign direct investment
The Azerbaijan Investment Company (AIC, www.aic.az), founded in 2006 with the Ministry’s support, is Azerbaijan’s first private equity firm
Azerbaijan’s official electronic trading portal, www.b2b.az, which enables sellers, particularly agricultural producers, to find buyers
The creation of various special economic and industrial zones, which are scheduled to begin operating in late 2013 and 2014
Although many positive results have been achieved in the regulatory and institutional environment in recent years, significant obstacles remain. The main impediments to the development of the SME sector are:
A complex and confusing system of licenses and permits, which raises the costs and risks of operating an SME. The IFC is currently cooperating with the government to develop a simpler permit system.
A slow, expensive and complex customs system, which discourages SMEs from engaging in international trade. This weakness is reflected in Azerbaijan’s poor Doing Business rank of 169 for “trading across borders”, highlighted by a 38‐day time to import or export and costs of over USD 3,400 to import or export a container.
Weaknesses in resolving insolvency, as evidenced by a Doing Business rank of 95. The average time for resolving insolvency is long, at 2.7 years, and the recovery rate of 30.6 cents on the dollar is low. The OECD states that the Law on Insolvency is “deficient in most areas” and as such “has been rarely used in practice since its adoption in 1997.”28
A limited number of private bodies lobbying on behalf of SMEs. Aside from the National Confederation of Entrepreneurs and Azerbaijan Trade Unions Confederation, there are no influential local organizations engaging in dialog with the government on issues of interest to SMEs. The OECD concludes that “small businesses have little influence and make little contribution to policy making.”29
Impediments related to SME access to finance are discussed in the Supply Analysis section of this report.
4.5 Innovation
Azerbaijan is currently characterized by a low level of innovation among SMEs, although there are some upcoming initiatives that may encourage more innovation in the future. Most SME and financial sector experts interviewed for this study struggled to think of examples of any innovative SMEs. The few examples that were given were generally working in the fields of software development and telecommunications and involved the application of existing technologies or business models imported from other countries.
28 OECD, et al. (2012), SME Policy Index: Eastern Partner Countries 2012: Progress in the Implementation of the Small Business Act for Europe, OECD Publishing. 29 Ibid.
PRIVATE SECTOR FINANCING IN THE EASTERN PARTNERSHIP COUNTRIES AND THE ROLE OF RISK‐BEARING INSTRUMENTS
Country Report: Azerbaijan Page 21
Industry observers offered the following explanations for the innovation gap in Azerbaijan:
Azerbaijan may be a victim of its own success, as rapid economic growth may actually discourage innovation. Thanks to rapid growth, SMEs can earn high profits engaging in traditional, low value added activities, thus reducing the incentives for entrepreneurs to take risks by attempting more innovative activities.
Weak intellectual property protection may be a key factor. Large companies with political connections can relatively easily take ideas from smaller firms without providing compensation. Only SMEs with good connections would attempt to introduce an innovative product or business model, in spite of the existence of a sound regulatory framework for IP rights.
There are no incubators, angel investor networks, or similar support structures for innovative startups. This means that entrepreneurs would typically need to have relevant business skills and significant financial resources prior to starting a new venture.
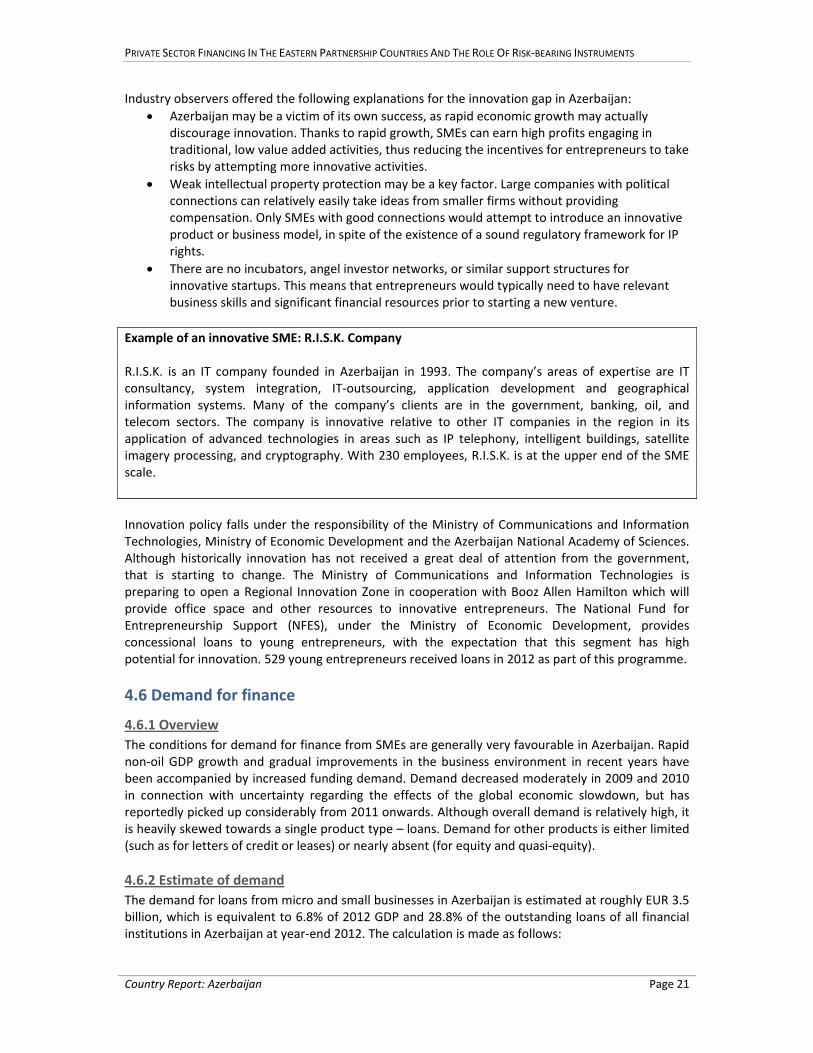
Example of an innovative SME: R.I.S.K. Company R.I.S.K. is an IT company founded in Azerbaijan in 1993. The company’s areas of expertise are IT consultancy, system integration, IT‐outsourcing, application development and geographical information systems. Many of the company’s clients are in the government, banking, oil, and telecom sectors. The company is innovative relative to other IT companies in the region in its application of advanced technologies in areas such as IP telephony, intelligent buildings, satellite imagery processing, and cryptography. With 230 employees, R.I.S.K. is at the upper end of the SME scale.
Innovation policy falls under the responsibility of the Ministry of Communications and Information Technologies, Ministry of Economic Development and the Azerbaijan National Academy of Sciences. Although historically innovation has not received a great deal of attention from the government, that is starting to change. The Ministry of Communications and Information Technologies is preparing to open a Regional Innovation Zone in cooperation with Booz Allen Hamilton which will provide office space and other resources to innovative entrepreneurs. The National Fund for Entrepreneurship Support (NFES), under the Ministry of Economic Development, provides concessional loans to young entrepreneurs, with the expectation that this segment has high potential for innovation. 529 young entrepreneurs received loans in 2012 as part of this programme.
4.6 Demand for finance
4.6.1 Overview
The conditions for demand for finance from SMEs are generally very favourable in Azerbaijan. Rapid non‐oil GDP growth and gradual improvements in the business environment in recent years have been accompanied by increased funding demand. Demand decreased moderately in 2009 and 2010 in connection with uncertainty regarding the effects of the global economic slowdown, but has reportedly picked up considerably from 2011 onwards. Although overall demand is relatively high, it is heavily skewed towards a single product type – loans. Demand for other products is either limited (such as for letters of credit or leases) or nearly absent (for equity and quasi‐equity).
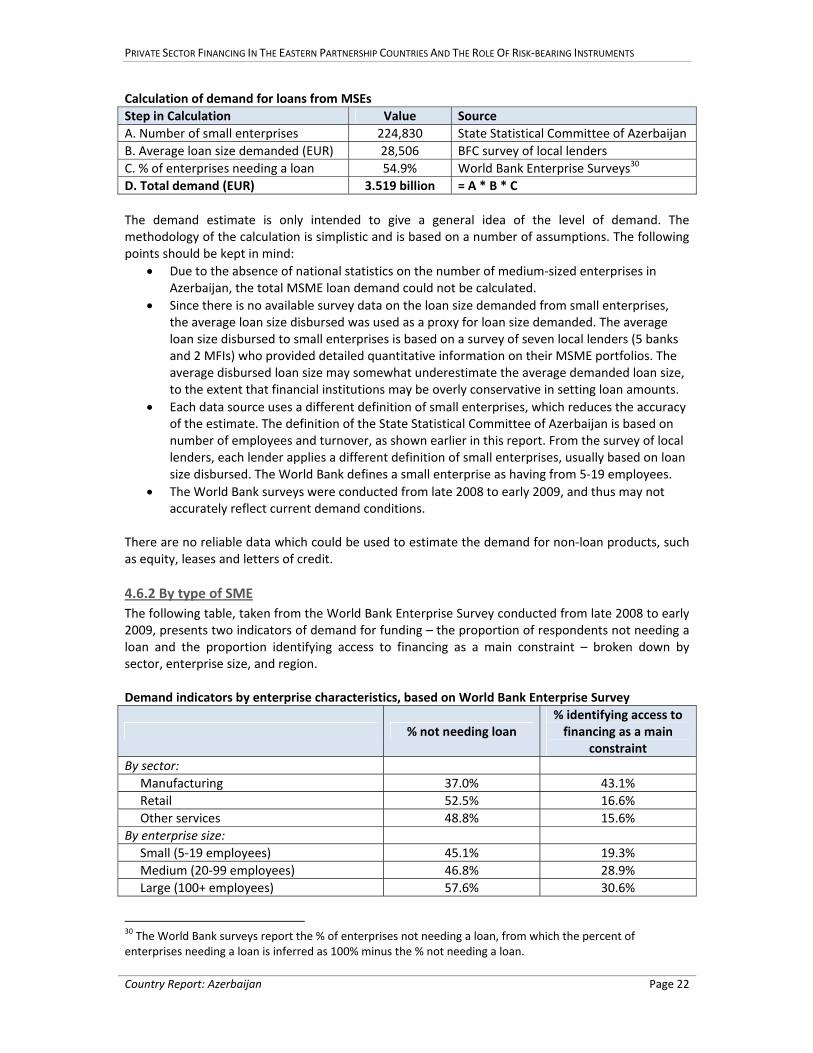
4.6.2 Estimate of demand
The demand for loans from micro and small businesses in Azerbaijan is estimated at roughly EUR 3.5 billion, which is equivalent to 6.8% of 2012 GDP and 28.8% of the outstanding loans of all financial institutions in Azerbaijan at year‐end 2012. The calculation is made as follows:
PRIVATE SECTOR FINANCING IN THE EASTERN PARTNERSHIP COUNTRIES AND THE ROLE OF RISK‐BEARING INSTRUMENTS
Country Report: Azerbaijan Page 22
Calculation of demand for loans from MSEs
Step in Calculation Value Source
A. Number of small enterprises 224,830 State Statistical Committee of Azerbaijan
B. Average loan size demanded (EUR) 28,506 BFC survey of local lenders
C. % of enterprises needing a loan 54.9% World Bank Enterprise Surveys30
D. Total demand (EUR) 3.519 billion = A * B * C
The demand estimate is only intended to give a general idea of the level of demand. The methodology of the calculation is simplistic and is based on a number of assumptions. The following points should be kept in mind:
Due to the absence of national statistics on the number of medium‐sized enterprises in Azerbaijan, the total MSME loan demand could not be calculated.
Since there is no available survey data on the loan size demanded from small enterprises, the average loan size disbursed was used as a proxy for loan size demanded. The average loan size disbursed to small enterprises is based on a survey of seven local lenders (5 banks and 2 MFIs) who provided detailed quantitative information on their MSME portfolios. The average disbursed loan size may somewhat underestimate the average demanded loan size, to the extent that financial institutions may be overly conservative in setting loan amounts.
Each data source uses a different definition of small enterprises, which reduces the accuracy of the estimate. The definition of the State Statistical Committee of Azerbaijan is based on number of employees and turnover, as shown earlier in this report. From the survey of local lenders, each lender applies a different definition of small enterprises, usually based on loan size disbursed. The World Bank defines a small enterprise as having from 5‐19 employees.
The World Bank surveys were conducted from late 2008 to early 2009, and thus may not accurately reflect current demand conditions.
There are no reliable data which could be used to estimate the demand for non‐loan products, such as equity, leases and letters of credit.
4.6.2 By type of SME
The following table, taken from the World Bank Enterprise Survey conducted from late 2008 to early 2009, presents two indicators of demand for funding – the proportion of respondents not needing a loan and the proportion identifying access to financing as a main constraint – broken down by sector, enterprise size, and region. Demand indicators by enterprise characteristics, based on World Bank Enterprise Survey
% not needing loan % identifying access to financing as a main
constraint
By sector:
Manufacturing 37.0% 43.1%
Retail 52.5% 16.6%
Other services 48.8% 15.6%
By enterprise size:
Small (5‐19 employees) 45.1% 19.3%
Medium (20‐99 employees) 46.8% 28.9%
Large (100+ employees) 57.6% 30.6%
30 The World Bank surveys report the % of enterprises not needing a loan, from which the percent of enterprises needing a loan is inferred as 100% minus the % not needing a loan.
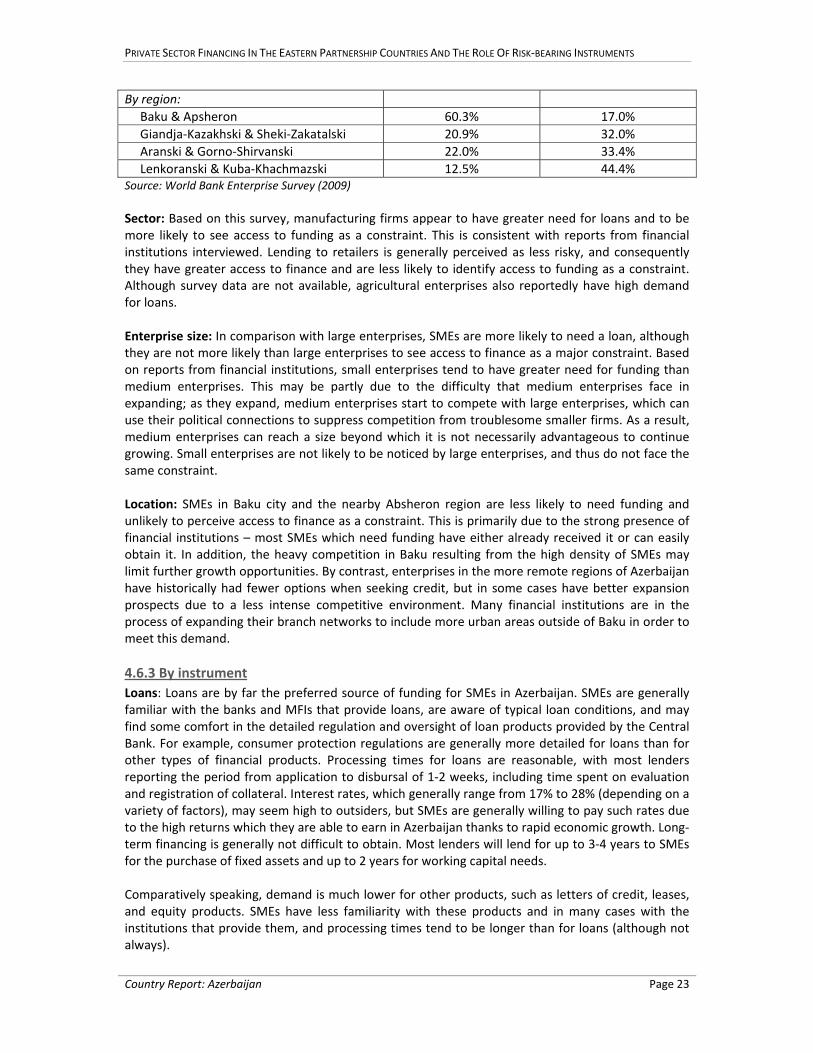
PRIVATE SECTOR FINANCING IN THE EASTERN PARTNERSHIP COUNTRIES AND THE ROLE OF RISK‐BEARING INSTRUMENTS
Country Report: Azerbaijan Page 23
By region:
Baku & Apsheron 60.3% 17.0%
Giandja‐Kazakhski & Sheki‐Zakatalski 20.9% 32.0%
Aranski & Gorno‐Shirvanski 22.0% 33.4%
Lenkoranski & Kuba‐Khachmazski 12.5% 44.4% Source: World Bank Enterprise Survey (2009)
Sector: Based on this survey, manufacturing firms appear to have greater need for loans and to be more likely to see access to funding as a constraint. This is consistent with reports from financial institutions interviewed. Lending to retailers is generally perceived as less risky, and consequently they have greater access to finance and are less likely to identify access to funding as a constraint. Although survey data are not available, agricultural enterprises also reportedly have high demand for loans. Enterprise size: In comparison with large enterprises, SMEs are more likely to need a loan, although they are not more likely than large enterprises to see access to finance as a major constraint. Based on reports from financial institutions, small enterprises tend to have greater need for funding than medium enterprises. This may be partly due to the difficulty that medium enterprises face in expanding; as they expand, medium enterprises start to compete with large enterprises, which can use their political connections to suppress competition from troublesome smaller firms. As a result, medium enterprises can reach a size beyond which it is not necessarily advantageous to continue growing. Small enterprises are not likely to be noticed by large enterprises, and thus do not face the same constraint. Location: SMEs in Baku city and the nearby Absheron region are less likely to need funding and unlikely to perceive access to finance as a constraint. This is primarily due to the strong presence of financial institutions – most SMEs which need funding have either already received it or can easily obtain it. In addition, the heavy competition in Baku resulting from the high density of SMEs may limit further growth opportunities. By contrast, enterprises in the more remote regions of Azerbaijan have historically had fewer options when seeking credit, but in some cases have better expansion prospects due to a less intense competitive environment. Many financial institutions are in the process of expanding their branch networks to include more urban areas outside of Baku in order to meet this demand.
4.6.3 By instrument
Loans: Loans are by far the preferred source of funding for SMEs in Azerbaijan. SMEs are generally familiar with the banks and MFIs that provide loans, are aware of typical loan conditions, and may find some comfort in the detailed regulation and oversight of loan products provided by the Central Bank. For example, consumer protection regulations are generally more detailed for loans than for other types of financial products. Processing times for loans are reasonable, with most lenders reporting the period from application to disbursal of 1‐2 weeks, including time spent on evaluation and registration of collateral. Interest rates, which generally range from 17% to 28% (depending on a variety of factors), may seem high to outsiders, but SMEs are generally willing to pay such rates due to the high returns which they are able to earn in Azerbaijan thanks to rapid economic growth. Long‐term financing is generally not difficult to obtain. Most lenders will lend for up to 3‐4 years to SMEs for the purchase of fixed assets and up to 2 years for working capital needs. Comparatively speaking, demand is much lower for other products, such as letters of credit, leases, and equity products. SMEs have less familiarity with these products and in many cases with the institutions that provide them, and processing times tend to be longer than for loans (although not always).
PRIVATE SECTOR FINANCING IN THE EASTERN PARTNERSHIP COUNTRIES AND THE ROLE OF RISK‐BEARING INSTRUMENTS
Country Report: Azerbaijan Page 24
Leases: Demand for leases is very low in comparison with demand for loans. For reasons discussed in the Supply Analysis section, leasing faces a tax disadvantage and is thus relatively expensive compared to lending. Most leasing services are offered by specialized leasing companies, rather than the banks with which most SMEs are familiar (although some of the leasing companies are subsidiaries of banks). Due to their relatively small scale, these leasing companies cannot do extensive marketing to help raise awareness of their products. Several of the leasing companies which are members of the Association of Leasing Companies of Azerbaijan do not even have functioning websites. Some entrepreneurs may also be aware that there is no specific leasing law in Azerbaijan31, which may further inhibit confidence in the sector. Cultural factors may also play a role; one interviewee explained that “people like to own things” in Azerbaijan, and leasing may be perceived as a less “prestigious” form of finance. Letters of credit: Demand for letters of credit is at a low level but has been gradually increasing over time. The main inhibiting factor is a perceived lack of need for LCs – businesses have been engaging in trade successfully without the use of documentary operations in the past, and thus see little need to experiment with different payment formats. According to experts interviewed for this study, the fact that LC financing is document‐driven may be perceived as undesirable; entrepreneurs may fear that small errors in documentation will cause delays or difficulties in obtaining their goods. Guarantees are much more commonly requested to facilitate trade finance. Equity and quasi‐equity: Demand for equity and quasi‐equity from formal institutions is particularly low in Azerbaijan. Many local SME sector experts interviewed for this study cited cultural factors to explain the lack of demand for equity from formal sources – according to them, Azeri businesspeople are particularly averse to cooperating with outsiders and sharing a part of their business with strangers. Lack of awareness of the availability of equity products, and lack of familiarity with the products themselves (such as a standard term sheet) also negatively affect demand. Without an appropriate venture capital ecosystem in place, including incubators, angel investor networks, and academic conferences, potential investees have limited opportunities to learn about these products.
31 Leasing activity is defined and regulated primarily by the Civil Code of Azerbaijan.
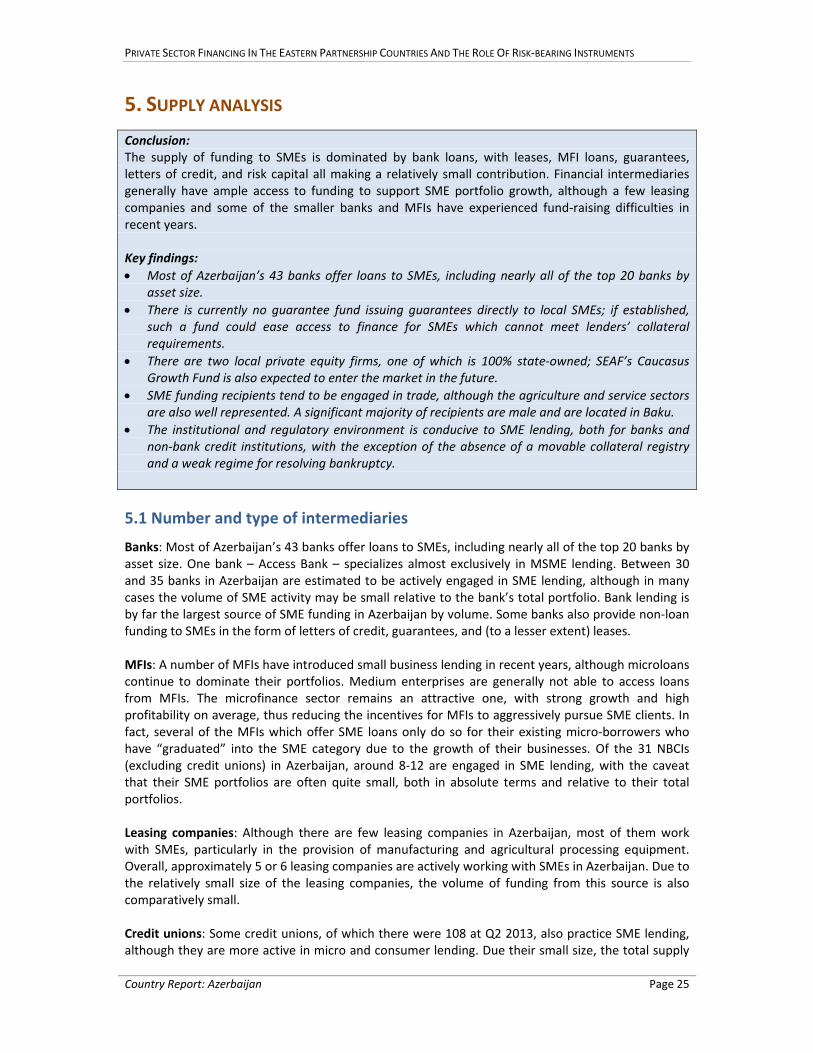
PRIVATE SECTOR FINANCING IN THE EASTERN PARTNERSHIP COUNTRIES AND THE ROLE OF RISK‐BEARING INSTRUMENTS
Country Report: Azerbaijan Page 25
5. SUPPLY ANALYSIS
Conclusion: The supply of funding to SMEs is dominated by bank loans, with leases, MFI loans, guarantees, letters of credit, and risk capital all making a relatively small contribution. Financial intermediaries generally have ample access to funding to support SME portfolio growth, although a few leasing companies and some of the smaller banks and MFIs have experienced fund‐raising difficulties in recent years. Key findings:
Most of Azerbaijan’s 43 banks offer loans to SMEs, including nearly all of the top 20 banks by asset size.
There is currently no guarantee fund issuing guarantees directly to local SMEs; if established, such a fund could ease access to finance for SMEs which cannot meet lenders’ collateral requirements.
There are two local private equity firms, one of which is 100% state‐owned; SEAF’s Caucasus Growth Fund is also expected to enter the market in the future.
SME funding recipients tend to be engaged in trade, although the agriculture and service sectors are also well represented. A significant majority of recipients are male and are located in Baku.
The institutional and regulatory environment is conducive to SME lending, both for banks and non‐bank credit institutions, with the exception of the absence of a movable collateral registry and a weak regime for resolving bankruptcy.
5.1 Number and type of intermediaries
Banks: Most of Azerbaijan’s 43 banks offer loans to SMEs, including nearly all of the top 20 banks by asset size. One bank – Access Bank – specializes almost exclusively in MSME lending. Between 30 and 35 banks in Azerbaijan are estimated to be actively engaged in SME lending, although in many cases the volume of SME activity may be small relative to the bank’s total portfolio. Bank lending is by far the largest source of SME funding in Azerbaijan by volume. Some banks also provide non‐loan funding to SMEs in the form of letters of credit, guarantees, and (to a lesser extent) leases. MFIs: A number of MFIs have introduced small business lending in recent years, although microloans continue to dominate their portfolios. Medium enterprises are generally not able to access loans from MFIs. The microfinance sector remains an attractive one, with strong growth and high profitability on average, thus reducing the incentives for MFIs to aggressively pursue SME clients. In fact, several of the MFIs which offer SME loans only do so for their existing micro‐borrowers who have “graduated” into the SME category due to the growth of their businesses. Of the 31 NBCIs (excluding credit unions) in Azerbaijan, around 8‐12 are engaged in SME lending, with the caveat that their SME portfolios are often quite small, both in absolute terms and relative to their total portfolios. Leasing companies: Although there are few leasing companies in Azerbaijan, most of them work with SMEs, particularly in the provision of manufacturing and agricultural processing equipment. Overall, approximately 5 or 6 leasing companies are actively working with SMEs in Azerbaijan. Due to the relatively small size of the leasing companies, the volume of funding from this source is also comparatively small. Credit unions: Some credit unions, of which there were 108 at Q2 2013, also practice SME lending, although they are more active in micro and consumer lending. Due their small size, the total supply
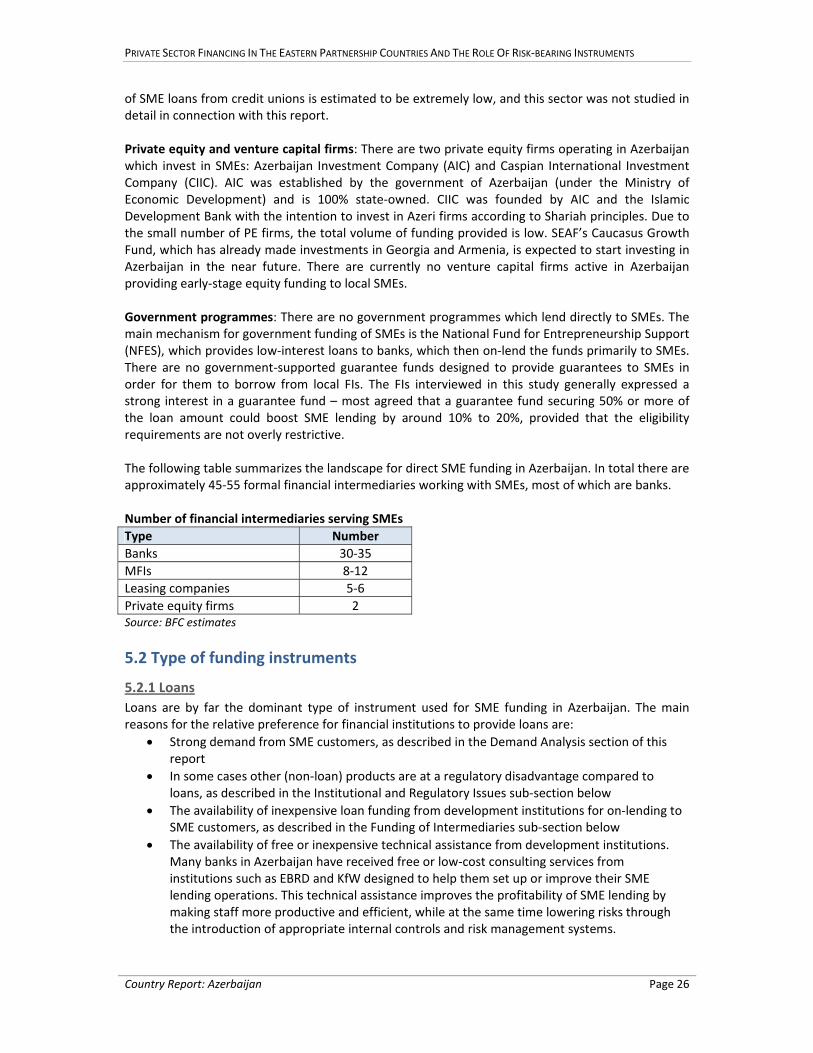
PRIVATE SECTOR FINANCING IN THE EASTERN PARTNERSHIP COUNTRIES AND THE ROLE OF RISK‐BEARING INSTRUMENTS
Country Report: Azerbaijan Page 26
of SME loans from credit unions is estimated to be extremely low, and this sector was not studied in detail in connection with this report. Private equity and venture capital firms: There are two private equity firms operating in Azerbaijan which invest in SMEs: Azerbaijan Investment Company (AIC) and Caspian International Investment Company (CIIC). AIC was established by the government of Azerbaijan (under the Ministry of Economic Development) and is 100% state‐owned. CIIC was founded by AIC and the Islamic Development Bank with the intention to invest in Azeri firms according to Shariah principles. Due to the small number of PE firms, the total volume of funding provided is low. SEAF’s Caucasus Growth Fund, which has already made investments in Georgia and Armenia, is expected to start investing in Azerbaijan in the near future. There are currently no venture capital firms active in Azerbaijan providing early‐stage equity funding to local SMEs. Government programmes: There are no government programmes which lend directly to SMEs. The main mechanism for government funding of SMEs is the National Fund for Entrepreneurship Support (NFES), which provides low‐interest loans to banks, which then on‐lend the funds primarily to SMEs. There are no government‐supported guarantee funds designed to provide guarantees to SMEs in order for them to borrow from local FIs. The FIs interviewed in this study generally expressed a strong interest in a guarantee fund – most agreed that a guarantee fund securing 50% or more of the loan amount could boost SME lending by around 10% to 20%, provided that the eligibility requirements are not overly restrictive. The following table summarizes the landscape for direct SME funding in Azerbaijan. In total there are approximately 45‐55 formal financial intermediaries working with SMEs, most of which are banks. Number of financial intermediaries serving SMEs
Type Number
Banks 30‐35
MFIs 8‐12
Leasing companies 5‐6
Private equity firms 2 Source: BFC estimates
5.2 Type of funding instruments
5.2.1 Loans
Loans are by far the dominant type of instrument used for SME funding in Azerbaijan. The main reasons for the relative preference for financial institutions to provide loans are:
Strong demand from SME customers, as described in the Demand Analysis section of this report
In some cases other (non‐loan) products are at a regulatory disadvantage compared to loans, as described in the Institutional and Regulatory Issues sub‐section below
The availability of inexpensive loan funding from development institutions for on‐lending to SME customers, as described in the Funding of Intermediaries sub‐section below
The availability of free or inexpensive technical assistance from development institutions. Many banks in Azerbaijan have received free or low‐cost consulting services from institutions such as EBRD and KfW designed to help them set up or improve their SME lending operations. This technical assistance improves the profitability of SME lending by making staff more productive and efficient, while at the same time lowering risks through the introduction of appropriate internal controls and risk management systems.
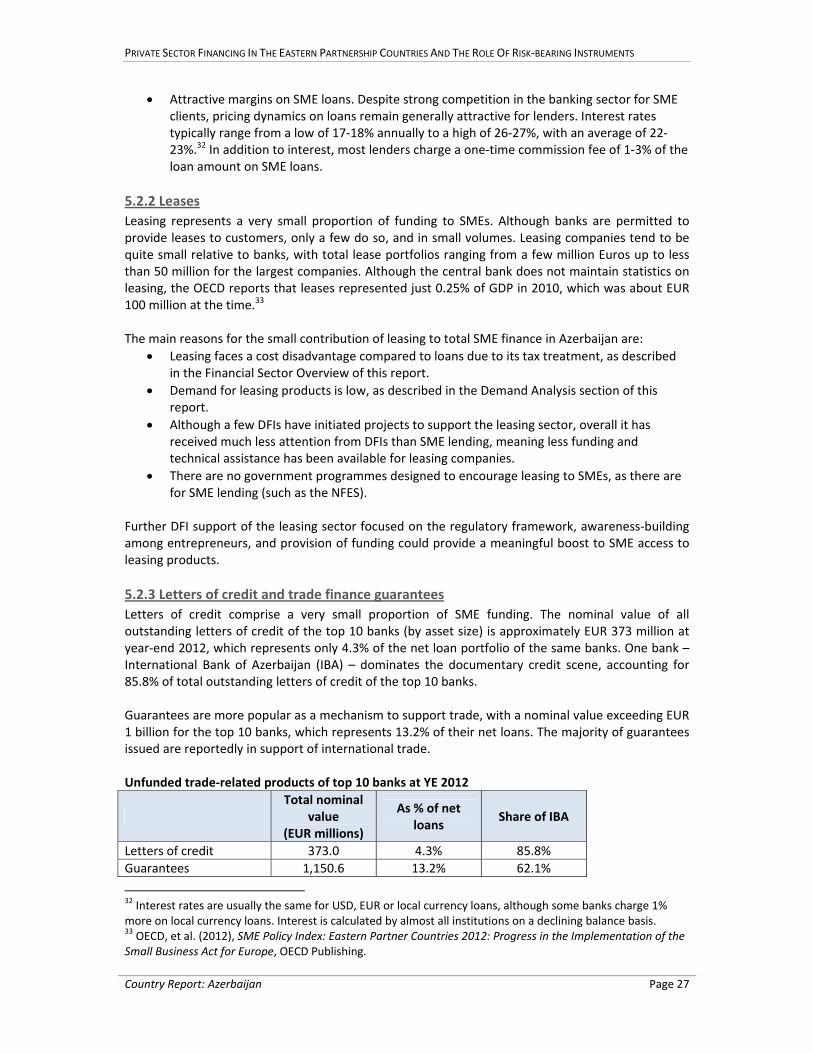
PRIVATE SECTOR FINANCING IN THE EASTERN PARTNERSHIP COUNTRIES AND THE ROLE OF RISK‐BEARING INSTRUMENTS
Country Report: Azerbaijan Page 27
Attractive margins on SME loans. Despite strong competition in the banking sector for SME clients, pricing dynamics on loans remain generally attractive for lenders. Interest rates typically range from a low of 17‐18% annually to a high of 26‐27%, with an average of 22‐23%.32 In addition to interest, most lenders charge a one‐time commission fee of 1‐3% of the loan amount on SME loans.
5.2.2 Leases
Leasing represents a very small proportion of funding to SMEs. Although banks are permitted to provide leases to customers, only a few do so, and in small volumes. Leasing companies tend to be quite small relative to banks, with total lease portfolios ranging from a few million Euros up to less than 50 million for the largest companies. Although the central bank does not maintain statistics on leasing, the OECD reports that leases represented just 0.25% of GDP in 2010, which was about EUR 100 million at the time.33 The main reasons for the small contribution of leasing to total SME finance in Azerbaijan are:
Leasing faces a cost disadvantage compared to loans due to its tax treatment, as described in the Financial Sector Overview of this report.
Demand for leasing products is low, as described in the Demand Analysis section of this report.
Although a few DFIs have initiated projects to support the leasing sector, overall it has received much less attention from DFIs than SME lending, meaning less funding and technical assistance has been available for leasing companies.
There are no government programmes designed to encourage leasing to SMEs, as there are for SME lending (such as the NFES).
Further DFI support of the leasing sector focused on the regulatory framework, awareness‐building among entrepreneurs, and provision of funding could provide a meaningful boost to SME access to leasing products.
5.2.3 Letters of credit and trade finance guarantees
Letters of credit comprise a very small proportion of SME funding. The nominal value of all outstanding letters of credit of the top 10 banks (by asset size) is approximately EUR 373 million at year‐end 2012, which represents only 4.3% of the net loan portfolio of the same banks. One bank – International Bank of Azerbaijan (IBA) – dominates the documentary credit scene, accounting for 85.8% of total outstanding letters of credit of the top 10 banks. Guarantees are more popular as a mechanism to support trade, with a nominal value exceeding EUR 1 billion for the top 10 banks, which represents 13.2% of their net loans. The majority of guarantees issued are reportedly in support of international trade. Unfunded trade‐related products of top 10 banks at YE 2012
Total nominal
value (EUR millions)
As % of net loans
Share of IBA
Letters of credit 373.0 4.3% 85.8%
Guarantees 1,150.6 13.2% 62.1%
32 Interest rates are usually the same for USD, EUR or local currency loans, although some banks charge 1% more on local currency loans. Interest is calculated by almost all institutions on a declining balance basis. 33 OECD, et al. (2012), SME Policy Index: Eastern Partner Countries 2012: Progress in the Implementation of the Small Business Act for Europe, OECD Publishing.
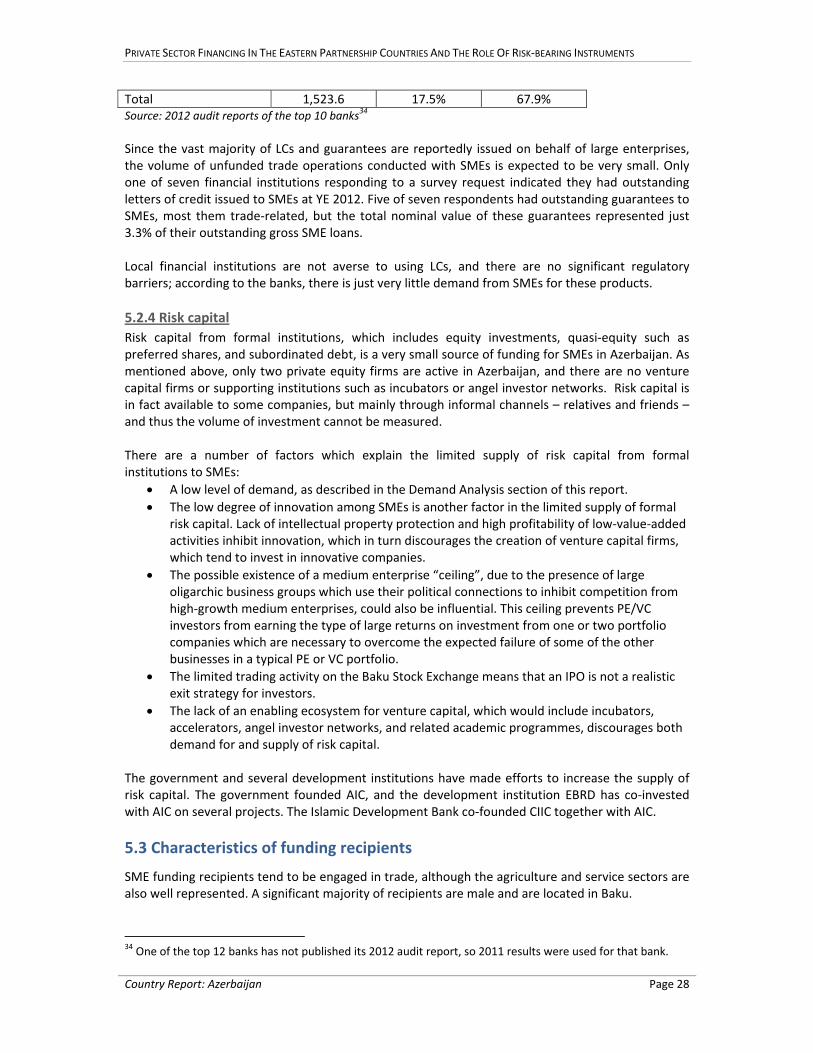
PRIVATE SECTOR FINANCING IN THE EASTERN PARTNERSHIP COUNTRIES AND THE ROLE OF RISK‐BEARING INSTRUMENTS
Country Report: Azerbaijan Page 28
Total 1,523.6 17.5% 67.9%Source: 2012 audit reports of the top 10 banks34
Since the vast majority of LCs and guarantees are reportedly issued on behalf of large enterprises, the volume of unfunded trade operations conducted with SMEs is expected to be very small. Only one of seven financial institutions responding to a survey request indicated they had outstanding letters of credit issued to SMEs at YE 2012. Five of seven respondents had outstanding guarantees to SMEs, most them trade‐related, but the total nominal value of these guarantees represented just 3.3% of their outstanding gross SME loans. Local financial institutions are not averse to using LCs, and there are no significant regulatory barriers; according to the banks, there is just very little demand from SMEs for these products.
5.2.4 Risk capital
Risk capital from formal institutions, which includes equity investments, quasi‐equity such as preferred shares, and subordinated debt, is a very small source of funding for SMEs in Azerbaijan. As mentioned above, only two private equity firms are active in Azerbaijan, and there are no venture capital firms or supporting institutions such as incubators or angel investor networks. Risk capital is in fact available to some companies, but mainly through informal channels – relatives and friends – and thus the volume of investment cannot be measured. There are a number of factors which explain the limited supply of risk capital from formal institutions to SMEs:
A low level of demand, as described in the Demand Analysis section of this report.
The low degree of innovation among SMEs is another factor in the limited supply of formal risk capital. Lack of intellectual property protection and high profitability of low‐value‐added activities inhibit innovation, which in turn discourages the creation of venture capital firms, which tend to invest in innovative companies.
The possible existence of a medium enterprise “ceiling”, due to the presence of large oligarchic business groups which use their political connections to inhibit competition from high‐growth medium enterprises, could also be influential. This ceiling prevents PE/VC investors from earning the type of large returns on investment from one or two portfolio companies which are necessary to overcome the expected failure of some of the other businesses in a typical PE or VC portfolio.
The limited trading activity on the Baku Stock Exchange means that an IPO is not a realistic exit strategy for investors.
The lack of an enabling ecosystem for venture capital, which would include incubators, accelerators, angel investor networks, and related academic programmes, discourages both demand for and supply of risk capital.
The government and several development institutions have made efforts to increase the supply of risk capital. The government founded AIC, and the development institution EBRD has co‐invested with AIC on several projects. The Islamic Development Bank co‐founded CIIC together with AIC.
5.3 Characteristics of funding recipients
SME funding recipients tend to be engaged in trade, although the agriculture and service sectors are also well represented. A significant majority of recipients are male and are located in Baku.
34 One of the top 12 banks has not published its 2012 audit report, so 2011 results were used for that bank.
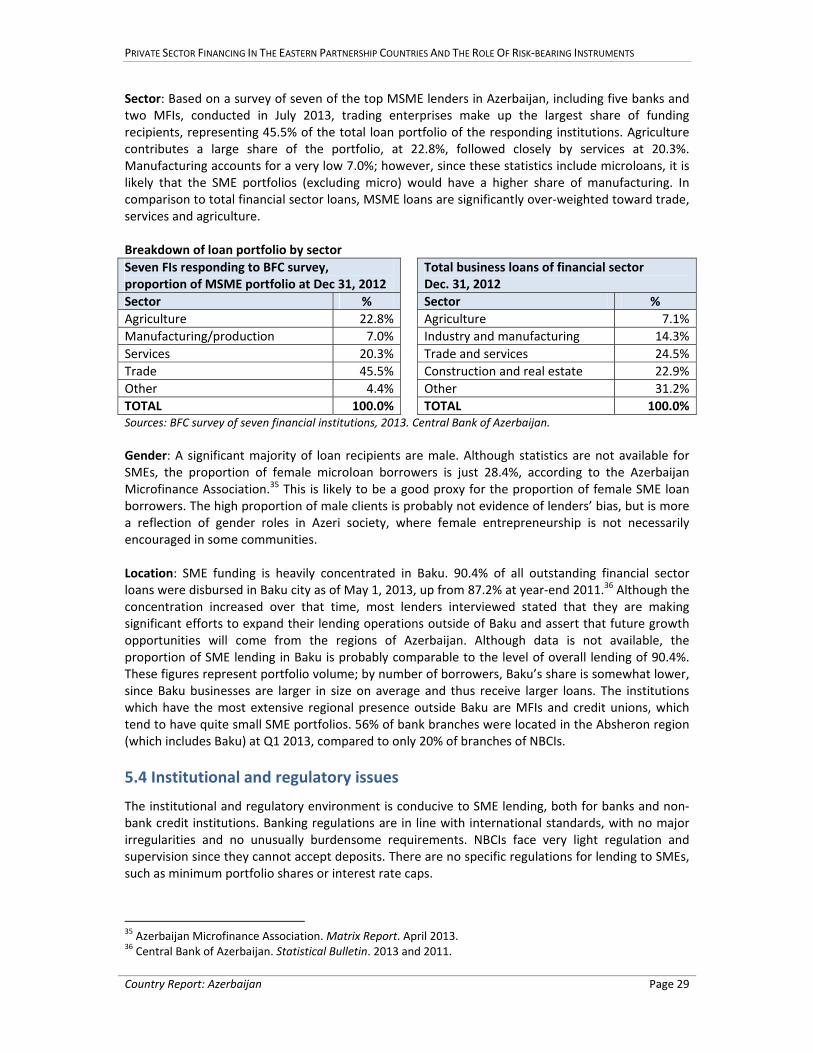
PRIVATE SECTOR FINANCING IN THE EASTERN PARTNERSHIP COUNTRIES AND THE ROLE OF RISK‐BEARING INSTRUMENTS
Country Report: Azerbaijan Page 29
Sector: Based on a survey of seven of the top MSME lenders in Azerbaijan, including five banks and two MFIs, conducted in July 2013, trading enterprises make up the largest share of funding recipients, representing 45.5% of the total loan portfolio of the responding institutions. Agriculture contributes a large share of the portfolio, at 22.8%, followed closely by services at 20.3%. Manufacturing accounts for a very low 7.0%; however, since these statistics include microloans, it is likely that the SME portfolios (excluding micro) would have a higher share of manufacturing. In comparison to total financial sector loans, MSME loans are significantly over‐weighted toward trade, services and agriculture. Breakdown of loan portfolio by sector
Seven FIs responding to BFC survey, proportion of MSME portfolio at Dec 31, 2012
Total business loans of financial sector Dec. 31, 2012
Sector % Sector %
Agriculture 22.8% Agriculture 7.1%
Manufacturing/production 7.0% Industry and manufacturing 14.3%
Services 20.3% Trade and services 24.5%
Trade 45.5% Construction and real estate 22.9%
Other 4.4% Other 31.2%
TOTAL 100.0% TOTAL 100.0%Sources: BFC survey of seven financial institutions, 2013. Central Bank of Azerbaijan.
Gender: A significant majority of loan recipients are male. Although statistics are not available for SMEs, the proportion of female microloan borrowers is just 28.4%, according to the Azerbaijan Microfinance Association.35 This is likely to be a good proxy for the proportion of female SME loan borrowers. The high proportion of male clients is probably not evidence of lenders’ bias, but is more a reflection of gender roles in Azeri society, where female entrepreneurship is not necessarily encouraged in some communities. Location: SME funding is heavily concentrated in Baku. 90.4% of all outstanding financial sector loans were disbursed in Baku city as of May 1, 2013, up from 87.2% at year‐end 2011.36 Although the concentration increased over that time, most lenders interviewed stated that they are making significant efforts to expand their lending operations outside of Baku and assert that future growth opportunities will come from the regions of Azerbaijan. Although data is not available, the proportion of SME lending in Baku is probably comparable to the level of overall lending of 90.4%. These figures represent portfolio volume; by number of borrowers, Baku’s share is somewhat lower, since Baku businesses are larger in size on average and thus receive larger loans. The institutions which have the most extensive regional presence outside Baku are MFIs and credit unions, which tend to have quite small SME portfolios. 56% of bank branches were located in the Absheron region (which includes Baku) at Q1 2013, compared to only 20% of branches of NBCIs.
5.4 Institutional and regulatory issues
The institutional and regulatory environment is conducive to SME lending, both for banks and non‐bank credit institutions. Banking regulations are in line with international standards, with no major irregularities and no unusually burdensome requirements. NBCIs face very light regulation and supervision since they cannot accept deposits. There are no specific regulations for lending to SMEs, such as minimum portfolio shares or interest rate caps.
35 Azerbaijan Microfinance Association. Matrix Report. April 2013. 36 Central Bank of Azerbaijan. Statistical Bulletin. 2013 and 2011.
PRIVATE SECTOR FINANCING IN THE EASTERN PARTNERSHIP COUNTRIES AND THE ROLE OF RISK‐BEARING INSTRUMENTS
Country Report: Azerbaijan Page 30
The institutional and regulatory constraints for SME lending are the same as the constraints for lenders in general, as described in the Financial Sector Overview section of this report. It is worth noting that the main constraint, the absence of a collateral registry for movable property, is particularly relevant for SMEs, which are less likely than large enterprises to own real estate which can be used for collateral. The most important regulatory change in recent years, the increase in minimum capital requirements from AZN 10 million to 50 million on January 1, 2014, may indirectly benefit SME borrowers. The required increase has led to a significant influx of capital into the banking sector, increasing bank liquidity. This may help boost SME lending in 2013 and 2014 as banks look to place the new funds in the market, although banks must be cautious not to contribute to over‐indebtedness through overly aggressive lending practices. As described in the Financial Sector Overview section of this report, leasing is at a cost disadvantage compared to lending as a result of the treatment of VAT. This is a significant impediment in access to finance especially for SMEs in the manufacturing, transportation, and agriculture sectors, which have strong demand for imported vehicles and equipment and would benefit significantly from a stronger leasing sector.
5.5 Funding of intermediaries
5.5.1 Overview
Financial intermediaries serving SMEs in Azerbaijan generally have sufficient access to funding to meet demand. The top‐performing banks and MFIs in particular, are able to borrow at acceptable terms from a variety of sources in sufficient volumes. The relatively few institutions which have experienced serious funding constraints are typically smaller banks and MFIs which have difficulty attracting the attention of large foreign institutions. Several leasing companies have also experienced funding constraints, which is consistent with the generally weak historical performance of the leasing sector and the perception of poor future prospects. Aside from customer deposits, the main sources of funding of intermediaries are the government of Azerbaijan, through a variety of channels, and development finance institutions (DFIs). Foreign commercial banks and commercially‐oriented funds are active, but represent a smaller proportion of total funding. Borrowing among local banks is practiced, but only on a small scale by a few banks. Conditional funding which may be used only for SME lending is offered by DFIs and to a lesser extent by a few commercial banks and investment funds. Although most funding is provided in foreign currency, this is generally not a critical issue, as the exchange rate is stable and customers are usually willing to accept foreign currency loans.
5.5.2 Government lending
The government of Azerbaijan provides funding to banks on a relatively large scale, some of which is specifically intended for SME lending. The government’s main tool for stimulating lending to SMEs is the National Fund for Entrepreneurship Support (NFES). NFES provides low‐interest loans (1% annually) to financial institutions which then on‐lend the funds at low interest rates (6%) to entrepreneurs. The financial institutions bear all the risk of default, with the NFES acting only as a source of funding. In 2012, 2,419 entrepreneurs received funding of AZN 218 million (EUR 210 million) indirectly through NFES, for an average loan size of AZN 90,120 (EUR 86,654). 96.2% of the recipients are classified by the fund as “small scale”. The fund has a particular focus on the agriculture sector, which received 68% of loans in 2012, and on regions outside Baku, which received 83%. The program also aims to promote entrepreneurship among youth, women, internally
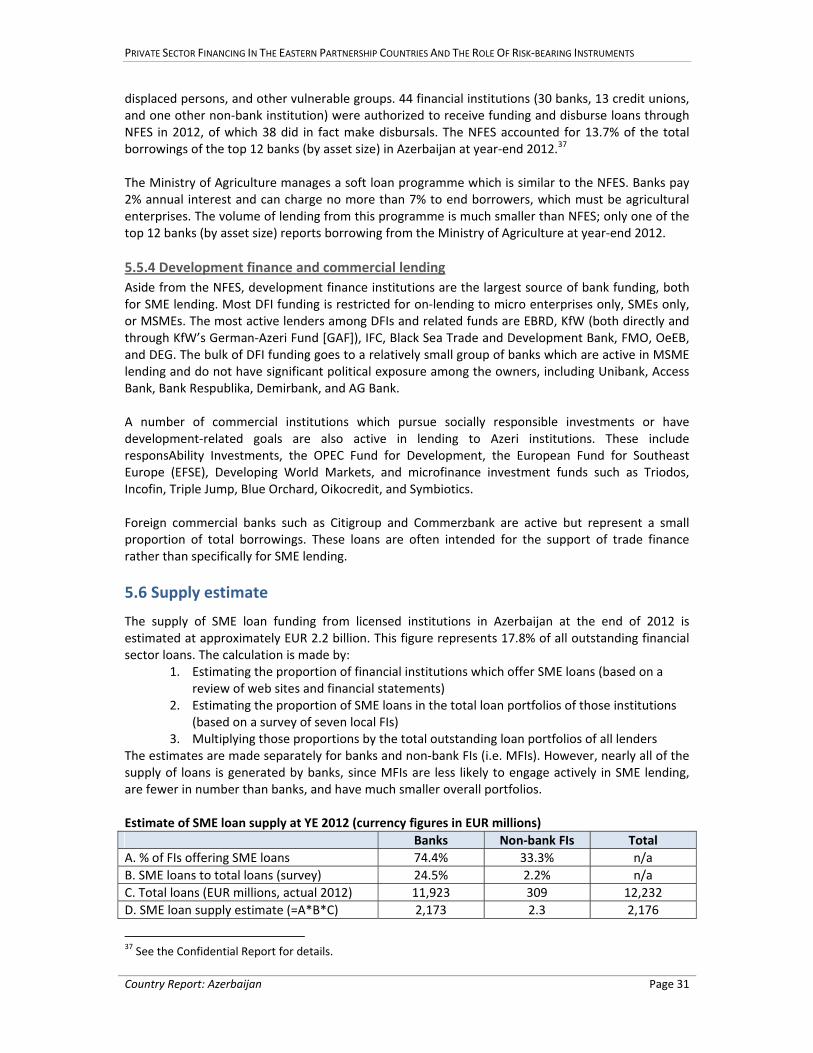
PRIVATE SECTOR FINANCING IN THE EASTERN PARTNERSHIP COUNTRIES AND THE ROLE OF RISK‐BEARING INSTRUMENTS
Country Report: Azerbaijan Page 31
displaced persons, and other vulnerable groups. 44 financial institutions (30 banks, 13 credit unions, and one other non‐bank institution) were authorized to receive funding and disburse loans through NFES in 2012, of which 38 did in fact make disbursals. The NFES accounted for 13.7% of the total borrowings of the top 12 banks (by asset size) in Azerbaijan at year‐end 2012.37 The Ministry of Agriculture manages a soft loan programme which is similar to the NFES. Banks pay 2% annual interest and can charge no more than 7% to end borrowers, which must be agricultural enterprises. The volume of lending from this programme is much smaller than NFES; only one of the top 12 banks (by asset size) reports borrowing from the Ministry of Agriculture at year‐end 2012.
5.5.4 Development finance and commercial lending
Aside from the NFES, development finance institutions are the largest source of bank funding, both for SME lending. Most DFI funding is restricted for on‐lending to micro enterprises only, SMEs only, or MSMEs. The most active lenders among DFIs and related funds are EBRD, KfW (both directly and through KfW’s German‐Azeri Fund [GAF]), IFC, Black Sea Trade and Development Bank, FMO, OeEB, and DEG. The bulk of DFI funding goes to a relatively small group of banks which are active in MSME lending and do not have significant political exposure among the owners, including Unibank, Access Bank, Bank Respublika, Demirbank, and AG Bank. A number of commercial institutions which pursue socially responsible investments or have development‐related goals are also active in lending to Azeri institutions. These include responsAbility Investments, the OPEC Fund for Development, the European Fund for Southeast Europe (EFSE), Developing World Markets, and microfinance investment funds such as Triodos, Incofin, Triple Jump, Blue Orchard, Oikocredit, and Symbiotics. Foreign commercial banks such as Citigroup and Commerzbank are active but represent a small proportion of total borrowings. These loans are often intended for the support of trade finance rather than specifically for SME lending.
5.6 Supply estimate
The supply of SME loan funding from licensed institutions in Azerbaijan at the end of 2012 is estimated at approximately EUR 2.2 billion. This figure represents 17.8% of all outstanding financial sector loans. The calculation is made by:
1. Estimating the proportion of financial institutions which offer SME loans (based on a review of web sites and financial statements)
2. Estimating the proportion of SME loans in the total loan portfolios of those institutions (based on a survey of seven local FIs)
3. Multiplying those proportions by the total outstanding loan portfolios of all lenders The estimates are made separately for banks and non‐bank FIs (i.e. MFIs). However, nearly all of the supply of loans is generated by banks, since MFIs are less likely to engage actively in SME lending, are fewer in number than banks, and have much smaller overall portfolios. Estimate of SME loan supply at YE 2012 (currency figures in EUR millions)
Banks Non‐bank FIs Total
A. % of FIs offering SME loans 74.4% 33.3% n/a
B. SME loans to total loans (survey) 24.5% 2.2% n/a
C. Total loans (EUR millions, actual 2012) 11,923 309 12,232
D. SME loan supply estimate (=A*B*C) 2,173 2.3 2,176
37 See the Confidential Report for details.
PRIVATE SECTOR FINANCING IN THE EASTERN PARTNERSHIP COUNTRIES AND THE ROLE OF RISK‐BEARING INSTRUMENTS
Country Report: Azerbaijan Page 32
Source: Central Bank of Azerbaijan, BFC estimates
This estimate may somewhat overstate the supply of lending to SMEs, since the seven institutions which responded to the survey request are among the country’s most active SME lenders. By contrast, the OECD estimates that SME loans account for only about 6% of total bank lending38, versus the 18% produced by this model. The Central Bank of Azerbaijan does not track lending to SMEs, so there are no definitive figures available. It is also worth noting that survey respondents apply various definitions of SMEs, which introduces another element of inaccuracy in the estimates.
38 OECD, et al. (2012), SME Policy Index: Eastern Partner Countries 2012: Progress in the Implementation of the Small Business Act for Europe, OECD Publishing.
PRIVATE SECTOR FINANCING IN THE EASTERN PARTNERSHIP COUNTRIES AND THE ROLE OF RISK‐BEARING INSTRUMENTS
Country Report: Azerbaijan Page 33
6. GAPS IN PRIVATE SECTOR FINANCING
Conclusion: There is a moderate gap in the financing of SMEs in Azerbaijan. This gap is most pronounced for loan products, for the agricultural sector, and for rural enterprises, particular those located in remote regions. Key findings:
The financing gap for non‐loan products is low overall, but this is mainly a result of low demand stemming from lack of familiarity with these other products.
Overall, there are no major gaps in the funding of intermediaries, and most financial institutions do not perceive lack of funding as a major constraint.
By sector, the SME funding gap is probably highest for the agriculture sector. The trade sector is characterized by high demand but also high supply, so the gap for trading enterprises is estimated to be modest.
Overall, there are no major gaps in the funding of intermediaries, and most financial institutions do not perceive lack of funding as a major constraint. There are some exceptions to this, particularly in the case of leasing companies and some of the smaller banks and MFIs.
6.1 Gaps by instrument
The demand and supply gap is the greatest by far for loans, mainly as a result of relatively small scale of both demand and supply for other products, such as risk capital, letters of credit, and leases. There is a general consensus that a leasing gap exists, but it appears to be small compared to the loan gap, mainly as a result of relatively weak demand for leasing. The relatively high cost of leasing due to a tax disadvantage, low awareness of leasing products, a cultural preference for ownership, and funding difficulties faced by some leasing companies all contribute to the small scale of both supply and demand. The situation for unfunded trade finance products such as letters of credit and trade guarantees is similar to that for leasing, characterized by both a low level of demand and supply, leading to a small funding gap. Some banks report actively marketing LCs to their clients but finding little interest. The gap for risk capital is difficult to estimate, but is probably relatively low due to lack of demand, which is driven partly by lack of awareness of risk capital products and cultural factors. Some demand for risk capital is satisfied by informal sources, but most SMEs do not have access to relatively wealthy friends and relatives. A combination of awareness‐building, the development of a supporting ecosystem of incubators, conferences, and investor networks, and the creation of private funds will all be needed to create a strong environment for risk capital financing.
6.2 Gaps by type of SME
By sector, the SME funding gap is probably highest for the agriculture sector. The combination of the remote, rural location of most agribusinesses and lenders’ perception of above‐average risk explain much of this gap. Further development of the nascent agricultural insurance sector would go a long way towards encouraging greater supply. Although total demand is highest from enterprises engaging in trade, the overall gap for that sector is likely to be relatively small; financial institutions are generally more comfortable working with trading enterprises than others, so the supply of funding is relatively high.
PRIVATE SECTOR FINANCING IN THE EASTERN PARTNERSHIP COUNTRIES AND THE ROLE OF RISK‐BEARING INSTRUMENTS
Country Report: Azerbaijan Page 34
In terms of location, the funding gap is highest for rural enterprises and for enterprises located in more remote parts of the country, not close to a major urban centre. This is reflected in the high concentration of bank branches in Baku and a few other major cities.
6.3 Gaps in funding of intermediaries
Overall, there are no major gaps in the funding of intermediaries, and most financial institutions do not perceive lack of funding as a major constraint. The combination of consistent deposit growth, government funding, and the active presence of development finance institutions ensure that most intermediaries are able to attract needed funding. There are some exceptions to this, particularly in the case of leasing companies and some of the smaller banks and MFIs, which sometimes have difficulty attracting the attention of international institutions which offer funding. However, as leasing companies and the smaller banks and MFIs represent a relatively minor share of overall funding, the impact of this gap on SMEs is not severe.
6.4 Potential and capability of DFIs to fill gaps
Most of the major international development institutions are active in Azerbaijan. While the largest share of DFI funding goes to large infrastructure projects, lending to financial institutions for the purpose of on‐lending to MSMEs is widely practiced. All of the local of staff of DFIs interviewed for this study were of the opinion that there is room for another development institution offering the standard MSME credit lines to banks and MFIs. Asian Development Bank (ADB): ADB has been working in Azerbaijan since 1999. Its main focus in recent years, based on the country strategy for 2012‐2014, has been infrastructure development. There are no active projects directly targeting the SME sector, but some projects offer some indirect benefits to SMEs. For example, the Gender Mainstreaming project provides financial literacy and entrepreneurship training to women, which could lead to the creation of new SMEs and better access to finance. The Trade Finance Program, although not solely dedicated to SMEs, has supported USD 41 million in trade through 52 transactions on behalf of SMEs. ADB has made four loans (cumulative) to the financial sector – to IBA, AG Bank, Bank of Baku, and Access Bank – for USD 66 million, representing 4.6% of all ADB loans. As part of its new Rural Inclusion Project, ADB will make an unsecured USD 50 million loan to Access Bank in 2013 for MSME lending in rural areas. ADB has made cumulative TA grants from 2001‐2012 of USD 14.3 million, most of which went to the government and to investment project loan recipients. Most ADB loans are to the government, but five non‐sovereign projects have received USD 93 million in financing since ADB’s inception. EBRD: EBRD reports that it is the largest investor in both the private sector and financial sector of Azerbaijan. Among development institutions, EBRD is the biggest lender to the financial sector, with loans outstanding to nine local banks and four MFIs. EBRD also has equity stakes in Access Bank, Demirbank, and Unibank. 21% of active projects are dedicated to the financial sector, mostly in support of MSME lending. EBRD’s current strategy (2010 – 2013) includes support for microfinance in regions, development of leasing, mortgage financing, and energy efficiency financing. In terms of technical assistance, EBRD has a Small Business Support (SBS) program providing advisory services to local companies. EBRD also has a capacity building project with Baku Stock Exchange, which could eventually benefit SMEs by offering new avenues to raise capital. EBRD is participating in the private equity sector by co‐investing with Azerbaijan Investment Company in local businesses. The private sector represents about 43% of EBRD’s total portfolio of EUR 667 million in Azerbaijan at the end of 2012.
PRIVATE SECTOR FINANCING IN THE EASTERN PARTNERSHIP COUNTRIES AND THE ROLE OF RISK‐BEARING INSTRUMENTS
Country Report: Azerbaijan Page 35
KfW: KfW has two active projects in Azerbaijan related to the financial sector. One is the German‐Azeri Fund (GAF), which provides credit lines to six local banks39 for MSME lending, with an outstanding portfolio of approximately EUR 12 million. Funding recipients also gain access to technical assistance, which mainly takes the form of seminars and training for staff. This project will be completed at the end of 2014, at which time the funds will belong to the Azeri government. The second is the Rural Lending Project, which consists of lending, equity investment, and technical assistance to local financial institutions (so far Bank Respublika and KredAqro). KfW is expected to focus most of its resources on infrastructure projects in the coming years. IFC: IFC is an active lender to the financial sector for the purpose of MSME support. Since 2009 IFC has made five loans to local FIs40 for a total of USD 59 million. It owns minority stakes in Access Bank and AG Bank. The IFC’s main project related to the financial sector is the Financial Markets Infrastructure Advisory Services Project. This has a number of components, including support for the creation of a private credit bureau, a risk management certification programme for bank employees, and financial literacy trainings. The project includes assistance to the government to draft a law for a movable collateral registry, the absence of which is one of the key institutional constraints for the banking sector. IFC has invested a total of USD 393 million since 1995, covering 67 total projects. Black Sea Trade and Development Bank (BSTDB): BSTDB supports the SME sector primarily through provision of credit lines to local banks and MFIs. Loans in recent years to TBC Kredit (USD 4 million), Unibank (USD 5 million), FINCA (USD 10 million), Azer‐Turk Bank (USD 3 million), and Demirbank (USD 15 million) were all designated for MSMEs. The development bank also has loans outstanding to Access Bank, Bank Technique, and Bank Respublika. BSTDB was one of the founders of Access Bank and holds a 20% stake. BSTDB can also support SMEs directly through loans (in amounts over EUR 3 million) and equity (up to a 33% stake). BSTDB’s active portfolio in Azerbaijan consisted of 18 projects for an amount of EUR 87.7 million at year‐end 2012.
39 AG Bank, Bank of Baku, Demirbank, Unibank, Bank Respublika, and Parabank 40 Access Bank, FINCA Azerbaijan, Turanbank, Bank Respublika, and AG Bank
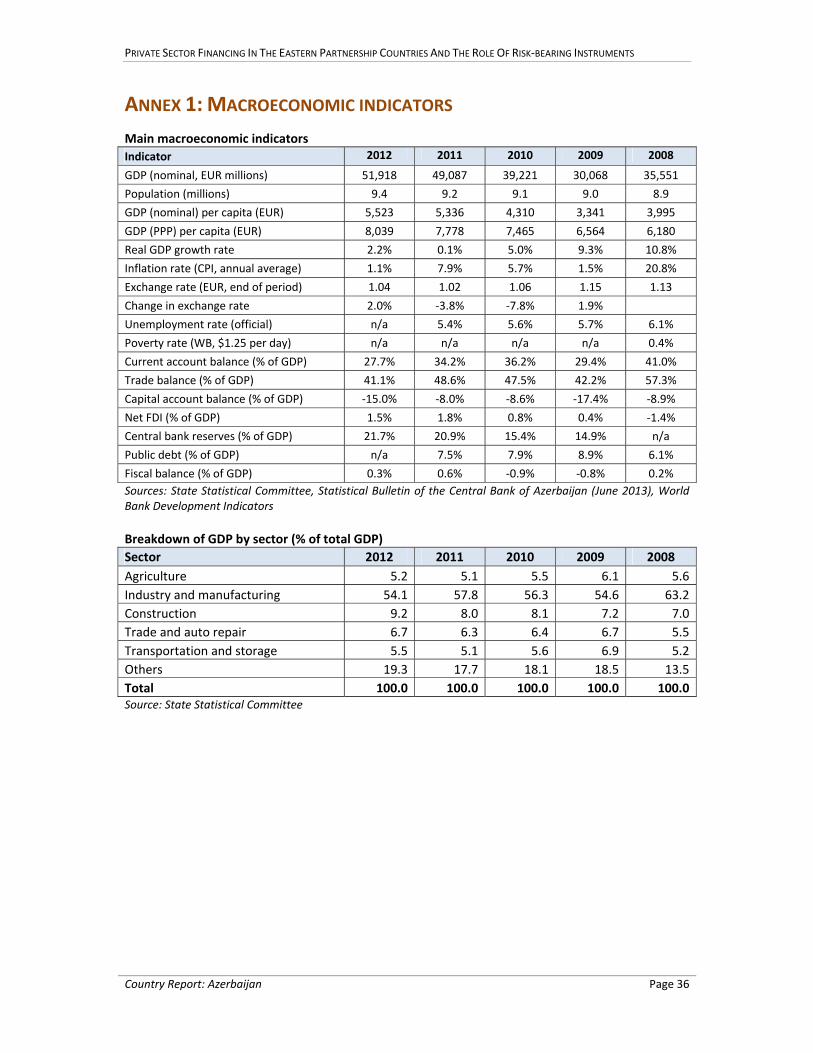
PRIVATE SECTOR FINANCING IN THE EASTERN PARTNERSHIP COUNTRIES AND THE ROLE OF RISK‐BEARING INSTRUMENTS
Country Report: Azerbaijan Page 36
ANNEX 1: MACROECONOMIC INDICATORS
Main macroeconomic indicators
Indicator 2012 2011 2010 2009 2008
GDP (nominal, EUR millions) 51,918 49,087 39,221 30,068 35,551
Population (millions) 9.4 9.2 9.1 9.0 8.9
GDP (nominal) per capita (EUR) 5,523 5,336 4,310 3,341 3,995
GDP (PPP) per capita (EUR) 8,039 7,778 7,465 6,564 6,180
Real GDP growth rate 2.2% 0.1% 5.0% 9.3% 10.8%
Inflation rate (CPI, annual average) 1.1% 7.9% 5.7% 1.5% 20.8%
Exchange rate (EUR, end of period) 1.04 1.02 1.06 1.15 1.13
Change in exchange rate 2.0% ‐3.8% ‐7.8% 1.9%
Unemployment rate (official) n/a 5.4% 5.6% 5.7% 6.1%
Poverty rate (WB, $1.25 per day) n/a n/a n/a n/a 0.4%
Current account balance (% of GDP) 27.7% 34.2% 36.2% 29.4% 41.0%
Trade balance (% of GDP) 41.1% 48.6% 47.5% 42.2% 57.3%
Capital account balance (% of GDP) ‐15.0% ‐8.0% ‐8.6% ‐17.4% ‐8.9%
Net FDI (% of GDP) 1.5% 1.8% 0.8% 0.4% ‐1.4%
Central bank reserves (% of GDP) 21.7% 20.9% 15.4% 14.9% n/a
Public debt (% of GDP) n/a 7.5% 7.9% 8.9% 6.1%
Fiscal balance (% of GDP) 0.3% 0.6% ‐0.9% ‐0.8% 0.2%
Sources: State Statistical Committee, Statistical Bulletin of the Central Bank of Azerbaijan (June 2013), World Bank Development Indicators
Breakdown of GDP by sector (% of total GDP)
Sector 2012 2011 2010 2009 2008
Agriculture 5.2 5.1 5.5 6.1 5.6
Industry and manufacturing 54.1 57.8 56.3 54.6 63.2
Construction 9.2 8.0 8.1 7.2 7.0
Trade and auto repair 6.7 6.3 6.4 6.7 5.5
Transportation and storage 5.5 5.1 5.6 6.9 5.2
Others 19.3 17.7 18.1 18.5 13.5
Total 100.0 100.0 100.0 100.0 100.0Source: State Statistical Committee
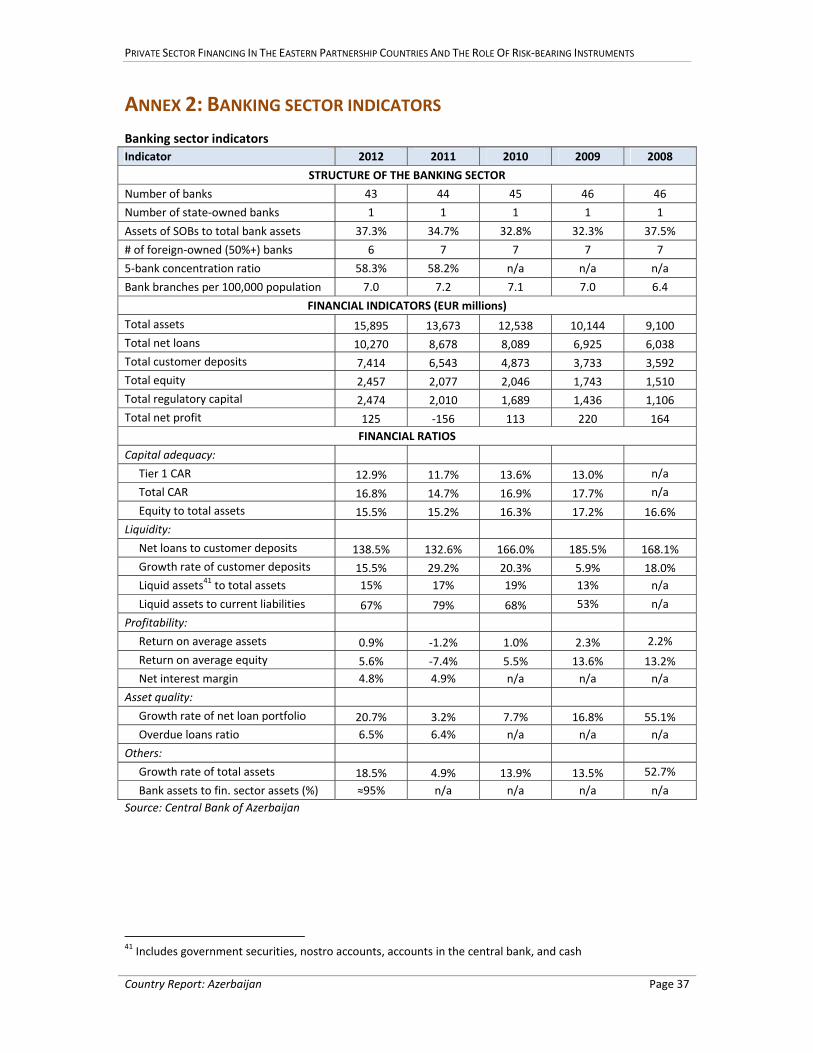
PRIVATE SECTOR FINANCING IN THE EASTERN PARTNERSHIP COUNTRIES AND THE ROLE OF RISK‐BEARING INSTRUMENTS
Country Report: Azerbaijan Page 37
ANNEX 2: BANKING SECTOR INDICATORS
Banking sector indicators
Indicator 2012 2011 2010 2009 2008
STRUCTURE OF THE BANKING SECTOR
Number of banks 43 44 45 46 46
Number of state‐owned banks 1 1 1 1 1
Assets of SOBs to total bank assets 37.3% 34.7% 32.8% 32.3% 37.5%
# of foreign‐owned (50%+) banks 6 7 7 7 7
5‐bank concentration ratio 58.3% 58.2% n/a n/a n/a
Bank branches per 100,000 population 7.0 7.2 7.1 7.0 6.4
FINANCIAL INDICATORS (EUR millions)
Total assets 15,895 13,673 12,538 10,144 9,100
Total net loans 10,270 8,678 8,089 6,925 6,038
Total customer deposits 7,414 6,543 4,873 3,733 3,592
Total equity 2,457 2,077 2,046 1,743 1,510
Total regulatory capital 2,474 2,010 1,689 1,436 1,106
Total net profit 125 ‐156 113 220 164
FINANCIAL RATIOS
Capital adequacy:
Tier 1 CAR 12.9% 11.7% 13.6% 13.0% n/a
Total CAR 16.8% 14.7% 16.9% 17.7% n/a
Equity to total assets 15.5% 15.2% 16.3% 17.2% 16.6%
Liquidity:
Net loans to customer deposits 138.5% 132.6% 166.0% 185.5% 168.1%
Growth rate of customer deposits 15.5% 29.2% 20.3% 5.9% 18.0%
Liquid assets41 to total assets 15% 17% 19% 13% n/a
Liquid assets to current liabilities 67% 79% 68% 53% n/a
Profitability:
Return on average assets 0.9% ‐1.2% 1.0% 2.3% 2.2%
Return on average equity 5.6% ‐7.4% 5.5% 13.6% 13.2%
Net interest margin 4.8% 4.9% n/a n/a n/a
Asset quality:
Growth rate of net loan portfolio 20.7% 3.2% 7.7% 16.8% 55.1%
Overdue loans ratio 6.5% 6.4% n/a n/a n/a
Others:
Growth rate of total assets 18.5% 4.9% 13.9% 13.5% 52.7%
Bank assets to fin. sector assets (%) ≈95% n/a n/a n/a n/a
Source: Central Bank of Azerbaijan
41 Includes government securities, nostro accounts, accounts in the central bank, and cash
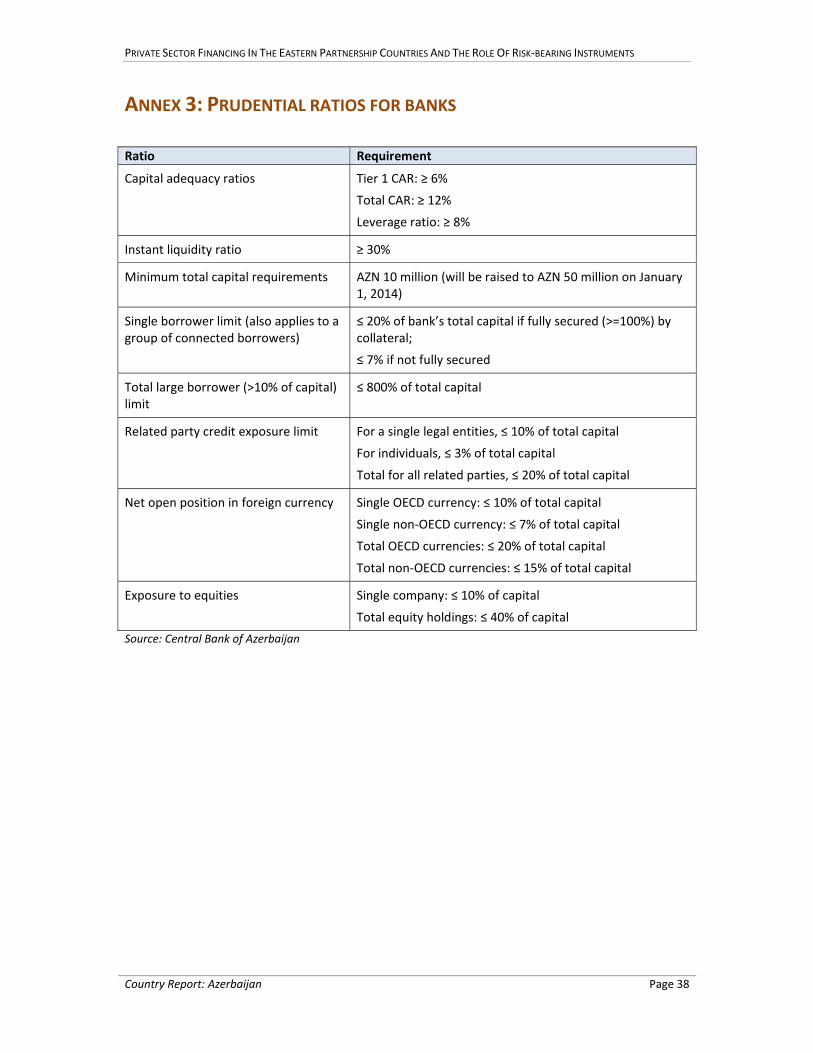
PRIVATE SECTOR FINANCING IN THE EASTERN PARTNERSHIP COUNTRIES AND THE ROLE OF RISK‐BEARING INSTRUMENTS
Country Report: Azerbaijan Page 38
ANNEX 3: PRUDENTIAL RATIOS FOR BANKS
Ratio Requirement
Capital adequacy ratios Tier 1 CAR: ≥ 6%
Total CAR: ≥ 12%
Leverage ratio: ≥ 8%
Instant liquidity ratio ≥ 30%
Minimum total capital requirements AZN 10 million (will be raised to AZN 50 million on January 1, 2014)
Single borrower limit (also applies to a group of connected borrowers)
≤ 20% of bank’s total capital if fully secured (>=100%) by collateral;
≤ 7% if not fully secured
Total large borrower (>10% of capital) limit
≤ 800% of total capital
Related party credit exposure limit For a single legal entities, ≤ 10% of total capital
For individuals, ≤ 3% of total capital
Total for all related parties, ≤ 20% of total capital
Net open position in foreign currency Single OECD currency: ≤ 10% of total capital
Single non‐OECD currency: ≤ 7% of total capital
Total OECD currencies: ≤ 20% of total capital
Total non‐OECD currencies: ≤ 15% of total capital
Exposure to equities Single company: ≤ 10% of capital
Total equity holdings: ≤ 40% of capital
Source: Central Bank of Azerbaijan
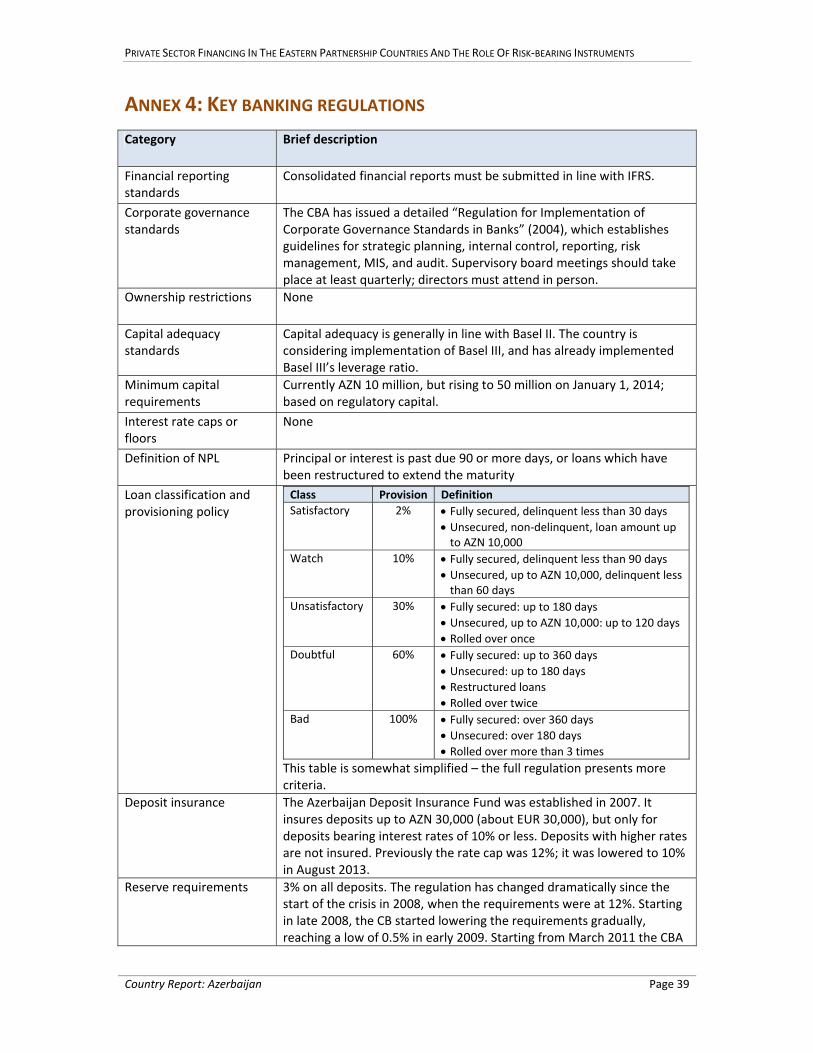
PRIVATE SECTOR FINANCING IN THE EASTERN PARTNERSHIP COUNTRIES AND THE ROLE OF RISK‐BEARING INSTRUMENTS
Country Report: Azerbaijan Page 39
ANNEX 4: KEY BANKING REGULATIONS
Category Brief description
Financial reporting standards
Consolidated financial reports must be submitted in line with IFRS.
Corporate governance standards
The CBA has issued a detailed “Regulation for Implementation of Corporate Governance Standards in Banks” (2004), which establishes guidelines for strategic planning, internal control, reporting, risk management, MIS, and audit. Supervisory board meetings should take place at least quarterly; directors must attend in person.
Ownership restrictions None
Capital adequacy standards
Capital adequacy is generally in line with Basel II. The country is considering implementation of Basel III, and has already implemented Basel III’s leverage ratio.
Minimum capital requirements
Currently AZN 10 million, but rising to 50 million on January 1, 2014; based on regulatory capital.
Interest rate caps or floors
None
Definition of NPL Principal or interest is past due 90 or more days, or loans which have been restructured to extend the maturity
Loan classification and provisioning policy
Class Provision Definition
Satisfactory 2% Fully secured, delinquent less than 30 days Unsecured, non‐delinquent, loan amount up to AZN 10,000
Watch 10% Fully secured, delinquent less than 90 days Unsecured, up to AZN 10,000, delinquent less than 60 days
Unsatisfactory 30% Fully secured: up to 180 days Unsecured, up to AZN 10,000: up to 120 days Rolled over once
Doubtful 60% Fully secured: up to 360 days Unsecured: up to 180 days Restructured loans Rolled over twice
Bad 100% Fully secured: over 360 days Unsecured: over 180 days Rolled over more than 3 times
This table is somewhat simplified – the full regulation presents more criteria.
Deposit insurance The Azerbaijan Deposit Insurance Fund was established in 2007. It insures deposits up to AZN 30,000 (about EUR 30,000), but only for deposits bearing interest rates of 10% or less. Deposits with higher rates are not insured. Previously the rate cap was 12%; it was lowered to 10% in August 2013.
Reserve requirements 3% on all deposits. The regulation has changed dramatically since the start of the crisis in 2008, when the requirements were at 12%. Starting in late 2008, the CB started lowering the requirements gradually, reaching a low of 0.5% in early 2009. Starting from March 2011 the CBA

PRIVATE SECTOR FINANCING IN THE EASTERN PARTNERSHIP COUNTRIES AND THE ROLE OF RISK‐BEARING INSTRUMENTS
Country Report: Azerbaijan Page 40
begin gradually increasing the requirements again.
Anti‐money laundering An anti‐money laundering law was passed in 2009. The Financial Monitoring Services is the relevant supervisor.
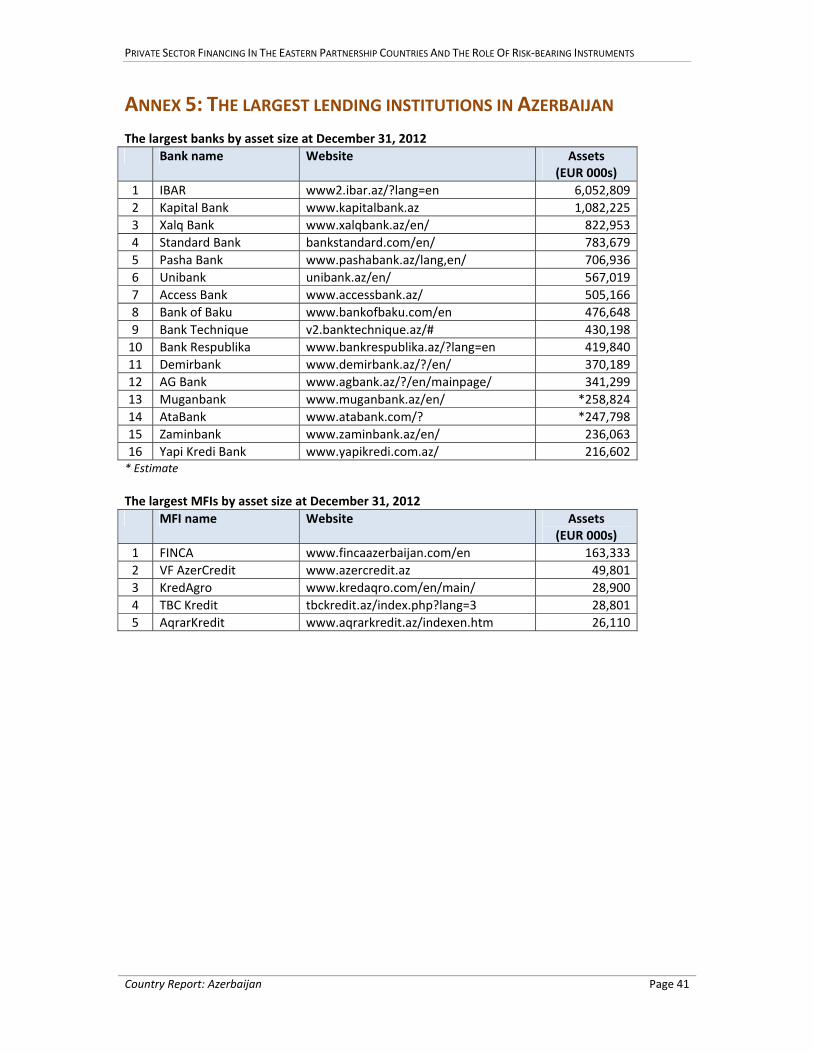
PRIVATE SECTOR FINANCING IN THE EASTERN PARTNERSHIP COUNTRIES AND THE ROLE OF RISK‐BEARING INSTRUMENTS
Country Report: Azerbaijan Page 41
ANNEX 5: THE LARGEST LENDING INSTITUTIONS IN AZERBAIJAN
The largest banks by asset size at December 31, 2012
Bank name Website Assets (EUR 000s)
1 IBAR www2.ibar.az/?lang=en 6,052,809
2 Kapital Bank www.kapitalbank.az 1,082,225
3 Xalq Bank www.xalqbank.az/en/ 822,953
4 Standard Bank bankstandard.com/en/ 783,679
5 Pasha Bank www.pashabank.az/lang,en/ 706,936
6 Unibank unibank.az/en/ 567,019
7 Access Bank www.accessbank.az/ 505,166
8 Bank of Baku www.bankofbaku.com/en 476,648
9 Bank Technique v2.banktechnique.az/# 430,198
10 Bank Respublika www.bankrespublika.az/?lang=en 419,840
11 Demirbank www.demirbank.az/?/en/ 370,189
12 AG Bank www.agbank.az/?/en/mainpage/ 341,299
13 Muganbank www.muganbank.az/en/ *258,824
14 AtaBank www.atabank.com/? *247,798
15 Zaminbank www.zaminbank.az/en/ 236,063
16 Yapi Kredi Bank www.yapikredi.com.az/ 216,602 * Estimate
The largest MFIs by asset size at December 31, 2012
MFI name Website Assets (EUR 000s)
1 FINCA www.fincaazerbaijan.com/en 163,333
2 VF AzerCredit www.azercredit.az 49,801
3 KredAgro www.kredaqro.com/en/main/ 28,900
4 TBC Kredit tbckredit.az/index.php?lang=3 28,801
5 AqrarKredit www.aqrarkredit.az/indexen.htm 26,110
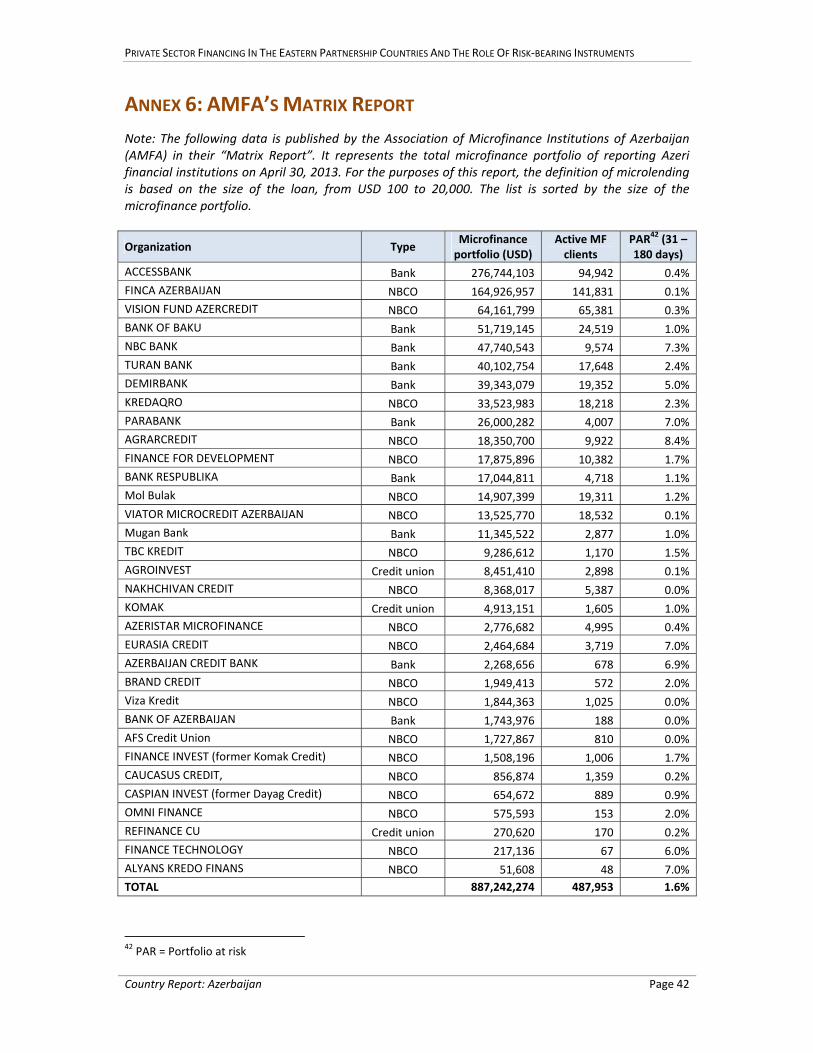
PRIVATE SECTOR FINANCING IN THE EASTERN PARTNERSHIP COUNTRIES AND THE ROLE OF RISK‐BEARING INSTRUMENTS
Country Report: Azerbaijan Page 42
ANNEX 6: AMFA’S MATRIX REPORT
Note: The following data is published by the Association of Microfinance Institutions of Azerbaijan (AMFA) in their “Matrix Report”. It represents the total microfinance portfolio of reporting Azeri financial institutions on April 30, 2013. For the purposes of this report, the definition of microlending is based on the size of the loan, from USD 100 to 20,000. The list is sorted by the size of the microfinance portfolio.
Organization Type Microfinance portfolio (USD)
Active MF clients
PAR42 (31 –180 days)
ACCESSBANK Bank 276,744,103 94,942 0.4%
FINCA AZERBAIJAN NBCO 164,926,957 141,831 0.1%
VISION FUND AZERCREDIT NBCO 64,161,799 65,381 0.3%
BANK OF BAKU Bank 51,719,145 24,519 1.0%
NBC BANK Bank 47,740,543 9,574 7.3%
TURAN BANK Bank 40,102,754 17,648 2.4%
DEMIRBANK Bank 39,343,079 19,352 5.0%
KREDAQRO NBCO 33,523,983 18,218 2.3%
PARABANK Bank 26,000,282 4,007 7.0%
AGRARCREDIT NBCO 18,350,700 9,922 8.4%
FINANCE FOR DEVELOPMENT NBCO 17,875,896 10,382 1.7%
BANK RESPUBLIKA Bank 17,044,811 4,718 1.1%
Mol Bulak NBCO 14,907,399 19,311 1.2%
VIATOR MICROCREDIT AZERBAIJAN NBCO 13,525,770 18,532 0.1%
Mugan Bank Bank 11,345,522 2,877 1.0%
TBC KREDIT NBCO 9,286,612 1,170 1.5%
AGROINVEST Credit union 8,451,410 2,898 0.1%
NAKHCHIVAN CREDIT NBCO 8,368,017 5,387 0.0%
KOMAK Credit union 4,913,151 1,605 1.0%
AZERISTAR MICROFINANCE NBCO 2,776,682 4,995 0.4%
EURASIA CREDIT NBCO 2,464,684 3,719 7.0%
AZERBAIJAN CREDIT BANK Bank 2,268,656 678 6.9%
BRAND CREDIT NBCO 1,949,413 572 2.0%
Viza Kredit NBCO 1,844,363 1,025 0.0%
BANK OF AZERBAIJAN Bank 1,743,976 188 0.0%
AFS Credit Union NBCO 1,727,867 810 0.0%
FINANCE INVEST (former Komak Credit) NBCO 1,508,196 1,006 1.7%
CAUCASUS CREDIT, NBCO 856,874 1,359 0.2%
CASPIAN INVEST (former Dayag Credit) NBCO 654,672 889 0.9%
OMNI FINANCE NBCO 575,593 153 2.0%
REFINANCE CU Credit union 270,620 170 0.2%
FINANCE TECHNOLOGY NBCO 217,136 67 6.0%
ALYANS KREDO FINANS NBCO 51,608 48 7.0%
TOTAL 887,242,274 487,953 1.6%
42 PAR = Portfolio at risk
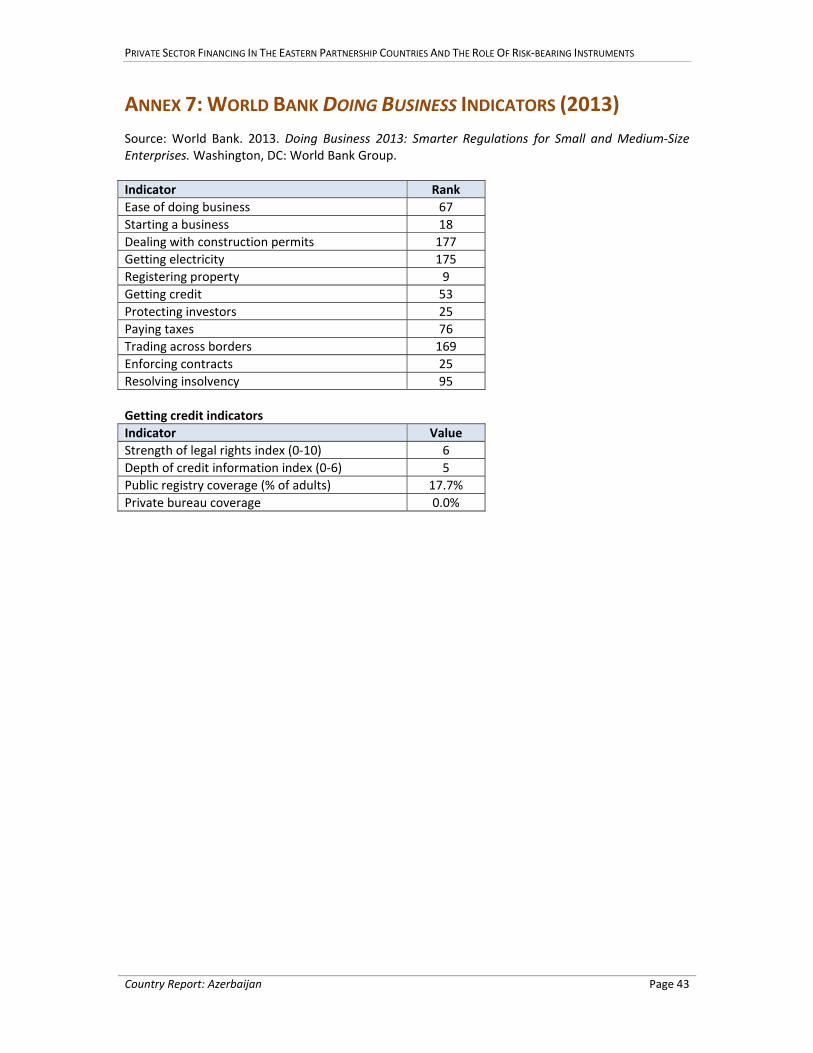
PRIVATE SECTOR FINANCING IN THE EASTERN PARTNERSHIP COUNTRIES AND THE ROLE OF RISK‐BEARING INSTRUMENTS
Country Report: Azerbaijan Page 43
ANNEX 7: WORLD BANK DOING BUSINESS INDICATORS (2013)
Source: World Bank. 2013. Doing Business 2013: Smarter Regulations for Small and Medium‐Size Enterprises. Washington, DC: World Bank Group.
Indicator Rank
Ease of doing business 67
Starting a business 18
Dealing with construction permits 177
Getting electricity 175
Registering property 9
Getting credit 53
Protecting investors 25
Paying taxes 76
Trading across borders 169
Enforcing contracts 25
Resolving insolvency 95
Getting credit indicators
Indicator Value
Strength of legal rights index (0‐10) 6
Depth of credit information index (0‐6) 5
Public registry coverage (% of adults) 17.7%
Private bureau coverage 0.0%
PRIVATE SECTOR FINANCING IN THE EASTERN PARTNERSHIP COUNTRIES AND THE ROLE OF RISK‐BEARING INSTRUMENTS
Country Report: Azerbaijan Page 44
ANNEX 8: PROSPECTS OF THE LARGE ENTERPRISE SECTOR
The attitude of the majority of financial institutions regarding the prospects for lending to the was generally negative, perhaps more so than in any of the other EP countries. This negative attitude was not due to the prospects for large businesses themselves, which is perceived as strong, but due to their high bargaining power relative to banks. In comparison to the relatively high margins which banks can earn on MSME and consumer loans, pricing on large corporate credits is very low, even more so than would be suggested simply by the larger loan sizes. Furthermore, credit growth is much higher in the small enterprise and consumer sectors. The large enterprise sector is already saturated in terms of credit, while there are still MSMEs and households that lack access to funding. It should be noted that the surveyed institutions skewed towards those with minimal political connections among the owners. Such institutions generally have more difficulty attracting large enterprises, which may partly account for their negative attitude towards the sector. By contrast, the banks which are politically connected (see Annex 9) may have a more favorable outlook. The corporate sector in Azerbaijan is noteworthy for the high contribution to total output of oil sector enterprises, which are generally financed by foreign banks rather than local banks. Another key feature is the presence of large business conglomerates which have close political connections, which in some cases are financed by their own pocket banks. Both of these features reduce the opportunities for local banks with no political connections to reach the corporate sector. The government does not maintain statistics on the number of large enterprises in the country. However, the size and importance of the large corporate sector can be inferred from the very large share of medium and large enterprises to total employment and total turnover of 91.3% and 92.6% in 2011. Although these statistics group medium and large enterprises together, the medium enterprise segment is reportedly quite small relative to the large enterprise segment, so most of the employment and output can be attributed to large enterprises. The corporate sector is targeted by IFIs such as ADB and EBRD. ADB, for example, has made a total of five non‐sovereign loans in a cumulative amount of USD 93 million. EBRD made loans in 2012 to an electronics retailer, water and soft drinks producer, and an ice cream manufacturer.

03/2014 © E IB GraphicTeam
Contacts
Economics Department3 (+352) 43 79 - 861475 (+352) 43 79 - 67799
European Investment Bank98 -100, boulevard Konrad AdenauerL-2950 Luxembourg3 (+352) 43 79 - 15 (+352) 43 77 04www.eib.org