b. hale, g. wilemski and a. viets physics department missouri university of science &...
DESCRIPTION
Monte Carlo Simulations of Growth/Decay Rate Constant Ratios for Small Methanol Clusters: Application to Nucleation Data Analysis. B. Hale, G. Wilemski and A. Viets Physics Department Missouri University of Science & Technology. Outline. - PowerPoint PPT PresentationTRANSCRIPT

Monte Carlo Simulations of Growth/Decay Rate Constant Ratios
for Small Methanol Clusters: Application to Nucleation Data Analysis
B. Hale, G. Wilemski and A. VietsPhysics Department
Missouri University of Science & Technology

Outline
• Scaling of nucleation rates / non scaling of methanol experimental rates
• Monte Carlo methanol cluster simulations:
small cluster growth/decay rates subcritical cluster heats of formation
• Prediction of higher experimental T, lower S.
• Summary of results.

Scaling Analysis of the Nucleation Rate* at T << Tc*B. Hale, Phys. Rev A 33, 4156 (1986); B. Hale, J. Chem. Phys. 122, 204509 (2005);
B. Hale & M. Thomason, Phys. Rev. Letters 105, 046101 (2010)
J(S, T) = J( lnS/[Tc/T-1]3/2)
Scaling Plot:
-log(J/1026) = Co [Tc/T - 1]3/[ln(S)2]
Substances demonstrating scaling include water, toluene, nonane,
n-octane, n-decane, n-pentanol, n-butanol, and n-propanol.
the scaling function
C0 = (16π/3)Ω3/ln(10) Ω ~ 2.1 for normal liquids
~1.5 for substances with dipole moment

Scaling of toluene data
Schmitt et al., J. Chem. Phys. 79, 4496 (1983); Hale & Thomason, Phys. Rev. Letters 105, 046101 (2010)
Co lnS/[Tc/T-1]3/2
2 3 4lo
g(J
/ cm
-3s-1
)1-
0
1
2
3
4
259K
217K
233K
Jexp (O) Jscaled (+)
Schmitt et al. toluene data b)
lnS
2 3 4
log(
J / c
m-3
s-1)
1-
0
1
2
3
4
259K
217K
233K
Jexp (O) Jscaled (+)
Schmitt et al. toluene data a)
Co = [Tc /240-1]3/2
Tc = 591.8K
C7H8
C0 lnS/[Tc/T-1]3/2lnS

Scaling plot for water data
Ω = 1.47

The SSW methanol data do not scale
Strey, Schmeling, and Wagner, JCP 85, 6192 (1986) (SSW)
Rates have beencorrected by SSW for
heats of formationfor n = 2 – 4.
Subcritical cluster heats of formationlead to an increase in the final T, and
a lowering of S.

Monte Carlo simulations are used to estimate small n-cluster heats of formation (including n > 4)
in the adiabatic expansion.
• 3- site pair potential of M. E. van Leeuwen and B. Smit, J. Phys Chem, 99,1831 (1995);
• Bennett Monte Carlo technique free energy differences.
δfn= - ln[Qn/(Qn-1Q1)]
n ranges from 2 to 96
(for formalism see B. Hale & M. Thomason, PRL 105, 046101 (2010))

0 0.1 0.2 0.3 0.4 0.5 0.6 0.7 0.8 0.90.00
2.00
4.00
6.00
8.00
10.00
12.00
14.00
16.00
18.00
20.00
f(x) = − 4.28783133333334 x + 10.4548919743521R² = 1
f(x) = − 2.02049154003061 ln(x) + 6.8212830784748R² = 0.35135659250292
T = 220 KT = 240 KT = 260 KLinear (T = 260 K)Logarithmic (T = 260 K)
n-1/3
df
n /
[ T
c /
T-1
]Tc = 532K
W
Scaled MC free energy differences-δfn scale at low T
with [Tc/T-1].
Tc for model(no cutoff)
~ 532K
Monte Carlo results for van Leeuwen / Smit methanol potential
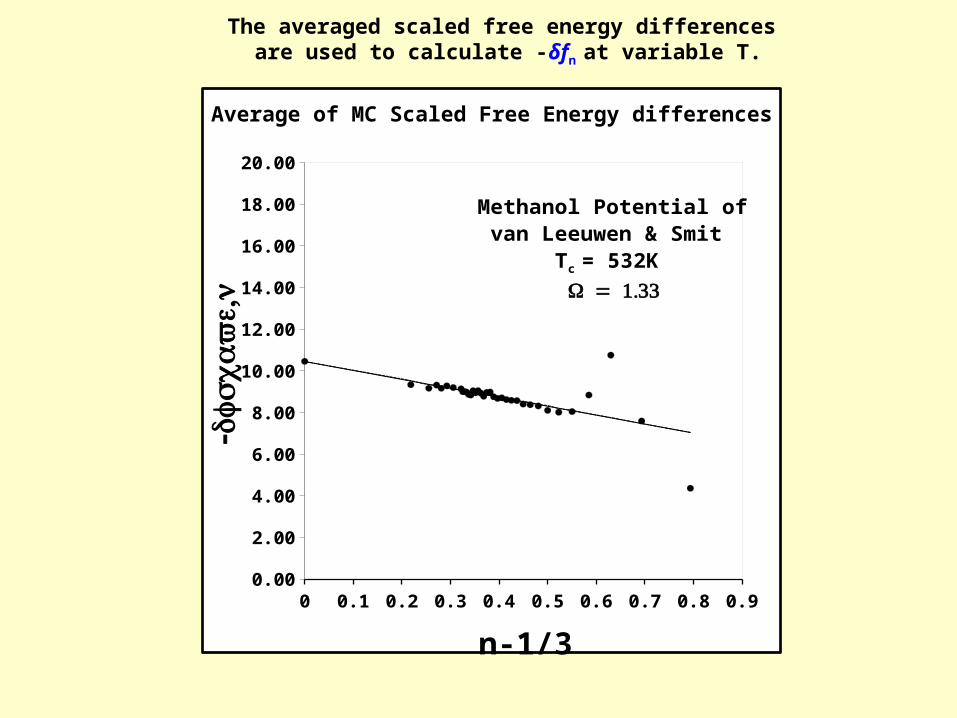
0 0.1 0.2 0.3 0.4 0.5 0.6 0.7 0.8 0.90.00
2.00
4.00
6.00
8.00
10.00
12.00
14.00
16.00
18.00
20.00
n-1/3
-,
dfscaven
Methanol Potential of van Leeuwen & Smit Tc = 532K = 1.33W
Average of MC Scaled Free Energy differences
The averaged scaled free energy differences are used to calculate -δfn at variable T.

Equilibrium constants and -δfn
• Equilibrium constant for the n-mer:
Kn = Nn /(N1)n
= (kTnliquid)1-n exp(Σj=2…n -δfn)
• Kn = Kn-1 exp(-δfn) for n = 3 and n > 4
• K2 and K4 normalized to experimental values
(Renner, Kucera & Blander, JCP 66, 177 (1977))
• Tetramer molar dissociation enthalpy and entropy:
ΔH = 23.9 kcal/mol, ΔS = 81.0 cal/mol/K

Experimental methanol rates with MC corrected T and S
The supersonic nozzledata of Laksmono,
Tanamura and Wyslouzil et al.
[JPC 135, 07435 (2011)]are as published.
Strey, Wagner & Schmelling,JCP 84, 2325 (1986) datahave corrected T, S from
Monte Carlo resultspresented here.
ΔH4 = 23.9 kcal/mol ΔS4 = 81.0 cal/mol/K

MC nucleation ratesare calculated usingkinetic steady-state
nucleation rateformalism with
T’c/T’ = Tc/T.and T’c = 532 K
for model potential.*
*Dunikov et al. JCP 115, 6623 (2001)
Monte Carlo results for the methanol nucleation ratefrom the van Leeuwen & Smit model potential

Old with n = 2 - 4 New with MC n = 2-12

Summary & Conclusions
• MC free energy differences for n = 2-12 applied to estimates of subcritical heats of formation can improve scaling properties of the methanol rate data.
• Questions remain regarding potential model Tc and the thermodynamic properties of the tetramer.
• Use of [Tc/T ]model = [Tc/T]exp in MC potential model
predictions for J gives good results.

Thank you!

data from Renner, Kucera & Blander, JCP 66, 177 (1977)

Final S and T depend on largest cluster size, n, used in expansion calculations

The heat of association (and sub-critical cluster formation) can greatly affect the final thermodynamic ( T, S) state of the gas.
T and S are plotted vs. the pressure drop of expansion (heats of formation included for n = 2-4). From
Strey, Schmeling, and Wagner, JCP 1986.

10-5
10-4
10-3
10-2
Cn
/C1
280 270 260 250 240T (K)
S=1 S=2 S=3 S=4
C2
C3
C4 C5
C6
Small n-mer concentrations formed during expansion from T=278 K, pM=5.53 kPa
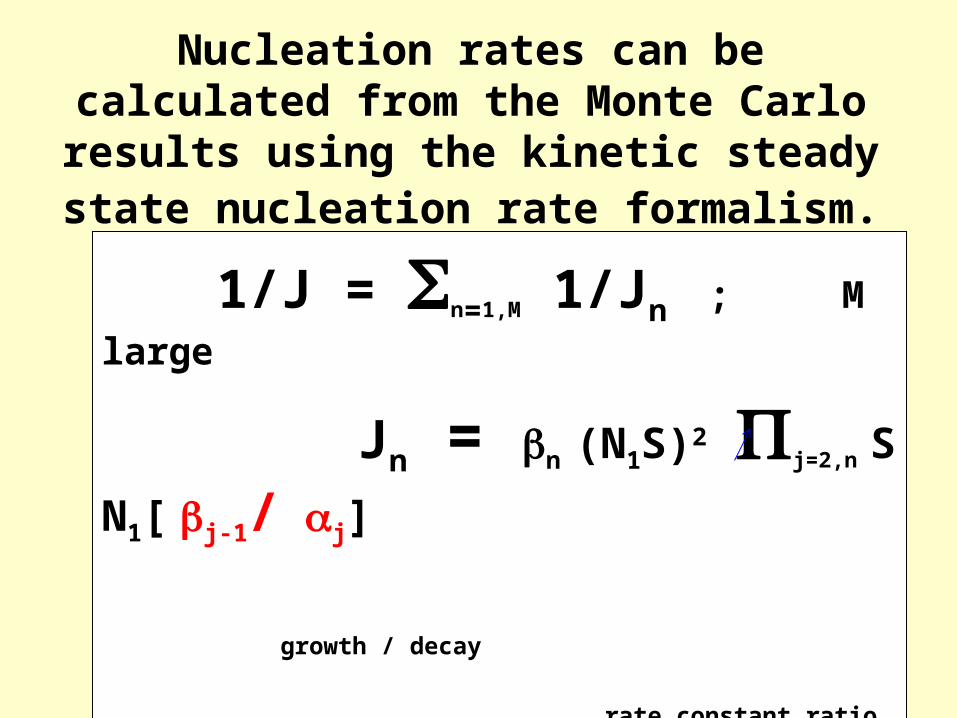
Nucleation rates can be calculated from the Monte Carlo results using the kinetic steady
state nucleation rate formalism.
1/J = n=1,M 1/Jn ; M large
Jn = n (N1S)2 j=2,n S N1[ j-1/ j]
growth / decay
rate constant ratio
S = Nexp1 /N1 P/Po

Growth/Decay Rate Constant Ratios Calculated from Monte Carlo
Detailed balance:
n-1 Nn-1N1= n Nn
ln(N1n-1 /n) = ln[Nn/Nn-1]
= - fn – ln [liquid/1] from Monte Carlo

MC results must be calibrated using experimental dimer and tetramer data
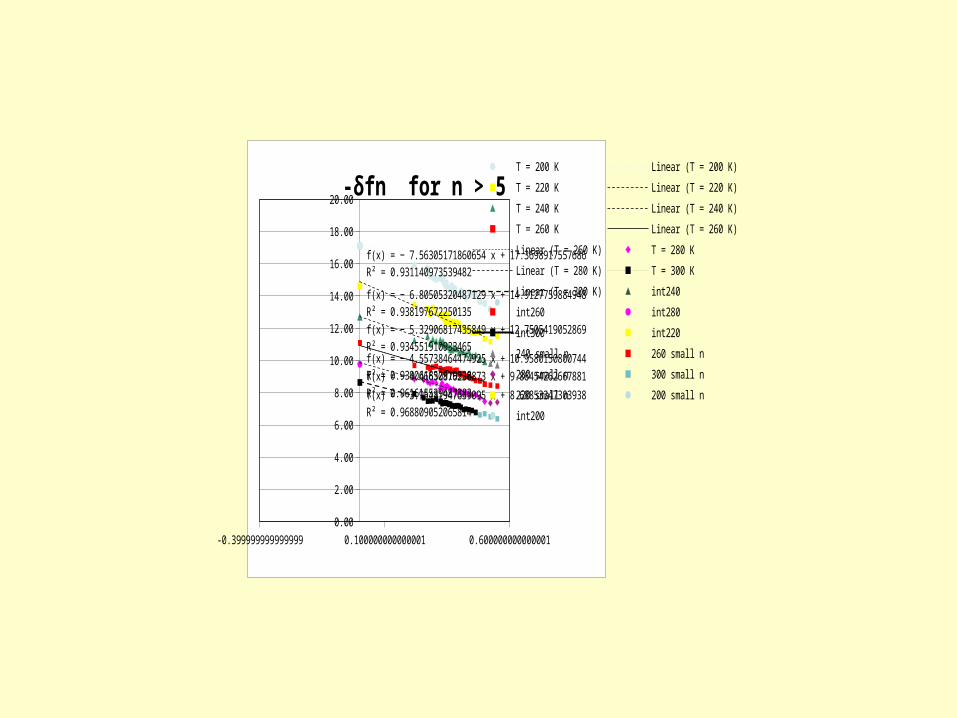
K(n)=K(n-1) exp(–δfn), n>5K(5)=KEX(4)exp(–δf5)

Dimer and tetramer equilibration rates were normalized to experimental values

Scaling: Wölk and Strey Water Data Co = [Tc/240-1]3/2 ; Tc = 647.3 K
lnS
1.8 2.0 2.2 2.4 2.6 2.8 3.0 3.2
log
J /(
cm-3
sec-1
)
4
6
8
10
a)
260 K 250 K
240 K 230 K 220 K
Co lnS / [Tc/T -1]3/2
1.8 2.0 2.2 2.4 2.6 2.8 3.0 3.2
log
[ J
/ cm
-3 /
sec-1
]
4
6
8
10 Wolk and Strey H2O data
b)
255 K
240 K 230 K
B. Hale, J. Chem. Phys. 122, 204509 (2005)
-0.399999999999999 0.100000000000001 0.6000000000000010.00
2.00
4.00
6.00
8.00
10.00
12.00
14.00
16.00
18.00
20.00
f(x) = − 3.95481947639095 x + 8.68853347303938R² = 0.968809052065814
f(x) = − 4.46630876230872 x + 9.86454262667881R² = 0.961615539487383
f(x) = − 4.55738464474925 x + 10.9580150800744R² = 0.939061852919328
f(x) = − 5.32906817435849 x + 12.7505419052869R² = 0.934551910933465
f(x) = − 6.80505320487129 x + 14.9127759884948R² = 0.938197672250135
f(x) = − 7.56305171860654 x + 17.3698917557686R² = 0.931140973539482
-δfn for n > 5T = 200 K Linear (T = 200 K) T = 220 K
Linear (T = 220 K) T = 240 K Linear (T = 240 K)
T = 260 K Linear (T = 260 K) Linear (T = 260 K)
T = 280 K Linear (T = 280 K) T = 300 K
Linear (T = 300 K) int240 int260
int280 int300 int220
240 small n 260 small n 280 small n
300 small n 220 small n 200 small n
int200