b. hu issn 1330 -3651 (print), issn 1848-6339 (online) tv
TRANSCRIPT

B. Hu Istraživanje automatskog područja onečišćenja u energetskoj rešetki
Tehnički vjesnik 23, 1(2016), 49-55 49
ISSN 1330-3651 (Print), ISSN 1848-6339 (Online) DOI: 10.17559/TV-20160108184803
RESEARCH OF AUTOMATIC POLLUTION AREA IN POWER GRID Bo Hu
Original scientific paper Line insulator flashing and lightning incidents have increasingly become the prominent and main reasons of power outages. Antifouling work has become an important part of the line maintenance. This paper has studied area pollution thematic map in detail. Firstly, it extracted a set of rules including pollution sources rule base, site contamination rule base, meteorological rule base, atmospheric environment rule base, operation experience rule base, by classifying and quantifying the factors that could affect the power pollution area level. Secondly, it determined the various sub-rules and rule base parameters. Thirdly, it used computer languages and GIS technology to quantify and express the rules extracted above, and constructed power pollution area level judgment rule base engine with the theory of interpolation and multivariate decision. Finally, it generated power pollution area thematic map by drawing contour, and designed the functions of early warning and insulator flashover configuration to make use of the pollution area map. Keywords: area pollution level; power GIS; rule engine; thematic maps Istraživanje automatskog područja onečišćenja u energetskoj rešetki
Izvorni znanstveni članak Pojave bljeskanja i sijevanja na izolatorima postale su sve veći i glavni uzroci prekida dovoda struje. Rad na prevenciji greške postao je važan dio u održavanju ispravnosti vodova. U ovom je radu detaljno istraživana tematska mapa onečišćenja područja. Najprije je izrađen niz osnovnih pravila uključujući izvore onečišćenja, kontaminacije mjesta, meteorologije, atmosferskog okruženja, operativnog iskustva, klasifikacijom i kvantifikacijom čimbenika koji mogu utjecati na stupanj onečišćenja električnih instalacija. Zatim su određena različita pod-pravila i parametri osnovnih pravila. Nakon toga su računalnim jezicima i GIS tehnologijom kvantificirana i izražena donesena pravila te sastavljena osnova za procjenu stupnja onečišćenja pomoću teorije interpolacije i multivarijantne odluke. Konačno je izrađena tematska mapa područja onečišćenja kao i funkcije za rano upozorenje te konfiguracija bljeskanja izolatora kako bi se iskoristila karta područja onečišćenja. Ključne riječi: energetski GIS; stroj za donošenje pravila; stupanj onečišćenja područja; tematske mape 1 Introduction
Pollution area in power grid is the zoning map of dielectric strength influence degree for external insulation porcelain electrical equipment caused by natural contamination. It has played an important role in guiding electrical equipment to climb and continuously improving grid against dirt crawl flash capabilities in recent years. Traditional pollution area in power grid is a hand-drawn map, which was made from meteorological data, environmental data and monitoring insulator salt density in 3-5 years, combined with the historical experience, and the amendment of pollution area was finished by human, which resulted in a long period of drawing, non-quantitative standard and inaccurate frame.
At present, the domestic power companies have drawn the traditional regional sewage district maps, a few
power companies attempt a small-scale electronic pollution area, which scanned from paper map and handled it with graphics software. Such pollution area map had the following problems: lack of unified standard draw basis, lack of means to achieve cross-platform GIS, lack of effective map stitching methods, lack of effective intelligent decision-making mechanism. As geographic information systems (GIS) are widely used in the power system, it provides conditions for automatic pollution area map by computer [1].
This paper studied the method of automatic generation of pollution area map with computers, considering the impact of contamination levels of pollution, contamination of the site, weather, atmospheric conditions and other factors operating experience.
Table 1Relation between pollution classification and salt density
Pollution level Wet sewage characteristics ESDD / mg/cm2
Line Power/substation equipment
0 Clean air, no significant pollution >50km from the sea, a desert, or open dry land ≤0,03 —
I Atmospheric light pollution, 10 ÷ 50km from the sea, a desert, or open dry land 0,03 ÷ 0,06 ≤0,06
II Atmospheric moderate pollution 3 ÷ 10km from the sea, a desert, or open dry land 0,06 ÷ 0,10 0,06 ÷ 0,10
III Atmospheric serious pollution, heavy fog within 3km of the sea, a desert, or open dry land 0,10 ÷ 0,25 0,10 ÷ 0,25
IV Atmospheric particular serious pollution, within 3km of the sea or 1km of man-made pollution sources 0,25 ÷ 0,35 0,25 ÷ 0,35
2 Pollution area classification theories
Pollution class, indicated by saturated salt density and ash density, can be divided into very light, light, medium,
heavy and very heavy, according to comprehensive consideration of wet sewage characteristics, operating experience combined with equivalent salt deposit density (ESDD)[2]. Wet sewage characteristics contain weather,

Research of automatic pollution area in power grid B. Hu
50 Technical Gazette 23, 1(2016), 49-55
atmospheric conditions and other factors. Operating experience, which contains not only experience over the years, but also the lessons from large flashover area close or similar to the natural environment, are the most important factor when the three conditions were inconsistent.
State Grid Corporation "pollution classification and external insulation selection for electric power system" (Q/GDW152-2006) and National Bureau Board "drawing method of pollution distribution map for electric power system" (DL/T374-2010) detailed the drawing rules of pollution area map [3, 4]. Relation between pollution classification of lines, power equipment, substation equipment and salt density is shown in Tab.1.
3 Pollution area mapping rule base
Based on the pollution classification and criteria for external insulation, the factors such as pollution sources, contamination of the site, weather, atmospheric conditions, operating experience, etc. were classified and quantified in this paper, from which the pollution area mapping rules were formed. Pollution area mapping rule base includes pollution sources rule base (including natural pollution, traffic pollution, industrial pollution, urban pollution), contamination rule base of the site, meteorological rule base, atmospheric environment rule base, and operating experience rule base [5]. Rules of each rule base and its parameters will be introduced in the following part. 3.1 Pollution sources rule base
(1) Natural pollution rule base For natural pollution rule, buffer strip analysis with
its boundary line is required to determine the scope and level of pollution. Natural pollution mainly includes shoreline, saline, salt and so on. Tab. 2 shows the natural pollution rule base.
Table 2 Natural pollution rule base Conditions Level
>50 km from the sea, saline 0 20 ÷ 50 km from the sea, saline I 10 ÷ 20 km from the sea, saline II 5 ÷ 15 km from the sea, saline III 1 ÷ 5 km from the sea, saline IV
(2) Traffic pollution rule base Important traffic arteries include railways, national
highways. For traffic pollution rule, buffer analysis with the border of railways and highways is required to determine the scope and level of pollution. Tab. 3 shows the traffic pollution rule base.
Table 3 Traffic pollution rule base Conditions Level
0, 5 ÷ 1 km from traffic arteries II 0,2 ÷ 0,5 km from traffic arteries III
<0,2 km from traffic arteries IV (3) Industrial pollution rule base Industrial pollution includes thermal power plants,
coal mines, pesticide plants, steel mills, oil refineries,
metal smelters, cement plants, coking plants, and mining, manufacturing, chemical plant. For industrial pollution rule, it is needed to make a circle (radius of 0,5 km and 2 km) buffer analysis from pollution sources, and to revise it in accordance with the wind roses to show their range affected by contamination suit related to roses, finally to determine the scope and level of pollution. Tab. 4 shows the industrial pollution rule base.
Table 4 Industrial pollution rule base Conditions Level
industrial emissions intensity <10 million mark m3/km2, dominant wind 15 ÷ 30 km I
industrial emissions intensity 10 ÷ 30 million mark m3/km2, dominant wind 10 ÷ 15 km II
industrial emissions intensity >30 million mark m3/km2, dominant wind 5 ÷ 10 km III
in the region of chemical, coal, cement factory, or <0,5 km from the source IV
(4) Urban pollution rule base Large and medium-sized cities refer to municipalities
and province capital, for urban pollution rule, circle buffer analysis from the centre of cities is required to be revised in accordance with the wind roses to show their range affected by contamination suit related to roses, finally to determine the scope and level of pollution. Tab. 5 shows the urban pollution rule base.
Table 5 Urban pollution rule base Conditions Level
30 ÷ 50 km from large and medium-sized city 0 population density: 500 ÷ 1000 people/km2,
15 ÷ 50 km from large and medium-sized city I
population density: 1000 ÷ 10000 people/km2, 15 ÷ 20 km from large and medium-sized city II
population density: >10000 people/km2 III
Figure 1 Relation between ESDD/NSDD and site severity for standard
profile cap and pininsulators 3.2 Site contamination rule base
Of all factors affecting the level of pollution distribution, salt density is the only factor that can be quantitatively described. Pollution area mapping could be updated in real time on the basis of measurement of salt

B. Hu Istraživanje automatskog područja onečišćenja u energetskoj rešetki
Tehnički vjesnik 23, 1(2016), 49-55 51
concentration, and operating unit could adjust correctly configured external insulation, and make timely state maintenance based on the real-time pollution area, finally really effectively prevent "flashover" accident [6].
Site contamination could be determined by ESDD and NSDD, which were obtained by live salt density and ash density values from real-time monitoring system, supplemented by artificial salt density values from measuring points. And the pollution gradation could be characterized by the contamination level in the measuring point as the centre, a circle within a radius of five kilometres (particularly within 1 to 3 km area). Fig.1 shows the relation between ESDD/NSDD and site severity for standard profile cap and pin insulators from IEC 60815-1:2001[7, 8]. 3.3 Meteorological rule base
Meteorological data include precipitation of an area, fog for several days, time distribution of rainfall and drought, which could be obtained by Web Services. According to historical operating experience, pollution flashover occurs mainly in November to February, immediately after long period without rain. Meteorological rule base is shown in Tab. 6.
Table 6 Meteorological rule base Conditions Level often foggy
increase a contamination
level
fine drizzling rain acid rain
melting snow Meteorological thematic monitoring points should
meet the requirements of full coverage of the geographical area [9]. This paper selected the centre of regular hexagon as the location of the meteorological monitoring point, which was formed by drawing regular hexagons in the geographic centre of the area and extending it to the outward boundary layer by layer, referring to cellular technology in the mobile communications. This way could ensure full coverage of monitoring points, and at the same time, ensure that failure of a single monitoring point does not influence the accuracy of weather monitoring. 3.4 Atmospheric environment rule base
According to the research on the impact of atmospheric environment to pollution grade from EPRI and Wuhan High Voltage Research Institute, the study calculated air quality index through the measured atmospheric pollutants, and made the air quality index equivalent to the value of salt concentration, formed the atmospheric environment rule base[10], shown in Tab. 7.
Table 7 Atmospheric environment rule base Conditions / mg/cm2 Level
0<ESDD<0,03 0 0,03<ESDD<0,05 Ⅰ 0,05<ESDD<0,10 Ⅱ 0,10<ESDD<0,25 Ⅲ
ESDD>0,25 Ⅳ
Air quality index P could be calculated by SO2, NOx and total suspended particulate (TSP) matter during the contamination, as Eq. (1), whose USO2, UNOx, UTSP were SO2, NOx and TSP monthly average concentration, and BSO2, BNOx and BTSP were SO2, NOx and TSP evaluation criteria value. The annual value of salt SDD could be calculated by empirical formula as Eq. (2).
,31
NO
NO
2SO
2SO
2SO
2SO
++⋅⋅=
TSP
TSP
x
x
BU
BU
BU
BU
P (1)
,08600150 P,,SDD ⋅+−= (2)
.1
1
CSSB −
= (3)
According to saturated salt density formula as Eq. (3),
the equivalent saturated salt density could be calculated with SDD, where S1 was the average annual maximum salt concentration; (1−C) was the rate of self-cleaning insulators, whose value was determined by local precipitation. In practical applications, it usually corrected the parameters in the formula and self-cleaning insulators with the actual measuring value and calculated the equivalent saturated salt density data, finally, drew the equivalent salt density distribution integrated atmospheric environmental factors. 3.5 Operating experience rule base
Operating experience should not only include operating experience over the years in the region, but also learn from the area with close or similar natural environment and suffering large area flashover. Operating experience determined the scope and level of contamination by pollution flashover occurred and flashover trip rate accepted. The region where power grid yet reached, or where large-scale pollution flashover never occurred, could learn from the region with the similar topography, weather conditions, atmospheric conditions, natural filthy nature, operating experience rule base shown in Tab. 8.
Table 8 Operating experience rule base Conditions Level
Current configuration has been set in line insulation
polluted area level
Raise the contamination level within a radius of 5 km and
flashover accident point as the center
Line exceeds the acceptable rate of
flashover trip
Raise the contamination level within 5km along the line
4 Pollution area mapping engine 4.1 Principle of pollution area mapping
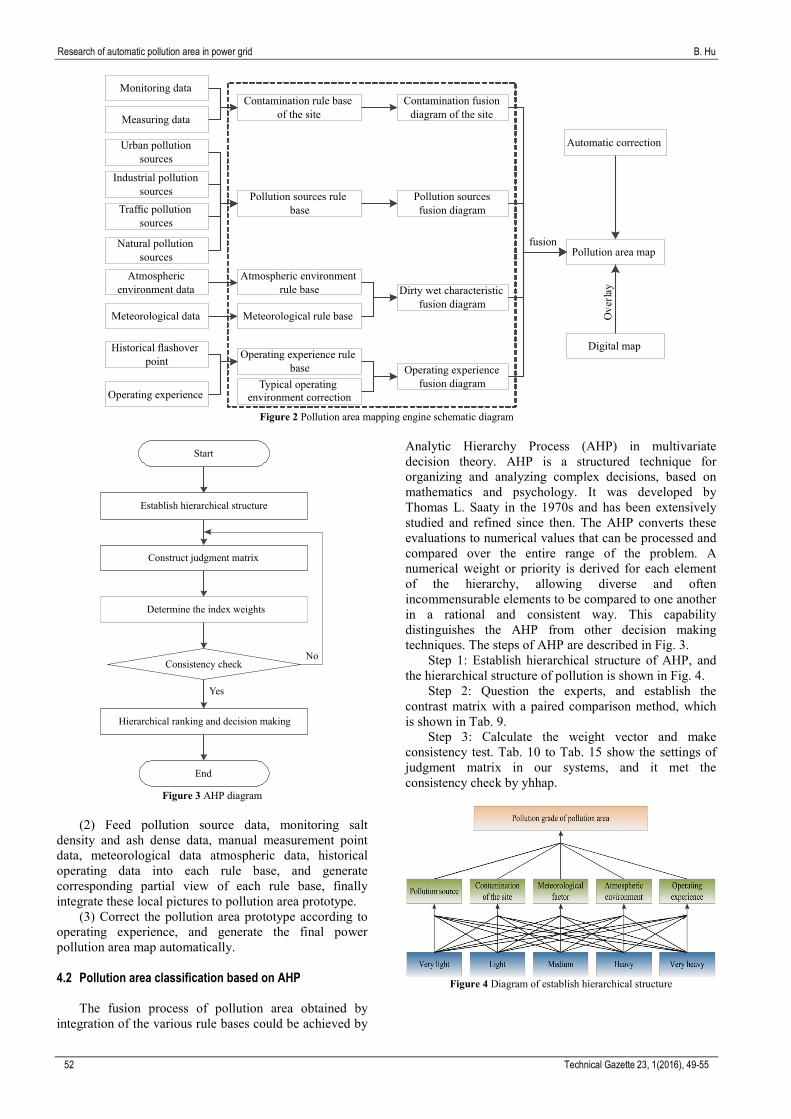
Power GIS pollution area mapping engine [11, 12] modeled the generating method of pollution area on the basis of the above base rule using GIS technology. Its schematic diagram was like Fig. 2, and its generating process is as follows:
(1) Refine the rules in the rule base for expression, and cure computer program algorithm.
Research of automatic pollution area in power grid B. Hu
52 Technical Gazette 23, 1(2016), 49-55
Figure 2 Pollution area mapping engine schematic diagram
Figure 3 AHP diagram
(2) Feed pollution source data, monitoring salt
density and ash dense data, manual measurement point data, meteorological data atmospheric data, historical operating data into each rule base, and generate corresponding partial view of each rule base, finally integrate these local pictures to pollution area prototype.
(3) Correct the pollution area prototype according to operating experience, and generate the final power pollution area map automatically. 4.2 Pollution area classification based on AHP
The fusion process of pollution area obtained by integration of the various rule bases could be achieved by
Analytic Hierarchy Process (AHP) in multivariate decision theory. AHP is a structured technique for organizing and analyzing complex decisions, based on mathematics and psychology. It was developed by Thomas L. Saaty in the 1970s and has been extensively studied and refined since then. The AHP converts these evaluations to numerical values that can be processed and compared over the entire range of the problem. A numerical weight or priority is derived for each element of the hierarchy, allowing diverse and often incommensurable elements to be compared to one another in a rational and consistent way. This capability distinguishes the AHP from other decision making techniques. The steps of AHP are described in Fig. 3.
Step 1: Establish hierarchical structure of AHP, and the hierarchical structure of pollution is shown in Fig. 4.
Step 2: Question the experts, and establish the contrast matrix with a paired comparison method, which is shown in Tab. 9.
Step 3: Calculate the weight vector and make consistency test. Tab. 10 to Tab. 15 show the settings of judgment matrix in our systems, and it met the consistency check by yhhap.
Figure 4 Diagram of establish hierarchical structure

Research of automatic pollution area in power grid B. Hu
53 Technical Gazette 23, 1(2016), 49-55
Table 9 Judgment matrix of index weights
Pollution source
Contamination of the site
Meteorological factor
Atmospheric environment
Operating experience
Pollution source 2/7 2/4 2/3 2/9
Contamination of the site 7/4 7/3 7/9
Meteorological factor 4/3 4/9
Atmospheric environment 3/9
Operating experience
Table 10 Judgment matrix of pollution area classification
Classification of pollution area
Pollution source
Contamination of the site
Meteorological factor
Atmospheric environment
Operating experience
Pollution source 1 0,2857 0,5 0,6667 0,222 Contamination of the site 3,5 1 1,75 2,3333 0,777
Meteorological factor 2 0,5714 1 1,3333 0,444 Atmospheric environment 1,5 0,4286 0,75 1 0,333
Operating experience 4,5 1,2857 2,25 3 1
Table 11 Judgment matrix of pollution source Pollution source
rule base a b c d e
a 1 0,5 0,3333 0,25 0,2 b 2 1 0,6667 0,5 0,4 c 3 1,5 1 0,75 0,6 d 4 2 1,3333 1 0,8 e 5 2,5 1,6667 1,25 1
Table 12 Judgment matrix of contamination of the site
Contamination rule base a b c d e
a 1 0,5 0,3333 0,25 0,2 b 2 1 0,6667 0,5 0,4 c 3 1,5 1 0,75 0,75 d 4 2 1,3333 1 0,8 e 5 2,5 1,3333 1,25 1
Table 13 Judgment matrix of meteorological factor
Meteorological rule base a b c d e
a 1 0,5 0,3333 0,25 0,2 b 2 1 0,6667 0,5 0,4 c 3 1,5 1 0,75 0,6 d 4 2 1,3333 1 0,8 e 5 2,5 1,6667 1,25 1
Table 14 Judgment matrix of atmospheric environment
Atmospheric environment
rule base a b c d e
a 1 0,5 0,3333 0,25 0,2 b 2 1 0,6667 0,6667 0,4 c 3 1,5 1 0,75 0,6 d 4 1,5 1,3333 1 0,8
Step 4: Integrate the weight between solution layer (5
optional contamination levels) and criteria layer (contamination level factors) and weight between criteria layer and target layer (determine contamination levels) to calculate the weight between solution layer and target layer. According to the above matrix, the weight of pollution source, contamination of the site, meteorological
factor, atmospheric environment and operating experience could be calculated, which is shown in Tab. 16.
Table 15 Judgment matrix of operating experience Operating experience rule base
a b c d e
a 1 0,5 0,3333 0,25 0,2 b 2 1 0,6667 0,5 0,4 c 3 1,5 1 0,75 0,6 d 4 2 1,3333 1 0,8 e 5 2,5 1,6667 1,25 1
Table 16 Weight results
Pollution area factor Weight pollution source 0,0800
contamination of the site 0,2800 meteorological factor 0,1600
atmospheric environment 0,1200 operating experience 0,3600
Step 5: Refer to the data of rule base involved to
determine pollution area classification. According to the normalization processing data, the
decision-making could be achieved. In fact, the matrix could take expert's experience into account to improve the reliability of weight, and improve pollution area generation accuracy. 4.3 Display of pollution classification
Vector data is a common data structure of spatial data, which accurately represents geographical entities of point, line and surface by recording the coordinates. Among the display method of topic geographic information and distribution characteristic of spatial data, we chose the equivalent area method, which used the same color to represent the same level of pollution area on the map [13]. The process of drawing pollution area was as follows: firstly generate the contours of pollution classification, secondly color the area of the closed curve contained, and finally finish pollution classification transformation from digital form into graphic form.

Research of automatic pollution area in power grid B. Hu
54 Technical Gazette 23, 1(2016), 49-55
Contour was drawn with triangulation algorithm, shown in Fig. 5. The algorithm put the pollution level data triangle grid, and then generated contour by tracking the grid. Contour drawing based on the triangular mesh took discrete points as foundation, and formed smooth contours with smooth three-point curve method. The method had the advantage of simple programmed and high precision [14]. The contours could be generated by the pollution data with this algorithm, and it was represented with a collection of the first series of connected points, which was saved as oracle spatial. Program accessed the objects with OpenScales and set the corresponding color of pollution level determined by the drawing rules, and finished the display.
Figure 5 Contour drawing algorithms with triangulation mesh
5 Power GIS automatic pollution area system
Power GIS automatic pollution area system achieved the goal that displayed the pollution area generated by pollution area engine on the WebGIS with the help of power WebGIS platform. With this system, maintainer could keep abreast of the contamination situation for electrical equipment, and get the decision making basis for state maintenance. 5.1 Architecture
Power GIS automatic pollution area system was designed by three-tier B/S structure [15], including data layer, application logical layer and user interface layer, and its architecture is shown in Fig. 6.
Figure 6 Architecture of power GIS automatic pollution area system
(1) Data layer managed all types of data, such as GIS
spatial data, electrical data, rules and parameter data, dirty wet characteristic data, map tiles file, and so on.
(2) Application logical layer dealt with the application logic, and its main function included: polluted area mapping rule base engine, thematic map generation module, service releasing module, spatial data management module, platform management module, and so on.
(3) User interface layer answered for the user request, and it supplied: data analysis module, map controls module, map displaying interface, Fusion Chart image module, map rendering module, and so on.
Figure 7 Functional division of power GIS automatic pollution area system

B. Hu Istraživanje automatskog područja onečišćenja u energetskoj rešetki
Tehnički vjesnik 23, 1(2016), 49-55 55
5.2 Functional structure
The function of power GIS automatic pollution area system was divided into power webGISplatform, pollution area management, basic data management, rule base management, decision support and warning, and its structure is given in Fig. 7. 5.3 Display of pollution area map
Power webGIS platform provided technical support for the automatic generation of power pollution area mapping. This paper automatically generated pollution area based on the map data and salt density data in Liaoning province, as displayed in Fig. 8.
Figure 8 Power pollution area of Liaoning province
6 Conclusion
The paper has studied the theory and key technologies of automatic generation of pollution area, and built power GIS automatic pollution area system on this basis. The achievement contained three parts:
(1) According to the influencing factor of pollution level, the author collected the appropriate thematic attribute data and designed the underlying data model, and at the same time combed the pollution rules, built rule bases and set the rule parameters.
(2) Employ computer to classify and quantify the pollution rules, and use GIS to express the quantified rules, finally build pollution area mapping engine, based on which the pollution level could be determined by multivariate interpolation theory and decision theory.
(3) Based on a variety of open source GIS framework, the author made the pollution level determined by pollution area mapping engine display on power webGIS platform and built power GIS automatic pollution area system.
The system could enable maintainers to keep abreast of the contamination status of power transmission equipment and provide basis for decision making of the state maintenance work, but the integrity of rule bases needs improvement.
7 References [1] Yang, Yong-ming; Bai, You-bing. Method for Applying the
GIS Data in Thematic Map. // Geomatics & Spatial Information Technology. 32, 4(2009), pp. 117-118, 121.
[2] Wu, Wei-ning; Wu, Guang-ya; Zhang, Rui. Causation analysis and countermeasures of pollution flashover of transmission and distribution equipment. // High Voltage Engineering. 30, 7(2004), pp. 9-11.
[3] Sun, Han-jing; Ma, Rui-feng; Li, Guo-qing; et al. Research on Mapping Pollution Areas and Insulation Selection Method Based on GIS. // Journal of Northeast China Institute of Electric Power Engineering. 31, 4(2011), pp. 96-100.
[4] Weining, W.; Guangya, W.; Rui, Z. Causation analysis and countermeasures of pollution flashover of transmission and distribution equipment. // High voltage engineering. 7, 003(2004).
[5] Wang, Hua-yun; Wan, Jun-biao; Chen, Zhi; et al. Method of Computer-automated drawing the Map of Pollution Areas Based on Intelligent Rule Engine. // 20th Transmission and Distribution Technologies Society Symposium Proceedings, 2012, pp. 9-16
[6] Ying, Wei-guo; Hu, Xu-guang. Analysis on the tested results of saturated salt density of 500 kV power transmission line insulator. // Electric Power. 37, 6(2004), pp. 29-32.
[7] IEC 60815: Guide for the selection and dimensioning of high-voltage insulators for polluted conditions- Part 1: Definitions, information and general principles.
[8] Chen, Xiaoli; Lu, Peijun; Wu, Wosheng; et al. A New Method for the Insulator Pollution Grade Judgments. // Southern Power System Technology. 3, 2(2009), pp. 53-55.
[9] Matsuyama, A.; Yasuda, Y.; Yasutake, A. et al. Detailed Pollution Map of an Area Highly Contaminated by Mercury Containing Wastewater from an Organic Chemical Factory in People's Republic of China. // Bulletin of Environmental Contamination and Toxicology. 77, (2006), pp. 82-87. DOI: 10.1007/s00128-006-1035-6
[10] Su, Zhiyi. Study on defining pollution classes and mapping pollution areas by saturated equal salt deposit density. // Power System Technology. 28, 8(2004), pp. 16-19.
[11] Liu, Yi; Luo, Dian-sheng; Yao, Jian-gang; et al. Method of Computer-automated drawing the Map of Pollution Areas. // High Voltage Engineering. 33, 5(2007), pp. 143-147.
[12] Yao, Nan; Wang, Xiao-wu. Application of intelligent technologies in pollution area in power grid. // Electric Power Automation Equipment. 27, 8(2007), pp. 86-88.
[13] Song, Lijuan; Gong, Xiaofeng; Zhong, Meng. A Method for Isoline plotting Based on Rectangular Grids. // Modern Electronics Technique. 14, 7(2005), pp. 65-67.
[14] Pang, Shiming; Cai, Yuhua; Jin, Wenfang. An Algorithm for Contour Rendering. // Computer Applications. 24, 1(2004), pp. 60-62.
[15] Xiao-hui, W.; Ke-he, W.; Xue-rong, X. Research of spatial index & caching for power GIS. // Computer Science & Education (ICCSE), 2011 6th International Conference on. IEEE, 2011, pp. 354-357. Author’s address Bo Hu, Postdoctoral 1) Thermal Power Engineering and Engineering Thermal Physics at North China Electric Power University 2) State Grid Anshan Electric Power Supply Company Liaoning 114000 P. R. China E-mail: [email protected]