b-zone chemical oxidation implementation report station responsible parties b-zone chemical...
TRANSCRIPT

Delivering sustainable solutions in a more competitive world
Prepared for: Hookston Station Responsible Parties
B-Zone Chemical Oxidation Implementation Report Hookston Station Site Pleasant Hill, California
15 May 2008
www.erm.com

Hookston Station Responsible Parties
B-Zone Chemical Oxidation Implementation Report Hookston Station Site Pleasant Hill, California
15 May 2008
Project No. 0077457.11
Arun Chemburkar, P.E. Partner-in-Charge
Brian Bjorklund, P.G, C.H.G. Project Manager
Kimberly L. Lake, P.G Project Geologist
Environmental Resources Management 1777 Botelho Drive, Suite 260 Walnut Creek, California 94596 T: 925-946-0455 F: 925-946-9968

i
TABLE OF CONTENTS
LIST OF FIGURES III
LIST OF TABLES IV
LIST OF ACRONYMS V
EXECUTIVE SUMMARY ES-1
1.0 INTRODUCTION 1
1.1 DOCUMENT ORGANIZATION 1
1.2 PURPOSE OF REPORT 2
1.3 PROJECT BACKGROUND 2 1.3.1 Geology and Hydrogeology 2 1.3.2 Chemicals of Concern 3 1.3.3 Hookston Station Remedial Strategy 4
2.0 REMEDIAL DESIGN FOR B-ZONE GROUND WATER 5
2.1 PRE-IMPLEMENTATION INVESTIGATION 5 2.1.1 Investigation Activities 6 2.1.2 Investigation Results 7
2.2 FINAL REMEDIAL DESIGN 7
3.0 CHEMICAL OXIDATION IMPLEMENTATION 9
3.1 SITE PREPARATION 9 3.1.1 Permits 9 3.1.2 Utility Clearance 9
3.2 WELL INSTALLATIONS AND DEVELOPMENT 9 3.2.1 Injection Wells 9 3.2.2 Performance Monitoring Wells 11
3.3 BASELINE MONITORING EVENT 12
3.4 POTASSIUM PERMANGANATE INJECTIONS 13 3.4.1 Injections via Temporary Injection Points 13

ii
3.4.2 Injections via Permanent Injection Wells 14 3.4.3 Injection Monitoring 15
3.5 INVESTIGATION-DERIVED WASTE MANAGEMENT 16
3.6 SURVEY ACTIVITIES 16
4.0 PERFORMANCE MONITORING 17
4.1 PERFORMANCE MONITORING ACTIVITIES 17
4.2 PERFORMANCE MONITORING RESULTS 18
5.0 SCHEDULE AND REPORTING 19
6.0 SUMMARY 20
7.0 REFERENCES 22
APPENDIX A — MEMBRANE INTERFACE PROBE LOGS
APPENDIX B — WELL CONSTRUCTION LOGS

iii
LIST OF FIGURES
(Figures immediately follow the text)
1 Site Location Map
2 Site Map
3 Geological Cross Sections
4 Originally Planned ISCO Treatment Area
5 Pre-Implementation Investigation Borings
6 Pre-Implementation Investigation Results
7 Injection Program Locations

iv
LIST OF TABLES
(Tables immediately follow the figures)
1 Summary of Performance Monitoring Results
2 Chemical Oxidation Injection Program Details

v
LIST OF ACRONYMS
1,1-DCE 1,1-Dichloroethene
µg/kg Microgram per kilogram
bgs Below ground surface
cis-1,2-DCE cis-1,2-dichloroethene
COC Chemical of concern
ECD Electron capture device
ERM ERM-West, Inc.
ESL Environmental screening level
FID Flame ionization detector
gpm Gallons per minute
ISCO In situ chemical oxidation
KMnO4 Potassium permanganate
mg/m3 Milligrams per cubic meter
MIP Membrane interface probe
RDIP Remedial Design and Implementation Plan
PCE Tetrachloroethene
PID Photoionization detector
psi Pounds per square inch
PVC Polyvinyl chloride
TCE Trichloroethene
USCS Unified Soil Classification System
USEPA United States Environmental Protection Agency
VOC Volatile organic compound

ERM ES-1 Hookston Station – 15 May 2008
EXECUTIVE SUMMARY
The first round of chemical injections associated with the Hookston Station B-Zone ground water in situ chemical oxidation (ISCO) remediation program has been implemented. The following activities have been completed:
• A pre-implementation investigation was conducted to optimize and finalize the design plans for the B-Zone ISCO program.
• Five performance monitoring wells and 9 permanent injection wells were installed in the treatment area.
• A pre-injection water quality monitoring event was completed in January and February 2008.
• Approximately 155,000 gallons of potassium permanganate (KMnO4) solution (approximately 29,500 lbs KMnO4) were injected into 49 locations during February, March, and April 2008. Injection depths ranged from approximately 36 to 55 feet bgs.
• The first post-injection monitoring event was completed in April 2008.
Based on the results of the first performance monitoring event, the KMnO4 solution was successfully distributed throughout the treatment area and VOC concentrations have decreased in several wells. Additional performance monitoring and injection events will be completed later this year.
ERM 1 Hookston Station – 15 May 2008
1.0 INTRODUCTION
ERM-West, Inc. (ERM) has prepared this B-Zone Chemical Oxidation Implementation Report (Implementation Report) to document the implementation of the B-Zone ground water remediation program at the Hookston Station site in Pleasant Hill, California (site) (Figure 1). This Implementation Report was prepared on behalf of the Hookston Station Responsible Parties, which include Union Pacific Railroad Company, Daniel C. Helix, Mary Lou Helix, Elizabeth Young, John V. Hook, Steven Pucell, Nancy Ellicock, and the Contra Costa County Redevelopment Agency. Environmental investigations and remediation activities for the Hookston Station site have been conducted under regulatory oversight of the California Regional Water Quality Control Board (Water Board). All applicable requirements of Water Board Order Number R2-2003-0035 (16 April 2003) and amended Order Number R2-2004-0081 (15 September 2004) have been fulfilled. A new Order (R2-2007-0009) was adopted in January 2007 for the Hookston Station site that focuses on the site cleanup. This Implementation Report is submitted in accordance with Task 5 of that Order.
1.1 DOCUMENT ORGANIZATION
This Implementation Report is organized as follows:
• Section 1.0 presents the introduction, purpose of the document, and project background;
• Section 2.0 describes the final in situ chemical oxidation (ISCO) program design, including a pre-design investigation;
• Section 3.0 documents the activities completed for the chemical oxidation program;
• Section 4.0 discusses performance monitoring activities and results;
• Section 5.0 presents a schedule for completing additional chemical oxidation injection events, performance monitoring events, and additional reports;
• Section 6.0 summarizes the implementation of the ISCO program; and
• Section 7.0 identifies documents referenced in this report.
Appendices, figures, and tables follow the text.

ERM 2 Hookston Station – 15 May 2008
1.2 PURPOSE OF REPORT
The purpose of this Implementation Report is to document the activities completed during the first injection event of the B-Zone ISCO program and to present initial performance monitoring results.
1.3 PROJECT BACKGROUND
This section summarizes the Hookston Station site characterization pertaining to the design and implementation of the B-Zone ISCO program (geology, hydrogeology, and chemical occurrence in ground water) and the overall Hookston Station remediation strategy. More detailed project background information is provided in the documents entitled, Remedial Investigation Report, Hookston Station Site, Pleasant Hill, California (ERM 2004), Feasibility Study, Hookston Station, Pleasant Hill, California (Feasibility Study) (ERM 2006), and Remedial Design and Implementation Plan for B-Zone Chemical Oxidation (ERM 2007) (RDIP).
1.3.1 Geology and Hydrogeology
The Hookston Station site (Figure 2) and surrounding area is underlain by unconsolidated deposits that extend to at least 100 feet below ground surface (bgs), as shown on Figure 3 and summarized below:
• Fine-grained clays and silts are present from the ground surface (or immediately below the ground surface cover materials) to depths typically ranging from 40 to 50 feet bgs. Discontinuous lenses of sands, silty sands, and gravelly sands are interbedded in the fine-grained clays and silts. ERM has defined this zone as the “A-Zone.”
• Directly beneath the A-Zone, a relatively continuous sand unit that is interbedded with silt and clay lenses is present. ERM has defined this zone as the “B-Zone,” and it generally extends to 70 feet bgs. The sands of the B-Zone are generally 5 to 10 feet thick and include sands, clayey sands, and gravelly sands; a few gravel zones are also encountered in this unit. The silt and clay lenses within the B-Zone are up to 10 feet thick, but are generally less than a few feet thick.
• A clay unit that is 10 to 40 feet thick is present beneath the B-Zone.
• A deeper sand unit, defined as the “C-Zone,” is present beneath the clay unit. The C-Zone is a continuous sand unit that is interbedded

ERM 3 Hookston Station – 15 May 2008
with silt and clay lenses. The C-Zone extends to at least 100 feet bgs; the deposits deeper than 100 feet bgs have not been characterized.
Ground water in the A-, B-, and C-Zones flows to the north-northeast. Based on ground water level measurements and stratigraphy, the three water-bearing zones are confined to semi-confined. Based on aquifer tests conducted at the site, average hydraulic conductivity for the B-Zone is 50 feet per day and the average ground water seepage velocity for the B-Zone is 300 feet per year, respectively (ERM 2006).
1.3.2 Chemicals of Concern
Remedial investigation activities were conducted to evaluate the nature and extent of chemical impacts originating from the Hookston Station site. These investigation activities identified trichloroethene (TCE) and associated degradation compounds (cis-1,2-dichloroethene [cis-1,2-DCE], 1,1-dichloroethene [1,1-DCE], and vinyl chloride) as the chemicals of concern (COCs) for the Hookston Station site. The COCs were detected in soil, soil vapor, A-Zone and B-Zone ground water, and indoor air at the Hookston Station parcel and in soil vapor, ground water, and indoor air within the downgradient neighborhood.
These chemicals were also detected in ground water and soil vapor near an upgradient tetrachloroethene (PCE)/TCE source area located west of Vincent Road that is unrelated to historical releases at the Hookston Station parcel. The Vincent Road Area PCE/TCE plume originates west of Vincent Road and flows to the northeast across the northern portion of the Hookston Station parcel. The Hookston Station and Vincent Road Area plumes mix in the northeastern portion of the Hookston Station Parcel and flow offsite. The Water Board is currently working to identify the responsible party(ies) for the Vincent Road Area PCE/TCE plume.
Petroleum-related ground water impacts originating from the neighboring Pitcock Petroleum property flow to the northeast across the northern portion of the Hookston Station site. These ground water impacts mix with the Vincent Road PCE/TCE plume in the northwestern portion of the Hookston Station site. The downgradient extent of the Pitcock Petroleum ground water plume is currently being investigated by the responsible party. The petroleum-related impacts originating from the Pitcock Petroleum property are not being addressed by the remedial activities described in this report.

ERM 4 Hookston Station – 15 May 2008
1.3.3 Hookston Station Remedial Strategy
The Hookston Station Feasibility Study was submitted to the Water Board in July 2006. The Feasibility Study provided a detailed comparative analysis to provide a basis for determining the most appropriate remedial alternative for protecting human health and the environment and managing long-term health risks. Remedial Alternative 4 was selected and was ultimately approved by the Water Board as the preferred remedial alternative. Alternative 4 consists of the following components:
• Zero-valent iron permeable reactive barrier for A-Zone ground water;
• Chemical oxidation for B-Zone ground water;
• Institutional controls (Soil Management Plan) for on-site subsurface soil impacted with arsenic;
• Vapor intrusion prevention components for residences in the downgradient neighborhood in which TCE is present in indoor air at concentrations that exceed the indoor air environmental screening level (ESL);
• Removal of private wells, which are used for irrigation and filling swimming pools, from residences that overlie the commingled plume in the downgradient neighborhood; and
• An ordinance to prevent new well installations within the impacted area until ground water cleanup goals are achieved.
This remedial alternative was selected because it ranked higher, or as high, as the other alternatives evaluated in the Feasibility Study for every evaluation criterion, it satisfied the threshold criteria of protectiveness and compliance with applicable or relevant and appropriate requirements, and it is expected to be effective at satisfying all balancing and modifying criteria (long-term effectiveness and permanence; reduction of toxicity, mass, and volume through treatment; short-term effectiveness; implementability; and State and community acceptance).

ERM 5 Hookston Station – 15 May 2008
2.0 REMEDIAL DESIGN FOR B-ZONE GROUND WATER
In accordance with Task 4 of Order R2-2007-0009, the RDIP was submitted to the Water Board, and was subsequently approved on 4 October 2007. The RDIP presented detailed design plans for implementing ISCO for B-Zone ground water within the source area of the site. The B-Zone ISCO design plans presented in the RDIP included the following components:
• Install five permanent injection wells from 45 to 55 feet bgs along the upgradient boundary of the proposed treatment area, to be used for periodic injection events;
• Install five monitoring wells within the proposed treatment area to monitor the chemical oxidation performance;
• Inject 187,000 gallons of a 2 percent potassium permanganate (KMnO4) solution (equivalent to 31,790 pounds KMnO4) into the injection wells and 127 temporary injection points (screened within the B-Zone sands from approximately 45 to 55 feet bgs) using a direct-push (GeoProbe) injection rig;
• Monitor ground water within the proposed treatment area at selected monitoring wells; and
• Repeat permanganate injection events and performance monitoring.
The treatment area proposed in the RDIP is presented on Figure 4.
A pre-implementation investigation was conducted to identify the appropriate locations and screen intervals for performance monitoring wells, permanent injection wells, and temporary injection points. The investigation activities and results are described below in Section 2.1. Based on the results of the pre-implementation investigation and access issues encountered at the site, the remedial design presented in the RDIP was refined and revised, as described in Section 2.2.
2.1 PRE-IMPLEMENTATION INVESTIGATION
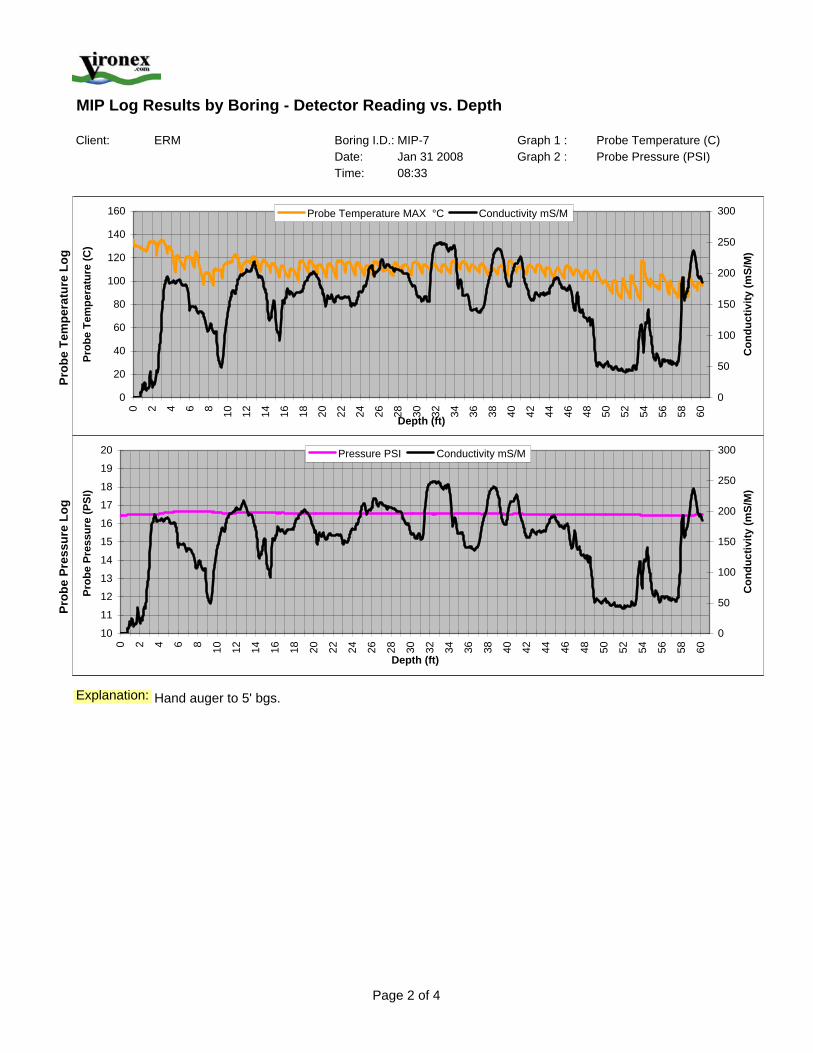
Before ISCO injection activities, a direct-push rig equipped with membrane interface probe (MIP) capabilities was used to advance borings within the planned ISCO treatment area. The MIP continuously monitors the vertical distribution of total volatile organic chemicals (VOCs) in the

ERM 6 Hookston Station – 15 May 2008
subsurface using a mobile laboratory. The output for this tool is a continuous VOC response profile log for each borehole.
2.1.1 Investigation Activities
Between 8 January and 5 February 2008, 14 MIP borings (MIP-1 to MIP-14) were advanced at the site within the treatment area identified in the RDIP. The locations of these borings are shown on Figure 5.
Locations MIP-1 to MIP-5 and MIP-13 were completed immediately west of the on-site 199 Mayhew Way structure, in a north-south trending alignment near monitoring wells MW-11A and MW-11B. These borings were advanced to identify the appropriate locations and screen intervals for the permanent injection wells described in the RDIP.
Locations MIP-6 to MIP-12 were advanced in an alignment perpendicular to the ground water flow direction in the approximate midpoint of the planned ISCO treatment area. This alignment extended across the entire width of the proposed treatment area. MIP-14 was advanced between the two MIP alignments. The rationale for these borings was:
• Confirm the width of the B-Zone TCE plume to identify the appropriate locations for the temporary injection points and performance monitoring wells; and
• Confirm the vertical distribution of total VOCs to identify the appropriate depth intervals for the temporary injection points and performance monitoring wells.
Each location was hand-augered from the ground surface to 5 to 7 feet bgs. The borings were then advanced with a direct-push rig equipped with MIP tools by Vironex of Pacheco, California. The borings were advanced to total depths ranging from approximately 58 to 70 feet bgs. Once the total depth was reached, the borings were backfilled with bentonite cement through a tremie pipe.
An electron capture device (ECD), photoionization detector (PID), and flame ionization detector (FID) were used with the MIP tool to measure total VOCs within each boring. Soil conductivity was also measured with the MIP equipment to evaluate relative grain size of the subsurface materials (i.e., clays and silts versus sands and gravel).

ERM 7 Hookston Station – 15 May 2008
2.1.2 Investigation Results
The continuous response logs generated by the ECD, PID, FID, and soil conductivity probe for each boring are included in Appendix A. Results from the ECD and soil conductivity probe are presented in cross-section on Figure 6. MIP results from other borings advanced previously at the site are also included on the cross sections on Figure 6.
As described in the RDIP, the most upgradient TCE impacts on the Hookston Station parcel are found immediately west of the 199 Mayhew Way structure. Based on the MIP data collected during the pre-implementation investigation and a chemical oxidation pilot test (documented in the RDIP), the total VOC impacts are centered approximately around monitoring wells MW-11A and -11B, extend less than 40 feet to the north (MIP-5), less than 65 feet to the south (MIP-13), and less than 30 feet to the west and southwest (CPT-33 and -34) (Figure 6). In this area, the impacts are encountered at approximately 36 to 51 feet bgs within silts, with the greatest impacts present at 38 to 46 feet bgs.
Approximately 150 feet downgradient of this area, total VOC impacts extend slightly deeper (to approximately 60 feet bgs), and are present in the coarse-grained B-Zone sands and the silts directly above the B-Zone sands. Based on MIP data collected from the MIP-6 to MIP-12 alignment, the width of the B-Zone TCE plume is estimated at 100 feet bgs, extending approximately from the western wall of the 199 Mayhew Way structure towards MIP-8 (Figure 6, cross section E-E’), with the greatest impacts observed at MIP-11. The TCE impacts in the silts above the B-Zone also appear to extend from the western wall of the 199 Mayhew Way structure to MIP-7, with the greatest impacts observed at MIP-8 (Figure 6, cross section E-E’).
2.2 FINAL REMEDIAL DESIGN
The treatment area described in the RDIP for the first injection event included 5 permanent injection wells located immediately west of the 199 Mayhew Way structure, 32 temporary injection points located inside the 199 Mayhew Way structure, and 95 temporary injection points located east and south of the 199 Mayhew Way Structure (Figure 4). Based on data collected during the pre-implementation investigation, set-back requirements for several underground utilities located in the treatment area, and above-ground obstructions within the 199 Mayhew Way structure, the treatment area and remedial design for the first injection event of the B-Zone ISCO program were modified, as described below:

ERM 8 Hookston Station – 15 May 2008
• Based on the data collected at MIP-1 to MIP-5 and MIP-13, the number of permanent injection wells to be installed west of the 199 Mayhew Way structure was reduced from 5 to 4. The screen intervals were also revised from 45 to 55 feet bgs (as proposed in the RDIP) to 36 to 46 feet bgs, based on the vertical distribution of total VOCs observed in this area.
• The 32 temporary injection points proposed inside the 199 Mayhew Way structure were eliminated and were replaced with an alignment of 5 permanent injection wells. The alignment of 5 injection wells is located mostly within the 199 Mayhew Way structure and is oriented perpendicular to the ground water flow direction. The screen intervals were selected at approximately 50 to 55 feet bgs based on MIP data collected from MIP-8 to -12 and MIP-14.
• The temporary injection points proposed south of the 199 Mayhew Way structure were eliminated based on the results at MIP-13 and CPT-47 (reported in the RDIP) and previous ground water results collected at CPT-01 (TCE was non-detect in the B-Zone)(ERM 2004).
• Approximately 30 temporary injection points proposed along the eastern/southeastern portion of the originally planned treatment area were eliminated because the width of the B-Zone plume does not appear to extend that far east, based on data collected from MIP-6 and -7.
• Approximately 15 temporary injection points proposed east of the 199 Mayhew Way structure were eliminated due to the set-back requirements for several underground utilities located in the area, including an 84-inch-diameter concrete storm line, a high-pressure Kinder Morgan fuel line, and a fiber optic communication line.
The revised treatment area and injection program has been refined, enabling the impacted zones to be more closely targeted. Although the total number of injection locations was reduced, the total mass of KMnO4 to be injected was not significantly reduced. The implementation activities associated with the first B-Zone injection program are described in the following section.

ERM 9 Hookston Station – 15 May 2008
3.0 CHEMICAL OXIDATION IMPLEMENTATION
This section documents the activities completed prior to and during the first injection event of the B-Zone ISCO program.
3.1 SITE PREPARATION
3.1.1 Permits
Drilling permits were obtained from the Contra Costa County Environmental Health Division for installation of performance monitoring wells, injection wells, MIP borings, and temporary injection points.
3.1.2 Utility Clearance
Prior to all drilling activities, the proposed locations for MIP borings, performance monitoring wells, injection wells, and temporary injection points were marked for underground utility clearance. Underground Services Alert was then notified at least 48 hours in advance of the drilling activities. A private utility locator was also hired to mark the locations of underground utilities near the proposed drilling locations. In addition, each proposed drilling location was advanced manually with a hand auger to at least 5 feet bgs to minimize the potential for encountering underground utilities.
3.2 WELL INSTALLATIONS AND DEVELOPMENT
Nine injection wells and five performance monitoring wells were installed for the B-Zone ISCO program. Installation and development of these wells are described below.
3.2.1 Injection Wells
3.2.1.1 Injection Wells INJ-1 to INJ-4
Injection wells INJ-1 to INJ-4 were completed west of 199 Mayhew Way on 14 and 15 January 2008. The well locations are included on Figure 7. Based on the results for the MIP borings advanced west of 199 Mayhew Way (MIP-1 to MIP-5 and MIP-13), ERM determined that the construction

ERM 10 Hookston Station – 15 May 2008
of four permanent injection wells in this area was appropriate and that a fifth injection well, as proposed in the RDIP, was not necessary.
All well installation and development activities were conducted in accordance with the Phase I Remedial Investigation Sampling and Analysis Plan (ERM 2000) (Sampling and Analysis Plan) and were completed by Gregg Drilling of Martinez, California. Each location was hand-augered from the ground surface to 5 feet bgs and then blind-drilled to 25 feet bgs. Soil samples were then collected continuously to the bottom of each boring for logging and field-screening purposes. An ERM geologist prepared boring logs in the field using the Unified Soil Classification System (USCS) to describe soils (Appendix B). The soils were screened in the field with a PID for the presence of VOCs.
The wells were completed as 2-inch-diameter polyvinyl chloride (PVC) wells with 10-foot screens. Because the greatest VOC impacts in this area are encountered from approximately 38 to 46 feet bgs (Section 2.1.2), the well screens were constructed from 36 to 46 feet bgs. Well completion details, including well materials used, total depths, and screen intervals, are included on the logs presented in Appendix B.
The injection wells were developed on 21 and 22 January 2008 by Gregg Drilling. The wells were developed by bailing and surging, and 10 well casing volumes of water were removed from each well during development. The development water was containerized in drums and stored on site pending off-site disposal at a licensed disposal facility.
3.2.1.2 Injection Wells INJ-5 to INJ-9
The number of temporary injection points was reduced during the implementation of the ISCO program. The installation of additional permanent injection wells was determined to be appropriate to facilitate the distribution of the chemical oxidant throughout the treatment area and to facilitate future injection events. Data collected from MIP-6 to MIP-12 and MIP-14 were used to select the locations for these additional injection wells.
Injection wells INJ-5 to INJ-9 were installed during 27 to 29 March 2008 by Precision Drilling and Sampling of Richmond, California. All well installation and development activities were conducted in accordance with the Sampling and Analysis Plan. Well locations are shown on Figure 7.

ERM 11 Hookston Station – 15 May 2008
Each location was hand-augered from the ground surface to 5 feet bgs and then blind-drilled to 35 to 40 feet bgs. Soil samples were then collected continuously to the bottom of each boring for logging and field-screening purposes. An ERM geologist prepared boring logs in the field using the USCS to describe soils (Appendix B). The soils were screened in the field with a PID for the presence of VOCs.
The wells were completed as 2-inch-diameter PVC wells with 5-foot screens. The wells were completed within the B-Zone sands at total depths ranging from 54 to 56 feet bgs. Appendix B provides well completion details, including well materials used, total depths, and screen intervals.
On 4 and 7 April 2008, Gregg Drilling developed the injection wells by bailing and surging; approximately 10 well casing volumes of water were removed from each well during development. The development water was containerized in drums and stored on site; handling of this development water is described in Section 3.5.
During development, it was discovered that well INJ-8 was damaged during installation and could not be used for ISCO injection activities. This well will be abandoned and replaced before the second ISCO injection event, scheduled for October 2008.
3.2.2 Performance Monitoring Wells
Five performance monitoring wells were installed from 4 to 8 February 2008 (MW-34B, -35A2, -35B, -36B, and -13A2). Monitoring well MW-34B was installed in an area outside the TCE plume to monitor background conditions. The remaining wells were installed within the ISCO treatment area to monitor the effectiveness of the ISCO program. Well locations are included on Figure 7. All well installation and development activities were conducted in accordance with the Sampling and Analysis Plan and completed by Gregg Drilling of Martinez, California.
Each location was hand-augered from the ground surface to 5 to 7 feet bgs. Wells MW-13A2, -34B, -35A2, and -36B were then blind-drilled to 25 to 30 feet bgs. Soil samples were then collected continuously for logging and field-screening purposes. MW-35B was continuously logged from 5 feet bgs to total depth. An ERM geologist prepared boring logs in the field using the USCS to describe soils (Appendix B). The soils were screened in the field for the presence of VOCs using a PID.

ERM 12 Hookston Station – 15 May 2008
Elevated total VOCs were detected at MIP-9 in the shallow subsurface from approximately 7 to 10 feet bgs (Figure 6). A soil sample for laboratory analysis of VOCs was collected from 7.5 feet bgs at MW-35B, which is adjacent to MIP-9, to evaluate the presence of COCs for the Hookston Station site in this area. The sample was submitted to Accutest Laboratories of Santa Clara, California for analysis of VOCs by United States Environmental Protection Agency (USEPA) Method 8260. TCE and cis-1,2-DCE were detected at concentrations of 60 and 82 micrograms per kilogram (µg/kg), respectively. Additional VOCs were not detected above the laboratory reporting limits.
The wells were completed as 2-inch-diameter PVC wells with 10-foot screens. Wells MW-34B, -35B, and -36B were completed at total depths of 59 and 60 feet bgs. These wells were screened within the B-Zone sands and will monitor the water quality of the depth intervals into which the KMnO4 solution was injected (via temporary injection points and permanent injection wells INJ-5 to INJ-9). Wells MW-13A2 and -35A2 were completed at total depths of 43 and 48 feet bgs, respectively. These wells will monitor the water quality of the depth intervals into which KMnO4 solution was injected via injection wells INJ-1 to INJ-4. See Appendix B for well completion details, including well materials used, total depths, and screen intervals.
The performance monitoring wells were developed on 4 and 7 April 2008 by Gregg Drilling. The wells were developed by bailing and surging, and seven to 10 well casing volumes of water were removed from each well during development. Development water was containerized in drums and stored on site pending off-site disposal at a licensed disposal facility.
3.3 BASELINE MONITORING EVENT
Ground water samples were collected between 30 January and 15 February 2008 to document baseline water quality conditions prior to implementing the first B-Zone ISCO injection event. All well sampling activities were conducted in accordance with the Standard Operating Procedures provided in the Sampling and Analysis Plan. Baseline ground water samples were collected from nine monitoring wells (MW-8B, -11B, -12B, -13A2, -13B, -34B, -35A2, -35B, and -36B), one test well (TW-1), and four injection wells (INJ-1 to -4). Results of the baseline monitoring event are summarized on Table 1.
The nine monitoring wells and one test well were purged and sampled with a peristaltic pump by low-flow purge techniques. During well

ERM 13 Hookston Station – 15 May 2008
purging activities, water quality parameters (including temperature, pH, specific conductance, oxidation-reduction potential, dissolved oxygen, and turbidity) were measured with an in-line flow cell and water quality meter and noted on field sampling forms. Once purging was completed, ground water samples were collected with the peristaltic pump for laboratory analysis of the following:
• Potassium, iron, and manganese by USEPA Methods 6010 and 6020 (USEPA SW-846);
• Chloride by USEPA Method 300.0 (Methods of Chemical Analysis of Waters and Wastes);
• Dissolved chromium by USEPA SW-846 Method 6010; and
• Dissolved hexavalent chromium by USEPA SW-846 Method 7196-A.
Once the above samples were collected, ground water samples for laboratory analysis of VOCs by USEPA Method 8260 were collected with disposable bailers.
The four injection wells were purged and sampled with disposable bailers. Three casing volumes were removed prior to sampling. During well purging activities, water quality parameters (including temperature, pH, and specific conductance) were measured and noted on field sampling forms. Once purging was completed, ground water samples were collected from each well for laboratory analysis of VOCs by USEPA Method 8260.
Purge water generated during the baseline sampling event was stored on site in 55-gallon drums pending off-site disposal at a licensed disposal facility.
3.4 POTASSIUM PERMANGANATE INJECTIONS
This section documents the activities completed during the first injection event of the B-Zone ISCO program.
3.4.1 Injections via Temporary Injection Points
During 20 February through 12 March 2008, 41 temporary injection points (I-1 to I-41) were completed at the site (Figure 7). Precision Sampling was retained to conduct the drilling, mixing, and chemical injection at the temporary injection points. Drilling of the temporary injection locations was initially attempted using both a track-mounted and a truck-mounted

ERM 14 Hookston Station – 15 May 2008
direct-push rig. The target depth of 57 feet bgs could not be reached with the truck-mounted direct-push rig; therefore, a sonic drill rig was used to complete some of the temporary injection points. Once the target depth was reached, the rods were pulled up 1 foot, exposing the injection tool.
A trailer-mounted 1,100-gallon poly tank was used to mix the KMnO4 solution. To prepare the KMnO4 solution, the poly tank was filled with 1,000 gallons of water from a nearby fire hydrant. Three buckets of KMnO4 (in powder form) were added to the water and the solution was thoroughly mixed. This provided a concentration of approximately 2 percent. The mixed solution was then transferred to a set of poly tanks mounted on a flatbed truck and transported to the injection area. The solution was delivered to the injection rods via a high pressure Moyno pump and hoses. Flow rates of the injected solution ranged from approximately 5 to 16 gallons per minute (gpm).
Target injection intervals were generally from 50 feet to 57 feet bgs. Target injection volumes for each temporary injection point were 1,000 or 2,000 gallons, depending on the specific location of the temporary injection point. A total of approximately 73,360 gallons of KMnO4 was injected into the 41 temporary injection points. Table 2 summarizes injection parameters for each temporary injection point.
3.4.2 Injections via Permanent Injection Wells
Vironex was retained to conduct the injection activities at the 9 permanent injection wells. Vironex used a custom-designed, fully self-contained, high-volume injection system. The system consisted of a batch mixing basin that metered water and dry KMnO4 powder in the appropriate proportions to maintain a 2.5 percent solution. As the solution was mixed to complete solubility, it was automatically transferred to a 1,000-gallon poly tank and recirculated to maintain proper mixing and provide the continuous source of the injection solution. The thoroughly mixed solution was pumped through a series of bag filters using a 2-inch pneumatic diaphragm pump. The filters eliminated suspended particles from being injected into the wells and ensured that only KMnO4 dissolved into solution was introduced into the well, thus reducing the potential for the injection wells to become fouled by suspended particles.
Injection activities at INJ-1 through -4 were completed from 19 to 24 March 2008. A total of approximately 36,550 gallons of a 2.5 percent KMnO4 solution was evenly distributed into each well. Injection flow rates ranged from 12 to 48 gpm. Injection pressures were typically

ERM 15 Hookston Station – 15 May 2008
between 0 to 5 pounds per square inch (psi) at the injection wellhead. Table 2 provides the injection parameters for each injection well.
Injection activities at INJ-5, -6, -7, and -9 were completed from 9 to 11 April 2008. As described previously, INJ-8 was not used because it was damaged during installation. Approximately 45,300 gallons of a 2.5 percent KMnO4 solution was injected into these wells. Approximately 9,000 gallons was injected into both INJ-5 and INJ-6, and approximately 13,500 gallons was injected into both INJ-7 and INJ-9. Additional volume was injected into these two wells to compensate for the lack of injection at INJ-8. Injection flow rates ranged from 10 to 49 gpm. Injection pressures were typically between 0 and 5 psi at the injection wellhead. Table 2 provides the injection parameters for each injection well.
3.4.3 Injection Monitoring
As part of ERM’s safety program for the site, and to monitor the radius of influence for the ISCO solution, the following monitoring points were established and checked several times daily during the injection event:
• Dust monitoring – Due to the proximity of a regional pedestrian trail to the mixing station, dust monitoring was conducted with a personal dust monitor (MIE model PDR-1000) while mixing activities were conducted for the temporary injection points. Recorded dust levels ranged from 0 to 0.05 milligrams per cubic meter (mg/m3). Action levels for dust were set at 5 mg/m3.
• Existing monitoring wells – These were visually inspected for the distinctive purple color of KMnO4 to verify the distribution of the ISCO solution. Additionally, the water levels in the monitoring wells closest to the active injection locations were monitored to ensure the water did not rise to the surface. Once the injection activities were completed at the temporary injection points, purple liquid was observed in wells TW-1, MW-35A2, MW-35B, and MW-36B indicating that the KMnO4 solution was distributed throughout the area.
• Sanitary and storm sewer utilities – To ensure that the utilities in the area were not impacted and potentially creating a short circuit for the injected solution, several on- and off-site manholes were visually inspected daily for purple liquid. Additionally, the storm sewer outfall to the nearby flood canal was also inspected daily. Purple-colored liquids, indicative of permanganate presence, was not observed in any of the inspected utilities.

ERM 16 Hookston Station – 15 May 2008
3.5 INVESTIGATION-DERIVED WASTE MANAGEMENT
Investigation-derived wastes included drill cuttings (soil), development and purge ground water, and decontamination water. All investigation-derived waste produced during implementation of the B-Zone ISCO program was stored on site pending waste profiling. With the exception of development water from INJ-5 to INJ-9, the wastes were then transported off site by a licensed waste hauler to a licensed disposal facility.
Development water from INJ-5 to INJ-9 was containerized on site. These wells were developed after injection activities were completed at nearby temporary injection points. Therefore, the development water contained KMnO4 solution. The development water was containerized for approximately 1 week, which allowed sediments to settle to the bottom of the drums. The water was then siphoned off and injected into INJ-5, -6, -7, and -9.
3.6 SURVEY ACTIVITIES
The MIP borings, injection wells, and performance monitoring wells were surveyed for latitude, longitude, and elevation by a surveyor licensed in the state of California. The latitude and longitude of the temporary injection points were located with a hand-held global positioning system unit.

ERM 17 Hookston Station – 15 May 2008
4.0 PERFORMANCE MONITORING
The activities and results of the first performance monitoring event are described in the following sections.
4.1 PERFORMANCE MONITORING ACTIVITIES
The first performance monitoring event was completed on 23 and 24 April 2008. All sampling activities were conducted in accordance with the RDIP and Sampling and Analysis Plan.
Ground water samples were collected from wells MW-8B, -11B, -12B, -13A2, -13B, -34B, -35A2, -35B, -36B, and TW-1. The wells were purged and sampled with a peristaltic pump by low-flow purge techniques. During well purging activities, water quality parameters (including temperature, pH, specific conductance, oxidation-reduction potential, dissolved oxygen, and turbidity) were measured with an in-line flow cell and water quality meter and noted on field sampling forms. The water quality was also observed for purple coloration, which is indicative of permanganate presence. Once purging was completed, ground water samples were collected with the peristaltic pump for laboratory analysis of the following:
• Potassium, iron, and manganese by USEPA Methods 6010 and 6020 (USEPA SW-846);
• Chloride by USEPA Method 300.0 (Methods of Chemical Analysis of Waters and Wastes);
• Dissolved chromium by USEPA SW-846 Method 6010; and
• Dissolved hexavalent chromium by USEPA SW-846 Method 7196-A.
Once the above samples were collected, ground water samples for laboratory analysis of VOCs by USEPA Method 8260 were collected with disposable bailers.
The 9 injection wells were also inspected during the first performance monitoring event. Grab ground water samples were retrieved from each injection well with disposable bailers and inspected for purple coloration.

ERM 18 Hookston Station – 15 May 2008
Purge water generated during the performance monitoring event was stored on site in 55-gallon drums pending off-site disposal at a licensed disposal facility.
4.2 PERFORMANCE MONITORING RESULTS
The results of the first performance monitoring event are summarized on Table 1 and briefly summarized below.
During the first post-injection monitoring event, purple coloration was observed in ground water at the 9 injection wells and 4 monitoring wells (MW-11B, MW-35B, MW-36B, and TW-1) indicating that the KMnO4 solution was distributed throughout the treatment area and remains chemically active. Significant decreases in VOCs were noted in these monitoring wells within the injection area.
Well Name Pre-injection TCE, µg/L
Post-injection TCE, µg/L
Pre-injection cis-1,2-DCE, µg/L
Post-injection cis-1,2-DCE, µg/L
MW-11B 13,000 ND<2.5 1,200 ND<2.5
MW-35B 440 85 12 ND<0.5
MW-36B 3,400 ND<0.5 21 ND<0.5
TW-1 42 11 760 ND<0.5
It is common to have some rebounding of chemical concentrations over time following an initial oxidant injection. Additional water quality monitoring will be completed to observe chemical trends over time.

ERM 19 Hookston Station – 15 May 2008
5.0 SCHEDULE AND REPORTING
In accordance with the RDIP, the second and third performance monitoring events will be conducted approximately 2 and 4 months after completion of the first injection event. The second performance monitoring event is currently scheduled for June 2008 and the third will be completed in August 2008. The results of these performance monitoring events will be presented in the Second Quarter 2008 Monitoring Report and Third Quarter 2008 Monitoring Report.
The second B-Zone ISCO injection event is currently scheduled for October 2008. The injection activities will be documented in the Fourth Quarter 2008 Monitoring Report. Additional performance monitoring will be implemented after the second injection event in accordance with the RDIP.

ERM 20 Hookston Station – 15 May 2008
6.0 SUMMARY
The first round of chemical injections associated with the Hookston Station B-Zone ground water ISCO remediation program has been implemented. The following activities have thus far been completed:
• A pre-implementation investigation was conducted to optimize and finalize the design plans for the B-Zone ISCO program.
• Five performance monitoring wells and 9 permanent injection wells were installed at the site.
• The Baseline Monitoring Event was completed between 30 January and 15 February 2008. Ground water samples for laboratory analysis of VOCs, potassium, iron, manganese, chloride, and dissolved chromium (total and hexavalent chromium) were collected from 10 monitoring wells. Ground water samples for VOC analyses were also collected from 4 injection wells during the Baseline Monitoring Event.
• Approximately 73,360 gallons of a 2 percent KMnO4 solution (approximately 12,000 lbs KMnO4) were injected into 41 temporary injection points between 20 February and 12 March 2008. The KMnO4 solution was injected from approximately 50 to 57 feet bgs.
• Approximately 36,550 gallons of a 2.5 percent KMnO4 solution (approximately 7,900 lbs KMnO4) were injected into 4 permanent injection wells (screened from 36 to 46 feet bgs) during 19 to 24 March 2008.
• Approximately 45,300 gallons of a 2.5 percent KMnO4 solution (approximately 9,500 lbs KMnO4) were injected into 4 permanent injection wells (screened from approximately 50 to 55 feet bgs) during 8 to 11 April 2008.
• The first performance monitoring event was completed on 23 and 24 April 2008. Ground water samples for laboratory analysis of VOCs, potassium, iron, manganese, chloride, and dissolved chromium (total and hexavalent chromium) were collected from 10 monitoring wells. The water quality at these 10 monitoring wells and the 9 injection wells was also inspected for purple coloration.

ERM 21 Hookston Station – 15 May 2008
Based on the results of the first performance monitoring event, the KMnO4 solution was successfully distributed throughout the treatment area and VOC results have significantly decreased. Additional performance monitoring and injection events will be completed later this year.

ERM 22 Hookston Station – 15 May 2008
7.0 REFERENCES
ERM-West, Inc. (ERM). 2007. Remedial Design and Implementation Plan for B-Zone Chemical Oxidation. August.
ERM. 2006. Feasibility Study, Hookston Station, Pleasant Hill, California. 10 July.
ERM. 2004. Remedial Investigation Report, Hookston Station Site, Pleasant Hill, California. August.
ERM. 2000. Phase I Remedial Investigation Sampling and Analysis Plan. December.

Figures


Tables

Table 1Summary of Performance Monitoring ResultsHookston StationPleasant Hill, CA
Location Date PCE TCE c-1,2-DCE t-1,2-DCE 1,1-DCE VC K Mn Cl- Disslvd Cr Disslvd Cr6+ Fe ORP pH Temperature Spec. Cond DO Turbidity(µg/L) (µg/L) (µg/L) (µg/L) (µg/L) (µg/L) (mg/L) (mg/L) (mg/L) (mg/L) (mg/L) (mg/L) (mV) (Celcius) (µS/cm) (mg/L) (NTU)
Hookston Station Ground Water Cleanup Standard: n/a 5.0 6.0 10.0 6.0 0.5 n/a n/a n/a n/a n/a n/a n/a n/a n/a n/a n/a n/aHookston Station Ground Water Cleanup Standard (for vapor intrusion): n/a 5.0 6.0 10.0 6.0 0.5 n/a n/a n/a n/a n/a n/a n/a n/a n/a n/a n/a n/a
MW-11B 2/14/2008 Baseline Event 40-50 n/a < 120 13,000 1,200 < 120 780 < 120 3 2 290 < 0.0050 < 0.010 13 -1.5 7.08 18.01 1686 1.41 33.4MW-11B 4/24/2008 13 days 40-50 Yes <2.5 <2.5 <2.5 <2.5 <2.5 <2.5 230 130 140 2.1 <0.25 1 610.9 7.15 22.39 2300 1.45 37.7
MW-12B 2/14/2008 Baseline Event 50-60 n/a < 10 19 1,200 < 10 91 120 1.1 0.95 270 < 0.0050 < 0.010 0.21 -79.5 7.07 18.14 1746 0.75 1183.6MW-12B 4/23/2008 12 days 50-60 No <2.5 16 330 2.8 39 60 1.2 0.95 270 <0.0050 <0.010 0.22 -195 7.13 18.29 1698 0.71 1.3
MW-13A2 2/15/2008 Baseline Event 33-43 n/a < 33 3,200 120 < 33 100 < 33 4.9 0.88 190 < 0.0050 < 0.010 2.6 23.2 7.21 19.65 1730 0.40 49.7MW-13A2 4/23/2008 12 days 33-43 No <25 3,900 320 <25 150 <25 8.3 1.5 150 <0.0050 <0.010 59 331.2 7.22 19.33 1710 1.00 365.8
MW-13B 2/14/2008 Baseline Event 45-55 n/a < 8.4 76 (a) 920 < 8.4 < 8.4 150 1.4 0.44 150 0.02 0.017 0.64 -56.6 7.06 18.51 1655 2.03 15.6MW-13B 4/23/2008 12 days 45-55 No <10 2100 400 <10 86 20 1.5 0.45 150 0.18 0.15 0.67 -256.4 7.1 19.22 1702 0.69 12.2
MW-34B 2/14/2008 Baseline Event 49-59 n/a < 0.50 4.7 < 0.50 < 0.50 < 0.50 < 0.50 5.4 1.9 490 < 0.0050 < 0.010 1.8 -22.6 6.93 18.91 2407 0.28 32.1MW-34B 4/24/2008 13 days 49-59 No <0.50 <0.50 <0.50 <0.50 <0.50 <0.50 2.6 1.8 520 <0.0050 <0.010 3.2 381.6 7.07 19.29 2369 0.69 76.7MW-34B Dup 4/24/2008 13 days 49-59 No <0.50 <0.50 <0.50 <0.50 <0.50 <0.50 2.7 1.8 460 <0.0050 <0.010 3.5 381.6 7.07 19.29 2369 0.69 76.7
MW-35A2 2/15/2008 Baseline Event 38-48 n/a < 62 6,200 88 < 62 340 < 62 4.4 0.89 270 < 0.0050 < 0.010 3.9 -112.8 6.92 19.77 1840 0.29 42.6MW-35A2 4/23/2008 12 days 38-48 No <50 3,300 52 <50 150 <50 4.1 1.3 260 0.0051 <0.010 9.7 63.1 7.01 19.81 1858 0.65 63.8
MW-35B 2/15/2008 Baseline Event 50-60 n/a < 5.0 440 12 < 5.0 24 < 5.0 3.5 1 290 < 0.0050 < 0.010 6.9 -128.5 6.95 19.74 1848 0.52 101.6MW-35B 4/24/2008 13 days 50-60 Yes <0.50 85 <0.50 <0.50 2.2 <0.50 12 1.4 270 0.08 0.071 7.2 616.9 7.06 20.33 1919 0.80 46.8
MW-36B 2/15/2008 Baseline Event 50-60 n/a < 25 3,400 21 < 25 210 < 25 3.7 0.73 270 < 0.0050 < 0.010 3.1 16.9 7.09 19.82 1839 0.51 85.9MW-36B 4/24/2008 13 days 50-60 Yes <0.50 <0.50 <0.50 <0.50 <0.50 <0.50 36 8.6 240 0.76 <0.010 9.8 657.2 7.10 20.24 1999 0.41 157.3
MW-8B 2/14/2008 Baseline Event 45-60 n/a < 3.3 370 (b) 7.8 < 3.3 6.6 < 3.3 0.82 0.015 240 < 0.0050 < 0.010 0.72 21.0 6.80 18.18 1779 0.72 1183.7MW-8B Dup 2/14/2008 Baseline Event 45-60 n/a < 3.3 360 8 < 3.3 6.9 < 3.3 0.77 0.013 160 < 0.0050 < 0.010 0.61 21.0 6.80 18.18 1779 0.72 1183.7MW-8B 4/24/2008 13 days 45-60 No <2.5 430 13 <2.5 11 <2.5 1.1 0.044 160 <0.0050 <0.010 2.1 478.8 6.98 19.84 1800 0.25 10.6
TW-1 2/14/2008 Baseline Event 45-75 n/a < 6.2 42 760 < 6.2 15 32 0.76 0.43 170 0.0078 < 0.010 0.27 19.01 7.00 18.33 1679 0.79 19.1TW-1 4/23/2008 12 days 45-75 Yes 6.2 11 <0.50 <0.50 <0.50 <0.50 2.5 4.3 160 0.43 0.36 0.25 539.4 7.10 18.75 1701 0.59 133.7
INJ-1 01/30/2008 Baseline Event 36-46 n/a < 5.0 450 < 5.0 < 5.0 27 < 5.0 n/a n/a n/a n/a n/a n/a n/a n/a n/a n/a n/a n/aINJ-1 4/23/2008 12 days 36-46 Yes n/a n/a n/a n/a n/a n/a n/a n/a n/a n/a n/a n/a n/a n/a n/a n/a n/a n/a
INJ-2 01/31/2008 Baseline Event 36-46 n/a < 50 8,800 450 < 50 290 < 50 n/a n/a n/a n/a n/a n/a n/a n/a n/a n/a n/a n/aINJ-2 4/23/2008 12 days 36-46 Yes n/a n/a n/a n/a n/a n/a n/a n/a n/a n/a n/a n/a n/a n/a n/a n/a n/a n/a
INJ-3 01/30/2008 Baseline Event 36-46 n/a < 20 2,500 < 20 < 20 150 < 20 n/a n/a n/a n/a n/a n/a n/a n/a n/a n/a n/a n/aINJ-3 4/23/2008 12 days 36-46 Yes n/a n/a n/a n/a n/a n/a n/a n/a n/a n/a n/a n/a n/a n/a n/a n/a n/a n/a
INJ-4 01/30/2008 Baseline Event 36-46 n/a < 5.0 810 7.4 < 5.0 50 < 5.0 n/a n/a n/a n/a n/a n/a n/a n/a n/a n/a n/a n/aINJ-4 4/23/2008 12 days 36-46 Yes n/a n/a n/a n/a n/a n/a n/a n/a n/a n/a n/a n/a n/a n/a n/a n/a n/a n/a
INJ-5 4/23/2008 12 days 51-56 Yes n/a n/a n/a n/a n/a n/a n/a n/a n/a n/a n/a n/a n/a n/a n/a n/a n/a n/a
INJ-6 4/23/2008 12 days 50-55 Yes n/a n/a n/a n/a n/a n/a n/a n/a n/a n/a n/a n/a n/a n/a n/a n/a n/a n/a
Purple Coloration
Days After Injection Event Completed
Screen Interval (feet bgs)
ERM Page 1 of 2 Hookston Station - 15 May 2008

Table 1Summary of Performance Monitoring ResultsHookston StationPleasant Hill, CA
Location Date PCE TCE c-1,2-DCE t-1,2-DCE 1,1-DCE VC K Mn Cl- Disslvd Cr Disslvd Cr6+ Fe ORP pH Temperature Spec. Cond DO Turbidity(µg/L) (µg/L) (µg/L) (µg/L) (µg/L) (µg/L) (mg/L) (mg/L) (mg/L) (mg/L) (mg/L) (mg/L) (mV) (Celcius) (µS/cm) (mg/L) (NTU)
Hookston Station Ground Water Cleanup Standard: n/a 5.0 6.0 10.0 6.0 0.5 n/a n/a n/a n/a n/a n/a n/a n/a n/a n/a n/a n/aHookston Station Ground Water Cleanup Standard (for vapor intrusion): n/a 5.0 6.0 10.0 6.0 0.5 n/a n/a n/a n/a n/a n/a n/a n/a n/a n/a n/a n/a
Purple Coloration
Days After Injection Event Completed
Screen Interval (feet bgs)
INJ-7 4/23/2008 12 days 49-54 Yes n/a n/a n/a n/a n/a n/a n/a n/a n/a n/a n/a n/a n/a n/a n/a n/a n/a n/a
INJ-8 4/23/2008 12 days 49-54 Yes n/a n/a n/a n/a n/a n/a n/a n/a n/a n/a n/a n/a n/a n/a n/a n/a n/a n/a
INJ-9 4/23/2008 12 days 50-55 Yes n/a n/a n/a n/a n/a n/a n/a n/a n/a n/a n/a n/a n/a n/a n/a n/a n/a n/a
Notes:Chemical oxidation injection event completed 20 February - 11 April 2008.(a) TCE at MW-13B has historically been detected at concentrations ranging from 400 to 6,300 µg/L. (b) TCE at MW-8B has historically been detected at concentrations ranging from 86 to 5,200 µg/L.n/a = not analyzed or not applicablefeet bgs = feet below ground surfaceµg/L = micrograms per litermg/L = milligrams per litermV = millivoltsµS/cm = microsiemens per centimeterNTU = nephelometric turbidity unitsPCE = TetrachlorotheneTCE = Trichloroethenec-1,2-DCE = cis-1,2-dichloroethenet-1,2-DCE = trans-1,2-dichloroetheneVC = Vinyl chlorideK = PotassiumMn = ManganeseCl- = ChlorideDisslvd Cr = Total chromium (dissolved)Disslvd Cr6+ = Hexavalent chromium (dissolved)Fe = IronORP = Oxidation reduction potentialDO = Dissolved oxygen
ERM Page 2 of 2 Hookston Station - 15 May 2008

Table 2Chemical Oxidation Injection Program DetailsHookston Station Site
Injection Location Date Completed Injection Interval
Flow Rate (gpm)
Buckets of KMnO4
KMnO4
Mass (lb)Injection
Volume (gal)Solution
Strength (%) Comments
Temporary Injection Points
I-1 02/20/08 50-60 8.5-13.3 3 165 1,362 1.5I-2 02/21/08 50-57 9.8-14.3 6 331 2,000 2.0I-3 02/21/08 50.5-57 8.5-11.9 6 331 1,087 3.7I-4 02/22/08 50-57 13-14 3 165 932 2.1I-5 02/25/08 50-55 7.8-9.3 3 165 1,000 2.0I-6 02/25/08 50-57 5.8-14.9 3 165 1,000 2.0I-7 02/26/08 50-57 14.5-15.6 3 165 1,000 2.0I-8 02/26/08 50-57 7.3-13 3 165 1,000 2.0I-9 02/26/08 50-55 9.7-13.5 3 165 1,393 1.4I-10 02/27/08 50-57 0-5.8 6 331 455 8.7 Attempted 3 times, abandoned. Flow rate
decreased above 53 ft.I-11 02/27/08 50-55 6.2-14.8 6 331 1,286 3.1I-12 02/27/08 50-57 6.3-14.9 6 331 1,779 2.2I-13 02/28/08 50-57 9.8-14.5 6 331 1,960 2.0I-14 02/28/08 50-57 10.7-15.8 3 165 906 2.2I-15 02/28/08 50-57 11.2-14.5 6 331 2,156 1.8I-16 02/29/08 50-57 5.3-13.2 6 331 2,240 1.8I-17 02/29/08 50-57 6-14.1 6 331 2,242 1.8 Flow rate decreased in 50-52.I-18 03/03/08 50-55 9-12 3 165 1,114 1.8I-19 03/03/08 50-57 0-14.4 6 331 2,050 1.9 22 gal from 52-57, 2,000 gal from 50-52I-20 03/04/08 50-57 10-12 6 331 2,141 1.9I-21 03/04/08 50-57 6.9-12.8 6 331 2,276 1.7I-22 03/05/08 50-57 10.7-13 6 331 2,068 1.9I-23 03/05/08 50-57 11.3-12.8 6 331 2,142 1.9I-24 03/05/08 50-57 11.5-14.3 6 331 2,148 1.8I-25 03/06/08 50-57 10.6-13 6 331 2,037 1.9I-26 03/06/08 50-57 11.6-14 6 331 2,016 2.0I-27 03/06/08 50-57 11.2-14.8 6 331 2,057 1.9I-28 03/06/08 50-57 5.7-11.4 6 331 2,007 2.0I-29 03/07/08 50-57 5.7-13.1 6 331 2,285 1.7I-30 03/07/08 50-57 6.7-10.8 6 331 2,015 2.0I-31 03/07/08 50-57 13.6-16.3 6 331 2,020 2.0I-32 03/07/08 50-57 10.3-12.2 6 331 2,195 1.8I-33 03/10/08 50-57 13.1-14.9 6 331 2,031 2.0I-34 03/10/08 50-57 9.5-11.8 6 331 2,130 1.9I-35 03/10/08 50-57 11.9-15.2 6 331 2,104 1.9I-36 03/11/08 50-57 8.9-11.5 6 331 2,119 1.9I-37 03/11/08 50-57 12.3-14.3 6 331 2,002 2.0I-38 03/11/08 50-57 12.5-15.1 6 331 2,110 1.9I-39 03/12/08 50-57 12.6-14.5 6 331 2,030 2.0I-40 03/12/08 50-57 9.8-12.5 6 331 2,150 1.8I-41 03/12/08 50-57 10.8-14.6 6 331 2,319 1.7 Add'l 366 gal to rinse tanks.
Permanent Injection Wells
INJ-1 3/20/2008 36-46 19-37 35 1,929 9,218 2.5INJ-2 3/24/2008 36-46 27-39 36 1,985 9,128 2.6INJ-3 3/24/2008 36-46 12-41 36 1,985 9,100 2.6INJ-4 3/19/2008 36-46 12-48 36 1,985 9,100 2.6INJ-5 4/9/2008 51-56 28-49 36 1,985 9,200 2.6INJ-6 4/11/2008 50-55 10-45 36 1,985 9,057 2.6INJ-7 4/8/2008 49-54 23-51 51 2,811 13,500 2.5INJ-8 4/8/2008 49-54 n/a n/a n/a n/a n/a Well damaged during installation.INJ-9 4/10/2008 50-55 34-46 50 2,756 13,500 2.5
Temporary Injection Point Subtotals: 219 12,072 73,362Injection Well Subtotals: 316 17,420 81,803
Total First Round Injection 535 29,492 155,165
Notes:gpm = gallons per minute KMnO4 = Potassium permanganate solutionlb = poundsgal = gallons
Pleasant Hill, California
ERM Page 1 of 1 Hookston Station - 15 May 2008

Appendix A Membrane Interface Probe Logs

MIP Log Results by Boring - Detector Reading vs. Depth
Client: ERM Boring I.D.: MIP-1 Detector 1 : Electron Capture (ECD)Date: Jan 09 2008 Detector 2 : Photo Ionization (PID)
Time: 11:21 Detector 3 : Flame Ionization (FID)
Det
ecto
r 1 L
og
Det
ecto
r 2 L
og
Det
ecto
r 3 L
og
0.0E+00
2.0E+06
4.0E+06
6.0E+06
8.0E+06
1.0E+07
1.2E+07
1.4E+07
1.6E+07
0 2 4 6 8 10 12 14 16 18 20 22 24 26 28 30 32 34 36 38 40 42 44 46 48 50 52 54 56 58
Depth (ft)
ECD
(Max
Res
pons
e)
0
50
100
150
200
250
300
Con
duct
ivity
(mS/
M)
ECD MAX Conductivity mS/M
0.0E+00
5.0E+04
1.0E+05
1.5E+05
2.0E+05
2.5E+05
3.0E+05
3.5E+05
4.0E+05
4.5E+05
5.0E+05
0 2 4 6 8 10 12 14 16 18 20 22 24 26 28 30 32 34 36 38 40 42 44 46 48 50 52 54 56 58Depth (ft)
PID
(Max
Res
pons
e)
0
50
100
150
200
250
300
Con
duct
ivity
(mS/
M)
PID MAX Conductivity mS/M
0.0E+00
2.0E+04
4.0E+04
6.0E+04
8.0E+04
1.0E+05
1.2E+05
1.4E+05
1.6E+05
0 2 4 6 8 10 12 14 16 18 20 22 24 26 28 30 32 34 36 38 40 42 44 46 48 50 52 54 56 58
Depth (ft)
FID
(Max
Res
pons
e)
0
50
100
150
200
250
300C
ondu
ctiv
ity (m
S/M
)FID MAX Conductivity mS/M
Page 1 of 4

MIP Log Results by Boring - Detector Reading vs. Depth
Client: ERM Boring I.D.: MIP-1 Graph 1 : Probe Temperature (C) Date: Jan 09 2008 Graph 2 : Probe Pressure (PSI)Time: 11:21
Prob
e Te
mpe
ratu
re L
og
Prob
e Pr
essu
re L
og
Explanation: Hand auger to 5' bgs. Refusal at 59' bgs.
0
20
40
60
80
100
120
140
0 2 4 6 8 10 12 14 16 18 20 22 24 26 28 30 32 34 36 38 40 42 44 46 48 50 52 54 56 58Depth (ft)
Prob
e Te
mpe
ratu
re (C
)
0
50
100
150
200
250
300
Con
duct
ivity
(mS/
M)
Probe Temperature MAX °C Conductivity mS/M
10
11
12
13
14
15
16
17
18
19
20
0 2 4 6 8 10 12 14 16 18 20 22 24 26 28 30 32 34 36 38 40 42 44 46 48 50 52 54 56 58Depth (ft)
Prob
e Pr
essu
re (P
SI)
0
50
100
150
200
250
300
Con
duct
ivity
(mS/
M)
Pressure PSI Conductivity mS/M
Page 2 of 4

MIP Log Results by Boring - Detector Reading vs. Depth
Client: ERM Boring I.D.: MIP-2 Detector 1 : Electron Capture (ECD)Date: Jan 09 2008 Detector 2 : Photo Ionization (PID)
Time: 08:21 Detector 3 : Flame Ionization (FID)
Det
ecto
r 1 L
og
Det
ecto
r 2 L
og
Det
ecto
r 3 L
og
0.0E+00
2.0E+06
4.0E+06
6.0E+06
8.0E+06
1.0E+07
1.2E+07
1.4E+07
1.6E+07
0 2 4 6 8 10 12 14 16 18 20 22 24 26 28 30 32 34 36 38 40 42 44 46 48 50 52 54 56 58 60 62 64
Depth (ft)
ECD
(Max
Res
pons
e)
0
50
100
150
200
250
300
Con
duct
ivity
(mS/
M)
ECD MAX Conductivity mS/M
0.0E+00
5.0E+04
1.0E+05
1.5E+05
2.0E+05
2.5E+05
3.0E+05
3.5E+05
4.0E+05
4.5E+05
0 2 4 6 8 10 12 14 16 18 20 22 24 26 28 30 32 34 36 38 40 42 44 46 48 50 52 54 56 58 60 62 64Depth (ft)
PID
(Max
Res
pons
e)
0
50
100
150
200
250
300
Con
duct
ivity
(mS/
M)
PID MAX Conductivity mS/M
0.0E+00
2.0E+04
4.0E+04
6.0E+04
8.0E+04
1.0E+05
1.2E+05
1.4E+05
1.6E+05
1.8E+05
0 2 4 6 8 10 12 14 16 18 20 22 24 26 28 30 32 34 36 38 40 42 44 46 48 50 52 54 56 58 60 62 64
Depth (ft)
FID
(Max
Res
pons
e)
0
50
100
150
200
250
300C
ondu
ctiv
ity (m
S/M
)FID MAX Conductivity mS/M
Page 1 of 4

MIP Log Results by Boring - Detector Reading vs. Depth
Client: ERM Boring I.D.: MIP-2 Graph 1 : Probe Temperature (C) Date: Jan 09 2008 Graph 2 : Probe Pressure (PSI)Time: 08:21
Prob
e Te
mpe
ratu
re L
og
Prob
e Pr
essu
re L
og
Explanation: Hand auger to 5' bgs. Refusal at 64' bgs.
0
20
40
60
80
100
120
140
0 2 4 6 8 10 12 14 16 18 20 22 24 26 28 30 32 34 36 38 40 42 44 46 48 50 52 54 56 58 60 62 64Depth (ft)
Prob
e Te
mpe
ratu
re (C
)
0
50
100
150
200
250
300
Con
duct
ivity
(mS/
M)
Probe Temperature MAX °C Conductivity mS/M
10
11
12
13
14
15
16
17
18
19
20
0 2 4 6 8 10 12 14 16 18 20 22 24 26 28 30 32 34 36 38 40 42 44 46 48 50 52 54 56 58 60 62 64Depth (ft)
Prob
e Pr
essu
re (P
SI)
0
50
100
150
200
250
300
Con
duct
ivity
(mS/
M)
Pressure PSI Conductivity mS/M
Page 2 of 4

MIP Log Results by Boring - Detector Reading vs. Depth
Client: ERM Boring I.D.: MIP-3 Detector 1 : Electron Capture (ECD)Date: Jan 08 2008 Detector 2 : Photo Ionization (PID)
Time: 08:35 Detector 3 : Flame Ionization (FID)
Det
ecto
r 1 L
og
Det
ecto
r 2 L
og
Det
ecto
r 3 L
og
9.0E+04
2.1E+06
4.1E+06
6.1E+06
8.1E+06
1.0E+07
1.2E+07
1.4E+07
1.6E+07
0 2 4 6 8 10 12 14 16 18 20 22 24 26 28 30 32 34 36 38 40 42 44 46 48 50 52 54 56 58 60 62
Depth (ft)
ECD
(Max
Res
pons
e)
0
50
100
150
200
250
300
Con
duct
ivity
(mS/
M)
ECD MAX Conductivity mS/M
0.0E+00
1.0E+05
2.0E+05
3.0E+05
4.0E+05
5.0E+05
6.0E+05
7.0E+05
8.0E+05
9.0E+05
1.0E+06
0 2 4 6 8 10 12 14 16 18 20 22 24 26 28 30 32 34 36 38 40 42 44 46 48 50 52 54 56 58 60 62Depth (ft)
PID
(Max
Res
pons
e)
0
50
100
150
200
250
300
Con
duct
ivity
(mS/
M)
PID MAX Conductivity mS/M
0.0E+00
5.0E+04
1.0E+05
1.5E+05
2.0E+05
2.5E+05
3.0E+05
3.5E+05
4.0E+05
0 2 4 6 8 10 12 14 16 18 20 22 24 26 28 30 32 34 36 38 40 42 44 46 48 50 52 54 56 58 60 62
Depth (ft)
FID
(Max
Res
pons
e)
0
50
100
150
200
250
300C
ondu
ctiv
ity (m
S/M
)FID MAX Conductivity mS/M
Page 1 of 2

MIP Log Results by Boring - Detector Reading vs. Depth
Client: ERM Boring I.D.: MIP-3 Graph 1 : Probe Temperature (C) Date: Graph 2 : Probe Pressure (PSI)Time: GLISH
Prob
e Te
mpe
ratu
re L
og
Prob
e Pr
essu
re L
og
Explanation: Hand auger to 5' bgs.
0
20
40
60
80
100
120
140
160
0 2 4 6 8 10 12 14 16 18 20 22 24 26 28 30 32 34 36 38 40 42 44 46 48 50 52 54 56 58 60 62Depth (ft)
Prob
e Te
mpe
ratu
re (C
)
0
50
100
150
200
250
300
Con
duct
ivity
(mS/
M)
Probe Temperature MAX °C Conductivity mS/M
10
11
12
13
14
15
16
17
18
19
20
0 2 4 6 8 10 12 14 16 18 20 22 24 26 28 30 32 34 36 38 40 42 44 46 48 50 52 54 56 58 60 62Depth (ft)
Prob
e Pr
essu
re (P
SI)
0
50
100
150
200
250
300
Con
duct
ivity
(mS/
M)
Pressure PSI Conductivity mS/M
Page 2 of 2

MIP Log Results by Boring - Detector Reading vs. Depth
Client: ERM Boring I.D.: MIP-4 Detector 1 : Electron Capture (ECD)Date: Jan 08 2008 Detector 2 : Photo Ionization (PID)
Time: 11:46 Detector 3 : Flame Ionization (FID)
Det
ecto
r 1 L
og
Det
ecto
r 2 L
og
Det
ecto
r 3 L
og
0.0E+00
1.0E+06
2.0E+06
3.0E+06
4.0E+06
5.0E+06
6.0E+06
7.0E+06
8.0E+06
0 2 4 6 8 10 12 14 16 18 20 22 24 26 28 30 32 34 36 38 40 42 44 46 48 50 52 54 56 58 60 62 64 66 68
Depth (ft)
ECD
(Max
Res
pons
e)
0
50
100
150
200
250
300
Con
duct
ivity
(mS/
M)
ECD MAX Conductivity mS/M
0.0E+00
2.0E+04
4.0E+04
6.0E+04
8.0E+04
1.0E+05
1.2E+05
1.4E+05
0 2 4 6 8 10 12 14 16 18 20 22 24 26 28 30 32 34 36 38 40 42 44 46 48 50 52 54 56 58 60 62 64 66 68Depth (ft)
PID
(Max
Res
pons
e)
0
50
100
150
200
250
300
Con
duct
ivity
(mS/
M)
PID MAX Conductivity mS/M
0.0E+00
2.0E+04
4.0E+04
6.0E+04
8.0E+04
1.0E+05
1.2E+05
1.4E+05
0 2 4 6 8 10 12 14 16 18 20 22 24 26 28 30 32 34 36 38 40 42 44 46 48 50 52 54 56 58 60 62 64 66 68
Depth (ft)
FID
(Max
Res
pons
e)
0
50
100
150
200
250
300C
ondu
ctiv
ity (m
S/M
)FID MAX Conductivity mS/M
Page 1 of 4

MIP Log Results by Boring - Detector Reading vs. Depth
Client: ERM Boring I.D.: MIP-4 Graph 1 : Probe Temperature (C) Date: Jan 08 2008 Graph 2 : Probe Pressure (PSI)Time: 11:46
Prob
e Te
mpe
ratu
re L
og
Prob
e Pr
essu
re L
og
Explanation: Hand auger to 5' bgs.
10
11
12
13
14
15
16
17
18
19
20
0 2 4 6 8 10 12 14 16 18 20 22 24 26 28 30 32 34 36 38 40 42 44 46 48 50 52 54 56 58 60 62 64 66 68Depth (ft)
Prob
e Pr
essu
re (P
SI)
0
50
100
150
200
250
300
Con
duct
ivity
(mS/
M)
Pressure PSI Conductivity mS/M
0
20
40
60
80
100
120
140
0 2 4 6 8 10 12 14 16 18 20 22 24 26 28 30 32 34 36 38 40 42 44 46 48 50 52 54 56 58 60 62 64 66 68Depth (ft)
Prob
e Te
mpe
ratu
re (C
)
0
50
100
150
200
250
300
Con
duct
ivity
(mS/
M)
Probe Temperature MAX °C Conductivity mS/M
Page 2 of 4

MIP Log Results by Boring - Detector Reading vs. Depth
Client: ERM Boring I.D.: MIP-5 Detector 1 : Electron Capture (ECD)Date: Jan 08 2008 Detector 2 : Photo Ionization (PID)
Time: 14:29 Detector 3 : Flame Ionization (FID)
Det
ecto
r 1 L
og
Det
ecto
r 2 L
og
Det
ecto
r 3 L
og
0.0E+00
5.0E+05
1.0E+06
1.5E+06
2.0E+06
2.5E+06
0 2 4 6 8 10 12 14 16 18 20 22 24 26 28 30 32 34 36 38 40 42 44 46 48 50 52 54 56 58
Depth (ft)
ECD
(Max
Res
pons
e)
0
50
100
150
200
250
300
Con
duct
ivity
(mS/
M)
ECD MAX Conductivity mS/M
0.0E+00
1.0E+04
2.0E+04
3.0E+04
4.0E+04
5.0E+04
6.0E+04
7.0E+04
0 2 4 6 8 10 12 14 16 18 20 22 24 26 28 30 32 34 36 38 40 42 44 46 48 50 52 54 56 58Depth (ft)
PID
(Max
Res
pons
e)
0
50
100
150
200
250
300
Con
duct
ivity
(mS/
M)
PID MAX Conductivity mS/M
0.0E+00
2.0E+04
4.0E+04
6.0E+04
8.0E+04
1.0E+05
1.2E+05
1.4E+05
1.6E+05
0 2 4 6 8 10 12 14 16 18 20 22 24 26 28 30 32 34 36 38 40 42 44 46 48 50 52 54 56 58
Depth (ft)
FID
(Max
Res
pons
e)
0
50
100
150
200
250
300C
ondu
ctiv
ity (m
S/M
)FID MAX Conductivity mS/M
Page 1 of 4

MIP Log Results by Boring - Detector Reading vs. Depth
Client: ERM Boring I.D.: MIP-5 Graph 1 : Probe Temperature (C) Date: Jan 08 2008 Graph 2 : Probe Pressure (PSI)Time: 14:29
Prob
e Te
mpe
ratu
re L
og
Prob
e Pr
essu
re L
og
Explanation: Hand auger to 5' bgs.
10
11
12
13
14
15
16
17
18
19
20
0 2 4 6 8 10 12 14 16 18 20 22 24 26 28 30 32 34 36 38 40 42 44 46 48 50 52 54 56 58Depth (ft)
Prob
e Pr
essu
re (P
SI)
0
50
100
150
200
250
300
Con
duct
ivity
(mS/
M)
Pressure PSI Conductivity mS/M
0
20
40
60
80
100
120
140
0 2 4 6 8 10 12 14 16 18 20 22 24 26 28 30 32 34 36 38 40 42 44 46 48 50 52 54 56 58
Depth (ft)
Prob
e Te
mpe
ratu
re (C
)
0
50
100
150
200
250
300
Con
duct
ivity
(mS/
M)
Probe Temperature MAX °C Conductivity mS/M
Page 2 of 4

MIP Log Results by Boring - Detector Reading vs. Depth
Client: ERM Boring I.D.: MIP-6 Detector 1 : Electron Capture (ECD)Date: Feb 01 2008 Detector 2 : Photo Ionization (PID)
Time: 08:23 Detector 3 : Flame Ionization (FID)
Det
ecto
r 1 L
og
Det
ecto
r 2 L
og
Det
ecto
r 3 L
og
0.0E+00
5.0E+05
1.0E+06
1.5E+06
2.0E+06
2.5E+06
0 2 4 6 8 10 12 14 16 18 20 22 24 26 28 30 32 34 36 38 40 42 44 46 48 50 52 54 56 58 60
Depth (ft)
ECD
(Max
Res
pons
e)
0
50
100
150
200
250
Con
duct
ivity
(mS/
M)
ECD MAX Conductivity mS/M
0.0E+00
1.0E+04
2.0E+04
3.0E+04
4.0E+04
5.0E+04
6.0E+04
7.0E+04
0 2 4 6 8 10 12 14 16 18 20 22 24 26 28 30 32 34 36 38 40 42 44 46 48 50 52 54 56 58 60Depth (ft)
PID
(Max
Res
pons
e)
0
50
100
150
200
250
Con
duct
ivity
(mS/
M)
PID MAX Conductivity mS/M
0.0E+00
1.0E+05
2.0E+05
3.0E+05
4.0E+05
5.0E+05
6.0E+05
7.0E+05
8.0E+05
9.0E+05
1.0E+06
0 2 4 6 8 10 12 14 16 18 20 22 24 26 28 30 32 34 36 38 40 42 44 46 48 50 52 54 56 58 60
Depth (ft)
FID
(Max
Res
pons
e)
0
50
100
150
200
250
Con
duct
ivity
(mS/
M)
FID MAX Conductivity mS/M
Page 1 of 4

MIP Log Results by Boring - Detector Reading vs. Depth
Client: ERM Boring I.D.: MIP-6 Graph 1 : Probe Temperature (C) Date: Feb 01 2008 Graph 2 : Probe Pressure (PSI)Time: 08:23
Prob
e Te
mpe
ratu
re L
og
Prob
e Pr
essu
re L
og
Explanation: Hand auger to 5' bgs. EC not working. Client wanted to run boring without the EC.
0
20
40
60
80
100
120
140
0 2 4 6 8 10 12 14 16 18 20 22 24 26 28 30 32 34 36 38 40 42 44 46 48 50 52 54 56 58 60Depth (ft)
Prob
e Te
mpe
ratu
re (C
)
0
50
100
150
200
250
Con
duct
ivity
(mS/
M)
Probe Temperature MAX °C Conductivity mS/M
10
11
12
13
14
15
16
17
18
19
20
0 2 4 6 8 10 12 14 16 18 20 22 24 26 28 30 32 34 36 38 40 42 44 46 48 50 52 54 56 58 60
Depth (ft)
Prob
e Pr
essu
re (P
SI)
0
50
100
150
200
250
Con
duct
ivity
(mS/
M)
Pressure PSI Conductivity mS/M
Page 2 of 4

MIP Log Results by Boring - Detector Reading vs. Depth
Client: ERM Boring I.D.: MIP-7 Detector 1 : Electron Capture (ECD)Date: Jan 31 2008 Detector 2 : Photo Ionization (PID)
Time: 08:33 Detector 3 : Flame Ionization (FID)
Det
ecto
r 1 L
og
Det
ecto
r 2 L
og
Det
ecto
r 3 L
og
0.0E+00
2.0E+06
4.0E+06
6.0E+06
8.0E+06
1.0E+07
1.2E+07
1.4E+07
1.6E+07
0 2 4 6 8 10 12 14 16 18 20 22 24 26 28 30 32 34 36 38 40 42 44 46 48 50 52 54 56 58 60
Depth (ft)
ECD
(Max
Res
pons
e)
0
50
100
150
200
250
300
Con
duct
ivity
(mS/
M)
ECD MAX Conductivity mS/M
0.0E+00
2.0E+04
4.0E+04
6.0E+04
8.0E+04
1.0E+05
1.2E+05
1.4E+05
1.6E+05
0 2 4 6 8 10 12 14 16 18 20 22 24 26 28 30 32 34 36 38 40 42 44 46 48 50 52 54 56 58 60Depth (ft)
PID
(Max
Res
pons
e)
0
50
100
150
200
250
300
Con
duct
ivity
(mS/
M)
PID MAX Conductivity mS/M
0.0E+00
5.0E+04
1.0E+05
1.5E+05
2.0E+05
2.5E+05
0 2 4 6 8 10 12 14 16 18 20 22 24 26 28 30 32 34 36 38 40 42 44 46 48 50 52 54 56 58 60
Depth (ft)
FID
(Max
Res
pons
e)
0
50
100
150
200
250
300
Con
duct
ivity
(mS/
M)
FID MAX Conductivity mS/M
Page 1 of 4
MIP Log Results by Boring - Detector Reading vs. Depth
Client: ERM Boring I.D.: MIP-7 Graph 1 : Probe Temperature (C) Date: Jan 31 2008 Graph 2 : Probe Pressure (PSI)Time: 08:33
Prob
e Te
mpe
ratu
re L
og
Prob
e Pr
essu
re L
og
Explanation: Hand auger to 5' bgs.
0
20
40
60
80
100
120
140
160
0 2 4 6 8 10 12 14 16 18 20 22 24 26 28 30 32 34 36 38 40 42 44 46 48 50 52 54 56 58 60Depth (ft)
Prob
e Te
mpe
ratu
re (C
)
0
50
100
150
200
250
300
Con
duct
ivity
(mS/
M)
Probe Temperature MAX °C Conductivity mS/M
10
11
12
13
14
15
16
17
18
19
20
0 2 4 6 8 10 12 14 16 18 20 22 24 26 28 30 32 34 36 38 40 42 44 46 48 50 52 54 56 58 60
Depth (ft)
Prob
e Pr
essu
re (P
SI)
0
50
100
150
200
250
300
Con
duct
ivity
(mS/
M)
Pressure PSI Conductivity mS/M
Page 2 of 4

MIP Log Results by Boring - Detector Reading vs. Depth
Client: ERM Boring I.D.: MIP-8 Detector 1 : Electron Capture (ECD)Date: Jan 30 2008 Detector 2 : Photo Ionization (PID)
Time: 12:17 Detector 3 : Flame Ionization (FID)
Det
ecto
r 1 L
og
Det
ecto
r 2 L
og
Det
ecto
r 3 L
og
0.0E+00
2.0E+06
4.0E+06
6.0E+06
8.0E+06
1.0E+07
1.2E+07
1.4E+07
1.6E+07
0 2 4 6 8 10 12 14 16 18 20 22 24 26 28 30 32 34 36 38 40 42 44 46 48 50 52 54 56 58 60
Depth (ft)
ECD
(Max
Res
pons
e)
0
50
100
150
200
250
300
Con
duct
ivity
(mS/
M)
ECD MAX Conductivity mS/M
0.0E+00
2.0E+04
4.0E+04
6.0E+04
8.0E+04
1.0E+05
1.2E+05
0 2 4 6 8 10 12 14 16 18 20 22 24 26 28 30 32 34 36 38 40 42 44 46 48 50 52 54 56 58 60Depth (ft)
PID
(Max
Res
pons
e)
0
50
100
150
200
250
300
Con
duct
ivity
(mS/
M)
PID MAX Conductivity mS/M
0.0E+00
5.0E+04
1.0E+05
1.5E+05
2.0E+05
2.5E+05
0 2 4 6 8 10 12 14 16 18 20 22 24 26 28 30 32 34 36 38 40 42 44 46 48 50 52 54 56 58 60
Depth (ft)
FID
(Max
Res
pons
e)
0
50
100
150
200
250
300
Con
duct
ivity
(mS/
M)
FID MAX Conductivity mS/M
Page 1 of 4

MIP Log Results by Boring - Detector Reading vs. Depth
Client: ERM Boring I.D.: MIP-8 Graph 1 : Probe Temperature (C) Date: Jan 30 2008 Graph 2 : Probe Pressure (PSI)Time: 12:17
Prob
e Te
mpe
ratu
re L
og
Prob
e Pr
essu
re L
og
Explanation: Hand auger to 7' bgs.
10
11
12
13
14
15
16
17
18
19
20
0 2 4 6 8 10 12 14 16 18 20 22 24 26 28 30 32 34 36 38 40 42 44 46 48 50 52 54 56 58 60
Depth (ft)
Prob
e Pr
essu
re (P
SI)
0
50
100
150
200
250
300
Con
duct
ivity
(mS/
M)
Pressure PSI Conductivity mS/M
0
20
40
60
80
100
120
140
160
0 2 4 6 8 10 12 14 16 18 20 22 24 26 28 30 32 34 36 38 40 42 44 46 48 50 52 54 56 58 60Depth (ft)
Prob
e Te
mpe
ratu
re (C
)
0
50
100
150
200
250
300
Con
duct
ivity
(mS/
M)
Probe Temperature MAX °C Conductivity mS/M
Page 2 of 4

MIP Log Results by Boring - Detector Reading vs. Depth
Client: ERM Boring I.D.: MIP-9 Detector 1 : Electron Capture (ECD)Date: Jan 30 2008 Detector 2 : Photo Ionization (PID)
Time: 09:51 Detector 3 : Flame Ionization (FID)
Det
ecto
r 1 L
og
Det
ecto
r 2 L
og
Det
ecto
r 3 L
og
9.0E+04
2.1E+06
4.1E+06
6.1E+06
8.1E+06
1.0E+07
1.2E+07
1.4E+07
1.6E+07
0 2 4 6 8 10 12 14 16 18 20 22 24 26 28 30 32 34 36 38 40 42 44 46 48 50 52 54 56 58 60 62 64 66 68
Depth (ft)
ECD
(Max
Res
pons
e)
0
50
100
150
200
250
300
Con
duct
ivity
(mS/
M)
ECD MAX Conductivity mS/M
0.0E+00
2.0E+04
4.0E+04
6.0E+04
8.0E+04
1.0E+05
1.2E+05
0 2 4 6 8 10 12 14 16 18 20 22 24 26 28 30 32 34 36 38 40 42 44 46 48 50 52 54 56 58 60 62 64 66 68Depth (ft)
PID
(Max
Res
pons
e)
0
50
100
150
200
250
300
Con
duct
ivity
(mS/
M)
PID MAX Conductivity mS/M
0.0E+00
5.0E+04
1.0E+05
1.5E+05
2.0E+05
2.5E+05
3.0E+05
3.5E+05
4.0E+05
4.5E+05
0 2 4 6 8 10 12 14 16 18 20 22 24 26 28 30 32 34 36 38 40 42 44 46 48 50 52 54 56 58 60 62 64 66 68
Depth (ft)
FID
(Max
Res
pons
e)
0
50
100
150
200
250
300
Con
duct
ivity
(mS/
M)
FID MAX Conductivity mS/M
Page 1 of 2

MIP Log Results by Boring - Detector Reading vs. Depth
Client: ERM Boring I.D.: MIP-9 Graph 1 : Probe Temperature (C) Date: Jan 30 2008 Graph 2 : Probe Pressure (PSI)Time: 09:51
Prob
e Te
mpe
ratu
re L
og
Prob
e Pr
essu
re L
og
Explanation: Hand auger to 5' bgs.
0
20
40
60
80
100
120
140
160
0 2 4 6 8 10 12 14 16 18 20 22 24 26 28 30 32 34 36 38 40 42 44 46 48 50 52 54 56 58 60 62 64 66 68Depth (ft)
Prob
e Te
mpe
ratu
re (C
)
0
50
100
150
200
250
300
Con
duct
ivity
(mS/
M)
Probe Temperature MAX °C Conductivity mS/M
10
11
12
13
14
15
16
17
18
19
20
0 2 4 6 8 10 12 14 16 18 20 22 24 26 28 30 32 34 36 38 40 42 44 46 48 50 52 54 56 58 60 62 64 66 68
Depth (ft)
Prob
e Pr
essu
re (P
SI)
0
50
100
150
200
250
300
Con
duct
ivity
(mS/
M)
Pressure PSI Conductivity mS/M
Page 2 of 2

MIP Log Results by Boring - Detector Reading vs. Depth
Client: ERM Boring I.D.: MIP-10 Detector 1 : Electron Capture (ECD)Date: Jan 30 2008 Detector 2 : Photo Ionization (PID)
Time: 14:18 Detector 3 : Flame Ionization (FID)
Det
ecto
r 1 L
og
Det
ecto
r 2 L
og
Det
ecto
r 3 L
og
0.0E+00
2.0E+06
4.0E+06
6.0E+06
8.0E+06
1.0E+07
1.2E+07
0 2 4 6 8 10 12 14 16 18 20 22 24 26 28 30 32 34 36 38 40 42 44 46 48 50 52 54 56 58 60 62 64 66
Depth (ft)
ECD
(Max
Res
pons
e)
0
50
100
150
200
250
Con
duct
ivity
(mS/
M)
ECD MAX Conductivity mS/M
0.0E+00
5.0E+03
1.0E+04
1.5E+04
2.0E+04
2.5E+04
3.0E+04
3.5E+04
4.0E+04
4.5E+04
5.0E+04
0 2 4 6 8 10 12 14 16 18 20 22 24 26 28 30 32 34 36 38 40 42 44 46 48 50 52 54 56 58 60 62 64 66Depth (ft)
PID
(Max
Res
pons
e)
0
50
100
150
200
250
Con
duct
ivity
(mS/
M)
PID MAX Conductivity mS/M
0.0E+00
2.0E+04
4.0E+04
6.0E+04
8.0E+04
1.0E+05
1.2E+05
1.4E+05
1.6E+05
1.8E+05
2.0E+05
0 2 4 6 8 10 12 14 16 18 20 22 24 26 28 30 32 34 36 38 40 42 44 46 48 50 52 54 56 58 60 62 64 66
Depth (ft)
FID
(Max
Res
pons
e)
0
50
100
150
200
250
Con
duct
ivity
(mS/
M)
FID MAX Conductivity mS/M
Page 1 of 4

MIP Log Results by Boring - Detector Reading vs. Depth
Client: ERM Boring I.D.: MIP-10 Graph 1 : Probe Temperature (C) Date: Jan 30 2008 Graph 2 : Probe Pressure (PSI)Time: 14:18
Prob
e Te
mpe
ratu
re L
og
Prob
e Pr
essu
re L
og
Explanation: Hand auger to 7' bgs
10
11
12
13
14
15
16
17
18
19
20
0 2 4 6 8 10 12 14 16 18 20 22 24 26 28 30 32 34 36 38 40 42 44 46 48 50 52 54 56 58 60 62 64 66
Depth (ft)
Prob
e Pr
essu
re (P
SI)
0
50
100
150
200
250
Con
duct
ivity
(mS/
M)
Pressure PSI Conductivity mS/M
0
20
40
60
80
100
120
140
0 2 4 6 8 10 12 14 16 18 20 22 24 26 28 30 32 34 36 38 40 42 44 46 48 50 52 54 56 58 60 62 64 66
Depth (ft)
Prob
e Te
mpe
ratu
re (C
)
0
50
100
150
200
250
Con
duct
ivity
(mS/
M)
Probe Temperature MAX °C Conductivity mS/M
Page 2 of 4

MIP Log Results by Boring - Detector Reading vs. Depth
Client: ERM Boring I.D.: MIP-11 Detector 1 : Electron Capture (ECD)Date: Feb 01 2008 Detector 2 : Photo Ionization (PID)
Time: 11:37 Detector 3 : Flame Ionization (FID)
Det
ecto
r 1 L
og
Det
ecto
r 2 L
og
Det
ecto
r 3 L
og
0.0E+00
2.0E+06
4.0E+06
6.0E+06
8.0E+06
1.0E+07
1.2E+07
1.4E+07
1.6E+07
0 2 4 6 8 10 12 14 16 18 20 22 24 26 28 30 32 34 36 38 40 42 44 46 48 50 52 54 56 58 60
Depth (ft)
ECD
(Max
Res
pons
e)
0
50
100
150
200
250
Con
duct
ivity
(mS/
M)
ECD MAX Conductivity mS/M
0.0E+00
2.0E+04
4.0E+04
6.0E+04
8.0E+04
1.0E+05
1.2E+05
1.4E+05
1.6E+05
1.8E+05
2.0E+05
0 2 4 6 8 10 12 14 16 18 20 22 24 26 28 30 32 34 36 38 40 42 44 46 48 50 52 54 56 58 60Depth (ft)
PID
(Max
Res
pons
e)
0
50
100
150
200
250
Con
duct
ivity
(mS/
M)
PID MAX Conductivity mS/M
0.0E+00
5.0E+04
1.0E+05
1.5E+05
2.0E+05
2.5E+05
3.0E+05
3.5E+05
4.0E+05
4.5E+05
0 2 4 6 8 10 12 14 16 18 20 22 24 26 28 30 32 34 36 38 40 42 44 46 48 50 52 54 56 58 60
Depth (ft)
FID
(Max
Res
pons
e)
0
50
100
150
200
250
Con
duct
ivity
(mS/
M)
FID MAX Conductivity mS/M
Page 1 of 4

MIP Log Results by Boring - Detector Reading vs. Depth
Client: ERM Boring I.D.: MIP-11 Graph 1 : Probe Temperature (C) Date: Feb 01 2008 Graph 2 : Probe Pressure (PSI)Time: 11:37
Prob
e Te
mpe
ratu
re L
og
Prob
e Pr
essu
re L
og
Explanation: Hand auger to 5' bgs. Probe heats up but temp is not reading correctly - possibly crossed wires. Franksaid to go ahead and adv boring.
0
20
40
60
80
100
120
140
160
180
200
0 2 4 6 8 10 12 14 16 18 20 22 24 26 28 30 32 34 36 38 40 42 44 46 48 50 52 54 56 58 60Depth (ft)
Prob
e Te
mpe
ratu
re (C
)
0
50
100
150
200
250
Con
duct
ivity
(mS/
M)
Probe Temperature MAX °C Conductivity mS/M
10
11
12
13
14
15
16
17
18
19
20
0 2 4 6 8 10 12 14 16 18 20 22 24 26 28 30 32 34 36 38 40 42 44 46 48 50 52 54 56 58 60
Depth (ft)
Prob
e Pr
essu
re (P
SI)
0
50
100
150
200
250
Con
duct
ivity
(mS/
M)
Pressure PSI Conductivity mS/M
Page 2 of 4

MIP Log Results by Boring - Detector Reading vs. Depth
Client: ERM Boring I.D.: MIP-12 Detector 1 : Electron Capture (ECD)Date: Feb 01 2008 Detector 2 : Photo Ionization (PID)
Time: 15:04 Detector 3 : Flame Ionization (FID)
Det
ecto
r 1 L
og
Det
ecto
r 2 L
og
Det
ecto
r 3 L
og
0.0E+00
2.0E+06
4.0E+06
6.0E+06
8.0E+06
1.0E+07
1.2E+07
1.4E+07
1.6E+07
0 2 4 6 8 10 12 14 16 18 20 22 24 26 28 30 32 34 36 38 40 42 44 46 48 50 52 54 56 58 60 62 64 66
Depth (ft)
ECD
(Max
Res
pons
e)
0
20
40
60
80
100
120
140
160
180
200
Con
duct
ivity
(mS/
M)
ECD MAX Conductivity mS/M
0.0E+00
1.0E+04
2.0E+04
3.0E+04
4.0E+04
5.0E+04
6.0E+04
0 2 4 6 8 10 12 14 16 18 20 22 24 26 28 30 32 34 36 38 40 42 44 46 48 50 52 54 56 58 60 62 64 66Depth (ft)
PID
(Max
Res
pons
e)
0
20
40
60
80
100
120
140
160
180
200
Con
duct
ivity
(mS/
M)
PID MAX Conductivity mS/M
0.0E+00
5.0E+04
1.0E+05
1.5E+05
2.0E+05
2.5E+05
0 2 4 6 8 10 12 14 16 18 20 22 24 26 28 30 32 34 36 38 40 42 44 46 48 50 52 54 56 58 60 62 64 66
Depth (ft)
FID
(Max
Res
pons
e)
0
20
40
60
80
100
120
140
160
180
200
Con
duct
ivity
(mS/
M)
FID MAX Conductivity mS/M
Page 1 of 4

MIP Log Results by Boring - Detector Reading vs. Depth
Client: ERM Boring I.D.: MIP-12 Graph 1 : Probe Temperature (C) Date: Feb 01 2008 Graph 2 : Probe Pressure (PSI)Time: 15:04
Det
ecto
r 2 L
og
Det
ecto
r 3 L
og
Explanation: Hand auger to 5' bgs. EC not working - conductivity data is invalid..
0
20
40
60
80
100
120
140
0 2 4 6 8 10 12 14 16 18 20 22 24 26 28 30 32 34 36 38 40 42 44 46 48 50 52 54 56 58 60 62 64 66Depth (ft)
Prob
e Te
mpe
ratu
re (C
)
0
20
40
60
80
100
120
140
160
180
200
Con
duct
ivity
(mS/
M)
Probe Temperature MAX °C Conductivity mS/M
10
11
12
13
14
15
16
17
18
19
20
0 2 4 6 8 10 12 14 16 18 20 22 24 26 28 30 32 34 36 38 40 42 44 46 48 50 52 54 56 58 60 62 64 66
Depth (ft)
Prob
e Pr
essu
re (P
SI)
0
20
40
60
80
100
120
140
160
180
200
Con
duct
ivity
(mS/
M)
Pressure PSI Conductivity mS/M
Page 2 of 4

MIP Log Results by Boring - Detector Reading vs. Depth
Client: ERM Boring I.D.: MIP-13 Detector 1 : Electron Capture (ECD)Date: Feb 05 2008 Detector 2 : Photo Ionization (PID)
Time: 09:28 Detector 3 : Flame Ionization (FID)
Det
ecto
r 1 L
og
Det
ecto
r 2 L
og
Det
ecto
r 3 L
og
0.0E+00
1.0E+05
2.0E+05
3.0E+05
4.0E+05
5.0E+05
6.0E+05
7.0E+05
8.0E+05
0 2 4 6 8 10 12 14 16 18 20 22 24 26 28 30 32 34 36 38 40 42 44 46 48 50 52 54 56 58
Depth (ft)
ECD
(Max
Res
pons
e)
0
50
100
150
200
250
300
Con
duct
ivity
(mS/
M)
ECD MAX Conductivity mS/M
0.0E+00
1.0E+04
2.0E+04
3.0E+04
4.0E+04
5.0E+04
6.0E+04
7.0E+04
0 2 4 6 8 10 12 14 16 18 20 22 24 26 28 30 32 34 36 38 40 42 44 46 48 50 52 54 56 58Depth (ft)
PID
(Max
Res
pons
e)
0
50
100
150
200
250
300
Con
duct
ivity
(mS/
M)
PID MAX Conductivity mS/M
0.0E+00
5.0E+04
1.0E+05
1.5E+05
2.0E+05
2.5E+05
3.0E+05
3.5E+05
4.0E+05
0 2 4 6 8 10 12 14 16 18 20 22 24 26 28 30 32 34 36 38 40 42 44 46 48 50 52 54 56 58
Depth (ft)
FID
(Max
Res
pons
e)
0
50
100
150
200
250
300
Con
duct
ivity
(mS/
M)
FID MAX Conductivity mS/M
Page 1 of 4

MIP Log Results by Boring - Detector Reading vs. Depth
Client: ERM Boring I.D.: MIP-13 Graph 1 : Probe Temperature (C) Date: Feb 05 2008 Graph 2 : Probe Pressure (PSI)Time: 09:28
Det
ecto
r 2 L
og
Det
ecto
r 3 L
og
Explanation: Hand auger to 5'.
0
50
100
150
200
250
300
0 2 4 6 8 10 12 14 16 18 20 22 24 26 28 30 32 34 36 38 40 42 44 46 48 50 52 54 56 58Depth (ft)
Prob
e Te
mpe
ratu
re (C
)
0
50
100
150
200
250
300
Con
duct
ivity
(mS/
M)
Probe Temperature MAX °C Conductivity mS/M
10
11
12
13
14
15
16
17
18
19
20
0 2 4 6 8 10 12 14 16 18 20 22 24 26 28 30 32 34 36 38 40 42 44 46 48 50 52 54 56 58
Depth (ft)
Prob
e Pr
essu
re (P
SI)
0
50
100
150
200
250
300
Con
duct
ivity
(mS/
M)
Pressure PSI Conductivity mS/M
Page 2 of 4

MIP Log Results by Boring - Detector Reading vs. Depth
Client: ERM Boring I.D.: MIP-14 Detector 1 : Electron Capture (ECD)Date: Feb 05 2008 Detector 2 : Photo Ionization (PID)
Time: 14:23 Detector 3 : Flame Ionization (FID)
Det
ecto
r 1 L
og
Det
ecto
r 2 L
og
Det
ecto
r 3 L
og
0.0E+00
2.0E+06
4.0E+06
6.0E+06
8.0E+06
1.0E+07
1.2E+07
1.4E+07
1.6E+07
0 2 4 6 8 10 12 14 16 18 20 22 24 26 28 30 32 34 36 38 40 42 44 46 48 50 52 54 56 58 60 62 64
Depth (ft)
ECD
(Max
Res
pons
e)
0
50
100
150
200
250
300
Con
duct
ivity
(mS/
M)
ECD MAX Conductivity mS/M
0.0E+00
5.0E+04
1.0E+05
1.5E+05
2.0E+05
2.5E+05
3.0E+05
3.5E+05
0 2 4 6 8 10 12 14 16 18 20 22 24 26 28 30 32 34 36 38 40 42 44 46 48 50 52 54 56 58 60 62 64Depth (ft)
PID
(Max
Res
pons
e)
0
50
100
150
200
250
300
Con
duct
ivity
(mS/
M)
PID MAX Conductivity mS/M
0.0E+00
1.0E+05
2.0E+05
3.0E+05
4.0E+05
5.0E+05
6.0E+05
7.0E+05
0 2 4 6 8 10 12 14 16 18 20 22 24 26 28 30 32 34 36 38 40 42 44 46 48 50 52 54 56 58 60 62 64
Depth (ft)
FID
(Max
Res
pons
e)
0
50
100
150
200
250
300
Con
duct
ivity
(mS/
M)
FID MAX Conductivity mS/M
Page 1 of 4

MIP Log Results by Boring - Detector Reading vs. Depth
Client: ERM Boring I.D.: MIP-14 Graph 1 : Probe Temperature (C) Date: Feb 05 2008 Graph 2 : Probe Pressure (PSI)Time: 14:23
Det
ecto
r 2 L
og
Det
ecto
r 3 L
og
Explanation: Hand auger to 7' bgs.
0
20
40
60
80
100
120
140
0 2 4 6 8 10 12 14 16 18 20 22 24 26 28 30 32 34 36 38 40 42 44 46 48 50 52 54 56 58 60 62 64Depth (ft)
Prob
e Te
mpe
ratu
re (C
)
0
50
100
150
200
250
300
Con
duct
ivity
(mS/
M)
Probe Temperature MAX °C Conductivity mS/M
10
11
12
13
14
15
16
17
18
19
20
0 2 4 6 8 10 12 14 16 18 20 22 24 26 28 30 32 34 36 38 40 42 44 46 48 50 52 54 56 58 60 62 64
Depth (ft)
Prob
e Pr
essu
re (P
SI)
0
50
100
150
200
250
300
Con
duct
ivity
(mS/
M)
Pressure PSI Conductivity mS/M
Page 2 of 4

Appendix B Well Construction Logs


