b2b managed services - opentext · in-house it teams. over time, ... b2b managed services are...
TRANSCRIPT
B2B Managed ServicesBusiness Value and Adoption Trends
BARCHI GILLAI and TAO YU Foreword by OpenText (formerly GXS, INC.)
March 2013
E N T E R P R I S E I N F O R M A T I O N M A N A G E M E N T 2
B2B MANAGED SERVICES BUSINESS VALUE AND ADOPTION TRENDS
W H I T E P A P E R
Foreword
Today’s businesses can no longer be successful solely operating within their own four walls. The modern, 21st century corporation is critically dependent upon a network of business partners to function. Consider the typical supply chain. Contract manufacturers build the products in low-cost geographies. Freight forwarders, customs brokers, third-party logistics providers and transportation carriers move the goods to the point of consumption. Distributors, brokers and resellers provide critical sales channels to end-customers.
Even administrative functions are increasingly critically dependent upon external entities as the outsourcing trend continues to grow. Systems integrators manage IT applications. Advertising agencies manage branding and marketing strategies. Management consultants provide strategic planning. Business Process Outsourcing firms assume ownership over accounts payable, customer service and human resource functions.
To operate with today’s highly distributed business model requires real-time connectivity to your network of business partners. Without visibility into the locations of inventory, the forecasts of demand, the availability of supply and the status of payments, companies cannot make decisions related to day-to-day operations.
Yet despite this critical need for business-to-business (B2B) connectivity, the interactions between companies and their partners remain highly inefficient. Over 50% of the information exchanged between business partners travels over fax, email and phone rather than flowing directly between business applications via B2B integration technologies such as EDI and XML.
The lack of adoption of B2B technologies is not due to a shortage of options and approaches for connectivity. B2B offerings exist to support a wide variety of transaction volumes and price points. Companies of all sizes and across all industries should, in fact, be able to connect with their partners throughout the supply chain.
Of course, B2B integration also presents a unique set of challenges that does not exist with other types of technologies. Some companies, especially smaller ones, may believe that they lack the budget, resources or expertise to do business electronically. And each company takes a different view on how it chooses to exchange data based upon the security policies and architectural preferences of its IT organization.
An awareness and understanding of the adoption rates for B2B integration and the results of those efforts may provide companies with information they need to make decisions about their own B2B environments. With that in mind, we collaborated with the Stanford Global Supply Chain Management Forum on a research study to obtain benchmark data from companies that represent a variety of industries, geographies, annual revenue, and IT budgets. We believe you will find this data useful in evaluating your go-forward strategy.
Table of Content
Executive Summary . . . . . . . . . . . . . . . . . . . . . . . . . . . . . . . . . . . . . . . . . . . . . . . . 4
Introduction . . . . . . . . . . . . . . . . . . . . . . . . . . . . . . . . . . . . . . . . . . . . . . . . . . . . . . . . 6
Methodology . . . . . . . . . . . . . . . . . . . . . . . . . . . . . . . . . . . . . . . . . . . . . . . . . . . . . . . 8
Profile of Participating Companies . . . . . . . . . . . . . . . . . . . . . . . . . . . . . . . . . 9
Primary Industry . . . . . . . . . . . . . . . . . . . . . . . . . . . . . . . . . . . . . . . . . . . . . . . . 9
Annual Revenue . . . . . . . . . . . . . . . . . . . . . . . . . . . . . . . . . . . . . . . . . . . . . . . .10
Geographic Base . . . . . . . . . . . . . . . . . . . . . . . . . . . . . . . . . . . . . . . . . . . . . . .11
Business-to-Business Managed Services Program . . . . . . . . . . . . . . . .11
Program Characteristics . . . . . . . . . . . . . . . . . . . . . . . . . . . . . . . . . . . . . . 12
Primary Business Drivers for Using B2B Managed Services . . .16
Benefits of B2B Managed Services . . . . . . . . . . . . . . . . . . . . . . . . . . . . 18
Future Plans . . . . . . . . . . . . . . . . . . . . . . . . . . . . . . . . . . . . . . . . . . . . . . . . . . . 34
Summary . . . . . . . . . . . . . . . . . . . . . . . . . . . . . . . . . . . . . . . . . . . . . . . . . . . . . . . . . 36
Acknowledgements . . . . . . . . . . . . . . . . . . . . . . . . . . . . . . . . . . . . . . . . . . . . . . 37
About the Authors . . . . . . . . . . . . . . . . . . . . . . . . . . . . . . . . . . . . . . . . . . . . . . . 37
About the Stanford Global Supply Chain Management Forum . . 37
About OpenText . . . . . . . . . . . . . . . . . . . . . . . . . . . . . . . . . . . . . . . . . . . . . . . . . 37
Appendix . . . . . . . . . . . . . . . . . . . . . . . . . . . . . . . . . . . . . . . . . . . . . . . . . . . . . . . . . 38
E N T E R P R I S E I N F O R M A T I O N M A N A G E M E N T 4
B2B MANAGED SERVICES BUSINESS VALUE AND ADOPTION TRENDS
W H I T E P A P E R
Executive Summary
In today’s global and often fragmented marketplace, Business-to-Business (B2B) capabilities are very important for a company’s successful collaboration with its business partners. Such capabilities significantly improve the business efficiency and quality of the information exchanged, resulting in lower costs and higher profitability. Early B2B solutions were usually implemented and maintained by in-house IT teams. However, the expansion of business networks—both physically and technologically—and the increasing complexity of managing these types of solutions, led a growing number of companies to outsource a portion of their B2B operations to external managed services providers1 to streamline their supply chain operations and improve overall business performance. Over the years, B2B managed services providers have achieved new levels of maturity, providing greater value and expanding the range of services they offer. These developments raised confidence among IT end users that managed services providers can successfully implement and manage their B2B projects, resulting in more companies using their services to simplify and enhance their B2B operations.
Given the new developments in B2B integration technologies in recent years, and the growing interest in B2B managed services2 , the Stanford Global Supply Chain Management Forum, in collaboration with OpenText, initiated a new research study in 2012. The goal of this study was to gain insights as to the latest trends and business value associated with B2B managed services and B2B integration programs. The study was based on a survey distributed to current users of B2B integration technologies and B2B managed services. The results of the study are summarized in two separate documents; this report3 focuses on the business value and adoption rates of B2B managed services, while a separate report focuses on the value and adoption trends of B2B integration programs.
Eighty-one people from 66 companies shared with us their experience with B2B managed services. The study participants varied in terms of their primary industry (CPG4 , financial services, logistics, manufacturing, retail, and other), their annual revenue (from under $100 million to more than $5 billion), and their geographic base (North America, EMEA5, and Asia Pacific (ASPAC)). The following are some of the key insights from the information they provided to us.
• Program characteristics: About a half of participating companies have been using B2B managed services for five years or more. B2B managed services have been used in all three geographic regions: Americas, EMEA, and ASPAC; on average, companies that have been using managed services for more than five years had a managed services program in more geographic regions. Companies have most frequently been using B2B managed services for integration with their customers (87 percent of participating companies), followed by suppliers (68 percent), logistics service providers (49 percent) and financial institutions (41 percent). Only 4 percent of companies used these services for integration with insurers.
• Business drivers: The most important business drivers affecting companies’ original decision to use B2B managed services were (in order of importance) the desire to improve customer experience, improve business process efficiency, and reduce IT costs. Other popular business drivers included consolidation of multiple B2B programs, support of global expansion into new markets, and the need to replace aging B2B platforms.
1 A B2B managed services provider is a vendor that, in addition to offering hosted integration services such as communication services, trading partner management services, integration services and application services, also enables companies to outsource their technical B2B infrastructure, including the people and processes necessary to manage their B2B operations and trading partner connections.
2 B2B managed services provide technical B2B infrastructure, including the people and processes necessary to manage B2B operations and trading partner connections.
3 Gillai and Yu, “B2B Integration: Business Value and Adoption Trends,” forthcoming. 4 Consumer Packaged Goods. 5 Europe, Middle East, and Africa.
E N T E R P R I S E I N F O R M A T I O N M A N A G E M E N T 5
B2B MANAGED SERVICES BUSINESS VALUE AND ADOPTION TRENDS
W H I T E P A P E R
Benefits of B2B managed services:
• Financial benefits: When considering the overall value of B2B managed services, 96 percent of companies indicated that these services increased the value of their B2B integration program. For 47 percent of the participants, the increased value was combined with a reduction in costs. When looking at specific financial benefits, the ones that were observed by the majority of participants were related to streamlining expenses and improved budget planning: 74 percent of participating companies strongly agreed or agreed that the ability to replace capital expenditure with an ongoing monthly subscription fee was of value to them, and 63 percent of companies strongly agreed or agreed that B2B managed services allowed them to improve planning for B2B budget and resources. As for benefits related to direct cost reduction, 59 percent of participants were able to reduce costs related to B2B integration (developing maps, onboarding business partners, etc.), while 46 percent were able to redeploy some of their IT staff to other projects/roles. A breakdown of the data based on the number of years of using B2B managed services reveals that often times, a larger portion of the companies that have been using managed services for five years or more realized these financial benefits.
• Trading community management and support: Given the focus of these questions, they were relevant for only a portion of the participants. The number one benefit that was observed by the highest portion of participants was the improved efficiency of onboarding new customers (realized by 68 percent of participants). Additional benefits, in decreasing order, were the improvement in the companies’ ability to meet and respond in a timely manner to changes in customer requirements (59 percent of participants), and the improved level of local support for business partners located in other countries (49 percent of participants). Fifty-two percent of participants strongly agreed or agreed that overall, with B2B managed services, their customers were finding it easier to do business with them. The parameters that had the most impact on the likelihood of realizing these benefits were the number of years of using managed services, and the company size.
• Future plans: When considering the companies’ plans for future use of B2B e-commerce, 96 percent of participants plan to increase the number of customers they trade with electronically, the number of suppliers they trade with electronically, and/ or the number of business processes they support. Fifty-nine percent of participants plan to expand their use of B2B e-commerce in all three areas.
E N T E R P R I S E I N F O R M A T I O N M A N A G E M E N T 6
B2B MANAGED SERVICES BUSINESS VALUE AND ADOPTION TRENDS
W H I T E P A P E R
1. Introduction
Business-to-Business (B2B) solutions have been in wide use for more than a decade, streamlining inter-company information exchange, improving process efficiencies, and driving costs down. Early B2B solutions were usually implemented and maintained by in-house IT teams. Over time, however, in-house support of a global B2B infrastructure became increasingly challenging. One reason was the economic globalization, which expanded business networks between companies physically and technologically, making the exchange of information with a growing number of trading partners located in different regions exponentially more costly and complex. The increasing number of heterogeneous data formats and communication protocols across various industries and regions further intensified the hurdles associated with B2B integration.6
Over the years, more and more companies have come to realize that trading partner collaboration is critical in a business environment characterized by highly competitive markets and an increasingly global supply base, which require faster and more automat-ed processes. But achieving seamless B2B integration to support the desired level of collaboration is not easy. Different organizations must agree on communication, process, delivery and security measures to enable effective B2B integration. It is essential for them to continuously invest in tools and resources to manage, maintain and evolve each trading partner relationship with ongoing support, and to handle change inherent in a dynamic business environment. Research conducted by the Yankee Group in 2005 identified the top three challenges for companies using B2B solutions at the time to be: the need to integrate different stand-alone applications and different systems; insufficient IT staff to manage their technology needs; and outdated business applications.7 Given these challenges, some companies started to outsource a portion of their B2B operations to external managed services providers to streamline their supply chain operations and improve over- all business performance.
B2B managed services are provided to trading partners with a variety of flexible hybrid features, including communications, integration and management applications. Through B2B managed services, companies can transfer to external B2B managed services providers the management of day-to-day B2B transaction activities and the coordination of B2B activities across different platforms and different parts of the supply chain.8 Managed services providers can deliver a broad array of value-added, cloud-based B2B services on a highly available global infrastructure in support of the mission-critical B2B processes, including data translation, ERP (Enterprise Resource Planning) integration, B2B commu-nication, visibility and alerting, and community collaboration. Through a combination of technology, processes and people, a B2B managed services provider can empower companies to meet their business performance goals and improve customer satisfaction, and help them maintain a competitive edge in today’s global marketplace.
With information technology developments and expanding globalization, B2B managed services providers have achieved new levels of maturity with larger trading communities, service-oriented architecture, more sophisticated processes and improved service-level agreements. An increasing number of managed services providers raise the quality and value of their managed services by increasing levels of availability: improving disaster recovery contingencies and process visibility: and providing more community management automation, more explicit and reliable B2B integration outsourcing task service level agreements (SLAs) as well as greater international fulfillment capacity. These developments raised confidence among IT end users that managed services providers can successfully implement and manage their B2B projects.9
Moreover, the range of services offered by B2B managed services providers for ongoing B2B project operations has expanded, and currently includes all forms of B2B project and communication management activities, including change control (such as adding new maps, trading partners or connections, or transactions and documents), problem escalation and support, dispute resolution, and incremental new B2B campaign/project rollouts. These services have helped companies simplify and enhance their B2B operations to rap- idly respond to new business opportunities for their expanding global reach.
6 Sommer, “Business Process Flexibility: A Driver for Outsourcing”, Emerald Insight, 2003.
7 Pottebaum, “Emerging Demand for B2B Managed Services, Hosted Integration and Outsourcing”, Yankee Group, Nov. 8, 2005.
8 http://www.b2bmanagedservices.com/overview.htm.9 Lheureux and Malinverno, “Magic Quadrant for Integration Service
Providers”, Gartner Research, November 20, 2009.
E N T E R P R I S E I N F O R M A T I O N M A N A G E M E N T 7
B2B MANAGED SERVICES BUSINESS VALUE AND ADOPTION TRENDS
W H I T E P A P E R
In addition, integration is no longer a process of linking two applications; rather, it is a cross-company and between-company discipline that increasingly involves all of an organization’s applications, external business partners and cloud services. The “dumb” network that used to only transfer bulk files between applications and trading partners is turning into a “smart” network that incorporates diverse integration functionality—includ-ing communications, translation and workflow—increasingly implemented by application vendors and users.
Demand for B2B managed services is likely to further increase in the future, as is demonstrated by a number of recent studies that have analyzed the market trends and expected developments in the next few years. According to a 2011 Gartner report, the multi-enterprise/B2B infrastructure market10 is poised for good growth during the next few years, driven by the increasing maturity and adoption of various related standards combined with the increasing maturity and flexibility of the integration of SaaS (Software as a Service). Overall, they anticipate the B2B infrastructure market to grow at a 9.0 percent CAGR through 2015.11 With the B2B infrastructure modernization, more and more companies will continue to implement B2B consolidation projects to rationalize diverse point solutions onto one B2B infrastructure, and the business globalization will require an ever-larger international fulfillment capacity of service providers. In the meantime, web services and SOA (Service-Oriented Architecture) will be more frequently and broadly used in B2B solutions. The worldwide market for cloud services, including various forms of IaaS (Integration as a Service), PaaS (Platform as a Service) and SaaS, was worth $58.6 billion in 2009 and is forecast to grow to $148.8 billion by 2014.12 The growing volume of data and adoption of cloud computing are creating demand for a new type of B2B intermediary—the cloud service brokerage (CSB)—to aggregate and add value to cloud services. Many managed services providers start to evolve into CSBs by adding native cloud-computing capabilities to their traditional e-commerce-focused B2B solution port- folio. Based on a Gartner report, 75 percent of the largest 25 managed services providers are expected to have explicit CSB go-to-market strategies by 2015.13 In addition, in a 2010 global survey of 819 cross-industry senior executives, which analyzed the trends in customer-supplier relationships and supply chain technology, more than 70 percent of the respondents expected supply chain complexity to increase over the next three years and 88 percent of the respondents believed that having a strong, flexible B2B e-commerce program provides differentiation from competitors and was important to growing business at key accounts.14 The study further emphasizes the value and competitive advantage that high-performance B2B managed services can bring to business partners.
Research conducted by the Stanford Global Supply Chain Management Forum in 2007 aimed to quantitatively assess the benefits attributed to B2B outsourcing (also known as B2B managed services)—including benefits related to technology, business processes, and human resources—as well as the overall return on investment (ROI) and business value of B2B outsourcing. The input provided by participating companies demonstrated that for the majority, B2B outsourcing improved their business performance in a wide range of areas, and helped shield them from the increasing complexities of B2B program management.15
Following up on the 2007 study, the Stanford Global Supply Chain Management Forum, in collaboration with OpenText, initiated a new research study in 2012. Given the new developments in B2B integration technologies in recent years, and the growing interest in B2B managed services, the goal of this new study was to gain insights as to the latest trends and business value associated with these technologies and services. The study was based on a survey distributed to current users of B2B integration technologies and B2B man- aged services. This report summarizes the findings of the study related to B2B managed services. The findings related to B2B integration technologies are summarized in a separate document.16
The remainder of the report is organized as follows: Section 2 outlines the methodology we used to conduct this study, including the questionnaire design, distribution list generation, and analysis approaches. Section 3 provides basic information on the companies that participated in the study. Section 4 summarizes the results of the data analysis related to the participants’ B2B managed services program. Section 5 provides a high-level summary of the report.
10 Multi-enterprise/B2B infrastructure is defined as an IT project that is composed of some combination of B2B software and B2B services that companies use to perform multi-enterprise integration with external business partners. Source: Biscotti et al. “Market Trends: Multienterprise/B2B Infrastructure Market, Worldwide, 2010 -2015, 1Q11 Update”, Gartner Research, February 10, 2011.
11 bid. 12 Pring et al. “Forecast: Public cloud Services, Worldwide and Regions,
Industry Sectors, 2009 - 2014”, Gartner Research, June 02, 2010.13 Lheureux et al. “Cloud Service Brokerages Create a New Role for
Integration Service Providers”, Gartner Research, Nov. 01, 2010.14 Christopher, “Enhancing Customer-Centric Supply Chains”, GXS Inc.
and SCM World, Oct. 2010.15 Gillai and Kim, “Driving Business Value through B2B Outsourcing”,
GXS, Inc. and Stanford Global Supply Chain Forum, Oct. 2007.16 Gillai and Yu, “B2B Integration: Business Value and Adoption
Trends,” forthcoming.
E N T E R P R I S E I N F O R M A T I O N M A N A G E M E N T 8
B2B MANAGED SERVICES BUSINESS VALUE AND ADOPTION TRENDS
W H I T E P A P E R
2. MethodologyThe study as a whole examined the business value, budgetary trends and level of adoption of B2B integration technologies and B2B managed services. While the results of the study were to be summarized in two separate documents, one focusing on B2B integration technologies and the second on B2B managed services, a single survey was used to collect the data required for both parts of the study. The main goals for the survey were defined as identifying and providing companies with benchmark information regarding:
• B2B managed services program: Main drivers for using B2B managed services; the level of adoption being achieved; and the financial and business benefits associated with this program.
• B2B integration program: Trends in budgetary requirements; current level of adoption and projected growth; and the realized process efficiency improvements.
• Future: Plans for future use of B2B e-commerce.
The survey questionnaire was designed with these goals in mind. It also asked participants for some basic company information, to help with the data analysis. A copy of the questionnaire is available in the Appendix.
The survey included several types of questions. Some questions asked participants to provide their answers in the form of a percentage range—for example when estimating the percent of the company’s overall B2B integration program that is supported by a B2B managed services provider. Other questions, in particular those focusing on the benefits of B2B managed services, asked participants to use a Likert Scale17 of “Strongly Agree”, “Agree”, “Neutral”, “Disagree” and “Strongly Disagree” to assess these benefits, as quantifying many of them can be challenging.
In parallel to designing the survey questionnaire, we compiled a list of individuals to invite to take part in the study.
These people represented companies from a variety of industries and geographies. We targeted those companies that have integrated B2B ecommerce into their operations for more than a year, as companies that started using such solutions more recently may not have had enough time to realize some of their associated benefits.
A total of 92 individuals from 75 companies completed the entire survey or a portion of it, including 81 people from 66 companies who shared their experience with B2B managed services. The participating companies are located in North America, EMEA, and ASPAC, and represent a variety of industries—including manufacturing, retail, consumer goods, financial services and logistics. Seventy-five percent of them have been using B2B managed services in their operations for over two years.
Once the data collection was completed, we proceeded with data analysis. We conducted different types of analyses, including:
• Analysis of all the responses combined.
• A breakdown of the responses based on parameters such as company size, geography, number of years of using B2B managed services, and the percent of the company’s B2B integration program supported by such services. This analysis helped us to gain better insights as to those characteristics that may have had an impact on companies’ decisions and their realized benefits.18
While the responses to each question were analyzed based on a variety of parameters, only those analyses that revealed meaningful results were included in the report.
On some occasions, two participants from the same company provided different answers to a particular question. In those cases when the question was about a fact related to the participating company, we averaged the individual responses. We did not conduct such averaging for questions related to the benefits of B2B managed services, which asked participants for their opinion on the list of potential benefits.
17 Likert scaling is a bipolar scaling method, measuring either positive or negative response to a statement. (Source: Wikipedia: en.wikipedia.org)
18 In the diagrams that summarize this type of analysis, we often times merged categories, to make the diagrams easier to read.
E N T E R P R I S E I N F O R M A T I O N M A N A G E M E N T 9
B2B MANAGED SERVICES BUSINESS VALUE AND ADOPTION TRENDS
W H I T E P A P E R
3. Profile of Participating Companies
The following is some general information regarding the 75 companies that participated in the study, including their primary industry, size (based on annual revenue), and geographic base.
Primary Industry
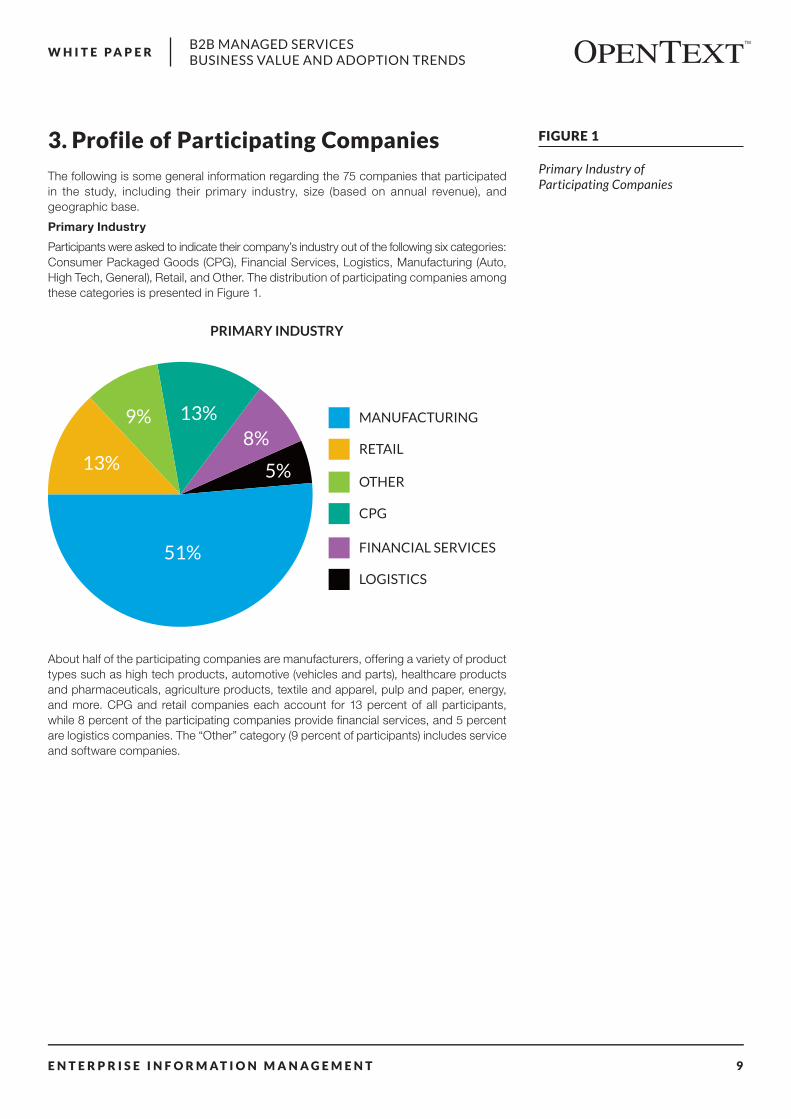
Participants were asked to indicate their company’s industry out of the following six categories: Consumer Packaged Goods (CPG), Financial Services, Logistics, Manufacturing (Auto, High Tech, General), Retail, and Other. The distribution of participating companies among these categories is presented in Figure 1.
About half of the participating companies are manufacturers, offering a variety of product types such as high tech products, automotive (vehicles and parts), healthcare products and pharmaceuticals, agriculture products, textile and apparel, pulp and paper, energy, and more. CPG and retail companies each account for 13 percent of all participants, while 8 percent of the participating companies provide financial services, and 5 percent are logistics companies. The “Other” category (9 percent of participants) includes service and software companies.
FIGURE 1
Primary Industry of Participating Companies
PRIMARY INDUSTRY
MANUFACTURING
RETAIL
OTHER
CPG
FINANCIAL SERVICES
LOGISTICS
51%
13%
9% 13%8%
5%
E N T E R P R I S E I N F O R M A T I O N M A N A G E M E N T 1 0
B2B MANAGED SERVICES BUSINESS VALUE AND ADOPTION TRENDS
W H I T E P A P E R
Annual Revenue
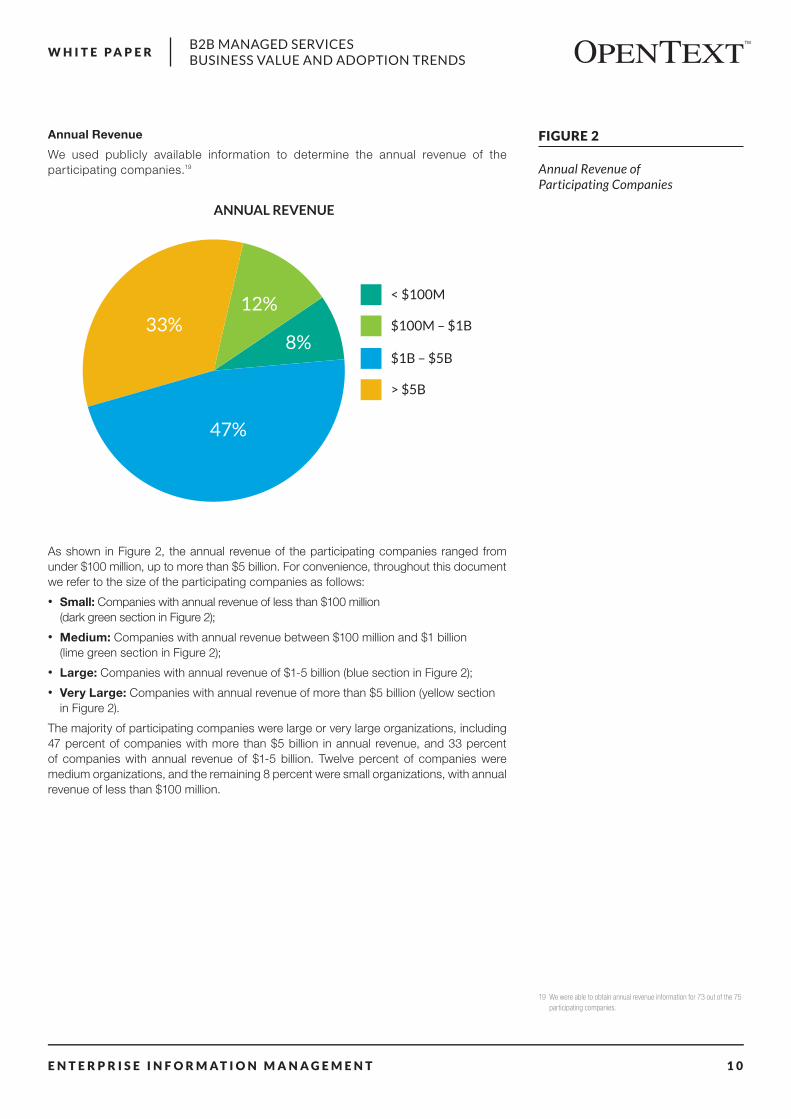
We used publicly available information to determine the annual revenue of the participating companies.19
As shown in Figure 2, the annual revenue of the participating companies ranged from under $100 million, up to more than $5 billion. For convenience, throughout this document we refer to the size of the participating companies as follows:
• Small: Companies with annual revenue of less than $100 million (dark green section in Figure 2);
• Medium: Companies with annual revenue between $100 million and $1 billion (lime green section in Figure 2);
• Large: Companies with annual revenue of $1-5 billion (blue section in Figure 2);
• Very Large: Companies with annual revenue of more than $5 billion (yellow section in Figure 2).
The majority of participating companies were large or very large organizations, including 47 percent of companies with more than $5 billion in annual revenue, and 33 percent of companies with annual revenue of $1-5 billion. Twelve percent of companies were medium organizations, and the remaining 8 percent were small organizations, with annual revenue of less than $100 million.
ANNUAL REVENUE
< $100M
$100M – $1B
$1B – $5B
> $5B
47%
33%12%
8%
FIGURE 2
Annual Revenue of Participating Companies
19 We were able to obtain annual revenue information for 73 out of the 75 participating companies.
E N T E R P R I S E I N F O R M A T I O N M A N A G E M E N T 1 1
B2B MANAGED SERVICES BUSINESS VALUE AND ADOPTION TRENDS
W H I T E P A P E R
Geographic Base
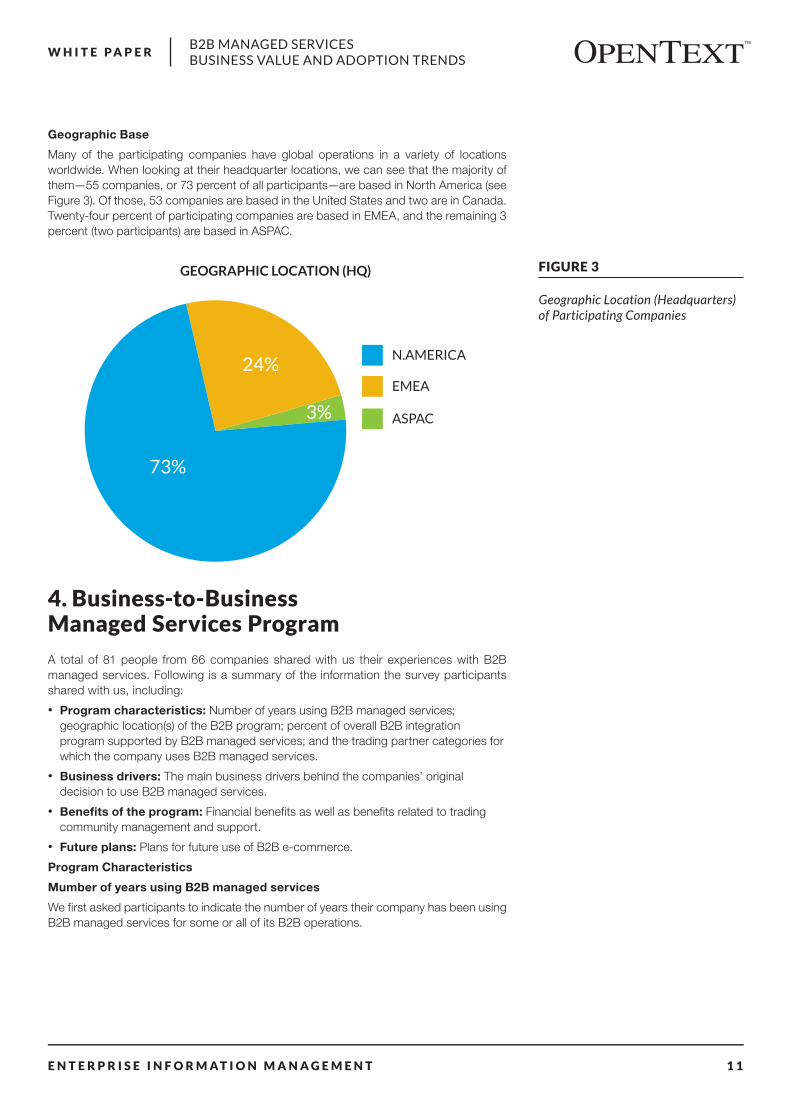
Many of the participating companies have global operations in a variety of locations worldwide. When looking at their headquarter locations, we can see that the majority of them—55 companies, or 73 percent of all participants—are based in North America (see Figure 3). Of those, 53 companies are based in the United States and two are in Canada. Twenty-four percent of participating companies are based in EMEA, and the remaining 3 percent (two participants) are based in ASPAC.
4. Business-to-Business Managed Services Program
A total of 81 people from 66 companies shared with us their experiences with B2B managed services. Following is a summary of the information the survey participants shared with us, including:
• Program characteristics: Number of years using B2B managed services; geographic location(s) of the B2B program; percent of overall B2B integration program supported by B2B managed services; and the trading partner categories for which the company uses B2B managed services.
• Business drivers: The main business drivers behind the companies’ original decision to use B2B managed services.
• Benefits of the program: Financial benefits as well as benefits related to trading community management and support.
• Future plans: Plans for future use of B2B e-commerce.
Program Characteristics
Mumber of years using B2B managed services
We first asked participants to indicate the number of years their company has been using B2B managed services for some or all of its B2B operations.
FIGURE 3
Geographic Location (Headquarters) of Participating Companies
GEOGRAPHIC LOCATION (HQ)
N.AMERICA
EMEA
ASPAC
73%
24%
3%
E N T E R P R I S E I N F O R M A T I O N M A N A G E M E N T 1 2
B2B MANAGED SERVICES BUSINESS VALUE AND ADOPTION TRENDS
W H I T E P A P E R
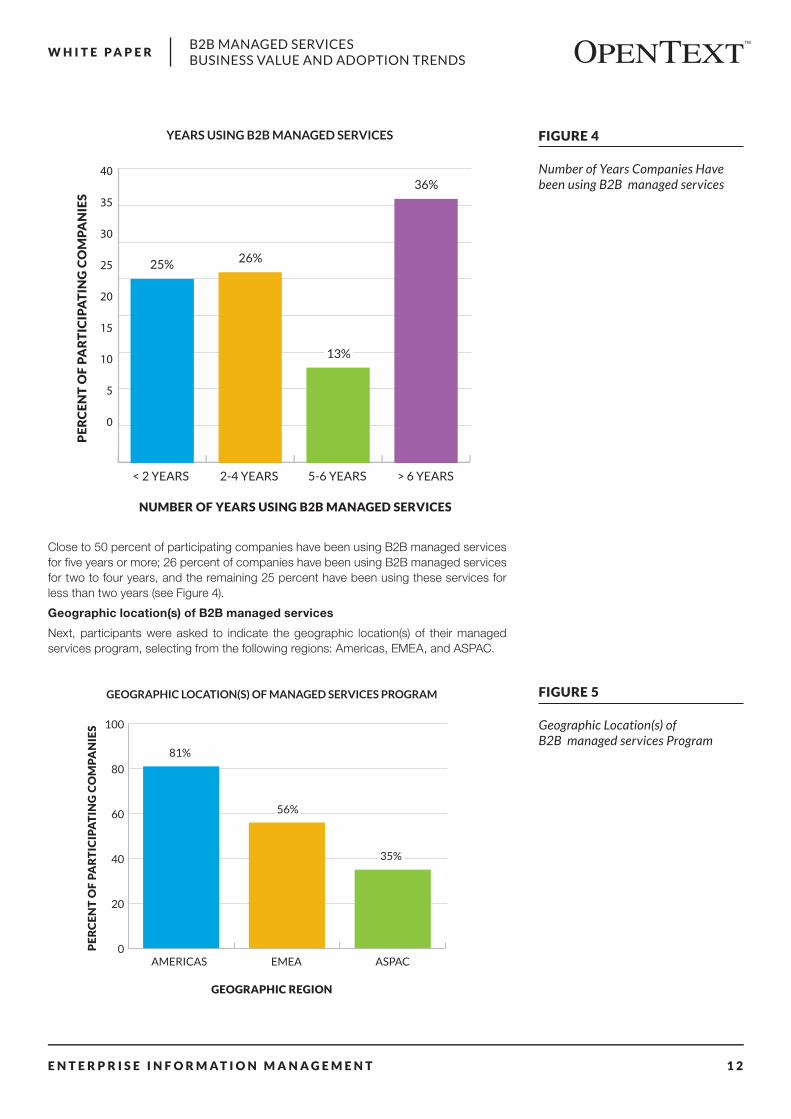
Close to 50 percent of participating companies have been using B2B managed services for five years or more; 26 percent of companies have been using B2B managed services for two to four years, and the remaining 25 percent have been using these services for less than two years (see Figure 4).
Geographic location(s) of B2B managed services
Next, participants were asked to indicate the geographic location(s) of their managed services program, selecting from the following regions: Americas, EMEA, and ASPAC.
FIGURE 4
Number of Years Companies Have been using B2B managed services
0
5
10
15
20
25
30
35
40
dcbaPE
RC
EN
T O
F P
AR
TIC
IPA
TIN
G C
OM
PA
NIE
S
NUMBER OF YEARS USING B2B MANAGED SERVICES
YEARS USING B2B MANAGED SERVICES
< 2 YEARS 2-4 YEARS 5-6 YEARS > 6 YEARS
25% 26%
13%
36%
GEOGRAPHIC LOCATION(S) OF MANAGED SERVICES PROGRAM
0
20
40
60
80
100
ASPACEMEAAMERICAS
GEOGRAPHIC REGION
PE
RC
EN
T O
F P
AR
TIC
IPA
TIN
G C
OM
PA
NIE
S
81%
56%
35%
FIGURE 5
Geographic Location(s) of B2B managed services Program
E N T E R P R I S E I N F O R M A T I O N M A N A G E M E N T 1 3
B2B MANAGED SERVICES BUSINESS VALUE AND ADOPTION TRENDS
W H I T E P A P E R
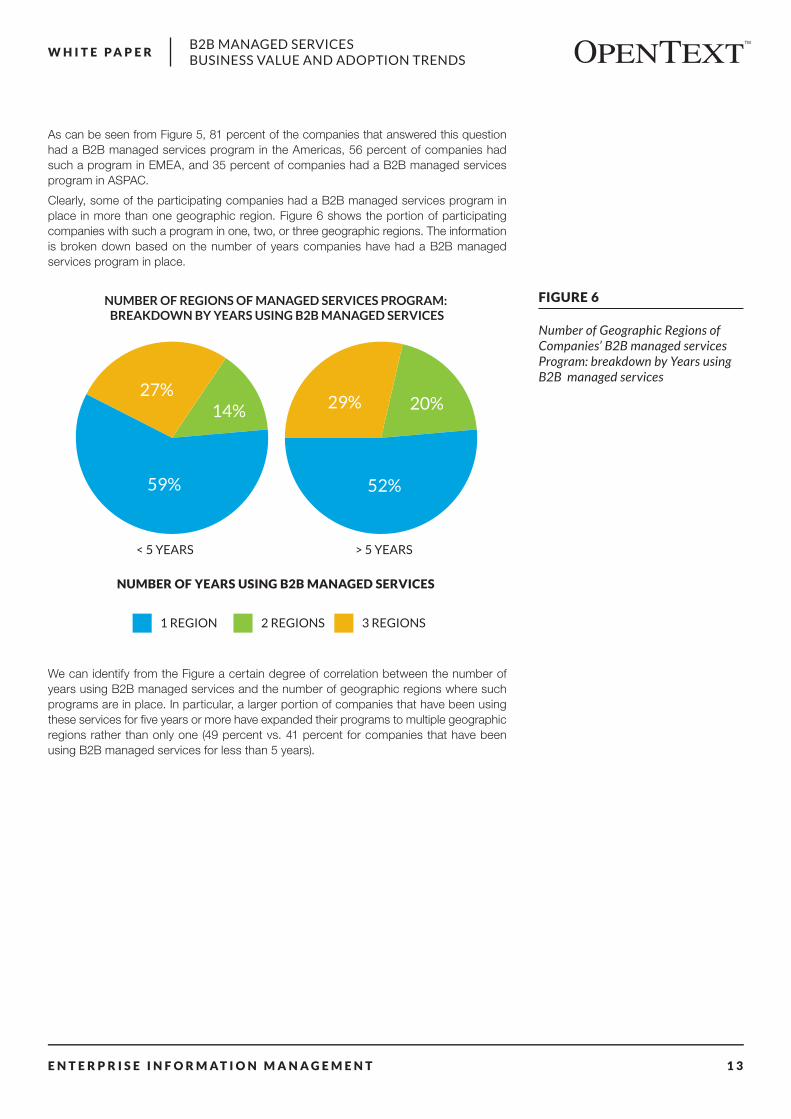
As can be seen from Figure 5, 81 percent of the companies that answered this question had a B2B managed services program in the Americas, 56 percent of companies had such a program in EMEA, and 35 percent of companies had a B2B managed services program in ASPAC.
Clearly, some of the participating companies had a B2B managed services program in place in more than one geographic region. Figure 6 shows the portion of participating companies with such a program in one, two, or three geographic regions. The information is broken down based on the number of years companies have had a B2B managed services program in place.
We can identify from the Figure a certain degree of correlation between the number of years using B2B managed services and the number of geographic regions where such programs are in place. In particular, a larger portion of companies that have been using these services for five years or more have expanded their programs to multiple geographic regions rather than only one (49 percent vs. 41 percent for companies that have been using B2B managed services for less than 5 years).
NUMBER OF REGIONS OF MANAGED SERVICES PROGRAM: BREAKDOWN BY YEARS USING B2B MANAGED SERVICES
NUMBER OF YEARS USING B2B MANAGED SERVICES
< 5 YEARS > 5 YEARS
59% 52%
27%14% 29% 20%
1 REGION 2 REGIONS 3 REGIONS
FIGURE 6
Number of Geographic Regions of Companies’ B2B managed services Program: breakdown by Years using B2B managed services
E N T E R P R I S E I N F O R M A T I O N M A N A G E M E N T 1 4
B2B MANAGED SERVICES BUSINESS VALUE AND ADOPTION TRENDS
W H I T E P A P E R
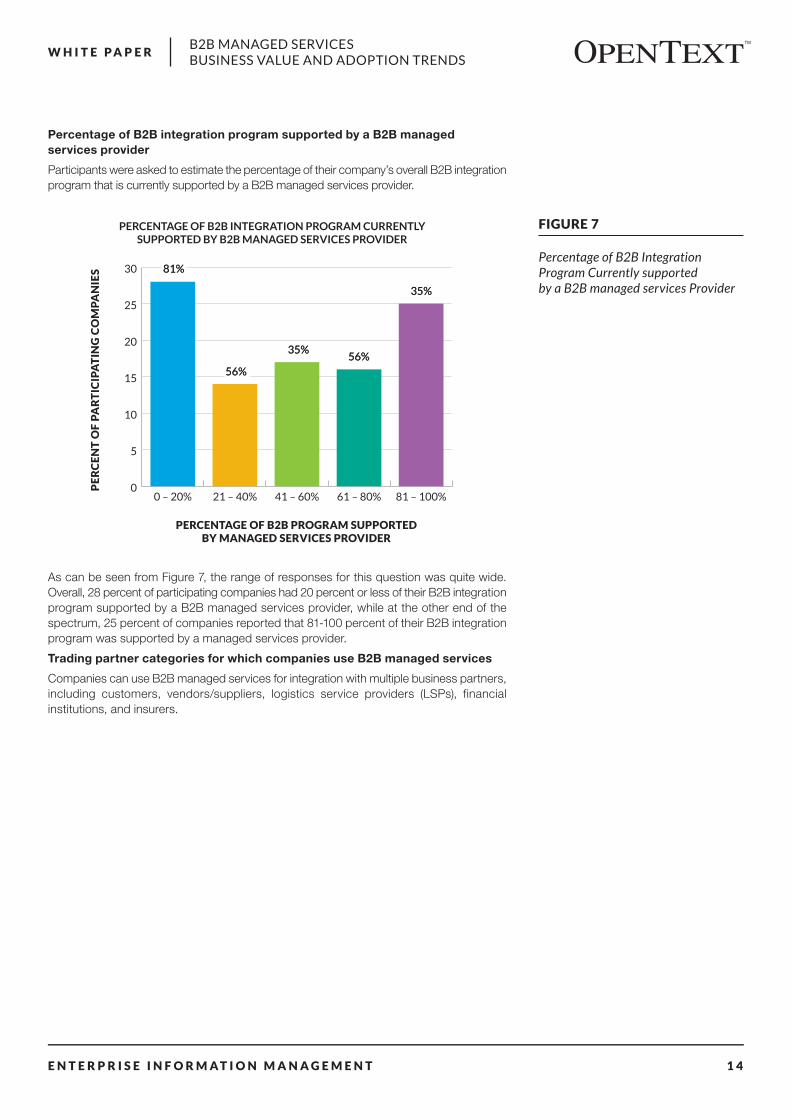
Percentage of B2B integration program supported by a B2B managed services provider
Participants were asked to estimate the percentage of their company’s overall B2B integration program that is currently supported by a B2B managed services provider.
As can be seen from Figure 7, the range of responses for this question was quite wide. Overall, 28 percent of participating companies had 20 percent or less of their B2B integration program supported by a B2B managed services provider, while at the other end of the spectrum, 25 percent of companies reported that 81-100 percent of their B2B integration program was supported by a managed services provider.
Trading partner categories for which companies use B2B managed services
Companies can use B2B managed services for integration with multiple business partners, including customers, vendors/suppliers, logistics service providers (LSPs), financial institutions, and insurers.
FIGURE 7
Percentage of B2B Integration Program Currently supported by a B2B managed services Provider
0
5
10
15
20
25
30
81 – 100%61 – 80%41 – 60%21 – 40%0 – 20%
PERCENTAGE OF B2B INTEGRATION PROGRAM CURRENTLY SUPPORTED BY B2B MANAGED SERVICES PROVIDER
PE
RC
EN
T O
F P
AR
TIC
IPA
TIN
G C
OM
PA
NIE
S
PERCENTAGE OF B2B PROGRAM SUPPORTED BY MANAGED SERVICES PROVIDER
81%
56%
35%56%
35%
81%
56%
35%56%
35%
E N T E R P R I S E I N F O R M A T I O N M A N A G E M E N T 1 5
B2B MANAGED SERVICES BUSINESS VALUE AND ADOPTION TRENDS
W H I T E P A P E R
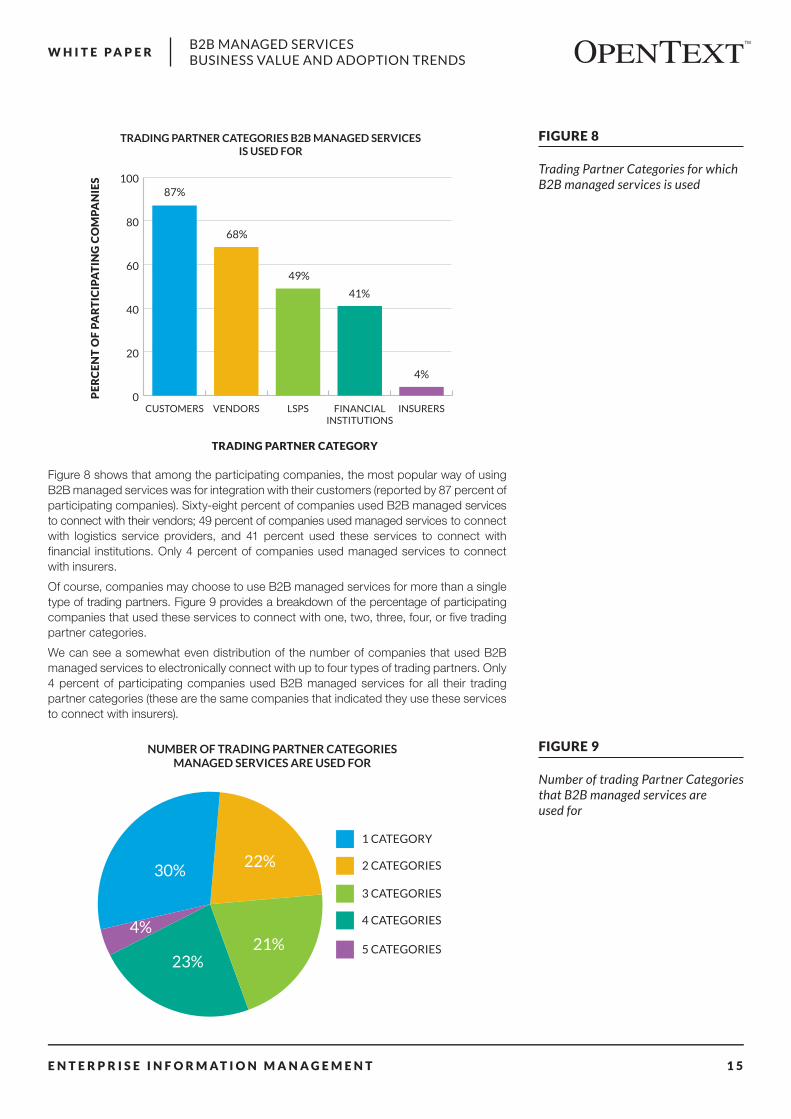
Figure 8 shows that among the participating companies, the most popular way of using B2B managed services was for integration with their customers (reported by 87 percent of participating companies). Sixty-eight percent of companies used B2B managed services to connect with their vendors; 49 percent of companies used managed services to connect with logistics service providers, and 41 percent used these services to connect with financial institutions. Only 4 percent of companies used managed services to connect with insurers.
Of course, companies may choose to use B2B managed services for more than a single type of trading partners. Figure 9 provides a breakdown of the percentage of participating companies that used these services to connect with one, two, three, four, or five trading partner categories.
We can see a somewhat even distribution of the number of companies that used B2B managed services to electronically connect with up to four types of trading partners. Only 4 percent of participating companies used B2B managed services for all their trading partner categories (these are the same companies that indicated they use these services to connect with insurers).
FIGURE 8
Trading Partner Categories for which B2B managed services is used
TRADING PARTNER CATEGORIES B2B MANAGED SERVICES IS USED FOR
0
20
40
60
80
100
INSURERSFINANCIALINSTITUTIONS
LSPSVENDORSCUSTOMERS
TRADING PARTNER CATEGORY
PE
RC
EN
T O
F P
AR
TIC
IPA
TIN
G C
OM
PA
NIE
S
87%
68%
49%
41%
4%
FIGURE 9
Number of trading Partner Categories that B2B managed services are used for
NUMBER OF TRADING PARTNER CATEGORIES MANAGED SERVICES ARE USED FOR
1 CATEGORY
2 CATEGORIES
3 CATEGORIES
4 CATEGORIES
5 CATEGORIES
4%
30%22%
21%23%
E N T E R P R I S E I N F O R M A T I O N M A N A G E M E N T 1 6
B2B MANAGED SERVICES BUSINESS VALUE AND ADOPTION TRENDS
W H I T E P A P E R
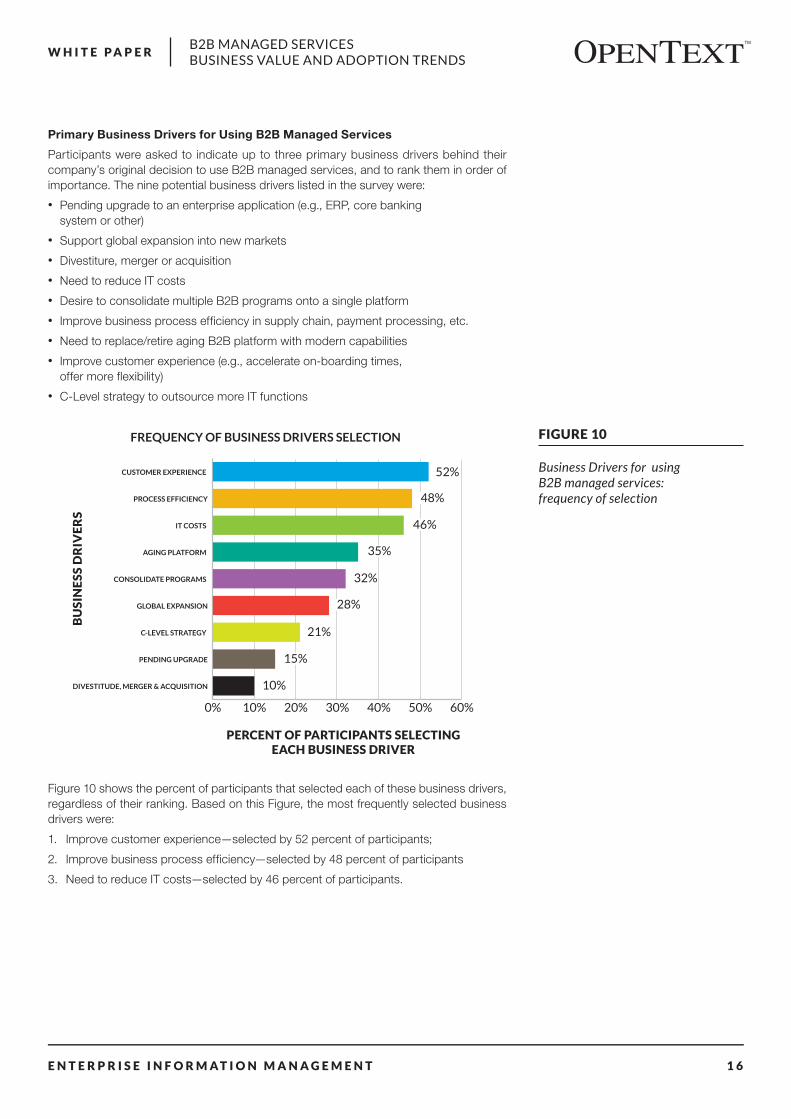
Primary Business Drivers for Using B2B Managed Services
Participants were asked to indicate up to three primary business drivers behind their company’s original decision to use B2B managed services, and to rank them in order of importance. The nine potential business drivers listed in the survey were:
• Pending upgrade to an enterprise application (e.g., ERP, core banking system or other)
• Support global expansion into new markets
• Divestiture, merger or acquisition
• Need to reduce IT costs
• Desire to consolidate multiple B2B programs onto a single platform
• Improve business process efficiency in supply chain, payment processing, etc.
• Need to replace/retire aging B2B platform with modern capabilities
• Improve customer experience (e.g., accelerate on-boarding times, offer more flexibility)
• C-Level strategy to outsource more IT functions
Figure 10 shows the percent of participants that selected each of these business drivers, regardless of their ranking. Based on this Figure, the most frequently selected business drivers were:
1. Improve customer experience—selected by 52 percent of participants;
2. Improve business process efficiency—selected by 48 percent of participants
3. Need to reduce IT costs—selected by 46 percent of participants.
FIGURE 10
Business Drivers for using B2B managed services: frequency of selection
FREQUENCY OF BUSINESS DRIVERS SELECTION
0% 10% 20% 30% 40% 50% 60%
DIVESTITUDE, MERGER & ACQUISITION
PENDING UPGRADE
C-LEVEL STRATEGY
GLOBAL EXPANSION
CONSOLIDATE PROGRAMS
AGING PLATFORM
IT COSTS
PROCESS EFFICIENCY
CUSTOMER EXPERIENCE
PERCENT OF PARTICIPANTS SELECTING EACH BUSINESS DRIVER
BU
SIN
ESS
DR
IVE
RS
52%
48%
46%
35%
32%
28%
21%
15%
10%
E N T E R P R I S E I N F O R M A T I O N M A N A G E M E N T 1 7
B2B MANAGED SERVICES BUSINESS VALUE AND ADOPTION TRENDS
W H I T E P A P E R
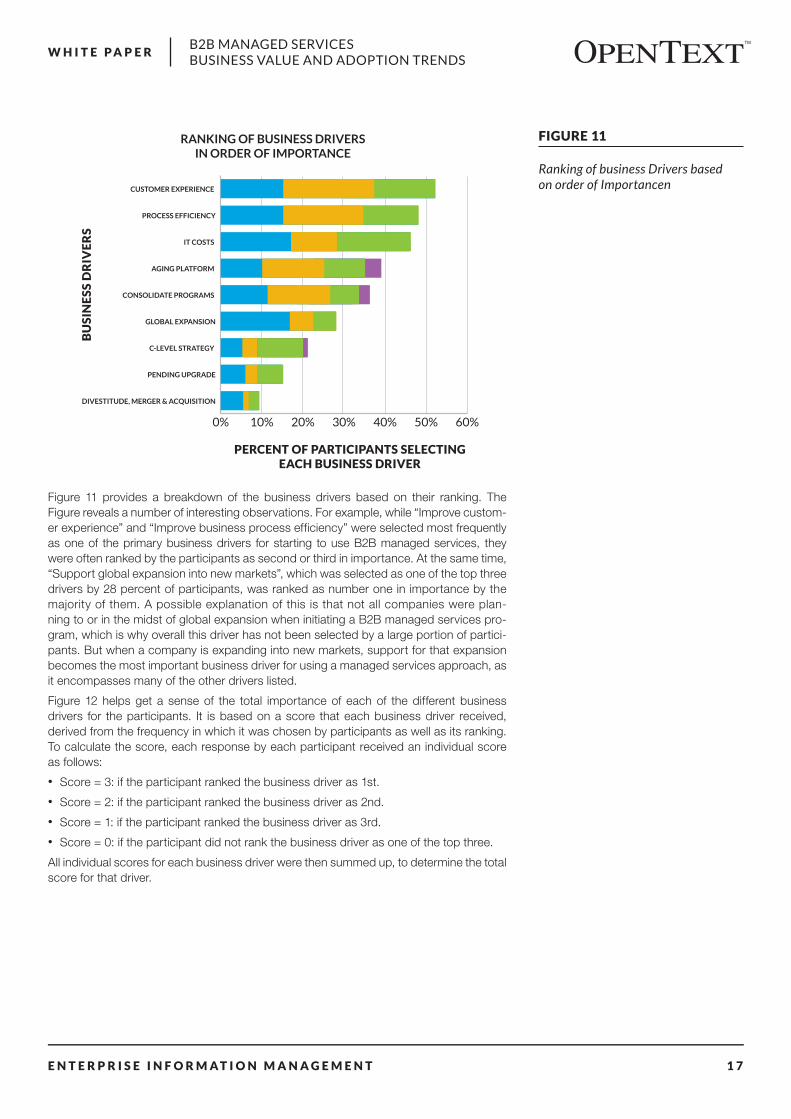
Figure 11 provides a breakdown of the business drivers based on their ranking. The Figure reveals a number of interesting observations. For example, while “Improve custom-er experience” and “Improve business process efficiency” were selected most frequently as one of the primary business drivers for starting to use B2B managed services, they were often ranked by the participants as second or third in importance. At the same time, “Support global expansion into new markets”, which was selected as one of the top three drivers by 28 percent of participants, was ranked as number one in importance by the majority of them. A possible explanation of this is that not all companies were plan-ning to or in the midst of global expansion when initiating a B2B managed services pro- gram, which is why overall this driver has not been selected by a large portion of partici-pants. But when a company is expanding into new markets, support for that expansion becomes the most important business driver for using a managed services approach, as it encompasses many of the other drivers listed.
Figure 12 helps get a sense of the total importance of each of the different business drivers for the participants. It is based on a score that each business driver received, derived from the frequency in which it was chosen by participants as well as its ranking. To calculate the score, each response by each participant received an individual score as follows:
• Score = 3: if the participant ranked the business driver as 1st.
• Score = 2: if the participant ranked the business driver as 2nd.
• Score = 1: if the participant ranked the business driver as 3rd.
• Score = 0: if the participant did not rank the business driver as one of the top three.
All individual scores for each business driver were then summed up, to determine the total score for that driver.
FIGURE 11
Ranking of business Drivers based on order of Importancen
RANKING OF BUSINESS DRIVERS IN ORDER OF IMPORTANCE
0% 10% 20% 30% 40% 50% 60%
RANK
DIVESTITUDE, MERGER & ACQUISITION
PENDING UPGRADE
C-LEVEL STRATEGY
GLOBAL EXPANSION
CONSOLIDATE PROGRAMS
AGING PLATFORM
IT COSTS
PROCESS EFFICIENCY
CUSTOMER EXPERIENCE
PERCENT OF PARTICIPANTS SELECTING EACH BUSINESS DRIVER
BU
SIN
ESS
DR
IVE
RS
1ST 2ND 3RD 4TH
E N T E R P R I S E I N F O R M A T I O N M A N A G E M E N T 1 8
B2B MANAGED SERVICES BUSINESS VALUE AND ADOPTION TRENDS
W H I T E P A P E R
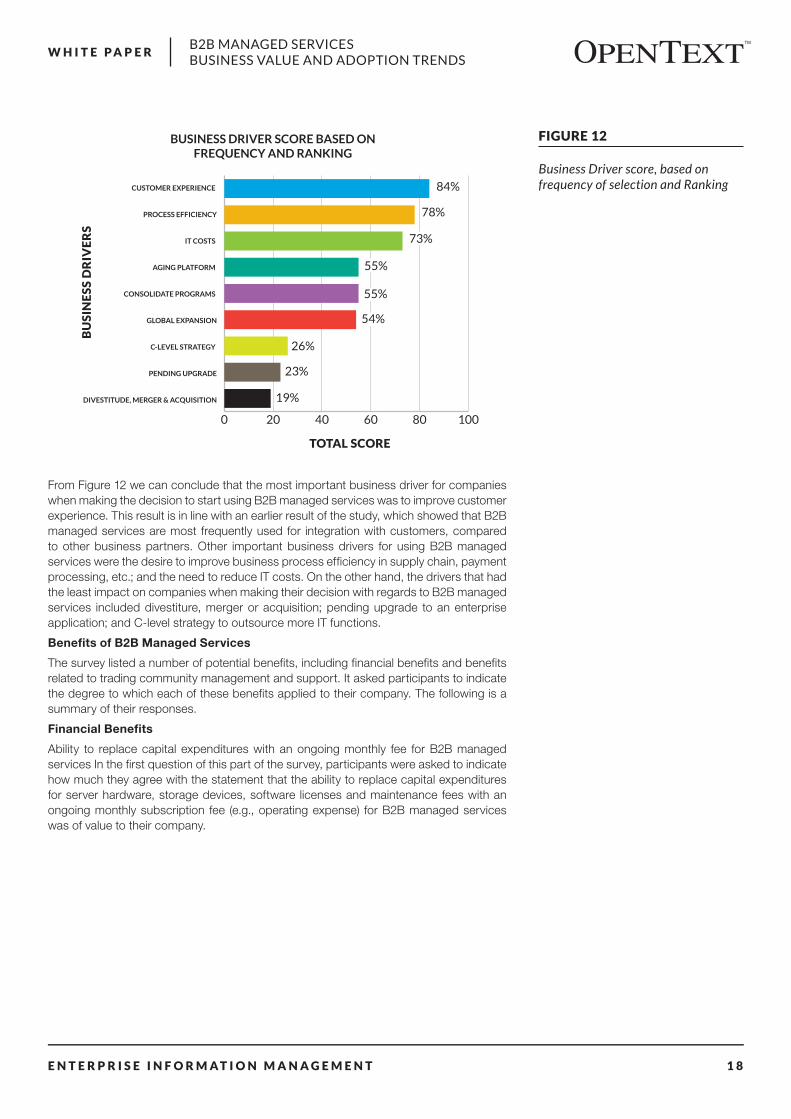
From Figure 12 we can conclude that the most important business driver for companies when making the decision to start using B2B managed services was to improve customer experience. This result is in line with an earlier result of the study, which showed that B2B managed services are most frequently used for integration with customers, compared to other business partners. Other important business drivers for using B2B managed services were the desire to improve business process efficiency in supply chain, payment processing, etc.; and the need to reduce IT costs. On the other hand, the drivers that had the least impact on companies when making their decision with regards to B2B managed services included divestiture, merger or acquisition; pending upgrade to an enterprise application; and C-level strategy to outsource more IT functions.
Benefits of B2B Managed Services
The survey listed a number of potential benefits, including financial benefits and benefits related to trading community management and support. It asked participants to indicate the degree to which each of these benefits applied to their company. The following is a summary of their responses.
Financial Benefits
Ability to replace capital expenditures with an ongoing monthly fee for B2B managed services In the first question of this part of the survey, participants were asked to indicate how much they agree with the statement that the ability to replace capital expenditures for server hardware, storage devices, software licenses and maintenance fees with an ongoing monthly subscription fee (e.g., operating expense) for B2B managed services was of value to their company.
FIGURE 12
Business Driver score, based on frequency of selection and Ranking
BUSINESS DRIVER SCORE BASED ON FREQUENCY AND RANKING
0 20 40 60 80 100
DIVESTITUDE, MERGER & ACQUISITION
PENDING UPGRADE
C-LEVEL STRATEGY
GLOBAL EXPANSION
CONSOLIDATE PROGRAMS
AGING PLATFORM
IT COSTS
PROCESS EFFICIENCY
CUSTOMER EXPERIENCE
BU
SIN
ESS
DR
IVE
RS
TOTAL SCORE
84%
78%
73%
55%
55%
54%
26%
23%
19%
E N T E R P R I S E I N F O R M A T I O N M A N A G E M E N T 1 9
B2B MANAGED SERVICES BUSINESS VALUE AND ADOPTION TRENDS
W H I T E P A P E R
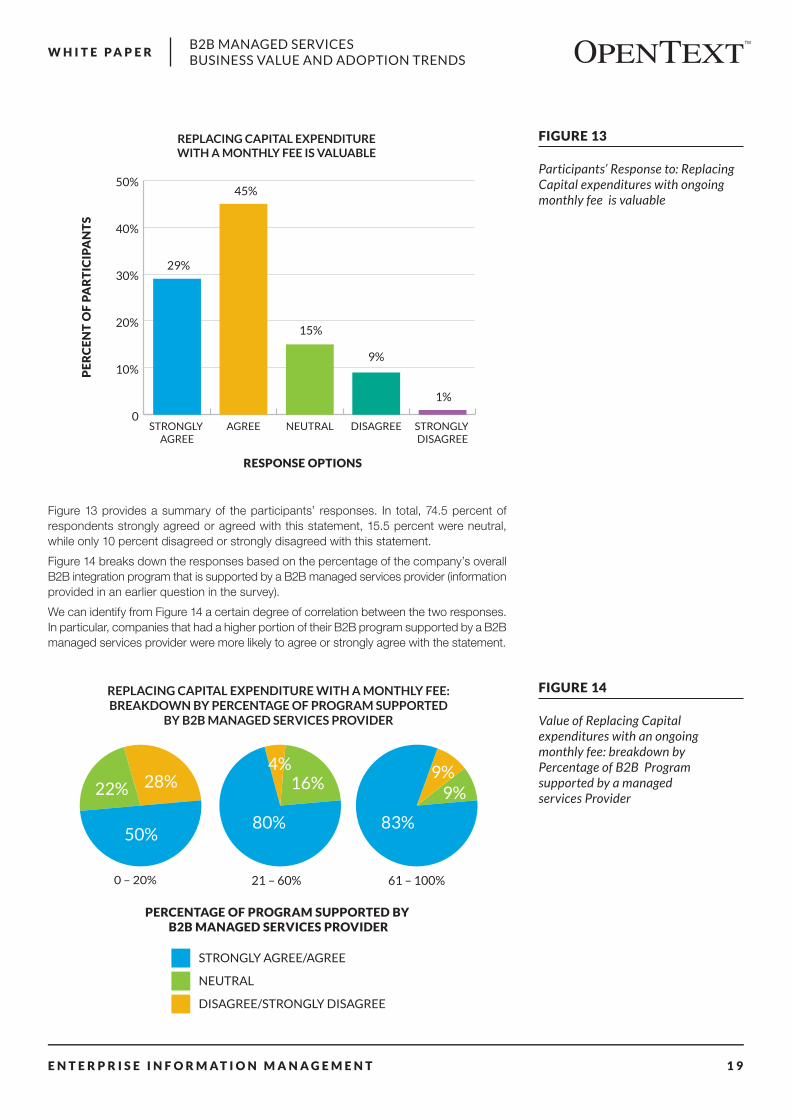
FIGURE 13
Participants’ Response to: Replacing Capital expenditures with ongoing monthly fee is valuable
REPLACING CAPITAL EXPENDITURE WITH A MONTHLY FEE IS VALUABLE
0
10%
20%
30%
40%
50%
STRONGLY DISAGREE
DISAGREENEUTRALAGREESTRONGLY AGREE
RESPONSE OPTIONS
PE
RC
EN
T O
F P
AR
TIC
IPA
NT
S
45%
15%
9%
1%
29%
Figure 13 provides a summary of the participants’ responses. In total, 74.5 percent of respondents strongly agreed or agreed with this statement, 15.5 percent were neutral, while only 10 percent disagreed or strongly disagreed with this statement.
Figure 14 breaks down the responses based on the percentage of the company’s overall B2B integration program that is supported by a B2B managed services provider (information provided in an earlier question in the survey).
We can identify from Figure 14 a certain degree of correlation between the two responses. In particular, companies that had a higher portion of their B2B program supported by a B2B managed services provider were more likely to agree or strongly agree with the statement.
FIGURE 14
Value of Replacing Capital expenditures with an ongoing monthly fee: breakdown by Percentage of B2B Program supported by a managed services Provider
REPLACING CAPITAL EXPENDITURE WITH A MONTHLY FEE: BREAKDOWN BY PERCENTAGE OF PROGRAM SUPPORTED
BY B2B MANAGED SERVICES PROVIDER
50%
22% 28%
80%
4%16%
83%
9%9%
PERCENTAGE OF PROGRAM SUPPORTED BY B2B MANAGED SERVICES PROVIDER
STRONGLY AGREE/AGREE
NEUTRAL
DISAGREE/STRONGLY DISAGREE
0 – 20% 21 – 60% 61 – 100%
E N T E R P R I S E I N F O R M A T I O N M A N A G E M E N T 2 0
B2B MANAGED SERVICES BUSINESS VALUE AND ADOPTION TRENDS
W H I T E P A P E R
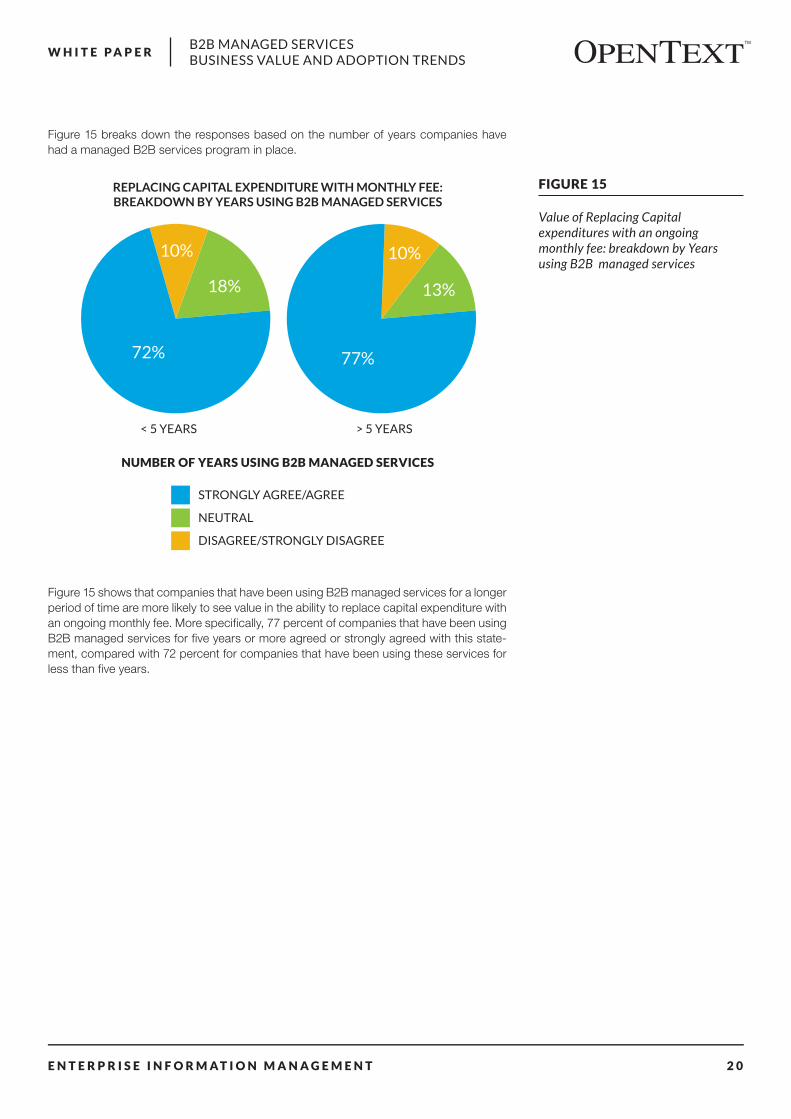
Figure 15 breaks down the responses based on the number of years companies have had a managed B2B services program in place.
Figure 15 shows that companies that have been using B2B managed services for a longer period of time are more likely to see value in the ability to replace capital expenditure with an ongoing monthly fee. More specifically, 77 percent of companies that have been using B2B managed services for five years or more agreed or strongly agreed with this state-ment, compared with 72 percent for companies that have been using these services for less than five years.
FIGURE 15
Value of Replacing Capital expenditures with an ongoing monthly fee: breakdown by Years using B2B managed services
REPLACING CAPITAL EXPENDITURE WITH MONTHLY FEE: BREAKDOWN BY YEARS USING B2B MANAGED SERVICES
NUMBER OF YEARS USING B2B MANAGED SERVICES
< 5 YEARS > 5 YEARS
72%
STRONGLY AGREE/AGREE
NEUTRAL
DISAGREE/STRONGLY DISAGREE
10%
18%
77%
10%
13%
E N T E R P R I S E I N F O R M A T I O N M A N A G E M E N T 2 1
B2B MANAGED SERVICES BUSINESS VALUE AND ADOPTION TRENDS
W H I T E P A P E R
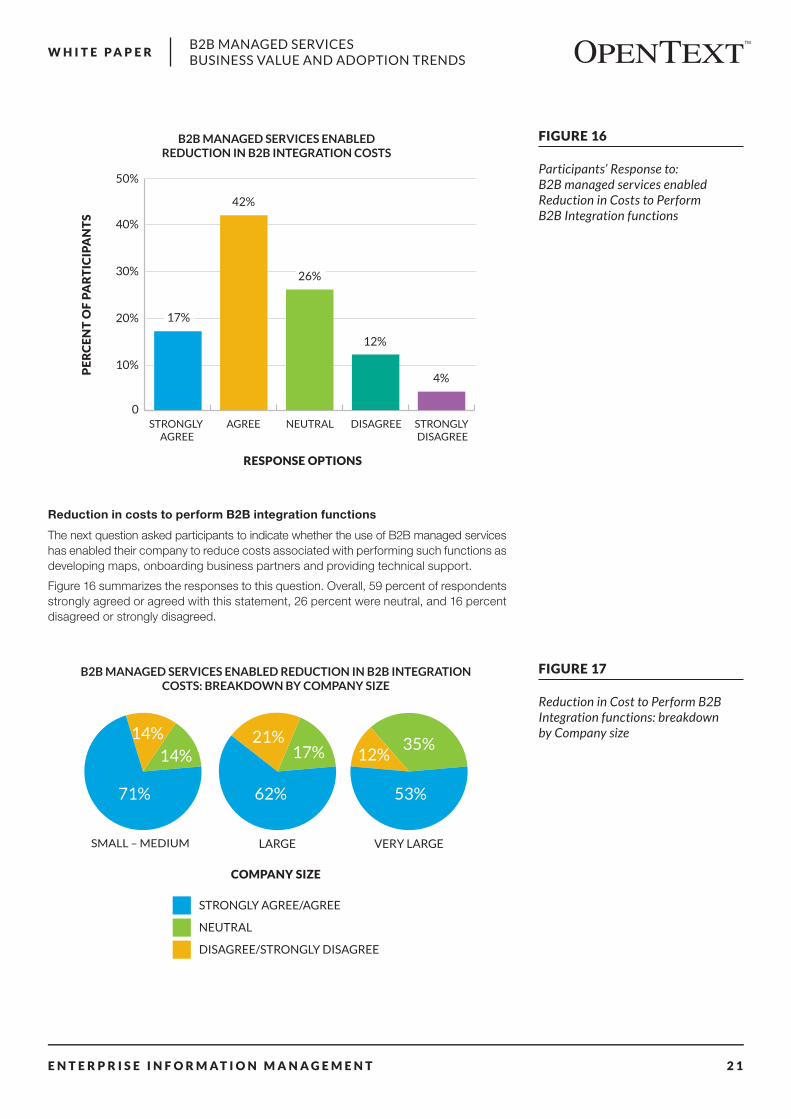
Reduction in costs to perform B2B integration functions
The next question asked participants to indicate whether the use of B2B managed services has enabled their company to reduce costs associated with performing such functions as developing maps, onboarding business partners and providing technical support.
Figure 16 summarizes the responses to this question. Overall, 59 percent of respondents strongly agreed or agreed with this statement, 26 percent were neutral, and 16 percent disagreed or strongly disagreed.
FIGURE 16
Participants’ Response to: B2B managed services enabled Reduction in Costs to Perform B2B Integration functions
B2B MANAGED SERVICES ENABLED REDUCTION IN B2B INTEGRATION COSTS
PE
RC
EN
T O
F P
AR
TIC
IPA
NT
S
STRONGLY DISAGREE
DISAGREENEUTRALAGREESTRONGLY AGREE
RESPONSE OPTIONS
10%
20%
30%
40%
50%
0
42%
26%
12%
4%
17%
FIGURE 17
Reduction in Cost to Perform B2B Integration functions: breakdown by Company size
B2B MANAGED SERVICES ENABLED REDUCTION IN B2B INTEGRATION COSTS: BREAKDOWN BY COMPANY SIZE
COMPANY SIZE
STRONGLY AGREE/AGREE
NEUTRAL
DISAGREE/STRONGLY DISAGREE
SMALL – MEDIUM LARGE VERY LARGE
71%
14%14%
62%
21%17%
53%
12%35%
E N T E R P R I S E I N F O R M A T I O N M A N A G E M E N T 2 2
B2B MANAGED SERVICES BUSINESS VALUE AND ADOPTION TRENDS
W H I T E P A P E R
It turns out that a higher portion of small and medium companies, with annual revenue of up to $1 billion, were able to use B2B managed services to reduce costs associated with performing various B2B integration functions, such as developing maps, onboarding business partners and providing technical support. In particular, 71 percent of small and medium companies strongly agreed or agreed with the statement, compared with 62 percent and 53 percent of large and very large companies, respectively.
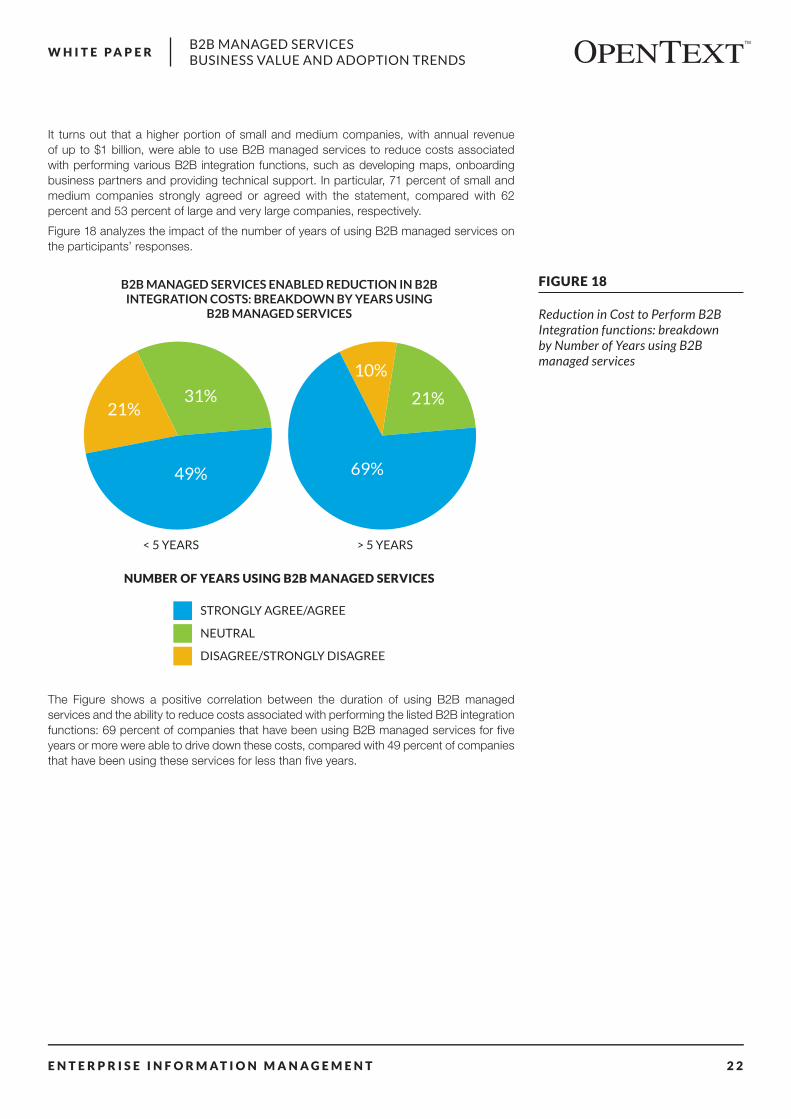
Figure 18 analyzes the impact of the number of years of using B2B managed services on the participants’ responses.
The Figure shows a positive correlation between the duration of using B2B managed services and the ability to reduce costs associated with performing the listed B2B integration functions: 69 percent of companies that have been using B2B managed services for five years or more were able to drive down these costs, compared with 49 percent of companies that have been using these services for less than five years.
FIGURE 18
Reduction in Cost to Perform B2B Integration functions: breakdown by Number of Years using B2B managed services
B2B MANAGED SERVICES ENABLED REDUCTION IN B2B INTEGRATION COSTS: BREAKDOWN BY YEARS USING
B2B MANAGED SERVICES
NUMBER OF YEARS USING B2B MANAGED SERVICES
< 5 YEARS > 5 YEARS
49%
STRONGLY AGREE/AGREE
NEUTRAL
DISAGREE/STRONGLY DISAGREE
21%31%
69%
10%
21%
E N T E R P R I S E I N F O R M A T I O N M A N A G E M E N T 2 3
B2B MANAGED SERVICES BUSINESS VALUE AND ADOPTION TRENDS
W H I T E P A P E R
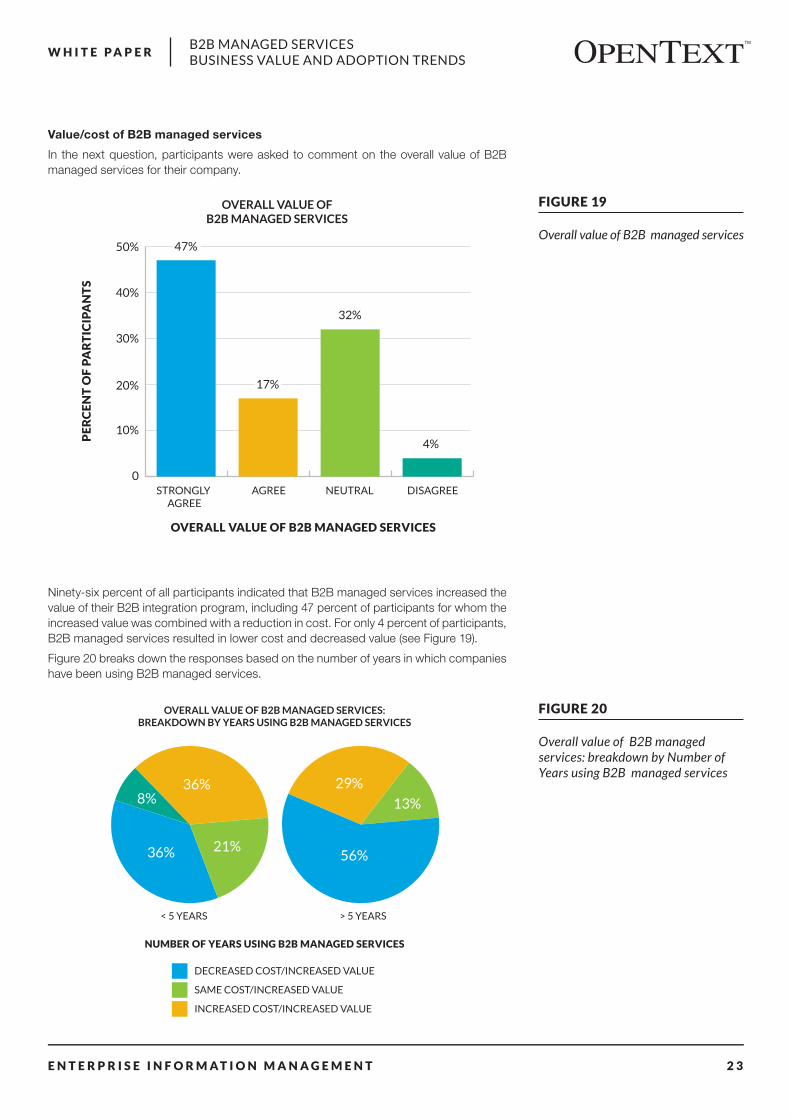
Value/cost of B2B managed services
In the next question, participants were asked to comment on the overall value of B2B managed services for their company.
Ninety-six percent of all participants indicated that B2B managed services increased the value of their B2B integration program, including 47 percent of participants for whom the increased value was combined with a reduction in cost. For only 4 percent of participants, B2B managed services resulted in lower cost and decreased value (see Figure 19).
Figure 20 breaks down the responses based on the number of years in which companies have been using B2B managed services.
FIGURE 19
Overall value of B2B managed services
OVERALL VALUE OF B2B MANAGED SERVICES
10%
20%
30%
40%
50%
0DISAGREENEUTRALAGREESTRONGLY
AGREE
17%
32%
4%
47%
PE
RC
EN
T O
F P
AR
TIC
IPA
NT
S
OVERALL VALUE OF B2B MANAGED SERVICES
FIGURE 20
Overall value of B2B managed services: breakdown by Number of Years using B2B managed services
OVERALL VALUE OF B2B MANAGED SERVICES: BREAKDOWN BY YEARS USING B2B MANAGED SERVICES
NUMBER OF YEARS USING B2B MANAGED SERVICES
< 5 YEARS > 5 YEARS
36% 21%
36%8%
56%
29%
13%
DECREASED COST/INCREASED VALUE
SAME COST/INCREASED VALUE
INCREASED COST/INCREASED VALUE
DECREASED COST/DECREASED VALUE
E N T E R P R I S E I N F O R M A T I O N M A N A G E M E N T 2 4
B2B MANAGED SERVICES BUSINESS VALUE AND ADOPTION TRENDS
W H I T E P A P E R
We see from Figure 20 that a larger portion of the companies that have been using managed services for five years or more were able to see the value of their B2B integration program increase, while at the same time reducing the costs associated with this program (58 percent vs. 36 percent of companies that have been using these services for less than five years). Furthermore, B2B Managed Services did not result in lower value for any of these companies. We can therefore conclude that it may take several years for companies to fully realize the benefits associated with B2B managed services.
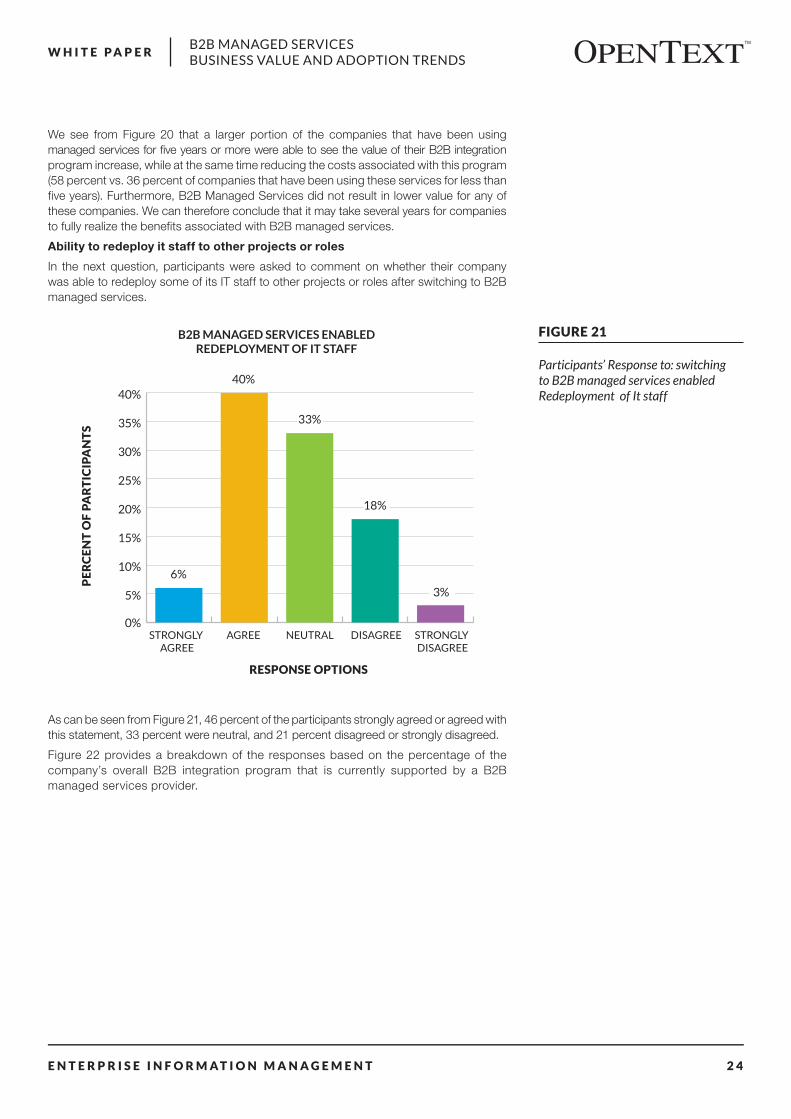
Ability to redeploy it staff to other projects or roles
In the next question, participants were asked to comment on whether their company was able to redeploy some of its IT staff to other projects or roles after switching to B2B managed services.
As can be seen from Figure 21, 46 percent of the participants strongly agreed or agreed with this statement, 33 percent were neutral, and 21 percent disagreed or strongly disagreed.
Figure 22 provides a breakdown of the responses based on the percentage of the company’s overall B2B integration program that is currently supported by a B2B managed services provider.
FIGURE 21
Participants’ Response to: switching to B2B managed services enabled Redeployment of It staff
B2B MANAGED SERVICES ENABLED REDEPLOYMENT OF IT STAFF
PE
RC
EN
T O
F P
AR
TIC
IPA
NT
S
0%
5%
10%
15%
20%
25%
30%
35%
40%
STRONGLY DISAGREE
DISAGREENEUTRALAGREESTRONGLY AGREE
RESPONSE OPTIONS
40%
33%
18%
3%
6%
E N T E R P R I S E I N F O R M A T I O N M A N A G E M E N T 2 5
B2B MANAGED SERVICES BUSINESS VALUE AND ADOPTION TRENDS
W H I T E P A P E R
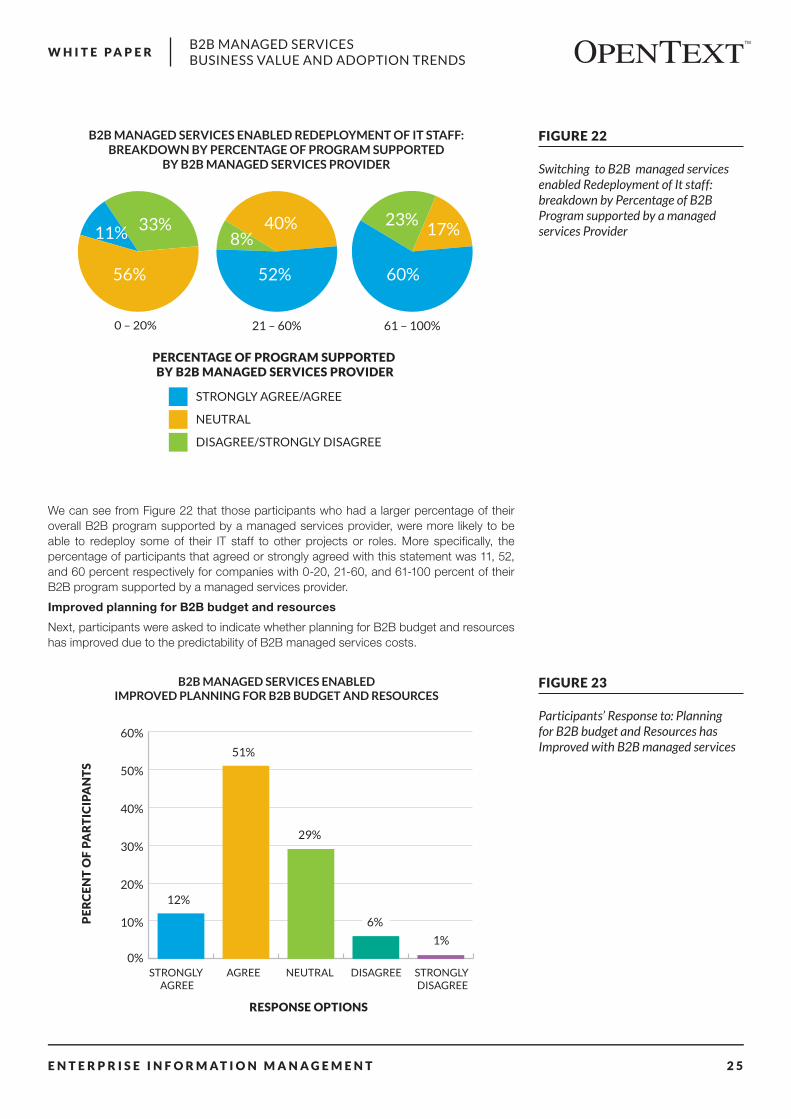
We can see from Figure 22 that those participants who had a larger percentage of their overall B2B program supported by a managed services provider, were more likely to be able to redeploy some of their IT staff to other projects or roles. More specifically, the percentage of participants that agreed or strongly agreed with this statement was 11, 52, and 60 percent respectively for companies with 0-20, 21-60, and 61-100 percent of their B2B program supported by a managed services provider.
Improved planning for B2B budget and resources
Next, participants were asked to indicate whether planning for B2B budget and resources has improved due to the predictability of B2B managed services costs.
FIGURE 22
Switching to B2B managed services enabled Redeployment of It staff: breakdown by Percentage of B2B Program supported by a managed services Provider
B2B MANAGED SERVICES ENABLED REDEPLOYMENT OF IT STAFF: BREAKDOWN BY PERCENTAGE OF PROGRAM SUPPORTED
BY B2B MANAGED SERVICES PROVIDER
PERCENTAGE OF PROGRAM SUPPORTED BY B2B MANAGED SERVICES PROVIDER
STRONGLY AGREE/AGREE
NEUTRAL
DISAGREE/STRONGLY DISAGREE
0 – 20% 21 – 60% 61 – 100%
56%
11% 33%
52%
8%40%
60%
23%17%
FIGURE 23
Participants’ Response to: Planning for B2B budget and Resources has Improved with B2B managed services
B2B MANAGED SERVICES ENABLED IMPROVED PLANNING FOR B2B BUDGET AND RESOURCES
0%
10%
20%
30%
40%
50%
60%
STRONGLY DISAGREE
DISAGREENEUTRALAGREESTRONGLY AGREE
RESPONSE OPTIONS
PE
RC
EN
T O
F P
AR
TIC
IPA
NT
S
51%
29%
6%
1%
12%
E N T E R P R I S E I N F O R M A T I O N M A N A G E M E N T 2 6
B2B MANAGED SERVICES BUSINESS VALUE AND ADOPTION TRENDS
W H I T E P A P E R
Sixty-three percent of respondents strongly agreed or agreed that planning for B2B budget and resources has improved with B2B managed services, 29.5 percent were neutral, and the remaining 7.5 percent disagreed or strongly disagreed with this statement (see Figure 23).
No clear patterns could be identified when breaking down the data based on the number of years the companies have been using B2B managed services, or the percentage of the companies’ overall B2B integration program that is supported by a managed services provider.
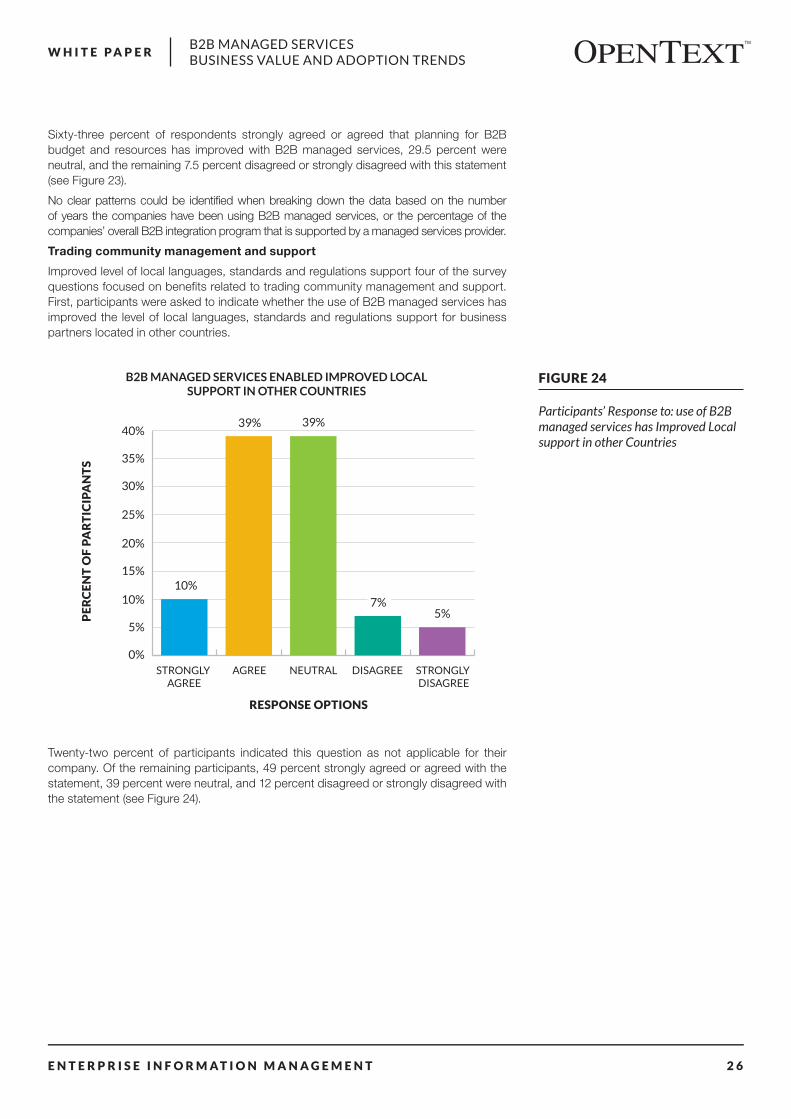
Trading community management and support
Improved level of local languages, standards and regulations support four of the survey questions focused on benefits related to trading community management and support. First, participants were asked to indicate whether the use of B2B managed services has improved the level of local languages, standards and regulations support for business partners located in other countries.
FIGURE 24
Participants’ Response to: use of B2B managed services has Improved Local support in other Countries
B2B MANAGED SERVICES ENABLED IMPROVED LOCAL SUPPORT IN OTHER COUNTRIES
PE
RC
EN
T O
F P
AR
TIC
IPA
NT
S
0%
5%
10%
15%
20%
25%
30%
35%
40%
STRONGLY DISAGREE
DISAGREENEUTRALAGREESTRONGLY AGREE
RESPONSE OPTIONS
39% 39%
7%5%
10%
Twenty-two percent of participants indicated this question as not applicable for their company. Of the remaining participants, 49 percent strongly agreed or agreed with the statement, 39 percent were neutral, and 12 percent disagreed or strongly disagreed with the statement (see Figure 24).
E N T E R P R I S E I N F O R M A T I O N M A N A G E M E N T 2 7
B2B MANAGED SERVICES BUSINESS VALUE AND ADOPTION TRENDS
W H I T E P A P E R
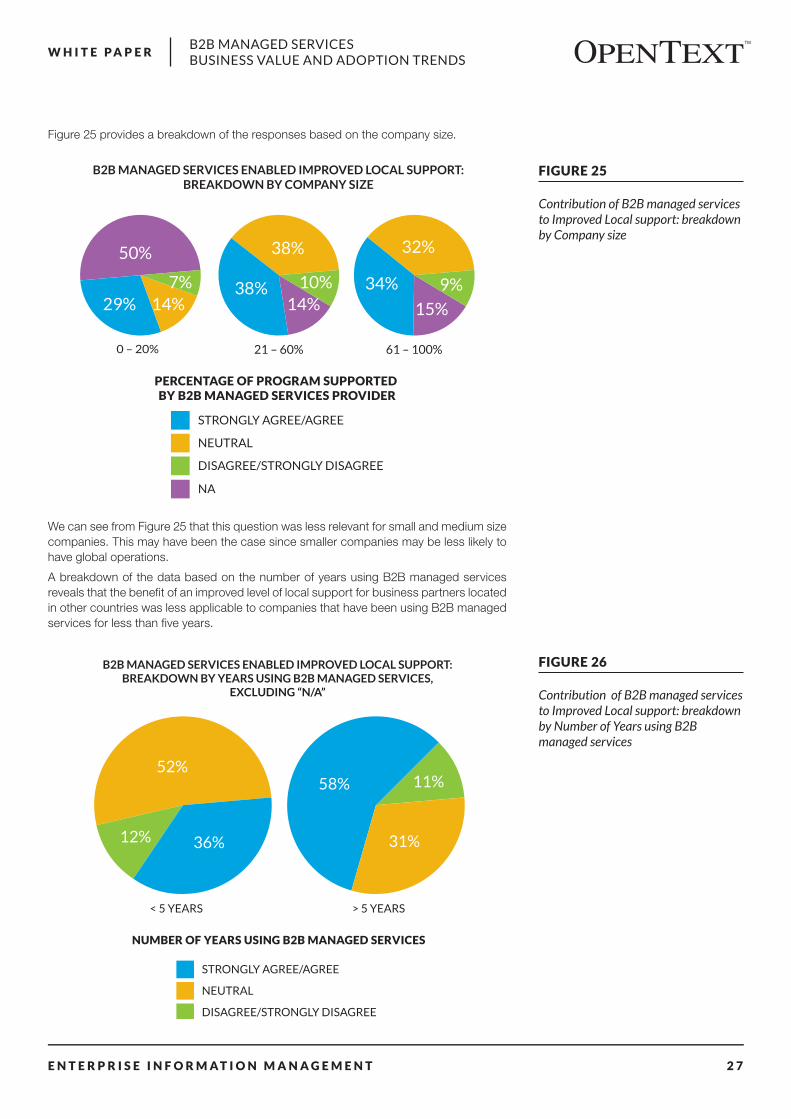
Figure 25 provides a breakdown of the responses based on the company size.
We can see from Figure 25 that this question was less relevant for small and medium size companies. This may have been the case since smaller companies may be less likely to have global operations.
A breakdown of the data based on the number of years using B2B managed services reveals that the benefit of an improved level of local support for business partners located in other countries was less applicable to companies that have been using B2B managed services for less than five years.
FIGURE 25
Contribution of B2B managed services to Improved Local support: breakdown by Company size
B2B MANAGED SERVICES ENABLED IMPROVED LOCAL SUPPORT: BREAKDOWN BY COMPANY SIZE
PERCENTAGE OF PROGRAM SUPPORTED BY B2B MANAGED SERVICES PROVIDER
STRONGLY AGREE/AGREE
NEUTRAL
DISAGREE/STRONGLY DISAGREE
0 – 20% 21 – 60% 61 – 100%
50%
NA
7%14%29%
38%
10%14%
38% 9%
15%
34%
32%
FIGURE 26
Contribution of B2B managed services to Improved Local support: breakdown by Number of Years using B2B managed services
B2B MANAGED SERVICES ENABLED IMPROVED LOCAL SUPPORT: BREAKDOWN BY YEARS USING B2B MANAGED SERVICES,
EXCLUDING “N/A”
NUMBER OF YEARS USING B2B MANAGED SERVICES
< 5 YEARS > 5 YEARS
36%
52%
12% 31%
58% 11%
STRONGLY AGREE/AGREE
NEUTRAL
DISAGREE/STRONGLY DISAGREE
E N T E R P R I S E I N F O R M A T I O N M A N A G E M E N T 2 8
B2B MANAGED SERVICES BUSINESS VALUE AND ADOPTION TRENDS
W H I T E P A P E R
Once the “Not Applicable” responses are excluded from the analysis (see Figure 26), we can see that a larger portion of companies that have been using B2B managed services for five years or more were able to realize this benefit: 58 percent of them strongly agreed or agreed with the statement in this question, compared with 36 percent of participants that have been using managed services for less than five years.
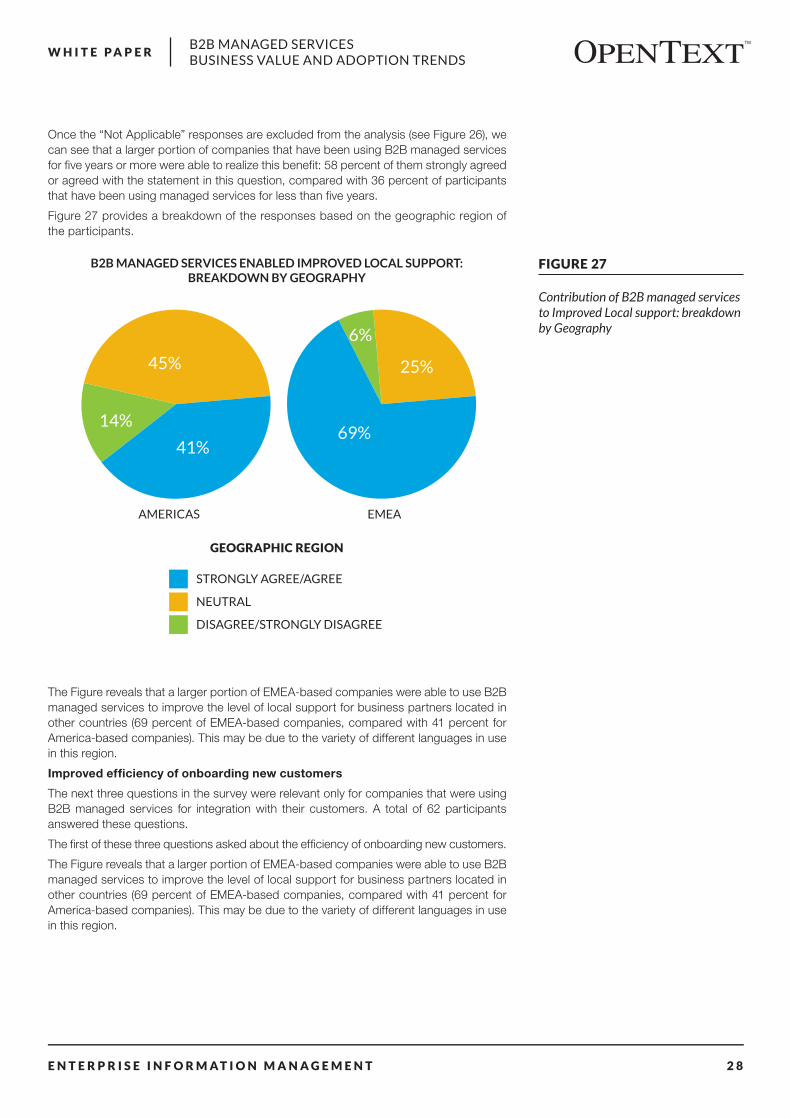
Figure 27 provides a breakdown of the responses based on the geographic region of the participants.
FIGURE 27
Contribution of B2B managed services to Improved Local support: breakdown by Geography
B2B MANAGED SERVICES ENABLED IMPROVED LOCAL SUPPORT: BREAKDOWN BY GEOGRAPHY
GEOGRAPHIC REGION
AMERICAS EMEA
41%
45%
14%69%
6%
25%
STRONGLY AGREE/AGREE
NEUTRAL
DISAGREE/STRONGLY DISAGREE
The Figure reveals that a larger portion of EMEA-based companies were able to use B2B managed services to improve the level of local support for business partners located in other countries (69 percent of EMEA-based companies, compared with 41 percent for America-based companies). This may be due to the variety of different languages in use in this region.
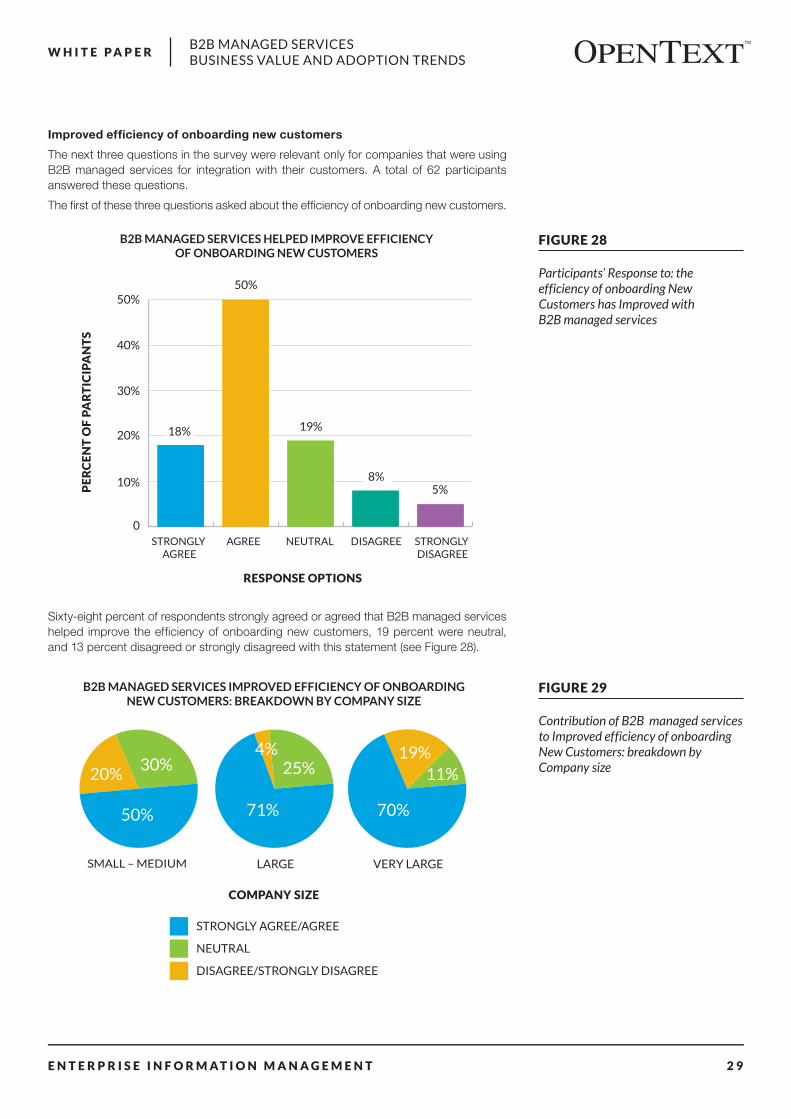
Improved efficiency of onboarding new customers
The next three questions in the survey were relevant only for companies that were using B2B managed services for integration with their customers. A total of 62 participants answered these questions.
The first of these three questions asked about the efficiency of onboarding new customers.
The Figure reveals that a larger portion of EMEA-based companies were able to use B2B managed services to improve the level of local support for business partners located in other countries (69 percent of EMEA-based companies, compared with 41 percent for America-based companies). This may be due to the variety of different languages in use in this region.
E N T E R P R I S E I N F O R M A T I O N M A N A G E M E N T 2 9
B2B MANAGED SERVICES BUSINESS VALUE AND ADOPTION TRENDS
W H I T E P A P E R
Improved efficiency of onboarding new customers
The next three questions in the survey were relevant only for companies that were using B2B managed services for integration with their customers. A total of 62 participants answered these questions.
The first of these three questions asked about the efficiency of onboarding new customers.
FIGURE 28
Participants’ Response to: the efficiency of onboarding New Customers has Improved with B2B managed services
B2B MANAGED SERVICES HELPED IMPROVE EFFICIENCY OF ONBOARDING NEW CUSTOMERS
PE
RC
EN
T O
F P
AR
TIC
IPA
NT
S
STRONGLY DISAGREE
DISAGREENEUTRALAGREESTRONGLY AGREE
RESPONSE OPTIONS
10%
20%
30%
40%
50%
0
50%
19%
8%5%
18%
Sixty-eight percent of respondents strongly agreed or agreed that B2B managed services helped improve the efficiency of onboarding new customers, 19 percent were neutral, and 13 percent disagreed or strongly disagreed with this statement (see Figure 28).
FIGURE 29
Contribution of B2B managed services to Improved efficiency of onboarding New Customers: breakdown by Company size
B2B MANAGED SERVICES IMPROVED EFFICIENCY OF ONBOARDING NEW CUSTOMERS: BREAKDOWN BY COMPANY SIZE
50%
COMPANY SIZE
STRONGLY AGREE/AGREE
NEUTRAL
DISAGREE/STRONGLY DISAGREE
SMALL – MEDIUM LARGE VERY LARGE
20%30%
71%
4%25%
70%
19%11%
E N T E R P R I S E I N F O R M A T I O N M A N A G E M E N T 3 0
B2B MANAGED SERVICES BUSINESS VALUE AND ADOPTION TRENDS
W H I T E P A P E R
When breaking down the information based on the annual revenue of the participating companies (Figure 29), we see that larger companies found B2B managed services more helpful in improving the efficiency of onboarding new customers: 71 percent of large companies and 70 percent of very large companies strongly agreed or agreed with this statement, compared with 50 percent of small and medium companies.
FIGURE 30
Contribution of B2B managed services to Improved efficiency of onboarding New Customers: breakdown by Years using B2B managed services
B2B MANAGED SERVICES IMPROVED EFFICIENCY OF ONBOARDING NEW CUSTOMERS: BREAKDOWN BY YEARS
USING B2B MANAGED SERVICES
57%
27%17%
78%
9%
13%
NUMBER OF YEARS USING B2B MANAGED SERVICES
< 5 YEARS > 5 YEARS
STRONGLY AGREE/AGREE
NEUTRAL
DISAGREE/STRONGLY DISAGREE
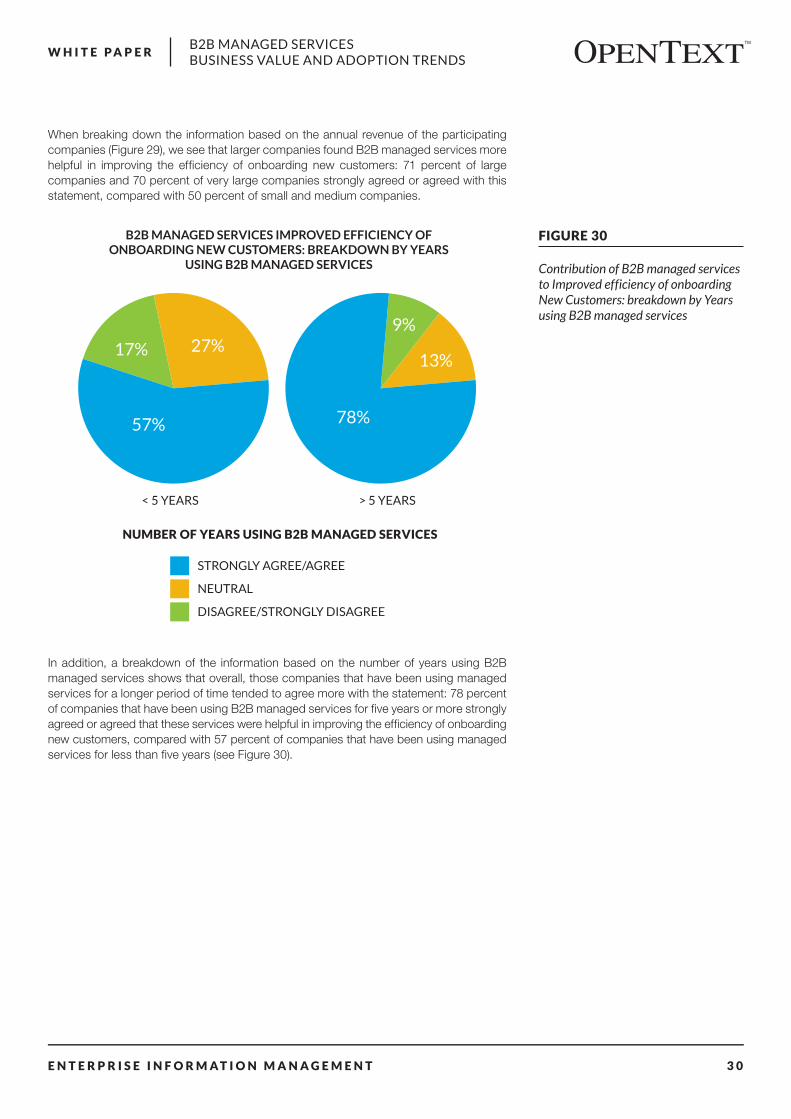
In addition, a breakdown of the information based on the number of years using B2B managed services shows that overall, those companies that have been using managed services for a longer period of time tended to agree more with the statement: 78 percent of companies that have been using B2B managed services for five years or more strongly agreed or agreed that these services were helpful in improving the efficiency of onboarding new customers, compared with 57 percent of companies that have been using managed services for less than five years (see Figure 30).
E N T E R P R I S E I N F O R M A T I O N M A N A G E M E N T 3 1
B2B MANAGED SERVICES BUSINESS VALUE AND ADOPTION TRENDS
W H I T E P A P E R
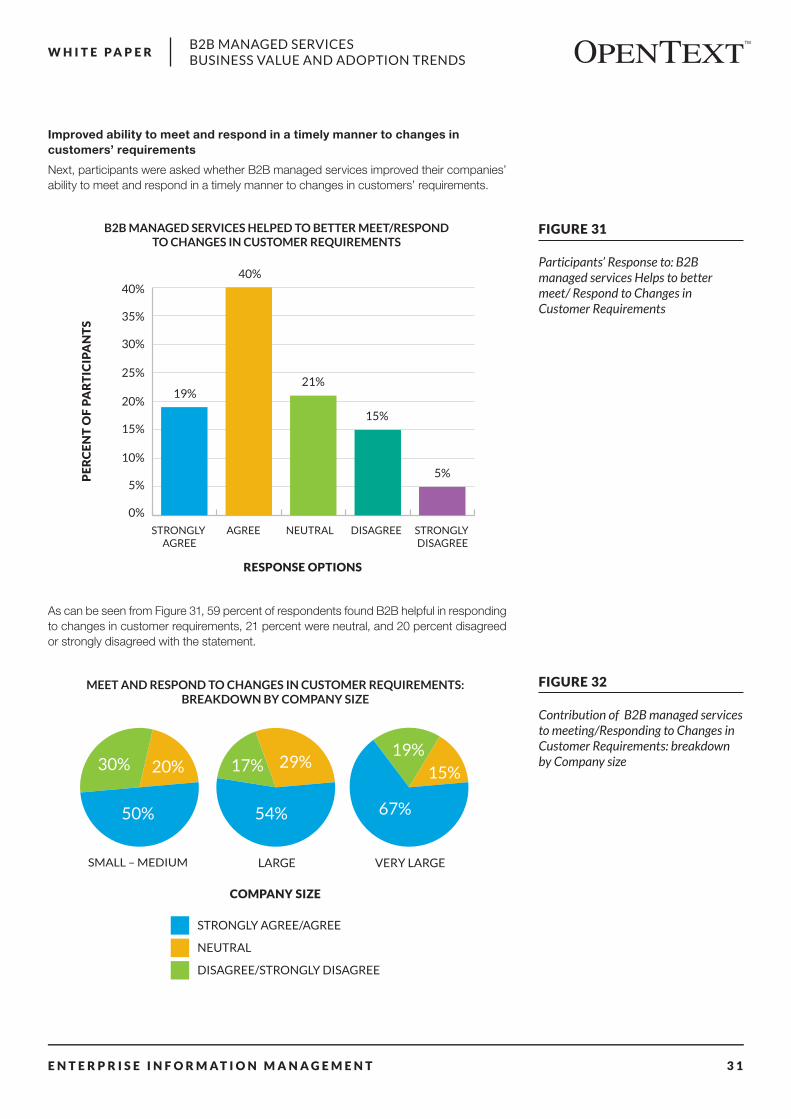
Improved ability to meet and respond in a timely manner to changes in customers’ requirements
Next, participants were asked whether B2B managed services improved their companies’ ability to meet and respond in a timely manner to changes in customers’ requirements.
FIGURE 31
Participants’ Response to: B2B managed services Helps to better meet/ Respond to Changes in Customer Requirements
B2B MANAGED SERVICES HELPED TO BETTER MEET/RESPOND TO CHANGES IN CUSTOMER REQUIREMENTS
STRONGLY DISAGREE
DISAGREENEUTRALAGREESTRONGLY AGREE
0%
5%
10%
15%
20%
25%
30%
35%
40%
PE
RC
EN
T O
F P
AR
TIC
IPA
NT
S
RESPONSE OPTIONS
40%
21%
15%
5%
19%
As can be seen from Figure 31, 59 percent of respondents found B2B helpful in responding to changes in customer requirements, 21 percent were neutral, and 20 percent disagreed or strongly disagreed with the statement.
FIGURE 32
Contribution of B2B managed services to meeting/Responding to Changes in Customer Requirements: breakdown by Company size
MEET AND RESPOND TO CHANGES IN CUSTOMER REQUIREMENTS: BREAKDOWN BY COMPANY SIZE
50%
COMPANY SIZE
STRONGLY AGREE/AGREE
NEUTRAL
DISAGREE/STRONGLY DISAGREE
SMALL – MEDIUM LARGE VERY LARGE
20%30%
54%
17% 29%
67%
19%15%
E N T E R P R I S E I N F O R M A T I O N M A N A G E M E N T 3 2
B2B MANAGED SERVICES BUSINESS VALUE AND ADOPTION TRENDS
W H I T E P A P E R
Similarly to the previous question, here too a breakdown of the data based on the annual revenue of the participating companies shows that a higher portion of larger companies were able to use B2B managed services to better meet and respond to changes in customer requirements, as 54 percent of large companies and 67 percent of very large companies strongly agreed or agreed with this statement, compared with 50 percent of small and medium companies (see Figure 32).
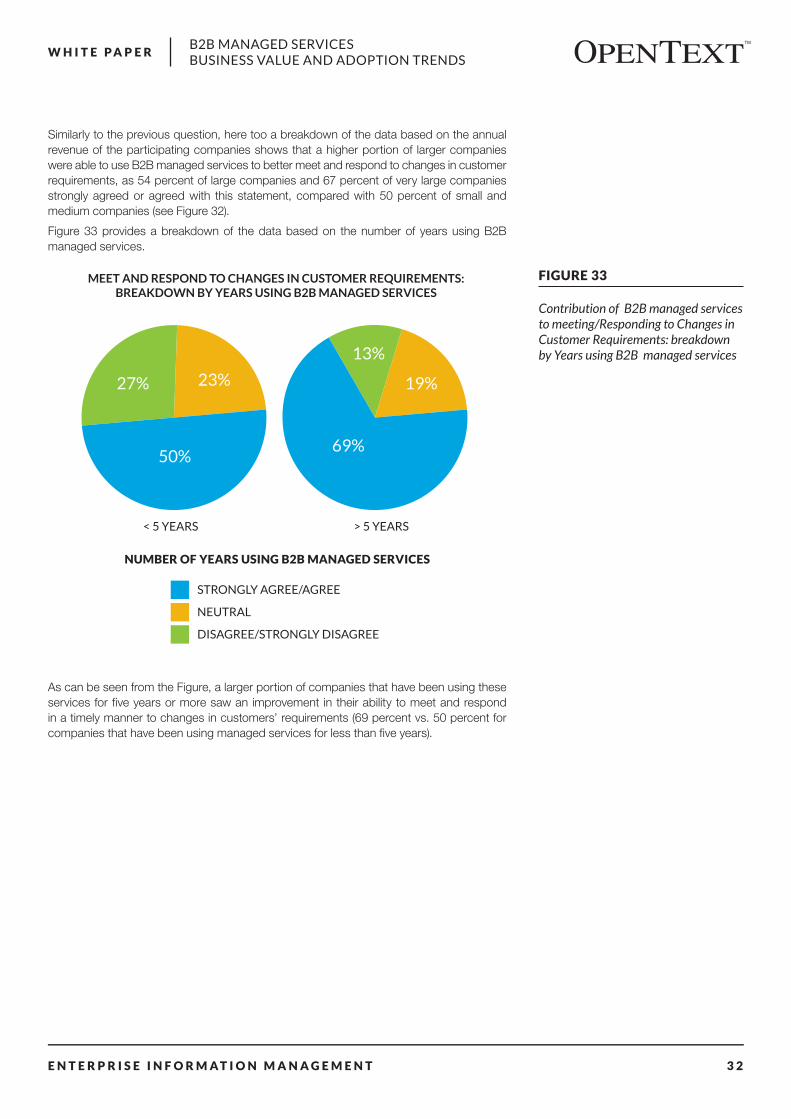
Figure 33 provides a breakdown of the data based on the number of years using B2B managed services.
FIGURE 33
Contribution of B2B managed services to meeting/Responding to Changes in Customer Requirements: breakdown by Years using B2B managed services
MEET AND RESPOND TO CHANGES IN CUSTOMER REQUIREMENTS: BREAKDOWN BY YEARS USING B2B MANAGED SERVICES
50%
23%27%
69%
13%
19%
NUMBER OF YEARS USING B2B MANAGED SERVICES
< 5 YEARS > 5 YEARS
STRONGLY AGREE/AGREE
NEUTRAL
DISAGREE/STRONGLY DISAGREE
As can be seen from the Figure, a larger portion of companies that have been using these services for five years or more saw an improvement in their ability to meet and respond in a timely manner to changes in customers’ requirements (69 percent vs. 50 percent for companies that have been using managed services for less than five years).
E N T E R P R I S E I N F O R M A T I O N M A N A G E M E N T 3 3
B2B MANAGED SERVICES BUSINESS VALUE AND ADOPTION TRENDS
W H I T E P A P E R
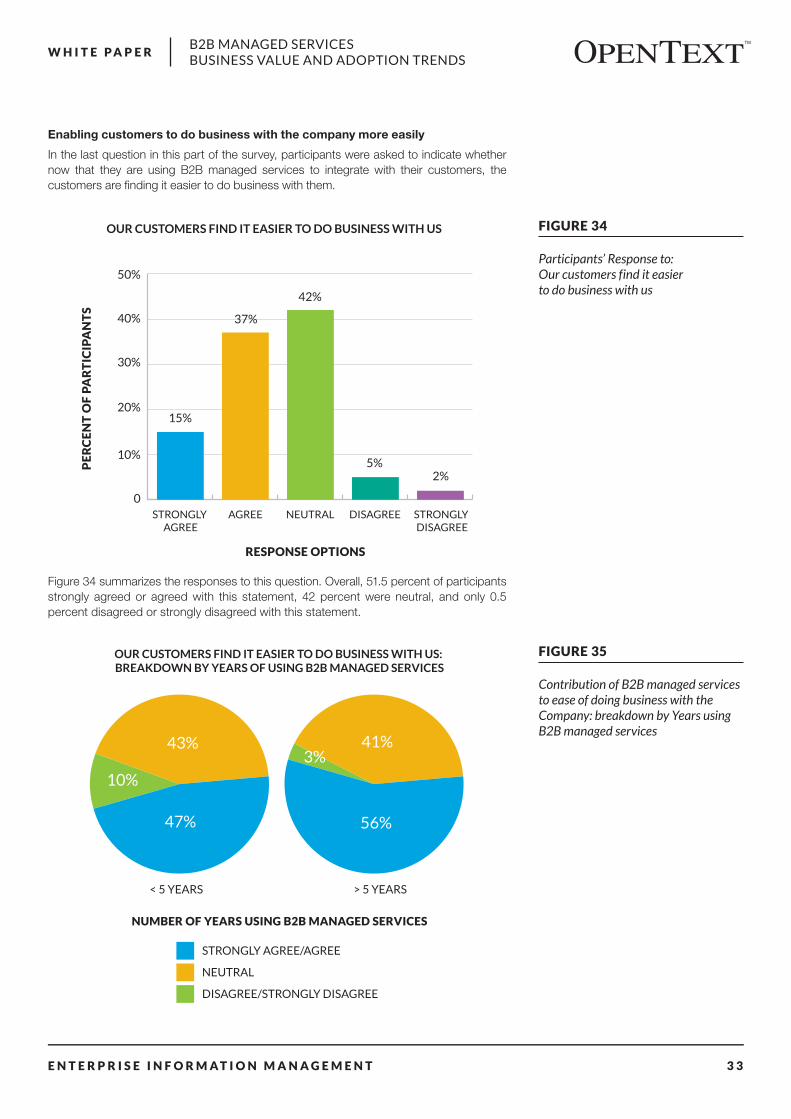
Enabling customers to do business with the company more easily
In the last question in this part of the survey, participants were asked to indicate whether now that they are using B2B managed services to integrate with their customers, the customers are finding it easier to do business with them.
FIGURE 34
Participants’ Response to: Our customers find it easier to do business with us
OUR CUSTOMERS FIND IT EASIER TO DO BUSINESS WITH US
PE
RC
EN
T O
F P
AR
TIC
IPA
NT
S
STRONGLY DISAGREE
DISAGREENEUTRALAGREESTRONGLY AGREE
RESPONSE OPTIONS
10%
20%
30%
40%
50%
0
37%
42%
5%2%
15%
Figure 34 summarizes the responses to this question. Overall, 51.5 percent of participants strongly agreed or agreed with this statement, 42 percent were neutral, and only 0.5 percent disagreed or strongly disagreed with this statement.
FIGURE 35
Contribution of B2B managed services to ease of doing business with the Company: breakdown by Years using B2B managed services
OUR CUSTOMERS FIND IT EASIER TO DO BUSINESS WITH US: BREAKDOWN BY YEARS OF USING B2B MANAGED SERVICES
47%
43%
10%
56%
3%41%
NUMBER OF YEARS USING B2B MANAGED SERVICES
< 5 YEARS > 5 YEARS
STRONGLY AGREE/AGREE
NEUTRAL
DISAGREE/STRONGLY DISAGREE
E N T E R P R I S E I N F O R M A T I O N M A N A G E M E N T 3 4
B2B MANAGED SERVICES BUSINESS VALUE AND ADOPTION TRENDS
W H I T E P A P E R
A breakdown of the data based on the number of years using B2B managed services (Figure 35) shows that a larger portion of those companies that have been using managed services for five years or more found these services helpful in making it easier for their customers to do business with them (56 percent vs. 47 percent for companies that have been using these services for less than five years).
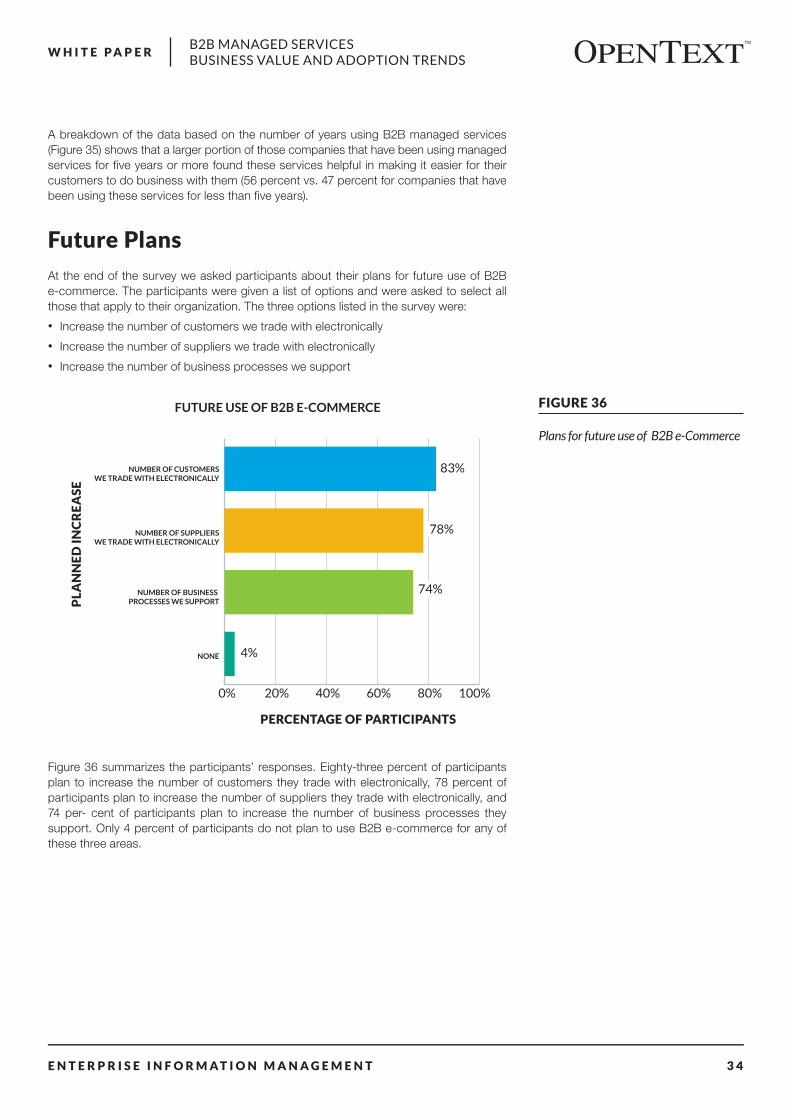
Future Plans
At the end of the survey we asked participants about their plans for future use of B2B e-commerce. The participants were given a list of options and were asked to select all those that apply to their organization. The three options listed in the survey were:
• Increase the number of customers we trade with electronically
• Increase the number of suppliers we trade with electronically
• Increase the number of business processes we support
FIGURE 36
Plans for future use of B2B e-Commerce
FUTURE USE OF B2B E-COMMERCE
0% 20% 40% 60% 80% 100%
NONE
NUMBER OF BUSINESS PROCESSES WE SUPPORT
NUMBER OF SUPPLIERSWE TRADE WITH ELECTRONICALLY
NUMBER OF CUSTOMERSWE TRADE WITH ELECTRONICALLY
PLA
NN
ED
INC
RE
ASE
PERCENTAGE OF PARTICIPANTS
74%
78%
83%
4%
Figure 36 summarizes the participants’ responses. Eighty-three percent of participants plan to increase the number of customers they trade with electronically, 78 percent of participants plan to increase the number of suppliers they trade with electronically, and 74 per- cent of participants plan to increase the number of business processes they support. Only 4 percent of participants do not plan to use B2B e-commerce for any of these three areas.
E N T E R P R I S E I N F O R M A T I O N M A N A G E M E N T 3 5
B2B MANAGED SERVICES BUSINESS VALUE AND ADOPTION TRENDS
W H I T E P A P E R
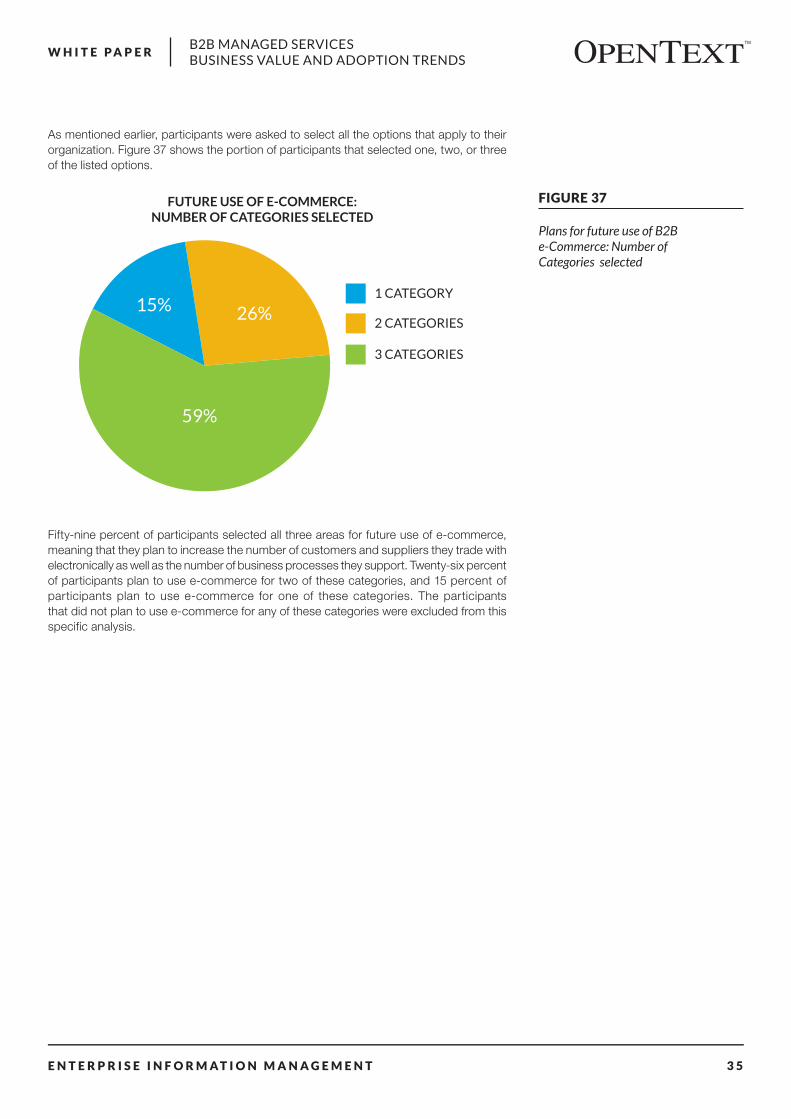
As mentioned earlier, participants were asked to select all the options that apply to their organization. Figure 37 shows the portion of participants that selected one, two, or three of the listed options.
FIGURE 37
Plans for future use of B2B e-Commerce: Number of Categories selected
FUTURE USE OF E-COMMERCE: NUMBER OF CATEGORIES SELECTED
59%
15% 26%1 CATEGORY
2 CATEGORIES
3 CATEGORIES
Fifty-nine percent of participants selected all three areas for future use of e-commerce, meaning that they plan to increase the number of customers and suppliers they trade with electronically as well as the number of business processes they support. Twenty-six percent of participants plan to use e-commerce for two of these categories, and 15 percent of participants plan to use e-commerce for one of these categories. The participants that did not plan to use e-commerce for any of these categories were excluded from this specific analysis.
E N T E R P R I S E I N F O R M A T I O N M A N A G E M E N T 3 6
B2B MANAGED SERVICES BUSINESS VALUE AND ADOPTION TRENDS
W H I T E P A P E R
5.Summary
Recent developments in B2B integration technologies, coupled with an expansion of the range of services offered by B2B managed services providers and new levels of maturity these providers achieved, have increased demand for managed services as companies look to enhance their B2B operations. This report summarizes the results of a study, launched in 2012, which examined the latest trends and business value associated with B2B man- aged services.
The results of the survey provide some valuable insights. B2B managed services have reached a certain level of maturity, as close to half of the participants have been using these services for five years or more, often in more than one geographic region.
The most important business drivers behind the companies’ original decision to start using B2B managed services were improved customer experience, improved business process efficiency, and reduction in IT costs. Therefore it is not surprising that companies have been using B2B managed services most frequently for integration with their customers, followed by suppliers, logistics service providers, and financial institutions. For almost all companies, B2B managed services increased the value of their B2B integration program, usually while reducing costs or keeping them unchanged. B2B managed services brought a variety of other benefits to the participating companies, including the ability to streamline expenses and improve budget planning as well as the ability to improve global trading community management and support. It is important to note that it may take time for companies to realize these benefits, as our analysis shows that often times a larger portion of companies that have been using B2B managed services for five years or more were able to realize their associated benefits, compared with companies that have been using these services for less than five years. Other parameters, such as the percent-age of the B2B program supported by a managed services provider, and the size of the company, may also have an impact on the likelihood of realizing some of these benefits.
As for plans for the future, the vast majority of the participating companies indicated that they plan to further expand their use of B2B e-commerce in the future, by increasing the number of customers they trade with electronically, the number of suppliers they trade with electronically, and/or the number of business processes they support. This is yet another indication to the value that companies see in B2B managed services, and in their overall B2B integration programs.
E N T E R P R I S E I N F O R M A T I O N M A N A G E M E N T 3 7
B2B MANAGED SERVICES BUSINESS VALUE AND ADOPTION TRENDS
W H I T E P A P E R
Acknowledgements
The authors would like to thank all the companies that participated in this study for their time and effort to complete the survey and share with us their experiences with B2B integration technologies and managed services. Their inputs were instrumental to the success of the study.
Contribution and financial support from OpenText is greatly acknowledged.
About the Authors
Barchi Gillai has 15 years of experience in the areas of supply chain management and operations management. Over the years, she successfully completed numerous research projects, many of them in collaboration with Fortune 500 companies and large interna-tional organizations. Dr. Gillai has authored several articles, book chapters, white papers, and teaching cases. She earned her Ph.D. in Management Science and Engineering, and her Master’s degree in Industrial Engineering and Engineering Management, at Stanford University. She earned her B.Sc. in Industrial Engineering and Management at the Tech-nion—Israel Institute of Technology. Dr. Gillai can be reached at [email protected].
Tao Yu is a Research Assistant with the Stanford Global Supply Chain Management Forum. He earned his bachelor’s degree in Industrial and Operations Engineering at University of Michigan, Ann Arbor, and is pursuing his Master’s degree in Management Science and Engineering at Stanford University. Prior to his arrival at Stanford University, Tao worked as an intern for a number of companies, including Honeywell and HSBC among others, where he became familiar with B2B e-commerce services and developed his interests in supply chain and operations management. After graduation, Tao plans to work for an education startup company based in New York City and will be responsible for its marketing and operations in Shanghai, China. Tao can be reached at [email protected].
About the Stanford Global Supply Chain Management Forum
Housed within the Stanford Graduate School of Business, the Global Supply Chain Management Forum works in partnership with academic, corporate, and nonprofit orga-nizations to identify, research, develop, and disseminate supply chain best practices within a dynamic, global business environment. Forum membership is open to industry leaders with a common interest in advancing the state of the art in global supply chain management. Member organizations have access to a unique and high-level professional network of supply chain experts and research. To learn more about the Forum, please contact Shoshanah Cohen ([email protected])
About OpenText
OpenText enables the digital world by simplifying, transforming, and accelerating enterprise information needs, on premises or in the cloud. For more information about OpenText (NASDAQ: OTEX, TSX: OTC) visit opentext.com.
Connect with us:
• OpenText CEO Mark Barrenechea’s blog
• Twitter | LinkedIn | Facebook
E N T E R P R I S E I N F O R M A T I O N M A N A G E M E N T 3 8
B2B MANAGED SERVICES BUSINESS VALUE AND ADOPTION TRENDS
W H I T E P A P E R
AppendixB2B e-Commerce Questionnaire
RESPONDENT INFORMATION
Please fill out the following information:
1. Company Name:
2. BU/Division (optional):
3. Respondent Name:
4. Email address: (required to receive a copy of the final report)
5. Phone number (optional):
6. Please indicate below the primary industry for your B2B program:
CPG Financial Services Logistics
Manufacturing (Auto, High Tech, General)
Retail Other (please indicate):
YOUR OVERALL B2B INTEGRATION PROGRAM
1. What is your company’s total estimated annual budget for B2B integration technologies including personnel, hardware, software, network fees, consultants and external vendors?
Less than $1M $1M to < $2M $2M to < $5M
$5M to < $10M $10M to < $20M More than $20M
2. What percentage of your company’s overall IT budget do you estimate is spent on B2B integration?
Less than 1% 1-5% 6-10%
11-15% 16-20% More than 20%
3. How has your company’s overall budget for B2B integration technologies changed over the past three years?
Increased by more than 20% Increased by 11-20% Increased by 0-10%
No Change Decreased by 0-10% Decreased by 11-20%
Decreased by more than 20%
4. What is the forecasted growth of your company’s B2B budget to meet the changing requirements over the next three years?
Increasing by more than 20% Increasing by 11-20% Increasing by 0-10%
No Change q Decreasing by 0-10% Decreasing by 11-20% Decreasing by more than 20%
5. By what percentage do you anticipate your company’s B2B transaction volumes will change over the next three years?
Increasing by more than 200% Increasing by 101-200% Increasing by 51-100%
Increasing by 26-50% Increasing by 0-25% Not Increasing
6. By what percentage do you anticipate your company’s number of B2B connections will increase over the next three years?
Increasing by more than 200% Increasing by 101-200% Increasing by 51-100%
Increasing by 26-50% Increasing by 0-25% Not Increasing
E N T E R P R I S E I N F O R M A T I O N M A N A G E M E N T 3 9
B2B MANAGED SERVICES BUSINESS VALUE AND ADOPTION TRENDS
W H I T E P A P E R
YOUR CONNECTIONS
1. What percentage of your company’s customers exchange transactions with you electronically (EDI, XML, web portals and other forms of electronic commerce)?
0-20% 21-40% 41-60% 61-80% 81-100%
2. What percentage of your company’s vendors/suppliers exchange transactions with you electronically?
0-20% 21-40% 41-60% 61-80% 81-100%
3. What percentage of your company’s other business partners (e.g., logistics providers, financial institutions, insurers exchange transactions with you electronically?
0-20% 21-40% 41-60% 61-80% 81-100%
4. What percentage of all your company’s B2B transactions are exchanged using structured messages such as EDI, XML or SWIFT messages (versus being keyed into a web portal)?
0-20% 21-40% 41-60% 61-80% 81-100%
PROCESS EFFICIENCY IMPROVEMENTS
If your company belongs to the Financial Services or Energy industries, please check this box and skip questions 1-3 below.
1. The cost of processing an order received electronically (via EDI, XML, etc.) as compared to orders received via email, fax, phone or mail is:
0-10% lower 11-20% lower 21-30% lower 31-40% lower 41-50% lower
51-60% lower 61-70% lower 71-80% lower 81-90% lower 91-100% lower
N/A
2. The use of ASNs and barcode/RFID labels to receive shipments into my company’s distribution centers, stores or manufacturing plants reduces our costs to manage incoming shipments (e.g., cost related to planning receiving resources, DC setup and ability to cross-dock) by:
0-10% lower 11-20% lower 21-30% lower 31-40% lower 41-50% lower
51-60% lower 61-70% lower 71-80% lower 81-90% lower 91-100% lower
N/A
3. The cost of processing an invoice received electronically (via EDI, XML) as compared to invoices received via paper, fax, email or PDF is:
0-10% lower 11-20% lower 21-30% lower 31-40% lower 41-50% lower
51-60% lower 61-70% lower 71-80% lower 81-90% lower 91-100% lower
N/A
ABOUT YOUR B2B MANAGED SERVICES PROGRAM
B2B Managed Services is the combination of outsourcing your technical B2B infrastructure and the people and processes necessary to manage your B2B operations and trading partner connections.
1. For how many years has your company been using B2B Managed Services for some or all of its B2B operations?
Less than 2 years 2 – 4 years 5 – 6 years More than 6 years
2. Please indicate the geographic location(s) of your Managed Services program (select all that apply).
Americas EMEA Asia Pacific
E N T E R P R I S E I N F O R M A T I O N M A N A G E M E N T 4 0
B2B MANAGED SERVICES BUSINESS VALUE AND ADOPTION TRENDS
W H I T E P A P E R
3. What were the primary business drivers behind your company’s original decision to use B2B Managed Services? (Please choose top three and rank in order of importance.)
a. Pending upgrade to an enterprise application (e.g., ERP, core banking system or other)
b. Support global expansion into new markets
c. Divestiture, merger or acquisition
d. Need to reduce IT costs
e. Desire to consolidate multiple B2B programs onto single platform
f. Improve business process efficiency in supply chain, payment processing, etc.
g. Need to replace/retire aging B2B platform with modern capabilities
h. Improve customer experience (e.g., accelerate on-boarding times, offer more flexibility)
i. C-Level strategy to outsource more IT functions
4. What percentage of your company’s overall B2B integration program is supported by a B2B Managed Services vendor today?
0-20% 21-40% 41-60% 61-80% 81-100%
5. For which trading partner categories does your company use B2B Managed Services? Check all that apply.
Suppliers/Vendors Customers Logistics Service Providers Financial Institutions Insurers
BENEFITS OF B2B MANAGED SERVICES
The following section includes a list of potential benefits associated with B2B Managed Services. Please indicate whether your company has experienced these benefits, by selecting for each question one of the options: “Strongly Agree”, “Agree”, “Neutral”, “Disagree”, “Strongly Disagree” or “Not Applicable”.
FINANCIAL
1. The ability to replace capital expenditures for server hardware, storage devices, software licenses and maintenance fees with an ongoing monthly fee (e.g., operating expense) for B2B Managed Services is of value to my company.
Strongly Agree Agree Neutral Disagree Strongly Disagree
2. The use of B2B Managed Services has enabled my company to reduce costs associated with performing functions such as developing maps, onboarding business partners and providing technical support.
Strongly Agree Agree Neutral Disagree Strongly Disagree
3. Which of the following best describes the value of B2B Managed Services for your company:
Decreased cost with Increased value Same cost with Increased value
Increased cost with Increased value Decreased cost with Decreased value
4. After switching to B2B Managed Services my company was able to redeploy some of our IT staff to other projects or roles.
Strongly Agree Agree Neutral Disagree Strongly Disagree
5. Planning for the B2B budget and resources has improved due to the predictability of our B2B Managed Services costs (e.g., predictable monthly payment to external B2B Managed Services providers).
Strongly Agree Agree Neutral Disagree Strongly Disagree
TRADING COMMUNITY MANAGEMENT AND SUPPORT
1. Use of B2B Managed Services has improved the level of local languages, standards and regulations support for business partners located in other countries.
Strongly Agree Agree Neutral Disagree Strongly Disagree
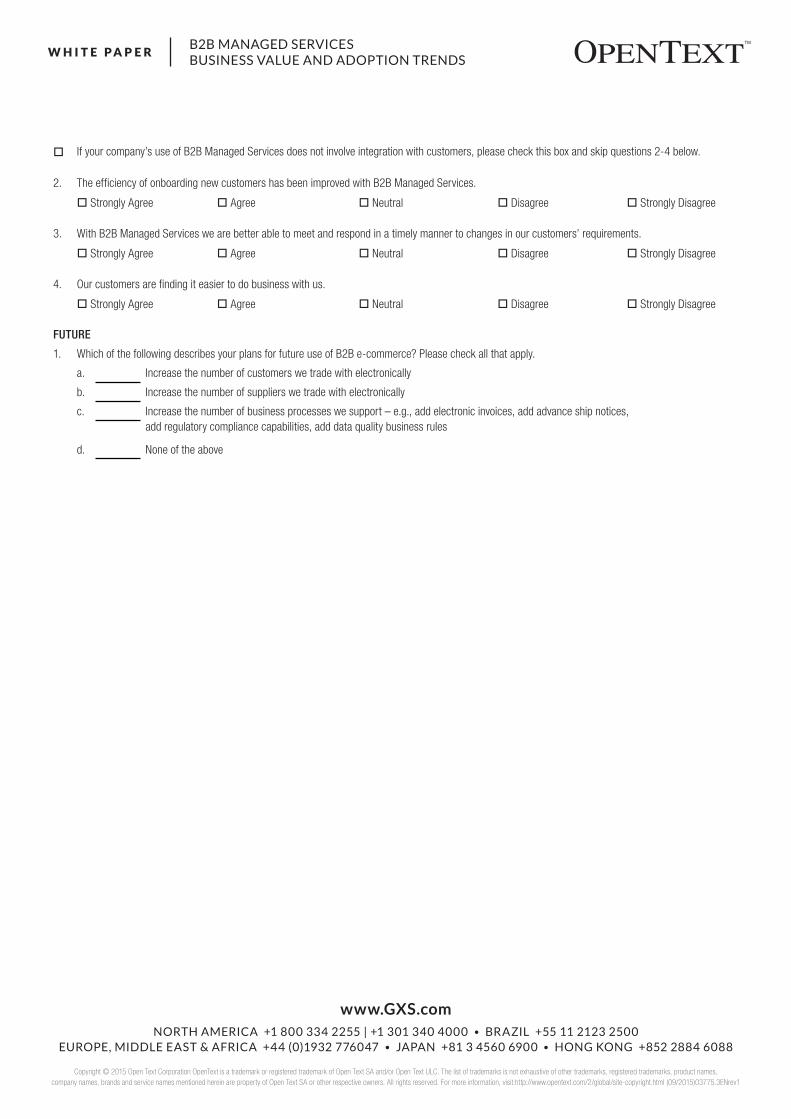
www.GXS.com NORTH AMERICA +1 800 334 2255 | +1 301 340 4000 • BRAZIL +55 11 2123 2500
EUROPE, MIDDLE EAST & AFRICA +44 (0)1932 776047 • JAPAN +81 3 4560 6900 • HONG KONG +852 2884 6088
Copyright © 2015 Open Text Corporation OpenText is a trademark or registered trademark of Open Text SA and/or Open Text ULC. The list of trademarks is not exhaustive of other trademarks, registered trademarks, product names, company names, brands and service names mentioned herein are property of Open Text SA or other respective owners. All rights reserved. For more information, visit:http://www.opentext.com/2/global/site-copyright.html (09/2015)03775.3ENrev1
W H I T E P A P E RB2B MANAGED SERVICES BUSINESS VALUE AND ADOPTION TRENDS
If your company’s use of B2B Managed Services does not involve integration with customers, please check this box and skip questions 2-4 below.
2. The efficiency of onboarding new customers has been improved with B2B Managed Services.
Strongly Agree Agree Neutral Disagree Strongly Disagree
3. With B2B Managed Services we are better able to meet and respond in a timely manner to changes in our customers’ requirements.
Strongly Agree Agree Neutral Disagree Strongly Disagree
4. Our customers are finding it easier to do business with us.
Strongly Agree Agree Neutral Disagree Strongly Disagree
FUTURE
1. Which of the following describes your plans for future use of B2B e-commerce? Please check all that apply.
a. Increase the number of customers we trade with electronically
b. Increase the number of suppliers we trade with electronically
c. Increase the number of business processes we support – e.g., add electronic invoices, add advance ship notices, add regulatory compliance capabilities, add data quality business rules
d. None of the above