b6 - system design report - flire.eu b6: dss tools system design report ... e-mail...
TRANSCRIPT

LIFE11 ENV GR 975 FLIRE: Floods and fire Risk assessment and management
Action B6: DSS Tools
System Design Report
28/02/2014
Project location Greece – Attiki region
Project starting date: 01/10/2012
Project ending date: 30/09/2015
Coordinating Beneficiary National Technical University of Athens
Associated Beneficiary
responsible for Action B6
FORTH
Contact person Dr. Nektarios Chrysoulakis
Postal address Foundation for Research and Technology - Hellas
Institute of Applied and Computational Mathematics
Regional Analysis Division, 100 N. Plastira Str., Vassilika Vouton,
70013, Heraklion, Crete, Greece
Telephone 0030 2810 391762
Fax : 0030 2810 391761
E-mail [email protected]
Other Associated Beneficiaries
involved in Action B6
NTUA, ALGOSYSTEMS, ICL, NOA, IRPI-CNR
Authors of the report FORTH: Dimitris Poursanidis, Giorgos Kochilakis, Nektarios
Chrysoulakis.
NTUA: George Karavokiros, Chrysoula Papathanasiou.
ALGO: Vassiliki Varella, George Eftychidis.
NOA: Vasiliki Kotroni, Kostas Lagouvardos.

2
Table of Contents
System Design Report ...................................................................................................... 1
Executive Summary .......................................................................................................... 6
1. Introduction ................................................................................................................... 9
1.1. DSS system - General information ............................................................................... 10
1.2. FLIRE DSS System architecture .................................................................................. 15
2. Weather Information Management Tool (WIMT) .................................................... 17
2.1. NOA Forecast Data - NoaForecastData tool ................................................................ 19
2.2. Available Weather Forecast Data Catalogs service (AWFDCS) ............................. 24
2.2.1. Catalog of months with available forecast data ........................................... 25
2.2.2. Catalog of dates of a specific month with available weather forecast data . 28
2.2.3. Catalog of hours of a specific date with available weather forecast data .... 32
2.3. Meteorological stations data - HOA System - Description ........................................... 36
2.3.1. Monitoring and Forecasting System ............................................................. 38
2.3.2. FLIRE monitoring network ............................................................................ 38
2.3.3. Tool get_noa_meteo .................................................................................... 39
2.3.4. Tool loggertodb ............................................................................................ 40
2.3.5. Hydrometeorological data exchange ............................................................ 41
2.4. Weather Forecast Data Distribution ......................................................................... 44
3. Flood Risk Assessment System (FLORAS) ............................................................... 49
3.1. General information ...................................................................................................... 49
3.3. Scenario Management Module ..................................................................................... 51
Preparation of the hydrological modelling .............................................................. 52
Run of the Catchment Hydrological Model ............................................................. 53
Run of the Catchment Hydraulic Model ................................................................. 53
Post processing and visualization of the results .................................................... 54
3.4. Catchment Hydrological Model ..................................................................................... 55
3.5. Catchment Hydraulic Model ......................................................................................... 58
3.6. Early Flood Warning System (EFWS) .......................................................................... 59
3.6. Resources Requirements ............................................................................................. 60
4. Fire Behavior Modeling and Simulation System – Fire Danger Mapping
System. .......................................................................................................................... 61
4.1. General information .................................................................................................... 61
4.2.Forest fire modeling and simulation (G-FMIS)............................................................... 63
4.3. KBDI web service ........................................................................................................ 69
4.4. Static Map Overlays Rendering - File Map Tile Creator (FMTC) ............................ 72
5. DSS Server - FLIRE GUI ........................................................................................... 77
5.1. Tab A. ........................................................................................................................... 78
5.2. Tab B. ........................................................................................................................... 80

3
5.3. Tab C. ........................................................................................................................... 88
5.4. Tab D. ........................................................................................................................... 93
5.5. Tab E. ......................................................................................................................... 102
6. Conclusions ............................................................................................................. 108
7. Literature .................................................................................................................. 109
APPENDIX .................................................................................................................... 113
gfmis_dss Service Request Example ................................................................................ 114
gfmis_dss Service Response xml Example ....................................................................... 115
gfmis Output Points Display............................................................................................... 116
Available Weather Forecast Data Catalogs Service. Requests and Responses
Examples ........................................................................................................................... 118
Catalog of months with available weather forecast data ...................................... 118
Catalog of dates of a specific month with available weather forecast data ......... 119
Catalog of hours of a specific date (of a specific month) with available weather
forecast data ......................................................................................................... 120
Description of Gfmis WEB Service ....................................................................... 121

4
Citation: Giorgos Kochilakis, Dimitris Poursanidis, Nektarios Chrysoulakis
George Karavokiros, Chrysoula Papathanasiou, Vassiliki Varella,
George Eftychidis, Vasiliki Kotroni & Kostas Lagouvardos. 2014.
System Design Report. LIFE11 ENV GR 975 FLIRE: Floods and fire
Risk assessment and management. 101 pages + APPENDIX.

5

6
Executive Summary
Within the FLIRE project, a Decision Support System which aims at the
combined, effective and robust risk assessment and management of both flash
floods and forest fires, has been designed. Using state of art tools, technologies
and methods and taking into account prevention, adaptation and interaction
issues, this tool will become a valuable alliance for the Civil Protection
Authorities, Fire department services and Forest service's of the project area.
The area of application of this approach is the peri-urban environment of the
Eastern Attica region (Greece). This typically Mediterranean area, with
extensive assets and lives at risk, that extends over approximately 200 km2
underwent rapid and uncontrolled urbanization during the last decades and is
particularly prone both to flash floods and forest fires resulting in its gradual but
dire ecological degradation. This degradation has significant consequences for
the almost 5 million inhabitants of Athens, who rely on these areas for
recreation, contact with nature and quality of life.
The main components of the FLIRE DSS include:
- The Weather Information Management Tool (WIMT): This tool will
receive and manage the short-term weather forecasting information
provided by NOA as well as the real time weather data from weather
stations in the project area, provided by NTUA's HOA system [air
temperature (in °C), relative humidity (in %), wind speed (in km/h), wind
direction (in °), rainfall (in mm). height (in meters)]. The tool will provide
to the fire and flood models the appropriate weather information in order
to calculate the extension of a fire case or the level of flood in the project
area. Also, it has the potential to serve the forecast data in order to be
used for "what-if" scenarios when the forecast information classify the
area as prone to fire during the drought summer period or prone to flood
during the winter period.
- The Flood Risk Assessment System (FLORAS): This tool will provide all
the available weather information data to the catchment modelling tool
as well as to the urban modelling tool in order to calculate the flood level
in the rural/natural part of the area as well as in the urban area in the
east part of the area. After the calculation of the flood areas, data in

7
KML format are provided to the FLIRE DSS by using http services and
these are visualized on the webGIS component of the tool. Data for the
floods are calculated from weather forecast data and the real time
weather data are used for the trigger of the Early Warnings that are
communicated to the local stakeholders.
- Early Fire Warning System (EFWS): This tool constitutes of two
components, the Geographic Fire Management Information System
(GFMIS) and the Keetch-Byram Drought Index (KBDI). G-FMIS is the
Forest Fire Management model which includes a forest fire simulator,
based on the BEHAVE fire behavior model. It uses a modified version of
the shortest path algorithm adapting it to the simulation of forest fire
propagation. G-FMIS was redesigned as a Web-service and is used by
the FLIRE WIS for providing fire risk assessment and fire propagation
simulations. It utilizes forest fuel maps, as a prerequisite of forest fire
propagation simulation and fire behavior assessment. For the operation
of the G-FMIS, the user has to set the fire ignition point (or points) at the
location (locations) of interest and then to update the system with the
information from the weather stations that are in the project area. Also,
the user can include more stations, outside but close to the boarders of
the project area in order to predict more accurate the fire behavior. For
the "what-if" scenarios development, the user can parameterize the DSS
based on the information provided by the weather forecast model.
Scenarios can be built either for the running and next day nor for
previous days datasets, in order to simulate the behavior of a fire case
that occurs in the area but was efficient eliminated. All the above are the
necessary inputs for the fire model. After these necessary steps, the
user sends a request to the G-FMIS system and within the predefined
waiting time, the fire model runs and returns a simulation on the spread
of the fire. KBDI is a cumulative index that provides indication
concerning the conditions contributing to the flammability of the
vegetation and its daily variation due to meteorological conditions. It is a
soil/duff drought index that ranges from 0 (no drought) to 800 (extreme
drought) and it is based on the soil capacity in 8 inches (200 mm) of
water. The depth of soil required to hold 8 inches of moisture varies.
This index is cumulative, based on the previous day value and it is
calculated once per day, every morning, for each station that is located
within the area of interest, using the meteorological data of the previous

8
twenty-four hours. This index is also calculated by using the weather
forecast data, for the implementation of a "what-if" scenario.
- FLIRE Server and GUI: The FLIRE Server unify the components of the
system and therefore are accessible via the GUI from the FLIRE web
site (www.flire.eu) for authorizes users such as the Civil Protection
Authorities, Fire department services and Forest services. Having as the
backbone a windows-based server, the FLIRE WIS tools are
implemented in six tabs, each one playing a different role in the system:
� Spatial data visualization board - Map (A)
� Weather Forecast Data (B )
� Weather Stations (C)
� Fire Management System (D)
� KBDI control board (E)
� Floodplain Data (F)
Innovations of the DSS system are the application of the principle "collect once,
use for many" as this is applied to the collected base data (weather, landcover,
fuel map), the distributed architecture of the components, as these are
geographically and physically in different areas and the access of the tool by
any mean of computer sources. Data are used for both fire and flood modelling
and also are available via xml format for other applications. The communication
is achieved by converting the models into web services and utilizing the weather
data (forecast and real time) by means of ftp and http services. The accessibility
of the system is achieved by any means of computer source like PC, laptops,
tablets and smartphones as is a web based system, assessable from a simple
web browser without any requirement for the installation of any licenses and
add-ons on it.

9
1. Introduction
The aim of this action is to develop and implement a web-based Spatial
Decision Support System (S-DSS) which will combine information from different
model outputs (fire and flood models) and create early warning informations
such as fire warnings, fire propagation simulations, flood warnings and flood
inundation maps for the local authorities and civil protection departments. This
information is crucial and important for the safety of humans and their properties
in the urban/periurban environments during both natural disasters, i.e. fires and
floods as it will help the decision makers, the civil protection mechanisms and
fire managers to plan a timely response to the problem.
Web-based DSS systems remain less common nowadays especially in
the area of civil protection while the World Wide Web technologies can provide
integrated platforms for the design, development, implementation and
deployment of such Decision Support Systems. Current DSS systems provide
to the end users a broad range of capabilities and decision tasks like
information gathering and analysis, model building, sensitivity analysis,
collaboration, alternative evaluation, decision implementation, spatial analysis
and spatial visualization (Bhargava et al., 2007).
Also, by using the web-based approach, DSS systems become more
flexible as all the components of the system are located on the web, distributed
in different locations while the calculations for the outputs and the results of the
models are running "on the fly". That means that the models have been
optimized in order to run really fast. The information, that the responsible for the
confrontation of natural disasters will receive, will be available in a manner of
real time response.
The system has a distributed architecture, thus each of the component is
in a different geographic location, to the FLIRE partners permissions. It has
been developed using programming languages such as JAVA, Visual Basic and
Python and free and open source tools (e.g., MapServer, Google API, Python
libraries, Hydrological models). It is compatible with all available web-browsers
(Internet Explorer, Mozilla Firefox, Google Chrome, Safari) and accessible by all
common operating systems (Windows, Linux, Macintosh). Meanwhile, by
incorporating the web-based technology, this system could be available even in

10
the field, early before or during the disasters by using smartphones and tablet
pc's.
1.1. DSS system - General information
By using the term "Decision Support System (DSS)" we mean a
computer-based information system which has the efficiency to support
business or organizational decision-making activities. In this decision support
system environment the computer is rather the “silent partner” (Simonovic,
1996; 1996a). The main factor responsible for involving computers in
decision-making is the treatment of information as the sixth resource (besides
people, machines, money, materials and management).
DSSs can provide services for the management, operations, and planning
levels of an organization and help to make decisions. Such decisions can be
rapidly changing and not easily specified in advance. DSS introduce multiple
inter-disciplinary aspects into the planning process in complex decision
environments by adding the geospatial domain (Chrysoulakis et al., 2010). The
basis of geospatial decision support is the Geographic Information Systems
(GIS) that includes data management, graphic display and spatial analysis
functions. Beyond these common GIS decision aids, special features may also
be included like optimization, statistical and spatial interaction functions
(Nyerged T., 2010). Decision support systems can be either fully computerized,
fully human controlled or a combination of both.
While academics have recognized DSS as a tool to support decision
making process, DSS users see them as a tool to facilitate organizational
processes. Some authors have extended the definition of DSS to include
any system that might support decision making. Sprague (1980) defines DSS
by its characteristics:
• DSS tends to be aimed at the less well structured,
underspecified problem that upper level managers typically face.
• DSS attempts to combine the use of models or analytic techniques
with traditional data access and retrieval functions.
• DSS specifically focuses on features which make them easy to use
by non-computer people in an interactive mode.

11
• DSS emphasizes flexibility and adaptability to accommodate
changes in the environment and the decision making approach of
the user.
An efficiently planned DSS is an interactive software-based system
intended to help decision makers compile useful information from a combination
of raw data, documents, personal knowledge, and models (business or
scientific) to identify and solve particular problems and make decisions in order
to eliminate them.
The fundamental components of a DSS system (Spraque et al., 1982,;
Marakas, 1999; Haag et al., 2000; Bohner, 2006) are:
1) the database or the database management system (DBMS).
2) the model (the decision context and user criteria) or the model
based management system (MBMS).
3) the user interface which is usually a standalone software on a
personal computer (PC) or a web - based Graphical User
Interface (GUI) which is accessible via any web browser from
any platform.
The database or the database management system (DBMS) is used for
the storage of the data, input and handling. The model based management
system (MBMS) is used for the storage or the management of the models, in
cases that the system has a distributed architecture. The last component is
crucial in several DSS systems as it provides the freedom of the accessibility
from any operating system (Windows, Linux, Macintosh). GUIs usually do not
require significant resources (e.g. computational power) since the actual
workload is carried out by servers of a distributed system (distributed decision
support systems).
Nowadays the revolution in communication networks (3G, 4G cellular
networks) and digital media (smartphones, tablets) has changed the original
concept of modules implemented within a Commercial-Off-The-Shelf (COTS)
software or a closed software which includes all the components of the system.
Yet, the elements of a system can be distributed systems in different remote
locations. By using this architecture, the use of virtual structures is obvious,
permitting the use of information and models from their original storage devices,
reducing expenses for data capture, integration and management. A

12
disadvantage of such an architecture could be security issues of data access
and the difficulties deriving from the division of responsibilities for information
and system maintenance and of growing challenges of a user-friendly GUI.
DSS systems have four primary characteristics:
• help decision-makers at the upper levels
• are flexible and respond quickly to questions
• provide "what-if" scenarios and
• consider the specific requirements of the decision makers.
DSS systems are popular in several fields like water resources
management (Koutsogiannis et al., 2003), renewable resources management
(Giupponi et al., 2013), environmental management (McIntosh et al. 2011), fire
management (Kalabokidis et al., 2012) and floods management (Hongai et al.,
2011). Vital is the application in the areas of fire and flood management where
the early detection of the ignition of the fire or the early warning on the flood
event are crucial for the human live and the destruction of properties and
assets.
Floods and forest fires can be classified among the most devastating
natural disasters, the occurrence of which is related with severe socioeconomic
impacts, including loss of human lives, health and quality of life degradation,
destruction of private and public property and disruption of economic activities.
Both disasters have considerable aesthetic impacts and often threaten the
cultural heritage of the affected areas. At the European level, flood events are
the most frequently reported natural disasters, affecting 25% more people than
any other type of natural disaster (Prevention Web, 2011). On the other hand
economic damages resulting from wildfires (including for example the reduced
ability of a burnt forest to offer recreation opportunities) are also significant,
especially in Mediterranean regions, where their frequency is considerably high
(Eurostat, 2011).
Both disasters cause significant degradation of ecosystem services and
are especially high in the agenda of the European Environment Agency. This
ecological degradation becomes even more severe in the (quite usual) case of
combined action, i.e. a flood event becomes more probable and more
catastrophic when occurring in a formerly forested area that has been

13
devastated by wildfire. The occurrence and the extent of both natural disasters
strongly depend not only on the existing weather conditions in an area, but also
on human intervention, which is particularly pronounced in peri-urban areas and
can magnify the environmental impact. These phenomena have traditionally
been investigated separately, with separate systems collecting information and
modelling the resulting risk.
This approach overlooks two significant facts:
• the field data required in both cases are essentially the same, and hence
a “collect once – use for many purposes” paradigm can be adopted
resulting in increased accuracy and economies and,
• the phenomena are tightly interrelated, with forest fires exacerbating the
risk of flooding and preceding floods drastically reducing the risk of fires.
This implies that a combined approach to managing flood and fire risk
would achieve better, more realistic results at a decreased cost and thus have
considerable added value beyond current practice. The fact that end-users, in
the form of emergency services (e.g. fire brigades) are more often than not the
recipients of both warnings only strengthens the case for combined risk
assessment and management.
The aim of the FLIRE system is to change the paradigm for the
combined, effective and robust risk assessment and management of both flash
floods and forest fires, using state of art tools, technologies and methods and
taking into account prevention, adaptation and interaction issues. Meanwhile
this system will be based and built on the platform of the World Wide Web. The
study area covers the catchment basin of Rafina municipality, a peri-urban
environment (Figure 1). This typically Mediterranean area, with extensive assets
and lives at risk, that extends over approximately 200 km2 underwent rapid and
uncontrolled urbanization during the last decades and is particularly prone both
to flash floods and forest fires resulting in its gradual but dire ecological
degradation. This degradation has significant consequences for the almost 5
million inhabitants of Athens, who rely on these areas for recreation, contact
with nature and quality of life.

14
.
Figure 1. The study area of FLIRE project. With red the catchment basin of Rafina.

15
1.2. FLIRE DSS System architecture
FLIRE DSS system consists of different components which are combined
under a unified GUI. The system has a distributed architecture (figure 2), where
the different elements of the system are stored in different locations
(geographical isolated). By using FTP technology and web services, the DSS
system utilizes them.
Figure 2. The distributed architecture of FLIRE project. Each component is used via ftp
or web service from the GUI.
The FLIRE system consists of the following components (figure 3) which
have been designed for the purposed of this project:
• Weather Information Management Tool (WIMT) - service
• Flood Risk Assessment System (FLORAS) - service
• Fire Modeling and Danger mapping System (FiMDMSS) - service
• Web-based GUI (Graphical User Interface)

16
Figure 3. The architecture of the FLIRE system.
Near Real -time Forest Fire
Risk Assessment and
Management Tool
Web Browser
( Visualization )
Web Server
(service)
Flood Scenarios
( Database )
Maps description
Request
Weather Information
Management Tool
( WIMT) ( service )
Map s
R e que s t
APIs , (Google, Openlayers , etc ) Map coverages ,
Background maps
Near Real -time Flood Risk
Assessment System
(FLORAS)
Flood Risk Assessment
System (FLORAS) (service )
Scenario Matching
Tool
( service)
Short- term weather
forecasting
( Action B .5)
Flood risk
assessment
(Action B .3)
Forest fire risk
assessment and
mitigation planning
( Action B .4)
Fire behavior Modeling
Component (service )
FiMDMSS
(service )

17
2. Weather Information Management Tool (WIMT)
The role of the WIMT is to retrieve, handle, manage and utilize the
available weather data from the project partners (NOA & NTUA). These data
are provided from 3 different sources:
• Weather forecast data from the National Observatory of Athens (NOA)
• Meteorological stations from the National Observatory of Athens (NOA)
• Meteorological stations from the National Technical University of Athens
(NTUA)
For the weather forecast data, an operational Numerical Weather
Prediction (NWP) systems which consist of global atmospheric models run
typically at horizontal resolution ranging from 20 to 50 km and of mesoscale
limited area models with horizontal resolution ranging from 5 to10 km. MM5 is
the selected model for the purposes of the FLIRE project. It run operationally,
once per day, following a three- nest strategy with 24-km, 8-km and 2-km
horizontal grid increment (Kotroni et al., 2004). This modeling effort follows the
worldwide trend to use increasingly higher resolutions with NWP models at
operational basis, following the significant improvement of computing
capabilities at prices that are continuously decreasing.
Three one-way nested grids are defined and used at an operational basis
for the needs of FLIRE project (Fig. 1a). MM5 model is run once daily, initialized
at 0000 UTC. Grid 1 simulation lasts 72 hours, Grid 2 starts at t+6 with a total
simulation time of 66 h and finally Grid 3 starts at t+6, with a total simulation
time of 42 h. Therefore Grid 3 provides every day detailed weather forecasts for
the same day and the following day, at 1-h interval. This high spatial and
temporal resolution of Grid 3 data will permit to provide rainfall and wind
forecasts for Actions of the FLIRE project.
The system provides every day detailed weather forecasts for the same
day and the following day, at 1-h interval. The produced forecast for a grid of
40x45 points in the project area (80 km x 90 km) is stored in form of hourly text
files in the server of NOA and can be retrieved from there by other components
using the FTP protocol.

18
Figure 1: (a) Horizontal extension of MM5 grids. The rectangles denote the position of
the intermediate and fine grid. (b) Athens area, as resolved by MM5 Grid 3.
The forecast data are provided by the NOA over the web by using the
NoaForecastData tool (see below), a software that has been designed and
implemented from scratch for the purposes of the project.
Data from the meteorological stations are provided by both NOA and
NTUA infrastructures. These data are firstly utilized by the Hydrological
Observatory of Athens (HOA) which belongs to the NTUA and then, in a
specified format, are provided to FORTH, via FTP for further use. In the section
2.3, specific information is provided on the data preparation and exchange.

19
2.1. NOA Forecast Data - NoaForecastData tool
National Observatory of Athens (NOA, www.noa.gr) produces every day,
at about 7:00 am, weather forecast data for the current and the next day. The
data that are required for the project are the following:
• Wind Direction
• Wind Speed
• Temperature
• Relative Humidity
• Hourly Rain
So, every day, at about 13:00, this dataset with hourly weather forecast
data for the next 42 hours is available for the points of a grid of 40 x 45 points.
The forecast data are stored in text files. These text files, with a file describing
the coordinates and the altitudes of the points, are compressed in a tar file. This
tar file is available to be downloaded by the user from the NOA server.
In order to download and distribute this data to the various Flire project
components, a software program called “NoaForecastData” has been
developed. In Flire project web server NoaForecastData is executed
automatically as a “Scheduled Task” at specific times (when forecast data are
available).
The Steps that NoaForecastData follows are:
1) It check in a specific url address if there is a compressed (.gz) file
2) It downloads the file to the local hard disk (of the Flire server)
3) It creates a backup copy of downloaded file (to folder used only for
backup reasons)
4) It uncompress the downloaded file
5) It combines the information of downloaded weather forecast data files
and the geographic information of the grid points to produce xml and kml
files
6) It creates an xml file about each date time with the forecast data for all
grid points about that specific date time.

20
7) It creates a kml file about each date time with the forecast data for all
grid points about that specific date time. This kml file is available to the
Flire website user:
a) to display it on Flire website map
b) to open it with Google Earth directly from the Flire web server
c) to download it to the local hard for future use (via Google Earth
software).
8) It combines the xml forecast data files of a whole day and creates a new
xml file about that date for all the grid points.
9) This xml file with daily weather forecast data is compressed to a zip file
(due to its initial size).
10) It creates a kml file with the forecast data of the day. This kml file can be
used in the ways mentioned above.
11) This kml file with daily data is compressed to a kmz file (due to its initial
size)
12) NoaForecastData creates and updates a log file with an analytical report
of every operation that it performs, including processing times, produced
data file names etc.
Some of the characteristics of NoaForecastData are:
• It is developed using Visual Basic 6 so it can be updated or extended
easily.
• It runs without the need of any user attendance (as “Scheduled Task”)
• All parameters (urls, folder names etc) needed by the program are
stored once in NoaForecastData.ini file (
• Figure 4).

21
Figure 4. Example of NoaForecastData.ini file
• It has a very simple user interface without any need of user training. If
NoaForecastData is executed using “–interface” option it provides a user
interface so that the user can use the program to perform more
advanced operations.
By using NoaForecastData tool with user interface (figure 5), the user has
the ability to select and perform any specific part of downloaded data
processing. NoaForecastData tool with user interface can be used, either if new
weather forecast data are available from NOA at a not regular time period or if
data processing must be done on a computer other than Flire servers, for
research reasons etc.
Figure 5. The User interface of the tool
NoaForecastData tool creates automatically backup copies of all
downloaded data files from NOA servers. So the user has the ability to process
any primary weather forecast data, in the future. Newer versions of the

22
NoaForecastData tool can perform post processing of these older data in order
to create new types of time series information if necessary, in the future, i.e. for
research reasons (figure 6).
Figure 6. Processing of an existing file dataset
Selection of weather forecast data backup file in order to perform
processing (figure 7).

23
Figure 7. The user select the files.
Using NoaForecastData tool the user has the ability to create a kml file
with the grid of points with available weather forecast data from NOA, in order to
display this kml file using Google earth, Flire website or any other software
(figure 8).
Figure 8. Kml creation from the tool.

24
2.2. Available Weather Forecast Data Catalogs service
(AWFDCS)
Available Weather Forecast Data Catalogs Service (AWFDCS) provides
catalogs of all available forecast data. These catalogs include the names of the
data files with the forecast data for a specific date or a specific hour.
AWFDCS works in three steps:
1. receives requests for a catalog
2. browses the data file structure created by NoaForecastData software
(described in Error! Reference source not found. page Error!
Bookmark not defined.)
3. responds by sending an xml file describing the available forecast data.
There are three types of catalogs of available weather forecast data:
1. Catalog of months with available forecast data.
2. Catalog of dates of a specific month with available weather forecast
data.
3. Catalog of hours of a specific date with available weather forecast data

25
2.2.1. Catalog of months with available forecast data
The request to get the catalog of months with available weather forecast
data is:
http://<web-server>/flire/weatherforecastdata.asp?cmd=getmonths
The response of the service has the schema of
Figure . A complete example of a catalog is located in paragraph Catalog of
months with available weather forecast data page 63 in Annex.
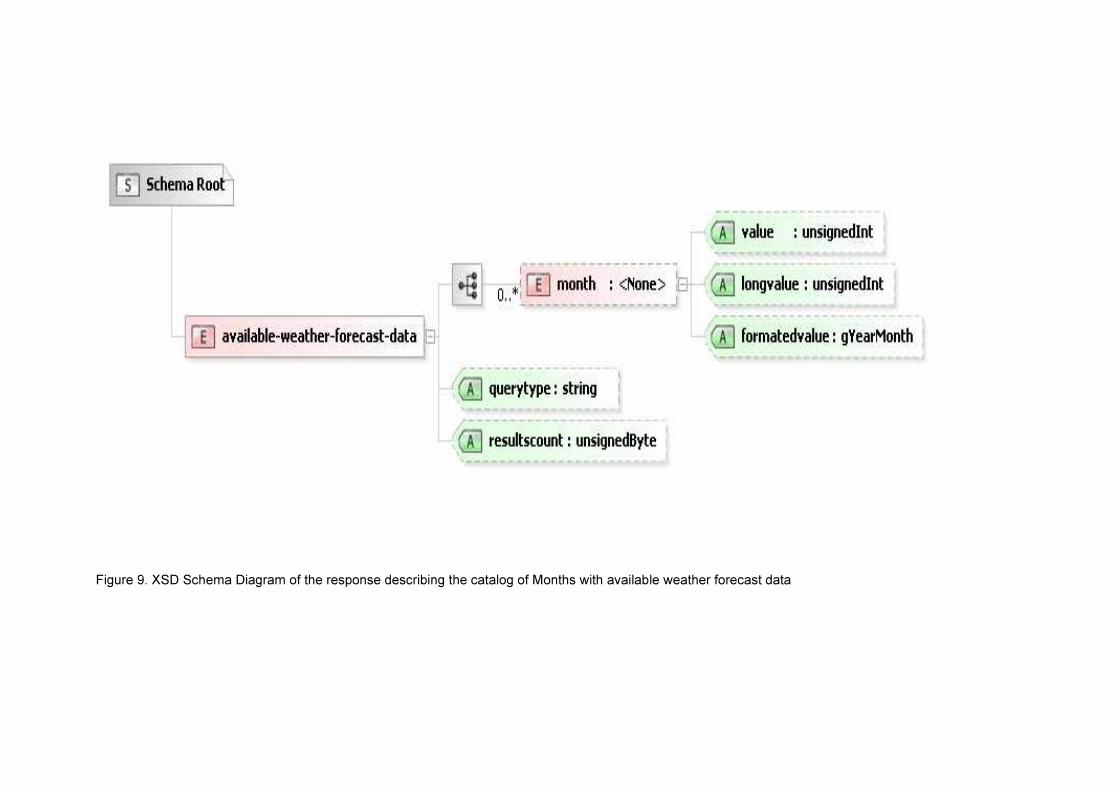
Figure 9. XSD Schema Diagram of the response describing the catalog of Months with available weather forecast data

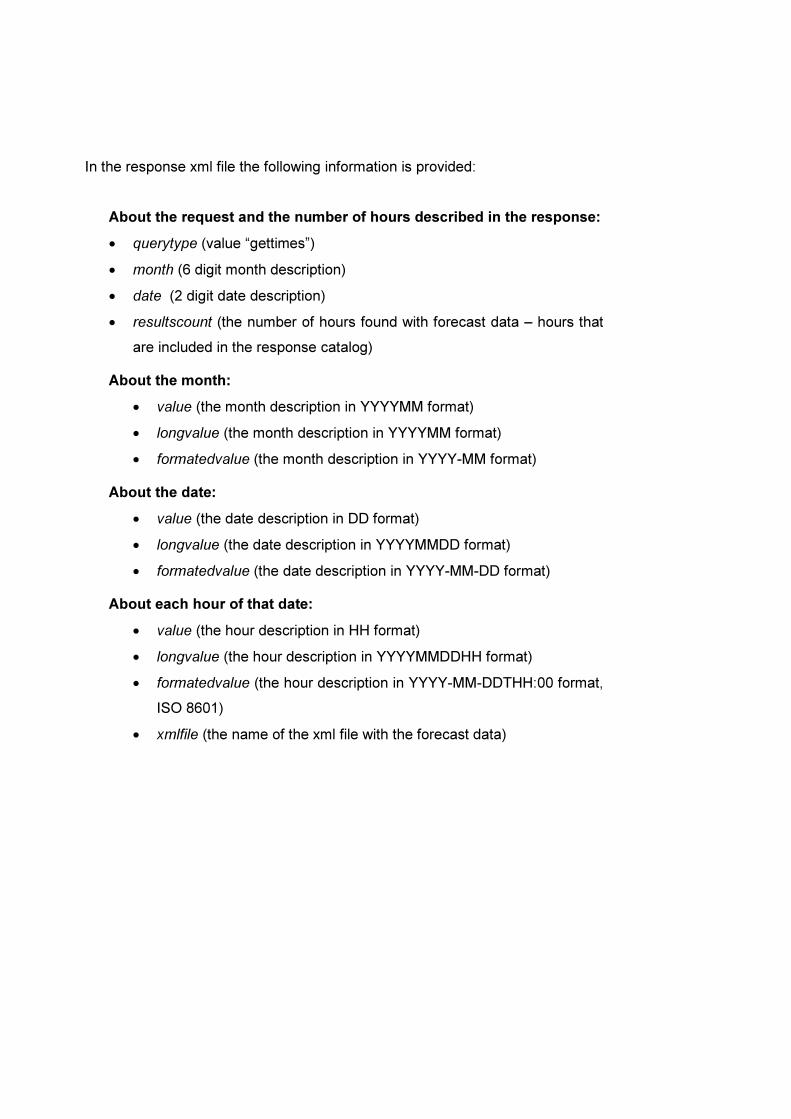
In the response xml file the following information is provided:
About the request and the number of months described in the response:
• querytype (value “getmonths”)
• resultscount (the number of months found with forecast data – months
that are included in the response catalog)
About the month:
• value (the month description in YYYYMM format)
• longvalue (the month description in YYYYMM format)
• formatedvalue (the month description in YYYY-MM format)

28
2.2.2. Catalog of dates of a specific month with available
weather forecast data
The request to get the catalog of dates of a specific month is: http://<web-
server>/flire/weatherforecastdata.asp?cmd=getdates&month=YYYYMM
YYYYMM is the 6 digit description of a month. YYYY stands for the year and MM for the month. The response of the service has the schema of
Figure . A complete example of a catalog is located in paragraph

29
Catalog of dates of a specific month with available weather forecast data page
64 in Annex.

Figure 10. XSD Schema Diagram of the response describing the catalog of Dates (of a month) with available weather forecast data

In the response xml file the following information is provided:
About the request and the number of dates described in the response:
• querytype (value “getdates”)
• month (6 digit month description)
• resultscount (the number of dates found with forecast data – dates that
are included in the response catalog)
About the month:
• value (the month description in YYYYMM format)
• longvalue (the month description in YYYYMM format)
• formatedvalue (the month description in YYYY-MM format)
About each date of that month:
• value (the date description in DD format)
• longvalue (the date description in YYYYMMDD format)
• formatedvalue (the date description in YYYY-MM-DD)
• xmlfile (the name of the xml.zip file with the forecast data)
• kmlfile (the name of the kmz file with the forecast data)

32
2.2.3. Catalog of hours of a specific date with available
weather forecast data
The request to get the catalog of hours of a specific date is: http://<web-server>/flire/weatherforecastdata.asp?cmd=gettimes&month= YYYYMM &date=DDYYYYMM is the 6 digit description of a month as mentioned above. DD is the 2 digit description of the hour (valid values are 00, 01, 3, 23). The response of the service has the schema of
Figure . A complete example of a catalog is located in paragraph

33
Catalog of hours of a specific date (of a specific month) with available weather
forecast data page 65 in Annex.

Figure 11. XSD Schema Diagram of the response describing the catalog of Times (of a date) with available weather forecast data
In the response xml file the following information is provided:
About the request and the number of hours described in the response:
• querytype (value “gettimes”)
• month (6 digit month description)
• date (2 digit date description)
• resultscount (the number of hours found with forecast data – hours that
are included in the response catalog)
About the month:
• value (the month description in YYYYMM format)
• longvalue (the month description in YYYYMM format)
• formatedvalue (the month description in YYYY-MM format)
About the date:
• value (the date description in DD format)
• longvalue (the date description in YYYYMMDD format)
• formatedvalue (the date description in YYYY-MM-DD format)
About each hour of that date:
• value (the hour description in HH format)
• longvalue (the hour description in YYYYMMDDHH format)
• formatedvalue (the hour description in YYYY-MM-DDTHH:00 format,
ISO 8601)
• xmlfile (the name of the xml file with the forecast data)

36
2.3. Meteorological stations data - HOA System -
Description
The Hydrological Observatory of Athens (HOA) (http://hoa.ntua.gr/) is
monitoring network of currently 11 active meteorological and 5 hydrological
stations in the greater Athens area. The network is in operation since 2005 and
data are collected, stored and published in near-real time in Enhydris, a
database system for the storage and management of hydrological and
meteorological data. It has been developed and maintained by the Laboratory of
Hydrology and Water Resources Management of the National Technical
University of Athens. On the other hand, the meteorological network of the
National Observatory of Athens (NOA) covers almost the whole territory of
Greece and is one of the largest in the country.
Some of the meteorological stations, belonging to the monitoring network
of the National Observatory of Athens (NOA) and the Hydrological Observatory
of Athens (HOA), are located within and in the surroundings of the project area.
All environmental data originating from monitoring stations and weather
predictions models are stored in near real-time in the FLIRE file based database
system. The DBMS supports the storage of tabular data as well as geospatial
information and feeds the mathematical models, applications and tools with
actual data.
The next sections will describe these components and their interactions in
detail. The following table (table 1) lists formats, procedures and protocols that
are used for data exchange between components in FLIRE.

37
Table 1: Data exchange between components of the project
Section Format Protocol Procedure
type Data provider Data receiver Purpose
2.3.1 CSV HTTP polling NOA DB HOA DB
Unification of ground
measurements in a single
database system
CSV FTP ??? Weather
Forecasting FLIRE DB
Data exchange of surface rainfall
forecasts
2.3.5 XML HTTP On-demand HOA DB FLIRE DB
Projection of ground
measurements on map and
further processing by other
models
4.3 XML HTTP On-demand HOA DB Algosystems
Data input for the Forest Fire
Risk Assessment and Fire
Propagation models
3 XML HTTP On-demand FLIRE DB FloRAS Areal rainfall forecasts as input
for the hydrological model

38
2.3.1. Monitoring and Forecasting System
Figure 12 shows the main components of the FLIRE Monitoring and
Forecasting System as described in detail in the next sections.
Figure 12: FLIRE Monitoring and Forecasting System
2.3.2. FLIRE monitoring network
The FLIRE monitoring network consists of several meteorological stations
from the NOA network, as well as hydrological and meteorological stations from
HOA located in and around the project area. It has been agreed between the
NOA and the NTUA, which operates the HOA network, that meteorological data
from NOA should be transmitted and stored in the database system of HOA.
After that, real-time meteorological information will be provided to other systems
of the project.
This approach offers the following potential advantages:
1. All meteorological information will be provided by one system
in a predefined structure and form
2. Established web services of HOA, such as time series
download, charts and web service API can be utilized and
3. Data quality routines may be applied upon the whole dataset.
39
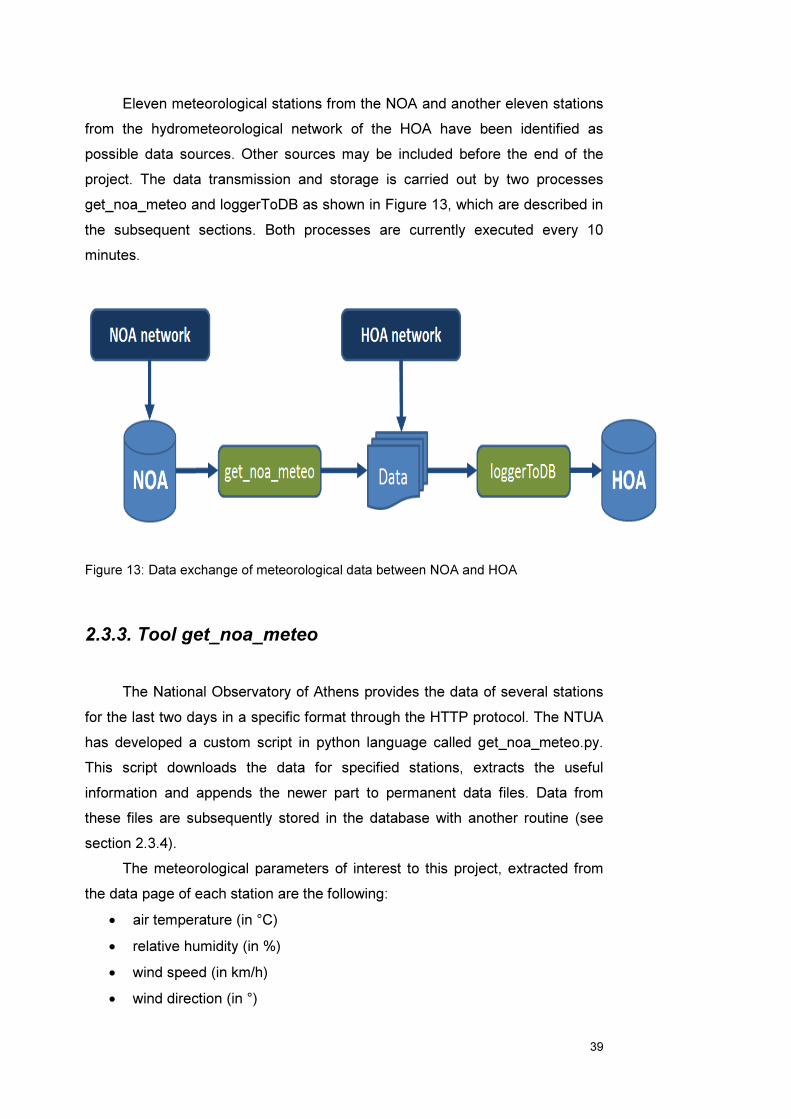
Eleven meteorological stations from the NOA and another eleven stations
from the hydrometeorological network of the HOA have been identified as
possible data sources. Other sources may be included before the end of the
project. The data transmission and storage is carried out by two processes
get_noa_meteo and loggerToDB as shown in Figure 13, which are described in
the subsequent sections. Both processes are currently executed every 10
minutes.
Figure 13: Data exchange of meteorological data between NOA and HOA
2.3.3. Tool get_noa_meteo
The National Observatory of Athens provides the data of several stations
for the last two days in a specific format through the HTTP protocol. The NTUA
has developed a custom script in python language called get_noa_meteo.py.
This script downloads the data for specified stations, extracts the useful
information and appends the newer part to permanent data files. Data from
these files are subsequently stored in the database with another routine (see
section 2.3.4).
The meteorological parameters of interest to this project, extracted from
the data page of each station are the following:
• air temperature (in °C)
• relative humidity (in %)
• wind speed (in km/h)
• wind direction (in °)

40
• rainfall (in mm)
The wind direction, given by the NOA stations in cardinal directions,
ordinal directions and eight further divisions, are converted to decimal degrees
as follows:
Direction Degrees Direction Degrees Direction Degrees Direction Degrees
N 0.0 E 90.0 S 180.0 W 270.0
NNE 22.5 ESE 112.5 SSW 202.5 WNW 292.5
NE 45.0 SE 135.0 SW 225.0 NW 315.0
ENE 67.5 SSE 157.5 WSW 247.5 NNW 337.5
2.3.4. Tool loggertodb
loggertodb is a highly configurable application, which reads a plain text
files containing time series, connects to an Enhydris database system
(openmeteo.org, 2013) and appends newer records to those stored in the
database. The application has been developed by the NTUA and is part of an
open source project (Christophorides 2013). It is capable to read a variety of file
formats supported by loggers of established manufacturers. At the same time it
is expandable to new formats if needed. loggertodb is used to enter data
measurements to the database coming from NOA stations the same way it
stores data from other stations of the HOA monitoring network. It is executed in
sequence with get_noa_meteo, so that there is no time lag between data
transmission and data storage.
NOA station loggers are configured to record the date in local time, i.e.
they switch to daylight saving time in spring and adjust the clock one hour back
in autumn. This practice is incompatible with Enhydris databases, such as the
one operated in HOA, as it requires that all timestamps of any given time series
must be in the same offset from UTC. Therefore, the functionality provided by
loggertodb is utilized to correct the given timestamp and store all time series in
EET (UTC +02:00).

41
2.3.5. Hydrometeorological data exchange
In order for recorded hydrometeorological data to become available to all
components of the project (e.g. DSS, models, web applications) and to be
overlaid with other data (forecasts, lightings, other geographical layers etc.) it
has been agreed that all data relevant for the project will be stored in the central
database of the project hosted by the Institute of Applied and Computational
Mathematics of the Foundation for Research and Technology-Hellas (FORTH).
FORTH and NTUA have agreed upon the use of XML (figure 14) as the format
for data transmission of point data collected from the HOA and the NOA
monitoring network. The main advantages of this approach are the following: a)
XML it is both human and machine-readable, b) it is simple and extensible and
c) this standard is already supported by numerous systems.
Figure 14: XML schema diagram for data exchange between HOA and FORTH

42
Figure 14 shows the diagram of the developed XML schema for the data
exchange. It may be used as data format for both hydrometeorogical stations
and weather forecasts for specific locations. It comprises station/location
characteristics and timeseries collected from one or more sites. The data
records are given in form of Record ID-timestamp-value tuples and may contain
several records from the following variables: rainfall, temperature, wind direction
and wind speed. This list of variables may be extended in future. The time is
given in local time and the offset from UTC is specified by the UTC_offset
attribute. The coordinates of each station are given in both coordinate systems
GGRS87 (EPSG SRID: 2100) and WGS84 (EPSG SRID: 2346), to avoid
possible resources consuming conversions by other applications.
The HTTP protocol has been utilized for data transfer. As far as data from
HOA are concerned, the data are dynamically prepared upon request and
returned in the appropriate XML form on-demand as illustrated in figure 15.
Figure 15: Measured data exchange between HOA and FORTH.
The developed software routine (enhydris2xml), (figure 15) is capable of
retrieving information from various Enhydris-compatible databases, such as the
one used by the HOA, using the web service API of Enhydris.
The following URLs may be used to provide the needed information:
1. http://hoa.ntua.gr/flire/stations_moment/
The request returns the last available value of each timeseries
2. http://hoa.ntua.gr/flire/stations_day/
All records of the last 24 hours are returned. This short “memory” is
especially useful if past values are also needed

43
3. http://hoa.ntua.gr/flire/stations_hour/
All records of the last hour are returned.
4. http://hoa.ntua.gr/flire/stations_twohour/
All records of the last two hours are returned.
Since this service of HOA is to be used only by other systems within the
project, the necessary resources which need to be allocated are expected to be
limited. The response time is expected to be a few seconds depending on the
type of the request and the amount of information returned. Thus, the service
can be provided on-demand and no cache or other similar techniques for data
preparation are needed.

44
2.4. Weather Forecast Data Distribution
Available forecast data are provided in two forms:
1. .xml or .xml.zip to be downloaded and processed by various models
2. .kml or .kmz (Keyhole Markup Language) files to be used by the web
mapping tool (Google Earth API).
For every hour of a date one .xml and one .kml file are available with all
available weather forecast data for that specific hour (figure 16). The .xml file
contains one “weather forecast data type” node. This node has some properties
and contains one “point type” node for each point (of the grid) with available
weather forecast data. The properties of the “weather forecast data type” node
(i.e. for 19:00 of 22nd of March of 2013):
• Datatype (with value “hourly", since that file contains data for an hour)
• Month (i.e. “201303” that is the 03rd month of 2013)
• Date (i.e. "22")
• Time (i.e. "19")
Each “point type” node contains:
• The date description
• The time description
• The altitude of the point (in meters)
• The coordinates of the point in both WGS84 (EPSG SRID: 2346) and
GGRS87 (Greek ΕΓΣΑ87; EPSG SRID: 2100) coordinate systems
• The weather forecast data for the specific point and date time, which
include information on:
o The speed of the wind
o The wind direction
o The temperature
o The relative humidity
o The hourly rain
o The timestamp (that is the date and time in ISO 8601
format of the time that the forecast data, for that specific
hour, have been created)

Figure 16. XSD Schema Diagram of distributed weather forecast data for a specific date

For every date one .xml and one .kml files are available with all available
weather forecast data for that specific date (in compressed formats .xml.zip and
.kmz). The .xml file contains one “weather forecast data type” node (figure 17).
This node has some properties and contains one “point type” node for each
point (of the grid) and for each hour with available weather forecast data. The
properties of the “weather forecast data type” node (i.e. for 22nd of March of
2013):
• Datatype (with value “daily", since that file contains data for a date)
• Month (i.e. “201303” that is the 03rd month of 2013)
• Date (i.e. "22")
Each “point type” node contains:
• The date description
• The time description
• The altitude of the point (in meters)
• The coordinates of the point in both WGS84 and EGSA87 coordinate
systems
• The weather forecast data for the specific point and date time, which
include information on:
1. The speed of the wind
2. The wind direction
3. The temperature
4. The relative humidity
5. The hourly rain
6. The timestamp (that is the date and time in ISO 8601
format of the time that the forecast data, for that specific
hour, have been created)


48
Figure 17. XSD Schema Diagram of distributed weather forecast data for a specific time

3. Flood Risk Assessment System (FLORAS)
3.1. General information
The Flood Risk Assessment System (FLORAS) continuously monitors hydrometeorological information coming from the monitoring stations and short-term predictions for the area. All data are assessed and compiled by the Scenario Management System feeding a Catchment Hydrological and a Catchment Hydraulic Model, producing information relevant to the flood risk assessment and flood alerts (e.g. water depths, flood inundation maps).
Figure 18 shows the main components and data flows of FLORAS, which
are described in detail in the next sections. Similar approaches combining
hydrologic/hydraulic models with GIS functionality in an integrated framework
have been documented in the past (Robayo, 2005).
Both simulation models used for this task, i.e. HEC-HMS and HEC-RAS
are well established models (HEC, 2010a; HEC, 2010b). They are usually
accessed over a user interface as stand-alone applications. For the current
project this interactive approach is not an option, since all procedures from the
creation of the hydrologic scenario to the production of flood inundation maps
have to be automated and processed in batch mode. FLORAS applies scripting
and other techniques offered by these models in order to feed them with the
relevant data, run the scenarios and extract simulation results.
Although it is not planned to be applied to areas other than the one
specified in this project, FLORAS can be adapted to other areas with modest
modifications in the configuration files.

50
Figure 18: The main components of the Flood Risk Assessment System.

51
3.3. Scenario Management Module
The purpose of this module is to control the computational workflow
process of the flood risk assessment. The role of the Scenario Management is
crucial, since it:
a) downloads, compiles and prepares the data for all components in
the system (e.g. hydrometeorological data),
b) initiates and controls the execution of sub-processes
(simulations, data transformations etc.) resuming control as soon
as they are terminated and
c) assesses the results of simulations/calculations, which in turn
may trigger further actions.
The ability to pass over the control of the workflow to another program
and wait for it to be completed before the next process starts executing is
particularly critical because the output of one process becomes the input for the
next process inline. In case of possible interruptions of the process due to
unexpected events (e.g. due to power loss or network connection interruption)
the Scenario Management module reestablishes the last state of the system, as
soon as it returns again to normal operation. In normal mode, the Scenario
Management runs continuously an iterative process, After every simulation run
the results are analyzed.
By comparing the water elevation with minimum channel elevation, the
water depth can be calculated and used as basis for the assessment of the
simulated scenario and for triggering further simulations by the Scenario
Management unit and alerts by the Early Flood Warning System. By analyzing
the channel geometry at every cross-section and comparing it with the water
elevation calculated by the Catchment Hydraulic Model, flood inundation maps
can be produced.
Depending on the outcome of the simulation, the Scenario Management
triggers one of the following actions:
• Archives the scenario results for future use
• Passes over simulation results to the Early Flood Warning System

52
• Delivers the information regarding the flood inundation area to the
FLIRE DSS for updating the relevant website
• Calculates new scenario parameters and initiates another simulation
More specifically, the Scenario Management component implements the
following actions:
Preparation of the hydrological modelling
• If available, load from the local database rainfall forecast time series
produced in previous iterations, to avoid time consuming data retrieval
from the FLIRE Database and analysis.
• Download from the FLIRE Database the newest rainfall forecasts
produced by NOA. Each downloaded file refers to rainfall forecasts for a
number of grid points (30x45) in and around the study area and for a
specific day and hour. New forecast updates are produced once per day
including a series of meteorological parameters for the next 24 to 48
hours.
• Read the shapefile with the sub-basins of the study area. Match grid
points, for which forecasts are available, to sub-basins of the study area.
48 grid points in total are currently matched (see Error! Reference
source not found.).
• Download historical data from the real-time meteorological monitoring
network.
• From all available historical and forecasted precipitation data, create
hourly hybrid time series for each grid point located within the study area
for the time period of three days, starting the day before and ending the
day after the current day.
• Disaggregate the time series from 1h to 10min time step, which is the
preferred temporal resolution to simulate scenarios in HEC-HMS.
• Save locally the created time series for future reuse

53
Figure 19: Overlaying weather forecast grid points to sub-basins of the project area
Run of the Catchment Hydrological Model
• All files comprising a HEC-HMS project (see next section) are created
from scratch, taking into account the model already set up for the study
area, the hydrological forecasts and the parameters for the current
scenario given by the Scenario Management module. Precipitation time
series are imported in the HEC-DSS file using the scripting functionality
of HEC-DSSVue.
• The thus created project is loaded and run by HEC-HMS in batch mode
• The resulting discharge time series are stored back in the HEC-DSS file.
Run of the Catchment Hydraulic Model
• Peak flow from each discharge timeseries representing the “worst case
scenario” for steady flow is identified. The max. discharge for selected
locations of the river network (e.g. sub-basin outlets) is calculated.
• The file containing flow information (extension .fxx) for the simulation
with HEC-RAS is created.

54
• Utilizing COM/OLE interface to load data in HEC-RAS and execute the
project. Due to the heavy workload only one sub-basin at a time is
simulated.
• The resulting water elevations at the cross sections of each reach are
stored in a spatial data file.
Post processing and visualization of the results
• The water depth at specific locations is calculated from the DTM and the
simulation results.
• Taking into account the geometry of each cross section and the water
elevations at the specific cross section a polygon is calculated
representing the flood inundation area.
• Post processing for the visualization of the flood inundation map, e.g.
conversion of coordinate systems or production of KML files to be
visualized by Web browsers.
• Archiving results of the simulation
The Scenario Management module is written in Python programming language.

55
3.4. Catchment Hydrological Model
For the purpose of this project HEC-HMS is being used as a hydrological
model producing runoff discharges for selected rainfall events. HEC-HMS is a
computer program, developed by the Hydrologic Engineering Center within the
US Army Corps of Engineers that models the hydraulics of water flow through
natural rivers and other channels. The initial version of the program was
developed in 1992 as a replacement for HEC-1 which has long been considered
a standard for hydrologic simulation. Figure 20 shows the main components
and data flows of the Catchment Hydrological Model.
Figure 20: Main components and dataflow of the Catchment Hydrological Model.
A number of input files given in

56
Table are needed to define the hydrological scenario (HEC, 2010a).
57
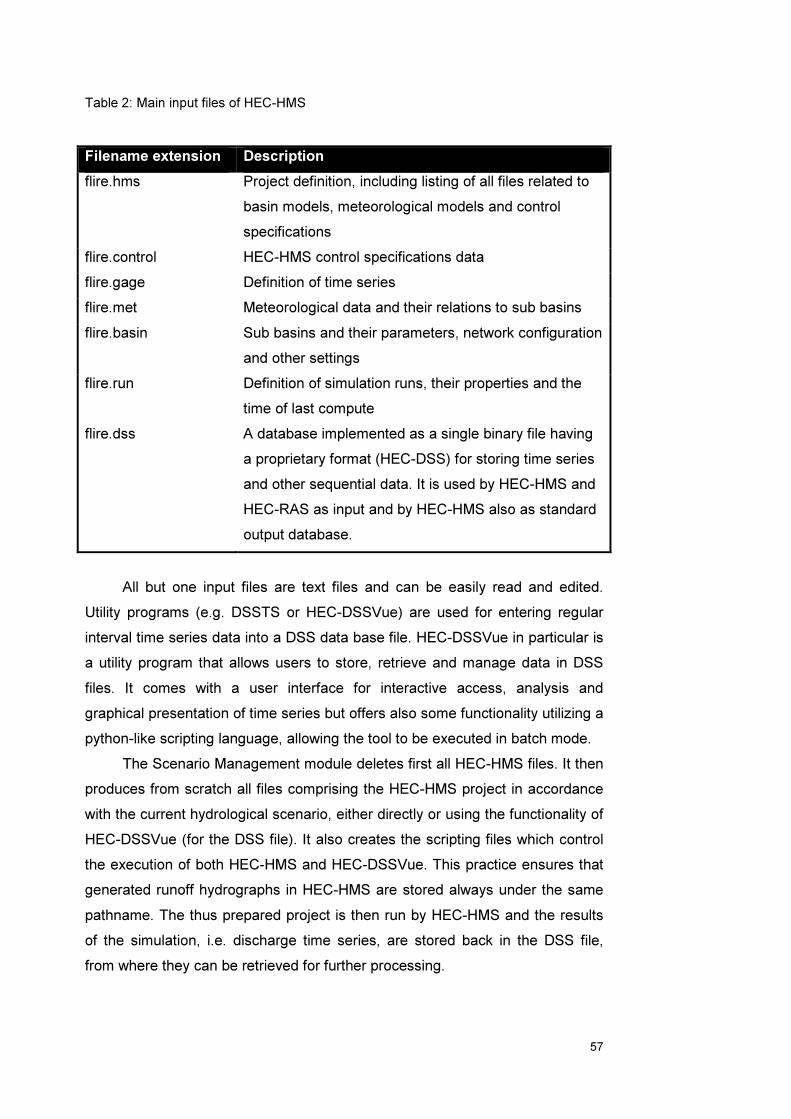
Table 2: Main input files of HEC-HMS
Filename extension Description
flire.hms Project definition, including listing of all files related to
basin models, meteorological models and control
specifications
flire.control HEC-HMS control specifications data
flire.gage Definition of time series
flire.met Meteorological data and their relations to sub basins
flire.basin Sub basins and their parameters, network configuration
and other settings
flire.run Definition of simulation runs, their properties and the
time of last compute
flire.dss A database implemented as a single binary file having
a proprietary format (HEC-DSS) for storing time series
and other sequential data. It is used by HEC-HMS and
HEC-RAS as input and by HEC-HMS also as standard
output database.
All but one input files are text files and can be easily read and edited.
Utility programs (e.g. DSSTS or HEC-DSSVue) are used for entering regular
interval time series data into a DSS data base file. HEC-DSSVue in particular is
a utility program that allows users to store, retrieve and manage data in DSS
files. It comes with a user interface for interactive access, analysis and
graphical presentation of time series but offers also some functionality utilizing a
python-like scripting language, allowing the tool to be executed in batch mode.
The Scenario Management module deletes first all HEC-HMS files. It then
produces from scratch all files comprising the HEC-HMS project in accordance
with the current hydrological scenario, either directly or using the functionality of
HEC-DSSVue (for the DSS file). It also creates the scripting files which control
the execution of both HEC-HMS and HEC-DSSVue. This practice ensures that
generated runoff hydrographs in HEC-HMS are stored always under the same
pathname. The thus prepared project is then run by HEC-HMS and the results
of the simulation, i.e. discharge time series, are stored back in the DSS file,
from where they can be retrieved for further processing.

58
As opposed to HEC-RAS, HEC-HMS in its current version does not
expose its functionality through an object library to be instantiated from an
external application, but offers a simple scripting language that controls over
command line statements basic functionalities, such as loading a project,
running a simulation and storing simulation results. The script needs to be
executed from within a file that in turn is executed by a DOS-type command
line.
3.5. Catchment Hydraulic Model
The Catchment Hydraulic Model, e.g. HEC-RAS (U.S. Army Corps of
Engineers, 2010b), uses discharge datasets provided by a hydrological model
in order to calculate water depth. More specifically, runoff discharges produced
by HEC-HMS and stored in the DSS file are identified, extracted and analyzed.
Numerous river sections are defined along the river network. The peak flow for
each river section of the river network is calculated and used to define steady
flow boundary conditions for HEC-RAS. The option to calculate peak flow
directly from the hydrographs stored in the DSS file using HEC-RAS
functionality has been rejected in order to retain the flexibility of replacing HEC-
RAS with another hydraulic model in future.
HEC-RAS may be executed either interactively or in batch mode. In order
to control the application from the OS shell, HEC-RAS offers an object library
that exposes basic functionalities through Microsoft’s standard interconnection
OLE/COM interface. Thus, basic methods for executing the entire model,
executing an individual hydrologic process, importing input data, or exporting
simulation results can be instantiated from an external application.
Using the same functionality, water elevation data of every cross section
and stream calculated by HEC-RAS is exported to a spatial data file, from
where it can be read and analyzed.

59
3.6. Early Flood Warning System (EFWS)
The Early Flood Warning System (EFWS) continuously collects and
analyzes real time and forecasted information to assess the flood risk in the
project area. In particular, the following sources are taken into account:
• Water stage at specific locations of the river system measured in
real time by the FLIRE monitoring network
• Water depth and discharge calculated by mathematical models
based on forecasted precipitation
• Recent lightning activity observed in and around the project area
• Rainfall intensity measured by the FLIRE monitoring network
Warnings of the following two types may be released by the EFWS:
• Forecasted flood risk. These warnings result from simulations of
river discharges in the project area, based on forecasted weather
conditions in the next 24-48 hours. They provide an estimated
flood risk intending to draw the attention of stakeholders to an
upcoming event.
• Observations related to the flood risk. They are based mainly on
near real-time measurements and observations, giving precise
information on the current situation of the weather conditions and
the rivers. Messages of this type are time critical and are
transmitted immediately to selected stakeholders.
Depending on the severity of the forecasted flood risk and the chosen
alerting policy a number of actions can be initiated by the EFWS. They intend
to alert specific stakeholders such as local authorities or the fire department.
Possible actions are the following:
• Point out an upcoming event by updating the FLIRE website
(release announcement, show forecasted flood inundation map
etc.)
• Send emails to stakeholders describing a potential risk
• Utilize the mobile phone communication network to send short
messages via SMS to the cellphones of selected stakeholders.

60
3.6. Resources Requirements
The following hardware and software has been used and is proven to be
sufficient for running FLORAS. It is likely that other Microsoft Windows
operating systems and older versions of the software listed below would also
suffice, although significant changes in the OLE/COM interface between the
current and older versions of HEC-RAS have been detected, suggesting that an
older version of this software would require a review and possibly adjustments
to the relevant routines. The applied hardware should comply with the minimal
requirements for the applied main modeling components, i.e. HEC-HMS and
HEC-RAS.
The system has been tested with the following hardware and software:
Hardware
• X86 compatible CPU
• 2 GB RAM
• 500 MB disc space
Software
• Windows 7/8 32-bit OS
• Python 2.7
• HEC-DSSVue 2.0 (U.S. Army Corps of Engineers, 2009)
• HEC-HMS 3.5 (U.S. Army Corps of Engineers, 2010a)
• HEC-RAS 4.1 (U.S. Army Corps of Engineers, 2010b)
• pywin32. Python extensions for Microsoft Windows provides access to
much of the Win32 API, the ability to create and use COM objects, and
the Pythonwin environment.
• pyshp. A library in python programming language for reading and writing
ESRI Shapefiles (shp, shx, and dbf files with all types of geometry).
• pyproj 1.9.3 provides python interfaces to PROJ.4 functions.
Windows 7/8 are products of Microsoft. HEC-DSSVue, HEC-DSS, HEC-
HMS, HEC-RAS applied in this project are products and technologies
developed by the Hydrologic Engineering Center of the US Army Corps of
Engineers. All other software are open source products.

61
4. Fire Behavior Modeling and Simulation System – Fire
Danger Mapping System.
4.1. General information
The efficient suppression of the fire in forests and shrublands is highly
depending on fire fighting activity at the early ignition stage. For this reason the
civil protection mechanisms and fire managers needs on time information
concerning the potential spread of the fire in order to plan and organize the
relevant suppression plan. Such information requires reliable forecasting and
management systems which rely on the efficient combination of interdisciplinary
research, use of technology, development of innovation and management tools
for assessing fire potential and fire risk in a specific area. Modern technologies
of geoinformatics, electronic data capture and wireless transmission of
information from remote areas to centralized control and monitoring centers
have a strong potential to contribute to more effective organization of
environmental protection (Noonan et al., 2011).
Benefits include early detection of fire, consistent assessment of fire risk,
systematic observation of the status of forest biophysical parameters and
support of fire management decisions (Bonazountas et al., 2007, Kalabokidis et
al., 2012). In the context of FLIRE, the relative forest fire management
components included in the are two, namely “fire behavior modeling and
simulation” and “fire danger mapping” subsystems.
The first one is based on G-FMIS (Geographic Fire management
Information System) . G-FMIS is a Forest Fire Management software which
includes a forest fire simulator based on the mathematical model of BEHAVE
fire behavior system (Burgan and Rothermel 1984, Andrews 1986, Andrews
and Chase 1989) and uses a modified version of the shortest path algorithm of
Dijkstra (1959) adapting it to the simulation of forest fire propagation.
The full G-FMIS software s of combines two major modules i.e. fire
danger mapping based on fire danger estimation and mapping and Fire
behavior and propagation simulation . The core of G-FMIS system has been
developed in C++ programming language and the initial desktop version of the
system runs as extension (toolbar) on top of Arc-GIS platform of ESRI. Thus G-
FMIS allows organizing forest protection against fire, being integrated in the

62
same environment (ArcGIS) in which other forest management or conservation
tasks can be performed in parallel. For the purposes of FLIRE project G-FMIS
core modules have been redesigned in order to run as separate web services
for authorized users and stakeholders that would have interest of getting
information on the propagation and behavior of an eventual fire without
investing extra funds in purchasing computing facilities or being obliged to
perform field work for fuel mapping purposes. The G-FMIS web services shall
be used through the FLIRE DSS for providing fire danger mapping (on a daily
basis) and fire behavior and propagation simulation (on user request) without
involving the users into the technical maintenance of the system and the
updating of the data needed.
The fire danger mapping service operates on a daily basis pulling
meteorological data for the area of East Attiki, which is the application area of
FLIRE, from respective meteorological data available from other modules of the
Project (Action B5). This module is based on Keetch Byram Drought index
(revised version of 1988). KBDI is a cumulative index which provides indication
concerning the conditions contributing to the flammability of the vegetation and
its daily variation due to meteorological conditions.
DSS will communicate appropriate stored messages to different group of
stakeholders when the calculated index exceeds a threshold value. For the
FLIRE project the KBDI index has been selected as the index for the fire danger
assessment since it is related with soil moisture and conditions related to
drought.

63
4.2.Forest fire modeling and simulation (G-FMIS)
The GFMIS fire modeling and propagation simulator was redesigned in order to
run as web - service and thus can be accessed only by authorized users in
order to utilize it in their systems. It can be used to answer questions like:
1. “What will happen, if a fire starts at a specific point (or points) and the
current weather conditions? ” or
2. “What would happen, if a fire had started at a specific date time in the
past (using the meteorological data available at that time)?”
In both cases we suppose that the necessary meteorological data
(current, historical or forecasted) are available for the specific date - time. In
order to use the fire behavior modeling and simulation service for answering
any of the above questions, it is necessary to have meteorological data for that
specific date-time from two or more meteorological stations near the selected
ignition points
G-fmismeteo_dss service supports this requirement. Thus, for the
provided ignition point(s), gfmismeteo_dss service finds the nearest meteo
stations from the existing meteo-station network and uses the available
weather data for the selected date time. The output data of gfmis_dss service
can be used as input to the Fire Behavior Modeling and simulation (gfmis_fbms)
service .
The detailed description of the inputs of gfmismeteo_dss service are described in “APPENDIX

64
gfmis_dss Service Request Example” at the APPENDIX. The output of
gfmismeteo_dss service is an xml file (figure 21) describing the points of the
weather forecast grid and the corresponding weather conditions. The number of
these output points is equal to the number of the input ignition points. (

65
gfmis_dss Service Response xml Example)
For each of these output points, gfmis_dss service output includes:
1. The altitude value (in meters)
2. The necessary (for gfmis_fbms service) weather data, wind speed (in
meters/sec) and wind direction
3. The coordinates of the point (latitude, longitude in WGS84 and x, y in
the Greek Geodetic Reference System GGRS 87)
4. The coordinates of the input fire ignition point (latitude, longitude in
WGS84 and x, y in the Greek Geodetic Reference System GGRS 87)
5. The units of the Euclidian distance value
gfmismeteo_dss service output also includes information about:
• The number of the output points (this number is equal to the number of
input ignition points). This value may be 0 if any error occurs
• The error description and error code, if any error occurs. These values
are empty after success service requests
• The selected date. The date description has 8 digits (4 for the year, 2 for
the month and 2 for the date)
• The selected time. The time description has 2 digits (00, 01,.. ,23)

Figure 21. XSD Schema Diagram of the response of gfmismeteo_dss service describing the weather conditions data round the selected ignition points at a
specific date time

The meteorological data for the selected meteo-stations are the inputs to
the gfmis_fbms service, together with other necessary inputs that are provided
by the user of the FLIRE_DSS (i.e, ignition points, fuel moisture values,
simulation step and duration) , for the Fire behavior modeling and simulation.
An example of the request to the gfmis_fbms is presented below:
http://webservices.gfmis.com:48080/services/controller?area=flire&firenum=1&f
x1=38.078112&fy1=23.928565&livefuel=75&markerType=&measnum=3&oneho
ur=7&simdur=180&simsteps=60&wd1=285&wd2=180&wd3=250&ws1=6.25&ws
2=8.5&ws3=7.14&x1=37.95861111&x2=38.00333333&x3=37.93000031&y1=23
.75333333&y2=23.8575&y3=23.93000031&z1=168&z2=165&z3=94
where:
• simdur ->Simulation Duration (min)
• simsteps -> Simulation Step (min)
• fx(n) -> latitude of fire ignition point
• fy(n) -> longitude of fire ignition point
• x(n) -> latitude of wind measurement station,
• y(n) -> longitude of wind measurement station
• z(n) -> elevation of wind measurement station,
• wd(n) -> wind direction measured at (n) meteo station (degrees)
• ws(n) -> wind speed measured at (n) meteo station (m/s)
GFMIS-fbms service outputs a kml file with points describing the evolution
of fire and including information for the estimated fire behavior values (i.e
fireline intensity, Rate of spread, flame length) for each point.
In order to display the output of gfmis_fbms service there were three
alternatives:
1) To use Google API capability to load and display kml files.
Unfortunately, Size and Complexity Restrictions for KML Rendering in
Google Maps1 are not constant and prohibit this alternative.
1 https://developers.google.com/kml/documentation/mapsSupport

68
2) To use Mapserver in order to download (to flire web server) and render
kml file containing gfmis service output. This alternative has two major
issues.
a) Since Mapserver sends to the web browser an image (i.e. using
WMS format) with kml objects, extra Javascript code should be
written to handle the event that the user may click on a point (of
gfmis service output) to get information about that point. Of course,
this would be implemented using WFS of Mapserver for example.
b) gfmis service outputs a too complex, for Mapserver, specifications
kml file.
3) To parse gfmis_fbms service output in browser and to use Javascript to
process and display gfmis_fbms output data on map. This is the
alternative chosen to be implemented. An issue of this approach is that
an ajax request must be performed to get gfmis service output file from
gfmis server. Since, gfmis service output files are hosted in a different
server (gfmis server) than flire web server, cross-domain ajax calls are
required to get kml file from gfmis server. Web browsers prohibit cross-
domain ajax calls due to security reasons, unless the user modify the
web browser security options (that must be avoided). The solution
applied is that an .asp application (bypass.asp) is hosted by flire web
server that receives ajax requests from web browser, makes the
requests to gfmis server and returns gfmis server response back to web
browser. Using this solution, the web browser makes an ajax request to
flire web server and it receives the response from the same server. In
this way, no cross-domain ajax calls are made.
4) With the followed approach, when the browser receives the response,
with the kml output of gfmis service, it parses it and organizes the gfmis
output points to different time steps for the user to have the ability to
select any time step to display on map or to have a slide show of the
available time steps (figure 22).
Figure 22. The methodology of parcing.

69
4.3. KBDI web service
KBDI is a soil/duff drought index that ranges from 0 (no drought) to 800
(extreme drought) and is based on the soil capacity in 8 inches (200 mm) of
water. The depth of soil required to hold 8 inches of moisture varies.
For the needs of FLIRE and its DSS, KBDI has been designed as a web service
routine to which only authorized user (FLIRE DSS) can have access. It provides
a range of values that have been calculated by using the follow equation:
KBDIt is the actual Keetch-Byram Index (absolute value)
KBDIt-1 is the Keetch-Byram Index value of the previous day (absolute value)
DF is the Drought Factor (absolute value)
Tmax is the daily maximum dry bulb temperature in oC
AnnRain is the mean annual rainfall (in mm) of the envisaged area. The
precipitation of the last twenty-four hours is taken into account in order to
calibrate the above KBDI calculated value and to estimate the final KBDI value
for the day of interest.
. This index is cumulative, based on the previous day value and is
calculated once per day, every morning, for each station that is located within
the area of interest ., using the meteorological data of the previous twenty-four
hours There are four classes of fire danger associated to respective range of
KBDI values as follows:

70
• KBDI = 0 - 25: Soil moisture and large class fuel moisture is high and
do not contribute much to fire intensity. Typical of spring dormant
season following winter precipitation.
• KBDI = 25 - 100: Typical of late spring, early growing season. Lower
litter and duff layers are drying and beginning to contribute to fire
intensity.
• KBDI = 100 - 150: Typical of late summer, early fall. Lower litter and
duff layers actively contribute to fire intensity and will burn actively.
• KBDI > 150: Often associated with more severe drought with
increased wildfire occurrence. Intense, deep burning fires with
significant downwind spotting can be expected. Live fuels can also
be expected to burn actively at these levels.
These classes have been defined in proportion to the classification of the
original values of KBDI (0-800) calculated using the US customary units.
Therefore these classes are tuned according to observations in the area during
the fire season.
KBDI web service requires a string of data in xml format. Each weather
station in the application area is associated with a KBDI value based on the
daily value of its meteorological parameters. For the calculation of the index, the
Maximum Daily Temperature, the total precipitation measured during the last
24 hours and the previous day KBDI value, the new KBDI value and class is
calculated for the specific station.
Aggregated data from both monitoring networks, HOA and NOA, are
provided to this module. More specifically the following two parameters for a
number of locations in the study area are required: a) daily temperature maxima
and b) total daily rainfall. At first, 14 meteorological monitoring stations located
within and around the project area have been identified. The functionality of the
software routine enhydris2xml has been expanded to perform aggregations of
the two parameters as required by the specifications. Thus, disaggregated
timeseries with a time step of 10-15 minutes are aggregated to daily maximum
temperatures and total rainfall for a given day.
Data are validated on-the-fly for the following cases, while the http-request
is processed:

71
• Extreme values, exceeding given upper and lower limits for each
parameter
• The results of aggregated values have to be based on a minimum
number of disaggregated data.
The aggregated values are discarded if the above criteria are not met.
The same procedure and protocol (HTTP) as for the transmission of data to
FORTH is used. The values are returned with the same XML-schema (see
Error! Reference source not found.), using elements “Temperature” and
Rainfall” for the daily maximum temperature and the daily aggregated rainfall
respectively. The syntax of the URL request must match the following pattern:
http://hoa.ntua.gr/flire/algosystems/YYYY-mm-dd/HH:MM/ where:
YYYY
mm
dd
HH
MM
is the year with century as a decimal number
is the month as a two-digit decimal number [01,12]
is the day of the month as a two-digit decimal number
[01,31]
is the hour (24-hour clock) as a decimal number [00,23]
is the minute as a two-digit decimal number [00,59].
The returned values are 24 hours aggregated values starting from the
given date and time, documented by the “Timestamp” element. Alternatively,
the URL http://hoa.ntua.gr/flire/algosystems/ returns the daily aggregated values
for the last available 24 hours.

72
4.4. Static Map Overlays Rendering - File Map Tile Creator
(FMTC)
Flire project web site has the ability to display a lot of overlays with static
cartographic data as land use coverage, etc. Since, these overlays are static
they can be converted to static tile files just as Google Maps, Bing Maps, etc.
A software program (called “Flire Map Tile Creator - FMTC”, figure 23) is built in
order to create map tiles that can be used by Google Maps api, satisfying the
specifications of WMS Tiling Client Recommendation of OSGeo (OSGEO
2013).
Figure 23. Workflow of the FMTC.
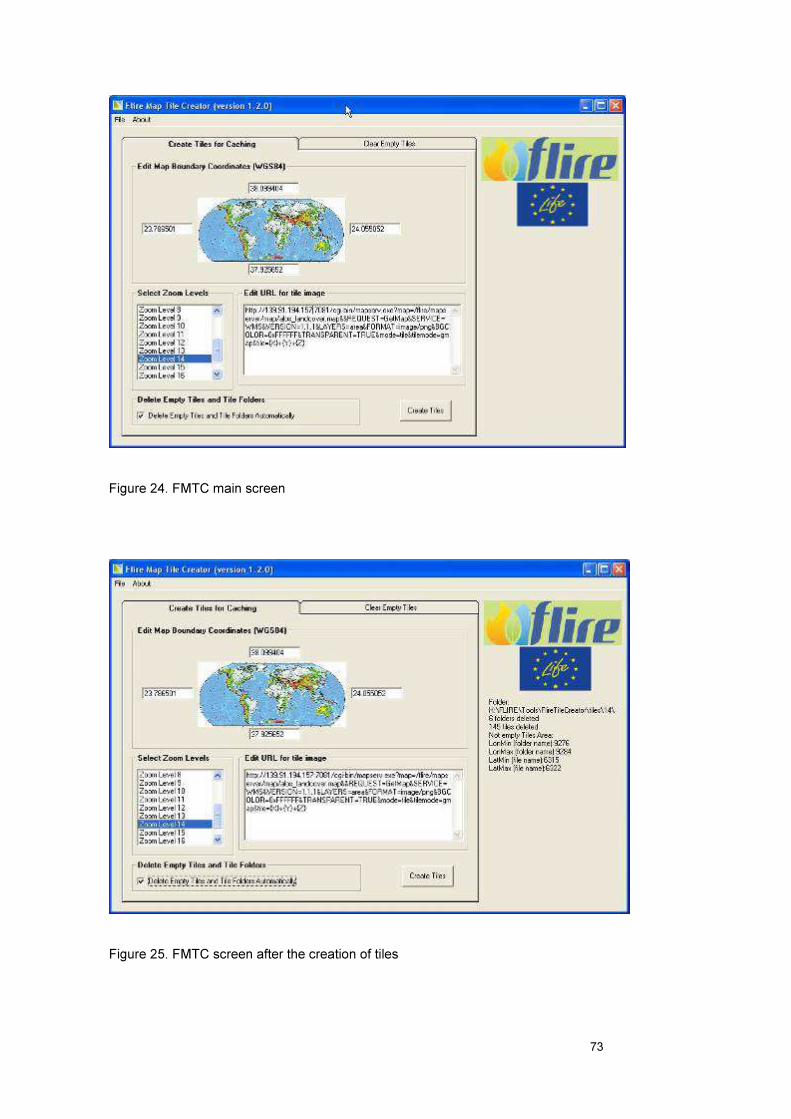
73
Figure 24. FMTC main screen
Figure 25. FMTC screen after the creation of tiles

74
Some of the characteristics of FMTC are:
1. It is developed using Visual Basic 6 so it can be updated or extended
easily.
2. It has a very simple user interface without any need of user training (
3. Figure and
4. Figure).
5. FMTC takes as input only few parameters (about the map area) inserted
by the user. Examples of such parameters are the zoom levels for tiles
files to create, the bounds of the map area of interest and the mapserver
url (where x, y and zoom level values are replaced by {x}, {y} and {z}) to
make the tile requests. Most of these parameters can be saved in an .ini
file that the user can load them easily, at any time in the future (
6. Figure).
7.
Figure 26. Example of .ini file with map area parameters that FMTC can load and
use.
8. FMTC runs without the need of any user monitoring due to the time
consuming operation to create the tiles for some zoom levels.
9. After the tiles creation, FMTC automatically browses every created tile
file and it compares it with a prototype empty tile created by FMTC. All
tiles found identical with the empty tiles are deleted to free server
storage space.
10. A complete report is exported after each execution with information
about the created tiles, number of empty and deleted tiles etc (
11. Figure 1).

75
Figure 1. Example of FMTC output log file
12. FMTC can be executed simultaneously on different machines in order to
eliminate the necessary time for the tiles creation.
13. FMTC can be executed simultaneously on the same machine creating
tiles for different map sources.
14. Tiles creation and storage satisfies the TMS file storage scheme of
MetaCarta Labs (TileCache 2013). Each tile is described by three values
(x, y and zoom level). For each specific zoom level there is a folder with
name the number of the zoom level. In this folder, there is a subfolder
for each x value of tiles of that zoom level. Each tile file has as file name
the y value of the tile (with extension “.png”) and it is stored in the
subfolder having as name the x value of the tile, in the folder with name
the zoom level. (Figure 2)

76
Figure 2. Part of the tiles files structure where zoom 14 folder in open having 9
subfolders for 9 available x values.
15. FMTC creates tiles to be used with Google Maps api, so it uses
“Mercator Profile” from the specifications of WMS Tiling Client
Recommendation, since Google Tiles Coordinates (Google Maps, 2013)
are not in WGS84 system (like MetaCarta’s “Geodetic Profile”).

77
5. DSS Server - FLIRE GUI
All the above mentioned systems are accessible from the FLIRE web site
(www.flire.eu) for authorizes users. Having as backbone a windows-based
server, DSS application has a GUI with different tabs; each one has a different
role in the system.
The Graphical User Interface (GUI) hosts all the previous tools and
models of the system. It has been designed in such a way that the users don't
have to install and use any specific software. The system is web-based (figure
29), which means that the end user can use his/her own computer system in
order to access it. The system is accessible from any location the end user may
be, even through personal smartphones or tablet pc.
All the components of the system, mentioned in the previous chapters, will
be accessible via the FLIRE web site (www.flire.eu) under user authorization
protocol. The figures of the system present the mockup that has been
developed till now.
The DSS architecture implements 5 tabs in the GUI, namely (A) Map, (B)
Weather Forecast Data, (C) Weather Stations, (D) Fire Management System,
(E) KBDI and (F) Flood Management System. In the next sessions, for each
tab, the system functionalities are presented and analytical instructions on the
tools and controls that are available are provided.

78
Figure 29. The entrance page of the web site of the FLIRE
5.1. Tab A.
Tab (A) has the role of the GIS platform where all the spatial data are
loaded and presented to the users (figure 30). Here the user can visualize and
explore the results of the fire and flood models, as these results automatically
are presented to the viewer after the creation. Also the user can load and
visualize the area of the project as a polygon file, the weather forecast grid for
selected date as a gridpoint file, the weather stations as locations and also the
hybrid landuse/landcover, as a multipolygon file, that has been created for the
needs of the project.

Figure 30. The GIS viewer of the FLIRE website.

In order to improve the performance of the system, a small submenu
(figure 31) has been designed in the website which includes and presents
several statistics on the performance of the systems. Successful requests,
Mean response time (in sec), Last response time (in sec) and Failed requests
are the four metrics that are calculated automatically every time the user runs
requests in order to retrieve the weather station data, the weather forecast data,
the response of the G-FMIS System data and the response of the Flood
management System.
Figure 31. Flire Website statistics submenu.
5.2. Tab B.
Tab (B) provide the weather forecast data from NOA, in both XML and
KML format. After the using of the NoaForecastData tool (Section 2.1), forecast
data are arranged in a file-based database system. Data are available per
month/week/day from March 2013 to date (figure 32).
Regarding further process of available datasets for each day, the user has
the following options:

81
1. Load the coverage on the map (tab A).
2. Download Data files in KMZ file.
3. Download Data files in XML.ZIP file.
By selecting the first option, the data are automatically loaded on the tab
A and for each point a balloon has been created, containing all the weather
forecast data (figure 33). The user can download them either in KMZ or XML
format for further use in other applications.
When the user want to load/use data for a specific date, by clicking on the
desired month, a list of all the available days is presented. The same options as
above are available for the days.

Figure 32 Catalogs of months with weather forecast data.

Figure 33. The grid with weather forecast data for a selected date. Note the table with the data that has been created for the selected point.

The user has the opportunity to select data for a specific time of the
selected day. By selecting a desired time, the data are analyzed and for each
forecast parameter, a thematic map is produced. Meanwhile, data are available
for download in KMZ and XML format for the time the user wants.
For the forecast parameters of (1) temperature, (2) relative humidity, (3)
hourly rain and (4) wind speed and for a more clear visualization of the data, a
proportional scalable symbology of 9 steps has been selected (figure 34). For
the weather forecast parameter of (5) weather direction, an arrow is used to
indicate the direction of the wind (8 directions) (figure 35).
Also, the hourly forecast data can be used for the Decision Support of Fire
Management System (figure 36), in cases that the authorities want to run and
simulate some WHAT-IF scenarios of fire in periods and areas sensitive to a fire
(hospitals, forest camping's, military areas, etc).

Figure 34. The 9 steps proportional symbology for the rain forecast.
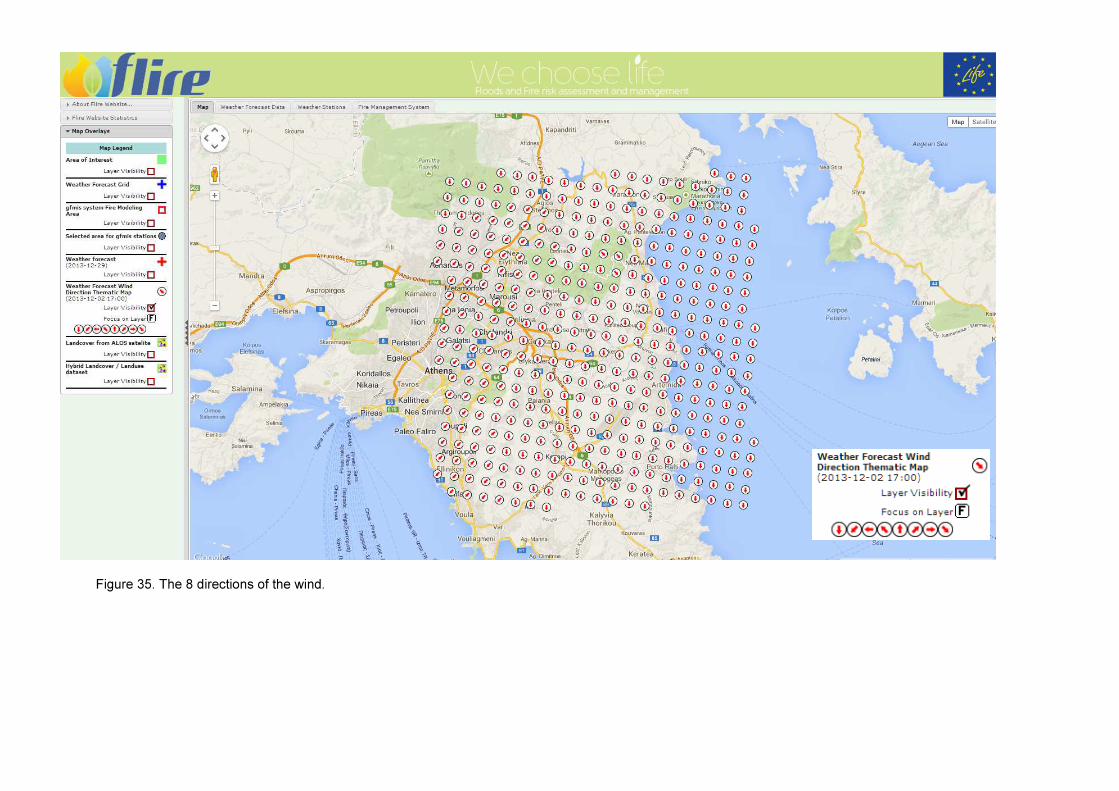
Figure 35. The 8 directions of the wind.

Figure 36. By clicking on the underling text, these data are using in the Fire
Management System.

88
5.3. Tab C.
Tab (C) provides the data from the weather stations for a given time the
end user access the modelling tools. Note that the weather stations data are
retrieved in real time from the HOA system (http://hoa.ntua.gr/) and thus, if the
user needs time series for the given stations, has to retrieve them via this
system. The user has the ability to control the following tasks from this tab:
• Request Timeout (seconds): 120
• Consider as old data older than: 4
hours
If a slow network connection is used, the user can increase the request
time in order to allow more time for this action. Sparsely the default value of 120
seconds drives the system to timeout. A value between 120 and 400 seconds is
the appropriate even for connection via cellular network (3G mobile network).
As the weather stations are in remote locations, situated in several
locations in the Attiki region and in FLIRE project area, the may stop working or
transmitting data for several technical reasons. To this end, 4 different controls,
which have the format of click boxes, have been designed, in order to handle
and display weather stations with old data:
• Red color
• Line through
• Italic
• Ignore them
By using the abovementioned options, the user can decide to use or reject
the data from stations that provide data older that the time he has define in the
appropriate tab. For the purposes of the project, a default value of four hours,
after which the data are considered old and the user can either reject them from
the modelling approach or use them being aware of which stations provide
these data, is selected. These stations can be marked with line through, by
using red color to the fonts or by using italics.

89
Figures 37 and 38 present the process of a request and the successful
return of the weather stations data.
Figure 37. Process of the request for weather stations data.
Figure 38. Successful return of weather stations data. Note the red color fonts for the
stations with weather data older than 4 hours.

90
By clicking on the name of the station (column Station Name) the systems
immediately transfer the view to the tab A and zoom to the location of the
station (figure 39). A table is created for the selected station, comprising all the
weather data. By clicking on the location, appears in the form of a balloon
(figure 40).
Figure 39. Weather station data for Penteli Station. Data are for the time that is
selected.
Also, as pervious mentioned, the data are stored in HOA systems. Thus,
the column with the name Host, has hyperlink for each station. By clicking on it,
a new tab opens in a web browser and transfers the user to the specifications of
the station as these are stored and presented by HOA website (figure 41).

Figure 40. In the center of the map is located the selected weather station.

Figure 41. Detailed information for the selected station, as provided by the host system,
HOA.

93
5.4. Tab D.
Tab (D) (figure 42) provides the controls for the G-FMIS model. There are 4
sectors in this tab:
1. Geographic Fire Management Information System Options
2. Geographic Fire Management Information System Use
3. Manually Set of parameters for gfmis service
4. Decision Support System with gfmis service


95
Figure 42. G-FMIS system tab

The first sector provides the tools related to the options of the system which are:
• Request Timeout (seconds): 120
• Fire Management Information System Output Processing Timeout
(seconds): 40
• Click to clear all ignition points.
If a slow network connection is used, the user can increase the request
time in order to provide to the system more time for this action. Sparsely the
default value of 120 seconds drives the system to timeout. A value between 120
and 400 seconds is the appropriate even for connection via cellular network (3G
mobile network). Also, as the fire model is in a remote location, for several
technical reasons can stop or slow down to return the results of the model. For
these reasons the user can increase the output processing timeout. Another
control is related to the ignition points. After their insertion, by clicking on the
underline text, all the inserted ignition points are erased from the map. The
system can accept up to four ignition points. This is crucial in the cases that it is
desirable to predict the behavior of a fire front that has several kilometers length
but also the case of more that one locations of fire in the area of the project.
The second sector provides the tools for the use of the fire tool:
1. Click to insert ignition point for fire management
information system.
2. Update Weather observation stations data.
3. Focus map on selected area of interest for gfmis service.
4. Weather Stations located within the selected area.
The first (1) allows the user to insert a point which indicates the location
that a fire starts. The second (2) updates the weather observations stations
data, as the system needs the updated data for the modeling. The third (3)
transfers the user to the tab A and enables a buffer zone, from which, the
weather stations that are located in, will be used for the modeling. The biggest

97
the buffer, the more stations data will be used. The fourth (4) provides the user
information about the weather stations that are located in the buffer zone. A
popup window appears and contains the stations names (figure 43).
Figure 43. The popup window which contains information about the stations that are
located in the buffer zone.
When the user provides to the system all the necessary elements for the
model, by clicking the button "Send Request to gfmis" a request is send to the
GFMIS server and after a given time, it returns the spread of the fire for the next
3 hours (figure 44).


99
Figure 44. The spread of the fire for the next 3 hours in a given location.

In the third sector the experiences user can insert manual the parameters
for the model, if hi/her has them. This is not recommended for not experienced
users on issues related to the fire system. The request has the form of the
following URL: "http://webservices.g-fmis.com:48080/services/controller?
area=flire&firenum=1&fx1=38.006281&fy1=23.921322&x1=38.00123&y1=23.
928607&z1=133.0&ws1=3.116&wd1=1&measnum=1&livefuel=75&markerTy
pe=&onehour=7&simdur=180&simsteps=60"
After the manual entry of the parameters and adding manual either the
ignition point on the map nor the coordinates of the location, the user first by
clicking the button "Calc Parameters for gfmis", the system calculates them
and after by clicking the button "Send Request to gfmis", a request is send to
the GFMIS server and after a given time, it returns the spread of the fire for the
next 3 hours, as previous.
The fourth sector is related to the WHAT-IF scenarios. This part of the tool
act as a Decision Support System (figure 45). It is designed in a such way that
the authorities related to the civil protection, if the weather conditions are prone
to fire conditions, to have the tools to run simulations about the potential spread
of a fire front in sensitive and strategic locations.
Figure 45. DSS tool for gfmis service.
The first step navigates the user to tab B, where the forecast data are
available. Thus, it prompts the user to select time and date, for which the
outcome of a fire is requested. The second step navigates the user to tab A, the
GIS platform, in which the fire ignition point has been imported manually. After
these two steps, the parameters for the DSS and the request to gfmis will be
calculated in order to produce the results.

101
Testing the system after the development of the mockup, a series of 100
ignition point scenarios using real time weather data were testing in order to
evaluate the response time of the model and thus to be considered as a real
time support system. After running 100 simulations (figure 46) on the website,
G-FMIS model has response after cold start in about 27 seconds (mean value)
with maximum at 61 seconds and minimum at 23 seconds. In few cases the
return of the results exceeds 35 seconds. Same results are produced also by
using the weather forecast data.
Figure 46. The response of the GFMIS system in seconds.

102
5.5. Tab E.
Tab (E) (figure 47) provides the controls for the G-FMIS model. There are
3 sectors in this tab:
• Keetch - Byram Drought Index Options
• Parameters for Keetch-Byram Drought Index Data request
• Keetch-Byram Drought Index Data
The first sector provides the tools related to the options of the system
which is:
• Request Timeout (seconds): 120
If a slow network connection is used, the user can increase the request
time in order to provide to the system more time for this action. Sparsely the
default value of 120 seconds drives the system to timeout. A value between 120
and 400 seconds is the appropriate even for connection via cellular network (3G
mobile network).
The second sector provides the tools related to the days that KBDI index
will be provided to the users by request.

Figure 47. The controls of the second sector.

The first step is the selection of the first date for the KBDI index while the
second step is the definition of the number of days for the KBDI that the user
will receive. After the completion of these steps and the press of the appropriate
button, a list of stations and the calculated KBDI indexes is listed below (figure
48).
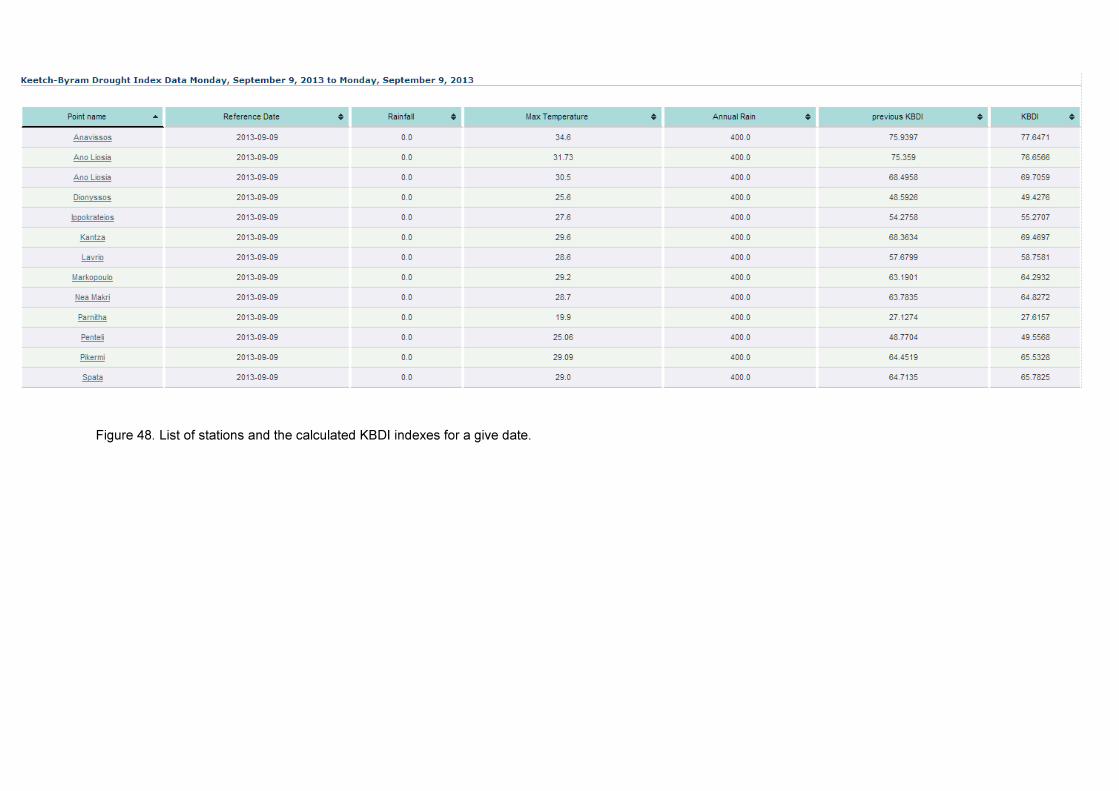
Figure 48. List of stations and the calculated KBDI indexes for a give date.

By clicking on the stations name, the system transfer you to tab A and
displays the station's location. By clicking the symbol, a table appears in the
popup balloon (figure 49) which includes the following information:
• Reference Date
• Rainfall
• Max Temperature
• Annual Rain
• previous KBDI
• KBDI

Figure 49: The popup balloon of the station which contains the abovementioned information.

6. Conclusions
The key objective of this action is the design and implementation of a S-
DSS system which will cope and integrate all the developed tools of the FLIRE
project. This system will help decision-makers to compile useful information to
identify and assess problems and help in making decisions. It will support an
effective approach of flood and fire risk management, based on state-of-the-art
technology, making use of the outcomes of scientific research. Meanwhile, the
developed technology of this action could be applied also to other locations in
Europe as all the developed tools have been designed by using open source
programming languages and software.
The outcomes of this action are the following:
• a file-based spatial database system that will contain all the outputs from
hydrologic and hydraulic models (off-line integration), as well as all other
spatial data that are required in DSS flood and fire visualizations. This
database will contain both raster and vector file formats as well as other
formats that are required by the DSS functions.
• a web-service for the DSS communication with the water forecasting models
server;
• a web-service for the DSS communication with the fire model server (on-line
integration);
• a web service for the DSS communication with the appropriate servers
providing background information;
• a scenario management tool capable of storing the various scenarios
parameters, as well as to match flood alert with the most close scenario.
• A core DSS mining tool which will retrieve the respective to the selected
scenario models outputs from the geodatabase.
• A web service for early warning messages dispatching.
• A web-based Graphical User Interface.

109
• The I/O infrastructure for the data and information flow among the DSS
parts.
7. Literature
� Andrews, P. L. & C. H. Chase. 1989. BEHAVE: fire behavior prediction and fuel
modeling system - BURN subsystem, part 2. General Technical Report INT-260.
Ogden, UT: U.S. Department of Agriculture, Forest Service, Intermountain
Research Station, pp. 96.
� Andrews, P. L. 1986. BEHAVE: Fire behavior prediction and fuel modeling system
— BURN Subsystem, Part 1, Gen. Tech. Rep. INT-194. Ogden, UT: U.S.
Department of Agriculture, Forest Service, Intermountain Forest and Range
Experiment Station, pp. 133.
� McIntosh, B.S., Ascough II, J.C., Twery, M., Chew, J., Elmahdi, A., Haase, D.,
Harou, J.J., Hepting, D., Cuddy, S., Jakeman, A.J., Chen, S., Kassahun, A.,
Lautenbach, S., Matthews, K., Merritt, W., Quinn, N.W.T., Rodriguez-Roda, I.,
Sieber, S., Stavenga, M., Sulis, A. Ticehurst, J., Volk, M., Wrobel, M., van Delden,
H., El-Sawah S., Rizzoli A., and Voinov, A. 2011. Environmental decision support
systems (EDSS) development – challenges and best practices. Environmental
Modelling and Software, 26, 1389-1402
� Batty, M. 2008. Planning Support Systems, Progress, predictions and speculations
on the shape of things to come, in: Brail, R. K. (Eds.), Planning Support Systems for
cities and regions, Lincoln Institute of land policy, Cambridge, Massachusetts.
� Blecic, I., A. Cecchini and G.A. Trunfio. 2009. A General-purpose Geosimulation
Infrastructure for Spatial Decision Support.Transaction on Computational Science
VI, LNCS, 5730, p. 200–218.
� Böhner, C. 2006. Decision-support systems for sustainable urban Planning.
International Journal of Environmental Technology and Management, 6, p. 193 –
205.
� Bonazountas, M., Kallidromitou, D., Kassomenos, P. A. and Passas, N. 2007. A
decision support system for managing forest fire casualties. Journal of
Environmental Management, 84, 412–418
� Burgan, R. E. & R. C. Rothermel. 1984. BEHAVE: fire behavior prediction and fuel
modeling system - FUEL subsystem. General Technical Report INT-167. Ogden,
UT: U.S. Department of Agriculture, Forest Service, Intermountain Forest and
Range Experiment Station, pp. 126.
� Christophides, A., "loggertodb," 2013. (Online). Available:
http://pthelma.readthedocs.org/en/latest/loggertodb.html. (Accessed November
2013).

110
� Chrysoulakis, N., Lopes, M., San José, R., Grimmond, C.S.B., Jones, M.B.,
Magliulo, V., Klostermann, J.E.M., Synnefa, A., Mitraka, Z., Castro, E., González,
A., Vogt, R., Vesala, T., Spano, D., Pigeon, G., Freer-Smith, P., Staszewski, T.,
Hodges, N., Mills, G. and C. Cartalis. 2012. Sustainable urban metabolism as a link
between bio-physical sciences and urban planning: the BRIDGE project. Landscape
and Urban Planning, 10.1016/j.landurbplan.2012.12.005.
� Chrysoulakis, N., Mitraka, Z., Diamantakis, E., González, A., Castro, E. A., San
Josë, R. and I. Blecic. 2010. Accounting for urban metabolism in urban planning.
The case of BRIDGE. In: CD-ROM of Proceedings of the 10th International
Conference on Design & Decision Support Systems in Architecture and Urban
Planning, organized by the Technical University of Einhoven, in Eindhoven, The
Netherlands (July 19-22).
� Dijkstra, E. W. 1959. A note on two problems in connexion with graphs. Numerische
Mathematik 1: 269–271.
� Noonan-Wright, E.K., Opperman, T.S., Finney, A.M., et al., Developing the US
Wildland Fire Decision Support System. 2011. Journal of Combustion. Article ID
168473, 14 pages. doi:10.1155/2011/168473
� Eurostat 2011. Forestry Statistics, Eurostat Pocketbooks, 2011 Edition.
� Giupponi, C., Sgobbi, A. 2013. Decision Support Systems for Water Resources
Management in Developing Countries: Learning from Experiences in Africa. Water
5: 798-818.
� Google Maps 2013, Tile Coordinates, accessed at 17/12/2013.
https://developers.google.com/maps/documentation/javascript/maptypes#TileCoordi
nates
� Haag, S. & M., Cummings. 2000. Management Information Systems: For The
Information Age. McGraw-Hill Ryerson Limited: 136-140. ISBN 0-07-281947-2
� Bhargava, K.H., Power, J.D. and D. Sun. Progress in Web-based decision support
technologies. 2007. Decision Support Systems 43(4):1083-1095.
� Honghai Q., and M.S. Altinakar. 2011. A GIS-based decision support system for
integrated flood management under uncertainty with two dimensional numerical
simulations. 2011. Environmental Modelling & Software 26, 817-821.
� ISO 8601. (2013, November 11). In Wikipedia, The Free Encyclopedia. Retrieved
12:34, November 15, 2013, from
http://en.wikipedia.org/w/index.php?title=ISO_8601&oldid=581239418.
� IUCN, 2000. Global Review of Forest Fires. pp 66.
� Kalabokidis, K., Xanthopoulos, G., Moore, P., Caballero, D., Kallos, G., Llorens, J.,
Roussou, O., and C. Vasilakos. Decision support system for forest fire protection in
the Euro-Mediterranean region. 2012. European Journal of Forest Research
131(3):597-608.

111
� Keetch John & George Byram, 1968. "A drought index for forest fire control." Res.
Paper SE-38. Asheville, NC: U.S. Department of Agriculture, Forest Service,
Southeastern Forest Experiment Station. 32 pp.
� Kotroni, V. & K. Lagouvardos, 2004. Evaluation of MM5 High-Resolution Real-Time
Forecasts over the Urban Area of Athens, Greece. J. Appl. Meteor., 43, 1666–1678
� Koutsoyiannis, D., G. Karavokiros, A. Efstratiadis, N. Mamassis, A. Koukouvinos,
and A. Christofides. 2003. A decision support system for the management of the
water resource system of Athens, Physics and Chemistry of the Earth, 28 (14-15),
599–609.
� Marakas, G. M. 1999. Decision support systems in the twenty-first century. Upper
Saddle River, N.J., Prentice Hall.
� Nyerged, T. 2010. Regional and urban GIS: a decision support approach, A Division
of Guilford Publications, Inc, New York, USA.
� openmeteo.org, "Enhydris homepage," (Online). Available: http://openmeteo.org.
(Accessed Jan. 2013).
� OSGEO, 2013 accessed at 17/12/2013.
http://wiki.osgeo.org/wiki/WMS_Tiling_Client_Recommendation#Tile_Grid_Definitio
n,
� P.D. Coddington, K.A. Hawick, H.A. James. 1999. Web-based access to distributed
high-performance geographic information systems for decision support,
Proceedings of the 32nd Hawaii International Conference on System Sciences.
� Prevention Web 2011. Disaster statistics from the Prevention Web, accessed on
December 5, 2013 at URL
http://www.preventionweb.net/english/countries/statistics/index_region.php?rid=3
� Robayo, O. 2005. Map to Map: Converting a NEXRAD Rainfall Map into a Flood
Inundation Map. The University of Texas at Austin, Dissertation.
� Robert E. Burgan. 1988. 1988 revisions to the 1978 National Fire-Danger Rating
System. Res. Pap. SE-273. Asheville, NC: U.S. Department of Agriculture, Forest
Service, Southeastern Forest Experiment Station. 39 pp.
� Rothermel, R. C. 1983. How to predict the spread and intensity of forest and range
fires, Gen. Tech. Rep.INT-143. Ogden, UT: U.S. Department of Agriculture, Forest
Service, Intermountain Forest and Range Experiment Station, pp. 161.
� Simonovic, S.P. 1996. Decision Support Systems For Sustainable
Management Of Water Resources 1. General Principles, Water International,
Vol21, No.4, 223-232.
� Simonovic, S.P. 1996a. Decision Support Systems For Sustainable
Management Of WaterResources 2. Case Studies, Water International, Vol.21,
No4, 233-244.
� Sprague, R. H. and E. D. Carlson. 1982. Building effective decision support
systems. Englewood Cliffs, N.J., Prentice-Hall. ISBN 0-13-086215-0

112
� Sprague, R. 1980. A Framework or the Development of Decision Support Systems.
MIS Quarterly. Vol. 4, No. 4, pp.1-25.
� Stocks, B.J., Lawson, B.D. Alexander, M.E., Van Wagner C.E., McAlpine, R.S.,
Lynham, T.J. and Dube, D.E. 1989. The Canadian Forest Fire Danger Rating
System: An Overview, Forestry Chronicle Vol. 65 (6): 450-457.
� TileCache 2013, accessed at 17/12/2013. ver. 2.11,
http://tilecache.org/docs/README.html.
� Hydrologic Engineering Center. 2009. HEC-DSSVue. HEC Data Storage System
Visual Utility Engine. User's Manual v. 2.0. US Army Corps of Engineers.
� Hydrologic Engineering Center. 2010a. Hydrologic Modeling System HEC-HMS,
User's Manual v.3.5. US Army Corps of Engineers
� Hydrologic Engineering Center. 2010b. HEC-RAS, River Analysis System, User's
Manual v. 4.1. US Army Corps of Engineers.

113
APPENDIX

114
gfmis_dss Service Request Example
http://<web-server>/flire/gfmis_dss.asp?
date=20130402&time=01&pointscnt=2&fy1=38.02873&fx1=23.885788&fy2=3
8.031435&fx2=23.913425
The date description must have 8 digits format (4 digits for the year, 2 digits for
the month and 2 digits for the date) and the time description must have 2 digits
format (00, 01,.. ,23).

115
gfmis_dss Service Response xml Example
<?xml version="1.0" encoding="utf-8"?> <flire-weather-forecast-points resultscount="2" date="20130402" time="01"> <info> <error_reason> </error_reason> <error_code> </error_code> </info> <point distance="1082.63810491357" units="m"> <altitude>303.2</altitude> <data> <wind_speed>1.8</wind_speed> <wind_direction>285</wind_direction> </data> <coordinates> <latitude>38.024</latitude> <longitude>23.875</longitude> <x>488880.05</x> <y>4208197.52</y> </coordinates> <input> <lat>38.02873</lat> <lon>23.885788</lon> <x>489827.548103273</x> <y>4208721.30679871</y> </input> </point> <point distance="492.105006454047" units="m"> <altitude>294.4</altitude> <data> <wind_speed>2.1</wind_speed> <wind_direction>264</wind_direction> </data> <coordinates> <latitude>38.034</latitude> <longitude>23.918</longitude> <x>492655.04</x> <y>4209303.09</y> </coordinates> <input> <lat>38.031435</lat> <lon>23.913425</lon> <x>492253.348189872</x> <y>4209018.81719607</y> </input>

116
gfmis Output Points Display
When the browser receives the response, with the kml output of gfmis
service, it parses it and organizes the gfmis output points to different time
steps for the user to have the ability to select any time step to display on
map or to have a slide show of the available time steps.
figure 3. gfmis service output message
The following table includes all the icons used to describe gfmis output
points.
icons explanation
, ,
etc
Icons used to display on map the output
points of the corresponding time steps and
for buttons to select the corresponding time
steps.
Icon used to display on map the output points
of the last time step and for buttons to select

117
the last time step.
Icon used to display on map the output points
of all steps greater than a limit (default value
is 10) and for buttons to select that points.
Icon used only for buttons in order to display
the points of all time steps.

Available Weather Forecast Data Catalogs Service. Requests and Responses Examples
Catalog of months with available weather forecast data
http://<web-server>/flire/weatherforecastdata.asp?cmd=getmonths
<?xml version="1.0" encoding="utf-8"?> <available-weather-forecast-data querytype="getmonths" resultscount="5"> <month value="201303" longvalue="201303" formatedvalue="2013-03" /> <month value="201304" longvalue="201304" formatedvalue="2013-04" /> <month value="201305" longvalue="201305" formatedvalue="2013-05" /> <month value="201306" longvalue="201306" formatedvalue="2013-06" /> <month value="201307" longvalue="201307" formatedvalue="2013-07" /> </available-weather-forecast-data>

119
Catalog of dates of a specific month with available weather forecast data
http://<web-server>/flire/weatherforecastdata.asp?cmd=getdates&month=201303
<?xml version="1.0" encoding="utf-8"?> <available-weather-forecast-data querytype="getdates" month="201303" resultscount="14"> <month value="201303" longvalue="201303" formatedvalue="2013-03"> <date value="18" longvalue="20130318" formatedvalue="2013-03-18" xmlfile="20130318.xml.zip" kmlfile="20130318.kmz" /> <date value="19" longvalue="20130319" formatedvalue="2013-03-19" xmlfile="20130319.xml.zip" kmlfile="20130319.kmz" /> <date value="20" longvalue="20130320" formatedvalue="2013-03-20" xmlfile="20130320.xml.zip" kmlfile="20130320.kmz" /> <date value="21" longvalue="20130321" formatedvalue="2013-03-21" xmlfile="20130321.xml.zip" kmlfile="20130321.kmz" /> <date value="22" longvalue="20130322" formatedvalue="2013-03-22" xmlfile="20130322.xml.zip" kmlfile="20130322.kmz" /> <date value="23" longvalue="20130323" formatedvalue="2013-03-23" xmlfile="20130323.xml.zip" kmlfile="20130323.kmz" /> <date value="24" longvalue="20130324" formatedvalue="2013-03-24" xmlfile="20130324.xml.zip" kmlfile="20130324.kmz" /> <date value="25" longvalue="20130325" formatedvalue="2013-03-25" xmlfile="20130325.xml.zip" kmlfile="20130325.kmz" /> <date value="26" longvalue="20130326" formatedvalue="2013-03-26" xmlfile="20130326.xml.zip" kmlfile="20130326.kmz" /> <date value="27" longvalue="20130327" formatedvalue="2013-03-27" xmlfile="20130327.xml.zip" kmlfile="20130327.kmz" /> <date value="28" longvalue="20130328" formatedvalue="2013-03-28" xmlfile="20130328.xml.zip" kmlfile="20130328.kmz" /> <date value="29" longvalue="20130329" formatedvalue="2013-03-29" xmlfile="20130329.xml.zip" kmlfile="20130329.kmz" /> <date value="30" longvalue="20130330" formatedvalue="2013-03-30" xmlfile="20130330.xml.zip" kmlfile="20130330.kmz" /> <date value="31" longvalue="20130331" formatedvalue="2013-03-31" xmlfile="20130331.xml.zip" kmlfile="20130331.kmz" /> </month> </available-weather-forecast-data>
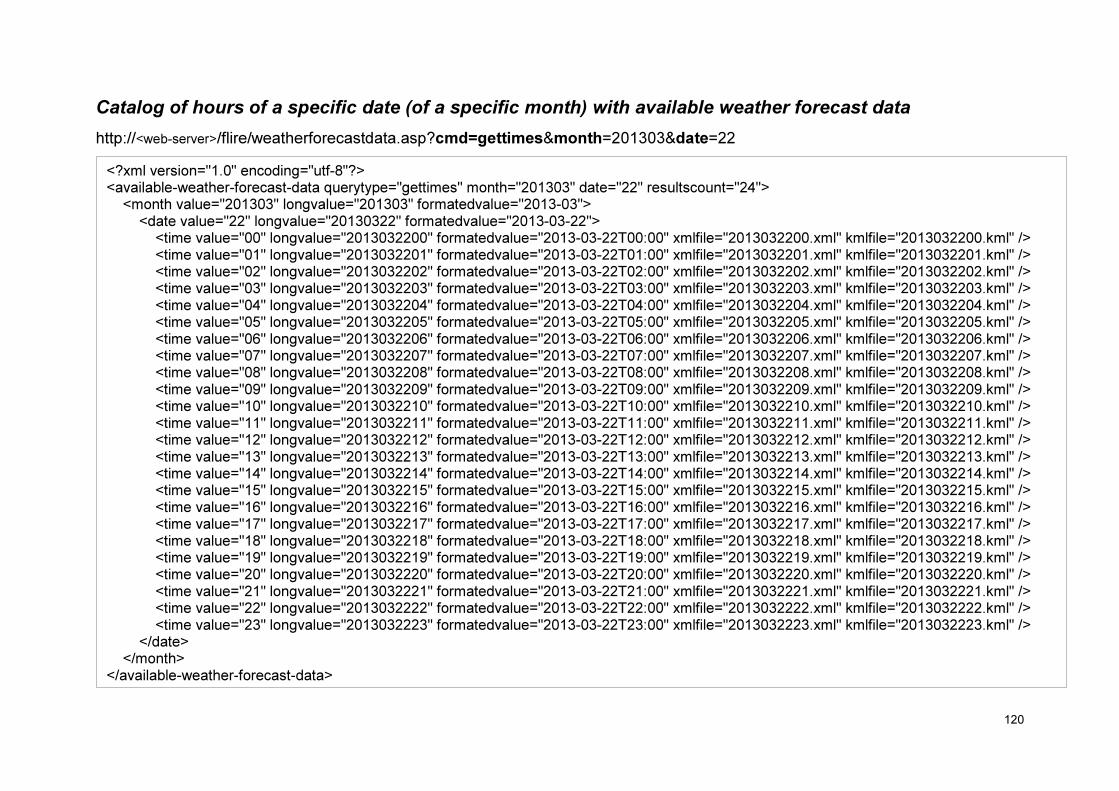
120
Catalog of hours of a specific date (of a specific month) with available weather forecast data
http://<web-server>/flire/weatherforecastdata.asp?cmd=gettimes&month=201303&date=22
<?xml version="1.0" encoding="utf-8"?> <available-weather-forecast-data querytype="gettimes" month="201303" date="22" resultscount="24"> <month value="201303" longvalue="201303" formatedvalue="2013-03"> <date value="22" longvalue="20130322" formatedvalue="2013-03-22"> <time value="00" longvalue="2013032200" formatedvalue="2013-03-22T00:00" xmlfile="2013032200.xml" kmlfile="2013032200.kml" /> <time value="01" longvalue="2013032201" formatedvalue="2013-03-22T01:00" xmlfile="2013032201.xml" kmlfile="2013032201.kml" /> <time value="02" longvalue="2013032202" formatedvalue="2013-03-22T02:00" xmlfile="2013032202.xml" kmlfile="2013032202.kml" /> <time value="03" longvalue="2013032203" formatedvalue="2013-03-22T03:00" xmlfile="2013032203.xml" kmlfile="2013032203.kml" /> <time value="04" longvalue="2013032204" formatedvalue="2013-03-22T04:00" xmlfile="2013032204.xml" kmlfile="2013032204.kml" /> <time value="05" longvalue="2013032205" formatedvalue="2013-03-22T05:00" xmlfile="2013032205.xml" kmlfile="2013032205.kml" /> <time value="06" longvalue="2013032206" formatedvalue="2013-03-22T06:00" xmlfile="2013032206.xml" kmlfile="2013032206.kml" /> <time value="07" longvalue="2013032207" formatedvalue="2013-03-22T07:00" xmlfile="2013032207.xml" kmlfile="2013032207.kml" /> <time value="08" longvalue="2013032208" formatedvalue="2013-03-22T08:00" xmlfile="2013032208.xml" kmlfile="2013032208.kml" /> <time value="09" longvalue="2013032209" formatedvalue="2013-03-22T09:00" xmlfile="2013032209.xml" kmlfile="2013032209.kml" /> <time value="10" longvalue="2013032210" formatedvalue="2013-03-22T10:00" xmlfile="2013032210.xml" kmlfile="2013032210.kml" /> <time value="11" longvalue="2013032211" formatedvalue="2013-03-22T11:00" xmlfile="2013032211.xml" kmlfile="2013032211.kml" /> <time value="12" longvalue="2013032212" formatedvalue="2013-03-22T12:00" xmlfile="2013032212.xml" kmlfile="2013032212.kml" /> <time value="13" longvalue="2013032213" formatedvalue="2013-03-22T13:00" xmlfile="2013032213.xml" kmlfile="2013032213.kml" /> <time value="14" longvalue="2013032214" formatedvalue="2013-03-22T14:00" xmlfile="2013032214.xml" kmlfile="2013032214.kml" /> <time value="15" longvalue="2013032215" formatedvalue="2013-03-22T15:00" xmlfile="2013032215.xml" kmlfile="2013032215.kml" /> <time value="16" longvalue="2013032216" formatedvalue="2013-03-22T16:00" xmlfile="2013032216.xml" kmlfile="2013032216.kml" /> <time value="17" longvalue="2013032217" formatedvalue="2013-03-22T17:00" xmlfile="2013032217.xml" kmlfile="2013032217.kml" /> <time value="18" longvalue="2013032218" formatedvalue="2013-03-22T18:00" xmlfile="2013032218.xml" kmlfile="2013032218.kml" /> <time value="19" longvalue="2013032219" formatedvalue="2013-03-22T19:00" xmlfile="2013032219.xml" kmlfile="2013032219.kml" /> <time value="20" longvalue="2013032220" formatedvalue="2013-03-22T20:00" xmlfile="2013032220.xml" kmlfile="2013032220.kml" /> <time value="21" longvalue="2013032221" formatedvalue="2013-03-22T21:00" xmlfile="2013032221.xml" kmlfile="2013032221.kml" /> <time value="22" longvalue="2013032222" formatedvalue="2013-03-22T22:00" xmlfile="2013032222.xml" kmlfile="2013032222.kml" /> <time value="23" longvalue="2013032223" formatedvalue="2013-03-22T23:00" xmlfile="2013032223.xml" kmlfile="2013032223.kml" /> </date> </month> </available-weather-forecast-data>

Description of Gfmis WEB Service
In the following table the formats of the data exchanged between the G-FMIS Server and
the service portal (FLIRE server) is shown for the “Fire Simulation”
Fire Simulation (behavior and spread)
Inputs from G-FMIS
portal
Parameter values provided by the user through the portal server.
These can be transferred to G-FMIS server (http request).
� Type of request depending on the Use case scenario
Request Date-time
� Name or code of the event/accident
� Incident Date-time
� The coordinates system info (e.g., “geographic
WGS’84”, “projected UTM_Zone_35” ).
� The coordinates of the incident site (coordinates of
one or more points)
� The total time of simulation in minutes (range of values
60-360)
� The time-step of simulation in minutes (range of
values 15-60)
� Fine fuel moisture % (range of values 1-15)
� Live fuel moisture % (range of values 30-200)
Inputs from G-FMIS
geodatabase/server
- ASCII Wind field file that has been created from P1
- Fuel map/ integers / ASCII-GRID format
- Slope map % /integers / ASCII-GRID format
- Aspect map (deg) / integers / ASCII-GRID format
Outputs to the FLIRE
web-portal/server
- KML file with the fire simulation points for all the simulation
time steps. The KML file includes information about the
fireline intensity, the rate of spread, the flame length and the

122
time step for each point
- An associated XML file including the following
• Name of service
• Time of receiving the query
• Time of answering the query
• Name or code of the event/accident
• The bounding box (LL,UR)
- An additional XML file including the burned area per
simulation step
G-FMIS Service Scenario:
• A fire incident is registered in the FLIRE web portal and its reference coordinates
are defined by the User on the map.
• The user wants to know which can be the propagation of the fire in the next 1-6
hours
• The user defines the source of meteo data for this incident. These data can be
provided by the GFMIS meteo Service , or alternatively directly by the User.
• The User will use the UI of the FLIRE-web portal for making a request to the G-
FMIS Fire Simulation Service.:
• The Fire Simulation Service shall elaborate the request and
a. it shall run the wind_field sub-Service for the creation of the wind field map of
the area of interest
b. it shall run the Fire Simulation procedure and
c . it shall return to the web portal the following files:
1. A KML file with the fire simulation points which will include information
about the fire behavior attributes for each point
2. A KML file with the wind field points including the attributes of wind
speed and direction for each point
3. An additional file with information about the simulated burned area per
step
4. Any other useful info in xml format
• The FLIRE- web portal shall receive and visualize the results on the map