bachelor of engineering thesis - espace.library.uq.edu.au681312/lin_jia_wei_thesis.… · bachelor...
TRANSCRIPT

UQ Engineering Faculty of Engineering, Architecture and Information Technology
Bachelor of Engineering Thesis
Effects of the Thermal History in Additive Manufacturing Process
on the Microstructure and Hardness of M2 Steel
Student Name: Jia Wei LIN
Course Code: MECH4501
Supervisor: Professor MingXing ZHANG
Submission date: 2 June 2017
A thesis submitted in partial fulfilment of the requirements of the Bachelor of Engineering
degree in Mechanical Engineering (Hons)

i
Abstract
Additive manufacturing (AM) has been surfacing in the early 1980s, where originally
being names as Rapid Prototyping (RP) technologies. RP provides fast and cost efficient ways
for phototyping during product development stages. While current technology has advanced
greatly, there is little effort in developing metallic alloys which are specifically suited for AM
process. This report investigates the thermal effects towards microstructure and hardness of M2
High Speed Steel (M2 HSS) in Direct Laser Deposition (DLD) process using LENS450 AM
equipment. Prior to achieving this goal, key processing parameters were optimised, following
with thermal effect studies alongside with stress relieving heat treatment effects on
microstructure and hardness of samples performed.
Optimum parameters on LENS450 using M2 HSS was found to be: Laser power of
300W; scanning nozzle velocity of 25ipm or 10.58mm/s; and powder feed rate of 5rpm or
9.30g/min. Highest density achieved was 99.05%. Average hardness of samples measured
906.5HV±42.5HV. Columnar dendrites observed to form around HAZ with equiaxed zone
above the melt pool boundary stretching towards centre of melt pool. Defects such as cracks
and porosities were mainly caused by solidification cracking and insufficient melting causing
entrapped gas bubbles. Single melt pool analysis portraited middle area of the particular melt
pool having slightly lower hardness compared to its edges along the HAZ.
Thermal effects analysis suggested increasing 2nd layer microstructure fineness
observed from 2 to 4-layer sample. Beyond 4-layeys, microstructure for 2nd layer seemed
constant throughout. Microstructure in the bottom and top layer appeared prominently finer
compared to microstructure in the centre layer. Fluctuations throughout the samples were due
to inhomogeneity caused by unique and unpredictable thermal cycles being difficult to control
and monitor. All samples encountered carbon and solute dilution in the utmost bottom layer
where shark dark needle like structures surfaced.
Effects of stress relieving heat treatment had little impact towards microstructure
features. Both heat and non heat treated samples obtained hardness values in a relatively small
error range of 3.72% and 4.76% respectively. Heat treated sample shows consistency in having
lower hardness compared to non heat treated samples, however no relationship between average
sample hardness with ascending layers were concluded.

ii
Acknowledgement
First of all, I would like to express my gratitude to my supervisor, Professor Mingxing
Zhang, for providing me with much guidance and knowledge in metallurgical of materials,
rendering my advancement towards this field of studies. I would also like to express thanks to
Dr Haiwei Chang and Mr Yu Ying for their generous assistance towards the operation of
LENS450, Mr Qiyang Tan for performing SEM and providing micrographs, and finally Mr
Jonathan Read for his time providing me with all necessary lab trainings to make this
experiment a success.

iii
Table of Contents
Abstract .............................................................................................................................................. i
Acknowledgement .............................................................................................................................. ii
List of Tables ...................................................................................................................................... v
List of Figures..................................................................................................................................... v
Abbreviations .................................................................................................................................. viii
Chapter 1 Introduction ....................................................................................................................... 1
1.1 Project Introduction ............................................................................................................ 1
1.2 Goals........................................................................................................................................ 1
1.2 Scope ................................................................................................................................. 2
1.2.1 Parameter Optimisation ..................................................................................................... 3
1.3.2 Effects on bottom layer microstructure with additional layers............................................. 3
1.3 Limitations ............................................................................................................................... 3
1.5 Project outcome........................................................................................................................ 3
1.6 Report Structure ....................................................................................................................... 4
Chapter 2 Literature Review .............................................................................................................. 5
2.1 Background .............................................................................................................................. 5
2.1.1 Benefits of AM .................................................................................................................. 5
2.1.2 Disadvantages of AM ........................................................................................................ 6
2.2 Classifications of AM technologies .......................................................................................... 6
2.2.1 Powder Bed Fusion ............................................................................................................ 8
2.2.2 Direct Energy Deposition................................................................................................... 8
2.3 Applications of AM .................................................................................................................. 9
2.3.1 Aerospace .......................................................................................................................... 9
2.3.2 Biomedical .......................................................................................................................10
2.3.3 Construction .....................................................................................................................10
2.4 M2 steel ..................................................................................................................................11
2.4.1 Introduction ......................................................................................................................11
2.4.2 Composition of M2 steel ...................................................................................................11
2.4.2 Effects of Alloying Elements ............................................................................................12
2.5 Case study on Powder Metallurgy of M2 steel .........................................................................13
2.6 Case study on Selective Laser Melting of M2 HSS ..................................................................15
2.7 Case study on 316L Stainless steel...........................................................................................17
2.8 Effects of laser attenuation ......................................................................................................19
2.9 Effects of AM Optimisation Parameters ...................................................................................20
2.9.1 Overview of physical events during DLD .........................................................................20
2.9.2 Powder Feed Rate .............................................................................................................21
2.9.3 Laser Power ......................................................................................................................21
2.9.4 Nozzle Scanning Velocity .................................................................................................21
2.9.5 Microstructure ..................................................................................................................22
Chapter 3 Methodology.....................................................................................................................23
3.1 Research overview ..................................................................................................................23
3.2 AM Parameter Optimisation ....................................................................................................23
3.2.1 LENS 450 AM equipment ................................................................................................23
3.2.2 M2 Powder Specification ..................................................................................................24
3.2.3 Optimisation Procedures ...................................................................................................24
3.2.4 Density Test .....................................................................................................................25
3.3 Microstructure Analysis ..........................................................................................................26

iv
3.3.1 Polishing and Etching .......................................................................................................26
3.3.2 Optical Microscope (OM) .................................................................................................26
3.4 Hardness and Microhardness Testing .......................................................................................27
3.5 Thermal history effects on bottom layers with additional layers ...............................................28
3.6 Stress Relieving Heat Treatment ..............................................................................................28
Chapter 4 AM Parameter Optimisation ..............................................................................................29
4.1 Overview ................................................................................................................................29
4.2 Results ....................................................................................................................................29
4.2.1 Phase 1: 300w, 5rpm, with Varying Nozzle Scanning Velocity .........................................29
4.2.2 Phase 2: 300w, 25ipm, with Varying Powder Feed Rate ....................................................30
4.2.3 Phase 3: 25ipm, 5rpm, with Varying Laser power .............................................................31
4.2.4 Hardness Test using Optimised Parameters .......................................................................32
4.3 Discussion ...............................................................................................................................33
4.3.1 Density .............................................................................................................................33
4.3.3 Hardness...........................................................................................................................36
4.3.2 Microstructure ..................................................................................................................36
Chapter 5 Effects of Thermal History with Additional Layers ...........................................................42
5.1 Overview ................................................................................................................................42
5.2 Results ....................................................................................................................................42
5.2.1 Microstructure of Melt Pool located in centre of sample ....................................................42
5.2.2 Microstructure differences between 2nd layer in a 2, 3, 4, 8 and 30-layer sample ................43
5.2.3 Microstructure differences between top and centre layer in an 8-layer sample ...................45
5.2.4 Effects of ascending layers on sample hardness .................................................................46
5.2.5 Effects of ascending layers on 2nd layer hardness...............................................................47
5.2.6 Effects of ascending layers on individual layer hardness ...................................................48
5.3 Discussions .............................................................................................................................49
Chapter 6 Effects of Stress Relieving Heat Treatment .......................................................................51
6.1 Overview ................................................................................................................................51
6.2 Results ....................................................................................................................................51
6.2.1 Microhardness Comparison with Non Heat Treated Samples ............................................51
6.2.2 Microstructure Comparison with Non Heat Treated Samples ............................................52
6.2.3 Secondary Electron SEM Comparison with Non Heat Treated Samples ............................52
6.3 Discussion ...............................................................................................................................53
Chapter 7 Conclusion ........................................................................................................................55
7.1 Overview ................................................................................................................................55
7.2 AM parameter Optimisation ....................................................................................................55
7.3 Effects of Thermal History on Bottom Layer with Additional Layers .......................................56
7.4 Effects of stress relieving heat treatment ..................................................................................56
7.5 Recommendations ...................................................................................................................57
References ........................................................................................................................................58
Appendices .......................................................................................................................................63
Appendix A: Chemical composition of M2 HSS Powder specification from Hoganas ....................63
Appendix B: Density calculation using Archimedes Principle ........................................................64
Appendix C: Hardness Test Results ...............................................................................................65
Appendix C1: Hardness test results for non heat treated samples ...............................................65
Appendix C2: Hardness test results for heat treated samples ......................................................65

v
List of Tables Table 1: Scope of project ................................................................................................................... 2
Table 2: Composition for Molybdenum based M2 HSS [34] ..............................................................12
Table 3: Sample processing parameters [50] ......................................................................................17
Table 4 Description for different types of melting encountered during AM ........................................22
Table 5 Chemical composition of M2 HSS from Hoganas .................................................................24
Table 6 Constant laser power and powder feed rate, varying nozzle scanning velocity .......................29
Table 7 Constant laser power and nozzle scanning velocity, varying powder feed rate .......................30
Table 8 Constant laser power and nozzle scanning velocity, varying powder feed rate .......................31
Table 9 Rockwell Hardness test results for 15 and 30-layer sample ...................................................32
Table 10 Microhardness test on melt pools ........................................................................................39
Table 11: Densities for 21ipm to 33ipm, fixed 300W and 5rpm .........................................................64
Table 12 Densities for 4rpm to 6rpm, fixed 300W and 25ipm ............................................................64
Table 13 Densities for 250W to 350W, fixed 25ipm and 5rpm...........................................................64
Table 14 Hardness test results for non heat treated samples ...............................................................65
Table 15 Hardness test results for heat treated samples ......................................................................65
List of Figures Figure 1 Classifications of AM Technologies [26] .............................................................................. 7
Figure 2 Powder Bed Fusion (PBF) process [x10] .............................................................................. 8
Figure 3 Direct Energy/Laser Deposition (DED/DLD) process [x10] .................................................. 8
Figure 4 UAS Prototyping [27] .......................................................................................................... 9
Figure 5 Siemens gas turbine blades [28] ........................................................................................... 9
Figure 6 Human sized ear printed on ITOP [30] ................................................................................10
Figure 7 AM fabricated prosthetic arms [29] .....................................................................................10
Figure 8 3D printed house by WinSun [31] .......................................................................................11
Figure 9 3D printed apartment by WinSun [32] .................................................................................11
Figure 10: Microstructure of annealed tool steel with ferrite and alloy carbides. 1000X [35] ..............13
Figure 11: Microstructure of hardened and tempered tool steel with martensite carbides. 1000X [35] 13
Figure 12: Effects of sintering temperature on density of M2 HSS samples [44] ................................14
Figure 13: Effects of temperature on shrinkage of M2 HSS samples [44] ...........................................14
Figure 14: Microstructure of M2 HSS sintered at 1280°C [44]...........................................................14
Figure 15: Microstructure of M2 HSS sintered at 1290°C [44]...........................................................14
Figure 16: Microstructure of M2 HSS sintered at 1300°C [44]...........................................................14
Figure 17: Microstructure of M2 HSS sintered at 1310°C [44]...........................................................14
Figure 18: Hardness of M2 HSS tempered at 580°C, with varying sintering temperature [44] ............15
Figure 19 Defects from fabrication of M2 with SLM [47]..................................................................15
Figure 20 Parts produced without (left) and with (right) baseplate preheating [47] .............................15
Figure 21 Dark phase magnification of dendritic structure [47] ..........................................................16
Figure 22 EBSD tests on dark and bright phase [47] .........................................................................16
Figure 23 Cellular like structure in dark phase [47] ...........................................................................16
Figure 24 HV values for varying laser speed (top), different phases (bottom) [47] .............................16
Figure 25: Microstructure of top layers (power=600W, nozzle velocity 300mm/min) [51] .................18
Figure 26: Microstructure of bottom layers (power=600W, nozzle velocity 300mm/min) [51] ...........18
Figure 27: Microstructure of sample (power=750W, nozzle velocity 300mm/min) [51] .....................18
Figure 28: Microstructure of sample (power=750W, nozzle velocity 450mm/min) [51] .....................18
Figure 29: Microstructure of sample (power=900W, nozzle velocity 300mm/min [51] ......................18
vi
Figure 30: Effects of laser attenuated to original power with varying radial distance to laser beam
centre. (H13, Power=2200W, beam diameter 1.2mm, nozzle velocity 300mm/min) [8] .....................19
Figure 31 Physical events occurring during DLD [8] .........................................................................20
Figure 32 Laser power vs nozzle scanning speed (a), path of laser travel (b) [58]...............................21
Figure 33 Complete melting (a), Partial melting(b), Partial melting with balling (c) [58] ...................22
Figure 34 Optomec LENS 450 ..........................................................................................................23
Figure 35 LENS450 working area .....................................................................................................23
Figure 36 Systemic approach for parameter optimisation ...................................................................24
Figure 37 Parts on substrate (top), after removal (bottom) .................................................................25
Figure 38 A&D GR200 Lab Balance .................................................................................................25
Figure 39 Struers CitoPress-30 ..........................................................................................................26
Figure 40 Struers TegraPol-31 ..........................................................................................................26
Figure 41 Reichert POLYVAR OM ..................................................................................................26
Figure 42 BUEHLER Rockwell tester ...............................................................................................27
Figure 43 Struers Duramin Microhardness tester ...............................................................................27
Figure 44 Indent distances (29a) ........................................................................................................27
Figure 45 Indent seen under microscope (29b) ..................................................................................27
Figure 46 Contherm Thermotec 2000 oven ........................................................................................28
Figure 47 300W, 5rpm, 21ipm ..........................................................................................................29
Figure 48 300W, 5rpm, 23ipm ..........................................................................................................29
Figure 49 300W, 5rpm, 25ipm ..........................................................................................................30
Figure 50 300W, 5rpm, 28ipm ..........................................................................................................30
Figure 51 300W, 5rpm, 30ipm ..........................................................................................................30
Figure 52 300W, 25ipm, 4rpm ..........................................................................................................31
Figure 53 300W, 25ipm, 5rpm ..........................................................................................................31
Figure 54 300W, 25ipm, 6rpm ..........................................................................................................31
Figure 55 25ipm, 5rpm, 250W ..........................................................................................................32
Figure 56 25ipm, 5rpm, 300W ..........................................................................................................32
Figure 57 25ipm, 5rpm, 350W ..........................................................................................................32
Figure 58 Relationship between nozzle scanning velocity and density ...............................................33
Figure 59 Relationship between powder feed rate and density ...........................................................34
Figure 60 Relationship between laser power and density ...................................................................35
Figure 61 First 8 layers in a 15-layer sample, vertical cross section ...................................................36
Figure 62 Laser and powder deposition path ......................................................................................37
Figure 63 Hatch spacing [38] ............................................................................................................37
Figure 64 Lower left corner of horizontal cross section (A) ...............................................................37
Figure 65 Upper right corner of horizontal cross section (B) ..............................................................37
Figure 66 Microstructure of Vertical cross section .............................................................................38
Figure 67 OM image of single melt pool ...........................................................................................38
Figure 68 SEM micrograph of melt pool (1 layer, 250X) ...................................................................40
Figure 69 SEM micrograph of melt pool (1 layer, centre,1000X) .......................................................40
Figure 70 SEM micrograph of melt pool (6 layers, centre, 2000X) ....................................................40
Figure 71 SEM micrograph of melt pool (8 layers, centre, 8000X) ....................................................41
Figure 72 11th layer in a 30-layer part ................................................................................................42
Figure 73 11th layer, Centre magnified...............................................................................................42
Figure 74 11th layer, Right magnified ................................................................................................42
Figure 75 11th layer, Left magnified ..................................................................................................42
Figure 76 2nd layer in a 2-layer sample ..............................................................................................43
Figure 77 2nd layer in a 3-layer sample ..............................................................................................43
Figure 78 2nd layer in a 4-layer sample ..............................................................................................44

vii
Figure 79 2nd layer in an 8-layer sample ............................................................................................44
Figure 80 2nd layer in a 30-layer sample ............................................................................................45
Figure 81 2nd layer in an 8-layer part (lower edge of melt pool) .........................................................46
Figure 82 2nd layer in an 8-layer part (centre of melt pool) .................................................................46
Figure 83 4th layer in an 8-layer part (Left edge of melt pool) ............................................................46
Figure 84 4th layer in an 8-layer part (centre of melt pool) .................................................................46
Figure 85 8th layer in an 8-layer part (Left edge of melt pool) ............................................................46
Figure 86 8th layer in an 8-layer part (Centre of melt pool).................................................................46
Figure 87 Average hardness of 2,4,8,15 and 30 layer samples............................................................47
Figure 88 2nd layer hardness with ascending layers ............................................................................47
Figure 89 Individual hardness on each layer with ascending layers ....................................................48
Figure 90 Average hardness of samples with ascending layers ...........................................................51
Figure 91 2nd layer in 2-layer without heat treatment .........................................................................52
Figure 92 2nd layer in 2-layer with heat treatment ..............................................................................52
Figure 93 2nd layer in 8-layer without heat treatment .........................................................................52
Figure 94 2nd layer in 8-layer with heat treatment ..............................................................................52
Figure 95 SEM micrograph (8 layers, bottom, 8000X) ......................................................................53
Figure 96 SEM micrograph (8 layers, bottom, 8000X) ......................................................................53
Figure 97 M2 steel chemical composition from Hoganas [81] ...........................................................63

viii
Abbreviations
AM Additive Manufacturing
RP Rapid Prototyping
ITOP Integrated Tissue-Organ Printer
HSS High Speed Steel
DLD Direct Laser Deposition
DED Direct Energy Deposition
PBF Powder Bed Fusion
CAD Computer Aided Design
OM Optical Microscopy
SEM Scanning Electron Microscopy
EDS Energy Dispersive X-Ray Spectroscopy
TEM Transmission Electron Microscopy
ASTM American Society for Testing and Materials
EDM Electrical Discharge Machining
SLM Selective Laser Melting
DMLS Direct Metal Laser Sintering
EBM Electron Beam Melting
SLS Selective Laser Sintering
EBSD Electron Backscatter Diffraction
LABE Low Angle Backscatter Electron
SAED Selected Area Electron Diffraction
BCC Body-Centered Cubic

Chapter 1 Introduction 1
Chapter 1 Introduction
1.1 Project Introduction
Additive manufacturing (AM) or 3D printing in layman terms is a rapidly revolving
technology in the manufacturing sector. AM is a manufacturing process whereby a three-
dimensional object is formed through layering deposit of raw material. Two main process of
AM includes Direct Laser Deposition (DLD) and Powder Bed Fusion (PBF). Both process
require computational resources capable of subdividing the object designed as Computer Aided
Design (CAD) drawings [1, 2, 3, 4] in STL formats into layers along the Z-direction, with
thickness of 0.05mm to 0.15mm depending on printer specifications [5]. The machine
assembles the part by adding layers of melt pool by injecting metallic powder via coaxial
powder delivery [6, 7], with concentrated laser radiation providing thermal energy [8] for
melting and solidification. As nozzle moves on, subsequent layers are added. AM has clear
advantages compared to traditional manufacturing processes, including the ability to
manufacture parts with complexed shapes that is not possible by conventional manufacturing
methods [9, 10]; saving time and cost on raw materials, and ability to fabricate assembled parts
as a single component [9, 10]. From 1975 to 2011, over 3500 AM related patents emerged [11]
with an intensive amount of attention focusing on commercial and academic sectors [11].
Proven applications of AM in the recent years include UAVs [12], complex fuel nozzles [13],
biomedical implants [14], houses [15], tooling [16, 17], and others. Considered to be a relatively
modern technology, durability and performance of AM fabrications remains at a stage whereby
more research must be undertaken for a better understanding on behaviour and properties of
AM fabricated parts.
1.2 Goals
The goal of this project is to achieve optimised AM parameters, research on how
additional layers built affects microstructure on bottom layer, and finally studies of hardness
and microstructure effects from stress relieving heat treatment process.
Optimization of AM processing parameters for M2 HSS has been identified as the
primary goal. Parameters such as powder feed rate, nozzle scanning velocity and power of laser
optimization will be performed on Optomec LENS 450, a DLD AM 3D printer. Optimization
is performed by investigating mechanical properties of printed parts with varying single
parameter while fixing two other parameters. AM parts with density of at least 99% of its

Chapter 1 Introduction 2
powder form, lowest porosity content and exhibit superior properties in hardness, tensile,
fatigue life and fracture toughness shall have their optimisation parameters documented.
DLD process involves repeated melting and solidification whereby parts are
accumulated with new melt pools from existing layers. This heating and cooling process causes
formation of Heat Affected Zone (HAZ) around the melt pool. HAZ will be investigated for
printed AM parts ranging from 2 to 30 layers, microstructural analysis performed
simultaneously to study the metallurgical effects of adding subsequent melt pools, i.e. how
additional layers affect microstructure of previous layers.
This project aims to enhance understanding towards development of new alloy other
than current restrictions on wrought compositions, allowing widening of industry applications
towards AM that is capable of producing low-volume, high complexed components efficiently.
1.2 Scope
The scope of project is documented in Table 1. Initial stages involve optimising of three
AM parameters; powder feed rate, laser power and nozzle scanning velocity on LENS 450 AM
equipment. Other equipment parameters such as hatch distance, resolution settings and contour
settings are out of scope, values of which uses system default parameters. Microstructure
studies will be performed using Optical Microscope (OM). Due to limited accessibility,
Scanning Electron Microscope (SEM), Energy Dispersive X-Ray Spectroscopy (EDS) and
Transmission Electron Microscopy (TEM) will be out of scope for this research. Density of
parts to be calculated by Archimedes Principle. Hardness testing will be performed on all
samples, microhardness test to be performed on each individual layer and analysed. Other
mechanical properties such as tensile strength, ductility, yield strength is not performed in this
experiment. Stress relieving will be performed on the optimised parts with M2 HSS used as
working powder. Table 1 summarises the scope of this thesis.
Table 1: Scope of project
In scope Out of scope
AM parameter optimisation (Powder feed
rate, laser power and nozzle scanning
velocity) on LENS 450
Other AM parameters such as hatch
distance, resolution, contours etc.
Microstructure studies with optical
microscope (OM)
SEM, EDS, TEM
Density and Hardness testing Other mechanical properties such as tensile
strength, ductility, etc.
Stress relieving Tempering, normalising, work hardening,
etc.
M2 High Speed Steel (M2 HSS) Other metallic powder

Chapter 1 Introduction 3
1.2.1 Parameter Optimisation
Parameter optimisation is a fundamental step towards producing a high quality AM part.
With various AM equipment in the market, each containing individual characterises. Similar
processing parameters across different equipment may not necessary yield similar quality parts.
AM optimisation process is undertaken on Optomec LENS 450. Powder feed rate, laser power
and nozzle scanning velocity parameters are altered systematically in a series of experiments to
achieve a printed part with high hardness and densities of over 99%. Achieving low porosity
parts is desirable towards production of high quality parts with good mechanical properties.
1.3.2 Effects on bottom layer microstructure with additional layers
Fabrication process generates melting and solidification repeatedly when new layers are
advanced on existing layers. The bottom layer experience thermal cycle which could affect the
microstructure and hardness of previous layers. Effect of HAZ will be investigated to enhance
understanding for development of AM parts.
1.3 Limitations
Limitations for this project generally revolves the consistency of LENS 450 AM
equipment. Powder feed rates are measured prior to commencement of experiment, and
assumed to held constant throughout the entire duration of fabrication process. Laser power and
nozzle scanning velocity are both assumed to be within specified values displayed on the
monitoring software. Powder size is expected to be in range of the manufacturer’s spec sheet.
Laser power is limited to maximum of 400W, working area is restricted to 100mm X 100mm
X 100mm. Due to LENS 450 AM fabrication operating as an open-loop process, melt pool
information such as surface temperature and quality information is unable to be fed back to the
system for real time parameter adjustments, hence laser focal distance that is initially set
manually, is assumed to be accurately in focused throughout the entire fabrication process.
1.5 Project outcome
This report examines on material properties, composition and Powder Metallurgy of M2
HSS to allow a better understanding on its microstructure formation and properties of this

Chapter 1 Introduction 4
working powder. AM parts often have complexed thermal gradients that produce varying
microstructure and mechanical properties throughout different layers. Insufficient studies on
effects of thermal history in AM has been undertaken, thus this research could potentially
enhance studies on effects of thermal cycles around the HAZ, providing a better understanding
on the effects on different layer microstructure, leading to more accurate future modelling of
AM fabrication processes.
Optimised AM parameters can provide a knowledge base for further grain refinement
research to eliminate columnar structures for equiaxed grains. Ultimately it could enhance
better understanding towards complexed formation of AM microstructure, providing necessary
control of process over parts fabrication through AM technologies in the industry.
1.6 Report Structure
Current chapter gives an introduction, goals and scope of research. Chapter 2 consists
of major literature reviews documented that aids the execution of current project. An insight
towards a number of AM technologies methods discussed, in addition, benefits and limitations
of such listed. Case studies for DLD and SLM of M2 HSS and 316L steel are performed for
better understanding of microstructure formation during those AM process.
Chapter 3 mentions methodology of the experiment. Equipment used in the experiment
are introduced, method and procedures are presented. Chapter 4 discuss the results for
parameter optimisation phase involving optimisation of laser power, nozzle scanning velocity
and powder feed rate for yielding highest part density. Optimised parameters will be identified
and discussed in this chapter.
Chapter 5 identifies relationship between thermal history effects and additional layers
advancement alongside with microstructure and hardness analysis. Unlike conventional
manufacturing of M2 HSS, AM encounters complexed and unpredictable thermal gradients,
subsequent layer effects on bottom later microstructure and hardness is an interesting segment
and will be looked into. Chapter 6 discuss about stress relieving heat treatment and its effects
on microstructure. OM images are identified as key instrument towards research. While SEM
is out of scope in this thesis, a number of SEM images are supplied by Q.Y.Zhang as a gesture
of goodwill. Given that a higher level of magnification compared to OM images, it provides a
better understanding towards microstructure analysis. Chapter 7 summarises key findings of
the research, alongside with discussions for potential improvements and future work.

Chapter 2 Literature Review 5
Chapter 2 Literature Review
2.1 Background
AM is a form of 3D printing which has been surfaced since the early 1980s, however
was limited to polymers during the early stages. As technology advances, metallic components
can now be created through AM [18]. AM has received well over 3500 patents from 1975 to
2011 [11]. Popularity for phototype printing and printing on demand has been increasing greatly
due to cost effectiveness and time savings as opposed to sending parts for out-of-house
machining [19]. The American Society for Testing and Materials (ASTM) define AM as
“process that joins materials in a layer by layer fashion to produce a 3D object, as opposed to
conventional subtractive methods [20]”
As discussed in introduction of Chapter 1, there are numerous field of studies that
benefits from this technology. Benefits and disadvantages will be discussed in this chapter,
different classifications of AM technology identified, along with a brief insight of each
technology’s’ operational features as well as their applications in different market sectors.
2.1.1 Benefits of AM
There are numerous benefits associated with AM. AM involves the technique of
building an object layer by layer, as compared to conventional manufacturing method which
removes material from a block of raw material, allows Rapid Prototyping (RP) to be possible
in a fast and cost efficient way [21], saving the cost of cutting tools while minimizing waste
materials. Parts with complexed geometries could be easily constructed with AM compared to
conventional manufacturing due to little constrains imposed on its geometries, no assemble of
final product is required since part is fabricated as one whole part [21]. Reduced lead time due
to eliminating the need to create a casting mould, user could create any complex objects through
CAD, run it on a AM equipment and the object can be printed. Continuous improvements and
changes could be made for product optimisation, where it would be very difficult if traditional
casting methods are used. AM is excellent for high complexity low volume production, which
is very costly for conventional manufacturing. AM also reduces storage costs, manufacturer
could print products on customer’s demand, thus reducing warehousing [22]. AM is considered
to be an automated process that is beneficial for labour intensive companies to produce parts in
an automated manner eliminating defects caused by human errors during manufacturing In
addition, potential savings off labour costs could drive profits up, resulting in a measurable
increment towards cost effectiveness and efficiency.

Chapter 2 Literature Review 6
2.1.2 Disadvantages of AM
Slow build rates and high production costs are the main disadvantages of AM [21]. AM
build parts layer by layer with millimetres of increments along the Z direction, printing a full-
scale object usually takes hours to days. AM production cost for high volume low complexity
parts can be very uneconomical. Currently AM faces limited materials [22], most commonly
used metals are steel, stainless steel, titanium gold and silver [23], leaving a wide range of other
metals to be identified and developed for AM applications. 60% of the 624 firms surveyed are
keen to use 3D printing for labour reduction [24], with future advancements in AM, job losses
in manufacturing sector could potentially be soaring in the near future [24].
2.2 Classifications of AM technologies
With pronounced popularity of 3D printing, increasing technologies associated with AM
has surfaced since the late 19th century. According to ISO/ASTM52900-15 [25], the seven
classifications of AM processes include
• Vat Photopolymerization
• Material Extrusion
• Material Jetting
• Binder Jetting
• Powder Bed Fusion (PBF)
• Direct Energy/Laser Deposition (DED/DLD)
• Sheet Lamination
Overview of PBF and DLD technologies are discussed since these two technologies could
accommodate printing of metallic materials. The other five technologies are only capable of
fabricating plastic samples, thus out of scope in this research. Figure 1 from 3D Hubs portraits
the seven classifications of AM processes, specifies whether plastic or metal could be printed,
and indicates companies that specialise in each classification of technology. Current project
utilises LENS450, a DLD AM equipment from OPTOMEC. Despite AM being an emerging
technology, most listed companies in Figure 1 demonstrates comprehensive in-depth
knowledge towards the AM industry, providing turnkey solutions to a wide range of enterprises
relying on AM solutions in the field of manufacturing.

Chapter 2 Literature Review 7
Figure 1 Classifications of AM Technologies [26]

Chapter 2 Literature Review 8
2.2.1 Powder Bed Fusion
PFD technologies uses laser beam as a thermal source to fuse metallic powder on the build area.
To overcome high melting temperatures of metal and high enthalpy of fusion, high powered
laser is utilized for layer to layer
allergically bonding. As described in
Figure 2, this laser scans in a pre-
programmed path to bond one layer,
fabrication piston lowers the same
height at which the part is deposited.
Powder delivery system delivers a new
layer of powder through a roller for
even distribution, and the process is
repeated till a complete part is formed.
This technology is advantages when
fabricating parts with overhanging
structures as the unmelted powder in
the work area supports the overhanging sections. Electrical Discharge Machining (EDM)
process is proceeded on the part to separate it from the base plate. Excess powder during
printing is collected in the over flow container to prevent excessive powder accumulation in the
powder bed. Any remaining unmelted powder is collected and reused. Selective Laser Melting
(SLM), Direct Metal Laser Sintering (DMLS) and Electron Beam Melting (EBM) are used to
produce metal parts while Selective Laser Sintering (SLS) produces nylon or ceramic parts.
2.2.2 Direct Energy Deposition
DED/DLD has similar process
involving melting metallic powder
using laser beam with PFD however
differs in a way that DLD combines
material and energy delivery system as
one shown in Figure 3. Nozzle
delivery system delivers a constant
flow of metallic powder at a pre-set
rate while laser is emitted through a
pyrometer and reflected by a turning
Figure 2 Powder Bed Fusion (PBF) process [x10]
Figure 3 Direct Energy/Laser Deposition (DED/DLD) process [x10]

Chapter 2 Literature Review 9
mirror directly onto the work piece to induce fusion between layers. Inert gas is injected onto
the workpiece during printing process to reduce unwanted chemical reactions and oxidations
from forming. Substrate is fixed on the base of the equipment, deposition head which bundles
with the coaxial powder delivery nozzles, laser lens and inert gas nozzle moves together in a X,
Y and Z direction.
2.3 Applications of AM
Having discussed the various technologies of AM, applications of AM will be conversed
in this section. 3D printing breakthrough in the recent years boosted cutting edge innovation’s
and advancements in AM industry. over 3500 AM related patents emerged [11] with an
intensive amount of attention focusing on commercial and academic sectors [11]. Proven
applications of AM in the recent years include UAVs [12], complex fuel nozzles [13],
biomedical implants [14], houses [15], tooling [16, 17]. Major efforts in recent AM
development focuses on aerospace, biomedical and construction sector.
2.3.1 Aerospace
Aerospace is an industry that utilise state-of-the-art technologies, for example carbon
fibre was early adopted by aerospace industry, first to integrate CAD/CAM into design process,
and now AM is used throughout major processes from design to repairs [27]. Trial and error
approach with AM offers flexibility to product prototyping. Figure 4 shows SelectTech
Geospatial, an advanced manufacturing facility that developed an Unmanned Aerial System
(UAS) for autonomous landing, the entire airframe is fabricated through AM. In February 2017
Figure 4 UAS Prototyping [27] Figure 5 Siemens gas turbine blades [28]

Chapter 2 Literature Review 10
Siemens successfully validated several AM printed turbine blades shown in Figure 5 with
conventional blade design at full operating conditions. These fabricated blades had excellent
surface finish, accuracy and surface finish, and were tested at 13,000 revolutions per minute
and elevated temperatures of over 1250 degrees Celsius [28].
2.3.2 Biomedical
Continuous innovation enabled biomedical sector to benefit from AM ideally due to the
ability for complexed and customised parts to be fabricated. From dental products to tissue
engineering, 3D printing has been addressing recent challenges in the biomedical field [29]. 3D
Bioprinting in an AM based technology that fabricates human body tissues and organ
constructs, currently still under intensive research [29]. Scientists have recently developed an
Integrated Tissue-Organ Printer (ITOP) that is capable of printing structural sound parts [30]
such as the human ear shown in Figure 6 using biodegradable plastic structure where cells can
be injected and kept alive through microchannel that enhance flow of oxygen. AM prosthetic
arms shown in Figure 7 is getting increasingly popular due to the customisability of parts to suit
each individual patient, providing an open source and low cost solution to developing countries
where patients with financial difficulties could obtain replacement limbs.
Figure 6 Human sized ear printed on ITOP [30]
Figure 7 AM fabricated prosthetic arms [29]
2.3.3 Construction
AM is revolutionising the construction sector by untangling design limitations which
traditional practices faced. Structures with high complexity can now be printed, internal cavities
and complications reproduced as single objects, on site printing of structures is now possible,
using only materials for the product with little to no waste, and finally a significant reduction
in labour cost and improved built quality since AM machines are extremely accurate and could
technically work 24 hours a day. A china construction firm, WinSun, managed to print a full-
Chapter 2 Literature Review 11
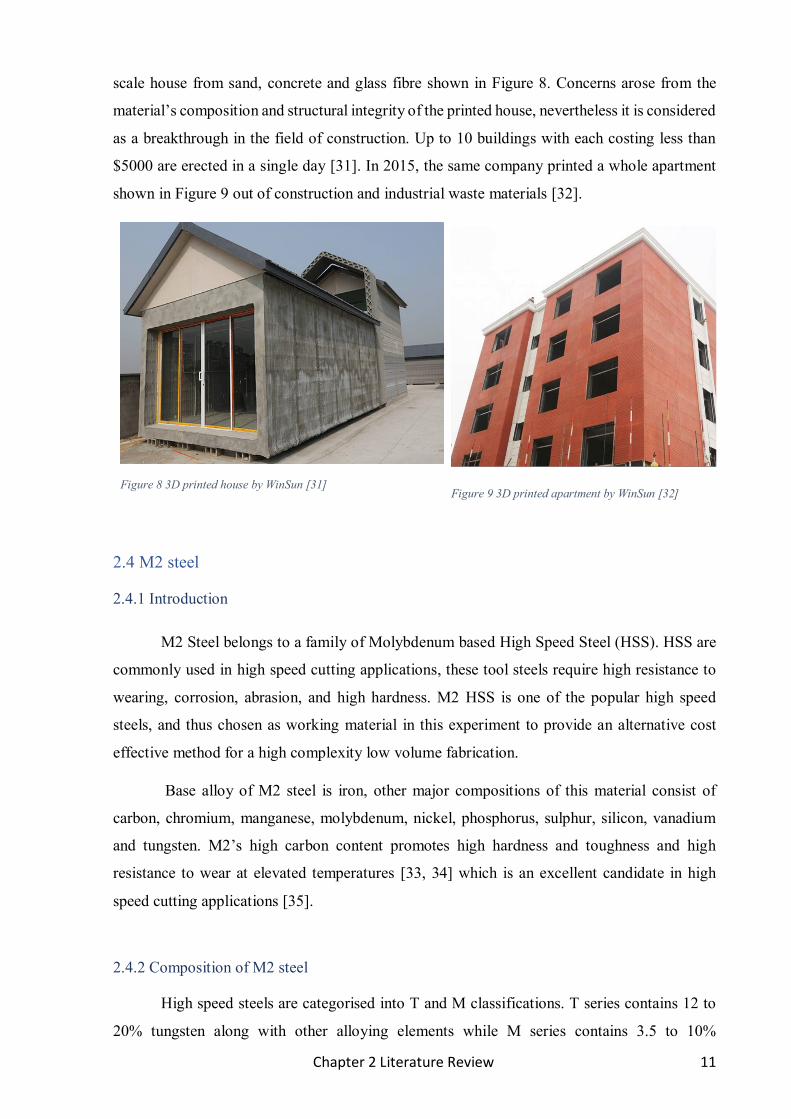
scale house from sand, concrete and glass fibre shown in Figure 8. Concerns arose from the
material’s composition and structural integrity of the printed house, nevertheless it is considered
as a breakthrough in the field of construction. Up to 10 buildings with each costing less than
$5000 are erected in a single day [31]. In 2015, the same company printed a whole apartment
shown in Figure 9 out of construction and industrial waste materials [32].
Figure 8 3D printed house by WinSun [31]
Figure 9 3D printed apartment by WinSun [32]
2.4 M2 steel
2.4.1 Introduction
M2 Steel belongs to a family of Molybdenum based High Speed Steel (HSS). HSS are
commonly used in high speed cutting applications, these tool steels require high resistance to
wearing, corrosion, abrasion, and high hardness. M2 HSS is one of the popular high speed
steels, and thus chosen as working material in this experiment to provide an alternative cost
effective method for a high complexity low volume fabrication.
Base alloy of M2 steel is iron, other major compositions of this material consist of
carbon, chromium, manganese, molybdenum, nickel, phosphorus, sulphur, silicon, vanadium
and tungsten. M2’s high carbon content promotes high hardness and toughness and high
resistance to wear at elevated temperatures [33, 34] which is an excellent candidate in high
speed cutting applications [35].
2.4.2 Composition of M2 steel
High speed steels are categorised into T and M classifications. T series contains 12 to
20% tungsten along with other alloying elements while M series contains 3.5 to 10%

Chapter 2 Literature Review 12
molybdenum [35] along with other alloy elements. Generally M series high speed steels tend
to distort less during heat treatment, has an abrasion resistance higher than T series, and cheaper
cost of production [36]. Table 2 documents the composition of alloys in regular and high carbon
molybdenum based high speed steels.
Table 2: Composition for Molybdenum based M2 HSS [35]
AISI type UNS
designation
C Si Cr V W Mo Co
M2
Regular
Carbon
T11302 0.83 0.33 4.13 1.98 6.13 5.0 -
M2 High
Carbon
T11302 1.0 0.33 4.13 1.98 6.13 5.0 -
2.4.2 Effects of Alloying Elements
Carbon is considered as the most important alloying element in M2 HSS, having a linear
relationship with hardness of the steel. Higher carbon content yields a greater number of carbide
microstructures, resulting in a greater resistance to wear [37].
Silicon has negligible effect on mechanical properties of steel. Generally, silicon content
is between 0.15 to 0.45%. Lower silicon contents result in a lower automatizing temperature
where manufacturers avoid overheating by adding up to 0.45%.
Chromium is an important alloying element which is present in all M and T series HSS,
ranging between 3 to 5%. High chromium increase hardness while low chromium increase
toughness. 3 to 4% is the optimum percentage for a trade-off between hardness and toughness
[35, 38].
Vanadium content allows formation of hard carbides which increase wear resistance of
the steel. It was originally added to the steels for purpose of reducing level of impurities and
nitrogen during melting process [35, 39].
Tungsten plays a significant role in M1 to M62 excluding M10, and all T series high
speed steels [40]. It adds resistance to wear, induces secondary hardening. It is replaced by
molybdenum when tungsten content is reduced.
Molybdenum provides enhancement to mechanical properties of steel due to its
alteration of the ferrite-carbide microstructure by replacing upper bainite and acicular ferrite
with carbide [41]. This is desirable in M grade high speed steels for excellent hot hardness and
toughness [35].

Chapter 2 Literature Review 13
Heat treatment is a critical step in improving mechanical properties of steel. Proper heat
treatment ensures total transformation of ferrite and alloy carbides to tempered martensite with
carbides. Typical steps involve preheating of sample for thermal shock reduction, austenitizing
for alloy carbides to dissolve within, quenching with a controlled cooling rate for austenite to
martensite transformation to take place, and finally tempering for stress relieving and gain in
secondary hardness.
Figure 10 shows microstructure of tool steel after annealing, ferrite and alloy carbides
can be observed, Figure 11 shows microstructure of tool steel after tempering, where it consists
of martensite and carbides.
Figure 10: Microstructure of annealed tool steel with ferrite and alloy carbides. 1000X [35]
Figure 11: Microstructure of hardened and tempered tool steel with martensite carbides. 1000X [35]
2.5 Case study on Powder Metallurgy of M2 steel
Powder metallurgy is widely adopted in production of high speed steels [42].
Mechanical pressing generates pressure to compact powders directly into shaped dies, this
provides a refined and homogeneous microstructure [43]. After pressing, parts are sintered, a
process where they are heated to metallurgical bond the individual particles at a temperature
between liquidus and solidus to densify the object [44, 45]. Further tempering relieves internal
stresses and induce transformation for untempered martensite of up to 20% [46]. Density and
shrinkage of sintered parts were closely studied with sintering temperature in a conducted
experiment [44]. At sintering temperature of 1300°C, density is near to theoretical 96% density
values, shrinkage is around 14%. Sintering temperature lower than 1300°C results in a reduced
shrinkage of parts, however a significant drop in density could be observed in Figure 13.

Chapter 2 Literature Review 14
Figure 12: Effects of sintering temperature on density of M2 HSS samples [44]
Figure 13: Effects of temperature on shrinkage of M2 HSS samples [44]
To achieve sound mechanical properties of sintered parts, density close to theoretical
achievable of 96% is desired. Any sintering temperature of above 1300°C results in higher
shrinkage with an insignificant increase in density shown in Figure 12 [44].
Figure 14: Microstructure of M2 HSS sintered at 1280°C [44]
Figure 15: Microstructure of M2 HSS sintered at 1290°C [44]
Figure 16: Microstructure of M2 HSS sintered at 1300°C [44]
Figure 17: Microstructure of M2 HSS sintered at 1310°C [44]
Figure 14: Samples sintered at 1280°C contains pores and traces of low liquid phase
fraction, object’s density is not sufficient. Figure 15: Pore size reduced, grain size increased,

Chapter 2 Literature Review 15
higher density compared to Figure 14. Figure 16: Increased grain size when compared to Figure
14 and Figure 15, thick films formed by carbides along the grain boundaries. This is the critical
temperature of sintering for optimum trade-offs between density and shrinkage. Figure 17:
Grain size increased further, excessive liquid phase fraction.
Tempering takes place after sintering of
object, Figure 18 shows experimental data for
hardness levels with additional cycles of
tempering between 540-600°C for varying
previously sintered temperatures of parts. It
can be observed that 2 tempering cycles after
sintering of parts at 1300°C results in a highest
hardness [44]. Research on powder metallurgy
and tempering is particularly useful in dealing
with situations encountering with unmelted
powders during AM. Sintering could potentially be a heat treatment process to boost density
levels, and tempering could enhance mechanical properties of fabricated AM samples.
2.6 Case study on Selective Laser Melting of M2 HSS
Z.G. Liu et al performed SLM experiment with M2 as working powder using laser
power of 90W and 105W with scanning speeds from 100mm/s to 850mm/s [47] using nitrogen
as inert gas, keeping oxygen level less than 1%. Machine used for the experiment is M2 Linear
from Concept Laser. Warpages, baseplate separation and cracking was observed in Figure 19
and was suggested the problem was due to high residue stress incurred during fabrication [47].
High carbon contents, greater than 0.9% in M2, contributes to high brittleness of the part. Laser
Figure 19 Defects from fabrication of M2
with SLM [47]
Figure 20 Parts produced without (left) and with (right) baseplate preheating [47]
Figure 18: Hardness of M2 HSS tempered at 580°C, with varying sintering temperature [44]

Chapter 2 Literature Review 16
welding literature recommends preheating on high carbon steel exceeding 0.6% carbon content
[48]. Without adequate preheating, high cooling rate is induced where high carbon contents are
trapped in a Body-Centered Cubic (BCC) structure, forming martensitic structures where high
internal stress is contained [49]. Figure 20 left shows parts printed without baseplate preheat
while right shows parts printed with baseplate preheat. Quality of printed parts improved
tremendously, with minimum defects observed. Relative density of 99% was observed when
using a 105W laser at 400mm/s scanning speed.
Figure 21 Dark phase magnification of dendritic structure
[47]
Figure 22 EBSD tests on dark and bright phase [47]
Figure 23 Cellular like structure in dark phase [47]
Figure 24 HV values for varying laser speed (top), different phases (bottom) [47]
Figure 21 shows dendritic structure found in dark phase under the optical microscope,
Electron Backscatter Diffraction (EBSD) tests from Figure 22 suggest dark phases consisting

Chapter 2 Literature Review 17
of martensite and ferrite with a prominent level of confidence index while bright phases are
suspected to be martensite. Bright phases have high hardness of around 870HV from Figure 24,
and exist around the edge of the melt pool which experiences high cooling rates, hence
suggesting martensite formation in that region. Figure 23 shows cellular like structures near the
centre of melt pool. Average hardness from SLM appeared to be around 800HV to 900HV,
higher than conventionally produced M2 steel which varies from 750HV to 830HV [50]
depending on which heat treatment process used.
This case study provides a better understanding on how different SLM processing
parameters affect the microstructure and hardness of parts, and provides a comprehensive guide
on distinct phases there exist in the microstructure of M2 steel.
2.7 Case study on 316L Stainless steel
DLD experiment was performed with a 1KW diode laser incorporated with FADAL
CNC. 316L Stainless steel powder used as a working powder. Similar to the current project,
effects of laser power, nozzle velocity and powder feed rate is experimented with and
investigated [51]. Table 3 shows configuration for 9 samples which are divided into 3 groups
of constant laser power with varying nozzle speed and powder feed rate. Each fabricated block
has equal dimensions of 50mm by 50mm by12.7mm.
Table 3: Sample processing parameters [51]
Sample
#
Laser Power
W
Nozzle velocity
mm/min
Powder feed rate
g/min
1 600 300 8
2 600 375 10
3 600 450 12
4 750 300 10
5 750 375 12
6 750 450 8
7 900 300 12
8 900 375 8
9 900 450 10
Microstructural analysis for laser power of 600W and nozzle velocity of 300mm/min
was performed under the SEM, results of top and bottom layers shown in Figure 25 and 26. it
can be observed that microstructure has a smooth and thin structure, grain spacing seems
reasonable close between top and bottom layers. The microstructure appears to be circular and
grain size around 15 to 35 µm.

Chapter 2 Literature Review 18
Figure 25: Microstructure of top layers (power=600W, nozzle velocity 300mm/min) [51]
Figure 26: Microstructure of bottom layers (power=600W, nozzle velocity 300mm/min) [51]
Figure 27: Microstructure of sample (power=750W, nozzle velocity 300mm/min) [51]
Figure 28: Microstructure of sample (power=750W, nozzle velocity 450mm/min) [51]
With power held constant, slower velocity of
nozzle retards heat loss, resulting in a slower
cooling rate. While higher velocity of nozzle
promotes greater heat loss, thus faster cooling
rate. For cooling rate comparison, Figure 27
and 28 has its laser power held constant at
750W, while velocity of nozzle changes from
300 to 450 mm/min. It is observed that grain
size reduced as velocity of nozzle increases,
due to faster cooling rate. Figure 29 shows Figure 29: Microstructure of sample (power=900W, nozzle
velocity 300mm/min [51]

Chapter 2 Literature Review 19
large grain size microstructures, with constant nozzle velocity as before, however power was
increased to 900W, resulting in a reduced cooling rate, hence the increment in size of grain
structures. Rapid directional solidification with high temperature gradient allows formation of
finer, closer packed grains microstructure configurations, promoting its mechanical properties.
This case study features the relationship of parameters and their microstructural effects on
deposited layers on 316L Stainless Steel. It features detailed imageries of microstructural
formations that can be closely studied towards experimenting with M2 HSS
2.8 Effects of laser attenuation
Thermal energy is provided by
highly focused high powered laser
beams. Typical DLD machines
utilizes Nd:YAG (Neodymium-
doped yttrium aluminium garnet),
CO2 lasers and Fibre lasers. LENS
450 uses an IPG 400W Fibre laser.
Laser attenuation refers to the ratio
of original power emitted by the
laser to power absorbed on surface
of substrate. This is affected by
factors such as powder feed rate and
profile [52]. With a constant laser power, as feed rate increases, temperature of powder on
surface reduces. Figure 30 shows that significant laser attenuation could occur, resulting in only
75% of original laser power reaching the surface of substrate. Another important consideration
of attenuation involves melt pool absorption, where power is scaled according to material’s
coefficient of absorption, ranging from 0.15 to 0.5. Previous experiment shows efficiency of
H13 tool steel between 0.3 to 0.5 on LENS AM [53]. Powder has the tendency to melt mid-air
when laser power is set too high. Wen and Shin demonstrated that particles melted before
reaching the melt pool while passing through lasers emitting heat of over 1800K [54], while
some experiments results in no evaporation [55]. Efficiency of powder is given by the ratio
between total powder ejected by nozzle and actual powder used towards product fabrication. A
low powder efficiency requires regular cleaning and collection of unused powder, increasing
labour costs commercially. Powder efficiency for H13 tool steel fabrication on LENS is
recorded to be fairly low at around 0.14 [53].
Figure 30: Effects of laser attenuated to original power with varying radial distance to laser beam centre. (H13, Power=2200W, beam
diameter 1.2mm, nozzle velocity 300mm/min) [8]

Chapter 2 Literature Review 20
2.9 Effects of AM Optimisation Parameters
This section provides a literature review for AM parameters and their importance on the
fabrication process. Overview of DLD events is described, along with powder feed rate, laser
power and nozzle scanning velocity effects on fabricated part discussed, alongside with
microstructure formation with varying cooling rates.
2.9.1 Overview of physical events during DLD
Figure 31 defines the physical events that occur during DLD. Laser provides thermal
energy governed by blown powder energy transfer which induce fusion of powder through
blown powder dynamics. During melting process, melt pool heat loss affects melt pool
dynamics which subsequently affects solidification process. This ultimately influences the
material’s microstructure and mechanical properties [8]. This research shall consider part of
blown powder dynamics, microstructural and resultant mechanical properties section.
Figure 31 Physical events occurring during DLD [8]

Chapter 2 Literature Review 21
2.9.2 Powder Feed Rate
Powder feed rate must be accurately adjusted with laser power and nozzle scanning
velocity. High powder feed rates could induce porosities and partially melted particles due to
excessive mass addition with inadequate fusion. On an open loop AM such as LENS450,
inadequate fusion could cause a mismatch between actual height built and commutated height,
causing a shift in laser focal distance that results in poor built quality as more layers are built.
2.9.3 Laser Power
Laser power affects cooling rates, thus has a significant impact towards the quality of
fabricated parts. Low laser power produce fine equiaxed grains while high laser power produce
large columnar grains [56]. Lower laser power with high nozzle scanning velocity produce a
lower heat input, thus higher rate of cooling, and higher laser power with lower nozzle scanning
velocity produce a higher heat input that result in a higher rate of cooling [56, 57].
2.9.4 Nozzle Scanning Velocity
Laser power and nozzle scanning velocity combinations are experimented on SLM with
by D. Gu and Y. Shen [58] as shown in Figure 32a. Figure 32b shows the path of laser travel.
Four possible outcomes with different laser power and scanning speed documented in Table 4.
Figure 32 Laser power vs nozzle scanning speed (a), path of laser travel (b) [58]

Chapter 2 Literature Review 22
Table 4 Description for different types of melting encountered during AM
Zone Phenomenon Description
I No Melting Powder remains solid, insufficient thermal energy for fusion
to occur
II Partial Melting With incomplete melting and solidification of powder, balling
can be observed where a mixture of partial melted particles
accumulates as “balls” shown in Figure 33b
III Melting with
Balling
Higher scan speed with higher laser power create long
cylindrical lines, which breaks up into course rows of beads
due to reduction of surface tension shown in Figure 33c
IV Complete Melting Permanent lines of melted solid tracks created, particles fuse
completely together shown in Figure 33a
Figure 33 Complete melting (a), Partial melting(b), Partial melting with balling (c) [58]
2.9.5 Microstructure
Solidified microstructure depends on the ratio of thermal gradient (G) to solidification
rate (V) given by G/V. As G/V increases, columnar structure is produced, as G/V decreases,
equiaxed structures are more likely to form. When subsequent layers are built, the centre of the
previous layer melt pool experiences repeated thermal cycle, lowering the cooling rate therefore
higher probability of producing directional columnar structure [56, 59]. Along the edges, heat
is conducted and radiated away quickly to the substrate and surroundings thus a higher cooling
rate. This results in finer and equiaxed dendrites forming along the edges [60, 61].

Chapter 3 Methodology 23
Chapter 3 Methodology
3.1 Research overview
To study the effects of thermal history in AM process, Optomec LENS 45 AM
equipment was selected and mastered to produce samples for investigation. A brief introduction
is provided for all equipment used, along with the discussion of methodology undertaken for
the research. Utilising optimised parameters, studies for thermal history effects, microhardness,
and effects of stress relieving heat treatment were performed.
3.2 AM Parameter Optimisation
3.2.1 LENS 450 AM equipment
Optomec LENS 450 is a workstation capable of direct fabrication of metal parts from
powdered metal. Figure 34 shows the AM equipment and integrated components. 400W IPG
fibre laser is incorporated with LENS450 to provide thermal energy. Controlled atmosphere
process chamber allows argon gas delivery for inert environment. Powder feed system consists
of a pump capable of impelling working powder size from 36 to 150 micron diameter.
Figure 34 Optomec LENS 450
Figure 35 LENS450 working area
Four jet deposition head in the powder feed nozzle assembly provides uniform distribution of
powder, independent of process motion. X, Y and Z-axis motion control is connected to DC
servo motors. Working area dimension is 100mm X 100mm X 100mm shown in Figure 35.
PartPrep software is used to create and convert CAD files to STL formats and LENS
Workstation Control software sends commands for AM fabrication.

Chapter 3 Methodology 24
3.2.2 M2 Powder Specification
Powder used in this research was M2 HSS from Hoganas, spec sheet shown in Appendix
A with the following composition shown in Table 5. It is considered as a high carbon material,
similar composition with T11302 grade high carbon steel as discussed in Chapter 2
Table 5 Chemical composition of M2 HSS from Hoganas
Chemical
Component
Fe C Si Cr V W Mo Mn
Percentage (%) 81.2 1.0 0.3 4.0 2.0 6.2 5.0 0.3
3.2.3 Optimisation Procedures
There are two main ways to approach optimisation procedures; trial and error and
systemically approach. Trial and error using test parameters from literature allows quicker
progress provided initial parameters are adequately accurate. Luck is involved for trial and
error, increasing the risk of potential delays of the experiment. Systematic approach was
followed to ensure consistency and quality of work is upheld.
Figure 36 Systemic approach for parameter optimisation
Figure 36 illustrates the systemic approach for parameter optimisation. Optimised
parameters must yield the highest density. Hence the optimisation process goes by holding
powder feed rate and laser power constant with 5 varying values of nozzle scanning velocity
21,23,25,28,30 and 33 inches per minute (ipm). Parts were then printed and removed from the
substrate with a cutting tool. Next, densities of the printed objects measured using Archimedes
principle. The nozzle scanning velocity parameter “A ipm” that yields the highest density
Variable Nozzle
Scanning Velocity (ipm)
21
23
25
28
30
33
Fixed
300W 5RPM
Variable Powder Feed
Rate (rpm)
4
5
6
Fixed
300W A IPM
Variable Laser Power
(W)
250
300
350
Fixed
A IPM B RPM

Chapter 3 Methodology 25
selected and held constant with laser power, along with 3 varying powder feed rates of 4,5 and
6 rpm, where “B rpm” is selected with the highest local density. Finally, the process repeats
with fixed nozzle scanning velocity of “A ipm” and powder feed rate of “B rpm” with three
laser power settings of 250, 300 and 350W. Parts with the highest density had its parameters
finalised as optimum.
3.2.4 Density Test
Printed parts were fused onto the substrate upon removing from LENS 450 shown in
Figure 37 top and after removal shown in Figure 37 bottom. Densities of printed samples were
derived using Archimedes principle. Weight of the sample was measured in air and
Perfluoropolyether Fluorinated fluid (Galden PFPE) using A&D GR200 lab balance shown in
Figure 38. The derived difference in weight then used to calculated the actual density of the
part in Appendix B. These values were compared against density of conventional manufactured
M2 HSS of 8138kg/m3 [62].
Density is an important benchmark in determining the quality of parts fabricated by AM
processing parameters. A higher density part would mean less porosities in the parts. Porosity
results in decreased mechanical properties of a metal and increases particle fracture due to
reduction in cross-section [63].
Figure 37 Parts on substrate (top), after removal (bottom)
Figure 38 A&D GR200 Lab Balance

Chapter 3 Methodology 26
3.3 Microstructure Analysis
3.3.1 Polishing and Etching
Prior to OM microstructure analysis, samples were hot mounted, polished to remove
any irregularities and imperfections on the surface, following by etching to reveal its
microstructure. Samples were initially cut into smaller pieces, cleaned with alcohol and hot
mounted with PolyFast resins using Struers CitoPress-30 shown in Figure 39. Samples were
then grinded with 320, 800, 1200 and finally 4000 grit silicon carbide paper, each for a minute
Figure 39 Struers CitoPress-30
Figure 40 Struers TegraPol-31
for surface finish enhancement on Struers TegraPol-31 in Figure 40. Samples were then
polished. Nital 4% containing 96% Ethanol and 4% Nitric acid was used as etchant towards
revealing sample’s microstructure features. Samples with 1,2 and 4 layers were etched between
10 to 20 seconds to prevent over etching, while samples with 15 and full block of 30 layers
were etched much longer to reveal visible microstructure features.
3.3.2 Optical Microscope (OM)
Microstructure analysis was performed on Reichert
POLYVAR optical microscope shown in Figure 41. Canon
EOS 5D Mark II DSLR attached onto the OM to capture
high resolution images for this experiment. Camera
settings used in this experiment: ISO 1600, 50mm focal
length, dimensions 2784 X 1856, horizontal and vertical
resolution 72 dpi. Images taken were then processed with
Spot32 digital processing software for scale bar addition.
Figure 41 Reichert POLYVAR OM

Chapter 3 Methodology 27
3.4 Hardness and Microhardness Testing
For test of average hardness throughout a 30-layer complete sample, Rockwell hardness
test was preformed using BUEHLER Rockwell tester shown in Figure 42. Test load of 1.961N
and 15 seconds of indentation period was used on the equipment. Three values were taken
throughout the top, middle and bottom of full sized samples to determine the average hardness.
Struers Duramin shown in Figure 43 was used to determine the microhardness in each layer of
printed sample. 4.903N of force with 12 seconds of indentation period and 0.5HV step
resolution were selected. Figure 45 shows the indentation as seen through Duramin’s built in
microscopic lens. d1 and d2 values from Figure 44 were measured manually using the turn knob
and selection button on the equipment, yielding calculated hardness values.
Figure 42 BUEHLER Rockwell tester
Figure 43 Struers Duramin Microhardness tester
Figure 44 Indent distances (29a)
Figure 45 Indent seen under microscope (29b)
Much attention was required during microhardness test process. Prominent level of
magnification has been used to achieve best focal resolution. Indentation on porosities and
surface defects were avoided to reduce imprecision of results. Three values were taken on each
layer of fabricated sample from top to bottom. Results with imperfect indents such as overly
rounded, broken or chipped off edges were discarded and retaken on another point in
neighbouring vicinity from the original location.
2, 4, 8, 15 and 30 layer samples were fabricated with optimum parameter settings. Every
layer for all samples had their hardness values taken and studied for any variability in hardness
throughout the printed parts. Hardness values for the first layer has been ignored due to carbon
diffusions that occurs from the high carbon content M2 into the low carbon content substrate
during initial fabrication as it may cause inconsistency in hardness results [64]. List of hardness

Chapter 3 Methodology 28
results are shown in Appendix C. Optimised parameters should yield parts with hardness equal
or higher than that of conventional manufactured M2 HSS.
3.5 Thermal history effects on bottom layers with additional layers
To study the thermal history effects on bottom layers with additional layers built, OM
images for second layer in a 2, 3, 4, 8 and 30 layer samples fabricated with optimised parameters
were compared along with hardness results, microstructure features against each other. This
new area of research enhances understanding towards changes of microstructure induced by
repeated heat cycles as more layers are built during AM process, hence may provide an effective
prediction towards quality and mechanical properties of future full scale fabricated parts.
3.6 Stress Relieving Heat Treatment
Stress relieving heat treatment was performed for 1, 2, 4, 8, 15 and 30-layer sample in Contherm
Thermotec 2000 oven as shown in Figure 46 at
200 degree Celsius for 45 minutes as suggested by
sources [64, 65]. During this process, peak stress
is relieved without significantly reducing
hardness [65]. Hardness values for each individual
layer of samples were taken from post heat
treatment process, microstructure analysis for
second layer performed, overall average hardness
values measured and compared with the samples
before undertaking heat treatment. Hardness
values of post heat treatment were described in
Appendix C. Due to time constrain limitations, prolonged heat treatment was unable to be
performed. Literature review suggested dual preheating stages, austenitzing, followed by three
tempering stages to transform ferrite and alloy carbides into hardened, tempered martensitic
structure with excellent hardness and toughness. First stage of preheat is carried out at around
700 oC, second stage preheat at around 880 oC. Austenitzing brings the temperature to around
1200 oC for 2-6 minutes, where alloy carbides are dissolved during this stage. Quenching
transforms the austenite into martensitic structure, finally three sets of tempering for 2-4 hours
each, and air cooled in between tempering. Subzero treatments can be performed after
tempering to further enhance austenite to martensite transformation [35, 66], however it may
induce brittle martensite causing internal cracking or distortions due to quenching process [35].
Figure 46 Contherm Thermotec 2000 oven
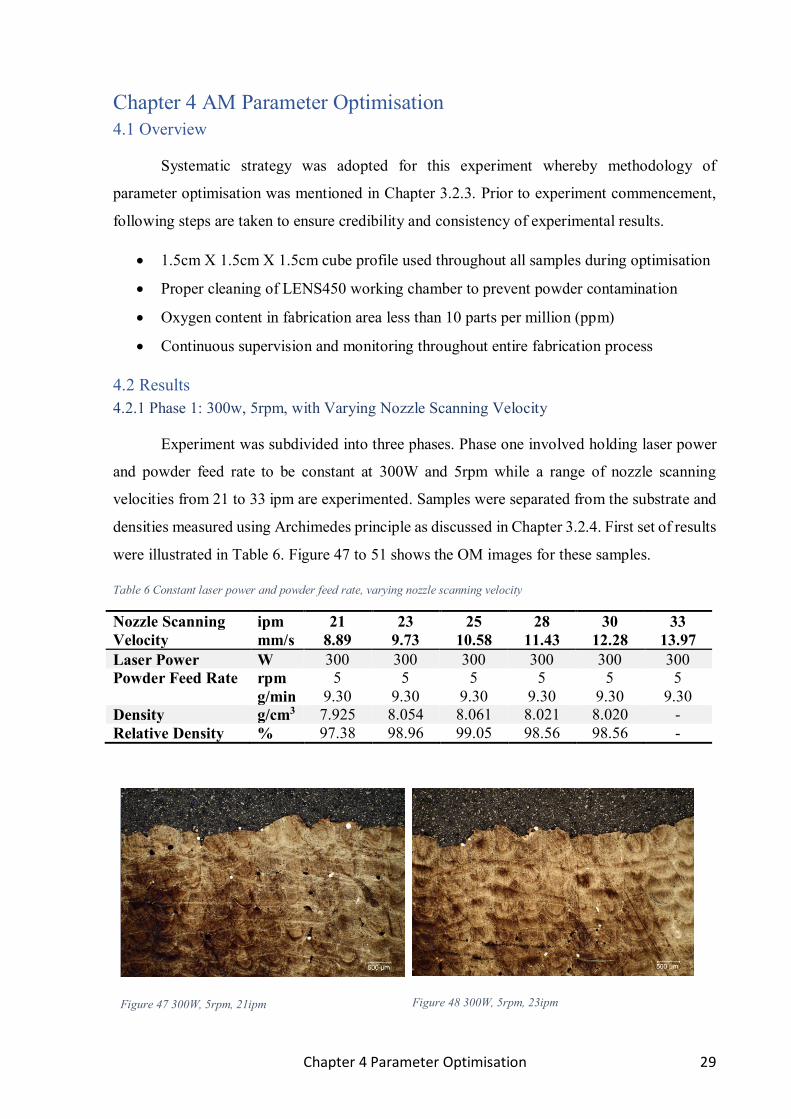
Chapter 4 Parameter Optimisation 29
Chapter 4 AM Parameter Optimisation
4.1 Overview
Systematic strategy was adopted for this experiment whereby methodology of
parameter optimisation was mentioned in Chapter 3.2.3. Prior to experiment commencement,
following steps are taken to ensure credibility and consistency of experimental results.
• 1.5cm X 1.5cm X 1.5cm cube profile used throughout all samples during optimisation
• Proper cleaning of LENS450 working chamber to prevent powder contamination
• Oxygen content in fabrication area less than 10 parts per million (ppm)
• Continuous supervision and monitoring throughout entire fabrication process
4.2 Results
4.2.1 Phase 1: 300w, 5rpm, with Varying Nozzle Scanning Velocity
Experiment was subdivided into three phases. Phase one involved holding laser power
and powder feed rate to be constant at 300W and 5rpm while a range of nozzle scanning
velocities from 21 to 33 ipm are experimented. Samples were separated from the substrate and
densities measured using Archimedes principle as discussed in Chapter 3.2.4. First set of results
were illustrated in Table 6. Figure 47 to 51 shows the OM images for these samples.
Table 6 Constant laser power and powder feed rate, varying nozzle scanning velocity
Nozzle Scanning
Velocity
ipm
mm/s
21
8.89
23
9.73
25
10.58
28
11.43
30
12.28
33
13.97
Laser Power W 300 300 300 300 300 300
Powder Feed Rate rpm
g/min
5
9.30
5
9.30
5
9.30
5
9.30
5
9.30
5
9.30
Density g/cm3 7.925 8.054 8.061 8.021 8.020 -
Relative Density % 97.38 98.96 99.05 98.56 98.56 -
Figure 47 300W, 5rpm, 21ipm
Figure 48 300W, 5rpm, 23ipm

Chapter 4 Parameter Optimisation 30
Figure 49 300W, 5rpm, 25ipm
Figure 50 300W, 5rpm, 28ipm
Figure 51 300W, 5rpm, 30ipm
From Table 6 it was observed that 25ipm produces a local optimum relative density of 99.05%.
This value was chosen and applied to phase two of the experiment.
4.2.2 Phase 2: 300W, 25ipm, with Varying Powder Feed Rate
From phase one of the experiment, nozzle scanning velocity of 25ipm was chosen.
Second phase of parameter optimisation process involved holding laser power and nozzle
scanning velocity constant at 300W and 25ipm, with varying values of powder feed rate from 4
to 6 rpm. Second set of results were illustrated in Table 7. Figure 52 to 54 shows the OM images
for these samples. It was observed from Table 7 that powder feed rate of 5rpm yielded the local
optimum relative density of printed parts at 98.90%. This value was chosen for the third phase.
Table 7 Constant laser power and nozzle scanning velocity, varying powder feed rate
Powder Feed Rate rpm
g/min
4
6.89
5
9.30
6
12.34
Laser Power W 300 300 300
Nozzle Scanning
Velocity
ipm
mm/s
25
10.58
25
10.58
25
10.58
Density g/cm3 8.003 8.049 7.868
Relative Density % 98.34 98.90 96.68

Chapter 4 Parameter Optimisation 31
Figure 52 300W, 25ipm, 4rpm
Figure 53 300W, 25ipm, 5rpm
Figure 54 300W, 25ipm, 6rpm
4.2.3 Phase 3: 25ipm, 5rpm, with Varying Laser power
From phase two of the experiment, powder feed rate of 5rpm or 9.30 g/min were chosen.
Third phase of parameter optimisation process involved holding nozzle scanning velocity and
powder feed rate constant at 25ipm and 5rpm, with varying values of laser power 250W, 300W
and 350W. Third set of results were illustrated in Table 8. Figure 55 to 57 shows the OM images
for these samples. It was observed from Table 8 that laser power of 300W yielded the local
optimum relative density of printed parts at 99.05%. This value was chosen for the final
parameter for optimisation process. Hence optimisation of parameter was completed, with nozzle
scanning velocity of 25ipm or 10.58mm/s, powder feed rate of 5rpm or 9.30g/min and laser
power of 300W were identified as optimised parameters in this experiment.
Table 8 Constant laser power and nozzle scanning velocity, varying powder feed rate
Laser Power W 250 300 350
Nozzle Scanning
Velocity
ipm
mm/s
25
10.58
25
10.58
25
10.58
Powder Feed Rate rpm
g/min
5
9.30
5
9.30
5
9.30
Density g/cm3 7.898 8.061 7.886
Relative Density % 97.05 99.05 96.90

Chapter 4 Parameter Optimisation 32
Figure 55 25ipm, 5rpm, 250W
Figure 56 25ipm, 5rpm, 300W
Figure 57 25ipm, 5rpm, 350W
4.2.4 Hardness Test using Optimised Parameters
Rockwell hardness test was performed on a 15 and 30-layer block of samples fabricated
with optimised parameters. Hardness test results were shown in Table 9. A complete table with
three readings off each layer reflected in Appendix C. HRC values were converted to HV values
[34] for comparison with further microhardness tests results. Both 15 and 30-layer samples
displayed consistent pattern of increasing following by decreasing hardness from bottom to top.
Both samples agreed to bottom layer having minimum hardness across the whole sample. 15-
layer sample yields an average of 909.67 HV while 30-layer sample yields an average of 903.33
HV. Total average HV values of this two samples were found to be 906.50 HV which was
higher than conventional produced M2 steel’s hardness varying from 750HV to 830HV [50].
Table 9 Rockwell Hardness test results for 15 and 30-layer sample
Location Top Middle Bottom
15 Layer HRC
HV
67.4
918
68.1
947
66.0
864
30 Layer HRC
HV
67.4
916
67.8
935
65.7
859
Average HV
15 layer 909.67
30 layer 903.33
2 samples 906.50

Chapter 4 Parameter Optimisation 33
4.3 Discussion
This section provides discussion of results for individual densities and quality of parts
fabricated during parameter optimisation stages. Using optimised parameters, new samples are
produced, microstructure features discussed, along with hardness test comparison with
conventionally manufactured M2 HSS
4.3.1 Density
Figure 58 summarises the relationship between nozzle scanning velocity and fabricated
parts’ densities during phase one of the parameter optimisation process as mentioned in Chapter
3.2.3 Optimisation Procedures.
It was observed in Chapter 4.2.1 during first phase of the experiment, porosity contents
reduced as nozzle scanning velocity is increased from 21ipm to 23ipm shown in Figure 47 to
49, small porosities can be seen near the centre layer. Part has slight uneven contours on the top
surface. At 25ipm, part produced contain the best surface finish, melt pools appears to be
parallel, top surface can be seen more refined. As nozzle scanning velocity further increases
beyond 25ipm, porosity content is increased. Parts fabricated at 28 ipm shown in Figure 50 has
a slight curved top edge. Pores with entrapped gas can be observed at the right edges. As nozzle
velocity is further increased to 30ipm in Figure 51, larger porosities are generated. Melt pool
shows an upward shift along the top corners, where surface finish is considered not satisfactory.
At 33ipm, part was unable to be built. During fabrication, it was observed that nozzle scanning
Figure 58 Relationship between nozzle scanning velocity and density

Chapter 4 Parameter Optimisation 34
velocity was too fast, causing incomplete melting to take place, when LENS450 attempts to
build the second layer, incompetent fusion on the first layer causes a reduction in thickness,
thus resulting in laser being out of focus. With open loop process, LENS450 was unable to
compensate the reduction in first layer thickness, hence the process repeats with laser getting
increasingly unfocused as more layers are attempted.
Figure 59 summarises the relationship between powder feed rate and fabricated parts’
densities during phase two of the parameter optimisation process.
Figure 59 Relationship between powder feed rate and density
Figure 52 shows sample fabricated at 4rpm or 6.89g/min. small porosities can be seen
throughout the whole part. Cracks are observed on the top layer, possibly elongated from the
porosities during solidification process where it experienced high rate of cooling. Density of
part is relatively high at 98.34%. As powder feed rate is increased to 5rpm or 9.3g/min, porosity
contents decreased slightly. General feature and quality of parts seem to be relatively similar
with the part fabricated at 4 rpm. When powder feed rate is further increased to 6rpm or
12.34g/min, significant changes to the general structure can be seen in Figure 54. Huge
porosities can be observed, there is evidence of incomplete melting and fusion throughout the
whole part, however more prominent in the bottom layers. Melt pool microstructure are not
clearly visible due to high amount of porosity causing inability of part for etching reaction to
take place. Top layer surface finish seemed uneven. It was also noted that during fabrication of
part at 6rpm, excessive amount of powder is transported onto the substrate, resulting in powder
bouncing off the workpiece. High powder feed rate without increasing laser power causes large
amount of unmelted powder and poor fusion, inducing large porosities. Hence from the second

Chapter 4 Parameter Optimisation 35
phase of parameter optimisation process, both 4rpm and 5rpm seem to yield reasonably high
densities, however parts fabricated at 5rpm has an enhanced density advantage of 0.55% over
sample at 4rpm.
Figure 60 summarises the relationship between laser power and fabricated parts’
densities during phase two of the parameter optimisation process.
Figure 60 Relationship between laser power and density
During fabrication of sample at 250W, large porosities were observed in Figure 55. This
phenomenon is due to insufficient thermal energy for a complete melting. 2.95% porosity was
recorded and it was deemed too high, such part lack of structural quality. The sample did not
respond well to etching due to porosities. Figure 56 shows a sample fabricated with 300W. Melt
pools seem to align with each other and layers seem perfectly parallel with one another. Some
tiny porosities of less than 50μm can be seen along the edge of melt pools. Permanent lines of
melted solid tracks can be seen within each layer, safeguarding the fusion of M2 particles.
Relative density of 99.05% was achieved at 300W. Figure 57 shows part fabrication with laser
power of 350W. This sample contains porosity similar to that of the sample fabricated with
insufficient thermal energy. Cracks on the bottom left is observed, along with huge porosities
with width of up to 500μm. Laser was unable to focus well during fabrication of this sample.
Porosity of 3.10% was recorded. From the three phases, optimised parameters are finalised with
nozzle scanning velocity identified as 25ipm or 10.58mm/s, powder feed rate to be 5rpm or
9.30g/min and laser power of 300W.

Chapter 4 Parameter Optimisation 36
4.3.3 Hardness
Rockwell hardness test was performed on top, middle and bottom layer of a 15 and 30-
layer sample fabricated on optimum parameters. 15-layer sample had an average hardness of
909.67HV while 30-layer sample had an average hardness of 903.33HV. Overall hardness for
both samples were higher than conventionally produced M2 steel’s hardness which varies from
750HV to 830HV [50] depending on heat treatment process used. This phenomenon agrees
with various literatures on 316L steel, suggesting AM parts adopt higher hardness values
compared to conventional manufactured 316L parts [67, 68]. Both samples show discrepancy
in hardness values between top and bottom layers, where a trend of increasing following by
decreasing hardness. Both samples’ top layer hardness appears to be higher than bottom layers,
this can be confirmed with experiment done by Griffith et al, suggesting final layers
experiencing less thermal cycling as compared to bottom layers, hence the higher hardness
values relative to initial layer deposition [55].
4.3.2 Microstructure
This section discusses about the general microstructure features of AM produced M2
HSS. It is important to understand the fundamental process of parts formation in microscopic
level. Thereafter, defects such as porosity and cracks are discussed. Single melt pool
microstructure analysis will be performed and results of single melt pool hardness discussed.
4.3.2.1 OM images
Figure 61 First 8 layers in a 15-layer sample, vertical cross section

Chapter 4 Parameter Optimisation 37
Vertical cross section with reference to bottom substrate shown in Figure 61 illustrates
the first 8 layers in a 15-layer sample. During first layer fabrication, laser fused M2 powder
with substrate. First layer experienced carbon diffusion from high carbon content M2 onto low
carbon content substrate. Reduction in corrosion resistance resulted in over etching towards
bottom layers. Odd numbered layers indicate laser melting tracks parallel to the page while
even numbered layers indicate laser melting tracks into and out of the page. Generally, the melt
pools seemed neat and even. Figure 62 demonstrates path of laser and powder deposition on
the substrate. OM images of horizontal cross section were taken on lower left and upper right
corner as shown in Figure 64-65. Spacing between centre of two parallel scanning paths refer
to hatch spacing shown in Figure 63. Hatch spacing is out of scope in this experiment, however
it directly affects porosity contents, a hatch spacing of 1.6mm was found to be adequate for
parallel laser melting tracks to meet. Insufficient hatch spacing resulted in parallel melt paths
unable to overlap, generating porosity accumulation in-between. Excessive hatch spacing could
result in early overlapping between parallel paths, where long fibre-like protuberance may
impact the flatness of layers. Complete binding between parallel melt paths can be observed
along the edges and small porosities can be observed towards the centre in Figure 64-65. Further
Figure 62 Laser and powder deposition path
Figure 63 Hatch spacing [38]
Figure 64 Lower left corner of horizontal cross section (A)
Figure 65 Upper right corner of horizontal cross section (B)
Fine tuning adjustments towards hatch spacing can be performed for additional reduction of
entrapped porosities in between parallel melt paths perpendicular to height of sample. A vertical

Chapter 4 Parameter Optimisation 38
Figure 66 Microstructure of Vertical cross section
cross section was taken, shown in Figure 66. Insufficient melting due to entrapped gas results
in circular porosities shown near the bottom of Figure 66, which agrees with literature [69] in
a DLD experiment involving studies of porosity performed by Rasheedat M. Et al. Elongated
crack along the vertical axis were observed. Investigation on SLM M2 HSS by Z. H. Liu Et.al
Figure 67 OM image of single melt pool

Chapter 4 Parameter Optimisation 39
suggest high residue stress [47] during sample fabrication was suspected to cause solidification
cracking, extending along the vertical layers where direction of thermal gradient exists [69].
A close-up image for single melt pool is shown in Figure 67. Direction of laser scanning
path points into the page. Melt pool is divided into two sections, equiaxed zone above the melt
pool boundary while HAZ exist below the melt pool boundary. Heat from the laser scanning
path is transferred downwards, deeming indirect heated area as HAZ. Lower region of the melt
pool experiences higher cooling rates since heat is conducted quickly away through the bottom
substrate, thus solidification occurs from the bottom. Dendritic growth is orientated with
direction of thermal gradient [70] shown by black arrows in Figure 67, thus resulting in
formation of fine columnar dendrites with equiaxed dendrite growth [71]. High temperatures
with rapid cooling and solidification experienced during DLD tend to produce very fine
microstructure as shown in Figure 67, which agrees with various literatures [56, 59, 60, 61, 72].
Microhardness test is performed on Site A, B and C on two different melt pools, one of the
tested melt pool is shown in Figure 67.
Table 10 Microhardness test on melt pools
Left (Site B) Middle (Site A) Right (Site C)
Melt Pool 1 HV 982 805 900
Melt Pool 2 HV 966 671 914
Results from Table 10 shows a trend as such HAZ (Site B and C) yields higher hardness
compared to centre of melt pool (Site A). Source suggests that during sanding and polishing of
sample, softer parts of sample is removed relatively more compared to harder parts, producing
a slight height difference [64]. After etching, harder area on the sample sits higher and thus
reflecting more light into the OM compared to softer area on the sample that reflects lesser
light. This occurrence results in harder areas of the sample appearing brighter and softer areas
appearing darker. This is confirmed by observation of higher hardness values in Site B and C
of table 10 corresponding to bright areas under the OM while darker areas of Site A
corresponding to lower hardness values from table 10. First layer microstructure experiences
carbon and solute content dilution [64] towards the bottom substrate, thus resulting in
weakening mechanical properties.
When additional layers are added, thermal gradient and microstructure differs from that
of a single layer part discussed in this chapter. Therefore, utilising optimised parameters as
discussed in this chapter, more samples of M2 HSS are fabricated, thermal history with
additional layers will be discussed in Chapter 5.

Chapter 4 Parameter Optimisation 40
4.3.2.2 Secondary Electrons SEM images
SEM analysis is beyond the scope in current research. Figure 68-71 has been provided by Q.Y.
Tan as a gesture of goodwill towards microstructure analysis. Figure 68 shows results of a 1
layer sample, it appears similar to OM microstructure in Figure 67. Fine equiaxed dendrites
growth can be observed in area above HAZ in Figure 69. Further 2000X magnification is shown
in Figure 70, 8000X magnification of melt pool is shown in Figure 71. Varying hardness among
the sample generated intrusions during sanding and polishing process. The darker regions of
Figure 68 SEM micrograph of melt pool (1 layer, 250X)
Figure 69 SEM micrograph of melt pool (1 layer, centre,1000X)
Figure 70 SEM micrograph of melt pool (6 layers, centre, 2000X)

Chapter 4 Parameter Optimisation 41
intrusions indicate a lower elevation, brighter region at the bottom right corner has a higher
elevation. Faint martensitic plates can be seen branching within the dendrites. Suspected fibre-
like eutectic carbides can be observed. Literatures have shown that MC and M2C carbides are
most commonly formed on HSS [73, 74] during solidification or soft annealing due to high
vanadium, molybdenum and tungsten contents [75], despite occasional cases where M23C6,
M7C3 may also be formed due to varying compositions [73]. At eutectic, liquid cools to form
austenite + M2C [74]. With additional layers built, tempering due to repeated thermal cycle
transforms retained austenite to martensite branching within the dendrites, leaving visible
carbide network along cell boundaries. More tests such as low angle backscatter electron
(LABE) is required for compositional contrast observation, TEM with selected area electron
diffraction (SAED) for crystal structural analysis and EDS for alloying element percentage
identification. This allows a better understanding of phase transformations taking place during
DLD of M2 HSS since it does not follow conventional phase diagram [76].
Figure 71 SEM micrograph of melt pool (8 layers, centre, 8000X)

Chapter 5 Effects of Thermal History with Additional Layers 42
Chapter 5 Effects of Thermal History with Additional Layers
5.1 Overview
With sequent addition of layers during DLD process, new layers are deposited on top
of existing layers that effectively act as a heat sink [46]. AM parts generally experiences rapid
heating and cooling cycles that contribute to excellent mechanical properties [77]. This chapter
aims to study the microstructure effects of bottom layers with subsequent additional layers,
providing contribution to the fundamental understanding of DLD forming mechanism.
5.2 Results
5.2.1 Microstructure of Melt Pool located in centre of sample
OM images for centre layer melt pool taken and shown in Figure 72. Centre of melt
pool as shown in Figure 73, Right and left corners of melt pool shown in Figure 74 and 75
respectively. Microstructure shows similar features as previous findings in Chapter 4. Fine
columnar dendrites with equiaxed dendrite growth can be observed. Similar experiment [71]
suggests course columnar zone exists above the HAZ is remelted, however HAZ is not melted,
thus formation of uniform columnar dendrites in the centre and equiaxed grains along edges.
Figure 72 11th layer in a 30-layer part
Figure 73 11th layer, Centre magnified
Figure 74 11th layer, Right magnified
Figure 75 11th layer, Left magnified

Chapter 5 Effects of Thermal History with Additional Layers 43
5.2.2 Microstructure differences between 2nd layer in a 2, 3, 4, 8 and 30-layer sample
Figure 76 to 80 shows the 2nd layer microstructure in a 2, 3, 4, 8 and 30-layer sample.
All samples display similar features showing visible melt pools with distinctive boundaries.
Figure 76 2nd layer in a 2-layer sample
Figure 77 2nd layer in a 3-layer sample

Chapter 5 Effects of Thermal History with Additional Layers 44
Figure 78 2nd layer in a 4-layer sample
Figure 79 2nd layer in an 8-layer sample

Chapter 5 Effects of Thermal History with Additional Layers 45
Figure 80 2nd layer in a 30-layer sample
It was observed that microstructures for all first layer appearing dark and containing needle like
structures. Centre area of melt pool for 2nd layer in a 2-layer sample appears to have coarse
equiaxed dendrites. As sample layers increase, finer equiaxed dendrites were observed in the
centre of melt pool. All samples suggested similar direction of solidification from outer HAZ
towards melt pol boundary with elongated grains oriented in direction with thermal gradient.
5.2.3 Microstructure differences between top and centre layer in an 8-layer sample
Left edge and centre melt pool OM images of microstructure on layer 2 and layer 4 in
an 8-layer part shown in Figure 81, 82, 83 and 84 respectively. Left edge and centre melt pool
OM images of microstructure on top later in an 8-layer part shown in Figure 85 and 86
respectively. General microstructure features seemed similar, with directional growth of fine
columnar dendrites along the edges of melt pool where HAZ sits shown in Figure 81, 83 and
85. Equiaxed dendrites observed in the fine grain zone towards centre of melt pool shown in
Figure 82, 84 and 86. Grain size in the 4rd layer seem to be marginally coarser as compared to

Chapter 5 Effects of Thermal History with Additional Layers 46
grain size on 8th and 2nd layer. Grain size along centre of melt pool also shows the same trend
of being marginally coarser at the bottom layer around HAZ as compared to the top and centre.
Figure 81 2nd layer in an 8-layer part (lower edge of melt
pool)
Figure 82 2nd layer in an 8-layer part (centre of melt pool)
Figure 83 4th layer in an 8-layer part (Left edge of melt pool)
Figure 84 4th layer in an 8-layer part (centre of melt pool)
Figure 85 8th layer in an 8-layer part (Left edge of melt
pool)
Figure 86 8th layer in an 8-layer part (Centre of melt pool)
5.2.4 Effects of ascending layers on sample hardness
Microhardness test was performed on samples with 2,4,8,15 and 30 layers. First layer
hardness values were ignored due to possibilities of carbon and solute dilution [30] that impacts
mechanical properties. Three values of microhardness had been recorded for each layer. Figure

Chapter 5 Effects of Thermal History with Additional Layers 47
87 shows the results. There were no significant impacts on samples’ average hardness with
increasing layers. Average hardness of AM samples seems to be consistent at 908 HV.
Figure 87 Average hardness of 2,4,8,15 and 30 layer samples
5.2.5 Effects of ascending layers on 2nd layer hardness
Second layer hardness values were taken on samples with 2,4,8,15 and 30 layer shown
in Figure 88. Average hardness of second layer seemed to futurate between 860 HV to 930 HV
throughout the samples with exception to a spike in hardness value in the 4-layer sample.
Figure 88 2nd layer hardness with ascending layers
This discrepancy is suspected to be caused by indentation test performed on carbides of the
sample, which has higher hardness values. General trend shows an increase in hardness for 2nd

Chapter 5 Effects of Thermal History with Additional Layers 48
later, following by decreasing of hardness, however all values are within range of 860 HV to
930 HV. This trend does not have a convincing evidence to suggest relationship between 2nd
later hardness with ascending layers.
5.2.6 Effects of ascending layers on individual layer hardness
Effects of hardness with ascending layers was performed by taking microhardness of all
layers for a 2,4,8,15 and 30-layer sample, with first layer hardness ignored. Results were shown
in Figure 89. Fluctuations were observed throughout the samples between 840HV to 953HV
with an exception of second layer hardness in the 4-layer sample being 1000HV. As discussed
in Chapter 5.2.5, such value may be imposed by indentation test being performed on carbides.
Fluctuations of hardness along different layers is expected in DLD applications due to
inhomogeneity caused by unique and unpredictable thermal cycles being difficult to control and
monitor. Parts appear to have hardness values reasonably in rage, no strong relationship
between additional layers’ effects on individual layer hardness can be concluded.
Figure 89 Individual hardness on each layer with ascending layers

Chapter 5 Effects of Thermal History with Additional Layers 49
5.3 Discussions
Optimised parameters were used to fabricate a 30-layer sample as shown in Figure 72.
Microstructure seem similar to that of a single melt pool shown in Figure 67. HAZ displays
columnar dendrites with evidence stating solidification begins from bottom, branching towards
centre of melt pool. During fabrication of the 11th layer, heat is lost through the previous layers,
which acts as a heat sink, located at the bottom of the current melt pool. This occurrence results
in a high thermal gradient, favouring fine microstructures at the bottom edge of melt pool.
Solidification subsequently occurs following by nucleation of dendrites in an upwards
direction, equiaxed dendrites form during solidification of centre melt pool. Upon advancement
of the 12th layer, heat is transferred from the new melt pool down to previous melt pool. This
thermal cycle acts as tempering however with a lower cooling rate due to elevated temperature
on previous layer. As a result, course dendrites are formed in the HAZ. This phenomenon agrees
with experiment on DLD on 316L steel conducted by Peng.G et al. [78].
Same processing parameters were used to print samples with 2, 3, 4, 8 and 30 layers.
All samples have dark spots with sharp needle like structures. Source suggest bottom layer
experiences carbon diffusion and solute content dilution, reducing corrosion resistance that
caused over etching of bottom layers to occur [64]. 2nd layer microstructure is observed to
show an increasing trend in fineness as more layers are built in the range of 2 to 4-layer sample,
however beyond 4 layers, no noticeable changes to the microstructure is observed. From Figure
76, after advancement of 2nd layer melt pool, HAZ area experiences higher cooling rates in
comparison with the area above HAZ due to heat loss through the substrate. Hence directional
growth of dendrites initiate from the lower edges towards the centre of melt pool. Meanwhile,
top to centre of melt pool experiences slower cooling rates, resulting in coarser dendrites
formation observed in Figure 76.
With additional advancement of 3rd layer, 2nd layer top and middle melt pool region is
partially reheated however with heat quickly dissipated to the 1st layer melt pool along with the
substrate. This high cooling rate results in a slightly finer microstructure shown in Figure 77.
Advancement above 5th layer has no noticeable effect on the 2nd layer microstructure due to
majority of heat has been dissipated above the 2nd layer as new layers are built, thermal energy
that is conducted onto the 2nd layer is insufficiently high to result in any effects. Consequently,
microstructure fineness for 2nd layer with 4 layers and above does not undergo observable
changes as shown in Figure 78-80. More test can be performed to confirm these findings.
Microstructure on the centre layer from Figure 83-84 seem to have coarser dendrites
than bottom and top layer from Figure 81-82 and 85-86. During fabrication of sample, upper

Chapter 5 Effects of Thermal History with Additional Layers 50
and lower regions experience higher cooling rate compared to middle layer region. 2nd layer
dissipates most heat through the substrate, while advancement of upper layers conducts heat
towards top layer, consequentially conducts and radiates the heat into exposing atmosphere,
thus higher cooling rates on top and bottom layers. Centre layers however experiences a
substantial HAZ longer due to longer exposure of thermal cycle, resulting in slower cooling
rates. Higher cooling rates on top and bottom layer is suspected to result in finer dendrites
shown in Figure 81,82,85 and 86 while slower cooling rates in the centre layer is suspected to
cause coarser dendrites shown in Figure 83 and 84. These results agree with literature [8, 79,
80].
From all results of OM images, clear boundaries of melt pools can be seen clearly. This
is due to fast cooling rates, as new melt pools are generated along the horizontal direction,
previously released melt pools quickly solidify, thus revealing distinctive individual
microstructure of melt pools. When initial layers of melt pool are solidified, eutectic liquid
cools to form austenite and carbide. Further advancement of layers induces additional thermal
cycle, subsequent cooling enhances retained austenite transformation to martensite, leaving
mixture of martensite with carbide particles, retaining morphology of a dendritic structure.
Average microhardness results for a 2,4,8,15 and 30-layer sample is shown in Figure
87. All samples seem to have hardness values of around 908HV with an error range between
2.7% to 14.6% based on largest and smallest error range between three distinct locations along
each layer. Average hardness of 908HV seems to agree with literature that AM produced M2
HSS yield higher hardness values than conventionally produced M2 [50]. No trend between
number of layers and their respective hardness are observed. Second layer microhardness
results in a 2,4,8,15 and 30-layer sample is shown in Figure 88. A trend of slight increase of
hardness for 2nd later, following by decreasing of hardness, however all values are within range
of 860 HV to 930 HV. Hence no clear evidence suggesting any relationship between 2nd layer
hardness with ascending layers. Figure 89 shows results for each individual layer’s hardness in
a 2,4,8,15 and 30 -layer sample. Again, all hardness values are in range between 840HV to
953HV with an exception of 2nd layer in a 4-layer sample with value of 1000HV. Inhomogeneity
caused by unique and unpredictable thermal cycles in AM results in difficulty controlling and
monitoring fabrication process. Samples appear to acquire hardness values reasonably in range,
thus for hardness tests, no strong relationship between additional layers’ effects on individual
layer hardness can be concluded.

Chapter 6 Effects of Stress Relieving Heat Treatment 51
Chapter 6 Effects of Stress Relieving Heat Treatment
6.1 Overview
In metallurgy, a trade off in mechanical properties always exists between strength and
ductility. Tempering is one of several types of heat treatment that involve precise control of
time and temperature critical for desired well balanced mechanical properties. This experiment
involves a stress relieving heat treatment where samples are heated to 200oC and held for 30
minutes. Samples are then mounted for hardness and microstructure analysis. SEM was done
by Q.Y.Tan along with micrographs provided to enhance research.
6.2 Results
6.2.1 Microhardness Comparison with Non Heat Treated Samples
Figure 90 shows the results for average hardness of heat treated samples alongside with
non heat treated samples for 2,4,8,15 and 30 layers. 1st layer hardness values were ignored for
all samples due to carbon and solute dilution which altered hardness values.
Figure 90 Average hardness of samples with ascending layers
For non heat treated samples, there is a weak decreasing trend of average hardness with
ascending layers observed. Total average hardness value of samples found to be 908 HV,
difference between 2-layer and 4-layer hardness seems to be highest at 43 HV with all other
samples within this error range. Thus a 4.76% error does not conclude a strong relationship
between average hardness of non heat treated samples with ascending layers. Heat treated
samples experiences a weak increasing trend of average hardness with ascending layers. Total

Chapter 6 Effects of Stress Relieving Heat Treatment 52
average hardness is found to be 880 HV, lower than average hardness for non heat treated
samples. All values are in range of 33 HV or 3.72% error.
6.2.2 Microstructure Comparison with Non Heat Treated Samples
OM images for 2nd layer of the 2-layer sample with and without heat treatment shown
in Figure 91 and 92 respectively, 2nd layer microstructure of the 8-layer sample with and without
heat treatment shown Figure 93 and 94 respectively. Melt pool size seems identical with or
without heat treatment, microstructure features are similar. No significant differences observed.
Figure 91 2nd layer in 2-layer without heat treatment
Figure 92 2nd layer in 2-layer with heat treatment
Figure 93 2nd layer in 8-layer without heat treatment
Figure 94 2nd layer in 8-layer with heat treatment
6.2.3 Secondary Electron SEM Comparison with Non Heat Treated Samples
SEM micrograph of bottom layer with and without heat treatment shown in Figure 95
and 96 respectively. Both samples portrait visible intrusions where the darker and brighter
regions exist. Suspected MC and M2C carbides are present in both samples, visible martensite
plates can be observed branching through dendrites of both samples, however both being more
prominent in heat treated sample.

Chapter 6 Effects of Stress Relieving Heat Treatment 53
Figure 95 SEM micrograph (8 layers, bottom, 8000X)
Figure 96 SEM micrograph (8 layers, bottom, 8000X)
6.3 Discussion
During AM fabrication process, initial layer experiences residue stress due to high
cooling and solidification on the surface experienced. With the advancement of subsequent
layers, as new melt pools are stacked, local heat treatment such as tempering was deployed
towards previous layers. Top most layers of a completed sample experienced most residue stress
due to the high cooling rate. Partial heat lost occurs through conduction of heat towards bottom
layers, heat is also lost concurrently through convection and radiation through atmosphere
above top most layer. Therefore, stress relieving heat treatment is necessary towards
strengthening mechanical properties of AM parts.
From figure 90 it was observed that all samples from 2 to 30 layer falls in range within
4.76% for non heat treated and 3.72% for heat treated samples. Parts are considered to preserve
constant hardness values independent of number of layers. It is noted that all heat treated
samples achieved lower hardness compared to non heat treated samples. OM images shows
insignificant changes to the microstructure caused by heat treatment, both samples contain
similar microstructure and constant melt pool size. All samples experience carbon and solute
dilution towards the 1st layer. SEM micrographs show similar microstructure between heat
treated and non heat treated samples. Heat treated sample is suspected to demonstrations more
visible carbides within the dendrites as a result of further martensite transformation occurred
from retained austenite through this tempering heat treatment. Etching inconsistency is also
considered to cause possible discrepancies between two micrographs. EDS and TEM could be
performed to acquire the chemical composition and detailed microstructure to confirm such
finding.

Chapter 6 Effects of Stress Relieving Heat Treatment 54
Other mechanical properties such as tensile strength and ductility can be performed to
correlate relationship between the trade-offs in mechanical properties experienced by this stress
relieving heat treatment process. Further tests such as LABE is required for compositional
contrast observation, TEM with SAED for crystal structural analysis and EDS for alloying
element percentage identification allows a better understanding of phase transformations and
their effects on microstructure and mechanical properties.

Chapter 7 Conclusion 55
Chapter 7 Conclusion
7.1 Overview
The aim of the project is to enhance understanding towards development of new alloy
other than current limits on wrought compositions, allowing widening of industry applications
towards AM that is capable of producing low-volume, high complexed components efficiently.
There are several goals of the project that form stepping stones towards achieving this aim.
Primary goal for this research involves studies of thermal history effects towards microstructure
and hardness in DLD AM process on LENS430. Prior to achieving this goal, optimisation of
parameters is crucial for production of high density parts. Optimised parameters are then
applied to fabricate samples used for thermal history effect studies towards bottom layer with
additional advancement of layers. Next, samples are tempered by stress relieving heat treatment
and analysed any microstructure and hardness differences from non heat treated parts.
7.2 AM parameter Optimisation
Fixing laser power and powder feed rate, porosity contents of parts decrease as nozzle
velocity increases. With a fixed laser power intensity of 300W, the corresponding speed of
scanning nozzle velocity for complete melting is found to be 25ipm or 10.58mm/s producing a
local optimum density of 99.05%. Parts higher than 25ipm shows a decrease in density. With
constant laser power and nozzle scanning velocity, local optimum density of 98.90% is recorded
when powder feed rate is 5rpm or 9.30g/min. Higher powder feed rates resulted in insufficient
melting thus increasing porosity contents. Two identified parameters were fixed, local optimum
density of 99.05% was achieved with laser power of 300W. Parameter optimisation stage was
completed, laser power of 300W, nozzle scanning velocity of 25ipm or 10.58mm/s and powder
feed rate of 5rpm or 9.30g/min was obtained. These parameters provide a reference for future
grain refinery works to be performed on M2 HSS.
Hardness test was performed for samples fabricated using optimised parameters. Total
average hardness is found to be 906.50 HV which is higher than conventional produced M2
steel’s hardness that varies from 750HV to 830HV. Such hardness values ensure integrity of
AM parts with good or even better mechanical properties compared to conventional
manufactured counterparts.
OM images revealed certain defects such as cracks and porosities present in samples.
Those defects were mainly caused by solidification cracking and insufficient melting causing

Chapter 7 Conclusion 56
entrapped gas bubbles. For a case of single melt pool analysis, middle area of a melt pool had
slightly lower hardness compared to edges along the HAZ. Heat from the laser scanning path
is conducted away from HAZ zone thus outer region of melt pool experiences higher cooling
rates. Solidification occurs from outer HAZ, resulting in columnar dendrites formation in HAZ
with equiaxed zone above the melt pool boundary. Marginally higher hardness in HAZ is
suspected to be caused by high cooling rates encountered.
SEM micrographs revealed suspected carbides and martensitic plates within dendritic
structures for bottom layer microstructure. Eutectic liquid M2 cools to form carbide and
austenite where further tempering caused by layer advancement enhances austenite to
martensite transformation. These micrographs provide a better understanding towards phase
transformation during AM process.
7.3 Effects of Thermal History on Bottom Layer with Additional Layers
All samples encounter carbon and solute dilution in the utmost bottom later. A trend of
increasing 2nd layer microstructure fineness from 2 to 4-layer sample was observed. Beyond 4-
layer sample, microstructure for 2nd layer seemed constant throughout. Microstructure in the
bottom and top layer appeared prominently finer compared to microstructure in the centre layer.
These results agree with literature [8, 79, 80], and provides accumulative information towards
this new area of thermal history studies within AM parts. No relationship between average
hardness of samples , 2nd layer hardness and individual layer hardness were concluded with
ascending layers. All samples acquire hardness well within range. Fluctuations can be observed
throughout the samples due to inhomogeneity caused by unique and unpredictable thermal
cycles being difficult to control and monitor.
7.4 Effects of stress relieving heat treatment
Two samples were tempered for 200oC and held for 30 minutes. Heat treated and non
heat treated samples had a relatively small error range of 3.72% and 4.76% respectively. Heat
treated samples showed consistency in having lower hardness compared to non heat treated
samples, however no relationship between average hardness and ascending layers were
observed. No significant changes to microstructure towards bottom layer were observed
between non heat and heat treated samples from OM and SEM micrographs.

Chapter 7 Conclusion 57
7.5 Recommendations
Parameter optimisation process can be boosted by fabricating more samples with a
smaller step size, For example laser power between 250W to 350W with a step size of 10W.
Results from that should suggest additional accuracy for optimisation, with improvement in
densities expected. Various difficulties such as uncontrollable out of focus events experienced
by laser, inconsistent continuous power feed rates, and frequent unexpected downtimes were
faced during part fabrication, hindering progress. Utmost effort had been undertaken to work
within these limitations. Other processing parameters such as hatch distance, resolution and
contours settings can be experimented for potential in achieving a higher density part. Close
looped AM equipment can be used to monitor live sample information such as surface
temperature and quality for real time processing parameter adjustments to achieve higher
quality fabrications.
Effects of thermal history on bottom layers with additional layers belongs to a new
research area where little work has been performed towards this area. Complexed thermal
cycles exists in AM process, much work is required to be performed to improve understanding
on microstructure changes experienced during fabrication. Current conclusions were drawn
based on OM observations and provided SEM micrographs, advance tests are required for
results validation.
Future prolonged heat treatment at elevated temperatures can be performed to enhance
mechanical properties for M2 HSS. Subzero treatment could also be performed to promote
austenite to martensite transformation. Tensile strength and ductility can be performed to
correlate relationship between the trade-offs in mechanical properties. LABE, TEM with SAED
and EDS would allow better understanding of phase transformations and their effects on
microstructure and mechanical properties.
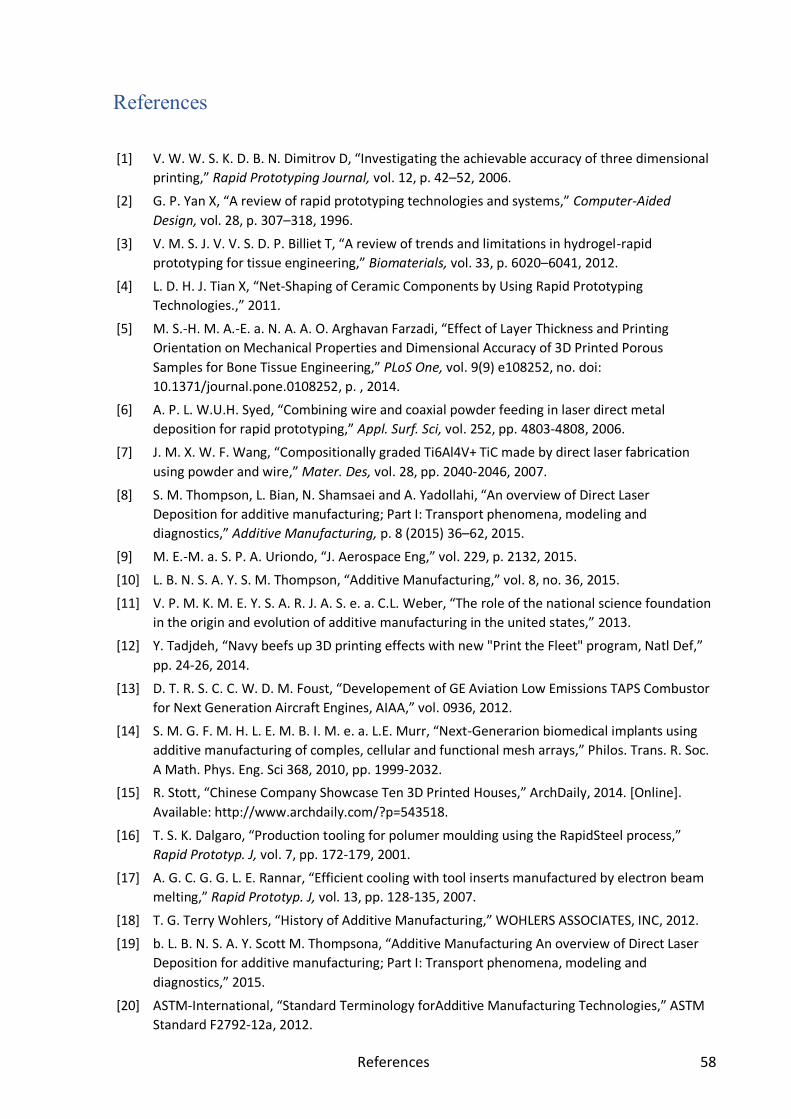
References 58
References
[1] V. W. W. S. K. D. B. N. Dimitrov D, “Investigating the achievable accuracy of three dimensional
printing,” Rapid Prototyping Journal, vol. 12, p. 42–52, 2006.
[2] G. P. Yan X, “A review of rapid prototyping technologies and systems,” Computer-Aided
Design, vol. 28, p. 307–318, 1996.
[3] V. M. S. J. V. V. S. D. P. Billiet T, “A review of trends and limitations in hydrogel-rapid
prototyping for tissue engineering,” Biomaterials, vol. 33, p. 6020–6041, 2012.
[4] L. D. H. J. Tian X, “Net-Shaping of Ceramic Components by Using Rapid Prototyping
Technologies.,” 2011.
[5] M. S.-H. M. A.-E. a. N. A. A. O. Arghavan Farzadi, “Effect of Layer Thickness and Printing
Orientation on Mechanical Properties and Dimensional Accuracy of 3D Printed Porous
Samples for Bone Tissue Engineering,” PLoS One, vol. 9(9) e108252, no. doi:
10.1371/journal.pone.0108252, p. , 2014.
[6] A. P. L. W.U.H. Syed, “Combining wire and coaxial powder feeding in laser direct metal
deposition for rapid prototyping,” Appl. Surf. Sci, vol. 252, pp. 4803-4808, 2006.
[7] J. M. X. W. F. Wang, “Compositionally graded Ti6Al4V+ TiC made by direct laser fabrication
using powder and wire,” Mater. Des, vol. 28, pp. 2040-2046, 2007.
[8] S. M. Thompson, L. Bian, N. Shamsaei and A. Yadollahi, “An overview of Direct Laser
Deposition for additive manufacturing; Part I: Transport phenomena, modeling and
diagnostics,” Additive Manufacturing, p. 8 (2015) 36–62, 2015.
[9] M. E.-M. a. S. P. A. Uriondo, “J. Aerospace Eng,” vol. 229, p. 2132, 2015.
[10] L. B. N. S. A. Y. S. M. Thompson, “Additive Manufacturing,” vol. 8, no. 36, 2015.
[11] V. P. M. K. M. E. Y. S. A. R. J. A. S. e. a. C.L. Weber, “The role of the national science foundation
in the origin and evolution of additive manufacturing in the united states,” 2013.
[12] Y. Tadjdeh, “Navy beefs up 3D printing effects with new "Print the Fleet" program, Natl Def,”
pp. 24-26, 2014.
[13] D. T. R. S. C. C. W. D. M. Foust, “Developement of GE Aviation Low Emissions TAPS Combustor
for Next Generation Aircraft Engines, AIAA,” vol. 0936, 2012.
[14] S. M. G. F. M. H. L. E. M. B. I. M. e. a. L.E. Murr, “Next-Generarion biomedical implants using
additive manufacturing of comples, cellular and functional mesh arrays,” Philos. Trans. R. Soc.
A Math. Phys. Eng. Sci 368, 2010, pp. 1999-2032.
[15] R. Stott, “Chinese Company Showcase Ten 3D Printed Houses,” ArchDaily, 2014. [Online].
Available: http://www.archdaily.com/?p=543518.
[16] T. S. K. Dalgaro, “Production tooling for polumer moulding using the RapidSteel process,”
Rapid Prototyp. J, vol. 7, pp. 172-179, 2001.
[17] A. G. C. G. G. L. E. Rannar, “Efficient cooling with tool inserts manufactured by electron beam
melting,” Rapid Prototyp. J, vol. 13, pp. 128-135, 2007.
[18] T. G. Terry Wohlers, “History of Additive Manufacturing,” WOHLERS ASSOCIATES, INC, 2012.
[19] b. L. B. N. S. A. Y. Scott M. Thompsona, “Additive Manufacturing An overview of Direct Laser
Deposition for additive manufacturing; Part I: Transport phenomena, modeling and
diagnostics,” 2015.
[20] ASTM-International, “Standard Terminology forAdditive Manufacturing Technologies,” ASTM
Standard F2792-12a, 2012.

References 59
[21] A. staff, “Composites Manufacturing,” ACMA, 15 10 2014. [Online]. Available:
http://compositesmanufacturingmagazine.com/2014/10/pros-cons-additive-manufacturing/.
[Accessed 22 05 2017].
[22] Green Garage Blog, “The Eco Friendly Blog,” Green Garage, [Online]. Available:
https://greengarageblog.org/13-pros-and-cons-of-3d-printing.
[23] SPI lasers, “Additive Manufacturing Materials,” SPI, 2015. [Online]. Available:
http://www.spilasers.com/application-additive-manufacturing/additive-manufacturing-
materials/. [Accessed 22 08 2017].
[24] R. Wile, “This Technology Could Have The Biggest Impact On American Jobs Since Offshoring,”
05 09 2014. [Online]. Available: https://www.businessinsider.com.au/how-3d-printing-will-
affect-manufacturing-jobs-2014-8?r=US&IR=T. [Accessed 2017 05 20].
[25] A. International, “Standard Terminology for Additive Manufacturing,” in General Principles –
Terminology, 2013.
[26] 3D HUBS, [Online]. Available: https://s3-eu-west-1.amazonaws.com/3dhubs-
knowledgebase/classification-am-processes/visual1.png.
[27] J. Hiemenz, “Additive Manufacturing Trends in Aerospace:,” 2013. [Online]. Available:
http://web.stratasys.com/rs/objet/images/SSYS-WP-AeroTrends-03-13-FINAL.pdf. [Accessed
20 05 2017].
[28] Erlangen, “Siemens achieves breakthrough with 3D printed gas turbine blades,” 06 02 2017.
[Online]. Available:
https://www.siemens.com/press/en/pressrelease/?press=/en/pressrelease/2017/power-
gas/pr2017020154pgen.htm&content[]=PG. [Accessed 2017 05 20].
[29] C. Sethi, “3D Printing Blooms,” 2014. [Online]. Available: https://www.asme.org/engineering-
topics/articles/bioengineering/3d-printing-blooms-in-biomedical. [Accessed 20 05 2017].
[30] ABC news, “3D printing breakthrough produces functioning human-scale bone and muscle
tissue,” 18 02 2016. [Online]. Available: http://www.abc.net.au/news/2016-02-18/3d-
printing-breakthrough-enables-human-sized-functioning-tissues/7178800. [Accessed 20 05
2017].
[31] R. Eaton, “Additive Manufacturing Revolutionizes Architectural and Construction Fields,” 12
06 2014. [Online]. Available: http://www.rapidmade.com/rapidmade-
blog/2014/6/12/additive-manufacturing-revolutionizes-architectural-and-construction-fields.
[Accessed 20 05 2017].
[32] B. Jackson, “3D printing buildings, a summary of additive manufacturing in construction,” 25
10 2016. [Online]. Available: https://3dprintingindustry.com/news/3d-printing-buildings-
summary-additive-manufacturing-construction-97312/. [Accessed 20 05 2017].
[33] A.P.Gulyaev, “Properties and Heat Treatment of High Speed Steels [russian],” Mashgiz,
Moscow, 1939.
[34] N. A. Minkevich, Low Alloy High Speed Steels [Russian], Metallurgiya, Moscow, 1944.
[35] A. M. Bayer, B. A. Becherer and T. Vasco, “High.Speed Tool Steels,” ASM Handbook, pp. Vol
16, p 51-59, 1989.
[36] S. Kalpakjian, in Manufacturing Processes for Engineering Materials, Addison Wesley, 1984, p.
524.
[37] V. A. K. S. R. Narayanasamy, in Mater. Sci. Eng. A, 2008, pp. 494,337.
[38] M.Maalekian, “The Effects of Alloying Elements on Steels,” Christian Doppler Laboratory for
Early Stages of Precipitation, 2007.

References 60
[39] R. W. K. J. I. G. R. H. Barkalow, “Solidification of M2 High Speed Steel,” Metallurgical
Transactions , vol. 3, no. 919, 1972.
[40] R. L. K. a. M. A. Sokolov, “EFFECT OF CHROMIUM, TUNGSTEN, TANTALUM, AND BORON ON
MECHANICAL PROPERTIES OF 5-9Cr-WVTaB STEELS,” Oak Ridge National Laboratory, p. 80.
[41] B. L. H. Rutz, “EFFECT OF MOLYBDENUM CONTENT IN PM STEELS,” Hoeganaes Corporation
Cinnaminson,, NJ 08077, USA .
[42] Z. D. Chen, “Technical Report of Developement of Rapid Forming of Hard Tool/Production of
Tool Using PIM,” Gintic Institude of Manufacturing Technology, 2001.
[43] T. Lyman, “Properties and Selection of Metal 8th Edition Vol 1,” in Metals Handbook, 1976,
pp. 234-239, 768-773.
[44] Q. Hu, J.Y.H.Fuh, Y.S.Wong, L. Lu1, C. M.Choy and Z.D.Chen, “Powder Metallurgy of M2 High-
speed Steel for Rapid Tooling Applications,” 2002.
[45] N. H. L. K. A. K. S. B. T. Z. Y. Liu, “Sintering of Injection Moulded M2 High Speed Steel,”
Materials Letters, vol. 45, no. 32, 2000.
[46] K. H. Prabhudev, “Hand Book of Heat Treatment of Steels,” New Delhi, Tata McGraw-Hill
Publishing company limited, 1988, pp. 642-648.
[47] C. K. C. K. F. L. K. K. L. T. E. Y. J. V.-H. J. P. K. Z. H. Liu, “A preliminary investigation on Selective
Laser Melting of M2 high speed steel,” in Research in Virtual and Rapid Prototyping, Leiria,
Portugal, 2011.
[48] J. Bundy, “Understanding Weld Cracking,” Welding Journal, vol. vol. 88, no. 9, pp. , pp. 30-32.,
September 2009.
[49] G. e. a. Totten, “Handbook of Residual Stress and Deformation of Steel Materials,” Park, Ohio,
ASM international, 2002.
[50] J. R. Davis, Tool Materials, ASM International, 1995.
[51] J. W. N. F. L. Tarak Amine, “An investigation of the effects of direct metal deposition
parameters on the characteristics of the deposited layers,” Case studies in Thermal
Engineering, vol. 3, pp. 21-34, 2014.
[52] J. M. X. He, “Transport Phenomena during direct metal deposition,” J. Appl. Phys, vol. 101,
2007.
[53] J. N. D. R. R. Unocic, in Prpcess efficiency measurements in the laser engineering net shaping
process, Metall. Mater. Trans B 35, 2004, pp. 143-152.
[54] Y. C. S. S. Wen, “Modelling of transport phenomena during coaxial laser direct deposition
process,” J. Appl. Phys, vol. 108, 2010.
[55] D. M. A. J. A. R. J. E. S. L. H. e. a. M. L. Griffth, “Free form fabrication of merallic components
using laser engineered net shaping (LENS),” in Proc 7th Solid Free. Fabr. Symp, Austin, USA,
1996, pp. 125-132.
[56] M. K. W. U. H. S. a. L. L. A. J. Pinkerton, “Thermal and microstructural aspects of the laser
direct metal deposition,” 2006.
[57] P. G. S. K. M. P. B. J. N. a. A. K. N. C. P. Paul, “Investigating laser rapid manufacturing for
Inconel-625 components,” Optics Laser Technol., vol. 39, no. 800, 2007.
[58] Y. S. D. Gu, “Processing conditions and microstructural features of porous 316L stainless steel
components by DMLS,” Applied Surface Science, vol. 255, pp. 1880-1887, 2008.
[59] W. L. a. X. S. K. Zhang, “Research on the processing experiments of laser metal deposition
shaping,” Optics Laser Technol, vol. 39, pp. 549-557, 2007.

References 61
[60] S. H. F. C. J. D. W. a. W. K. M. Gaumann, “Epitaxial laser melt forming: analysis of
microstructure formation,” Mater. Sci. Eng. A, vol. 271, pp. 232-241, 1999.
[61] A. K. D. a. J. M. G. P. Dinda, “Laser aided direct metal deposition of Inconel 625 superalloy:
microstructural evolution and thermal stability,” Mater. Sci. Eng. A, vol. 509, pp. 98-104, 2009.
[62] Hudson , “M2 High Speed Steel,” Hudson Tool Steel Corporation, 2017. [Online]. Available:
http://www.hudsontoolsteel.com/technical-data/steelM2. [Accessed 20 05 2017].
[63] M. I. G. &. J. H. S. N. AQIDA, “EFFECTS OF POROSITY ON MECHANICAL PROPERTIES OF METAL
MATRIX COMPOSITE: AN OVERVIEW,” Jurnal Teknologi, vol. 40 A, pp. 17-32, 2004.
[64] M. X. Zhang, Interviewee, Thesis meeting. [Interview]. 29 05 2017.
[65] HTA, “Stress Relieving,” HTA, 2017. [Online]. Available: http://www.heat.com.au/treatments-
stress-relieving.php. [Accessed 20 05 2017].
[66] L. Gas, “Sub-zero Treatment of Steels,” [Online]. Available:
http://www.pangas.ch/internet.lg.lg.che/de/images/Subzero_Treatment_of_Steels_en553_1
16014.pdf. [Accessed 20 05 2017].
[67] M. D. T. Zietala, M. Polanski, I. Kunce, T. Plocinski, W. Zielenski, M. Lazinska and W.
Stepniowski, “The microstructure, mechanical properties and corrosion resistanceof 316L
stainless steel fabricated using laser engineered net shaping,” Mater. Sci. Eng. A, vol. 677, pp.
1-10, 2016.
[68] I. Tolosa, F. Garciandía, F. Zubiri, F. Zapirain and A. Esnaola, “Study of mechanical properties
of AISI 316 stainless steel processed by “selective laser melting”,” Int. J.Adv. Manuf. Technol.,
vol. 51, pp. 639-647, 2010.
[69] M. Z. T. B. T. K. Pavel Hanzl, “The Influence of Processing Parameters on the Mechanical
Properties of SLM Parts,” in Department of Machining Technolog, University of West Bohemia
in Pilsen, Univerzitní 22, 306 14 Pilsen, Czech Republic.
[70] E. T. A. M. S. S. P. Rasheedat M. Mahamood, “Characterizing the Effect of Processing
Parameters on the Porosity of Laser Deposited Titanium Alloy Powder,” in Proceedings of the
International MultiConference of Engineers and Computer Scientists, Hong Kong, 2014.
[71] D. D. X. W. G. M. D. W. &. G. Z. J. Li, “Microstructure and Performance Optimisation of
Stainless St eel formed by Laser Additive Manufacturing,” Materials Science and Technology,
vol. 32, no. 12, pp. 1223-1230, 2015.
[72] L. T. B. V. S. B. J. V. H. a. J.-P. K. K. Kempen, “PRODUCING CRACK-FREE, HIGH DENSITY M2 HSS
PARTS BY SELECTIVE LASER MELTING,” in University of Leuven (KU Leuven) Department of
Mechanical Engineering, , Arenberg 44, 3001 Leuven, Belgium.
[73] R. A. Versaci, “Stability of Carbides in M2 High Speed Steel,” Journal of Materials Science
Letters, vol. 7, pp. 273-275, 1988.
[74] F. F. J. J. Zhou Xuefeng, “Solidification microstructure of M2 high speed steel by different
casting technologies,” Jiangsu Key Laboratory of Advanced Matellic Materials, Southeast
University, Nanjing, China , 2011.
[75] S.K, “SEM and TEM microstructural investigation of high speed tool steel after laser melting,”
Materials Chemistry and Physics, vol. 81, no. 2-3, pp. 510-512, 2003.
[76] D. Q. Z. C. C. K. L. Z.H. Liu, “Crystal structure analysis of M2 High Speed Steel parts produced
by Selective Laser Melting,” Science Direct, pp. 72-80, 2013.
[77] O. MA, Elements of Rapid Solidification, Fundamentals and applications, New York: Springer,
1998.

References 62
[78] B. Z. C. H. H. G. Peng Guo, “Study on Microstructure, Mechanical properties and machinability
of efficiently additive manufactured AISA 316L Stainless Steel by high power direct laser
deposition,” Journal of Materials Processing Technology, vol. 240, pp. 12-22, 2017.
[79] C. Selcuk, “Laser Metal Deposition for powder metallurgy parts,” Powder Metallurgy, vol. 54,
no. 2, pp. 94-99, 2013.
[80] N. S. A. Y. L. B. Scott M. Thompson, “An overview of Direct Laser Deposition for Additive
Manufacturing: Part 2: Mechanical behavior, process parameter optimisation and control,”
Additive Manufacturing, vol. 8, pp. 12-35, 2015.
[81] Hoganas, “Thermal surfacing powder choice with ease,” 08 2014. [Online]. Available:
https://www.hoganas.com/globalassets/media/sharepoint-
documents/BrochuresanddatasheetsAllDocuments/Powder_choice_with_ease.pdf. [Accessed
20 05 2017].
[82] M. S. L. H. M. O. M. B. M. e. a. M.L. Griffith, “Thermal behavior in the LENS process,” Proc. 9th
Solid Free, pp. 89-96, 1998.

APPENDIX A 63
Appendices
Appendix A: Chemical composition of M2 HSS Powder specification from Hoganas
Figure 97 M2 steel chemical composition from Hoganas [81]

APPENDIX B 64
Appendix B: Density calculation using Archimedes Principle
Archimedes principle of buoyancy states that a submerged liquid is buoyed up by a force equal
to the weight of displaced liquid. This force depends on volume of object and density of liquid.
Buoyant force is given by
𝐹𝑏 = ρ𝑙𝑖𝑞𝑢𝑖𝑑 ∗ 𝑔 ∗ 𝑉𝑠𝑜𝑙𝑖𝑑
𝐹𝑏: Buoyant force
ρ𝑙𝑖𝑞𝑢𝑖𝑑 : Density of fluid = 1.692 g/cm3
g: 9.81m/s2
Dividing both sides by g,
𝑚𝑎𝑖𝑟 − 𝑚𝑙𝑖𝑞𝑢𝑖𝑑 = ρ𝑙𝑖𝑞𝑢𝑖𝑑∗𝑉𝑠𝑜𝑙𝑖𝑑
Volume of solid also equals to mass / density,
𝑉𝑠𝑜𝑙𝑖𝑑 =𝑀𝑎𝑠𝑠𝑠𝑜𝑙𝑖𝑑
ρsolid
Hence density of object is given by,
ρsolid =ρ𝑙𝑖𝑞𝑢𝑖𝑑∗ 𝑀𝑎𝑠𝑠𝑠𝑜𝑙𝑖𝑑
𝑚𝑎𝑖𝑟 − 𝑚𝑙𝑖𝑞𝑢𝑖𝑑
𝑚𝑎𝑖𝑟: Mass of object in air
𝑚𝑙𝑖𝑞𝑢𝑖𝑑 : Mass of object in fluid
Table 11: Densities for 21ipm to 33ipm, fixed 300W and 5rpm
Fixed 300W, 5rpm Mair (g) MFluid (g) Density (g/cm3) Density (%)
21 ipm 24.4658 21.6015 7.925 97.38
23 ipm 29.8655 23.5910 8.054 98.96
25 ipm 25.4848 20.1356 8.061 99.05
28 ipm 23.1525 18.2685 8.021 98.56
30 ipm 26.5215 20.9265 8.020 98.55
33 ipm - - - -
Table 12 Densities for 4rpm to 6rpm, fixed 300W and 25ipm
Fixed 300W, 25ipm Mair (g) MFluid (g) Density (g/cm3) Density (%)
4 rpm 25.9352 20.4521 8.003 98.34
5 rpm 16.2515 12.8351 8.049 98.90
6 rpm 20.5215 16.1085 7.868 96.68
Table 13 Densities for 250W to 350W, fixed 25ipm and 5rpm
Fixed 25ipm, 5rpm Mair (g) MFluid (g) Density (g/cm3) Density (%)
250W 20.1525 15.8352 7.898 97.05
300W 25.4848 20.1356 8.061 99.05
350W 22.1020 17.3596 7.886 96.90

APPENDIX C 65
Appendix C: Hardness Test Results
Appendix C1: Hardness test results for non heat treated samples
Table 14 Hardness test results for non heat treated samples
Sample, Layer 1st 2nd 3rd 4th 5th 6th 7th 8th
1 layer 735
618
678
2 layers 897 917
891 894
870 866
4 layers 826 969 843 969
850 1068 835 963
846 970 875 928
8 layers 665 917 913 833 938 856 790 879
612 953 966 853 893 887 905 948
585 918 920 917 968 904 853 931
15 layers Bottom: 885 Middle: 992 Top: 924
Bottom: 867 Middle: 936 Top: 939
Bottom: 842 Middle: 913 Top: 891
30 layers Bottom: 846 Middle: 915 Top: 926
Bottom: 848 Middle: 885 Top: 877
Bottom: 885 Middle:1005 Top: 944
Appendix C2: Hardness test results for heat treated samples
Table 15 Hardness test results for heat treated samples
Sample, Layer 1st 2nd 3rd 4th 5th 6th 7th 8th
1 layer 988
805
900
2 layers 872 850
798 873
883 881
4 layers 821 871 846 845
668 890 878 890
719 849 860 849
8 layers 803 871 861 930 916 990 960 817
972 864 823 914 912 930 998 835
978 907 940 1000 884 840 993 942
15 layers Bottom: 802 Middle: 914 Top: 855
Bottom: 970 Middle: 938 Top: 834
Bottom: 842 Middle: 915 Top: 891
30 layers Bottom: 902 Middle: 922 Top: 863
Bottom: 830 Middle: 816 Top: 833
Bottom: 892 Middle:995 Top: 911