bachelor thesis 302511
DESCRIPTION
porter's five forces wind energyTRANSCRIPT
SIEMENS WIND POWER AND THE U.S. MARKET FOR WIND ENERGY
-‐ AN ANALYSIS OF ENVIRONMENTAL FACTORS IMPACTING A TURBINE MANUFACTURER
by Jan Thore Sieck
Exams No. 302511
Bachelor Thesis For The Program Of Business Administration
Characters (Excluding Spaces, Including Figures): 108.285
Supervisor: Sylvia Grewatsch
Department: AU-‐ School of Business and Social Science
Date Of Submission: 01.05.2014
ABSTRACT
This thesis is going to examine the wind turbine manufacturer Siemens
Wind Power, and its position in the American market for wind energy. The
investigation focuses on:
1. How a turbine manufacturer is affected by its market settings?
2. What market scanning tools are able to assist companies in their
strategic decision process?
In order to be able to answer these questions a qualitative approach was
used. To cover the wide range of information different sources were utilized.
Academic literature such as books and journals and non-‐academic sources
including web news, homepages and other online data archives have been the
main sources. For the analytical portion of the paper, PESTEL analysis, Porters 5
Forces framework, and SWOT analysis were used, since the interplay of the
analyses was able to answer the questions to the expected degree.
By the use of the three tools it was discovered that the American market
for wind energy is tremendously impacted by its surroundings. Especially
government interaction, the economic situation, and vertical integration are key
characteristics that are impacting wind turbine manufacturers in the U.S. and are
of major influence on Siemens Wind Power´s success. Furthermore, the
interrelation between different factors has shown to have a tremendous impact,
which also was the rationale behind the use of three different analytical tools.
Table of Contents
1. INTRODUCTION ............................................................................................................. 1 1.1 RESEARCH QUESTION ........................................................................................................ 1 1.2 PROBLEM STATEMENT ..................................................................................................... 1
2. RESEARCH DESIGN ........................................................................................................ 2 3. SIEMENS ........................................................................................................................... 5 3.1 SIEMENS ENERGY ................................................................................................................ 5 3.2 SIEMENS WIND POWER ..................................................................................................... 5 3.2.1 DANREGN A/S & BONUS ENERGY ........................................................................................ 5 3.2.2 SIEMENS WIND POWER ........................................................................................................... 6 3.2.3 CURRENT SIEMENS WIND POWER AND THE PRESENCE IN THE U.S. ................ 7
4. The American Electricity Market ............................................................................. 8 4.1 RENEWABLE ENERGY IN AMERICA AND THE CAUSES FOR ITS GROWTH ........ 9 4.2 RENEWABLE ENERGY SOURCES IN THE U.S .............................................................. 10 4.2.1 HYDROELECTRIC ....................................................................................................................... 11 4.2.2 BIOMASS ........................................................................................................................................ 11 4.2.3 GEOTHERMAL ............................................................................................................................. 12 4.2.4 SOLAR .............................................................................................................................................. 13
4.3 WIND POWER ..................................................................................................................... 13 5. SIEMENS WIND POWER IN THE AMERICAN MARKET .................................... 15 5.1 ENVIRONMENTAL SCANNING ........................................................................................ 16
6. PESTEL ANALYSIS ....................................................................................................... 17 6.1 CRITIQUE .............................................................................................................................. 19 6.2 PESTEL ANALYSIS SIEMENS WIND POWER ............................................................... 20 6.2.1 POLITICAL ..................................................................................................................................... 20 6.2.2 ECONOMIC .................................................................................................................................... 23 6.2.3 SOCIAL ............................................................................................................................................ 25 6.2.4 TECHNOLOGICAL ....................................................................................................................... 29 6.2.5 ENVIRONMENTAL ..................................................................................................................... 33 6.2.6 LEGAL .............................................................................................................................................. 35
7. PORTERS FIVE FORCES ............................................................................................. 38 7.1 CRITIQUE .............................................................................................................................. 42 7.2 PORTERS FIVE FORCES SIEMENS WIND POWER ..................................................... 43 7.2.1 RIVALRY AMONG COMPETING FIRMS ............................................................................. 43 7.2.2 POTENTIAL ENTRY OF NEW COMPETITORS ................................................................ 46 7.2.3 THREAT OF SUBSTITUTES .................................................................................................... 47 7.2.4 BARGAINING POWER OF SUPPLIERS ............................................................................... 49 7.2.5 BARGAINING POWER OF CONSUMERS ............................................................................ 52
8. SWOT ANALYSIS ......................................................................................................... 53 8.1 CRITIQUE .............................................................................................................................. 54 8.2 SWOT ANALYSIS SIEMENS WIND POWER ................................................................. 55 8.2.1 STRENGTH .................................................................................................................................... 55 8.2.2 WEAKNESSES .............................................................................................................................. 56 8.2.3 OPPORTUNITIES ........................................................................................................................ 57 8.2.4 THREATS ....................................................................................................................................... 58
9. CONCLUSION ................................................................................................................ 59 Bibliography ..................................................................................................................... 61
1
1. INTRODUCTION
Since its discovery, the demand for electricity has increased
tremendously and today a life without it is unimaginable. To cover the growing
request of electricity, different energy sources are utilized with the major
contribution coming from the so-‐called non-‐renewable sources. These sources
are not only highly dependent on natural scarce resources but are also the main
contributor to the contemporary climate change.
In order to combat these issues, more and more focus is going towards
renewables as an energy source. The wind energy industry had an impressive
development during the last decade and is the most utilized renewable energy
source worldwide.
In the following paper, the reader is going to learn more about the factors
that are influencing a manufacturers decision process. The case company that is
used is Siemens Wind Power, a subsidiary of Siemens.
1.1 RESEARCH QUESTION
I am analyzing the business environmental factors surrounding Siemens
Wind Power in the U.S., because I want to find out how a turbine manufacturer is
affected by its environmental settings, in order to understand how
environmental-‐scanning tools are able to assist companies in their strategic
decision process.
1.2 PROBLEM STATEMENT
The purpose of this study is to analyze how Siemens Wind Power is
affected by the business market climate in the U.S. In order to be able to evaluate
the impact of the company’s environment, three different scanning tools were
chosen.
During the history of wind energy, the market always was tremendously
affected by its surrounding conditions. Especially the U.S. has been, and still is, a
market that to high degree is shaped by external market influences. Throughout
the last years until today the factors, which are covered with the chosen
2
analytical tools, were in different ways taking a noteworthy impact on turbine
manufacturers success.
The market factors and their changes were facing manufacturers with
many difficulties in maintaining a profitable business. For Siemens this resulted
in huge losses, which were forcing the company to lay off workers, while at the
same time, management was sensing the need for restructuring the company.
This paper is going to analyze the American market in regard to the
political, economical, social, technological, environmental, and legislative factors,
which are going to be of the major concern in the PESTEL analysis. The Porters
Five Sources framework is directing its attention to the rivalry among competing
firms, the potential threat of new competitors, the threat of substitute products,
the bargaining power of suppliers, and the bargaining power of consumers. Last
but not least, the SWOT analysis is used to evaluate Siemens' Wind Power
strength, weaknesses, opportunities, and threats.
2. RESEARCH DESIGN What is very common for an economic research is the qualitative study,
which was also chosen for this paper (Blumberg et al., 2008). The qualitative
study, in comparison to the quantitative, was better able to answer the ‘how’ of
our question since especially the interplay of different market factors were
contributing to the actual situation of the company.
The paper in itself is majorly formal, starting out with a descriptive
account of the situation, followed by the analysis, and ending with the
conclusion. However, it was not possible to totally keep the study formal and one
might discover tendencies into the exploratory study, since additional areas of
investigation were discovered along the way.
Since the purpose of the paper was to answer both “how a turbine
manufacturer is affected by its environmental settings” and “how environmental
scanning tools are able to assist companies in their strategic decision process”,
the causal study was chosen (Blumberg et al., 2008). However, the reader is also

3
able to discover characteristics of the descriptive study since the first part of the
study focuses on finding out who, what, where.
In order to be able to answer the research question different information
sources were needed, ranging all the way from secondary sources to qualitative
interviews. The secondary sources that were utilized were governmental
homepages, company homepages, homepages from independent organizations,
academic journals, news homepages, and academic books of the management
and marketing literature.
The first part of this paper, which is majorly descriptive and deals with
our case company and the American energy market, was written by the use of
information that were found on homepages from governmental institutions and
company homepages. To gather information about the American energy market,
data that was provided by governmental institutions was used as the primary
source. Additionally a variety of independent organizations were able to provide
information regarding the market and the different energy sources.
Furthermore different history and political academic sources were used as a
source for the U.S. historical political development for renewables.
Information, concerning the different analytical tools, was obtained
through the use of strategy and marketing books, and with additional
supplementation via articles found in a variety of academic marketing and
management journals. Especially in this part of the paper, a collection of different
sources was needed to broaden the writer’s knowledge, while on the other hand
allowing taking a critical viewpoint towards each theory applied.
The widest range of information was needed for the analytical part.
Besides the analytical part being the biggest, it on the other hand is the broadest.
In addition to the already mentioned sources, the analytical part was supplied
with information from news homepages and interviews.
The two interviews that were held in Springfield, Illinois, have both been
qualitative. The first interview, which was held with Stan Komperda, who is the
Director of Development for American Wind Energy Management Corp., was
about the developer and his part in the supply chain and, additionally, about

4
some factors of the American market for wind energy. The interview was chosen
to be semi-‐structured to give the interviewee enough freedom to decide how
much to go in depth with each question and what direction to choose. This
freedom was additionally helping the interviewer to discover what a wind
developer regards as important and what not.
The second interview was a focus group interview. The group consisted of
three people namely Christopher Nickell, who is the Director of Site
Establishment for AWEM Corp, Stan Komperda, and Kyle Barry, who is an
independent lawyer dealing with legal issues in regard to the development of
wind farms. The interview was about legal issues concerning the development of
a wind project and the three different personalities were chosen to widen the
discussions horizon. During the interview process the interviewer tried to
interact as little as possible to keep the different arguments continuing.
However, this was not always possible and an interaction to keep the discussion
going was needed from time to time.
Both interviews were able to provide the needed data and at the same
interesting viewpoints.
However, during the research process the writer several times was facing
problems, although minor. Especially the use of news homepages turned out to
be problematic since the published information not always was reliable. To
tackle this problem, at least to some extent, the given data was compared with as
many sources as possible.
Another problem that was to be handled was the fact that Siemens Wind
Power not was willing to give interviews in regard to their contemporary and
future strategy. This resulted in an increased focus towards the information that
could be gathered.
Furthermore, the fact that a recorder was used, to record the interviews,
gave the impression that some sentences were shortened to get to the point
faster. Additionally the participants of the focus group interview were not
familiar with the interview style, which resulted in some answers to be given
directly to the interviewer.

5
Additionally, and that has been one of the most influential problems, was
the fact that this paper was limited to 110.000 signs. This limitation resulted in
the writer not being able to discuss all of the factors that were taking an impact
on the case. It was therefore up to the writer to decide what factors to include
and which not, which resulted in spending a lot of time reading literature to find
out how different factors were taking an impact.
3. SIEMENS
Werner von Siemens founded the company in 1847, starting out with
producing an improved version of the telegraph (Siemens, 2008). Today Siemens
AG is a worldwide operating electronics and engineering company, focusing on
the market sectors of energy, industry, healthcare and infrastructure & cities
(Siemens AG, 2013). At its current stage the company is employing 370.000
people in 190 countries, while generating yearly revenue close to 105 billion
Euros (Siemens AG, 2013).
3.1 SIEMENS ENERGY
Siemens energy sector is divided into different areas namely; energy
services, power generation, power transmission and wind power (Siemens,
2013). The energy sources in Siemens product portfolio are wide ranging from
renewables like wind, solar, and hydroelectric, all the way to the non-‐renewable
sources like coal, and gas (Siemens, 2013). In 2013, Siemens energy sector had a
workforce of approximately 83,500 and received orders that were accounting to
28.8 billion Euros, generating a total profit of 1.95 billion Euros (Siemens, 2013).
3.2 SIEMENS WIND POWER Siemens wind power has a history of more than 30 years and is the
world’s oldest wind turbine manufacturer (Siemens Wind Power, 2013).
3.2.1 DANREGN A/S & BONUS ENERGY The whole basis for the Siemens wind power sector was made in 2004
through an acquisition of Bonus Energy (formerly Danregn Vindkraft A/S).
Danregn started its wind turbine business in 1980, with producing 15 turbines,
each with a capacity of 25-‐30 kW (Bonus Energy, 2003). A year later, Danregn
6
founded the company Danregn Vindraft, which was now producing a 55 kW
turbine that was to be exported to the USA in collaboration with Difko A/S
(Bonus Energy, 2003). Due to the boom on the American market, Danregn
Vindkraft decided to establish a service company in the U.S while at the same
time changing its name to Bonus A/S in 1983 (Bonus Energy, 2003). In 1985
Bonus stopped selling turbines on the American market due to the cuts of
governmental support under the Reagan administration (Sherlock, 2011).
However the company was still maintaining its presence by carrying out
retrofitting activities on turbines made by other manufacturers (Bonus Energy,
2003). During the time after 1985, Bonus A/S was nearly exclusively focusing on
their Danish domestic market, with directly developing new technologies for
offshore wind projects (Bonus Energy, 2003). In 1991 Bonus A/S participated in
the world's first offshore wind park in Vindeby, Denmark (Siemens, 2012). The
Vindeby offshore wind park consisted of 11 turbines with a total capacity of 5
MW (Siemens, 2012).
3.2.2 SIEMENS WIND POWER In 2004 Siemens entered the wind industry market by acquiring Bonus
A/S (Siemens, 2008). After the acquisition, Siemens rapidly continued investing
into their new wind business, since they saw a high potential in the industry
(Siemens, 2008). In 2005 Siemens bought one of Bonus Energy's former partners,
AN Windenergie GmbH, which was dealing with sales and services (Siemens,
2008). One year later Siemens bought a former blade factory, LM Glassfiber, while
at the same time investing into new offices, warehouses and production facilities
at its headquarters in Brande (Siemens, 2008). The new acquisitions were made
to better control quality, delivery, production, etc. However, Siemens did not
only invest domestically. In 2007 Siemens opened a blade factory in Iowa (USA),
which was consisting of different facilities for warehousing and manufacturing
(Siemens, 2008). The reason for directly investing into the market was caused by
the fact that the American growth rate started to increase and that corporate
owned facilities were able to decrease transportation cost and at the same time
increasing delivery speed (Siemens, 2010). During the time between 2005 and
2010 the American market had an average growth rate of more than 35% and in
these five years Siemens installed a capacity of 3.6 GW, which was enough to
7
supply more than one million households with clean and renewable energy
(Siemens, 2010).
During the last years, Siemens presence on the international market for
wind energy has grown tremendously. At the end of 2010 Siemens again directly
invested into foreign markets, with its first rotor blade manufacturing plant in
China and Canada, and a new nacelle production in Kansas (Siemens, 2010). The
investment was caused by new orders in these markets, while analysis at the
same time were predicting enormous growth rates for the wind turbine industry
(Miller, 2013). In 2011 Siemens again decided to invest into the expansion of
their wind business. One Hundred Fifty million Euros were to be invested into
their R&D center in Aalborg and Brande (Siemens, 2011). Additionally, this
money was used to expand the headquarters in Brande, since the facilities were
too small to accommodate the growing number of employees (Siemens, 2011).
The fact that both the wind power and the solar & hydro sectors have
grown dramatically, lead to the decision of realigning the renewables business
into two independent units (Siemens, 2011). This was caused by the fact that both
the wind and solar industry were on different stages of their development and
because the workforce has grown more than 10 times since 2004 (Siemens,
2011). The realignment was made to better customize the strategies for the two
different industries and was, additionally, the main reason to replace the wind
power headquarter to Hamburg, Germany (Siemens, 2011).
3.2.3 CURRENT SIEMENS WIND POWER AND THE PRESENCE IN THE U.S. Today the Siemens Wind Power sector accounts for more than 10.000
employees of which more than 1.500 directly are employed in the U.S. (Siemens,
2013). To the present day Siemens has installed a total of more than 13.000 wind
turbines with approximately 4.800 of them generating clean and renewable
energy in the American market (Siemens, 2013). In total, their turbines are
accounting for a capacity of more than 22.000 MW globally, with close to 8.500
MW in the U.S. (Siemens, 2013).

8
At its current stage, Siemens Wind Power has 10 locations in the U.S. The
American headquarters for the wind power business is located in Orlando,
Florida, and was established in 2005 (Siemens, 2013). Through the headquarters
in Orlando, they manage a nacelle assembling facility in Hutchinson, Kansas, a
rotor blade manufacturing facility in Fort Madison, Iowa, a research and
development center in Boulder, Colorado, an offshore office in Boston,
Massachusetts, a distribution center in Wichita, Kansas, and four different
service locations in Orlando, Houston, Texas, Goldendale, and Woodward
(Siemens, 2013). All of these locations are relatively new and none of them was
established before 2005 (Siemens, 2013).
Siemens Wind Powers contemporary goal is to drive down the cost of
wind energy and thereby be not only be competitive with other energy sources
but to also to be independent of subsidies (Siemens, 2013). The strategy to obtain
this goal is to build highly efficient, solid, and reliable turbines that are easy to
install and are able to supply reliably for long timeframes (Siemens, 2013).
4. The American Electricity Market
The United States is currently the biggest producer of electricity and at
the same time its largest consumer. In 2013 U.S electricity consumption
accounted to 4.05 million MWh, which was supplied by energy sources such as
coal, gas, nuclear, renewable energy sources and oil. (U.S. Energy Information
Administration, 2014).
The biggest electricity sources used in America are coal with 39%,
followed by natural gas accounting for 27,5%, nuclear for 19,5%, and renewables
and other sources accounting for 12,8% and 1,2% respectively (U.S. Energy
Information Administration, 2014).
The biggest consumer group of the supplied energy is the residential
sector with 37%, the commercial sector with 36%, the industrial sector with
26,5%, and the transportation sector that accounts for less than 0.5% (U.S.
Energy Information Administration, 2014).
9
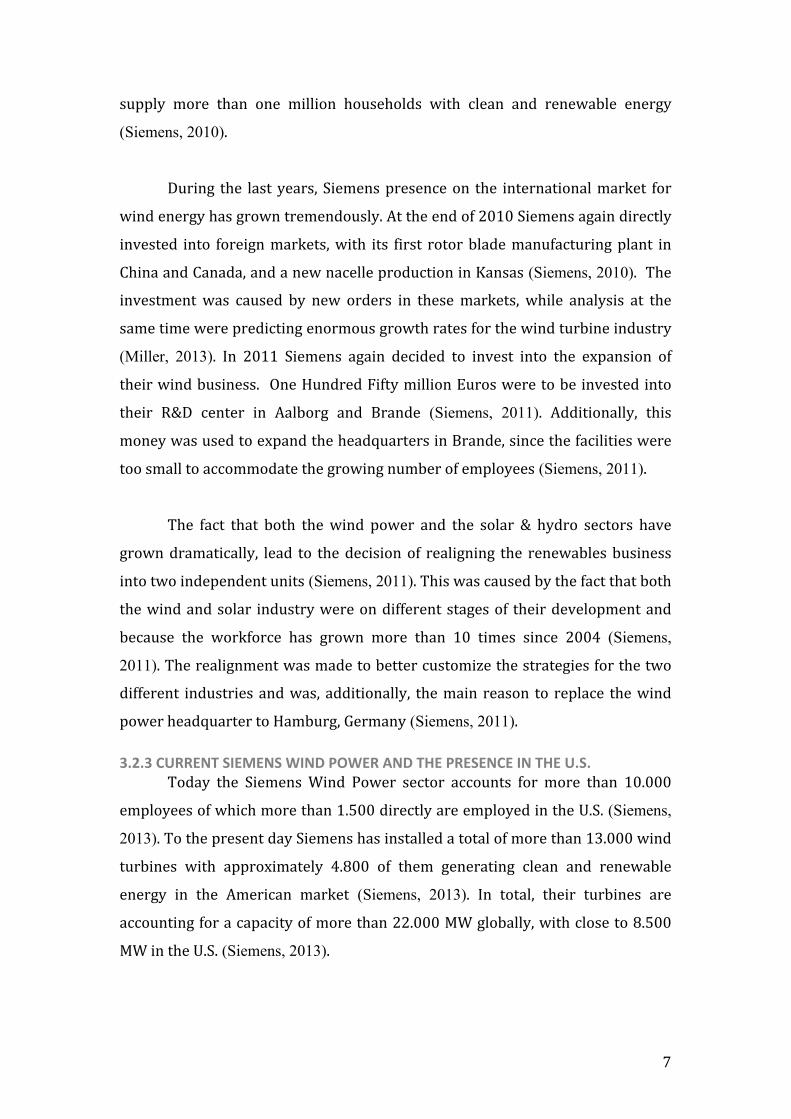
Figure 1. EIA, Feb 2014, Electric Power Monthly, http://www.eia.gov/electricity/monthly/epm_table_grapher.cfm?t=epmt_1_01
Figure 1 shows how the supply by the different energy sources has
changed during the time between 2003 and 2013. The most noteworthy increase
was made by the sector of renewables (excluding hydroelectric). Starting out
with supplying around 80.000 MWh in 2003, which was equal to approx. 2% of
the total energy supply, the renewable sector (excluding hydroelectric) has
increased its supply to 270.000 MWh, equal to 6% of the U.S total supply of
electricity.
The following part is going to look more detailed at the American market
in regard to the renewable energy sector, while directly putting increased focus
towards the wind energy.
4.1 RENEWABLE ENERGY IN AMERICA AND THE CAUSES FOR ITS GROWTH
The first step to push renewables was made in the 1960s, where The
National Environmental Policy Act for the first time recognized the importance
of protecting the national environment (GENESLAW, 1995). Air pollution and
the use of scarce natural resources where the main causes for the Congress to
impose responsibilities on the federal government (GENESLAW, 1995).
In the 1970s the U.S Environmental Protection Agency (EPA) was
established due to the continuing damages that were made to American natural
10
areas (EBSCO HOST, 2014). The goal of the EPA was to reduce the dependency
on natural resources like fossil fuels, and to develop energy sources with a long-‐
term sustainable future (EBSCO HOST, 2014).
In 1973 the oil embargo came and the U.S were pressured since they were
not able to cover their domestic demand with their own production (Eckhart,
2012). This lead to calls for energy independency while creating programs and
policies that were supporting clean and renewable energy sources (Eckhart,
2012). However, the support for renewables and its research and development
were slashed with the Reagan Administration in 1981 (Sherlock, 2011). In
addition to the bad political situation for renewable energy sources, the oil and
natural gas prices declined tremendously between 1985-‐1986 which made it
even harder for renewables to develop (Eckhart, 2012).
In 1992, the Energy Policy Act (EPACT) was carried into effect, which
contained titles such as the ‘Independent Power’ that was eliminating the 49%
ownership-‐rule that said that utility companies were not allowed to hold a major
part in the energy plants that were supplying them (Eckhart, 2012). These new
laws were the basis for the modern energy structure the U.S. has today, where
big companies own energy plants such as wind farms, coal power plant, or
nuclear power plant etc. (Eckhart, 2012).
From 2000-‐2010, 30 of the 50 American states adapted to some form to
the ‘Renewable Portfolio Standard’, which requires an increase in production for
energy supplied by renewable energy sources (IHS, 2010; Eckhart, 2012). The 30
states targeted a goal of 20% of all energy being supplied by renewables by 2020
(IHS, 2010).
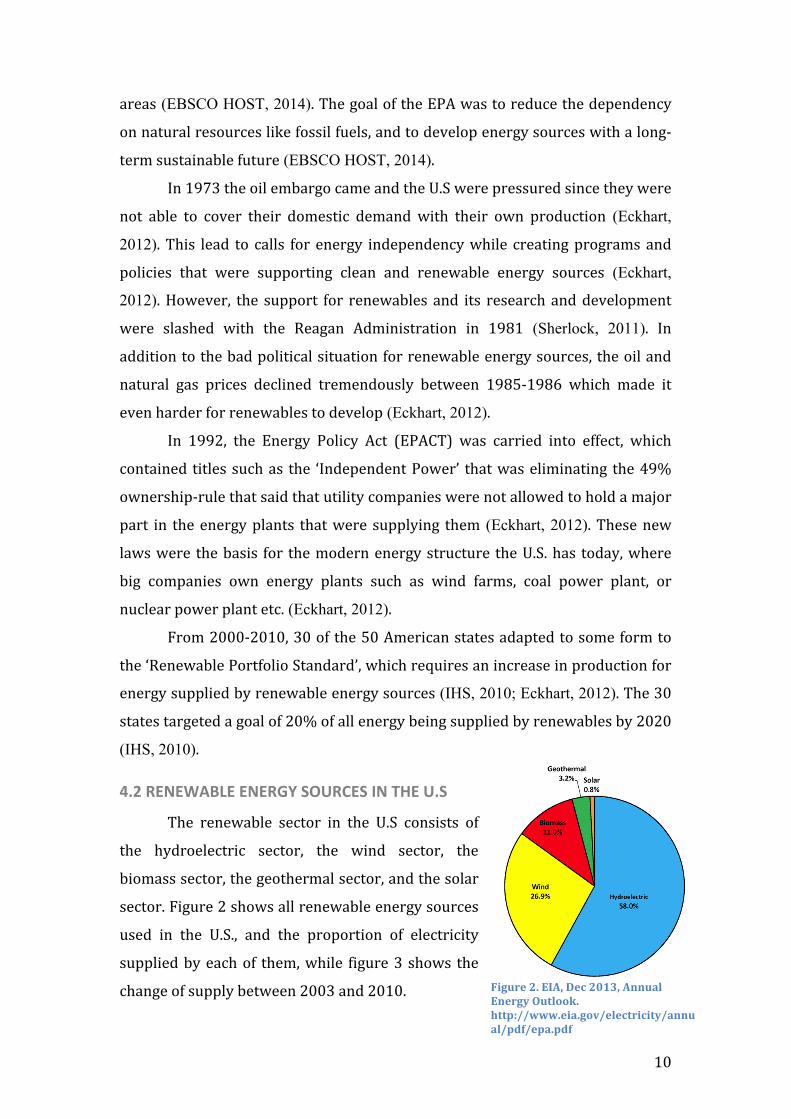
4.2 RENEWABLE ENERGY SOURCES IN THE U.S
The renewable sector in the U.S consists of
the hydroelectric sector, the wind sector, the
biomass sector, the geothermal sector, and the solar
sector. Figure 2 shows all renewable energy sources
used in the U.S., and the proportion of electricity
supplied by each of them, while figure 3 shows the
change of supply between 2003 and 2010. Figure 2. EIA, Dec 2013, Annual Energy Outlook. http://www.eia.gov/electricity/annual/pdf/epa.pdf

11
Figure 3. EIA, Feb 2014, Net Generation from Renewable Sources. http://www.eia.gov/electricity/monthly/epm_table_grapher.cfm?t=epmt_1_01_a
4.2.1 HYDROELECTRIC
The biggest renewable energy source in the U.S. is hydroelectric. A
hydroelectric power plant requires the power of moving water like rivers, ocean
waves, or other streams of water (NHA, 2013). Figure 3, the column of
‘Hydroelectric Conventional`, shows the energy supplied by this sector. In 2013,
the hydroelectric energy source provided approx. 7% of the total electricity
supplied, while generating more than 55% of all the electricity supplied by
renewables.
Not only is hydropower the biggest renewable source in the U.S, but
additionally one of the cheapest with a price of $0.09 per kW/hr., where only
power plant types such as natural gas, wind and geothermal are able to compete
(Eia, 2013).
By the end of 2012 the industry employed close to 300.000 workers
across the U.S. However, this renewable energy source has not shown to develop
much during the last years, which insiders say is caused by the fact that other
renewable energy sources received governmental support and the fact that
hydroelectric power plants are restricted to a limited amount of development
areas (NHA, 2013).
4.2.2 BIOMASS
Leaving out wind energy to make a more detailed description, we have
biomass as the third biggest renewable energy source. Biomass is biological
material, usually from organisms like plants, which in a thermal, chemical, or
12
biochemical conversion produces energy (Biomass EC, 2014). Figure 3 shows the
net generations for biomass in four different columns, all together having
supplied close to 60.000 MWh. in 2013. With this number the biomass sector has
supplied approx. 11% of the total renewable energy generated in 2013.
The price for one kW/hr. has been $0.11 in 2013 and thereby supplied for
the same cost as nuclear power plants (Eia, 2013).
By the end of 2011 the industry of biomass energy employed around
15.500 people all over in the U.S, but, like the hydroelectric industry, the
industry of biomass energy neither has shown big growth rates during the last
ten years (Biomass Power, n.d.). The net generation of electricity supplied by
biomass in 2003 was 53.000 MWh., while ten years later it increased to 60.000
MWh (Eia, 2013). The only slow growth of the biomass industry has different
causes. First of all biomass is said to be a carbon dioxide neutral energy source,
since the process of generating energy releases approximately the same amount
of carbon dioxide that is being recovered by the growth of the plants (NREL,
2014). Additionally, it is being criticized that areas where food could be grown,
are utilized for plants that in later stages are getting destroyed for the supply of
energy (NREL, 2014).
4.2.3 GEOTHERMAL
The fourth biggest renewable energy source is geothermal energy;
supplying around 4% of the total renewable energy in the U.S. Geothermal
energy uses magma that is heating up water and by that creating pressure which
is going to drive electric generators (Union of Concerned Scientists, 2014). Plants
for geothermal energy are placed in areas where the earths’ crust is relatively
thin and where it is easier to access the hot core (Union of Concerned Scientists,
2014). When it comes to employment, the sector of geothermal energy had a
workforce of approx. 13.500 people in 2010 (GEA, 2010).
The price for one kW/hr. of geothermal energy is $0.09 and by that makes
it one of the cheapest energy sources (Eia, 2013).
In 2003, the geothermal sector supplied around 14.500 MWh and
reached, 10 years later, 16.500, which equals a growth of 12% in ten years. Like
biomass and hydroelectric, also geothermal energy has not shown big growth

13
rates during the time between 2003 and 2013. The slow growth is caused by the
fact that the technology cost of geothermal energy plants is generally higher than
for example for wind or solar (EIA, 2011). Additionally, geothermal power plants
are extremely dependent on area specific characteristics and by that limit their
growth possibilities (EIA, 2011).
4.2.4 SOLAR
The smallest renewable energy source in the U.S. is solar energy. Solar
energy can be generated by photovoltaic and thermal solar power plants (SEIA,
2014). Figure 3 and the columns of “Solar Photovoltaic” and “Solar Thermal” are
showing the development of the energy supplied by the solar industry. Starting
out with supplying around 500 MWh in 2003, the industry now supplies more
than 9.000 MWh. The biggest change here was made in the area of photovoltaic,
starting with supplying 2 MWh in 2003, to reaching a supply of 8.300 in 2013.
The reason for this enormous growth is not only caused by governmental
support, but also the fact that installments of photovoltaic can be placed on
nearly every surface where the sun is shining (SEIA, 2014).
Although the development went fast for solar energy, the price is still not
competitive with other energy sources. The price for one kW/hr. of photovoltaic
generated electricity is $0.14 and $0.26 for thermal solar electricity (Eia, 2013).
One of the main reasons, that are causing the relatively high price of solar
energy, is the fact that, although the industry is still small, the total workforce is
unproportionally large, with more than 100.000 employees at the end of 2012
(ACORE, 2013).
4.3 WIND POWER
Wind power has a long history in the U.S., reaching all the way back to the
18th century (U.S. Department of Energy, 2014). In the beginning, the energy,
which was supplied by the mills, was used for grinding corn and other grains or
pumping water, while in the 1930s it started to be used as an electricity source
(Iowa Energy Center, 2014; U.S. Department of Energy, 2014). The efficiency at that
time was low and one wind turbine only had the capacity of lighting one or two
bulbs, or operating a radio receiver (Iowa Energy Center, 2014). However, the
demand for wind turbines was high since many households were not connected
14
to the power grid (Kaldellis & Zafirakis, 2011). In the 1950s this changed and the
central power grid was extended to nearly every American household, which
resulted in a heavy decrease in demand for wind turbines and development was
nearly dormant for the following 20 years (Kaldellis & Zafirakis, 2011).
In the 1970s the Oil Embargo reawakened the interest in renewables and
especially wind energy (Sherlock, 2011). The fact that energy prices were
climbing and the availability of conventional fuels was decreasing resulted in
governmental investments into the development of the wind energy industry
(Iowa Energy Center, 2014). The input came from the National Aeronautics and
Space Administration, The National Science Foundation, and The U.S.
Department of Energy, which all contributed to the development of 13
experimental turbines that were causative to the basis of the turbines used
today, not only in the U.S. but worldwide (Wind Energy Foundation, 2014; Iowa
Energy Center, 2014). The new technology increased the efficiency and
effectiveness dramatically, with turbines being able to supply around 700
households (Iowa Energy Center, 2014).
The fast development of the industry and the governmental investments
resulted in many startups with more than 50 different turbine suppliers in the
70s (Iowa Energy Center, 2014). However, due to massive consolidation, the
industry had less than a dozen domestic suppliers by the end of 1977 (Iowa
Energy Center, 2014).
Between the time of 1973 and 1986, the whole structure of the supply of
electricity generated by wind changed tremendously. It now became usual
investing more and more into big wind farms instead of single turbine
production (Iowa Energy Center, 2014; Wind Energy Foundation, 2014; Kaldellis &
Zafirakis, 2011).
Today wind energy is still one of the fastest growing renewable energy
sources. Looking at Figure 3, we see that the sector was supplying around
11.000 MWh in 2003, while it now supplies more than 167.000 MWh., generated
by an installed capacity of 60.000 MW (AWEA, 2013). The growth in these 10
years accounts to a total of more than 1500%. When looking at the supply in
15
percentage, generated by wind power to the renewable supply in total, we see
that they contributed 3% in 2003 and more than 32% in 2013. In 2012 the wind
energy industry employed more than 75.000 people all over in the United States,
with approx. 25.500 working in the area of manufacturing (ACORE, 2013).
Since 1980 the price for one kW/hr., generated by wind turbines, fell by
more than 90% and supplies, at its current stage, for a cost between $0.09 and
$0.22 (AWEA, 2013). The big variation of the energy cost, supplied by wind
energy, is caused by different factors. First of all, wind turbines are showing
enormous differences in their efficiency, which especially is connected to the
turbines age. Secondly, wind turbines need wind to produce and best prices are
only secured when the wind level stays constant and strong over longer periods
(U.S. Department of Energy, 2014). Other factors that are influencing are the
efficiency of the electricity grid, the distance to the supplied utility company, and
weather conditions that are resulting in deterioration (U.S. Department of
Energy, 2014).
5. SIEMENS WIND POWER IN THE AMERICAN MARKET
The last part gave an introduction to our company and the American
energy market. The following part is going more into depth and at the same time
we are switching from an exclusively descriptive viewpoint into a more
analytical perspective.
Before starting with the analysis it is important to note that turbine
manufacturers are extremely dependent on Wind Developers. Wind Developers,
sometimes independent, sometimes owned by utility companies, are companies
that are developing the actual wind farm, which then is sold to an investor.
Generally wind developers have three things they look for (Barry, 2014).
1. Resource: How does the wind level look like?
2. Proximity to demand: How close are you to your demanding
consumers?
3. Interconnection: How to interconnect the wind farm and how
much is to be built by yourself?

16
When a project is developed these companies are dealing with a wide
range of issues concerning the project of a wind farm e.g. political, legal, market,
economical etc. (Komperda, 2014). Important for the turbine manufacturer is the
fact that the developers usually choose their own supplier that is fitting best to
their needs (Komperda, 2014). The factors influencing the decision which
supplier to choose are wide ranging but usually relate to factors such as
technology, maintenance, quality, price, capability and availability (Komperda,
2014).
During the analysis we are going to discuss factors that not always
directly are affecting our manufacturer, Siemens, but the developers, which is the
section in the supply chain getting the actual product to the customer.
Inside the literature of strategy there are several theories, every single
one using a different approach to analyze. In this paper the theories that are
being used are to explain market characteristics and on the other hand to
analyze our company in regard to the factors taking influence on strategic
decisions. Since this is the case, we are using the PESTEL analysis, Porters Five
Forces, and the SWOT analysis. Before starting each analysis, the theory is going
be explained and its limitations are pointed out.
5.1 ENVIRONMENTAL SCANNING
Since businesses are aiming at improving their success and ensuring their
survival, it is important for managers to acknowledge the conditions in which
their business is placed (Pickton & Wright, 1998). Environmental scanning allows
people to discern information and knowledge form the ongoing environmental
signals they receive every day (Slaughter, 1999). The environmental conditions
should be of enormous influence in the decision processes that might, and mostly
is, influenced by the surrounding settings (Hollensen, 2011).
When monitoring the environment, managers are able to gain knowledge
not only about their business in itself, but additionally about the
market/industry in its whole (Hollensen, 2011).
However, when using environmental scanning techniques it is important
to first of all design a scanning frame, which is going to help the practicing
17
person to decide what might be of importance for his business case (Adler &
Gundersen, 2008). Complementary to the information that is received
automatically, a good environmental scanning process always needs huge
amounts of data that must be gathered (Slaughter, 1999).
Organizations that are not paying attention to the wide range of
information that is surrounding them often tend to lose touch with vital
information about products, suppliers, markets, competitors etc. (Hollensen,
2011). On the other hand, a company that adapts to the techniques of
environmental scanning are able to evaluate their environment on a regular
basis, which makes it possible not only to perform good contemporary but in the
long run as well, since adaptation to changes are able to be made earlier since
information is on hand (Hollensen, 2011; Adler & Gundersen, 2008).
The following analyses are going to focus on those environmental
conditions, some internal and some external. What is noteworthy before starting
is the fact that nearly all of the factors, at least to some extent, interrelate with
each other (Hollensen, 2011). Because this is the case, the reader will most of the
time be able to draw parallels between each the factors that are analyzed.
Additionally it is important to note that not all sub-‐factors that are having an
impact are discussed and only the most influential were picked and analyzed.
While the analysis was made the writer tried to avoid running into the
problems that were acknowledged in the critique of each applied theory. This
was mainly caused to increase the papers validity and usefulness.
6. PESTEL ANALYSIS
The PESTEL analysis, which is an advancement of the PEST analysis, is a
tool that is commonly used in the market scanning process (Hollensen, 2011). The
analysis is used to analyze the macro-‐environment, that is, analyzing the main
external and uncontrollable factors which mostly are, influencing the decision
making process of an organization (Kotter & Schlesinger, 2008; Johnson et al.,
2007).

18
Philip Kotler, who is an American professor, consultant and marketing
author, noticed that the PESTEL analysis has shown to make its user understand
an organizations business position, the general causes for market growth or
decline, and additionally the opportunity and potential of a business related
project (Hollensen, 2011; Kotler et al., 2009).
PESTEL is an abbreviation for Political, Economic, Social, Technological,
Legal, and Environmental. The analysis in itself is going to examine each factor
and how they are influencing the business of the company (Johnson et al., 2007).
Let us take a look at the six different factors, which are included in the PESTEL
analysis, in more detail:
• Political: The question we want to answer here is how the political
situation of the area where we are dealing in might affect the
industry/business. Factors that are of interest here are for example to
what extent the government is interacting in our industry e.g. the support
they are giving, the taxes they charge etc.
• Economical: Here we might want to find out how the economic situation,
of the country we are doing business in, looks like and later what factors
are influencing us as an organization. Factors that might be of interest are
usually the distribution of income, the inflation rate, the demand/supply
situation etc.
• Social: A question that might get asked here is how important is culture
and to what extent is the community shaped by it? The social part of the
analysis covers factors such as demographics, religion, population
analysis etc. The knowledge that is obtained here is able to answer
questions about people’s habits and attitudes e.g. higher energy demand
during the Christmas season in Christian countries, viewpoint towards
different energy sources.
• Technological: Here we might want to answer what technological
innovations might be of importance in the future and on what level the
market is right now. We evaluate how favorable the technology, that the
market contains, might be for our business. This of course always
19
depends a lot on our product and high innovation in technology might in
the end even be unfavorable e.g. another wind turbine manufacturer that
is able to provided a better turbine than we are.
• Environmental: When talking about the environment in the analysis we
refer to the natural environment like climate, weather, geographical
position etc., and not the market environment related to all the other
factors as we did it in the last sections. In this part of the analysis we want
to know how the environment fits to our needs e.g. are there enough open
fields to build wind farms and how does the wind level look like.
• Legal: We might want to answer if there are any regulatory or restrictions
in our industry or if there might be some in a future outlook. Although
this factor is often criticized for being too closely related to the political
part of PESTEL, it has shown to provide a more precise picture in
comparison to a PEST analysis. When analyzing the legal part in another
country, the company often starts to face new possibilities while on the
other side new restrictions e.g. patents on technology, restrictions of
some materials.
6.1 CRITIQUE
Of course the PESTEL analysis is not perfect and the user needs to keep its
limitations in mind.
The PESTEL analysis is not mathematics and problems are to be
encountered when trying to assign a value to the findings. Having a qualitative
tool, instead of quantitative, results in an evaluation that needs to be qualitative
as well (Yüksel, 2012). This limits PESTEL in being objectively or rationally
analyzed which ravages in the results not being comparable (Yüksel, 2012).
Another problem is connected to the fact that PESTEL claims to use a
holistic approach. However, this is not the case and every single factor is usually
measured and evaluated independently, which might result in a picture that is
far from reality (Byars, 1991). However, since this factor has shown to be of such
20
a significant influence, the modern use of PESTEL usually includes the interplay
of each factor (Byars, 1991).
Additionally PESTEL is said to neglect different factors in different cases,
which may be of different importance (Byars, 1991). In some industries political
interaction might to high degree influence a company’s profitability, while
technological factors, on the other hand, only are taking minor impacts. This
might result in the factors differing tremendously in their importance and their
actual impact on the business (Byars, 1991).
6.2 PESTEL ANALYSIS SIEMENS WIND POWER
Since we now know the most important facts about the PESTEL analysis,
it is time to use the theory in practice. The following part of this paper is going to
start out with analyzing the political aspects that are influencing Siemens Wind
Power.
6.2.1 POLITICAL
During the last decades federal and state governments have had an
enormous impact on what energy source is going to succeed and which are not
(Post, 2013). In this industry it is under no circumstances possible to talk about
fair and total competition and many detractors even say that governmental
actions like squeezing taxpayers, rigging regulations and taxes, and
implementing must-‐take provisions are a discrimination of the market (Post,
2013). The following section is going to look at how political intervention made
and is making an impact on the wind industry.
In 1978 the industry of wind energy for the first time received
governmental support. At that time it was The Energy Tax Act that was
containing titles such as the Investment Tax Credit (ITC) for wind energy
(Sherlock, 2011). During its history the industry was shaped tremendously by
governmental interactions like the Production Tax Credit (PTC) or the
Renewable Energy Standard (RES) (Sherlock, 2011). However, the most
important support in the history of wind energy in America has been the
Production Tax Credit (PTC). The PTC was first enacted in 1992, as a part of the
Energy Policy Act (Sherlock, 2011). At its inception, the PTC was providing an
21
adjusted tax credit of 1.5 cent per kWh in comparison with its most recent 2.2
cent credit before its last expiration (Sherlock, 2011). The PTC was granted for
the first 10 years of operation for energy that was supplied by wind turbines
(Sherlock, 2011). The support was made to increase investments into
development and production of the wind energy industry, while at the same time
providing a basis for wind to be competitive to other energy sources (Sherlock,
2011; AWEA, 2013).
Another way to look at the PTC is that it is a governmental tool to price
carbon dioxide (Barry, 2014). At its contemporary point the U.S. is not pressing
charges on CO2 that is released into the atmosphere, and power plants such as
coal and gas are releasing tons of it every day (Barry, 2014; EPA, 2011). When
looking at the PTC from another angle, it could be argued that it is a mechanism
that still, in some way, presses charges by not providing the same support to all
energy sources (Barry, 2014).
Currently, President Obama and the Democratic Party control the
Executive Branch and Legislative Senate of the U.S. government with
Republicans controlling the Legislative House of Representatives. After the
election in 2009, the president, who has expressed himself very favorable
towards renewable energies, has insured the industry a high degree of
governmental support (Galbraith, 2009). However, the situation at that point of
time was more complicated due to the financial crisis hitting the U.S. hard and
every penny spent was to be well considered (Summers, 2009). The goal by
support the wind industry was not only caused by governmental pressures from
other countries, but additionally the American pursuit of fossil fuel
independency, the creation of jobs, an increase in energy efficiency, the
deceleration of the climate change, and the environmental protection in general
(Sherlock, 2011). These goals were financed by incentives that already have been
of importance for many years but after the election of Obama, with an increased
focus on tax credits, direct grants, and the renewable portfolio standard (NREL,
2008).

22
The PTC, which has been shown to be the most important governmental
support incentive, had nine different amendments and expirations that caused
enormous
fluctuations in the
installment of
capacity in the wind
energy industry
(AWEA, 2013).
Figure 4 shows the
annual installment
of wind energy in
megawatt from 1997
to the third quarter
of 2013. At the end
of 1999, 2003, and 2012, we see the impact of the expiration of the PTC, which
has been significant every single time. The effects are ranging from drops of 76%
in 2001 and 2004, all the way to drops of 99% in 2013. However, the positive
impacts are as noticeable as the negative ones. The PTC resulted in a tripled
investment between 2007 and 2012 accounting to an annual average of $18
billion (AWEA, 2013). The yearly installment since the Obama election in 2009
was ranging from 5GW all the way to 12GW (AWEA, 2013).
Additionally, the PTC made it possible for manufacturers, including
Siemens, to produce the biggest part of the needed components themselves and
domestically on the U.S. market, which was caused by companies investments
into manufacturing facilities in 44 states, all together supplying 72% of all
turbine components (AWEA, 2013). In comparison to 2006, where more than
77% of all components were imported, the domestic production increased nearly
50% (AWEA, 2013).
On the other hand the PTC is still said to be extremely unpredictable,
which in the end is an enormous burden for the wind energy industry, since
investors, developers, and turbine manufacturers themselves are not able to
foresee the situation in the long term (Brown, 2014). As of December 31. 2013
Figure 4. AWEA, 2014, Federal Production Tax Credit for Wind Energy. https://www.awea.org/Advocacy/Content.aspx?ItemNumber=797
23
the PTC is expired and nobody knows when it is going to be reactivated.
However, there have been different future predictions expecting the PTC to be
renewed. Ron Wyden, a Democrat who chairs the Senate Finance Committee,
submitted a proposal in March 2014, aiming at a renewal of different tax
incentives (Doering, 2014). Although the proposal did not include the PTC, both
Wyden and the officials representing the wind industry, are expecting the
production tax credit to be included (Doering, 2014). Additionally Chuck Grassley,
a supporter of the PTC and Senator, together with bipartisan support from 26
senators and 118 House members are encouraging Congressional leaders to
extend credits helping the creation of jobs and the development of the renewable
energy industry (Doering, 2014). This happened in March 2014, but with
uncertain success, since Republicans, which are aiming at a permanent change in
the country’s tax code, lead the House chamber (Doering, 2014).
6.2.2 ECONOMIC
The next factor of PESTEL that is going to be analyzed is the factor
regarding the economical conditions on the American market that are
surrounding Siemens Wind Power. Before starting it is noteworthy that the
reader from now on will be able to draw parallels between the different sections
of PESTEL. Especially this part is going to relate remarkably to the political
section since governmental intervention is influencing the economical
foundation for the wind industry dramatically. Although some factors that are
going to be analyzed might seem to be repeated, the approaches are different in
their nature.
The financial crisis of 2007 has been of major influence in nearly all
industries (Sikorski, 2011). Still today many countries are suffering due to the
damages the financial crisis caused which resulted in decreased expectations for
the following years (Sikorski, 2011). However, the situation in the U.S. was not as
traumatic and the installed capacity was above manufacturers and economist’s
expectations (AWEA, 2013). One reason for this is that the U.S., like many other
economies as well, are supplying the market with cheap money to keep the

24
economy running. In the U.S. it is the Federal Reserve System (FED) buying
assets such as treasury bonds or mortgage-‐backed securities with newly-‐created
money (Aziz, 2013). To the present, the FED has supplied several trillion of
dollars of liquidity, which not only resulted in a prevention of a crash but even
the stock market rising to new records (Subramanian, 2013).
Although many detractors were predicting the American inflation rate to
increase dramatically with the market being flooded with cheap money, the
inflation rate has shown to stay relative stable while even showing tendencies of
decreases (U.S. Bureau Of Labor Statistics, 2014; Aziz, 2013). During the last two
years the inflation rate was staying relatively stable between 1 and 2 per cent.
According to Milton Friedman (1969), an inflation rate is “healthy” when it stays
between 2 and 3 per cent. This percentage should be taken as a target goal by
federal banks since a too high inflation is for example able to decrease
purchasing power, while on the other hand a negative inflation, called deflation,
might cause decreases in wages etc. (Cogley, 1997).
Next we will examine the supply/demand situation on the American
market for electricity as it relates to the employment rate.
Since the invention of electricity the major sources always have been non-‐
renewable. Today, no country is dominated with supply by renewables and will
be many more decades until this is going to be the case. Also, the U.S. is majorly
supplied by non-‐renewable sources, but as already mentioned, aiming at
increasing the renewables contribution. At its contemporary point the U.S.
produces more energy than it consumes, but on the other hand still lacks to
establish electrical grids in some areas, especially in rural Alaska (AWEA, 2013;
REAP, 2013). In 2014, Obama announced that new investments into American
energy infrastructure are going to be made, which not only is going to extend the
existing grid but also increase its capacity (Holdren, 2014).
The development of wind farms, which exclusively are placed in rural
areas, has shown to contribute to the development of the American
infrastructure for energy and on the other hand was able counteract the process
of urbanization by increasing rural job demand (NREL, 2008). According to an
outlook made by the National Renewable Energy Laboratory, the industry of
25
wind energy is expected to create more than 6.3 million jobs, both direct and
indirect, between 2007 and 2030 (NREL, 2008). What however is important to
note is the fact that many of these jobs are connected to the construction or
manufacturing, which are able to decrease when the demand of new turbines is
low and the market starts to be saturated (NREL, 2008). The potential of job
creation are especially crucial when political decisions are to be made. A major
task of the government is to decrease the unemployment rate and industries that
are favoring job development are often in a much better position than industries
where the level is expected to stay constant.
Siemens Wind Power is, like every other company, affected by this
economical situation and was, during the last years, profiting of the cheap money
on the market. However, what has shown to be of immense influence is the
unpredictability of the FED and its monetary policies. During the last month
there were several speculations about the FED changing their policies, which
every single time resulted in a decline of the American stock index, the Dow
Jones. The effect of the unpredictability of the FED, as with the unpredictability
of the PTC, faces investors with an increased degree of risk and by that decreases
their willingness to invest in long-‐term projects like the development of a wind
farm. However, the fact that it is able to provide jobs and that the market is far
from saturated still favors the industry.
6.2.3 SOCIAL
The social factors of a country are one of the factors showing the biggest
variation of importance in different industries. The wind industry, however, is
said to be remarkable influenced by these conditions and the reason for this is
going to be found in the following section.
Before starting it is important to note that the individual consumer, of the
energy supplied by a wind turbine, is not the direct customer of the turbine in
itself. The wind developer, already introduced earlier, is an important part in the
supply chain when it comes to the social factors inside the market, since they are

26
deciding what turbine and manufacturer to choose and where to place the wind
farm.
The United States of America has a very high demographic variation and
therefore a high variation of attitudes as well. In 2013 Charul Vyas and Dave
Hurst together with Navigant Research, published a consumer survey in regard
to attitudes towards energy and environment. The survey was conducted with
1.084 U.S. adults with a sample balanced by nationality and demography. The
first part of the survey was in regard to different energy sources and vehicles
running on renewable sources. The servants had 6 different possible choices:
Very Favorable, Favorable, Neutral, Don’t Know, Somewhat Unfavorable, and
Strongly Unfavorable. The outcomes, where only “Very Favorable “ and
“Favorable” are included, are represented in figure 5.
Figure 5, Vyas; Hurst, 2013, Energy and Environment Consumer Survey. http://www.navigantresearch.com/wp-‐assets/uploads/2013/12/WP-‐EECS-‐13-‐Navigant-‐Research.pdf
As the figure shows, both the renewable energy sources, solar and wind
were favored by more than 70% of the servants. Wind and solar were
unfavorable for 7% and 6% respectively, with the rest having a neutral or don’t
know attitude towards the renewable energy sources (Vyas & Hurst, 2013).
Solar, which scored a little higher on the favor scale than wind, gives
more consumers, in comparison to wind, the opportunity to install their own
panels, by that producing their own energy and having the freedom of decision.
The customer thereby perceives solar as a more feasible energy source than a
wind turbine, which in itself is too costly for most people. Another factor that is
said to increase peoples favorability towards solar is the fact that the installment
27
of solar panels, at least on rooftops, does not take enormous impact on the
overall impression of the area and neither has impact on the environment
surrounding it (SEIA, 2014). A wind turbine, on the other hand, is much more
noticeable, is subject to more Not In My Backyard (NIMBY) issues, and
additionally has, a perceived impact on the wildlife lying inside the habitats
surrounding its placement (NWCC, 2010).
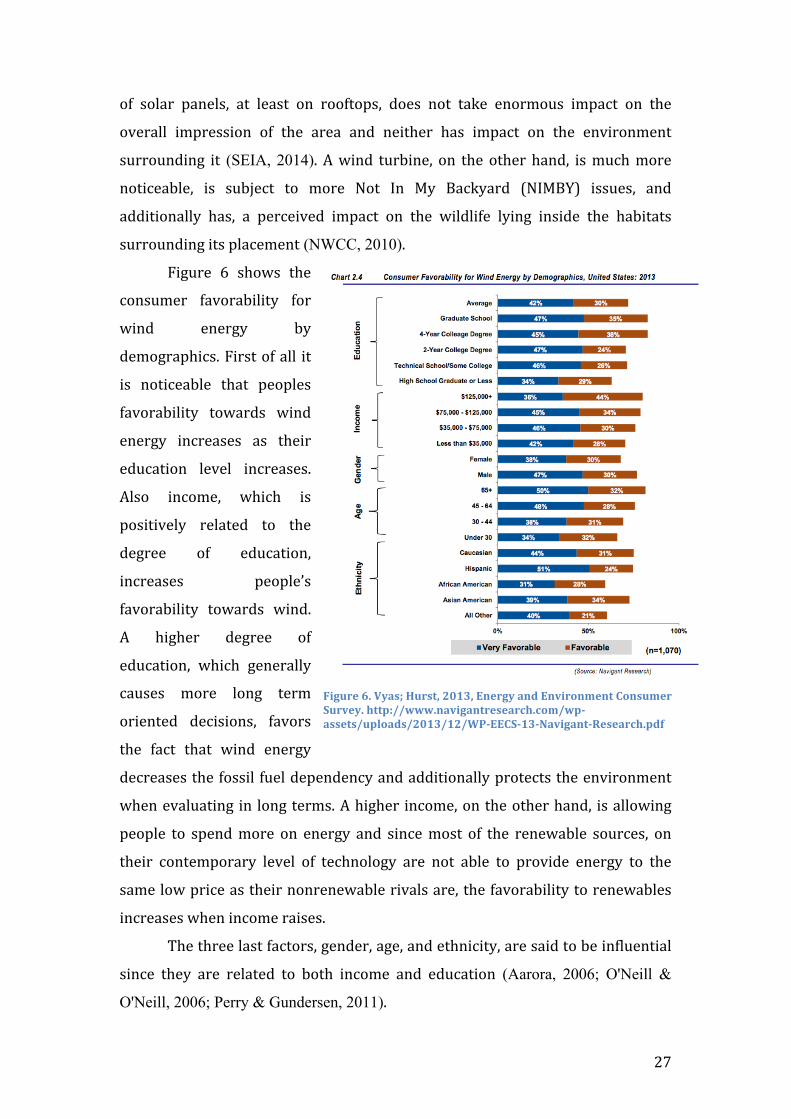
Figure 6 shows the
consumer favorability for
wind energy by
demographics. First of all it
is noticeable that peoples
favorability towards wind
energy increases as their
education level increases.
Also income, which is
positively related to the
degree of education,
increases people’s
favorability towards wind.
A higher degree of
education, which generally
causes more long term
oriented decisions, favors
the fact that wind energy
decreases the fossil fuel dependency and additionally protects the environment
when evaluating in long terms. A higher income, on the other hand, is allowing
people to spend more on energy and since most of the renewable sources, on
their contemporary level of technology are not able to provide energy to the
same low price as their nonrenewable rivals are, the favorability to renewables
increases when income raises.
The three last factors, gender, age, and ethnicity, are said to be influential
since they are related to both income and education (Aarora, 2006; O'Neill &
O'Neill, 2006; Perry & Gundersen, 2011).
Figure 6. Vyas; Hurst, 2013, Energy and Environment Consumer Survey. http://www.navigantresearch.com/wp-‐assets/uploads/2013/12/WP-‐EECS-‐13-‐Navigant-‐Research.pdf
28
Although the American government is trying to reduce the pay inequality
in regard to pay and gender, men are still earning an average of close to 20%
more than their female colleagues (Perry & Gundersen, 2011). Education, on the
other hand, is higher for women; they earn more bachelors and master degrees
but lack behind on doctorates (IES, 2013). The difference in education is in
comparison to the pay/gender relation much smaller and only accounts to less
than a 5 per cent difference (IES, 2013).
Also ethnicity and income, as well as education, are related to each other
(O'Neill & O'Neill, 2006; Aarora, 2006). The average Caucasian man earns on
average $819 dollars a week, which is lower than the Asians who earn $952, but
higher for both African-‐American and Hispanics who earn an average of $621
and $569 respectively (U.S. Deparment Of Labor, 2010; U.S. Census Bureau, 2011).
Between ethnicity and education there is also a correlation to be found (Aarora,
2006). The highest percentage of people having at least a bachelor degree are
found within the Asian race with close to 51%, followed by Caucasians with 32%,
and Black and Hispanic with 19,7% and 13% respectively (Aud & Fox, 2010).
When putting this data in relation to the outcomes in figure 6, we see that, expect
for the Hispanic race, there is a correlation between ethnicity and education
(U.S. Department Of Education, 2010)
The conclusion here, when generalizing, is that the most supportive
groups of people consist of Asian, Hispanic or Caucasian descent, has a high
income, is highly educated, their gender is male, and they are 65+. However, is
important to note that, although dividing by those factors, every group within
each factor had at least favored wind energy with 59%.
In the end, although people generally say they favor wind energy, there
still arise problems when it comes to the actual construction of the wind farm.
Typically a wind farm consists of dozens to hundreds of turbines that are placed
on a land of thousands of acres. The actual farm additionally consists of sub-‐
stations, access roads, and transmission wires that are placed within and around
the farm. Problems that arise are connected to aesthetic and acoustic factors and
opponents tend to become NIMBYs. An attitude the literature calls “not in my
backyard” or shortened NIMBY.
29
By now we know the general U.S. attitude towards wind energy and what
problems might arise. However, since a country's population does not directly
decide on decisions, regarding the development of wind power, other
stakeholders are of importance as well. The U.S government, which is elected
every fourth year, is running their campaign before election to advertise about
their future goal of the country. During the last years, especially the Democratic
Party has pronounced itself very favorable towards wind energy and its
development (Handley, 2012). However, energy is only one of many issues that
are lying inside a parties campaign and it would be false to conclude that every
American voter, who is pro wind, would decide to go with the Democrats.
Also wind developers are extremely affected by people’s attitude towards
wind energy. Being backed by a big community increases the chance of success
for a project, and it is important for the developers to take those factors into
account (Nickell, 2014). When deciding where to build it is therefore not only
important to decide by market and legislative conditions, which are going to be
elaborated later in this analysis, but also the ethnographic characteristics of the
areas and to what extend its inhabitants are supporting wind energy. But as
already mentioned earlier, although most people say they favor wind energy
there are still problems that might arise. To avoid these problems it is important
for developers to include the local community make them aware of the potential
problems and benefits that the wind farm is going to contain before starting
construction.
6.2.4 TECHNOLOGICAL
The technological level of a turbine is crucial for manufacturers success. It
is not for nothing that R&D is one of the biggest costs that manufacturers are
facing. Besides a company’s internal level of technology, the country’s specific
energy infrastructure is of tremendous importance. This part of the analysis is
going to analyze the overall technological level of the wind turbine
manufacturers in the U.S while additionally putting focus on the general
infrastructure of the country.
30
The U.S is a very big country, but in comparison to many others, not that
populated. The population density in the U.S is 84 per one square mile, 609 in
Germany, and 333 in Denmark (U.S. Census Bureau, 2011). Countries facing a
higher density of population, like Germany, often already have established wide-‐
ranging streets and water pipes plus additionally transmission lines, distribution
circuits, and substations, which are crucial for the transport of electricity
(AWEA, 2013). On the other hand, a country having a lower density of
population often has areas where these infrastructures still lack behind or just
are not the capable of dealing with the huge amount of energy a wind farm
produces (Komperda, 2014). Additionally to that, areas that might be able to
handle the amount of energy, with the necessary infrastructure components
already installed, are often extremely quickly occupied by developers (Nickell,
2014).
As a reaction to those concerns in the energy infrastructure, Obama
signed a memorandum for the first Quadrennial Energy Review (QER) (Holdren,
2014). The memorandum, which was signed on January 9th 2014 and was
fulfilling a commitment from the Climate Action Plan, which ensured that the
federal government is continuing to meet economic, market, and security goals
(Holdren, 2014). The QER is going to focus directly on the infrastructure for
energy e.g. transmitting, storing, and delivering (Holdren, 2014). The plan is to
establish 200.000 miles of high-‐voltage transmission lines, 2.2 million miles of
local distribution circuits, 300.000 miles of transmission pipelines, and hundreds
of processing plants and storage facilities for natural gas (Holdren, 2014). Besides
the importance of the transmission lines, distribution circuits, and substations
being present, it is also very important that the quality and technological level, of
the components used, are high since it is able to increase the efficiency
dramatically (Chakrabortty, 2014). When using old or components of bad quality
the losses on the way to the end consumers are able to decrease wind farms
profitability, while additionally decreasing its eco-‐friendliness (Chakrabortty,
2014).
When developing a wind farm it is very important to keep these
infrastructure characteristics in mind. Building a wind farm in a rural area where
31
no streets, transmission lines, or substations are present, the project might
dramatically increase its cost since all of this is to get build.
Looking at the technological level within the suppliers of a wind turbine,
we find different factors that are to be taken into consideration.
What is said to be one of the major disadvantages of wind energy is the
fact that wind is not able to provide energy, independent from other sources,
over longer terms (EIA, 2011). Except for solar, wind is the only source where
the supply cannot be ensured totally, which results in wind energy only being
used in connection with other sources (EIA, 2011).
However, during the last years not only has the size of the turbines
increased but also their overall efficiency. Siemens, or at that point Danregn,
started out with producing a 25 kW onshore turbine in 1980. Today the
company’s turbine portfolio consists of 4 different turbines, 2 onshore and 2
offshore, having a capacity between 2.3 and 6 MW (Siemens, 2013). The turbines
are designed to work under different environmental conditions, the G2, their
smallest onshore turbine with 2.3 MW, being able to handle a wide range of
different wind conditions, the D2, their biggest onshore turbine with 3.2 MW,
working best under strong wind conditions, the G4, their smallest offshore
turbine with 4MW, designed to work under a wide range of offshore conditions,
and the D6, their biggest offshore turbine, working best with strong wind
conditions (Siemens, 2013). Inside each platform of turbine the developers are
able to decide on which rotor blade to make it fit best to the environmental
conditions (Siemens, 2013).
GE-‐Energy, Siemens strongest competitor on the American market, offers
a wider range of onshore turbines but on the other hand only one offshore
turbine. Their on-‐shore product portfolio, which ranges from 1.7 to 3.2 MW,
contains 8 different turbines (GE-Energy, 2014). Their only off-‐shore turbine is a
4.1 MW turbine, and aims, in comparison to others, not to be the biggest but
rather to stand out by its reliability and availability (GE-Energy, 2014).
Although efficiency, capacity and reliability are all very important factors
in themselves, there are other factors that the average person might not think
about. Information provided by a wind developer tells that especially factors
32
regarding sound have shown to take an enormous impact on the actual
realization of a wind farm (Komperda, 2014). Owners of the land, where the wind
farm is to be build, are often going to live close to the turbines and might
therefore be affected by the noise the nacelle and the rotor blades produces. The
noise has shown to impact people’s health and is, although rarely, causing
headaches, insomnia, blurred vision, difficulties in thinking and remembering,
dizziness, or even tinnitus (Ryan, 2014). For a turbine manufacturer it is
therefore important to take these factors into account when developing a new
onshore turbine. Generally, a turbine can be quieter at certain sound frequencies
as the rotor diameter increases since the blades are going to move slower, but
other acoustic frequencies can be louder. On the other hand, larger turbines may
increase the problem of shadow flickers, which are shadows made by the rotor
blades.
The process of R&D of a wind turbine is still going to implement
enormous changes in the next few decades and also the fact that investments
into infrastructure are made are going to change the situation. Already today
different technologies are able to reduce the noise factor of a turbine
tremendously while additionally eliminate shadow flickers, due to another
design of the turbine (Lombardo, 2013). Additionally engineers are trying to
develop a technology that makes it able to store the electricity produced by wind
turbines, which would make it possible for wind to be the only energy source if
the average production would exceed consumption (Bullis, 2014). However, this
technology is still in its first stages and it is going to take some more years to go
into production.
Generally Siemens, although having a smaller portfolio, has positioned
them favorably. Focusing only on a smaller range enables them to profit of
economies of scale while on the other hand directing more resources to a smaller
group of products.
Also the planned infrastructure investment increases the favorability of
wind in general since it decreases costs that are associated to the construction of
a wind farm.
33
6.2.5 ENVIRONMENTAL
Now we are going to take a look on the factors that are, or might be, of
importance for wind energy in regard to the environmental conditions. As
already noted earlier, the word environment used in the PESTEL analysis refers
to the nature of the country or the biotic environment.
Before starting it is important to know how wind energy actually works
since there actually are many factors that are taking influence that most people
do not note.
Wind power is actually a form of solar energy (WED, 2014). Wind is
caused by the uneven heating of the atmosphere made by the sun, by the rotation
of the earth, and additionally the irregularities of the earth’s surface (WED,
2014). Furthermore, the oceans surrounding the areas, the different geographical
terrains/elevation, and the vegetative covers influence wind and its speed
(WED, 2014).
The U.S. is one of the biggest countries worldwide, which results in having
different climate zones. The climate zones are ranging from desert climate in
Arizona and California to subarctic climate in Alaska. Additionally to that, the U.S
is surrounded by the Atlantic and Pacific Ocean. These two factors, both climate
zone and circumvallation of both oceans contribute to U.S. having 7 different air
masses throughout the country.
When developing a wind farm it is necessary to keep these factors in
mind. It is not only important to focus on the average wind level of the specific
areas, but also the overall variation in it. Although turbines, during the last
decades developed impressively, natural disaster still have to be taken into
account. Earthquakes, hurricanes, tornadoes and floods are all able to cause
enormous damages, not only to the turbines themselves, but also to all the
different components that are included in the wind farm (Lawson, 2013). Most
commonly all of these parts are well insured, but the premium increases when
placing the wind farm in an area where these natural disaster are more likely
(Lawson, 2013). The increase in premium is not only affecting the owner of the
34
farm but especially the end consumer since it increases the cost of production
and by that the final price.
So where should developers place wind farms to make the highest profit?
Generally the best wind levels are obtained in the coast and mountain areas plus
additionally the Great Plains ranging from North Dakota all the way to Texas
(AWEA, 2013). According to the American Wind Energy Association the best 3
states for the development of a wind farm, when evaluating by the average wind
level, are North Dakota, Texas and Kansas (AWEA, 2013). In the following part
we are going to look at North Dakota in more detail to see what factors might
influence the decision of where to establish a wind farm.
North Dakota is placed in the northwestern continental area of the U.S.
Being placed in the continental climate zone; North Dakota is characterized as
having cold winters and hot summers and experiences a wide variety of weather
conditions. This area is especially influenced by the continental arctic and
continental polar air masses, which results in having the highest average wind
level of the U.S., with a speed of approx. 11 meters per second (NOAA, 2002).
The National Renewable Energy Laboratory and the Associated Weather
Services calculated the states capacity, when subtracting protected areas, to be
770.000 MW, which is more than all of the U.S. fossil-‐fueled power plants
produce together (NREL, 2014). With this number North Dakota is the 6th biggest
wind resource area in the U.S. (AWEA, 2013).
North Dakota ranks as number 3 when looking at the percentage of
energy supplied by wind (AWEA, 2014). At its contemporary point the state has
a total installment of 995 turbines together producing 1.6 MW which accounts to
approx. 15% of the states total electricity production (AWEA, 2013).
Especially due to the states climate the energy consumption stays high all
year long with air-‐conditions running in the summer and heaters in the winter
times. Per capita the state is placed at the 4th most consuming state in the
country, with an average of 19.8 kWh per person, which is more than 7kWh
higher than the U.S average (CEC, 2011).

35
What is important to note when evaluating the wind capacity of different
areas is that there not only are different methods to calculate these numbers but
also the ongoing development in the industry with bigger and more efficient
turbines being put into production (Söder, 2009). Different countries use
different formulas to calculate the capacity of wind and all of them are giving the
user another result. Factors that are influencing the calculations are the level
above ground where the wind is measured, what technology is used, and what
time of the year and day is measured (Söder, 2009). Using different methods
might make a project much more attractive than using another and it is therefore
crucial for developers to keep this in mind (Söder, 2009). Often using different
methods together the user is able to eliminate errors that are arising in others,
by that giving a more realistic picture (Söder, 2009).
Generally the environmental conditions are more than just good for the
installation of wind turbines. However, it is important to remember that the cost
of building a wind farm is not only connected to the installation of the turbines
but also the total grid (Nickell, 2014). This is one of the reasons why states such
as North Dakota, South Dakota, Wyoming and Montana are not totally covered
with wind farms, since not only demand is too low but also the actual cost of
establishing the grid would go into the billions (Nickell, 2014). However,
generally the environmental conditions may outweigh these other concerns
depending on project specifics.
6.2.6 LEGAL
Numerous legal issues can arise when it comes to the development of a
wind farm. Also this factor is going to deal more directly with the wind
developers instead of the manufacturers, since it is the developers facing and
dealing with the issues. Especially the topic concerning the land and its owners
where the farm is to get build is going to be discussed in more detail.
In the U.S. a wind farm usually stretches over several hundred up to
several thousands of acres and therefore contracts with many different
landowners are to be made (Nickell, 2014). The land is not only going to be used
36
for the turbines themselves but also the electrical grid containing sub-‐stations,
high voltage transmission lines and distribution circuits (Komperda, 2014;
Nickell, 2014). The lease agreement, which is going to be signed by both parties
and usually last for 30 years, is going to address the period of the lease, how
much is be leased, how much is to be paid, how the payment should be made,
what rights the developers and the landowner receives, what the termination
rights are, how the components of the farm are to be insured, and how it works
after the lease agreement expired (Nickell, 2014). Furthermore it is important for
the developers to ensure that there are no easements that are covering that area
where the farm is to get build, since, especially coal and gas companies are able
to exert their easements by that eliminating the developers contracts made with
the landowners (Komperda, 2014; Barry, 2014).
However, besides needing the approval from the landowners, the
developers also needs the local governmental agencies, who control the siting
process, to agree on the project (Nickell, 2014). During the development of a
wind farm, developers usually run into several problems that are causing the
area to shrink little by little (Nickell, 2014). According to Kyle Barry, an attorney
dealing with the development of wind farms said that especially zoning codes are
contemporary facing developers with issues (Barry, 2014). Zoning control is the
division of geographical area (e.g. residential, commercial, agricultural, mining
zone etc. Laws control each zone and only some of the zones are eligible for the
construction of a wind farm typically agricultural. Since the industry of wind
energy, in comparison to others, is relatively young there are new laws executed
on regular basis, which changes the whole legal system for a project. Especially
zoning is affected by this which is caused by the fact that not only more turbines
are installed but also are they getting bigger and bigger. As already mentioned in
the technological factor, especially noise and shadow flickers are causing these
new laws, since they not only are affecting the land owners themselves but also
the local community living close to the turbines.
Since there a many problems a project might run into, developers tend to
sign an option with the landowners before signing the actual lease agreement
(Nickell, 2014). This option is going to ensure the developers of having the
“option” of leasing the land while being able to continue development without

37
the duty to lease the land (Nickell, 2014). When continuing the development,
developers are going to deal with the so-‐called commercial agreements, which
we are going to look at now.
Commercial agreements are agreements such as the turbine purchase
agreement, the warranty, operation and maintenance agreement, and the power
purchase agreement.
The turbine purchase agreement is an agreement, either soft or hard,
between the developers of a wind farm and a turbine manufacturer (Komperda,
2014). Both parties are by the use of a contract ensuring when to pay, how to pay,
when to deliver, how to deliver, who has to install the turbines, who is liable
during the shipping process, and often who has to deal with maintenance and
warranty for the next years.
The cost of the turbines for a whole wind farm goes into the hundreds of
millions, sometimes billions, and the way of financing is to be well considered
(Nickell, 2014). Due to the high cost, the developers, which at that point of a
project usually already are backed by an investor, are passing this part over. It is
now the task of the investor, who might be a utility company or a pension found
etc., to finance the project and to contact a lender if needed (Komperda, 2014).
The reason for investors entering into the agreement might be motivated by tax
benefits connected to the PTC, or the fact that the project is seen as an
reasonable investment (Barry, 2014). When looking for a way of financing the
PPA starts to be of importance since it is securing the energy, produced by the
farm, to be purchased by a utility company (Barry, 2014). When having the PPA,
financing usually becomes easier, since you can ensure your lender that you have
regular cash flows coming in (Barry, 2014). However, the PPA is sometimes hard
to acquire (Nickell, 2014). One factors causing the PPA to be hard to get is the fact
that wind is an intermediate resource, which means that it is not possible to
ensure that the wind level is going to stay constant during the time of agreement,
and because wind still is more expensive than other energy sources and
especially than the energy supplied by its nonrenewable rivals (Barry, 2014;
Nickell, 2014). Another factors is related to the grid owner, who might force you
to decrease your output if the grid would be overloaded when the total amount
38
of energy would be injected, which would result in your purchaser not getting
the total possible output (Nickell, 2014). However, there are also factors
increasing the chance for a wind farm to receive a PPA. One factors is the
renewable portfolio standard, already elaborated earlier, which however is
facing increasing competition form the stock market where utility companies
might decide to invest in options on renewables (Barry, 2014).
The issues discussed above are only a few of many. It is essential, not only
for the developers but for the manufacturers as well, to keep in mind where
problems might arise since they are able to cancel a whole project. Especially the
fact that new laws, which might have an enormous impact on the industry, might
be executed on a regular basis needs attention by both the developers and the
manufacturers.
7. PORTERS FIVE FORCES
Porters Five Forces is a framework developed in 1980 by Michael Porter,
a professor in strategic management. Porter, who is said to be one of the
founding fathers of strategic management, wrote more then 17 books and
developed several different analytical tools for corporate strategy (Kotler et al.,
2009). However, one of the most popular tools, not only around managers but
also around business schools all around the world, is the five forces framework
(Hollensen, 2011). The framework is to help a company to evaluate both the
potential profitability inside the industry and on the other hand its own
competitive position (Hollensen, 2011).
When using the framework the company analysis five different factors
that are to evaluate the nature of competitiveness in a given industry (Hollensen,
2011; Kotler et al., 2009). These five different forces are elaborated in the
following part.
The first force we are going to look at is “Rivalry Among Competing
Firms”. This force is usually said to be the most influential one of all the five
different forces (Kotler et al., 2009). Rivalry Among Competing Firms is the
39
rivalry between companies offering a product that is able to provide the same
basic feature e.g. a turbine by Vestas or Siemens (Kotler et al., 2009).
For the firm to have a competitive advantage, they might implement
different strategies. Some of the most used strategies here are lowering prices,
enhancing quality, providing additional services, increase warranty coverage, or
adding new features (Kotler et al., 2009; Hollensen, 2011). In general, the rivalry
increases as soon as the number of competitors increases, since all of them are
aiming at increasing profitability and sales (Kotler et al., 2009). However, not only
the number of competitors has shown to take impact on the degree of rivalry in
the industry, also the size and capability of the competing firms, changes of
market conditions such as demand declines, a wide range of substitutes, low
entry barriers, generally high fixed costs in the industry, and leaving barriers are
high, have all shown to increase the intensity of rivalry (Hollensen, 2011).
Another factor that had tremendous influence on the competition within
the same industry is the modern way of information access. Since the Internet,
everybody is able to gather information not only about a product in general but
also to compare prices between several retailers. This new way of information
access tremendously increased competition and is extremely favorable for the
end customer.
The second force we are going to look at is the “Potential Entry of New
Competitors”. As soon as the entry barriers into an industry are low, it increases
the overall intensity of competitiveness (Hollensen, 2011). Mostly barriers to
enter an industry are connected to factors such as the level of technology and
know-‐how that is needed, the experience that other firms in the industry are
having, the loyalty customers have to their preferred brand, the capital that is
required to enter, the development of distribution that is needed to deal out the
product, the degree to which patents cover specific features of the products, the
general access to raw materials that are needed, and governmental regulatory
like tariffs or restrictions etc. (Kotler et al., 2009).
However, it sometimes happens, although entry barriers might be high,
that new companies are entering the industry with products that might be
cheaper, have a higher quality etc., which might be caused by an innovation that
40
the company discovered or a big company having a lot of resources that is able to
profit of economies of scale (Hollensen, 2011). Because things like that might
happen, it is always crucial that firms within the industry monitor the market
and are able to react accordingly to threats like this.
The third force we are going to look at is “The Threat Of Substitute
Products”. A substitute is a product or a service that is going to provide the end
used with closely the same feature (Hollensen, 2011). The car industry faces
substitutes such as motorcycles, public transports, walking or biking etc.
Generally most products are facing different substitutes that the end consumer
might switch to. Substituting a product is often caused by price sensitivity, which
means that consumers are switching products as soon as price passes a certain
level (Hollensen, 2011). However, there are several factors influencing the
decision of substituting a product, elements such as technological/innovative
advancement, product image, general design, product-‐connected services etc.
(Hollensen, 2011).
The pressure in the industry increases when the switching cost for the
customer is relatively low and when the substitutes price decreases (Kotler et al.,
2009). The cost of switching varies tremendously, and while switching from a
Snickers candy bar to a Mars candy bar might be generally cheap, the cost of
switching from a bike to a car might be extremely expensive. For a company to
estimate the threat that a substitute product might have, it is important to
constantly monitor their rivals holding a potential substitute.
The next force getting elaborated in more detail is “The Bargaining Power
of Suppliers”. The bargaining power of suppliers in an industry is said to be
higher when there is a small number of suppliers, when there are no substitutes,
when the switching cost of raw material or components is high, or when the
market is unimportant to the suppliers (Hollensen, 2011). Mostly it is both in the
interest of the supplier and the producer to build a loyal long-‐term relationship,
which is securing high quality, reasonable prices, continues development of the
relation, and saving both parties from long and costly inventories (Hollensen,
2011).
41
Companies that have been very successful in their industry, often tend to
make a backward vertical integration, which means that they are buying their
own suppliers (Kotler et al., 2009). Suppliers that are too expensive, not reliable,
or just not able to meet the company’s needs often cause this action (Kotler et al.,
2009).
However, more common is the use of external suppliers. This is especially
true for small or medium sized companies, since the demand usually is smaller
than for their big competitors (Kotler et al., 2009). Big suppliers are able to profit
from economies of scale by that having the possibility to offer their products at a
relatively low price (Hollensen, 2011).
Companies that are not having an ownership in their own suppliers, often
tend to have strategic partnerships with their suppliers. Those partnerships
often allow both parts to reduce cost associated with logistics and inventory with
strategies such as just in time delivery (Hollensen, 2011). Additionally to that
partnerships are able to increase the speed of availability of next generation
components, increase quality of the supplied goods, and in general decrease cost
in several areas that both companies otherwise might be facing (Hollensen, 2011).
The last force in the Porters Five Forces framework is “The Bargaining
Power of Consumers”. There are said to be different characteristics that make
the bargaining power of consumers rise namely: high concentration of
consumers, big consumer group, consumers are buying in large
amounts/volumes, or many suppliers (Hollensen, 2011). For companies to stay
competitive with their rivals, they often tend to offer extras such as extended
warranties or after purchase services (Kotler et al., 2009). By offering extras, like
the one just mentioned, companies want to increase a consumer’s loyalty to the
brand, by that increasing the chance of buying their products again (Hollensen,
2011). Additionally to the factors above that are influencing the bargaining
power of consumers, also product characteristics are taking an enormous
influence. Standardized and undifferentiated products, where substitution is
easy, often face the consumer with a higher degree of bargaining power
(Hollensen, 2011). Furthermore the consumers discretion in whether and when
they purchase the products, increases the pressures on the selling company since
42
inventory cost often are of substantial influence in their balance sheets. Like in
the first force as well, also this force is has shown to be of more and more
importance with the modern exchange of information. Since customers are able
to retrieve information, in regard to price, product characteristics etc., they are
able to compare on an everyday basis by that increasing the chance of switching
to another brand or a substitute product.
7.1 CRITIQUE
The Porters Five Forces framework is like every other strategy tool not
perfect. Although it by many of its proponents is characterized as one of the most
powerful tools for the analysis the business environment it still has its
limitations and detractors (Stonehouse & Snowdon, 2007).
One of the critique points is in regard to the unit of analysis, which in
Porters framework is the industry rather than the individual firm (Rumelt, 1991).
The reason for this being a bad thing, according to Rumelt (1991), is caused by
the fact that every company is different in its nature, which results in every
company facing different factors that are to be analyzed (Rumelt, 1991). Rumelt
(1991) argues that firm’s specific factors are way more important than industry
factors when it comes to evaluating potential profitability (Rumelt, 1991).
Another critique point is connected to the fact that the Porters Five
Forces framework implies that that every force applies equally to every firm in a
given industry. Detractors on the other hand see every force affecting every
company differently, at least to some extend (Stonehouse & Snowdon, 2007).
According to them, the Porters framework ignores reality in regard to for
example a company’s size (Stonehouse & Snowdon, 2007).
Additionally, and that is especially interesting for our analysis, is the fact
that the Porters framework is said to be static (Stonehouse & Snowdon, 2007).
Since environmental conditions in most industries change regularly, using a
static tool is only able to evaluate for a short term (Stonehouse & Snowdon, 2007).

43
7.2 PORTERS FIVE FORCES SIEMENS WIND POWER
Since we now know the most noteworthy characteristics of the Porters
Five Forces framework, we are able to use the theory in practice.
7.2.1 RIVALRY AMONG COMPETING FIRMS
The energy industry, as already mentioned in the description of the
American energy market, is supplied by several different sources. The actual
product that we are looking at is electricity. This part of the Porters Five Forces
Framework is going to look at the rivalry only within the wind industry.
Although the product features of electricity are the same, other sources are going
to be analyzed in the part of “The Threats of Substitute Products”. This is done
since the process of producing the electricity is branding the product to a
significant degree.
Figure 7. AWEA, 18.07.2013, U.S. Wind Energy Industry Manufacturing and Supply Chain. http://www.awea.org/Resources/Content.aspx?ItemNumber=4609
Figure 7 shows the
seven biggest turbine
manufacturers on the
American market. GE Energy,
an American company, has
been the market leader since
many years, and had an
installment of more than 5 GW
in 2012, which is equal to a
market share of 38% (AWEA,
2013). GE Energy is followed by
Siemens Wind Power, which
had a market share of 20%
(AWEA, 2013). Vestas, a Danish
Figure 8. SNL Energy, 2013, Top 10 Turbine Manufacturers. http://www.worldofwindenergy.com/wind_resources/research-‐and-‐analysis/snl_energy_reports_top_10_turbine_manufacturers.html
44
manufacturer and the world’s largest supplier of wind turbines, has been on the
third place with a total market share of 14% (AWEA, 2013). Since 2010 both GE-‐
energy and Vestas have lost 5% of their market share. On the other hand both
Siemens and Gemensa were able to gain market share, with 5% and 2%
respectively. To eliminate confusion, figure 8 shows the projected market share
while the data from AWEA were able to provide the actual installment data.
However, what is noteworthy in the development of manufacturers on the U.S
market is that there only have been 5 in 2005 installing more than 1 MW, while
having more than 25 in 2012 (AWEA, 2013).
The rapid growth of the market and the governmental incentives to
support production and development also captured the attention of other
manufacturers and the market is starting to receive more and more suppliers.
The increase in competition leads the manufacturers to even more consider what
strategy to follow.
As we remember from the technological factor of PESTEL, GE-‐Energy is
offering a broad range of turbines that generally have a lower capacity than the
turbines manufactured by their competitors. One of the reasons that GE-‐Energy
is able to offer a wider range of turbines is the fact that they originate from the
American market. In comparison to the other big suppliers, GE has through its
whole history been active in the U.S., which allowed the company to establish
facilities all around America (GE-Energy, 2014). This allows GE to safe huge
amounts of costs related to logistics, which is a tremendous part of their
competitors cost. Another noteworthy advantage is the fact that GE, as a result of
its descent, was able to gain a lot of experience on the domestic market, by that
being able to take more variables into account when deciding on strategy.
However, GE-‐Energy´s focus, which during its history nearly exclusively was
directed towards the U.S., causes the company to lack behind on the
international market and only leaves the U.S. as their main pillar.
Vestas, who is the world’s biggest turbine manufacturer, is placed third
on the American market. Like GE also Vestas has a quit broad product portfolio,
which at its current stage consists of ten different turbines. The turbines capacity
ranges from 1.8 MW to 3.3 MW, which is extremely close to the capacity of GE´s
turbines. In contrast to both GE and Siemens, Vestas is exclusively focusing on
45
the wind industry, which on the one hand excludes Vestas from the synergy
between different industries that GE and Siemens experience, but on the other
hand neither can be affected negatively by another business branch and allows
the company to totally focus on one industry. However, also Vestas, in order to
be more competitive, invested directly into the American market and opened
different facilities that are dealing with manufacturing of tower, nacelle and
blades, research & development, maintenance, and services (Vestas, 2013).
Together their manufacturing plants are able to supply approx. 90% of the
components that are required to assemble the final turbine (Vestas, 2013). Being
able to supply the major part with the domestic production not only saves Vestas
shipping costs, which decreases the overall cost of the turbine, but also cuts the
delivery time to the customer.
Siemens Wind Power offers, in comparison to GE and Vestas, a smaller
range of products but on the other hand with a bigger capacity. Although
Siemens has invested heavily into the American market, they tend to stick to a
rather small but powerful product portfolio. Having a smaller product portfolio
does not need to be a bad thing in itself since Siemens is able to profit from
economies of scale to higher degree. In comparison to GE, who produces most of
its components domestically, Siemens nacelle assembling facility in the U.S.
manufacturers only one nacelle which is to be used with a 2.3 MW turbine
(Siemens, 2013). This, although they are able to supply most of their blades
domestically, results in increased slack time and huge costs that are associated
with logistics since many of the parts are to be shipped from Siemens production
facilities in Denmark. However, one of the main advantages that the company is
having is the fact that they are the oldest turbine manufacturer worldwide. This
not only results in Siemens being extremely experienced but also contributed to
the many patents the company is holding (Siemens, 2013). Another advantage the
company has is that they not solely are dependent on the American market. At its
contemporary point the company 4th biggest supplier of turbines worldwide and
is active in Asia, Europa, America, Africa, and Australia.
46
What is interesting in the industry of wind energy is the fact that usually
companies that are charging premium prices and are producing high-‐end
turbines are succeeding.
The competition that at least at its contemporary point is between the big
suppliers rises especially through the fact that many of them have invested a lot
into the market, which increases the exit barriers since none of the
manufacturers are willing to give up their huge investments. However, on the
other hand the rivalry decreases, at least for Siemens since their product
portfolio to high degree is able to differentiate itself.
7.2.2 POTENTIAL ENTRY OF NEW COMPETITORS
Generally the industry of turbine manufacturers is said not to face
noteworthy threats by the potential entry of new competitors.
At its current stage the industry is lead by European and American
manufacturers, which were the first to start in the industry by that possessing
the highest amount of experience and know how. Although Suzlon, an Indian
company, has shown to compete generally well, there is still no Chinese or
Korean manufacturer that made it under the top five manufacturers on the
American market (AWEA, 2013).
The main causes for the Asian companies having trouble to enter the
market is their lack of experience since most of them are relatively new to the
industry (Trahish, 2012). Additionally the American market shows to have
several different entry barriers a new competitor has to overcome. First of all an
entry would need enormous investments to be competitive. Companies entering
the market need to have a turbine that is able to compete with the domestic
supply and usually domestic manufacturing facilities are to be established to,
first, reduce costs associated with logistics and, second, to increase the delivery
speed. Furthermore, entering companies need to be sure that no patents on the
market are violated and that their turbine design is allowed to operate in the
market.
However, although the risk of new entrants is low, there still might be
companies that are able to enter. It might be a company that is to able find a
47
niche in the market or a big company that is able to raise the needed investment.
Especially Samsung, who started its wind business in 2010, might become a
potential competitor. Samsung is ranked no. 14 in the Fortune 500 list, with a
jump of 6 places from 2012 where the company was number 20. Also if the
company would not able to invent their own competitive technology, they still
would be able to acquire a smaller wind turbine manufacturer. Acquisitions have
been the basis for both Siemens and GE, which demonstrated that the strategy
might work.
7.2.3 THREAT OF SUBSTITUTES
When analyzing the threat of substitutes, we first have to define what
product actually would be a substitute for a wind farm/turbine. This depends
tremendously on the potential customer and if the renewable characteristic is of
major influence. When this is the case, the only substitutes are other renewable
sources like solar, hydro, and geothermal, with biomass taking a position in-‐
between, since it is carbon dioxide neutral. However, if the resource is not of
concern then the non-‐renewable sources are able to be a substitute. In addition,
the fact that many investors, especially big companies, are looking for an
investment only, we have other substitutes showing up that are able to be used
as investment e.g. stocks, bonds, funds, options etc.
During this analysis we assume that the only customers are the potential
purchasers of the actual wind farm. This is due to the fact that wind developers
although they hypothetically are able to substitute, usually lack knowledge
inside other energy industries. Additionally to that we assume that the only
substitutes are other renewable sources. If we would take the two other
scenarios into account, and especially the one where the wind farm is seen as an
investment only, we could continue this analysis forever.
So, besides renewability, what other factors are this analysis going to take
into account? To find an answer on the question “The Threat of Substitutes” we
need first of all to understand how the different sources are functioning
therefore we need to keep in mind the information that is provided in section 4.2
and 4.3.
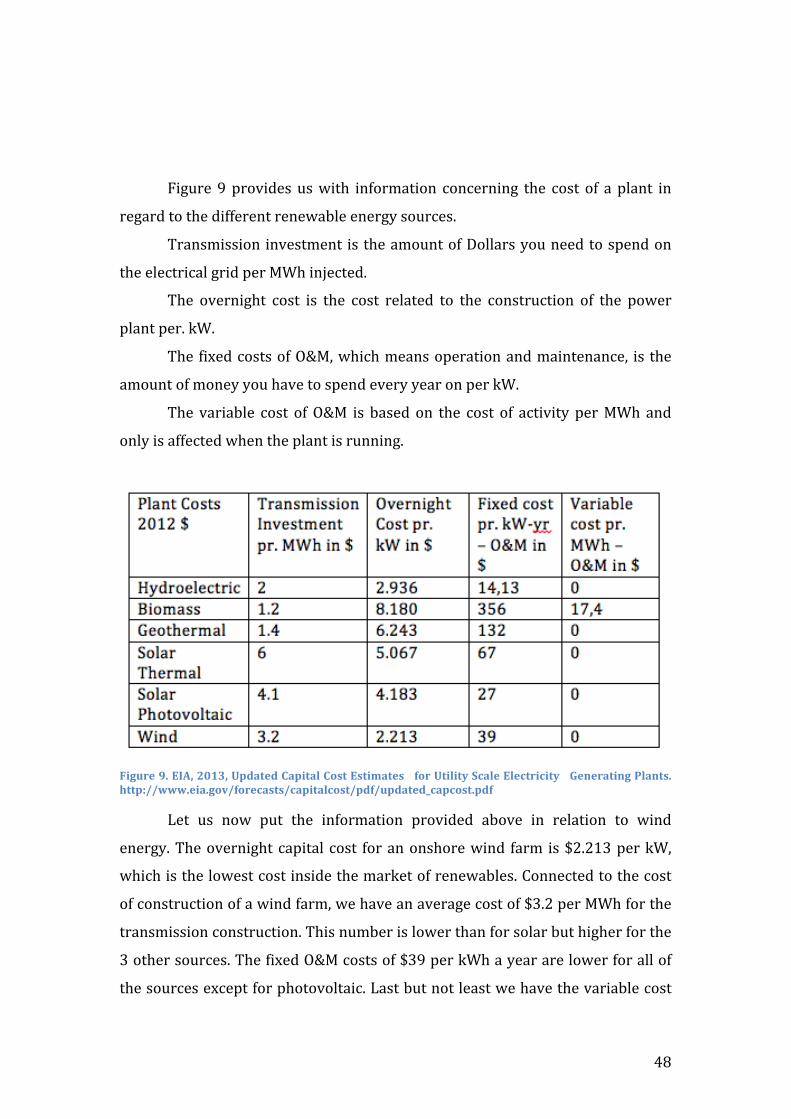
48
Figure 9 provides us with information concerning the cost of a plant in
regard to the different renewable energy sources.
Transmission investment is the amount of Dollars you need to spend on
the electrical grid per MWh injected.
The overnight cost is the cost related to the construction of the power
plant per. kW.
The fixed costs of O&M, which means operation and maintenance, is the
amount of money you have to spend every year on per kW.
The variable cost of O&M is based on the cost of activity per MWh and
only is affected when the plant is running.
Figure 9. EIA, 2013, Updated Capital Cost Estimates for Utility Scale Electricity Generating Plants. http://www.eia.gov/forecasts/capitalcost/pdf/updated_capcost.pdf
Let us now put the information provided above in relation to wind
energy. The overnight capital cost for an onshore wind farm is $2.213 per kW,
which is the lowest cost inside the market of renewables. Connected to the cost
of construction of a wind farm, we have an average cost of $3.2 per MWh for the
transmission construction. This number is lower than for solar but higher for the
3 other sources. The fixed O&M costs of $39 per kWh a year are lower for all of
the sources except for photovoltaic. Last but not least we have the variable cost
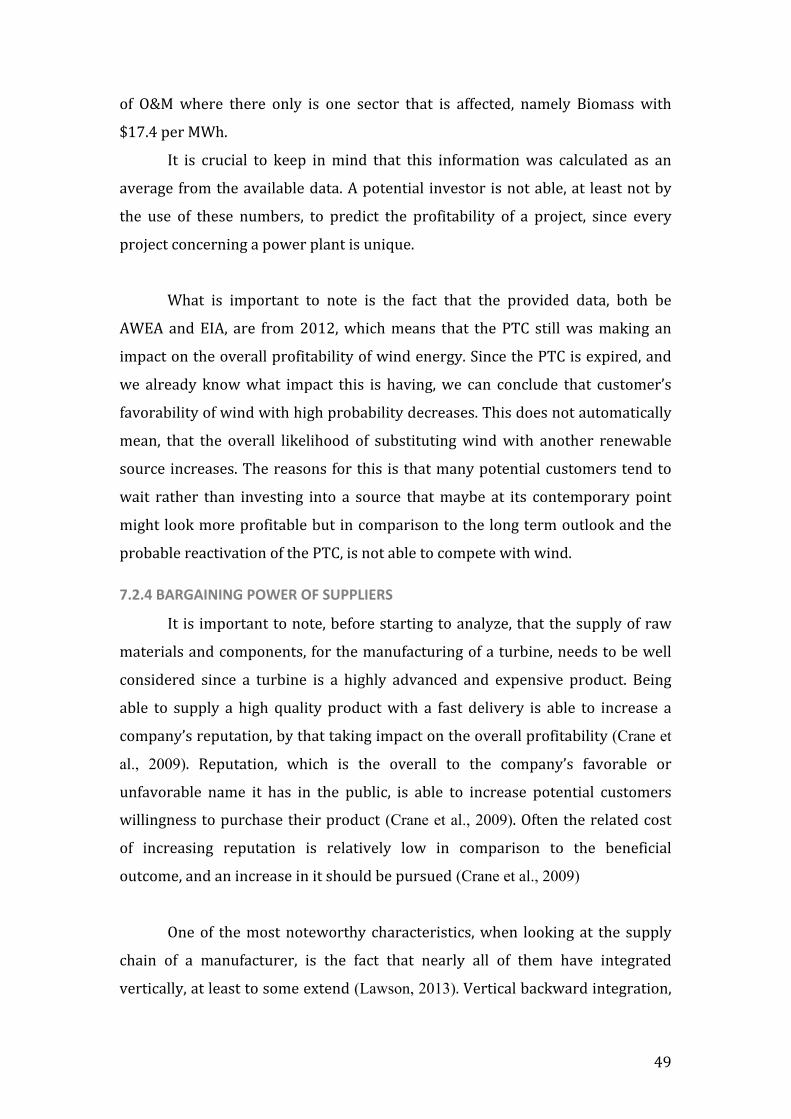
49
of O&M where there only is one sector that is affected, namely Biomass with
$17.4 per MWh.
It is crucial to keep in mind that this information was calculated as an
average from the available data. A potential investor is not able, at least not by
the use of these numbers, to predict the profitability of a project, since every
project concerning a power plant is unique.
What is important to note is the fact that the provided data, both be
AWEA and EIA, are from 2012, which means that the PTC still was making an
impact on the overall profitability of wind energy. Since the PTC is expired, and
we already know what impact this is having, we can conclude that customer’s
favorability of wind with high probability decreases. This does not automatically
mean, that the overall likelihood of substituting wind with another renewable
source increases. The reasons for this is that many potential customers tend to
wait rather than investing into a source that maybe at its contemporary point
might look more profitable but in comparison to the long term outlook and the
probable reactivation of the PTC, is not able to compete with wind.
7.2.4 BARGAINING POWER OF SUPPLIERS
It is important to note, before starting to analyze, that the supply of raw
materials and components, for the manufacturing of a turbine, needs to be well
considered since a turbine is a highly advanced and expensive product. Being
able to supply a high quality product with a fast delivery is able to increase a
company’s reputation, by that taking impact on the overall profitability (Crane et
al., 2009). Reputation, which is the overall to the company’s favorable or
unfavorable name it has in the public, is able to increase potential customers
willingness to purchase their product (Crane et al., 2009). Often the related cost
of increasing reputation is relatively low in comparison to the beneficial
outcome, and an increase in it should be pursued (Crane et al., 2009)
One of the most noteworthy characteristics, when looking at the supply
chain of a manufacturer, is the fact that nearly all of them have integrated
vertically, at least to some extend (Lawson, 2013). Vertical backward integration,
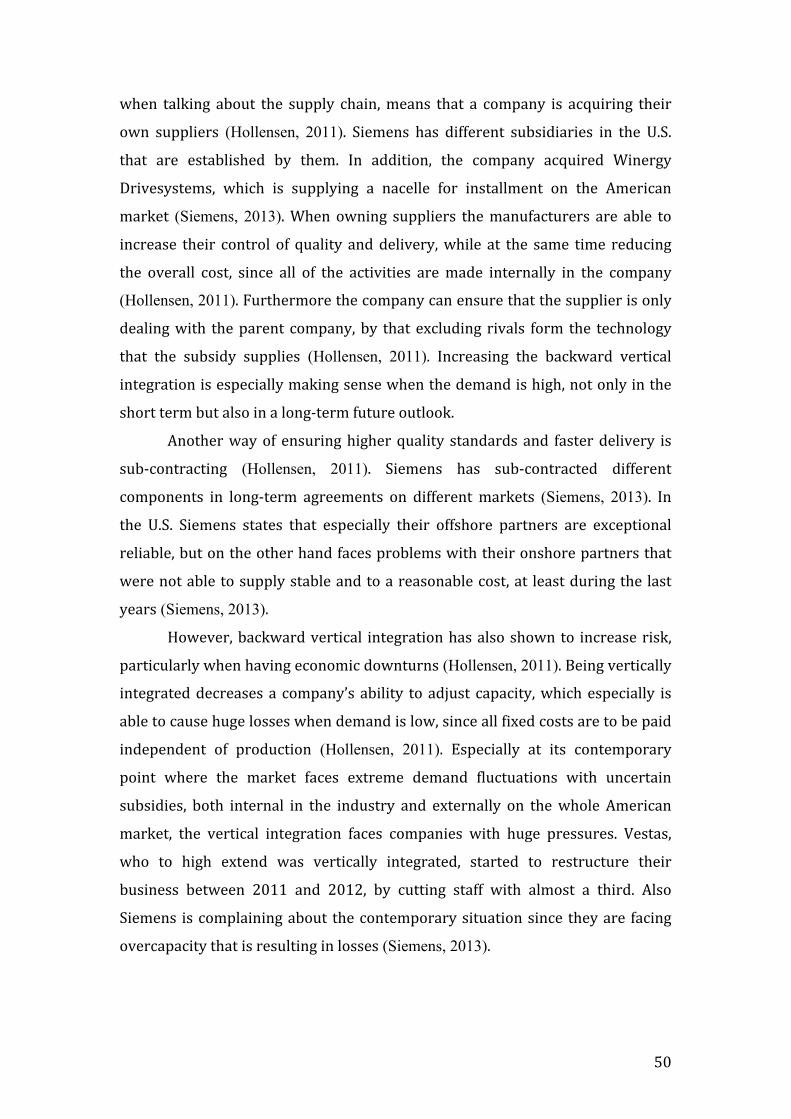
50
when talking about the supply chain, means that a company is acquiring their
own suppliers (Hollensen, 2011). Siemens has different subsidiaries in the U.S.
that are established by them. In addition, the company acquired Winergy
Drivesystems, which is supplying a nacelle for installment on the American
market (Siemens, 2013). When owning suppliers the manufacturers are able to
increase their control of quality and delivery, while at the same time reducing
the overall cost, since all of the activities are made internally in the company
(Hollensen, 2011). Furthermore the company can ensure that the supplier is only
dealing with the parent company, by that excluding rivals form the technology
that the subsidy supplies (Hollensen, 2011). Increasing the backward vertical
integration is especially making sense when the demand is high, not only in the
short term but also in a long-‐term future outlook.
Another way of ensuring higher quality standards and faster delivery is
sub-‐contracting (Hollensen, 2011). Siemens has sub-‐contracted different
components in long-‐term agreements on different markets (Siemens, 2013). In
the U.S. Siemens states that especially their offshore partners are exceptional
reliable, but on the other hand faces problems with their onshore partners that
were not able to supply stable and to a reasonable cost, at least during the last
years (Siemens, 2013).
However, backward vertical integration has also shown to increase risk,
particularly when having economic downturns (Hollensen, 2011). Being vertically
integrated decreases a company’s ability to adjust capacity, which especially is
able to cause huge losses when demand is low, since all fixed costs are to be paid
independent of production (Hollensen, 2011). Especially at its contemporary
point where the market faces extreme demand fluctuations with uncertain
subsidies, both internal in the industry and externally on the whole American
market, the vertical integration faces companies with huge pressures. Vestas,
who to high extend was vertically integrated, started to restructure their
business between 2011 and 2012, by cutting staff with almost a third. Also
Siemens is complaining about the contemporary situation since they are facing
overcapacity that is resulting in losses (Siemens, 2013).
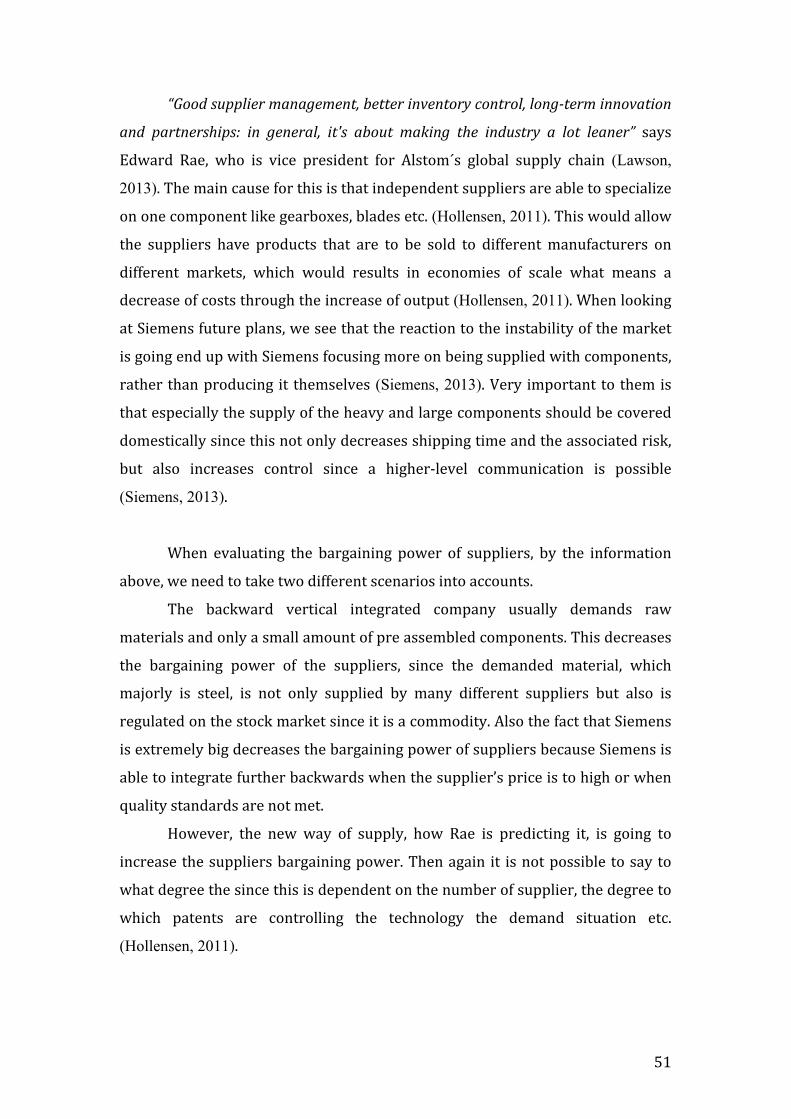
51
“Good supplier management, better inventory control, long-‐term innovation
and partnerships: in general, it's about making the industry a lot leaner” says
Edward Rae, who is vice president for Alstom´s global supply chain (Lawson,
2013). The main cause for this is that independent suppliers are able to specialize
on one component like gearboxes, blades etc. (Hollensen, 2011). This would allow
the suppliers have products that are to be sold to different manufacturers on
different markets, which would results in economies of scale what means a
decrease of costs through the increase of output (Hollensen, 2011). When looking
at Siemens future plans, we see that the reaction to the instability of the market
is going end up with Siemens focusing more on being supplied with components,
rather than producing it themselves (Siemens, 2013). Very important to them is
that especially the supply of the heavy and large components should be covered
domestically since this not only decreases shipping time and the associated risk,
but also increases control since a higher-‐level communication is possible
(Siemens, 2013).
When evaluating the bargaining power of suppliers, by the information
above, we need to take two different scenarios into accounts.
The backward vertical integrated company usually demands raw
materials and only a small amount of pre assembled components. This decreases
the bargaining power of the suppliers, since the demanded material, which
majorly is steel, is not only supplied by many different suppliers but also is
regulated on the stock market since it is a commodity. Also the fact that Siemens
is extremely big decreases the bargaining power of suppliers because Siemens is
able to integrate further backwards when the supplier’s price is to high or when
quality standards are not met.
However, the new way of supply, how Rae is predicting it, is going to
increase the suppliers bargaining power. Then again it is not possible to say to
what degree the since this is dependent on the number of supplier, the degree to
which patents are controlling the technology the demand situation etc.
(Hollensen, 2011).
52
7.2.5 BARGAINING POWER OF CONSUMERS
In comparison to many other products, the bargaining power of
customers is a little more complicated in the wind industry. This is caused by the
fact there are two buyers that are of concern, first it is the developer of the wind
farm and, second, the buyer of the actual project. This part of the analysis is
going to focus on the buyers of the actual turbines or better the wind farm.
Due to the large size of a typical American wind farm today, the number of
potential buyers has decreased dramatically. During the last years the political
situation has tremendously influenced the attractiveness, of a wind farm, since it
was supported by different subsidies. Usually a wind farm is purchased by either
a utility companies, a local government, or a pension fund. However there are
other investors like big companies that are investing into wind energy, which not
rarely is caused by tax benefits related to the investment (Nickell, 2014).
In comparison to many other industries, customers of a wind farm in a
different way care about price, which is caused by the fact that the purchased
product is going to generate revenue in itself. What is important for investors is
that the farm is equipped with turbines that are high in capacity, that the grid is
connected properly, that the efficiency is high, that the technology used is
reliable, that demand for the electricity is on hand etc. All of these factors then
are related to the farms cost and its profitability is calculated.
Project developers, which usually are the part of the supply chain
between the manufacturer and the customer, have to take customer into
account. When developing a wind farm the developer usually first choose where
to build and afterwards what turbine to use. Since every geographical area, at
least to some extent, is unique, there usually only is one turbine that fits best.
Preferable than lowering the sights of the project, the developer is going with the
one turbine that showing the best characteristics for his project and allows the
highest marginal return.
All this of course decreases the bargaining power of the buyer. However it
is noteworthy that, in comparison to an everyday product, the buyer is
constantly calculating on the profitability of the project. This results in the
53
turbine manufacturers to adjust prices to stay within a level where the average
project is able to make enough profit out of the chosen turbines. It is however
not possible for manufacturers to predict a projects cost since they are related to
many different factors e.g. energy infrastructure, governmental support, wind
level etc.
8. SWOT ANALYSIS
The SWOT analysis has a long history in the literature of strategy, ranging
all the way back to the 1960s where it was invented by Albert Humphrey, a
former American business and management consultant. The analysis was and is
to evaluate internal and external factors after 4 different criteria, namely:
Strengths, Weaknesses, Opportunities, and Threats (Pickton & Wright, 1998;
Piercy & Giles, 1989; Kotler et al., 2009). Although environmental scanning tools
are often criticized for focusing too much on external factors, both Strengths,
which is determining the organizations strong points, and Weaknesses, which is
determining the organizations frailties, are internal factors, which means that
they are used to analyze within the organization (Lee et al., 2000; Piercy & Giles,
1989). Opportunities, which are the organizations future or contemporary
openings, and Threats, which are the potential intimidations the organization is
facing, are external factors that are to analyze the environmental settings
surrounding the organization (Lee et al., 2000; Kotler et al., 2009). It is important
to note that both internal factors are within the control of the organization;
factors that might be included here are internal financing, marketing, accounting
etc. (Lee et al., 2000). The external factors are, in contrast to the internal factors,
not controllable by the organization; areas that are included in the external
factors often relate to political factors, technology, economical factors,
competition etc. (Lee et al., 2000; Piercy & Giles, 1989).
The basic idea behind the analysis is to assist practicing managers or
businessmen, in the strategic management planning process, and since its
invention it has done so relatively good (Pickton & Wright, 1998; Kotler et al.,
2009). One of the most praised characteristics of the SWOT analysis is its

54
simplicity and the way it makes the user focus on the key factors/issues that
might be of importance for the organizations development. According to
Wehrich (1982), the SWOT can either be used at its whole or the user might
build a combination of two factors (Lee et al., 2000). The following SWOT analysis
for Siemens in the American wind industry is going to use the SWOT analysis in
its totality, since the goal is to obtain an overall picture of their current position.
8.1 CRITIQUE
Besides having its proponents the SWOT analysis also has its detractors.
During its history the SWOT analysis has severely been criticized for being a
conventional and sole tool for formulating a company’s strategy (Kotler et al.,
2009). According to Hill and Westbrook (1997) the SWOT tool is often so
misleading that it should be scrapped totally. (Hill & Westbrock, 1997)
Although SWOT is loved for its simplicity it as the same time is one of its
major critique points. Detractors say that, when using SWOT, the user tends to
oversimplify the issues a company is facing and at the same time lacks to allocate
the importance and level of influence that each finding in the analysis has (Hill &
Westbrock, 1997). This often leads to a conclusion where the user sees the weak
strengths and strong weaknesses as being balanced, with the same situation
often happening for opportunities and threats.
Another question is whether the external factors can be categorized as
favorable or unfavorable only? According to Erhard Valentin (2005) this should
be acknowledged by the SWOT analysis since user often tend to run into this
very tricky question (Valentin, 2005).
Generally detractors say that the SWOT analysis needs to include more
guidelines, limitations, and criteria for prioritizing (Mintzberg, 1994; Valentin,
2005). Especially lacks on how to use a finished SWOT are acknowledged by
different disparagers. An example here would be how companies should deal
with the opportunities found and how an appropriate decision about which
opportunity to pursue is made (Hill & Westbrock, 1997).
55
8.2 SWOT ANALYSIS SIEMENS WIND POWER
Now we are going to use SWOT to analyzes Siemens Wind Powers
environment on the North American market.
The analysis is additionally summing up on many of the points that were
analyzed in both the PESTEL and the Porters Five Forces analysis, resulting in a
shortened conclusion of this paper. Therefore we are assuming that the reader
keeps the information, provided above, in mind while reading the SWOT
analysis.
8.2.1 STRENGTH
When evaluating the strength of Siemens Wind Power it is important to
keep in mind that the company is part of Siemens, which is one of richest
companies worldwide. Additionally it is important to remember that wind
energy in itself is extremely favored by the community, which is backing the
development in comparison to other nonrenewable sources.
Siemens diversified business and the fact that the company is operating
not only in many segments but in many geographical markets as well, gives them
the advantage of interconnecting their businesses with each other. Market
entrants are often easier for companies that already have entered the market in
one industry, since both market knowledge was gained and relationships were
made.
Also the fact that Siemens demand of raw materials or components is
sometimes shared with different of their industries, makes them able to exploit
supplier relationships that are gained in one segment to be used in another
(Senn, 2006). Additionally, and that is one of the most important influences from
the mother company, is the fact that Siemens Wind Power is able to rely on
financial support when the business is showing to have difficulties. This was
especially helping Siemens Wind Power when governmental subsidies expired
and made them able, in comparison to Vestas, to maintain their position in the
market without the need to restructure immediately.
However, there are also strengths inside Siemens Wind Power that not
directly are related to their mother company. As we know Siemens is the oldest
wind turbine manufacturer, which not only means that they were able to develop
56
technologically but also gain experience throughout many years. During that
time the company was able to establish wide-‐ranging relations with suppliers
and other partners e.g. utilities, maintenance companies. Additionally Siemens
Wind Power has, during its history, established and acquired several different
facilities in the U.S, which not only increased their presence but also decreased
cost associated with communication and logistics. Also their turbine portfolio,
which is much smaller than the ones from their competitors, but on the other
hand more powerful, has shown to give them the advantage of holding a
differentiated product portfolio. Especially their new offshore turbine, which is
one of the biggest turbines world-‐wide, seems to fit the American needs and
several projects are under development (Siemens, 2013). What is special about
their new offshore technology is the fact that they are able to build the turbine
with 50% less parts than before. By that they are able to reduce maintenance
time and cost, while additionally reducing the overall weight of the turbine
(Siemens, 2013).
8.2.2 WEAKNESSES
Now we are going to look at the weaknesses that Siemens Wind Power
contemporary faces.
What has shown to be a problem is the fact that manufacturers are often
dependent on developers, which could be changed by pursuing a forward
vertical integration. The next level of the supply chain is usually the wind
developer. Although they are not buying the turbines themselves, they are the
part where the decision is made what turbine to choose for a given project. What
however is interesting is the fact that many turbine manufacturers usually are
not involved in this decision process, although some are providing you with
assistance as soon as you decide that you are going with their turbines. The fact
that developers are independent makes it hard for manufacturers to ensure that
they are capturing some of the projects that are going to be developed or already
are under development. This is due to the fact that developers usually keep the
option of switching to another supplier when discovering that another turbine
might be more profitable for a given project. In Europe Siemens already
57
eliminated this risk to some degree by going into a joint venture with utility
companies.
Another factor that has shown to be a strength, but a weakness on the
other hand, is the fact that still some of the very important parts are supplied by
third parties. As we know, manufacturers generally starting to pursue a more
flexible structure with more suppliers external to the organization. On the other
hand external supply is also facing Siemens with more uncertainty about the
products e.g. quality, logistics, etc. (Siemens, 2013). Especially their American
suppliers, in regard to their onshore turbines, were facing Siemens with
problems to deliver on time (Siemens, 2013).
8.2.3 OPPORTUNITIES
Because the industry of wind energy is still relatively young, we can
expect a lot of development during the next decades. This of course also results
in manufacturers facing many opportunities. In the following we are going to
discuss some of them.
As already mentioned above, Siemens still lacks behind on relations with
developers. Especially small developers are increasingly able to develop wind
farms of an enormous size. The reason for that is the fact that wind developers
do not need a huge amount of employees but rather employees with the right
knowledge and capability (Komperda, 2014). Having a small company, that is
playing an influential rule in the supply chain, should make big manufacturers
think about how they could make sure that they are the chosen supplier. One
way would to be to bind both parties with a contract, which is saying that all
projects that are going to be developed are equipped with the manufacturers
turbine. Another way manufacturers you ensure that the developers are using
their turbine is to make an acquisition. Since the companies usually a small, the
needed investment would be so as well, at least when the developer is willing to
be acquired.
Another opportunity to decrease the risk of the very vague political
situation for wind energy is to switch extensive from an internal to an external
58
supply. However, as we already have discussed, this opportunity is not only
increasing the company’s strengths but additionally its weaknesses. Nonetheless,
since the market is extremely unpredictable at its contemporary point, the
company should try to be more flexible to adjust to changing conditions faster.
The demand situation would then decrease its influence on the company’s
profitability since all the fixed costs, which are connected to the production of
components, would be affecting the suppliers only.
8.2.4 THREATS
The most noteworthy threats are lying inside political decisions in regard
to wind energy. As we have discovered in the “Threat of Substitutes” turbine
manufacturers are holding a good standpoint since wind, at least at its
contemporary point, is the most profitable renewable energy source with one of
the biggest potential development of capacity.
The big influence that the political system has is not only connected to if
support is granted or not, but also the fact that nobody is able to predict what is
going to happen. If the government, hypothetically, would announce that support
for wind energy is not going to be granted from now on, investors are ensured.
The problem right now is that nobody wants to build a project since they are
waiting for the potential support. However, that does not mean that a wind
project would be unprofitable without the support, but having a potential 20%
increase of profitability by waiting a year, makes most investors letting the time
pass which results in many manufactures facing a huge decline in demand.
Another potential threat is related to patents. Since the industry is still
characterized as investing a lot in research & development, new and better ways
of capturing wind energy might be discovered. Already today there are
technologies, although in their starting stage, that are extremely efficient and on
the other hand are able to eliminate noise and shadow flickers nearly totally.
Having a company that is holding a patent on a technology, which is way better
than the technology used by manufacturers today, might result in a market with
a company having monopolistic control. If this company decides to market the
59
new technology themselves, without giving other companies the possibility to
license, the market for wind energy would change dramatically.
9. CONCLUSION
This paper has by the use of different analytical tools shown what factors
are having an impact on Siemens Wind Power´s business in the United States.
Furthermore we have learned how environmental scanning tools are able to
provide information that is essential for the strategic decision process.
However, it is important to note that different analytical tools are
providing different information. Our impression of market characteristics and
factors that are of importance might tremendously change when using other
tools that are found within the management and marketing literature.
Furthermore we should acknowledge that the research design
simultaneously was taking an impact on our results. Also here a different
approach would have accredited different factors.
But what can we conclude from our research design and our use of
PESTEL, Porters 5 Forces, and SWOT? First of all we have learned that
governmental support has a tremendous impact on the industry’s success.
However, governmental support can only be granted when the economy is doing
well and at its current stage this is not the case since it is mainly a stock market
bubble growing because the is FED is supplying cheap money. What is important
is that the industry learns how to grow without governmental support, which
already might be possible, but for investors easier and well more profitable with
granted subsidies. Also the fact that wind generally is favored by the biggest part
of the community should be acknowledged and the causes for the phenomena of
NIMBY should by tried to tackle through new turbine technology. Especially
wind developers should take this into account and plan projects were the highest
favorability is placed while additionally involving the local community from start
on. Furthermore, the industry should start seeing the governmental investment
into the energy infrastructure as another, although indirect, grant for the
industry while additionally making potential investors aware of that. As we have

60
discovered the costs of installing the grid is extremely influential in its impact
and might decrease tremendously when the government extends it for the
taxpayers costs. Also turbine manufacturers should start to involve themselves
more into the developers tasks and especially focus on the legal issues that can
arise, since there not only are many and extreme in their potential impact but on
the other hand developing to acknowledge new problems.
However, Siemens Wind Power also has to develop their own internal
business. Although we found out that the threat of new entrants generally is low,
since the needed investment is way too high for most companies, GE and Vestas
are still major players and are able, through their bigger product portfolio, to
supply areas where Siemens does not have the right turbine. Especially when the
market starts to saturate, secondary areas are going to be utilized where
different turbine characteristics might be needed. Additionally the company
should start to rely on outside suppliers to higher degree, although we have
learned that the backward vertical integration was able to offer many benefits,
the situation on the American market is too unpredictable to have all the costs
internally and the risk would decline tremendously when passing it to suppliers.
What however might be worth a try, although it decreases flexibility, is a forward
vertical integration. The closer, more direct, customer contact might, if
approached correct, dramatically increase the company’s orders while
additionally increasing their knowledge about the supply chain.
Before the reader puts this paper away, it is important to note that these
analyzes only are able to provide a short-‐term picture. During the next decades
the industry is going to develop tremendously and we all can look forward to a
huge amount of interesting research for the industry of wind energy.
61
Bibliography Aarora, R., 2006. Race and Ethnicity in Educatio. Education + Training , 48(7),
p.13.
ACORE, 2013. Energy Fact Check. [Online] Available at: http://www.energyfactcheck.org/category/jobs/ [Accessed 25 March 2014].
Adler, N.J. & Gundersen, A., 2008. International Dimensions of Organizational Behavior. Mason, Ohio, America: South Western.
Aud, S. & Fox, M.A., 2010. Status and Trends in the Education or Racial and Ethnic Groups. Statistic. Washington: IES.
AWEA, 2013. American Wind Energy Association. [Online] Available at: http://awea.files.cms-‐plus.com/FileDownloads/pdfs/PTC%20Fact%20Sheet.pdf [Accessed 25 March 2014].
AWEA, 2013. American Wind Energy Association. [Online] Available at: https://www.awea.org/resources/statefactsheets.aspx?itemnumber=890 [Accessed 17 April 2014].
AWEA, 2014. American Wind Energy Associaton. [Online] Available at: http://awea.files.cms-‐plus.com/FileDownloads/pdfs/NorthDakota.pdf [Accessed 17 April 2014].
Aziz, J., 2013. Week. [Online] Available at: http://theweek.com/article/index/244899/does-‐the-‐federal-‐reserve-‐really-‐control-‐the-‐money-‐supply [Accessed 14 April 2014].
Barry, K., 2014. Legal issues in regard to the development of a wind farm. [Online] Springfield, U.S.
Biomass EC, 2014. Biomass Energy Center. [Online] Available at: http://www.biomassenergycentre.org.uk/portal/page?_pageid=76,15049&_dad=portal&_schema=PORTAL [Accessed 18 March 2014].
Biomass Power, n.d. Biomass Power Association. [Online] Available at: http://biomasspowerassociation.com/pages/about_facts.php [Accessed 18 March 2014].
Blumberg, B., Cooper, D. & Schindler, P., 2008. Business Research Method. Maidenhead, Bershire, England: McGraw Hill.
Bonus Energy, 2003. Bonus. [Online] Available at: http://web.archive.org/web/20010331181302/http://www.bonus.dk/uk/profil/profilvinduer/mere_historie.html [Accessed 04 March 2014].
Brown, A., 2014. Clean Energy. [Online] Available at: http://blog.cleanenergy.org/2014/03/03/conservatives-‐ptc/ [Accessed 18 April 2014].
Bullis, K., 2014. MIT Technology Review. [Online] Available at: http://www.technologyreview.com/news/523251/new-‐battery-‐material-‐could-‐help-‐wind-‐and-‐solar-‐power-‐go-‐big/ [Accessed 18 April 2014].
Byars, L.L., 1991. Strategic management: Formulation and implementation : concepts and cases. Harper Collins.
62
CEC, 2011. California Energy Comission. [Online] Available at: http://energyalmanac.ca.gov/electricity/us_per_capita_electricity-‐2010.html [Accessed 17 April 2014].
Chakrabortty, A., 2014. NC State University. [Online] Available at: http://news.ncsu.edu/releases/wms-‐chakrabortty-‐wind2014/ [Accessed 18 April 2014].
Cogley, T., 1997. Federal Reserve Bank of San Francisco. [Online] Available at: http://www.frbsf.org/economic-‐research/publications/economic-‐letter/1997/september/what-‐is-‐the-‐optimal-‐rate-‐of-‐inflation/ [Accessed 18 April 2014].
Crane, A. et al., 2009. The Oxford Handbook of Corporate Social Responsibility. Oxford: Oxford University Press.
Doering, C., 2014. The Des Moines Register. [Online] Available at: http://www.desmoinesregister.com/story/news/politics/2014/04/02/renewal-‐wind-‐tax-‐credit-‐shows-‐signs-‐life/7190249/ [Accessed 13 April 2014].
EBSCO HOST, 2014. Ebsco Host. [Online] Available at: http://connection.ebscohost.com/science/alternative-‐energy-‐exploration/history-‐alternative-‐and-‐renewable-‐energy [Accessed 24 April 2014].
Eckhart, M.T., 2012. Ecogeneration. [Online] Available at: http://ecogeneration.com.au/news/history_and_outlook_on_renewable_energy_policy_in_the_us/067016/.
EIA, 2011. U.S Energy Information Administration. [Online] Available at: http://www.eia.gov/todayinenergy/detail.cfm?id=3970 [Accessed 21 March 2014].
Eia, 2013. U.S Energy Information Administration. [Online] Available at: http://www.eia.gov/forecasts/aeo/pdf/electricity_generation.pdf [Accessed 15 March 2014].
Eia, 2013. U.S Energy Information Administration. [Online] Available at: http://www.eia.gov/electricity/monthly/epm_table_grapher.cfm?t=epmt_1_01_a [Accessed 18 March 2014].
EIA, 2013. Updated Capital Cost Estimates for Utility Scale Electricity Generating Plants. Cost Estimate. EIA.
EPA, 2011. Environmental Protection Agency. [Online] Available at: http://www.epa.gov/climatechange/ghgemissions/gases/co2.html [Accessed 18 April 2014].
Galbraith, K., 2009. New York Times. [Online] Available at: http://green.blogs.nytimes.com/2009/02/25/obama-‐vows-‐support-‐for-‐renewables-‐and-‐a-‐carbon-‐cap/ [Accessed 25 April 2014].
GEA, 2010. Geothermal Energy Association. [Online] Available at: http://www.geo-‐energy.org/pdf/reports/GreenJobs_Through_Geothermal_Energy_Final_Oct2010.pdf [Accessed 21 March 2014].
63
GE-‐Energy, 2014. GE-‐ Energy. [Online] Available at: http://www.ge-‐energy.com/products_and_services/products/wind_turbines/fourone_113.jsp [Accessed 16 April 2014].
GENESLAW, H., 1995. CLEANUP OF NATIONAL PRIORITIES LIST SITES, FUNCTIONAL EQUIVALENCE, AND THE NEPA ENVIRONMENTAL IMPACT STATEMENT. Journal of Land Use & Environmental Law.
Handley, M., 2012. U.S News. [Online] Available at: http://www.usnews.com/news/articles/2012/09/04/6-‐energy-‐policy-‐highlights-‐from-‐the-‐democratic-‐party-‐platform [Accessed 15 April 2014].
Hill, T. & Westbrock, R., 1997. SWOT analysis: It's time for a product recall. Long Range Planning, 30(01), p.6.
Holdren, J., 2014. Whitehouse. [Online] Available at: http://www.whitehouse.gov/blog/2014/01/09/new-‐steps-‐strengthen-‐nation-‐s-‐energy-‐infrastructure [Accessed 16 April 2014].
Hollensen, S., 2011. Global Marketing. Harlow, England: Prentice Hall. IES, 2013. Institute of Education Sciences. [Online] Available at:
http://nces.ed.gov/programs/digest/d12/ [Accessed 15 April 2014].
IHS, 2010. Emerging Energy. [Online] Available at: http://www.emerging-‐energy.com/uploadDocs/Excerpt-‐-‐-‐US-‐RPS-‐Markets-‐and-‐Utility-‐Strategies-‐2010-‐2025.pdf [Accessed 15 March 2014].
Iowa Energy Center, 2014. Iowa Energy Center. [Online] Available at: http://www.iowaenergycenter.org/wind-‐energy-‐manual/history-‐of-‐wind-‐energy/ [Accessed 24 March 2014].
Johnson, G., Scholes, K. & Whittington, R., 2007. Exploring Corporate Strategy. Lancaster: Prentice Hall.
Kaldellis, J. & Zafirakis, D., 2011. The wind energy (r)evolution: A short review of a long history. Lab of Soft Energy Applications & Environmental Protection, 36, p.17.
Komperda, S., 2014. Legal issues in regard to the development of a wind farm. [Online] Springfield, U.S.
Komperda, S., 2014. Wind Developers in the U.S. and the Contemporary Situation for Wind in the U.S. [Online] Springfield, U.S.
Kotler, P. et al., 2009. Marketing Management. Harlow: Pearson. Kotter, J. & Schlesinger, L., 2008. Choosing Strategies for change. Harvard
Business Review, Augustus. p.29.
Lawson, J., 2013. Renewable Energy World. [Online] Available at: http://www.renewableenergyworld.com/rea/news/article/2013/04/to-‐keep-‐wind-‐competitive-‐manufacturing-‐ups-‐its-‐game [Accessed 19 April 2014].
Lee, S.F., Lo, K.K., Leung, R.F. & Sai On Ko, A., 2000. Strategy formulation framework for vocational education: integrating SWOT analysis, balanced scorecard, QFD methodology and MBNQA education criteria. Managerial Auditing Journal, 15(8), p.16.
64
Lombardo, T., 2013. Engineering Electronics. [Online] Available at: http://www.engineering.com/ElectronicsDesign/ElectronicsDesignArticles/ArticleID/5832/Worlds-‐Quietest-‐Wind-‐Turbine.aspx [Accessed 18 April 2014].
Lyons, W., 2010. About Energy. [Online] Available at: http://energy.about.com/od/Generation_and_Storage/ht/How-‐To-‐Build-‐A-‐Wind-‐Farm.htm [Accessed 15 April 2014].
Miller, B., 2013. Wind Power Monthly. [Online] Available at: http://www.windpowermonthly.com/article/1207731/wind-‐power-‐growth-‐2006-‐2012 [Accessed 25 April 2014].
Mintzberg, H., 1994. The Rise and Fall of Strategic Planning. Prentice Hall International.
Muralidharan, R., 2013. Environmental Scanning and Strategic Decisions in Multinational Corporations. The Multinational Business Review, 11(1), p.22.
NHA, 2013. Hydro. [Online] Available at: http://www.hydro.org/wp-‐content/uploads/2010/12/NHA-‐Fact-‐Sheet-‐Hydropower-‐for-‐a-‐Clean-‐Energy-‐Future.pdf [Accessed 15 April 2014].
Nickell, C., 2014. Legal issues in regard to the development of a wind farm. [Online] Springfield, U.S.
NOAA, 2002. National Oceans And Atmospheric Administration. [Online] Available at: http://www.berner.com/sales/energy_windspeed.html [Accessed 17 April 2014].
NREL, 2008. 20% Wind Energy by 2030. Outlook. U.S. Department of Energy.
NREL, 2014. National Renewable Energy Laboratory. [Online] Available at: http://www.nrel.gov/learning/re_biomass.html [Accessed 18 March 2014].
NREL, 2014. Wind Power in America. [Online] Available at: http://www.windpoweringamerica.gov/wind_resource_maps.asp?stateab=nd&print [Accessed 17 April 2014].
NWCC, 2010. National Wind Coordinating Collaborative. [Online] Available at: http://www1.eere.energy.gov/wind/pdfs/birds_and_bats_fact_sheet.pdf [Accessed 15 April 2014].
O'Neill, J. & O'Neill, D., 2006. What do wage differentials tell about labor market discrimination? Emerald Group.
Perry, J. & Gundersen, D., 2011. American Women and the Gender Pay Gap: A Changing Demographic or the Same Old Song. Advancing Women in Leadership, 31(1), p.7.
Pickton, D. & Wright, S., 1998. What's swot in strategic analysis? Strategic Change, 7(1001), p.9.
Piercy, N. & Giles, W., 1989. Making Swot Analysis Work. Strategic Marketing Development, 7(5), p.3.
Post, W., 2013. The Energy Collective. [Online] Available at: http://theenergycollective.com/willem-‐post/310631/more-‐realistic-‐cost-‐wind-‐energy [Accessed 14 April 2014].
65
REAP, 2013. Renewable Energy Alaska Project. [Online] Available at: http://alaskarenewableenergy.org/why-‐renewable-‐energy-‐is-‐important/alaskas-‐resources/ [Accessed 18 April 2014].
Rumelt, R.P., 1991. How Much Does Industry Matter? Strategic Managment Journal, 12(3).
Ryan, D., 2014. EHP. Environmental Health Perspective, 122(1), p.6. Available at: http://ehp.niehs.nih.gov/122-‐a20/.
Söder, L., 2009. Diva. [Online] Available at: http://www.diva-‐portal.org/smash/get/diva2:405861/FULLTEXT01.pdf [Accessed 17 April 2014].
SEIA, 2014. Solar Energy Industries Association. [Online] Available at: http://www.seia.org/policy/solar-‐technology/photovoltaic-‐solar-‐electric [Accessed 18 March 2014].
Senn, C., 2006. The executive growth factor: how Siemens invigorated its customer relationships. Journal of Business Strategy , 27(01).
Sherlock, M., 2011. Energy Tax Policy: Historical Perspectives on and Current Status of Energy Tax Expenditures. Congrssional Research Service.
Siemens AG, 2013. Das Unternehmen 2013. Annual Report. Siemens AG. Siemens Wind Power. 2013. [Film] Directed by Siemens.
Siemens, 2008. Siemens. [Online] Available at: http://www.siemens.com/history/pool/geschichte/unternehmensgeschichte_lang.pdf [Accessed 04 March 2014].
Siemens, 2008. treia. [Online] Available at: http://www.treia.org/assets/documents/TR08_Tue_1030-‐1200_Nelson.Robert_Siemens_Wind_Power-‐Technical_Developments.pdf [Accessed 04 March 2014].
Siemens, 2010. Siemens. [Online] Available at: http://www.siemens.com/press/pool/de/events/energy/2010-‐11-‐wind/Factsheet_USA_de.pdf [Accessed 04 March 2014].
Siemens, 2010. Siemens. [Online] Available at: http://www.siemens.com/press/en/pressrelease/index.php?content[]=E&content[]=EW&search=Searchterm&date-‐1-‐dd=01&date-‐1-‐mm=03&date-‐1=2005&date-‐2-‐dd=05&date-‐2-‐mm=03&date-‐2=2014&intern=1&content_0=E&content_1=EW&sheet=9 [Accessed 05 March 2014].
Siemens, 2011. Siemens. [Online] Available at: http://www.siemens.com/press/en/pressrelease/index.php?content[]=E&content[]=EW&search=Searchterm&date-‐1-‐dd=01&date-‐1-‐mm=03&date-‐1=2005&date-‐2-‐dd=05&date-‐2-‐mm=03&date-‐2=2014&intern=1&content_0=E&content_1=EW&sheet=8 [Accessed 05 March 2014].
Siemens, 2011. Siemens. [Online] [Accessed 05 March 2014].
66
Siemens, 2011. Siemens. [Online] Available at: http://www.siemens.com/press/en/pressrelease/index.php?content[]=E&content[]=EW&search=Searchterm&date-‐1-‐dd=01&date-‐1-‐mm=03&date-‐1=2005&date-‐2-‐dd=05&date-‐2-‐mm=03&date-‐2=2014&intern=1&content_0=E&content_1=EW&sheet=6 [Accessed 05 March 2014].
Siemens, 2012. Siemens. [Online] Available at: http://www.siemens.com/press/en/pressrelease/index.php?content[]=E&content[]=EW&search=Searchterm&date-‐1-‐dd=01&date-‐1-‐mm=03&date-‐1=2005&date-‐2-‐dd=05&date-‐2-‐mm=03&date-‐2=2014&intern=1&content_0=E&content_1=EW&sheet=5 [Accessed 05 March 2014].
Siemens, 2012. Siemens. [Online] Available at: http://www.siemens.com/press/pool/de/events/2012/energy/2012-‐07-‐wismar/factsheet-‐wind-‐power-‐offshore-‐e.pdf [Accessed 05 March 2014].
Siemens, 2013. Oxford Research. [Online] Available at: http://www.oxfordresearch.dk/media/185188/Opl%C3%A6g_Mogens%20Nyborg%20Pedersen.pdf [Accessed 19 April 2014].
Siemens, 2013. Siemens. [Online] Available at: http://www.siemens.com/about/en/management-‐structure/energy.htm [Accessed 04 March 2014].
Siemens, 2013. Siemens. [Online] Available at: http://www.siemens.com/about/en/businesses/energy.php [Accessed 04 March 2014].
Siemens, 2013. Siemens. [Online] Available at: http://www.energy.siemens.com/hq/en/renewable-‐energy/wind-‐power/references.htm [Accessed 04 March 2014].
Siemens, 2013. Siemens. [Online] Available at: http://www.siemens.com/press/pool/de/feature/2013/energy/2013-‐12-‐fort-‐madison/factsheet-‐siemens-‐wind-‐power-‐d.pdf [Accessed 01 April 2014].
Siemens, 2013. Siemens. [Online] Available at: http://www.siemens.com/innovation/apps/pof_microsite/_pof-‐spring-‐2013/_pdf/de/Weisse_riesen_produzieren_DE.pdf [Accessed 18 April 2014].
Sikorski, D., 2011. The Global Financial Crisis. Contemporary Studies in Economic and Financial Analysis, 93, p.70.
Slaughter, R., 1999. Framework for Environmental Scanning. Foresight, 1(5). Stonehouse, G. & Snowdon, B., 2007. Competitive Advantage Revisited:
Michael Porter on Strategy and Competitiveness. Journal of Management Inquiry, 16, p.19.
Subramanian, C., 2013. Time. [Online] Available at: http://business.time.com/2013/12/26/dow-‐jones-‐record-‐high/ [Accessed 14 April 2014].

67
Summers, L., 2009. National Economic Council. [Online] Available at: http://www.whitehouse.gov/administration/eop/nec/speeches/responding-‐to-‐an-‐historic-‐economic-‐crisis-‐the-‐obama-‐program [Accessed 18 April 2014].
Trahish, H., 2012. GreenTech. [Online] Available at: https://www.greentechmedia.com/articles/read/ge-‐still-‐dominates-‐u.s.-‐wind-‐making-‐but-‐new-‐faces-‐are-‐emerging/ [Accessed 14 April 2014].
U.S. Bureau Of Labor Statistics, 2014. Tradingeconomics. [Online] Available at: http://www.tradingeconomics.com/united-‐states/inflation-‐cpi [Accessed 14 April 2014].
U.S. Census Bureau, 2011. Population Density per Square Mile of Countries. U.S Census Bureau.
U.S. Deparment Of Labor, 2010. BLS. [Online] Available at: http://www.bls.gov/cps/cpswom2009.pdf [Accessed 15 April 2014].
U.S. Department Of Education, 2010. Status and Trends in the Education of Racial and Ethnic Groups. IES.
U.S. Department of Energy, 2014. U.S. Department of Energy. [Online] Available at: http://energy.gov/eere/wind/history-‐wind-‐energy [Accessed 01 April 2014].
U.S. Department of Energy, 2014. U.S. Department of Energy. [Online] Available at: http://www1.eere.energy.gov/tribalenergy/guide/wind_turbines.html [Accessed 04 April 2014].
U.S. Energy Information Administration, 2014. Monthly Electric Sales and Revenue With State Distributions Report. Power Plant Operations Report. U.S. Energy Information Administration.
Union of Concerned Scientists, 2014. UCSUSA. [Online] Available at: http://www.ucsusa.org/clean_energy/our-‐energy-‐choices/renewable-‐energy/how-‐geothermal-‐energy-‐works.html [Accessed 18 March 2014].
Valentin, E.K., 2005. Away With SWOT Analysis: Use Defensive/Offensive Evaluation Inste. The Journal of Applied Business Research –, 21(2), p.103.
Vestas, 2013. Vestas. [Online] Available at: http://worldofwind.vestas.com/en/Manufacturing [Accessed 18 April 2014].
Vyas, C. & Hurst, D., 2013. Energy and Environment Consumer Survey. Consumer Survey. Navigant Research.
WED, 2014. Wind Energy Development. [Online] Available at: http://windeis.anl.gov/guide/basics/ [Accessed 17 April 2014].
Wind Energy Foundation, 2014. Wind Energy Foundation. [Online] Available at: http://www.windenergyfoundation.org/about-‐wind-‐energy/history [Accessed 24 March 2014].
Yüksel, I., 2012. Developing a Multi-‐Criteria Decision Making Model for PESTEL Analysis. International Journal of Business and Managemen, 7(24), p.15.