bachelor thesis final report - universiteit twente · bachelor thesis final report an evaluation of...
TRANSCRIPT

1
BACHELOR THESIS FINAL REPORT
An evaluation of a new type of housing
scheme based on residential satisfaction:
Plaza de la Hoja, Bogotá, Colombia
Anna van Veenen s1346954 23-08-2015
BACHELOR THESIS FINAL REPORT
Anna van Veenen s1346954 23-08-2015
Figure 1 Conceptual model of Pérez Pérez

Bachelor thesis Anna van Veenen 2
An evaluation of a new type of housing scheme based on residential satisfaction: Plaza de la Hoja, Bogotá, Colombia
Author: Anna van Veenen Bachelor student Civil Engineering University of Twente s1346953 Supervised by: Ir. Mark Brussel University of Twente Faculty of Geo-Information Science and Earth Observation Melba Rubiano Universidad Piloto de Colombia Researcher at Maestría en Gestión Urbana Bachelor thesis Period of internship: 23-04-2015 till 03-07-2015 Date of submission: 23-08-2015

Bachelor thesis Anna van Veenen 3
PREFACE This research report has been drafted in the context of the final bachelor assignment of the study Civil Engineering at the University of Twente. During a ten week period I have been working on this report at the Universidad Piloto de Colombia. In order to obtain all the relevant data I have had some appointments with a local housing authority, did in-situ observations and conducted questionnaires, all in Spanish. The process was very irregular, because sometimes I had to work hard to get documents ready in time and sometimes I could not do anything except waiting for external parties to respond. These waiting times were very useful to keep up with the writing of this report and this has helped me to finish within the prescribed time for this research. Residential satisfaction is an interesting topic. I did not know anything about it and I have enjoyed deepening in this topic in order to create the specific model for Plaza de la Hoja. Sometimes it was hard to make a selection of all the obtained information and to make specific assumptions, but in the end it all worked out. I liked that it was possible to include an ArcGIS analysis to apply my acquired skills from my minor last year. Conducting the questionnaires was very special, because it was possible to get in contact with the residents and a different group of people. It was interesting to hear their stories and to learn about the other, poorer side of Bogotá. This created the opportunity to make a typical civil engineering combination of the technical aspects of the project and the social aspect of the residents. I would like to thank my supervisors Mark Brussel and Melba Rubiano for mentoring me through the research process and help me with making appointments or decisions. Because of you I had no big difficulties conducting this research. From the University of Twente I would like to thank Ellen van Oorsterzee for helping me with applying for scholarships, insurances and visa. From the Universidad Piloto de Colombia I would like to thank Carlos Moreno, Mauricio Torres and Jorge Solano for critical advice about my research and help in solving technical difficulties at the university. At last, I would like to thank all my other colleagues from the Universidad Piloto de Colombia for the nice times and support. I always felt welcome and comfortable at the university. Anna van Veenen Enschede 23-08-2015

Bachelor thesis Anna van Veenen 4
SUMMARY Bogotá is with almost 9 million inhabitants the biggest city in Colombia. The center of the city is bustling and in the north of the city richer areas are located. However, there are a lot of areas in Bogotá where the living conditions are not that good. There is a high number of poor people living in poorly constructed houses or even slums, mostly at the edges of the city. To solve this problem the Colombian government introduced a new housing policy. This means that the government will provide homes for 100.000 families throughout Colombia during the presidential period (Metrovivienda, Alcaldía Mayor de Bogotá D.C., & Sociedad Colombiana de Arquitectos Bogotá D.C. , 2013). The project of Plaza de la Hoja is an example of this new policy. The nation of Colombia and the district of Bogotá finance 457 free homes and provide free internet access for victims of displacement or violence. The main purpose of this project is to break the paradigm that poor people should live in the suburbs of the city. The housing authority and executor Metrovivienda wants to bring several types of landuse, such as living, working or leisure together to reduce socio-economic segregation and to weaken the border between rich and poor. At last, they want to renew the city with this project and change the perception of the inhabitants of Bogotá that good quality housing for poor people in the city center is possible. A sub-goal of the project is to provide a comfortable and affordable living environment for the displaced persons and victims of violence to improve their quality of life (El Tiempo, 2014). However, evaluating the main purposes of the project is not possible, because the project was finished a few months ago and at this moment not every resident has moved in. It takes more time for these activities to develop and the scope of this research is too small to cover them all. In order to keep the purposes in mind this research has focused on evaluating the sub-goal of the Plaza de la Hoja project. When looking at literature about evaluating housing schemes the terms performance and residential satisfaction arise. The project performs well when the residents are satisfied with their home. This leads to the following research question: “What is the current performance of Plaza de la Hoja when looking at the residential satisfaction?” The purpose of this research is to develop and implement a model to measure the satisfaction of the residents in order to evaluate the project of Plaza de la Hoja. Based on the results it can be concluded if this type of project can be named a success. An advice will be given to Metrovivienda if it is recommendable to develop this kind of projects in other parts of Bogotá.
1.1 Research approach and results The research starts off with an in-depth analysis of the introduced terms in the research question. Through literature study the definitions of performance and residential satisfaction are obtained and a way to evaluate them is developed. The choice has been made to evaluate the project on three different scales: house, project and neighborhood. A fourth scale: household characteristics will be included in order to explain differences in the outcome of the research. Through this literature study a lot of factors that contribute to residential satisfaction are selected and distributed over the different scales. The factors are selected from literature all over the world and not every factor will apply to housing schemes in Bogotá. The next step is to select the most relevant factors for the Plaza de la Hoja project. This has been done by brainstorming, in-situ observations and an interview with Metrovivienda. The outcome of these observations made it possible to write down all the social and technical aspects of the project from which the most important factors were selected. The choice has been made to distribute the factors over two categories: the biggest part of the factors will be evaluated through a questionnaire and a small part of neighborhood factors will be analyzed in ArcGIS. These two instruments will form the basis of the assessment framework of evaluating the Plaza de la Hoja project. The combination of the three different measurement scales and the two instruments is shown below (Figure 1).

Bachelor thesis Anna van Veenen 5
Figure 2 Assessment framework
As can be seen in the diagram, the choice has been made to let each scale contribute equally to residential satisfaction. The evaluation model converts the outcome of the instruments into a scale from 1 (very unsatisfied) to 5 (very satisfied). In short, when the final grade is higher than 3, the residents are indeed satisfied and the project performs well. The neighborhood analysis is based on the distance to 11 different facilities around the project site. These facilities are located through in-situ observations and a research of Marulanda (2014). The walking distances to them are generated in ArcGIS and divided in categories in order to obtain the sub-grade of satisfaction about the neighborhood. The result of this neighborhood analysis is a sub-grade of 3,36. The results of the questionnaire are based on 47 factors, distributed over the different categories. The questionnaires are conducted during one Friday and Saturday and in the end 26 residents were interviewed. The answers to the questions are converted into a scale from 1 to 5, averaged per category and multiplied by the corresponding factor. Including the outcome of the neighborhood analysis, the following calculation can be made:
Average
Factor Weighted average
House 3,50 0,33 1,17
Project 3,47 0,33 1,16
Neighborhood 3,46 0,17 0,58
Neighborhood analysis 3,36 0,17 0,56
Total
3,46
The final grade of residential satisfaction is 3,46. Based on this answer and only residential satisfaction as a part of performance the answer to the major research question “What is the current performance of Plaza de la Hoja when looking at the residential satisfaction?” is that the project performs well. Based on the contents and the outcome of this research the project can be named a success and it is recommendable to Metrovivienda to realize more of these projects. However, this research is conducted in the first stage of the exploitation of Plaza de la Hoja and not all the residents have moved in. This is not a preferable situation. It is recommendable to conduct the same research a few years later with more respondents to obtain a more realistic opinion of the residents, because they will be in a better position to have an opinion about the project when they have been living there for a couple of years. Furthermore, it may be possible to investigate the other purposes of the Plaza de la Hoja project to make a more complete framework and to draw more accurate and reliable conclusions. At this point in time Metrovivienda can increase the amount of residential satisfaction by improving the factors that did not score very high like safety and security, internet access, and the accessibility of the apartments. In the long run the final recommendation will be to observe the developments of the project over the years and to conduct this research in a later stage of the Plaza de la Hoja project to obtain a more accurate opinions and results.

Bachelor thesis Anna van Veenen 6
TABLE OF CONTENTS
List of figures and tables .................................................................................................................................. 8
List of abbreviations ......................................................................................................................................... 9
1 Introduction ........................................................................................................................................... 10
1.2 Plaza de la Hoja 10
1.3 Purpose 11
1.4 Literature study 12
1.5 Research questions 13
1.6 Thesis outline 13
2 Stakeholders .......................................................................................................................................... 14
3 Definition and measurement of performance and residential satisfaction ............................................ 16
3.1 Performance 16
3.2 Residential satisfaction 17
4 Selection of factors ................................................................................................................................ 25
4.1 Technical aspects of the project 25
4.2 Factors for observation 26
4.3 Factors for asking 27
4.4 Assessment framework 28
5 Neighborhood analysis .......................................................................................................................... 29
5.1 Analysis in ArcGIS 30
6 Implementation and results questionnaires .......................................................................................... 32
6.1 Implementation 32
6.2 Valuating the factors 32
6.3 Results 33

Bachelor thesis Anna van Veenen 7
7 Discussion .............................................................................................................................................. 38
7.1 Selection of scales 38
7.2 Selection of factors 39
7.3 Neighborhood analysis 39
7.4 Questionnaires 39
7.5 Neighborhood analysis vs. questionnaire 42
7.6 Comparison to literature 43
7.7 Final result 43
8 Conclusions and recommendations ....................................................................................................... 46
9 References ............................................................................................................................................. 48
Appendices
A. Interview Metrovivienda ....................................................................................................................... 52
B. Questionnaire ........................................................................................................................................ 54

Bachelor thesis Anna van Veenen 8
LIST OF FIGURES AND TABLES Figure 1 Assessment framework ..................................................................................................................... 5
Figure 2 Project location of Plaza de la Hoja……. ............................................................................... ……. 11
Figure 3 3D impression…………………………………… ........................................................................................... 11
Figure 4 Conceptual model ........................................................................................................................... 12
Figure 5 Relation between purpose, success and performance ................................................................... 16
Figure 6 Conceptual model of Pérez Pérez ................................................................................................... 18
Figure 7 Relation between residential satisfaction and its components ...................................................... 18
Figure 8 Top view apartment. Source: Metrovivienda .................................................................................. 26
Figure 9 Connection instruments to residential satisfaction ........................................................................ 28
Figure 10 Overview district and neighborhood ............................................................................................. 29
Figure 11 Overview facilities ......................................................................................................................... 30
Figure 12 Calculated routes........................................................................................................................... 31
Figure 13 Relation between residential satisfaction and performance ........................................................ 44
Table 1 Authors related to numbers ............................................................................................................. 19
Table 2 Apartment feature factors ................................................................................................................ 19
Table 3 Housing service factors ..................................................................................................................... 20
Table 4 Project factors................................................................................................................................... 21
Table 5 Neighborhood factors ....................................................................................................................... 22
Table 6 Household factors ............................................................................................................................. 24
Table 7 Factors for observation..................................................................................................................... 27
Table 8 Factors for asking .............................................................................................................................. 27
Table 9 Factors to analyze ............................................................................................................................. 29
Table 10 Distribution of factors in relation to distance (in meters) .............................................................. 30
Table 11 Results ArcGIS analysis ................................................................................................................... 31
Table 12 Results with respect to the house .................................................................................................. 33
Table 13 Results with respect to the project ................................................................................................ 34
Table 14 Results with respect to the neighborhood ..................................................................................... 34
Table 15 Comparison outcome neighborhood analysis and questionnaire .................................................. 42

Bachelor thesis Anna van Veenen 9
LIST OF ABBREVIATIONS NA: No Answer POT: Plan de Ordenamiento Territorial UPC: Universidad Piloto de Colombia VIP: Vivienda de Interés Prioritario VIS: Vivienda de Interés Social

Bachelor thesis Anna van Veenen 10
1 INTRODUCTION Bogotá is with almost 9 million inhabitants the biggest city in Colombia. The center of the city is bustling and in the north of the city richer areas are located. However, there are a lot of areas in Bogotá where the living conditions are not that good. There is a high amount of poor people living in poorly constructed houses or even slums. In the whole country of Colombia 1.2 million people are living in inadequate housing (Gilbert, 2014). To solve this big problem the Colombian government introduced a new housing policy. This means that the government will provide homes for 100.000 families during the presidential period (Metrovivienda, Alcaldía Mayor de Bogotá D.C., & Sociedad Colombiana de Arquitectos Bogotá D.C. , 2013). The government wants to reduce the amount of people living in inadequate housing to approximately 550.000 by this policy (Departamento Nacional de Planeación, 2014). This free housing is also going to take place in Bogotá. According HSB Noticias (2015) 2500 free houses will be built in Bogotá. Besides the developments in social housing there are some other activities going on in the center of Bogotá. The center of Bogotá is very diverse, people from all social classes are living there and a lot of activities take place. It is very crowded and there are many traffic flows. People don’t live, work and leisure in the same place and that is why they are travelling throughout the city. Most of the poor are living in the southern suburbs of Bogotá and have to travel many kilometers to reach the center. This has led to a big amount of social economic segregation in the city (Secretaría de Planeación & Alcaldía mayor de Bogotá, 2012). To solve this problem the municipality of Bogotá decided to reduce this segregation by a new, national land use plan: Plan de Ordenamiento Territorial (POT) in 2000. This plan describes where new developments of areas where living, working and leisure can take place (Secretaría Distrital Planeación Bogotá, sd). The plan includes social housing to mix the poor and rich. The POT tries to reduce the segregation and the amount of traffic flows by increasing the concentration of different activities. In 2013 a revision of the POT has been introduced: the mayor made an amendment but the city council did not accept this.
1.2 Plaza de la Hoja The project of Plaza de la Hoja is one of the three projects in Bogotá that provides free housing for poor people. It is not officially part of the POT, but the guidelines of this program are included in the design. The distinction between Plaza de la Hoja and the other two projects is the project location and the fact that the inhabitants are displaced people. The nation of Colombia and the district of Bogotá finance the 457 free homes and provide free internet access for these victims of displacement or violence. The residents only pay a converted €8,- for administration and the service costs for water, gas and electricity. In Bogotá these service costs are based on a classification of socio-economic groups, the so called “estratos” and the higher estratos subsidize the lower ones. The residents of Plaza de la Hoja are in the lowest estrato and therefore they pay the minimum for services. The idea behind this is that they can spend their money on other things, since they don’t have to spend their whole income on the rent of a house (Ortegón, 2015). The project is located in the district Puente Aranda on the intersection of Carrera 30 (NQS) with Calle 19, close to the intersection of two major roads. Puente Aranda is one of the 20 districts of Bogotá and is well-known for its industry. The location and a 3D impression can be seen below in figure 2 and 3 (En Obra, 2012). The biggest tower (figure 3) will provide office space, but has not been built yet. The lower towers are not completely finished, because the lifts are not in use and the painting and finishes are not done yet, but notwithstanding this, the first 102 families have moved in.

Bachelor thesis Anna van Veenen 11
Figure 3 Project location of Plaza de la Hoja Figure 4 3D impression
The neighborhood is called Cundinamarca and it used to be an informal and industrial neighborhood. The Plaza de la Hoja project tries to bring new life in the neighborhood by providing social and commercial services at the first floor of the building. At first the residents of the neighborhood were not that happy with the project and the fact that very poor and especially displaced people are going to live with them. They feared more crime and robbery and protested against the project (Restrepo, 2013). However, when the construction work started and the biggest part of the neighborhood was provided with new wiring, pipelines and public facilities they became less skeptical (Ortegón, 2015). The reason why the Bogotá Housing Authority Metrovivienda picked this neighborhood is because it was a financially attractive and available lot in the city center. Cundinamarca is not the richest neighborhood of the city and that is in its favor because the contrast between the residents of Plaza de la Hoja and the people from Cundinamarca is not very big. According to Metrovivienda the main purpose of the project is to break the paradigm that poor people should live in the suburbs of the city. They want to bring several types of landuse, such as living, working or leisure together to reduce socio-economic segregation and to weaken the border between rich and poor. At last, they want to renew the city with this project and change the perception of the inhabitants of Bogotá that good quality housing for poor people in the city center ís possible. The center of Bogotá should be a place for everyone (Metrovivienda et al., 2013).
1.3 Purpose As stated above Plaza de la Hoja is a very special and new type of housing project because three interesting factors are combined in the project:
- The POT has given a set of guidelines to be met - The houses are given away freely to displaced people - The project location is in the center of Bogotá
Since the construction work of Plaza de la Hoja has ended it is not interesting to contribute to this process or the design phase. The most straightforward category to address this research to is evaluation. What is the performance of the project? The purpose of this research is to develop and implement a model to measure the satisfaction of the residents in order to evaluate the project of Plaza de la Hoja. This purpose has changed several times during this internship period, due the lack of knowledge about the number of residents in the Plaza de la Hoja project. In the beginning of this research, there were no residents living at Plaza de la Hoja, but during the execution of this research they started to move in. In the end, the purpose was changed back to as intended. Based on the results can be concluded if this type of project can be named a success. An advice will be given to Metrovivienda if it is recommendable to develop this kind of projects in other parts of Bogotá.

Bachelor thesis Anna van Veenen 12
1.4 Literature study A small study of literature will provide a theoretical framework to measure the performance of the project, which will lead to the research questions of this bachelor assignment. Later on in this report, this literature study will be expanded. When looking at the literature about performance the term “satisfaction” arises. “User’ satisfaction has a direct relationship with the overall performance of buildings in meeting the needs and expectations of the users” (Nawawi & Khalil, as cited in Ibem, Opoko, Adeboye & Amole, 2013). When applying the term satisfaction to the case of Plaza de la Hoja it is possible to look at the satisfaction of the new residents and estimate the success rate or performance of the whole project. It is very interesting to look at the satisfaction of the residents of Plaza de la Hoja, because “the study of residential satisfaction is most interesting when it is applied to populations of low economic resources, who cannot move away if they are dissatisfied with their present residential environment” (Amerigo & Aragones, 1997). Residential satisfaction is an interesting and well analyzed research topic. For example, Kim, Yang, Yeo and Kim (2005) developed an evaluation model for housing performance in Korea. They distinguish different indicators on which housing performance is based. Examples are housing environment, housing comfort and housing function which can be divided in even smaller factors as view, noise, safety or green areas. This study mainly focuses on indicators for mostly individual houses. However, it is interesting to look at the bigger environment such as the project and the city. Pérez Pérez (2011) described a model for measuring the quality of living in social housing in Bogotá. He does not only describe the individual house, but also considers the relation with the neighborhood and the city as important. There are more models for evaluating residential satisfaction in a bigger environment. The National Afordable Homes Agency (2008) in Great Britain developed a Housing Quality Indicator Form which uses a lot more, but similar indicators to evaluate the quality of housing. These factors include location, site, housing layout and sustainability. The purpose of this form is to “allow potential or existing housing schemes to be evaluated on the basis of quality rather than simply of cost” (National Affordable Homes Agency, 2008). Van Rosmalen (1994) wrote a book about succes and fail factors in housing schemes in the Netherlands in a bigger perspective. He sums up a lot of indicators that can be used to evaluate housing schemes. Based on this literature context the decision has been made to evaluate the Plaza de la Hoja project on three different scales: house, project and neighborhood. The main question is now: what is the purpose of the factors mentioned in literature? These factors can be combined into a conceptual assessment to indicate the satisfaction of the residents of Plaza de la Hoja as visualized in Figure 4. This can contribute to give a prediction of the success or performance of the whole project.
Figure 5 Conceptual model

Bachelor thesis Anna van Veenen 13
1.5 Research questions From analyzing the available literature it can be concluded that there is a lot of information about residential satisfaction. The concept of Plaza de la Hoja is very special and is useful to know if the same concept can be applied somewhere else. The major research question to answer will be: “What is the current performance of Plaza de la Hoja when looking at the residential satisfaction?” The major question is too complicated to answer directly. In order to give an adequate answer, this major question has to be divided into more sub-questions.
1. How can performance and residential satisfaction of housing schemes be defined and measured? The major question introduces two new terms: performance and residential satisfaction. These terms have to be explained and defined to make them useful. Furthermore, a method has to be developed to measure these definitions to draw significant conclusions. In the literature context a conceptual model has been made and this model has to be improved and maybe remodeled. This will be done through another literature study.
2. Which factors are important in the context of measuring residential satisfaction of housing
schemes in Bogotá? There are not many references available which describe residential satisfaction in Colombia. Luckily, there is more literature available from all around the world, but some factors will not be suitable in the context of housing schemes in Bogotá. To make a representable model for Plaza de la Hoja, the factors found in sub-question one have to be focused on Bogotá and particularly on Plaza de la Hoja. This will be done by brainstorming, in-situ observations and an interview with Metrovivienda.
3. How can these factors be combined into an assessment framework and what are the results? When the different factors of measuring the residential satisfaction and performance of Plaza de la Hoja are known it is possible to combine these findings in an assessment framework. The results will be based on a network analysis in ArcGIS and questionnaires filled in by the residents. The influence of these instruments will be explained and the link to the major question will be made.
1.6 Thesis outline This thesis will start in chapter 2 with an overview of the most important stakeholders. In chapter 3 the literature context is expanded to create a theoretical framework. The terms of performance and residential satisfaction are described in more detail and the all the factors in relation to residential satisfaction are extracted from the given literature. In chapter 4 the most important factors related to the Plaza de la Hoja project are selected and divided in two categories of measurement. The 5th chapter gives an overview of the different facilities in the neighborhood and describes the conduction and evaluation of the network analysis in ArcGIS. Chapter 6 explains the implementation and results of the questionnaires. The final level of residential satisfaction will be obtained in this chapter, followed by a discussion in chapter 7. At last, the final conclusion and recommendations will be given in chapter 8.

Bachelor thesis Anna van Veenen 14
2 STAKEHOLDERS The project of Plaza de la Hoja is a pilot, which means that it is the first of its kind in housing scheming. The contents are very special and that is why an overview of the stakeholders is useful to understand the project and its context better. In this chapter all the relevant stakeholders are mentioned, but only the most important stakeholders are worked out in more detail. The list of stakeholders is as follows:
1. Alcaldía Mayor de Bogotá: the district government 2. Bogotá Humana 3. Ministerio de vivienda: the housing ministry 4. Secretaria de Habitat: the secretary of habitat 5. Secretaria de Movilidad: the secretary of mobility 6. Instituto de Desarollo Urbano: the urban development institute 7. Metrovivienda: the Bogotá Housing Authority 8. Arpro: the contractor of the project 9. Empresa de acueducto de Bogotá: a public company which provides water supply systems,
sanitation and rainwater sewerage. 10. Residents 11. Neighbors 12. Universidad Piloto de Colombia
Alcaldía Mayor de Bogotá The district government is the most powerful stakeholder. The national government initiated the policy of providing 100.000 homes for the poorest people in Colombia and they wanted to collaborate with the district government of Bogotá. There were some confrontations between the minister of housing and the mayor of Bogotá but in the end they came to a compromise about the amount of free houses. The district government and the national government are the main financers of the Plaza de la Hoja project and are in the end responsible for the consequences. Metrovivienda Metrovivienda is the housing authority which is directly linked to the district government. They are responsible for all the social housing projects in Bogotá. In Bogotá there are two types of social housing: Vivienda de Interés Social (VIS) and Vivienda de Interés Prioritario (VIP). In order to qualify for these social housing types the house must value below 135 minimum wages for the VIS and below 70 minimum wages for the VIP. Furthermore, an applicant needs an income of maximum 6 minimum wages a month. One minimum wage is converted €224. Metrovivienda only develops housing schemes in the VIP sector, for the poorest inhabitants of Bogotá. Their aim is to reduce the socio-spatial segregation, to gradually stop the expanding land occupation and instead promote the model of a dense and compact city (Metrovivienda, 2013). Metrovivienda is the only company which is working on the execution of Plaza de la Hoja. There are no other housing authorities or institutions that cooperate. Metrovivienda selected the architect, the contractor (Arpro) and the utility companies. They are the only point of contact with respect to the Plaza de la Hoja project and therefore a very important stakeholder. Residents The characterization of the residents is important to understand the Plaza de la Hoja case and the possible outcome of the research. The biggest part of the residents is victim of displacement or violence. They were forced to leave their house because of violence, armed conflict, violation of human rights or natural disasters. They are law-bound protected by the government, but do not have anything left of their own. The difference between a displaced person and a fugitive is that fugitives chose to cross the border in search for a better life and displaced persons stay in the same country (United Nations High Commissioner for Refugees, 2015). However, most of the time the displaced people do have a

Bachelor thesis Anna van Veenen 15
(temporary) house or job, but often in poor villages or neighborhoods. The residents hope to find a better life in the center of Bogotá. The displaced residents of Plaza de la Hoja come from several parts of Colombia and the poorer neighborhoods of Bogotá. They are very happy with the opportunity to live in a house of their own and to start over with their lives (El Tiempo, 2015). They are very positive about the Plaza de la Hoja project and in this stage of the project the expectations are that they will be very satisfied with everything they get. At the moment there are two groups of residents: one group which is living in the Plaza de la Hoja project and the other group not (yet). Neighbors In the beginning the inhabitants of Cundinamarca were not very happy with the Plaza de la Hoja project. They feared more crime and robbery (Restrepo, 2013). They were mad that the project was so expensive and they suggested investing the money in something more useful to the community. They feared that the project was only a reason for the government to receive more votes and that the value of their houses would drop, because of the lower income and displaced community of Plaza de la Hoja (Ortegón, 2015). However, after the construction works began, the inhabitants of Cundinamarca started to realize that the Plaza de la Hoja project is supposed to serve the whole neighborhood. Ortegón (2015) told that the biggest part of the neighborhood was provided with new wiring, pipelines and public facilities. The project attracts more people, whereby more opportunities for small shop owners in the neighborhood arise. After finding out about this they became less skeptical. Universidad Piloto de Colombia The home base of this research is the Universidad Piloto de Colombia (UPC), in the section of Urban Management. For more than 25 years, the Maestría en Gestión Urbana (Masters in Urban Management) seeks to generate in their students the ability to research urban realities phenomena and problems. (Universidad Piloto, 2008). This research lies within the scope of the section of Urban Management and that is why this research is very important for the investigators in this section. They are not familiar with the concept of residential satisfaction and maybe more opportunities in this research branch are possible after this research.
Bachelor thesis Anna van Veenen 16
3 DEFINITION AND MEASUREMENT OF PERFORMANCE AND RESIDENTIAL SATISFACTION
In this chapter the first sub-question will be answered: “How can performance and residential satisfaction of housing schemes be defined and measured?” The first part of this chapter will focus on describing performance and the second part will focus on residential satisfaction.
3.1 Performance Chapter 1 described the value of evaluating the Plaza de la Hoja project based on performance. Performance is a very broad and vague concept. What is performance exactly? How can it be defined and measured? This paragraph will provide the answers to these questions.
3.1.1 Success
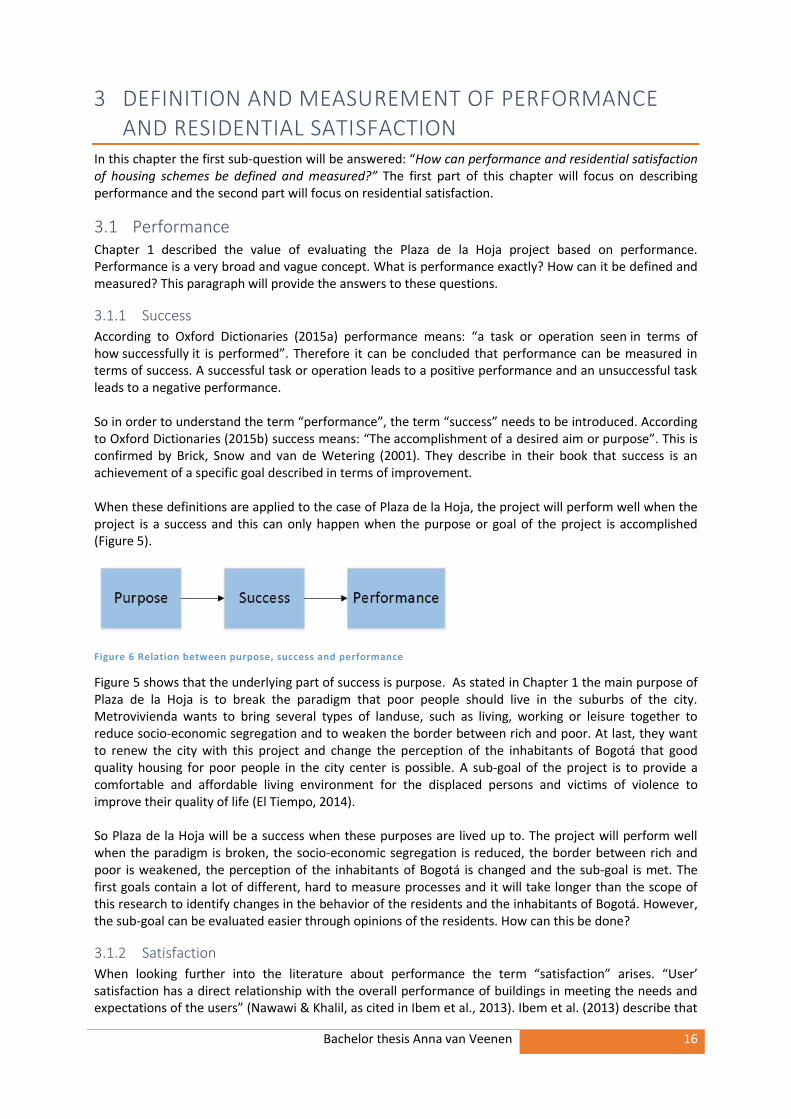
According to Oxford Dictionaries (2015a) performance means: “a task or operation seen in terms of how successfully it is performed”. Therefore it can be concluded that performance can be measured in terms of success. A successful task or operation leads to a positive performance and an unsuccessful task leads to a negative performance. So in order to understand the term “performance”, the term “success” needs to be introduced. According to Oxford Dictionaries (2015b) success means: “The accomplishment of a desired aim or purpose”. This is confirmed by Brick, Snow and van de Wetering (2001). They describe in their book that success is an achievement of a specific goal described in terms of improvement. When these definitions are applied to the case of Plaza de la Hoja, the project will perform well when the project is a success and this can only happen when the purpose or goal of the project is accomplished (Figure 5).
Figure 6 Relation between purpose, success and performance
Figure 5 shows that the underlying part of success is purpose. As stated in Chapter 1 the main purpose of Plaza de la Hoja is to break the paradigm that poor people should live in the suburbs of the city. Metrovivienda wants to bring several types of landuse, such as living, working or leisure together to reduce socio-economic segregation and to weaken the border between rich and poor. At last, they want to renew the city with this project and change the perception of the inhabitants of Bogotá that good quality housing for poor people in the city center is possible. A sub-goal of the project is to provide a comfortable and affordable living environment for the displaced persons and victims of violence to improve their quality of life (El Tiempo, 2014). So Plaza de la Hoja will be a success when these purposes are lived up to. The project will perform well when the paradigm is broken, the socio-economic segregation is reduced, the border between rich and poor is weakened, the perception of the inhabitants of Bogotá is changed and the sub-goal is met. The first goals contain a lot of different, hard to measure processes and it will take longer than the scope of this research to identify changes in the behavior of the residents and the inhabitants of Bogotá. However, the sub-goal can be evaluated easier through opinions of the residents. How can this be done?
3.1.2 Satisfaction
When looking further into the literature about performance the term “satisfaction” arises. “User’ satisfaction has a direct relationship with the overall performance of buildings in meeting the needs and expectations of the users” (Nawawi & Khalil, as cited in Ibem et al., 2013). Ibem et al. (2013) describe that

Bachelor thesis Anna van Veenen 17
performance of products or services can be evaluated through satisfaction. Kelly and Swindell (2002) confirm this by stating that satisfaction surveys are useful for evaluating service quality or -performance. When applying the term satisfaction to the case of Plaza de la Hoja it can be possible to measure the satisfaction of the inhabitants. When the satisfaction of the inhabitants is known, the overall performance of the project can be evaluated. In the context of Plaza de la Hoja “the overall performance “ is a very broad concept and it has to be specified to make it easier to measure. When looking at literature about the performance of housing schemes the terms “building performance” and “housing performance” arise (Ibem et al., 2013; Kim, Yang, Yeo and Kim, 2015; Lara & Bekker, 2012). As stated above performance of products or services can be evaluated through satisfaction (Ibem et al, 2013). This can be applied to housing schemes as well, because “buildings are like any other products” (Ibem et al., 2013). Kim et al. (2015) developed a model to evaluate housing performance. They agree with Ibem et al. that performance can be measured in terms of satisfaction: “Housing performance (…) can be defined as performance on the housing quality of the residential buildings directly related to the occupants’ satisfaction to their housing” (Kim et al., 2015). Also Lara and Bekker (2012) state that project quality performance can be evaluated through investigation of the level of satisfaction of residents. According to the authors above, it is possible to measure performance in another way than in terms of success. “Satisfaction” and in special “residential satisfaction” is a good way to determine the performance of the Plaza de la Hoja project. That is why this research will focus on this underlying part of housing performance.
3.2 Residential satisfaction In the previous paragraph several authors stated that housing performance can be evaluated in terms of residential satisfaction. However, residential satisfaction is still a vague term. What is residential satisfaction exactly? How can residential satisfaction be measured? Which factors are important? There is a lot of literature available about this interesting and well analyzed research topic. However, there are only a few cases studied in South America and especially Colombia. The Plaza de la Hoja project is a new concept of housing type so it’s hard to obtain relevant references. That is why researches from all over the world and one from Bogotá are collected and used as a theoretical framework.
3.2.1 Definition of residential satisfaction
Residential satisfaction is about the contentment of the inhabitants of residential buildings. “The primary purpose of buildings is to provide occupants with conducive, safe, comfortable, healthy and secured indoor environment to carry out different kinds of activities ranging from work, study, leisure and family life to social interactions” (Ibem et al., 2013). These are examples of the needs and desires of residents. According to Mohit, Ibrahim, and Rashid (2010) residental satisfaction can be defined as the feeling of contentment when one´s needs or desires in a house are archieved. Ibem and Aduwo (2013) agree on this by stating that satisfactory housing meets the daily needs, expectations and preferences of the occupants. Residential satisfaction is a matter of perception of the gap between residents' residential reality and expectation (Campbell, Converse & Rodgers, as cited in Huang & Du, 2015). At last residential satisfaction can be used as a tool to measure the quality of life (Amerigo & Aragones, 1997). According to these authors residential satisfaction measures the difference between the residents’ needs and expectations in housing and reality. These expectations related to housing can be divided in three components: housing quality, housing function and housing comfort (Kim et al, 2005; Elsinga & Hoekstra, 2005). However, other authors agree on the fact that residential satisfaction not only deals with the house alone. Two authors are cited often, Canter and Rees (as cited in Amerigo & Aragones, 1990; Amerigo & Aragones, 1997; Adriaanse, 2007). They found that residential satisfaction can be measured in terms of house, neighborhood and neighbors. Pérez Pérez (2011) states that the evaluation of residential satisfaction includes the satisfaction with the house, and he agrees with Canter and Rees that the

Bachelor thesis Anna van Veenen 18
surrounding environment should also be included. When looking at Figure 6 Pérez Pérez distinguishes three scales of measurement: the house, the environment and the city.
In case of Plaza de la Hoja the measurement of residential satisfaction can be divided in two aspects: housing aspects and environmental aspects. The environmental aspects can thereafter be devided in two sub-aspects as well: aspects in relation to the project and aspects in relation to the neighborhood. This creates an opportunity to evaluate the project on three different scales: house, project and neighborhood. The assumption is made that each scale will contribute equally to residential satisfaction. At last, most of the authors agree on the fact that residential satisfaction can not only be measured based on the technical aspects of the house or the facilities in the neighborhood. The perception of satisfaction can be different for the same people at different times or by different people at the same time (Ibem et al., 2013). As concluded above, residents are satisfied with their home when it meets the resident’s needs. However, the needs and desires of the residents can vary over time and that is why flexibility of the house is important (Van Rosmalen, 1994). The perception (Adriaanse, 2007) of the residents of the technical aspects of the house or the facilities in the neighborhood is more important than these aspects themselves. Every person has a different view on these aspects and that is why residential satisfaction also depends on socio-economic, demographic and household characteristics (Mohit et al., 2010; Pérez Pérez, 2011; Lara & Bekker, 2012; Ibem & Aduwo, 2013; Huang & Du, 2015). From this study of literature it can be concluded that “various housing, neighborhood and household characteristics determine the level of residential satisfaction” (Mohit et al., 2010). The relation between these aspects is shown below (Figure 7).
Figure 8 Relation between residential satisfaction and its components
Figure 7 Conceptual model of Pérez Pérez

Bachelor thesis Anna van Veenen 19
Figure 7 shows the four aspects on which residential satisfaction is based: household characteristics, housing aspects, project aspects and neighborhood aspects. These aspects can be divided into smaller factors of influence. These factors are objective, but they will become subjective when residents give their opinion about them (Amergigo & Aragones, 1997). That is why it is hard to measure residential satisfaction quantitatively.
3.2.2 Measurement of residential satisfaction
The most common way to measure residential satisfaction is through questionnaire surveys (Kim et al., 2005; Adriaanse, 2007; Mohit et al., 2010; Ibem & Aduwo, 2013; Huang & Du, 2015). Residents can rate their amount of satisfaction regarding the different factors on a scale from 1 (very dissatisfied) to 5 (very satisfied). Then it is possible to compare the ratings or to find relationships between factors through statistical analyzes. Before the questionnaires can be designed, it is necessary to collect all the factors which are related to residential satisfaction. This will be done structurally by following the model in Figure 7. The factors are found through literature study and will be organized with respect to the authors that mention them. In total there are 15 references that contributed to the selection of the factors in this research. They are given a number to simplify the notation (Table 1). The names and the contents of the factors may differ per author; all the meanings are included in the tables. Table 1 Authors related to numbers
Number Author Number Author
1 Ministerio de Ambiente, Vivienda y Desarrollo Territorial (2013)
9 Alcaldía mayor de Bogotá D.C. (2011)
2 Amérigo and Aragonés (1990) 10 he National Affordable Homes Agency (2008)
3 Elsinga and Hoekstra (2005) 11 Ibem and Aduwo (2013) 4 Adriaanse (2007) 12 Lara and Bekker 2012) 5 Huang and Du (2015) 13 Mohit et al. (2010) 6 van Rosmalen (1994) 14 Own insight 7 Pérez Pérez (2011) 15 Metrovivienda (2015) 8 Kim et al. (2005) Housing aspects At first the factors related to the house will be analyzed. These factors can be divided into two groups: apartment features and housing services. Apartment features are related to the constructional aspects of the apartment and housing services are more related to the facilities inside the apartment. Apartment features The most basic and physical elements of a house are covered by the apartment features of the residence. The factors with respect to the unit features of the house are sorted and displayed below in Table 2. Table 2 Apartment feature factors
Factor Interpretation Authors
Area of the house The total area in m2 2, 5, 6, 7, 12, 15
Layout of the house The number, division and distribution of rooms 1, 4, 6, 7, 11, 12, 15
Location of the house in the building
11
Bedroom The size and number of bedrooms. Satisfaction with the (facilities of the) bedroom
1, 5, 6, 10, 11, 12, 13

Bachelor thesis Anna van Veenen 20
Kitchen The size of the kitchen. Satisfaction with the kitchen. Presence of dining room.
1, 2, 10, 11, 12, 13
Living room Size of the living room. Satisfaction with the (facilities of the) living room.
6, 10, 11, 12, 13
Bathroom Number of bathrooms and facilities (shower, sink, toilet). Satisfaction with the bathroom
1, 2, 3, 6, 10, 11, 12, 13
Other rooms Washing area, study or work area 1, 3, 10, 13 Storage Storage or pantry 1, 10, 11, 12 Garden or balcony If present: size and orientation 3, 4, 6, 10, 12 Construction Quality, construction materials, finishes 1, 2, 3, 6, 8, 9,
11, 12, 15 Roof/ceiling Condition and quality of the roof. Height of ceiling 1, 3, 6, 10, 12 Walls Quality, material and finish of walls 1, 6, 9, 12, 15 Floors Quality, material and suitability of floors 1, 6, 10, 12 Windows Amount and type of glazing 8, 10, 12 Doors Size 6, 12 Protection against outside conditions
Protection against the weather, animals, natural disasters. Insulation. Earthquake and flooding resistance
1, 2, 6, 7, 8, 10, 14, 15
Multifunctional/flexible Possibility to change room function. Possibility to expand
6, 7, 15
Light Natural and artificial light 1, 2, 3, 6, 7, 8, 10, 11, 12
Ventilation Natural and mechanical air ventilation 1, 2, 6, 8, 10, 12, 13
Temperature Temperature (control) 1, 3, 7, 8, 10, 15
Humidity Damp problems and humidity control 1, 2, 3, 6, 8 Noise Noise of neighbors, traffic, industries, airplanes or
youths (if any) 6, 7, 8, 10, 14
Sustainability Sustainable use of materials 1, 10 Comfort Comfortable and Ambience. Comfort consists of:
temperature, humidity and amount of daylight inside, the finishes of the walls and the noise level
2, 4, 7, 14
View Perception of the view. Orientation of the house 2, 5, 6, 8, 10 Housing services Not only are the most basic elements of a house important to define the housing aspects, the derivatives of them are equal as important. The factors with regard to the housing services are sorted and displayed below in Table 3.
Table 3 Housing service factors
Factor Interpretation Authors
Costs The cost of the house and services 3, 6, 7, 9, 11, 12, 15
Waste disposal Present? Garbage collection 1, 12, 13 Drainage/sewerage (external) Drainage. Connection to sewerage
system 1, 9, 12, 13, 15
Maintenance/cleaning Condition of the house. Easiness to clean and maintenance facilities
1, 4, 6, 7, 11
Connection to water, energy, communication networks
Present? Access to (warm) water, electricity, gas, internet, TV and/or telephone
1, 7, 8, 9, 10, 11, 12, 15

Bachelor thesis Anna van Veenen 21
Installations Gas and electricity installations 7, 15 Lighting in public areas Present? Quality 10 Sockets and switches Amount and location 10, 13 Accessibility Accessibility of the house (for disabled). 1, 7, 10 Child friendly Is the house designed for living with children? 10 Safety Perception of safety in the apartment. Consists of:
smoke alarm, fire extinguisher or sprinklers, gas and electricity installations, wiring and sockets, and lightning protection
1, 10, 13, 14, 15
Security Perception of security in the apartment. Consists of: the type of lock on the front door and the risk of burglary
11
Privacy Perception of privacy 1, 11, 12 Leisure The possibility to leisure 1, 15 Project aspects Second, the project aspects will be analyzed. The project includes everything what is situated at and under the project site. This includes all the residential buildings, the open space, parking garage (if present) and the entrance road(s). Like the housing factors, the project factors can be divided in technical and social aspects. The project factors are listed below in Table 4. Table 4 Project factors
Factor Interpretation Authors
Area The area of the project site in m2 7, 15 Aesthetics The perception of the looks and the way the
buildings fit in the environment 1, 6, 7, 10, 11, 12
Orientation/spatial cohesion Orientation and use of the site. 6, 10 Location Location of the project site in the city 14, 15 Number of floors 7, 15 Stairs and elevator Present? 10, 12, 13, 15 Entrance lobby Present? Double entrance 10, 12, 15 Open spaces The amount and area of open spaces between the
buildings 10, 13
Public areas The type and area of public or communal areas. Public services
1, 7, 9, 10, 11, 13, 15
Vegetation and green areas The type, quality and area of green areas. Water, trees and vegetation
1, 6, 7, 9, 10, 12, 15
Land use and landscaping Distribution of the built-up/non built-up areas 8, 10 Condition of the ground Ground type and pollution 1 Accessibility Infrastructural accessibility. Accessibility for police,
firefighters and ambulances 1, 6, 7,10
Parking Parking facilities for cars (and bicycles) 12, 13, 14, 15 Collection garbage Place for collection and disposal of solid waste and
garbage. Bin storage 1, 9, 10
Emergency services Escape routes and exits. Firefighting facilities 1, 15 Maintenance Condition of the buildings 11 Density Amount of houses per m2 1, 6, 7 Occupation rate Number of occupied houses divided by the total
number of houses 1, 9
Relation with neighbors Type of relation and contact with neighbors 2, 4, 13 Rate of attachment/urge to move out
2, 4

Bachelor thesis Anna van Veenen 22
Livability Wind protection. Providing shade. Neighborhood friendliness
4, 10, 12
Pollution Environmental quality. Air, water, ground and light pollution. Garbage. Perception of pollution at the project site
1, 6, 8, 9, 12, 14
Sustainable use of water and energy
Possibility of recycling grey water. Green roofs. Implementation of solar panels
1, 8, 10, 15
Safety Perception of safety. Consists of: escape routes and exits, firefighting facilities and adequate lighting. Earthquake and fire resistance
6, 9, 12, 14, 15
Security Perception of security at the project site. Consists of: surveillance, security cameras, the amount of crime and a fence around the project site
12, 14, 15
Privacy Perception of privacy 6, 12 Noise Perception of noise and quietness at the project
site (if any) 6, 9, 10, 11, 12, 13
Smell Perception of smell on project site (if any) 6, 9 Flexibility Flexibility of land use and function of the building 6, 7, 14 Rules and regulations 11 Neighborhood aspects Neighborhoods are geographically bounded groupings of households and institutions connected through structures and processes (Coulton et al., as cited in Foster and Hipp, 2011). However these boundaries are hard to define. The district of the Plaza de la Hoja project is called Puente Aranda, but this area is too big to consider as the neighborhood. The name of the neighborhood is Cundinamarca, but this will be too small to cover all the facilities. Furthermore, Plaza the la Hoja is situated close to the border of the district and the residents may cross this border to reach the closest facilities. The neighborhood in this context will be defined in ArcGIS after the most important facilities are located. An overview of all the factors is given in Table 5.
Table 5 Neighborhood factors
Factor Interpretation Authors
Employment Access, distance and traveling time to employment and job opportunities
1, 7, 11
Healthcare Access, distance and traveling time to hospital, clinic, ambulance, pharmacy or other healthcare facilities
1, 2, 5, 10, 11, 12, 13
Police station Distance and traveling time 1, 13 Fire station Distance and traveling time 1 Education (primary) Access, distance and traveling time to
kindergarten, preschool and elementary school 1, 5, 6, 10, 11, 12, 13
Education (secondary) Access, distance and traveling time to high school and university
1, 6, 10, 11, 12, 13
Industry Presence of polluting industries 1, 10 Gas station 14 Veterinarian Distance and traveling time 1 Post office Distance and traveling time 1, 10 Park and green areas Access, quality, distance and traveling time 1, 2, 5, 6, 7, 8,
10, 12 Playground Distance and traveling time 1, 6, 10, 12, 13 Shops and markets Distance and traveling time to shops,
(super)market and /or commercial center 2, 5, 6, 10, 11, 12, 13

Bachelor thesis Anna van Veenen 23
Restaurant or café Distance and traveling time. Also community kitchen or food bank
10, 14
Sport facilities Access, distance and traveling time to recreation, running and sport areas
1, 10, 11, 12
Cinema, theatre or concert room
Access, distance and traveling time 1
Bank or cash point Distance and traveling time 10 Airport Access, distance and traveling time. Noise
pollution form airplanes 10
Library Distance and traveling time 13 Church Distance and traveling time to a church, mosque or
other place of worship 10, 12, 13
Public telephone Distance 10, 13 Public transport Distance and traveling time to different modalities
(bus, metro, train, taxi) 1, 6, 7, 8, 10, 12, 13
Cost and supply of transportation
Supply meets demand? Cost per modality 7
Roads and infrastructure Quality of infrastructure. Motor or railway near? Disclosure
2, 6, 7, 10, 11, 12, 13
Parking facilities Distance to parking facilities for cars 6, 8, 10, 12, 13 Distance/time to city center 2, 5, 7, 12, 13 Amount of accidents Number of traffic accidents in the neighborhood 13 Safety Perception of safety in the neighborhood. Consists
of: lighting at night, amount of traffic accidents and the presence of high voltage power lines
2, 6, 8
Security Perception of security in the neighborhood. Consists of: surveillance, security cameras, amount of crime and the presence of a police station
5, 8, 10, 11, 14
Privacy Perception of privacy in the neighborhood 12 Noise Perception of noise and quietness in the
neighborhood (if any) 2, 5, 10, 12
Lighting at night Quality and perception 2 Pollution Origin and types of pollution in the neighborhood.
Ground, air and water pollution. Perception of pollution
1, 2, 5, 8, 10
Possibility of natural disasters The possibility of earthquakes and flooding after heavy rainfall
8, 14
High voltage power lines Present? 10 Prices and quality of services Prices and quality of services in the neighborhood
like food, drinks, clothes etc. 11

Bachelor thesis Anna van Veenen 24
Household characteristics At last, the household characteristics are analyzed. They are important because they identify the residents and make it possible to compare results based on socio-economic and demographic factors of the residents. The factors with respect to the household characteristics are listed below in Table 6.
Table 6 Household factors
Factor Interpretation Authors
Age 2, 3, 5, 6, 9, 11, 12
Gender 5, 9, 11, 12 Marital status 11, 12 Education level The highest level of education 2, 5, 9, 11 Origin Previous address 2, 12 Household size Number of persons in the household 3, 5, 9, 11, 12 Household income Monthly income per person or whole household 3, 5, 6, 11, 12 Occupation/employment sector
5, 11, 12
Type of house 3, 5, 6, 7, 11, 12
Length of residence Amount of time that the resident lives in the same home
2, 5, 11
Time in neighborhood Amount of time that the resident lives in the same neighborhood
2
Tenure Tenure status 1, 3, 11, 12 Reason to move 12 Density Amount of residents per m2 2, 9 Youngest child Age of the youngest child 2 Relatives (in area) Presence of any relatives in the neighborhood 2, 12 Home improvements 2 Health Healthcare class. Lifestyle 6, 7, 14 Car/bike possession 12, 14 Main modality of transport Auto, bus, train, bicycle, walking, taxi 14 Now all the important factors for measuring residential satisfaction are defined, the most relevant ones for the Plaza de la Hoja project have to be selected. This will be based on brainstorming, interviews with Metrovivienda and in-situ observations.

Bachelor thesis Anna van Veenen 25
4 SELECTION OF FACTORS In the previous chapter all kind of different factors related to measuring residential satisfaction are defined. Not all of these factors will be suitable to include in the model for Plaza de la Hoja. In this chapter the second sub-question will be answered: “Which factors are important in the context of measuring residential satisfaction of housing schemes in Bogotá? It is too confusing to provide every single factor with an argumentation why they should be included or not. By brainstorming, observation and an interview with Metrovivienda technical and social information about the project is acquired. The most important factors are selected from this information and divided into two categories. Each category describes a different approach for collecting the data. It is possible that some specific factors are in both categories.
1. The first category of data will be collected by personally observing the neighborhood. 2. The second category of data are the subjective factors that will be evaluated through opinions by
the residents. Some instruments have to be developed to obtain and evaluate the right factors. One instrument will be used to select the factors and two other instruments to measure the factors. The instrument that will help to select the factors is a list of questions that will be conducted during an interview with Metrovivienda. These questions are related to the project and the current residents in general, and some technical aspects of the house and project. These questions can be found in Appendix A. The first instrument that will be used to measure residential satisfaction is a network analysis in ArcGIS to get a better overview of the facilities in the neighborhood. The second instrument is a questionnaire which will indicate the expectations and the amount of satisfaction of the residents about their new apartments.
4.1 Technical aspects of the project The social aspects of Plaza de la Hoja and its residents can be found throughout Chapter 1 and 2, but no specific technical information is provided in those sections. In order to select the most adequate factors also technical information is needed. The Plaza de la Hoja project consists of 457 apartments which are all the same. The apartments are distributed over twelve towers: six towers of six floors and six towers varying between twelve and sixteen floors. The main construction material is reinforced concrete and some bricks as finishing. The area of one apartment is 50 m² and in the beginning the layout is the same. The only apartments which are slightly different are the ones for disabled residents. However, the walls inside the apartment are made of drywall and are easily to remove or build elsewhere. The apartments are flexible and the residents can decide if they want to change the size and function of rooms. In the beginning the apartment contains two bedrooms, an open kitchen with living room and a bathroom. All the “wet” rooms like the kitchen, bathroom and laundry area are in the same column. An overview of the layout of one apartment is shown in Figure 8. The equipment of the rooms is just an example in this figure. The sixth floor of the project connects all the towers with an open garden. This is nice for the residents, since the apartments don’t have a garden or balcony on their own. These green areas contain urban farming. They are used to reduce the amount of carbon dioxide and to train the residents to maintain these areas and develop knowledge in agriculture (Metrovivienda, 2015). The courtyard can be used as a playground for children. It is safe because the courtyard is surrounded by the apartments whereby social control is created. Besides this green area on the roof there are no other parks or green areas on the project location. Regarding to safety and security, the project is very safe. There is an entrance lobby so only the residents can enter the building without permission. The buildings meet all the restrictions regarding to earthquakes and fire. There are many escape routes and stairs so the residents can safely leave the building, even in the taller buildings. However, it is remarkable that there is no fence around the project

Bachelor thesis Anna van Veenen 26
site, this is very common in Bogotá. This design choice has been made to integrate the project with the surrounding environment and to make the first floor more accessible. In order to create a safer ambience there are fences placed on the windows of the first floor.
Figure 9 Top view apartment. Source: Metrovivienda
The first floor of the project is totally dedicated to public facilities and apartments for disabled residents. Furthermore, it is possible to open small shops to increase the commerce in the neighborhood. At this moment in time, there are no facilities located at the first floor. This will be developed later. The aspects named above are the most basic, but specific aspects of the Plaza de la Hoja project. However, there are some factors which are special in housing scheming in Bogotá.
1. Parking lots: the project is not provided with private parking lots for cars. The government wants to discourage the car use by this measure. Another reason is that in front of the project green areas will be realized and there is simply no space for parking lots. The residents can park their cars in parking garages in the neighborhood. However, if the residents own a car, this is quite expensive.
2. Heater: most of the housing schemes in Bogotá are not provided with a heater because it is not strictly necessary in this climate. Plaza de la Hoja is an exception, because the residents are coming from all parts of Colombia which are a lot warmer. In order to welcome the residents and make them feel more comfortable, Metrovivienda decided to provide them with a heater running on bio-gas.
3. Outdoor gym: The gym is very expensive in Bogotá and that is why more free fitness facilities arise in parks and other public areas. They look like playground equipment, but after taking a closer look they are outdoor gym equipment. Plaza de la Hoja provides some of this equipment at the third floor.
Now that the social and technical aspects of the project are determined, the most important factors can be selected and distributed over both categories.
4.2 Factors for observation All the observations will be done in the scale of the neighborhood, because it requires more exploration and the technical factors of the house and the project are already provided by Metrovivienda and in-situ observations. The result is listed below in Table 7.

Bachelor thesis Anna van Veenen 27
Table 7 Factors for observation
Scale Factors
Neighborhood Employment Healthcare Education (primary and secondary) Industry Parks and green areas Church Shops and markets Restaurant or café Sport facilities Bank or cashpoint Library Public transport
4.3 Factors for asking This category includes the subjective factors that will be evaluated by the residents. There are two groups of residents: the first group is living in the project at the moment and the second group not. Because there is not enough time to interrogate both groups and to compare the answers, only the first group will be questioned. In order to indicate the resident’s expectations one open question about this will be included. The rest of the questions will be used to identify the household characteristics and to measure the amount of satisfaction with respect to the following factors (Table 8). Table 8 Factors for asking
Scale Factors
House Location of the house in the building Walls Area Layout Bedroom Connection to water, energy and
communication networks Kitchen Living room Bathroom Sewerage Comfort View Accessibility Safety Security Privacy Noise Project Aesthetics Accessibility Location Parks and green areas Security Pollution Safety Neighborhood Education (primary and secondary) Healthcare Parks and green areas Bank or cashpoint Sport facilities Library Church Supermarket Market place Pollution Public transport Household Gender Age characteristics Marital status Education level Occupation Origin Household size Main modality of transport Health Now all the important factors are selected the two measurement instruments can be developed and conducted. First the neighborhood analysis will be conducted and evaluated in Chapter 5 and second the implementation and the results of the questionnaire will be discussed in Chapter 6.

Bachelor thesis Anna van Veenen 28
4.4 Assessment framework Chapter 5 and 6 will together answer the last sub-question: “How can these factors be combined into an assessment framework or model and what are the results?” For the sake of clarity, in this section a preview of the assessment framework will be explained. As stated in this chapter, the residential satisfaction will be based on two instruments: a neighborhood analysis and a questionnaire. But how are they connected and how do the results contribute to residential satisfaction? In Paragraph 3.2.1. is stated that the three scales: house, project and neighborhood will be evaluated equally, so each scale will contribute 1/3rd to residential satisfaction. However, the neighborhood scale will be evaluated by both instruments and therefore the contribution of this scale will be divided in two. The contribution of the neighborhood analysis and the questionnaire will both be 1/6th. An overview of the instruments and the connection with residential satisfaction is shown in Figure 9. The interpretation of the evaluation model and the contribution of the factors to residential satisfaction will be made clear in the next chapters.
Figure 10 Connection instruments to residential satisfaction

Bachelor thesis Anna van Veenen 29
5 NEIGHBORHOOD ANALYSIS The first part of the assessment framework of measuring residential satisfaction consists of an analysis of the facilities in the neighborhood. The neighborhood of Plaza de la Hoja is called Cundinamarca and is located in the district of Puente Aranda. Below, an overview is shown of the district and the location Plaza de la Hoja in the neighborhood (Figure 10). As this figure shows, the project is situated close to the boundaries of the neighborhood and the district.
Paragraph 3.2.2. describes that the boundaries of a neighborhood are hard to define. The Cundinamarca neighborhood is too small to facilitate all the important factors (Table 9), and on the other hand, the Puente Aranda district is too big. A quick analysis in Google Maps tells us that every factor, except for the library and sport accommodation, lies within 1000 meter (as the crow flies) of the Plaza de la Hoja project. In the scope of this research, the neighborhood will be roughly defined as every spot within 1000 meter from the Plaza de la Hoja project. Table 9 Factors to analyze
Employment Healthcare Education (primary and secondary) Industry Parks and green areas Church Shops and markets Restaurant or café Sport facilities Bank or cashpoint Library Public transport
The location of the other factors is based on in-situ analyses and the research of Marulanda (2014). She analyzed the Cundinamarca neighborhood in order to give an advice about the local commerce and the impact of high-rise buildings. Her research includes an analysis of the facilities in Cundinamarca and its surroundings and is therefore useful for analyzing the neighborhood of Plaza de la Hoja. An overview of the facilities in the neighborhood is shown in Figure 11. The exact distances from the Plaza de la Hoja project to these facilities will be analyzed in ArcGIS. The factor employment will be eliminated in this analysis because this factor is very broad and difficult to locate specifically.
Figure 11 Overview district and neighborhood

Bachelor thesis Anna van Veenen 30
Figure 12 Overview facilities
5.1 Analysis in ArcGIS In order to obtain the influence of the neighborhood on the residential satisfaction, the exact distance is needed. The factors will be divided in categories of importance. The facility will obtain an average score of 3 when the recommended distance is reached. How further away the facility is how lower the score and how closer the facility is how higher the score. The only negative factor is industry, the score for this factor will be the other way around. The distribution of the factors and the determination of the distances are based on the document “Calidad en la vivienda de Interés Social” (Ministerio de Ambiente Vivienda y Desarollo Territorial, 2011). The assessment framework is shown below in Table 10.
Table 10 Distribution of factors in relation to distance (in meters)
Category Factors 1 (Very far) 2 (Far) 3 (Not far not close)
4 (Close) 5 (Very close)
1 Kindergarten Shops and markets Restaurant or café Public transport Parks and green areas
600+ 450-600 450-350 200-350 200-0
2 Primary school Church Healthcare Bank or cashpoint
1200+ 950-1200 950-650 400-650 400-0
3 High school University Sport facilities Library
3000+ 2400 -3000 2400 -1600 1000 -1600 1000-0
4 Industry 150+ m 120-150 120-80 50-80 50-0
The facilities are implemented in ArcGIS and a network analysis is conducted to find out the routes to the closest facilities. In Bogotá most roads are only one way and the provided network data does not include the directions of the roads. Furthermore, most inhabitants of Plaza de la Hoja are not in possession of a car and therefore the walking routes are calculated. The routes are shown on the next page in Figure 12.

Bachelor thesis Anna van Veenen 31
Figure 13 Calculated routes
The starting point of all routes is the orange square, located at the entrance of the plaza de la Hoja project. The orange circles are the endpoints of the routes located at the entrance of the facilities. It is noticeable that no route to the bank is generated. This is because further insight provides that the location of more cash points are in the shopping center Calima, which is the middle red block in Figure 11. Other strange routes are the ones to the park (green area) and the supermarket (the left red block). This is because it is not possible to cross the major road at the south-west of the project location. An alternative route is found, but the result is a longer walking distance. The distances to the closest facilities are calculated in ArcGIS and written down below (Table 11). The distance is compared to the assessment framework in Table 10 and the final average score is calculated. Table 11 Results ArcGIS analysis
Factor Distance (m) Score
Kindergarten 0 (inside the project) 5
Primary school 265 4
High school 807 5
University 2312 3
Healthcare 473 4
Shops and markets 675 1
Restaurant or café 385 3
Parks and green areas 986 1
Sport facilities 3130 1
Church 102 5
Library 1723 3
Bank or cashpoint 669 3
Public transport 290 4
Industry 250 5
Average 3,36
This average value of 3,36 will count for 1/6th of the total score of residential satisfaction (Figure 9).

Bachelor thesis Anna van Veenen 32
6 IMPLEMENTATION AND RESULTS QUESTIONNAIRES The second and the biggest part of the assessment framework of measuring residential satisfaction consists of conducting a questionnaire. In this questionnaire the residents can give their opinion in terms of amount of satisfaction. The residents can rate their amount of satisfaction on a scale from 1 (very unsatisfied) to 5 (very satisfied) with respect to the selected factors (Table 8). The household characteristics will not contribute to the value of residential satisfaction, but will be used to explain possible differences in the outcome. The final version of the questionnaire can be found in Appendix B. The answers to the questions are stored orderly in an Excel spreadsheet to maintain the overview and to make quick calculations.
6.1 Implementation The questionnaire was designed in different phases and piloted twice at the UPC in order to remove the mistakes and delete insignificant factors. The hardest part of the implementation was to get in contact with the residents. Luckily, a few weeks earlier during in-situ observations two phone numbers of residents were acquired. One of these residents was phoned and interviewed over the phone, because she did not have time to make an appointment. The rest of the questionnaires were conducted during one Friday and Saturday at the entrance of the Plaza de la Hoja project with another student, Jairo. The site is provided with strong security and entering the project to conduct the questionnaires was not an option. All the questionnaires were conducted orally in order to make sure the questions were understood correctly and to obtain the most honest answers. This took more time than handing the questionnaires over, but the required data is more pure. In the end 26 residents were interviewed.
6.2 Valuating the factors In order to get a final indication of the level of residential satisfaction the subjective opinions about the factors have to be quantified. As mentioned earlier it is possible to rate the amount of satisfaction on a scale of 1 to 5. It is possible to give “no answer” (NA) to some the factors if the residents are not able to rate them, because they are not familiar with them or do not use them. These “NA’s” will not be taken into account when averaging the ratings. The averages will be multiplied by the amount of contribution as stated in Figure 8. The sum of the weighted averages, including the neighborhood analysis, will give the final indication of residential satisfaction. When looking at the questions in the questionnaire, most factors are easy to rate on a scale from 1 to 5, but some factors are more difficult to rate. These factors are summed up below based on the question number and an explanation about the quantification of these questions is given.
6. The number of residents per apartment can influence the level of satisfaction. At this moment all the apartments have two bedrooms and according to the Ministerio de Ambiente Vivienda y Desarollo Territorial (2011) the maximum amount of residents per bedroom is 3. Assuming that the parents and children have separate rooms, the maximum number of residents will be 5. When this criterion is met the score will be 4 points and when not the score will be 2 points.
13. Although this question is in the section of household characteristics, the amount of communication services contributes to residential satisfaction. When the answer is “none” a score of 1 point will be assigned. When the answer includes one of the provided communication services a score of 2 points will be assigned. When the answer includes two of the provided communication services (all possible combinations) a score of 4 will be assigned. At last, when all three of the communication services are used by the resident a score of 5 will be assigned.
15. These questions are about noise and pollution. When there is noise or pollution present, the 19. rating will be negative and when there is no noise or pollution the rating will be positive. In terms 23. of numbers this will result in 2 points when the answer is “yes” and 4 points when the answer is
“no”.

Bachelor thesis Anna van Veenen 33
17. This question is opposite of the previous ones, because it is positive when it is possible to generate income in the apartment and negative when it is not. When the answer is “yes” a score of 4 points will be assigned and when the answer is “no” a score of 2 points will be assigned.
21. This question is used to indicate the facilities or aspects that the residents miss in their
environment. These answers will not be quantified, but will be used to give recommendations about the project.
24. This question is used to get an indication about the importance of the factors. If one category is
valued high by many residents, this can mean that improvement in that specific category is needed or that they collectively value that category.
25. The last question is used to obtain more information about the expectations of the residents.
They can give their opinion about aspects or factors that they thought would be different. This will be used to check consistency in the answers.
6.3 Results In this paragraph the final grade of residential satisfaction and the results of the questionnaires are displayed. First the factors with respect to the house, project and neighborhood which can be valued on a scale of 1 to 5 are organized related to the amount of residents that gave the same answer. Second, the most common answers to the open questions are assessed and at last the household characteristics are analyzed. The results with respect to all three scales are shown below (Table 12, 13, 14). The orange rows present the possible answers and the numbers below present the amount of residents that gave that specific answer.
Table 12 Results with respect to the house
Answer 1 2 3 4 5 NA Average St. Dev.
Ap
artm
ent
feat
ure
s
Amount of residents 0 8 0 18 0 0 3,38 0,94
Communication 21 2 0 2 1 0 1,46 1,10
Total area 0 2 0 23 1 0 3,88 0,59
Layout 0 2 2 20 2 0 3,85 0,67
Finishes 0 8 4 9 1 4 3,14 0,99
Size bedroom 0 5 6 15 0 0 3,38 0,80
Light bedroom 0 0 1 22 3 0 4,08 0,39
Size kitchen 0 6 1 17 2 0 3,58 0,95
Light kitchen 0 2 0 23 1 0 3,88 0,59
Size living room 0 5 1 20 0 0 3,58 0,81
Light living room 0 0 0 24 2 0 4,08 0,27
Size bathroom 0 6 4 15 1 0 3,42 0,90
Comfort 0 3 1 21 1 0 3,77 0,71
View 0 1 0 16 9 0 4,27 0,67
Noise 0 5 0 21 0 0 3,62 0,80
Ho
usi
ng
serv
ice
s
Water supply 1 0 0 22 1 2 3,92 0,65
Sewerage 0 0 1 21 1 3 4,00 0,30
Safety 1 5 2 9 0 9 3,12 1,05
Security 2 6 3 8 1 6 3,00 1,17
Privacy 1 2 1 19 2 1 3,76 0,88
Accessibility 4 4 2 15 1 0 3,19 1,23
Generate income 0 18 0 7 0 1 2,56 0,46

Bachelor thesis Anna van Veenen 34
Table 13 Results with respect to the project
Answer 1 2 3 4 5 NA Average St. Dev.
Pro
ject
Design 0 8 2 16 0 0 3,31 0,93
Accessibility car 1 3 2 17 1 2 3,58 0,93
Accessibility bike 0 2 0 19 1 4 3,86 0,64
Accessibility public transport
0 2 0 22 1 1 3,88 0,60
Location 0 0 0 14 12 0 4,46 0,51
Parks and green areas 4 5 3 12 1 1 3,04 1,24
Safety 4 7 5 7 1 2 2,75 1,19
Security 4 8 2 10 1 1 2,84 1,25
Pollution 0 6 0 20 0 0 3,54 0,43
Table 14 Results with respect to the neighborhood
Answer 1 2 3 4 5 NA Average St. Dev.
Ne
igh
bo
rho
od
Kindergarten 0 3 0 11 0 12 3,57 0,85
Primary education 0 2 1 13 0 10 3,69 0,70
Secondary education 0 3 2 10 0 11 3,47 0,83
University 0 4 2 4 0 16 3,00 0,94
Healthcare 1 3 1 14 1 6 3,55 1,00
Parks and green areas 4 6 2 8 0 6 2,70 1,22
Sports center 3 5 1 2 0 15 2,18 1,08
Library 2 6 0 4 0 14 2,50 1,17
Church 1 0 1 20 3 1 3,96 0,73
Supermarket 0 1 1 22 2 0 3,96 0,53
Market place 0 1 1 21 2 1 3,96 0,54
Bank or cashpoint 0 0 0 22 0 4 4,00 0,00
Transmilenio 1 2 3 15 3 2 3,71 0,95
SITP 1 1 2 9 6 7 3,95 1,08
Collective bus 0 3 1 15 5 2 3,92 0,88
Pollution 0 10 0 16 0 0 3,23 0,99
6.3.1 Open questions Besides these scaled questions there are some other open questions with respect to the noise, pollution, facilities that were missing, importance of factors, and expectations. Noise Most residents did not complain about noises in their apartments. Some did complain about the traffic, which was clearly hearable in the apartments, but very common in Bogotá. There are almost no apartment blocks in the city which are not suffering from traffic noises. The second source of noise was neighbors, because the walls are very thin. Pollution There were some more complaints about pollution. The project site is kept very clean and the garbage collection system works fine, but the neighborhood is not that neat. The most mentioned pollutions are: traffic, industries and homeless people on the street. Some residents complained about garbage, dogs and the smell of gas, but these are examples of individual observations.

Bachelor thesis Anna van Veenen 35
Missing facilities The residents could indicate which aspects or facilities they were missing in the neighborhood or in general. Most of the residents mentioned the absence of parking lots at the project site and in the neighborhood, even the residents which do not have a car. It is a special feature of the Plaza de la Hoja project to discourage the car use, but most residents are not happy with this strict measure. Other often mentioned facilities are a fence around the project site and more surveillance. A fence is very common in housing schemes in Bogotá, but around Plaza de la Hoja it is not included. The residents feel, combined with a lack of surveillance, less secure and this can be seen in the lower ratings of safety and security in the project scale (Table 13). The third mentioned facility is a park or green area. Most residents have small children and there is no playground or park close by for them. The absence of green areas gives a more industrial look to the Plaza de la Hoja project and results in lower ratings with respect to the design and the amount of parks and green areas (Table 13 and 14). At last the poor realization of communicative services is mentioned. Most residents do not have an internet, TV or local telephone connection and would like to have access to them. They are mad at Metrovivienda that they were promised an internet connection, but still not have received it. Other individuals mentioned that they were missing: local commerce, sports center, library, better accessibility, dining room, and more organization from Metrovivienda. Importance of factors This question was included to look for a pattern in the interests of the residents to match with the given answers. Most residents put the category safety and security high which matches with the answers. The score of safety and security is lower than average and this indicates that the residents will most likely put effort in improving the safety because it is important to them. The second important category is noise and pollution and this is a remarkable outcome, because residents are not very critical about these two aspects. The least important categories to the residents are with respect to the physical and subjective aspects of the apartment. They do not pay much attention about the design and facilities of their apartment, they just want a place to live in. Expectations The last question was included to obtain expectations of the residents. However, most of the time the question was answered with a simple “yes”. Only two of the respondents thought that their house would be bigger and two other respondents got a whole different apartment than promised.
6.3.2 Final result In order to answer the second part of the third sub question “And what are the results?” the answers to the questionnaires have to be combined according to the established model (Figure 7). According to this model the factors with respect to the house, project and neighborhood contribute to the final rate of residential satisfaction. The average of every scale is calculated and multiplied by the set factors as defined in Figure 9. The result is the following calculation:
Average Factor Weighted average
House 3,50 0,33 1,17
Project 3,47 0,33 1,16
Neighborhood 3,46 0,17 0,58
Neighborhood analysis 3,36 0,17 0,56
Total
3,46
The total value of residential satisfaction is 3,46, which is above the average of 3. A quick conclusion is that the residents are indeed satisfied with their home. However, further analysis of the standard deviation of the factors and the influence of household characteristics are needed to draw a more sophisticated conclusion.

Bachelor thesis Anna van Veenen 36
6.3.3 Household characteristics Now the final score of residential satisfaction is determined the influence of different household characteristics can be analyzed. However, there is not enough data to make specific statistical analyses or correlations between the factors, so the conclusions will be qualitative in nature. Remarkable is that almost 85% of the interviewed residents has moved from Bogotá. Ortegón (2015) told us that the residents would come from all parts of Colombia, but the results do not show that. Maybe this is because the questionnaires were conducted in an early state when not all residents have moved in. It could take more time for the residents who used to live further away to move to Bogotá and maybe that is why they were not interrogated. Gender The majority of the respondents was female. This is due to the moment of interrogation, because the questionnaires were conducted during two afternoons. This is the most common moment for most men to be at work. There is almost no difference in outcome of residential satisfaction between males and females. Females score an average rate of 3,47 and males score a bit lower, but almost the same. Their score is 3,45.
Age The biggest part of the respondents was between 21 and 65 years old. This is favorable, because this is the group of adults that can give an adequate opinion about their house and residential satisfaction. The older residents (41+ years) score higher than the younger residents. Their scores are 3,50 respectively 3,43, but still the difference is very small.
Marital status It is remarkable that most respondents just live together with their partner and are not married. Maybe this is because of financial security. The group of people living without a partner is not big enough to make a comparison between them and the group with partner.
Education level Most residents have enrolled in some sort of education. Only one woman did not have had any education at all. None of the residents have gone to university, because they simply cannot afford it. There is almost no difference in outcome between the different education levels.
42%
58%
Male
Female
11%
46% 35%
8%
0-20 years
21-40 years
41-65 years
66+ years
15%
62%
19%
4% Married
Living togetherwith partner
Single
Widow(er)
27%
61%
8% 4%
Primary
Secondary
Technical
Other

Bachelor thesis Anna van Veenen 37
Household size There is a big variation of the amount of residents per apartment. The majority of the families stay below the maximum of 5 persons per apartment, but there are some families that exceed this margin. These larger families obtain a clearly lower score of 3,36 in comparison to the score of 3,50 of the smaller families, because they are less satisfied with the sizes of the rooms.
Occupation There is a strict separation between residents that work and residents that don’t work. The amount of unemployment is high, 42% compared to the 8,6% average in Bogotá (Departamento Administrativo Nacional de Estadística, 2015). It is remarkable that the majority of the workers are vendors on the street or work at home, which are not “real” jobs. The unemployment can be caused by the fact that the residents are displaced or recently moved and are still looking for a new job. All the residents, except for one, indicate that they want a job closer to the project. There is almost no difference between the scores of employed and unemployed residents.
Main modality of transport Most of the residents travel by bus (Transmilenio is also a bus) because it is the cheapest way of travelling through Bogotá. Another reason is that there are no parking lots at the project site and the residents cannot afford to park their car or motorcycle in a local parking garage. Healthcare There are two types of healthcare systems. The first one is SISBEN for the poorest, which is a subsidized system. The second one is more regular, which is a contributive system. Remarkable is that most residents are in the second system. The residents in the SISBEN system score a high 3,50 compared to the residents in the contributive system with a score of 3,43. Remarkable is that the SISBEN group more satisfied is with the healthcare facilities.
Communication The outcome of this question is surprisingly, because all of the residents were promised a computer with free internet connection, but they are going to receive it soon. However, just a few have access to TV, internet or local telephone. Most residents just use their mobile phone.
4%
26%
15% 22%
22%
11%
2
3
4
5
6
7
42%
54%
4%
Neither
Work
Both
4%
58%
31%
7%
Car
Bus
Transmilenio
Motorcycle
35%
65%
SISBEN
Contributive
10% 7%
13%
70%
TV
Internet
Telephone
None

Bachelor thesis Anna van Veenen 38
7 DISCUSSION The developed method to come to the final grade of residential satisfaction and the housing performance contains a lot of assumptions. Besides this, the results of the neighborhood analysis and the questionnaires could contain errors or strange outcomes. All these assumptions and remarks will be discussed in this chapter. At the end of this chapter it is possible to answer the major research question.
7.1 Selection of scales The first assumption is this research is that the project is evaluated based on three scales: house, project and neighborhood. The project could also be evaluated based on the house alone or the house and project or the house and neighborhood. In order to make sure that all the options are taken into account and to measure the sensitivity of the model, these three scenarios are conducted as well. The scales are weighted the same as in the original assessment framework: equally. The results are as follows:
Average Factor Weighted average
House 3,50 1,00 3,50
Total 3,50
Average Factor Weighted average
House 3,50 0,50 1,75
Project 3,47 0,50 1,74
Total 3,48
Average Factor Weighted average
House 3,50 0,50 1,75
Neighborhood 3,46 0,25 0,86
Neighborhood analysis 3,36 0,25 0,84
Total 3,45 The differences in the final grade of residential satisfaction are not very big and they will all lead to the same conclusion that the residents are satisfied and that the project performs well. The in- or exclusion of scales does not have a big influence on the outcome of the research. Another remark about the scales is the contribution per scale. As stated in Paragraph 3.2.1 and Figure 9 each scale contributes equally to residential satisfaction. Another method is to weigh the scales based on the amount of factors. There are, including the neighborhood analysis factors, 58 different factors. The house scale contains 22 factors, the project scale 9 factors and the neighborhood scale 27 factors. The weights per scale will then be 22/58 for the house scale, 9/58 for the project scale and 27/58 for the neighborhood scale. This will result in the following calculation:
Average Factor Weighted average
House 3,50 0,38 1,33
Project 3,47 0,16 0,54
Neighborhood 3,46 0,28 0,95
Neighborhood analysis 3,36 0,19 0,64
Total
3,46 In the end it does not matter which method is used, the outcome is exactly the same. This means, including the slight differences per scale, that the model is not very sensitive and that it could be considered reliable.

Bachelor thesis Anna van Veenen 39
7.2 Selection of factors The majority of assumptions are made in the selection of factors. There are a lot of factors found through the literature study and with every elimination the assessment becomes more limited. The factors are selected based on brainstorming, in-situ observations and an interview with Metrovivienda. This was done during the first stages of this research and some factors could have been missed. It was only possible to enter the project site during the conduction of the questionnaires, which provided further insight in the situation. For example the factors “parking lot” or “temperature” could have been included. Furthermore, a second interview with another person from Metrovivienda could have provided more or different specific information about the project and could lead to a different selection of factors. Generally, the more factors included, the more accurate the final result. However, within the scope of this research it is not possible to include all the applying factors. The number of factors had to be narrowed down to make the neighborhood analysis more accessible and the questionnaires not too long and complicated. On the other hand there are still a lot of factors included in this research. Therefore, a high number of factors leads to a smaller influence per factor. In or excluding of a specific factor does not influence the average significantly (see Paragraph 7.4.3). Furthermore, a specific factor that scores low does not influence the total value of residential satisfaction that much. In order to make the influence of the individual factors significant the number of factors needs to be reduced even more. In the further research a comparison can be made between the two instruments: one with more factors and one with less factors to measure the sensibility an accuracy of the model.
7.3 Neighborhood analysis The calculation of the routes in the chapter of neighborhood analysis contains some errors due to the available data. The available network did not contain the direction of the roads. According to the data it is possible to take every road both ways, but that is not possible in reality. Because of this the walking distances were calculated and not the distances by car, because pedestrians can walk the roads in both directions. By calculating these walking distances, the problem about the direction of the road data was solved. Another remark about the processing in ArcGIS is that residents are not allowed to cross the streets. The program has to use junctions to change the direction of the route and this results in longer walking distances. The second error in the network analysis is the location of the facilities. The locations are based on looking around in the neighborhood and the research of Marulanda (2014). It could be possible that closer facilities are not found or that other important facilities are missing. Moreover, the end points of the routes could not be properly selected, because of a lack of information about the entrances of the buildings or the entrance roads. This could have influenced the routes and the exact distances. The last error can be found in the delimitation of distances in the assessment framework in Table 8. Most of the distances are based on a document from Ministerio de Ambiente Vivienda y Desarollo Territorial (2011), but not every facility is included in that document. In order to determine the distribution of the facilities in relation to the distance assumptions had to be made. Furthermore, the margins per category differ and the spread of this margins is also an assumption. This could lead to a different outcome per facility and the total score of the neighborhood analysis.
7.4 Questionnaires Most of the remarks can be made about the implementation and outcome of the questionnaires. The remarks can be split in three sections: the first one is about the implementation of the questionnaires and the processing of data, the second one about important observations, and the third one about the results.
7.4.1 Implementation The first remark about the implementation of the questionnaires is about the amount of questionnaires. The number of respondents is very little. Only 26 questionnaires were conducted, which is when looking

Bachelor thesis Anna van Veenen 40
at the irregular research process sufficient, but in order to draw significant conclusions not enough. At the beginning of this research, no residents were living at the project and during the past period they started to move in. Only in the second half of the research period it was possible to get in contact with the residents. The few questionnaires result in that the influence of one individual resident is still high and there are not enough answers for classifying and then correlating the factors. The questionnaires were conducted during a Friday and Saturday afternoon. More days of conduction were not possible, because the neighborhood is not very safe and it was not possible to go out alone. This introduces the second remark: the questionnaires of the other student, Jairo. In order to obtain the most questionnaires within the given time, we split up to interview more residents at the same time. This results in some misunderstandings in the questionnaires conducted by Jairo. Some questions were not filled in properly. For example, some factors were not answered with a grade of satisfaction and other factors were answered with two different grades. Other problems were that his handwriting was not always readable or that question 24 about the importance of factors was not filled in consequently. The inconsequent answers of the questionnaires of Jairo lead to assumptions of the correct answer or no answer at all, which can evoke mistakes. At last, the processing of the data could lead to errors. These errors are of high influence on the outcome of this research, because wrongly inserted data or formulas will give incorrect outcomes. They should be prevented. All the answers of the questionnaires are inserted manually in Excel and checked multiple times. However, it is still is possible that the answers in Excel differ from the answers from the questionnaires by human mistake. Furthermore, it is possible that the calculations of the averages and standard deviations contain errors, but that is most unlikely, because they are calculated in two different ways and the answers are the same.
7.4.2 General observations During conducting the questionnaires some peculiarities were observed, which are not visible in the answers of the questionnaires. This can influence the reliability of the outcome of this research or provide new insights in the way the residents think. The most important characteristic of the residents is that they are displaced people. They are poor and afraid of more violence and are very happy with this opportunity to live in the project of Plaza de la Hoja. That being said, the following observations can be explained: The first observation is the fact that the majority of the residents is not that satisfied with some factors. Most often mentioned are the size of the rooms, the finishes and the design of the buildings. However they tell us to fill in that they are satisfied, because they cannot complain about a house which is better than the one they had before. They do not allow themselves to be unsatisfied because they came from almost nothing and they don’t have to pay for the rent. This leads to higher level of residential satisfaction than when they would answer honestly. The second observation is visible in the answers of the questionnaire, but the reason is most of the time the same. It is about the safety and security of the residents. They do not feel safe in their home and around the project. This is due to the fact that the most common reason of displacement is because of violence and they are afraid that this will happen again. The buildings are guided by security men, but there is no fence around the site and there are no security cameras. The dissatisfaction with the safety and security is because the residents of Plaza de la Hoja are more anxious than non-displaced residents.
7.4.3 Results Besides to the observations above, there are some other peculiarities in the answers of the questionnaire. They are analyzed in this section and incorporate factors with a strange outcome or a high standard deviation (higher than 1). Communication services As stated in paragraph 6.3.3 most of the residents do not have any communication services at all. This is odd, because they were promised a free computer with free internet access by Metrovivienda. This has

Bachelor thesis Anna van Veenen 41
not been realized yet, but they will receive their internet connection. The score of this factor is exceptionally low and pulls down the final score of residential satisfaction. For example, excluding the factor would lead to an average score of 3,49 instead of 3,46. However, the score for this factor can be increased quickly if Metrovivienda provides the free internet access. Finishes The opinions about the finishes are distributed, which leads to a high standard deviation. About a third of the residents state that they are unsatisfied with the finishes. A relative high amount of residents is neutral about the finished and most of the satisfied residents are in category 1 as described in the previous paragraph. They do not think that they are satisfied with the finishes, but they do not allow themselves to give a low score. Remarkable is that a relative high amount of the residents does not have an opinion about the finishes. Sizes of the bedroom, kitchen, living room and bathroom There is a distinction between the sizes of the different rooms and the quality of the daylight. All the averages of the sizes of the different rooms are lower than the averages of the daylight in the same rooms (Table 12). This means that the rooms in the apartments are too small or narrow for about a fifth of the interviewed residents. However, it is contradictory that almost no resident is unsatisfied with the total area of the house. There could be a relation between the household size and the rating of the sizes. The averages are slightly lower, but there is not enough data to statistically prove this. View and location Except for one, all the residents are satisfied with the view from their apartments and all the residents are satisfied with the location of the project site. The remarkable conclusion about these factors is that between a third and a half of the residents indicate that they are very satisfied with respectively the view and the location, a score of 5 is very uncommon. This results in exceptionally high scores. Safety and security in general The safety and security in both house and project scale score below average. The scores in the project scale are even lower than the scores in the house scale. An explanation is given in the previous paragraph. However, the opinions about the safety and security are distributed. Still about a third of the residents indicate that they are satisfied with the safety and security. There is not a decisive outcome of these factors, because this third of the residents were not like the residents in category 1 of the paragraph above. They did not indicate that they were unsatisfied and then tell us to mark the “satisfied” box. Accessibility in general At the moment of conducting the questionnaires the elevators were not working. This has led to a low score of accessibility in the scale of the house. The residents that live at the sixth floor or higher complain more about this, because they have to walk more staircases. Their average is 2,92 compared to the average of 3,19, which is a lot lower. Asking the same question later, when the elevators are working, will definitely result in a higher score for this factor. The accessibility of the project differs per modality. About a quarter of the residents is not satisfied with the accessibility by car because there are no parking lots. The accessibility by bike is generally very good and the accessibility in public transport as well. However, most residents did not know much about the public transport routes and just indicated us to mark the “satisfied” box in order to go to the next question. So the value of the average of the accessibility by public transport is not very reliable. For example, excluding this factor will lead to a slightly lower final grade of residential satisfaction of 3,44. Parks and green areas The answers to these questions in the project and neighborhood are a bit odd, because there are not many parks and green areas. Still, about half of the residents is satisfied with the amount of parks and green areas, even after we pointed out that there are not that many of them. In the scale of the neighborhood around a quarter of the interviewed residents did not know where the parks or green areas were. If these answers are translated to a score of 1 (very unsatisfied) the average of this factor will be a

Bachelor thesis Anna van Veenen 42
lot lower. However, this will not influence the final grade of residential satisfaction and it is hard to tell if it is possible to draw this strict conclusion.
Sports center and library These two questions are a bit like trick questions, because these two facilities cannot be found in the neighborhood. This results in more than half of the residents answering that they do not know where these facilities are and a bit misleading average. The same applies for these factors as for the parks and green areas: if these “NA’s” are translated to a score of 1 (very unsatisfied) the averages would be a lot lower. However, this will also not influence the final grade of residential satisfaction. It is remarkable that 2 to 4 residents are indeed satisfied with these factors, which is highly unlikely. When looking at the rest of their answers, these residents do not rate everything “satisfied” and are therefore not suspicious of giving false answers. Maybe they do not mind traveling long distances or they know another closer location which was not observed in the neighborhood analysis.
Bank or cashpoint The outcome of this factor is remarkable because there is no spread at all. Except for four residents, who did not know where the closest bank or cashpoint was, all the residents state that they are satisfied with the accessibility of a bank or cashpoint. This indicates that these facilities are well distributed over the neighborhood.
SITP This question confirms the knowledge of the residents about the public transport and the accessibility. A lot of different answers are given and about a quarter of the residents does not know where the closest SITP station is or do not use the SITP. The answers depend on the preference of the residents, not everyone likes to go with this type of bus or needs another bus route, which is not close to the project.
7.5 Neighborhood analysis vs. questionnaire Now that the neighborhood analysis and the questionnaires are discussed separately, it is possible to compare them and see if they give the same result. The factors of both instruments overlap, which makes it easy to put the outcomes together. The scores are plotted against each other below in Table 15.
Table 15 Comparison outcome neighborhood analysis and questionnaire
Factor Score neighborhood analysis
Rounded score questionnaire
Actual score questionnaire
Kindergarten 5 4 3,57
Primary school 4 4 3,69
High school 5 3 3,47
University 3 3 3,00
Healthcare 4 4 3,55
Shops and markets
1 4 3,96 (average of supermarket and market place)
Restaurant or café
3 - -
Parks and green areas
1 3 2,70
Sport facilities 1 2 2,18
Church 5 4 3,96
Library 3 3 2,50
Bank or cashpoint
3 4 4,00
Public transport 4 4 3,86 (average of the three transport modalities)
Industry 5 - -

Bachelor thesis Anna van Veenen 43
The score of the kindergarten in the questionnaire is around 1,5 point lower than the score of the neighborhood analysis. This is because of the fact that the kindergarten at the first floor of the project has not opened, yet. About half of the residents does not know where a kindergarten is and the other half has found another kindergarten, which is further away from the project location and results in a lower score. In general about half of the residents does not know where the educational facilities are, which could lead to a disproportional or misleading average. The score of the high school in the questionnaire is lower than the score of the neighborhood analysis, because most residents think that the nearest school is not that close as ArcGIS shows or think that the route is dangerous. On the other hand, the shops, markets, parks and green areas of the questionnaire score higher. Maybe this is because of the fact that it is possible to see the supermarket from the project site and it seems less far away or that there is another supermarket closer to the project site which is not discovered in the neighborhood analysis. The opinions of the residents about the parks and green areas differ a lot. The definition of a park or green area may differ per resident and can lead to distributed perceptions. There are no big or remarkable differences in the other facilities. In conclusion the neighborhood analysis is not very accurate when looking at the outcome of the questionnaires. This proves that perception plays an important role in valuating distances.
7.6 Comparison to literature The model in this research is based on several different articles related to residential satisfaction. It is useful to compare the outcomes of these articles to the outcome of this research to indicate the reliability. When looking at the outcomes of the authors that use as well scale from 1 to 5 (Huang & Du, 2015; Ibem & Aduwo, 2013; Kim et al., 2005; Lara & Bekker, 2012) the average score is generally the same: between 3 and 4. Only in the case of Lara and Bekker (2012) the average score is significantly lower: below 3. Remarkable is that all the authors use a bigger sample group than this research. All these groups contain over 100 participants, which makes it easier and more useful to make statistical analyses. The conclusions in these articles will be more sophisticated, but still the value of residential satisfaction comparable. This approximately same value means that the outcome of this research can be considered reliable. Other authors give examples for improvement of this research. Amérigo and Aragonés (1990) investigated the influence of changing the factors and the way of questioning the residents. This could be interesting for the case of Plaza de la Hoja to see if the residents respond differently if they are not interrogated but just can fill out the questionnaires themselves. Furthermore, the difference in the amount of factors can be investigated (Paragraph 7.2). Besides this Peréz Peréz (2011) added to the base model in Figure 6 less tangible aspects like traditions, preferences and time. These aspects could be included in this research to explain the perspectives of the residents.
7.7 Final result This research has been done in the first stage since the finishing of the construction of the Plaza de la Hoja project and the project is still not completely done. Not all residents have moved in, the elevator is not working and there is still no free internet access. At this stage the residents could be more negative about the project because it is not entirely finished and not all facilities are working. On the other hand they could be more positive because they have not had time to acclimatize and to discover the weaknesses of the project. A different moment in time could lead to a different outcome of this research. Now that the final grade of residential satisfaction is determined and the outcome of the instruments are discussed, the answer to the major research question can be derived. “What is the current performance of Plaza de la Hoja when looking at the residential satisfaction?” In order to do so, the model developed in Chapter 3 has to be evaluated (Figure 13).

Bachelor thesis Anna van Veenen 44
Figure 14 Relation between residential satisfaction and performance
In the previous chapters the contribution of the house, project and neighborhood aspects to the residential satisfaction is calculated. Only one of the household characteristics (household size) is included in the scale of the house to contribute to the residential satisfaction. All the aspects are combined in this model give a final grade of residential satisfaction of 3,46. As stated in the literature study in Paragraph 3.2.1 the residential satisfaction is linked directly to housing performance (Kim et al., 2015). The residential satisfaction is rated on a scale from 1 to 5 and therefore a rate of 3 or higher results in satisfaction and a positive performance. The value of 3,46 is higher than 3 so the sub-goal is met: the residents are provided with comfortable and affordable living environment to improve their quality of life. It can be concluded that: When looking at residential satisfaction the project of Plaza de la Hoja performs well. However, as stated in Paragraph 3.3.1 performance is a broader concept and can be evaluated on many more levels than residential satisfaction. It is quite straightforward to link residential satisfaction directly to the housing performance. In order to get a complete representation of the performance of Plaza de la Hoja the purposes of this project and the stakeholders have to be taken into account as well. This lies, however, not within the scope of this research and further research is needed to obtain all the information about Plaza de la Hoja. It is important to obtain the opinions of all the stakeholders and the satisfaction of the residents a few years later. In a few years it is possible to tell if the paradigm is broken, the socio-economic segregation is reduced, the border between rich and poor is weakened and the perception of the inhabitants of Bogotá is changed. When these goals are met, the project can be named a true success and it can be implemented somewhere else in the center of Bogotá or in other cities in Colombia. Furthermore, it is possible to look at the factors individually. The final score is an average of a lot of different factors and to improve this final score the individual factors have to be analyzed. For example, in the short run Metrovivienda can improve the residential satisfaction by improving the safety and security, providing internet access, and increase the accessibility of the houses by fixing the elevators. In the long run Metrovivienda can consider placing parking lots or realizing more parks and green areas around the project site to further improve the residential satisfaction.

Bachelor thesis Anna van Veenen 45

Bachelor thesis Anna van Veenen 46
8 CONCLUSIONS AND RECOMMENDATIONS In the previous chapters of this report the different sub-questions were answered one by one, which has led to the final answer of the major research question. This answer can help to formulate a recommendation about the project of Plaza de la Hoja to the executing party Metrovivienda. The answer to the first sub-question “How can performance and residential satisfaction of housing schemes be defined and measured?” has shown that there is not one specific definition or measurement method of performance or residential satisfaction. Performance can be expressed in terms of success, purpose, satisfaction or a combination of these three. This research has focused on the concept of satisfaction with a slight link to purpose, because residential satisfaction is linked directly to the sub-goal of the Plaza de la Hoja project. The definition of residential satisfaction is clearer: residential satisfaction measures the difference between the residents’ needs and expectations in housing and reality. It can be measured through various housing, neighborhood and household characteristics. The choice has been made to evaluate the project on three different scales: house, project and neighborhood. Through literature study a lot of factors that contribute to residential satisfaction are selected and distributed over these different categories. The second part of this report focuses on the second sub-question “Which factors are important in the context of measuring residential satisfaction of housing schemes in Bogotá?” and consists of selecting the right factors for Plaza de la Hoja. This has been done by brainstorming, in-situ observations and an interview with Metrovivienda. The outcome of these observations made it possible to write down all the social and technical aspects of the project from which the most important factors were selected. The choice has been made to distribute the factors over two categories: the biggest part of the factors will be evaluated through a questionnaire and a small part of neighborhood factors will be analyzed in ArcGIS. This distribution over two measurement categories answers the first part of the third sub-question “How can these factors be combined into an assessment framework and what are the results?” The assessment framework can be interpreted as demonstrated in Figure 9. Then the neighborhood analysis in ArcGIS and the questionnaires were conducted and have led to the following realization of the assessment framework:
Average Factor Weighted average
House 3,50 0,33 1,17
Project 3,47 0,33 1,16
Neighborhood 3,46 0,17 0,58
Neighborhood analysis 3,36 0,17 0,56
Total
3,46
The final grade of residential satisfaction is 3,46. Based on this answer and only residential satisfaction as a part of performance the answer to the major research question “What is the current performance of Plaza de la Hoja when looking at the residential satisfaction?” will be that the project performs well. Based on the contents and the outcome of this research the project can be named a success and it is recommendable to Metrovivienda to realize more of these projects. However, this research is conducted in the first stage of the exploitation of Plaza de la Hoja and not all the residents have moved in. This is not a preferable situation and it is recommendable to conduct the same research a few years later with more respondents to obtain a more realistic opinion of the residents and the other stakeholders. Furthermore, it may be possible to investigate the goals of the Plaza de la Hoja project to make a more complete framework and to draw more accurate and reliable conclusions. At this point in time Metrovivienda can increase the amount of residential satisfaction by improving the safety and security, providing internet access, and increase the accessibility of the apartments by fixing the elevators. In the long run the final

Bachelor thesis Anna van Veenen 47
recommendation will be to observe the developments of the project over the years and to conduct this research in a later stage of the Plaza de la Hoja project to obtain a more accurate opinions and results.

Bachelor thesis Anna van Veenen 48
9 REFERENCES Adriaanse, C. (2007). Measuring residential satisfaction: a residential environmental satisfaction scale
(RESS). Housing and Built Enviironment, 2007(22), 287-304.
Alcaldía mayor de Bogotá D.C. (2011). Diagnostico localidad de puente aranda sector hábitat.
Amérigo, M., & Aragonés, J. I. (1990). Residential satisfaction in council housing. Environmental
Psychology, 1990(10), 313-325.
Amerigo, M., & Aragones, J. I. (1997). A theoretical and methodological approach to the study of
residential satisfaction. Environmental Psychology, 1997(17), 47-57.
Brick, P., Snow, D., & van de Wetering, S. (2001). Across the Great Divide: Explorations in Collaborative
Conservation and the American West. Canada: Island Press.
Departamento Administrativo Nacional de Estadístic. (2015). DANE. Retrieved from
http://www.dane.gov.co/index.php
Departamento Nacional de Planeación. (2014). Bases del Plan Nacional de Desarollo 2014-2018.
El Tiempo. (2014, December 17). Gestionan empleo a beneficiarios de vivienda VIP en centro de Bogotá.
Retrieved from El Tiempo : http://www.eltiempo.com/economia/sectores/vivienda-vip-en-la-
plaza-de-la-hoja/14990513
El Tiempo. (2015, January 21). Entregan las primeras viviendas gratis con computador e internet.
Retrieved from El Tiempo: http://www.eltiempo.com/bogota/sorteo-viviendas-gratis-en-
bogota/15130477
Elsinga, M., & Hoekstra, J. (2005). Homeownership and housing satisfaction. Housing and the Built
Environment, 2005(20), 401-424.
En Obra. (2012). Ya Iniciaron las obras de “Plaza de la Hoja”. Retrieved from http://www.en-
obra.com.co/news/821/63/Ya-Iniciaron-las-obras-de-Plaza-de-la-Hoja.htm
Faludi, A. (2010). The Performance of Spatial Planning. Planning Practice & Research, 15(4), 299-318.
Gilbert, A. G. (2014). Free housing for the poor: an effective way to adress poverty? Habitat International,
2014(41), 253-261.
HSB Noticias. (2015, May 25). Gobierno Nacional llegó a Bogotá con su programa "Casas Gratis".
Retrieved from HSBnoticias.com.
Huang, Z., & Du, X. (2015). Assessment and determinants of residential satisfaction with public housing in
Hangzhou, China. Habitat International, 47(2015), 218-230.
Ibem, E. O., & Aduwo, E. B. (2013). Assessment of residential satisfaction in public housing in Ogun State,
Nigeria. Habitat International, 2013(40), 163-175.

Bachelor thesis Anna van Veenen 49
Ibem, E. O., Opoko, A. P., Adeboye, A. B., & Amole, D. (2013). Performance evaluation of residential
buildings in public housing estates in Ogun State, Nigeria: Users' satisfaction perspective.
Frontiers of Architectural Research, 2013(2), 178-190.
Kelly, J. M., & Swindell, D. (2002). A Multiple–Indicator Approach to Municipal Service Evaluation:
Correlating Performance Measurement and Citizen Satisfaction across Jurisdictions. Public
Administration Review, 62(5), 610-621.
Kim, S.-S., Yang, I.-H., Yeo, M.-S., & Kim, K.-W. (2005). Development of a housing performance evaluation
model for multi-family residential buildings in Korea. Building and Environment, 40(2005), 1103-
1116.
Lara, T., & Bekker, M. C. (2012). Resident satisfaction as a project quality measure: the case of Nova Vida
housing project, Angola. Contemporary Management, 9, 364-381.
Metrovivienda. (2013). Misión. Retrieved from Metrovivienda:
http://www.metrovivienda.gov.co/index.php/2013-04-02-16-45-18/mision2
Metrovivienda. (2015, April 15). Bogotá Humana instala las primeras cubiertas verdes en vivienda social.
Retrieved from Metrovivienda: http://www.metrovivienda.gov.co/index.php/192-bogota-
humana-instala-las-primeras-cubiertas-verdes-en-vivienda-social
Metrovivienda, Alcaldía Mayor de Bogotá D.C., & Sociedad Colombiana de Arquitectos Bogotá D.C. .
(2013). Bases - Concurso de diseño para una propuesta de vivienda de interés prioridado (VIP) y
usos complementarios en el marco de una intervencion urbana integral de la manzana
denominada Plaza de la Hoja. Bogotá.
Ministerio de Ambiente Vivienda y Desarollo Territorial. (2011). Calidad en la Vivienda de Interés Social.
Mohit, M. A., Ibrahim, M., & Rashid, Y. R. (2010). Assessment of residential satisfaction in newly designed
public low-cost housing in Kuala Lumpur, Malaysia. Habitat International, 2010(34), 18-27.
National Affordable Homes Agency. (2008). Housing Quality Indicator (HQI) Form.
Ortegón, A. T. (2015, May 21). Interview technical manager of Metrovivienda. (A. v. Veenen, & C. A.
Moreno Luna, Interviewers)
Oxford Dictionaries. (2015a). Performance. Retrieved from
http://www.oxforddictionaries.com/definition/english/performance
Oxford Dictionaries. (2015b). Success. Retrieved from
http://www.oxforddictionaries.com/definition/english/success
Pérez Pérez, A. L. (2011). La calidad del hábitat para la vivienda de interés social. Soluciones desarrolladas
entre 2000 y 2007 en Bogotá. INVI, 26(72), 95-126.
Restrepo, J. (2013). No queremos vivir con desplazados. Retrieved from Kienyke.com:
http://www.kienyke.com/historias/no-queremos-vivir-con-desplazados/
Secretaría de Planeación, & Alcaldía mayor de Bogotá. (2012). Bogotá - Ciudad de Estadísticas.

Bachelor thesis Anna van Veenen 50
Secretaría Distrital de Ambiente. (2012). Bogotá humana abre concurso para proyecto plaza de la hoja.
Retrieved from http://ambientebogota.gov.co/archivo-de-noticias/-
/asset_publisher/5PPa/content/id/1436355
Secretaría Distrital Planeación Bogotá. (n.d.). ¿Qué es el POT? Retrieved from
http://www.sdp.gov.co/portal/page/portal/PortalSDP/POT_2020/Que_Es
Studenten Mobiliteits Centrum CTW. (2014). Bachelor Eindopdracht - Handleiding voor Civiele Techniek.
The National Affordable Homes Agency. (2008). Housing Quality Indicators (HQI) Form.
United Nations High Commissioner for Refugees. (2015). Dezplazados Internos. Retrieved from UNHCR:
http://www.acnur.org/t3/a-quien-ayuda/desplazados-internos/
Universidad Piloto. (2008). Maestría en gestión urbana. Retrieved from Universidad Piloto de Colombia:
http://www.unipiloto.edu.co/programas/especializaciones/maestria-en-gestion-urbana/
Van Rosmalen, B. (1994). Succes- en faalfactoren bij de ontwikkeling van woningbouwprojecten. Delft:
Delftse Universitaire Pers.
Vargas D., I. C., Jimenez M., E., Grindlay M., A., & Torres T., C. (2014). Informal Settlements in a medium
Latin American city: a proposal in the sixth district of Ibagué. (Colombia).

Bachelor thesis Anna van Veenen 51
APPENDICES

Bachelor thesis Anna van Veenen 52
A. INTERVIEW METROVIVIENDA This appendix shows the questions of the interview with Andrea Tatiana Ortegón, technical manager of Metrovivienda. The answers to this questions are integrated in the introduction, stakeholder analysis and the selection of factors. The questions marked in orange were not answered. Questions about the project in general 1) What can you tell in general about the Plaza de la Hoja project?
a) How many houses? b) When is it finished? c) When will the residents move in?
2) What is the purpose of the Plaza de la Hoja project? 3) In what “estrato” is this project? 4) What can you tell about the policy of free housing for the desplazados? 5) The houses are free for the inhabitants, what do they have to pay for? 6) How is this project financed? 7) How is this project related to the POT 8) Why is the location of Cundinamarca, Puente Aranda chosen to develop this project? 9) Puente Aranda is known for one of the most air polluting zones in Bogotá, do you think this is a
problem for the health of the residents? 10) What do you think the impact of the project will be? A whole new group of people is going to live in
the center. 11) What will be the impact with respect to security in the neighborhood? Questions about the technical aspects of the house and project 12) House
a) What is the area of the houses in m2? Do all the apartment have the same area? b) What is the layout of the houses? Are they different or the same? What kind of rooms are there
and how many? c) Is there a separate storage? d) Do the houses have a garden? e) What kinds of materials are used for the construction/walls/floors/roofs/ceilings? f) How many doors/windows are there? g) Does the building protect the residents against the weather or natural disasters? h) Is the building earthquake proof? How? i) How multifunctional/flexible is the house? j) How sustainable are the building and the project? (Building materials) k) Are the water and energy used sustainably? l) What are the water/energy/communication services?
13) Project
a) What is the project area? b) What is the number of floors per building? c) How are the stairs and elevators distributed? d) Is there an entrance lobby? e) Are there public areas? What and where are they? f) What can you tell about the vegetation, green areas and urban farming? g) How many parking lots are there for cars and bikes? Are they private? h) How is the garbage collected? i) Are there any emergency services? j) Who maintains the building?

Bachelor thesis Anna van Veenen 53
14) Neighborhood a) What is the quality of lighting at night? b) Are there community kitchens nearby?
15) Household characteristics a) Why desplazados? b) What is the origin of the residents? c) What were the causes of displacement? d) How were the residents selected?
16) Can we have interviews with the residents? Can you help us to contact them?

Bachelor thesis Anna van Veenen 54
B. QUESTIONNAIRE In this appendix the final version of the questionnaire can be found. The original conducted questionnaire is in Spanish, but for the readability of this report the English version is included.
D D M M Y Y Y Y
1.1. Interior 1.2.Apartment
2. Please indicate the following information: 3. Please indicate your marital status
2.1. Sexo 2.2. Edad M P S D W M : M arried L : Living with partner S : Single
H M 1 2 3 4 5 D : Divorced (a) W : Widow(er)
4. What is your level of education? P S T U O P : Primary S : Secondary T : Technical
1 2 3 4 5 U : University O : Other ______________
5. Where did you live before?
5.1 Municipality _______________________5.2 Neighborhood _____________________5.3 District _____________________
6. How many persons are living in your apartment?________________
7. Do you work or study? Neither* 1 Study 2 Work 3 Both 4
* If your answer is "neither", please skip to question 10
8. Municipality and neighborhood where you work/study:
Municipality Neighborhood
Study ________________________ ________________________
Work ________________________ ________________________
9. Please indicate your occupation (principal activity)
10. Would you like to get a job close to your house? 1 No 2
Where? _____________________________
11. In general, what kind of transportation do you use the most?
Car 1 Bicycle 2 Walking 3 Autobus 4
TM 5 Taxi 6 Motor 7
12. In what healthcare system are you? SISBEN 1 Régimen contributivo 2 None 3
13. What kind of communicative services do you use?Tv Cable 1 Internet 2 Telephone 3 None 4
Page 1.
PRIVACY: the provided data is confidential and w ill not be used for commercial purposes, f iscal taxation or judicial investigation.
They w ill only be used for academic purposes
This questionnaire has the objective to determine the amount of residential satisfaction of the residents of Plaza
de la Hoja
Determination of the residential satisfaction of the residents of Plaza de la Hoja
District of Puente Aranda
No.
B. ECONOMIC MODULE
A. IDENTIFICATION MODULE
Yes

Bachelor thesis Anna van Veenen 55
Page 2. No.
14. Please indicate your level of satisfaction with respect to:
NA
1 2 3 4 5 6
1 2 3 4 5 6
1 2 3 4 5 6
1 2 3 4 5 6
1 2 3 4 5 6
1 2 3 4 5 6
15. Do you have noises in your apartment?
1 No 2
What noises? _________________________
_________________________
16. Please indicate your level of satisfaction with respect to:
NA
1 2 3 4 5 6
1 2 3 4 5 6
1 2 3 4 5 6
1 2 3 4 5 6
17. Is it possible to generate your own income in your apartment?
1 No 2
C. PHYSICAL CHARACTERISTICS OF THE HOUSE
D. HOUSING SERVICES
14.1. Total area
14.5. Quality of the daylight
in the major bedroom
Neutral Very satisf ied
1 2
5
5
Very insatisf ied Satisf ied
4
3
Satisfied
3 4
3
3 4
4
2
2
3
1 2 3
16.1. Water supply
14.11. Comfort (light, noise,
temperature)1 2
Neutral
16.5. Privacy
16.6. Accessibility
14.12. View
16.2. Sewerage
1 2 3
Very insatisf ied
6
6
4 5
6
6
6
6
6
6
2
Very satisf ied
5
5
5
54
14.3. Finishes
14.6. Size of the kitchen
14.7. Quality of the daylight
in the kitchen
14.8. Size of the living room
14.9. Quality of the daylight
in the living room
14.10. Size of the bathroom
14.4. Size of the major
bedroom1
1
1
Yes
Yes
416.3. Safety
16.4. Security
Insatisf ied
Insatisf ied
2 3 4 5
14.2. Layout of the house 1

Bachelor thesis Anna van Veenen 56
Page 3. No.
18. Please indicate your level of satisfaction with respect to:
NA
1 2 3 4 5 6
1 2 3 4 5 6
1 2 3 4 5 6
1 2 3 4 5 6
1 2 3 4 5 6
19. Are there any forms of pollutions at the project site? (traffic, garbage, smell, etc.)
1 No 2
What kind of pollutions? _________________________
_________________________
20. Please indicate your level of satisfaction with respect to the accessibility of:
NA
20.1. Kindergarten 1 2 3 4 5 6
20.2. Primary education 1 2 3 4 5 6
20.3. Secondary education 1 2 3 4 5 6
20.4. University 1 2 3 4 5 6
20.5. Healthcare or hospital 1 2 3 4 5 6
20.6. Parks and green areas 1 2 3 4 5 6
20.7. Sports center 1 2 3 4 5 6
20.8. Library 1 2 3 4 5 6
20.9. Church 1 2 3 4 5 6
20.10. Supermarket 1 2 3 4 5 6
20.11. Market place 1 2 3 4 5 6
20.12. Bank or cashpoint 1 2 3 4 5 6
21. What facilities do you miss in the neighborhood? Please write them down
_______________________ _______________________ _______________________
_______________________ _______________________ _______________________
22. Please indicate your level of satisfaction with respect to the public transport:
NA
1 2 3 4 5 6
E. CHARACTERISTICS OF THE PROJECT
4 5
2
1 2 3 4
Very satisf ied
4 5
4
18.7. Safety
18.8. Security
1
1 2 3
Yes
18.5. Project location
18.6. Parks and green areas
18.2. Accessibility by car
18.1. Design of the building
21
H. CHARACTERISTICS OF THE NEIGHBORHOOD
2 3
6
6
22.2.Traveling time to SITP
3 4 522.1. Traveling time to
Transmilenio
Very insatisf ied Insatisf ied Neutral Satisf ied
22.3.Traveling time to
collective bus1
6
6
6
18.3. Accessibility by bicycle
18.4. Accessibility by public
transport
Very insatisf ied Insatisf ied Neutral Satisf ied Very satisf ied
Very insatisf ied Insatisf ied Neutral Satisf ied Very satisf ied
5
53

Bachelor thesis Anna van Veenen 57
23. Are there any forms of pollutions at the neighborhood? (traffic, industries, smell, etc.)
1 No 2
What kind of pollutions? _________________________
_________________________
24. What category of factors is the most important for you? Please put them in order
1. Physical aspects of the house like design, amount and size of the rooms
2. Subjective aspects of the house like noise, comfort or view
3. Housing services
4. The safety and security in and around the house
5. The project location and the facilities in the neighborhoor
6. The amount of parks and green areas
7. The amount of noise and pollution
25. Is your apartment as you expected it to be?
1 No 2
What is different?
Thank you for participating
OBSERVATIONS
Name of the interview er Signature
Yes _______________________________________________
______________________________________________
Page 4.
The most
important
The least
important
Yes
______________________________________________________________________________________________________________
No.
______________________________________________________________________________________________________________
______________________________________________________________________________________________________________
______________________________________________________________________________________________________________