back in fashion_why emerging markets are still attractive_april 2011
TRANSCRIPT
8/6/2019 Back in Fashion_Why Emerging Markets Are Still Attractive_April 2011
http://slidepdf.com/reader/full/back-in-fashionwhy-emerging-markets-are-still-attractiveapril-2011 1/36
Why Emerging Markets are still attractiv
AAAf f f r r r iiicccaaa EE
AAsssseett AAlllloocca
Back in FashionWhy Emerging Markets ar Olivier M. LumenganesoEconomist & Global Investment Strategi April 2011
HIGHLIGHTS
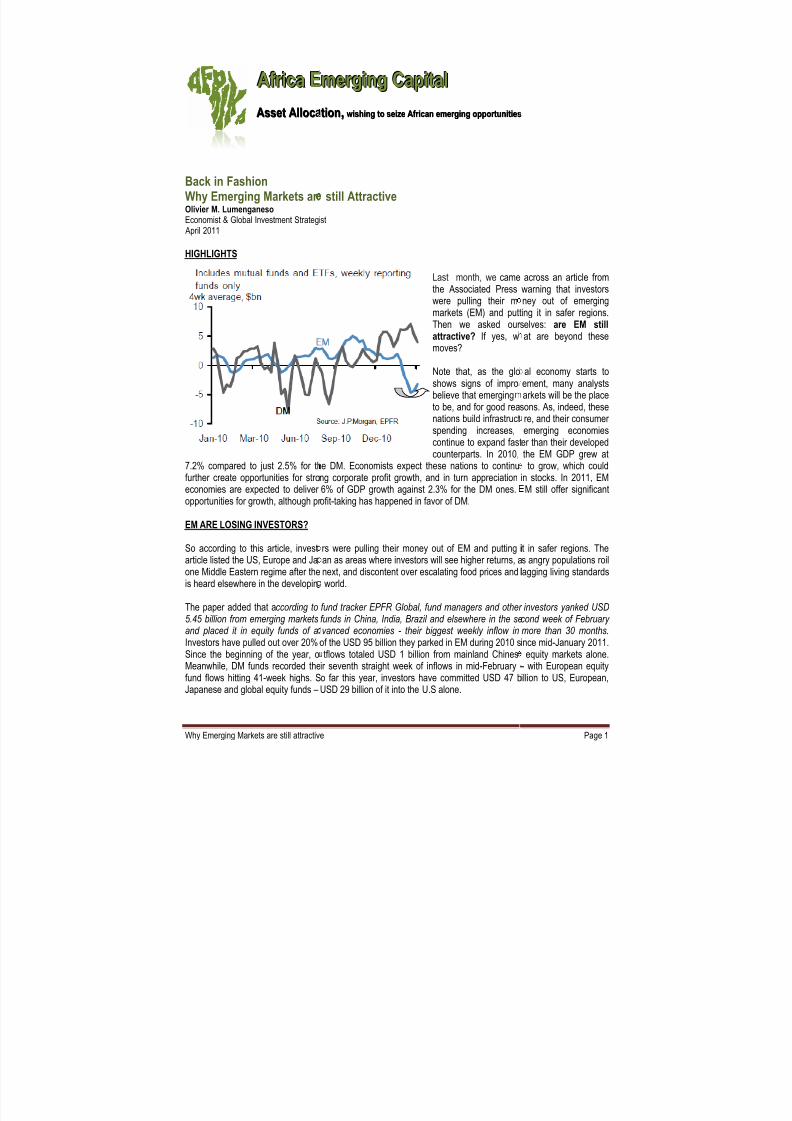
7.2% compared to just 2.5% for thfurther create opportunities for stroeconomies are expected to deliver opportunities for growth, although pr EM ARE LOSING INVESTORS?
So according to this article, investarticle listed the US, Europe and Jaone Middle Eastern regime after theis heard elsewhere in the developin
The paper added that according to5.45 billion from emerging marketsand placed it in equity funds of aInvestors have pulled out over 20%Since the beginning of the year, oMeanwhile, DM funds recorded thefund flows hitting 41-week highs. S
Japanese and global equity funds –
e
mmmeeer r r gggiiinnnggg CCCaaapppiiitttaaalll
ttiioonn,, wwiisshhiinngg ttoo sseeiizzee AAf f r r iiccaann eemmeer r ggiinngg ooppppoor r ttuunniittiieess
still Attractive
st
Last month, we camethe Associated Presswere pulling their mmarkets (EM) and puttThen we asked our attractive? If yes, wmoves?
Note that, as the gloshows signs of improbelieve that emergingto be, and for good rea
nations build infrastructspending increases,continue to expand fastcounterparts. In 2010,
e DM. Economists expect these nations to continung corporate profit growth, and in turn appreciation6% of GDP growth against 2.3% for the DM ones.ofit-taking has happened in favor of DM.
rs were pulling their money out of EM and putting ian as areas where investors will see higher returns, anext, and discontent over escalating food prices and lworld.
fund tracker EPFR Global, fund managers and other funds in China, India, Brazil and elsewhere in the sevanced economies - their biggest weekly inflow inof the USD 95 billion they parked in EM during 2010 stflows totaled USD 1 billion from mainland Chines
ir seventh straight week of inflows in mid-February -o far this year, investors have committed USD 47 b
USD 29 billion of it into the U.S alone.
Page 1
across an article fromwarning that investorsney out of emerginging it in safer regions.selves: are EM stillat are beyond these
al economy starts toement, many analystsarkets will be the place
sons. As, indeed, these
re, and their consumer emerging economies
er than their developedthe EM GDP grew atto grow, which could
in stocks. In 2011, EMM still offer significant
it in safer regions. Thes angry populations roillagging living standards
investors yanked USDcond week of February more than 30 months. ince mid-January 2011.
equity markets alone.- with European equityillion to US, European,

8/6/2019 Back in Fashion_Why Emerging Markets Are Still Attractive_April 2011
http://slidepdf.com/reader/full/back-in-fashionwhy-emerging-markets-are-still-attractiveapril-2011 2/36
Why Emerging Markets are still attractive
Emerging Market performance as of March 31, 2011
Market overview
Price
(local ccy)
S&P 500 1325.83 0.00% 1.00% 0.00% 5.00% 12.885
Eurostoxx 600 284.364 -0.80% 0.20% -2.60% 3.60% 10.295
Topix 869.38 0.00% 2.00% -9.00% -3.00% 12.356
SMI 6357.55 -1.00% 1.00% -4.00% -1.00% 11.43
Bovespa 68586.69 1.00% 2.00% 2.00% -1.00% 10.194Russia (RTS Index) 2044.2 0.00% 1.00% 4.00% 15.00% 6.856
Chinese H-shares 13315.84 1.00% 4.00% 6.00% 5.00% 9.593
Korean Kospi 2106.7 1.00% 3.00% 9.00% 3.00% 9.763
MSCI Asia ex-Japan 690.549 0.70% 3.10% 5.70% 0.40% 11.409
MSCI Emerging Markets 48317.75 0.60% 2.30% 4.10% 0.30% 10.77
MSCI World 925.281 -0.20% 1.10% -1.50% 3.10% 12.09
1 Day
performance
1 Week
performance
1 Month
performance
Year-to-date
performance
12-month
forward
Price/Earning

8/6/2019 Back in Fashion_Why Emerging Markets Are Still Attractive_April 2011
http://slidepdf.com/reader/full/back-in-fashionwhy-emerging-markets-are-still-attractiveapril-2011 3/36
Why Emerging Markets are still attractive Page 3
Over the past 2 weeks, however, we observe that the divergence between DM and EM equity fund flows hasstarted shrinking (see previous chart), as retail investors withdrew USD 3.2 billion per week from EM equityfunds and injected a similar amount into DM equity funds. This is lower than the USD 4.6 billion per week paceseen two weeks ago.
What was behind these moves is the undeniable fact that the DM have outperformed some key EM, since thebeginning of the year. As for the first quarter of the year, the S&P 500 returned a 5%, the Eurostoxx 600 was up3.6%, the MSCI world delivered a 3.1%. Meanwhile, the MSCI Emerging Markets Index only returned 0.3%.
5 REASONS WHY EM ARE STILL ATTRACTIVE
We believe EM asset class is still attractive and see the following 5 reasons to be positive.
1. EM economies are still driving global growth
The past five decades
have witnessedsubstantial changes inthe distribution of world GDP acrossdifferent groups of economies. The directcontribution of EM toglobal growth hascontinued to increaseover time and wasfurther accentuatedduring the financial
crisis, while thereverse has been truefor DM economies.
During 1960-85, advanced economies on average accounted for about three quarters of global GDP measured incurrent dollars, PPP adjusted across countries. This share has declined gradually over time. By 2008-09, it wasdown to 57%. In contrast, EM share has risen steadily from just about 17%in the 1960s to an average of 31%during the period of rapid global trade and financial integration that started in the mid-1980s. By 2008-09, it wasclose to 40%. During the last financial crisis, there was a stunning shift in these relative contributions. EM becamethe lone engine of world GDP growth during 2008-09, while DM economies experienced a deep contraction.
Thus with this rapid growth of the EM, weare now into a world where global growth
will be powered by emerging economies,rather than held back by them. Theemerging-world growth will contribute twiceas much as the developed world to globalgrowth over this period. The emergingworld will provide again the principalsupport to global demand in 2011 and2012. Most emerging markets, indeed,have been experiencing a vigorousrecovery, which has taken output abovelevels reached before the crisis. Our viewis that the recent loss of momentum in
some EM does not mark the start of aserious downturn.

8/6/2019 Back in Fashion_Why Emerging Markets Are Still Attractive_April 2011
http://slidepdf.com/reader/full/back-in-fashionwhy-emerging-markets-are-still-attractiveapril-2011 4/36
Why Emerging Markets are still attractive Page 4
According to Goldman Sachs, by 2020, USGDP might be only slightly larger thanChina's GDP. Together, the four BRICsmay account for 41% of the world'smarket capitalization by 2030. Note thatdue to contraction of Japan's GDP in Q4’10by 1.1% from the previous quarter, China'sGDP surpassed Japan's GDP by USD 5.88trillion and USD 5.47 trillion respectively andmake China as Number 2 in worldeconomy1. There is also the issue of population growth. According to estimates,since the four big EM economies of theBRIC are developing rapidly, by 2050 their combined economies could eclipse the
combined economies of the current richest countries of the world. These four countries, combined, currently
account for more than a quarter of the world's land area and more than 40% of the world's population.
Today, and following the sharp recession of 2008, the global economy is entering the second year of anexpansion phase. That expansion continues to be led by strength in EM domestic demand, while demandgrowth in mature economies remains lackluster . Unfortunately, the second year of this expansion (mid-2010through mid-2011) is liable to be significantly weaker than the first year, in part reflecting normal cyclical patternssuch as the fading in the boost from inventories. It also reflects the withdrawal of some stimulus policies enactedin 2008-09 to lift the global economy out of recession, as well as more general fiscal tightening underway bygovernments concerned to signal a medium-term limit of the current rise in their public debt-to-GDP ratios.
On average, annual world growth is projected to be accelerate towards 3% compared with growth of just over 2%in the 2000s, according to estimates. EM economies will also lead. However, the forecast of a sustained recovery
in EM is not without risks. Indeed, many of these economies have been lifted by fiscal and monetary policystimulus, which, given the lack of balance-sheet problems, has had a powerful effect on growth. It is not clear yethow emerging markets will cope with the withdrawal of this stimulus at a time when exports to developed-countrymarkets, traditionally an important source of demand, remain subdued. Given the restrained medium-term outlookfor developed countries, emerging markets will need to make a structural shift, reducing their dependence onexports and generating more growth through domestic demand.
While fiscal policy is definitely set to become less expansionary in the emerging world, the outlook for monetarypolicy is less clear . Exceptionally low policy rates and QE in the US and some other developed markets are likelyto result in large capital inflows into emerging markets. Overall these will support demand, but they may lead tounwanted currency appreciation, generate inflationary pressure and fuel asset price bubbles. Like their peers inthe West, emerging-market policymakers will face no shortage of challenges in 2011.
Bottom line, global GDP (PPP weighted) is expected to grow 4.2% in 2011 (vs. 4.8%% in 2010) . Growth in theemerging world should remain strong at around 6% (close to three times the G7). Developing Asia continues togrow most rapidly, but other emerging regions are also expected to continue their strong rebound. Notably,growth in sub-Saharan Africa is expected to exceed growth in all other regions except developing Asia . Thisreflects sustained strength in domestic demand in many of the region’s economies as well as rising globaldemand for commodities.
EM Asia will likely grow a robust 7.6% in 2011 (vs. 9.2% in 2010). China and India will again lead theregion, with growth expected to be 9.4% and 8.7%, respectively. The ASEAN (Indonesia, Malaysia,Philippines, Thailand, and Vietnam) will come out with 5.5% of GDP growth.
1This will likely be confirmed on the aftermath of the earthquake that struck the east coast of Japan Friday morning, March
11, 2011.

8/6/2019 Back in Fashion_Why Emerging Markets Are Still Attractive_April 2011
http://slidepdf.com/reader/full/back-in-fashionwhy-emerging-markets-are-still-attractiveapril-2011 5/36
Why Emerging Markets are still attractive Page 5
The growth message for 2011 in EMEA is that energy exporters will again outperform. The forecasted2011 EMEA growth is at 4.6%. GCC, Russia, and some oil exporters in Sub-Saharan Africa are expected togrow above potential, in part because of rising oil prices, and in part because most of these countries will notneed to consolidate fiscally.
Growth in LATAM should remain at or above potential in 2011. Real GDP growth in the region came at5.9%oya in 2010. Importantly, the 4.4% growth forecast for LATAM as a whole for 2011 suggests that theregional pace of growth will remain again above potential this year.
2. EM economic fundamentals remain fully healthy
Many factors account for the relative resilience of EM during the last financial crisis. Some relate to policy choicesmade by these countries, while others are associated with underlying structural changes in their economies.These factors also help explain differences in degrees of resilience across different groups of EM economies.
Better macroeconomic policies in most
EM succeeded over the past decade inbringing inflation under control through acombination of more disciplined fiscal andmonetary policies. Prudent fiscalpolicies that resulted in low levels of fiscal deficit and public debt created roomfor EM economies to respondaggressively with countercyclical fiscalpolicies to offset the contraction effects of the crisis. In addition, EM economies withlow inflation were able to employexpansionary monetary policies to
stimulate domestic demand.
When analyzing the other macro indicators, we see that they remained solid, fully explaining why EM economieswere resilient during the last crisis. For example, less dependence on foreign finance and changes in thecomposition of external debt reduced their vulnerability to swings in capital flows. EM economies were netexporters of capital during the past decade. EM Asia, especially China, have run significant current accountsurpluses in recent years. The other EM regions, that were running large current account deficits before the crisis,proved most vulnerable to the crisis because credit booms in these countries were financed largely throughforeign capital rather than domestic savings.
Going forward, and despite too solidGDP growth, we continue to see no
deterioration in external accountsacross EM thanks to higher commodity prices. Indeed,although the current accountbalance of EM economies as awhole continues to shrink- it hasdeclined from a surplus of 5.6% of GDP in 2006 to projected surplusesof 3% in 2010 and 2.8% in 2011 –the deterioration remains modestgiven the sharp recovery across EMthat followed the shallow recession
in early 2009.

8/6/2019 Back in Fashion_Why Emerging Markets Are Still Attractive_April 2011
http://slidepdf.com/reader/full/back-in-fashionwhy-emerging-markets-are-still-attractiveapril-2011 6/36
Why Emerging Markets are still attractive Page 6
Beyond the benign outlook for growth and external accounts, EM fiscal indicators will improve in 2011 andmark another point of differentiation with DM economies. Indeed, after reaching a decade-high of -4.2% of GDP in 2009 on the back of the recession and fiscal stimuli, the fiscal deficit of EM economies as a whole isexpected to improve from -4.2% of GDP in 2009 to -2 % in 2011 . This improvement will reflect not only thecyclical rebound in tax revenues, but also the fact that fiscal stimulus measures are being rolled backacross EM.
Large buffers of FX reserves alsoinsured against sudden reversals ininvestor sentiment. Indeed, followingthe Asian financial crisis of 1997-98,EM around the world built large levelsof foreign exchange reserves, partlyas a result of export-oriented growthstrategies and partly as a form of self-insurance against crises associatedwith sudden stops or reversals of
capital inflows. EM economies haveaccumulated USD 5.5 trillion in FXreserves, nearly half of which isaccounted for by China.
Bottom line: no internal and external solvency risks! Emerging economies have potential response tools asthey have accumulated large external reserves which should provide a buffer against capital account reversalsFX reserves are still growing and now stand around more than 30% of their global GDP.
Helped by relatively favorable economic prospects across a wide array of EM, net private capital flows to EMeconomies substantiallyimproved and are projected to
have reached USD 825 billion in2010, up from USD 581 billionin 20092. Relatively buoyant flowsare expected to persist into 2011,when net private flows toemerging economies areprojected to be USD 833 billion.By components, equity-relatedinflows remain the strongest. Themost dynamic component of capital flows estimates in 2010has been portfolio equity
investment by nonresidentsinto EM countries. This is projected to be USD186 billion in 2010, up from an average of about USD 62 billionper year in 2005-09. By contrast, net credit flows from banks are projected to be USD 85 billion in 2010, whichcompares to an annual average of USD 172 billion in 2005-09.
FDI remains the single largest component of private capital flows to EM economies. In 2010, it is expectedto total USD 367 billion, which would be about 45% of all net private flows. In 2010, FDI will have been boostedby the revival in corporate earnings, which will have increased the retained earnings component of FDI. Despitethis, the projected recovery in net inflows from their peak in 2008 (USD 508 billion) and relative to 2009 (USD342billion) is quite modest (a net increase of about USD 25 billion). The main reason for this relative sluggishnessis undoubtedly the weak overall global investment environment.
2 Source: the Institute for International Finance (IIF).

8/6/2019 Back in Fashion_Why Emerging Markets Are Still Attractive_April 2011
http://slidepdf.com/reader/full/back-in-fashionwhy-emerging-markets-are-still-attractiveapril-2011 7/36
Why Emerging Markets are still attractive Page 7
Emerging Asia remains the largestrecipient of non-resident FDI (USD156 billion) and China the single-largest recipient (USD 90 billion). All other regions enjoy healthyinflows, however, albeit well downfrom the peak years of 2007 and2008, when real estate investmentfeatured large in FDI flows. Bysector, more FDI is nowconcentrated in the extractionindustries. A number of maturemarket banks are bolstering thecapital in their EM subsidiaries,and this is supporting FDI,especially in Emerging Europe.There is no obvious advantage of
scale: the BRIC countries combined account for USD 188 billion of inward FDI flows in 2010. Remarkably, this isidentical to their share of the combined GDP of the group.
Las but not least, EM economies are becoming more and more diversified in their production and exportpatterns, although this has been largely offset by vertical specialization-with some countries supplying parts andother intermediate products to the country that is the ultimate exporter. This specialization has led, particularly in Asia, to regional supply chains. Diversification offers only limited protection against large global shocks but, aslong as the macro effects of shocks are not the same across the export markets of EM economies, it can helpthem deal with the disruptions that occur over the normal business cycle . Note that China and India, respectively,became the dominant global suppliers of manufactured goods and services, while Brazil and Russia will becomesimilarly dominant as suppliers of raw materials. It should be noted that of the four countries, Brazil remains theonly nation that has the capacity to continue all elements, meaning manufacturing, services, and resource
supplying simultaneously.
Cooperation becomes thus the logical step among the BRICs as Brazil and Russia together form the logicalcommodity suppliers to India and China. Thus, the BRICs have the potential to form a powerful economic bloc tothe exclusion of the modern-day states currently of G8 status According to a last report from Goldman Sachs,China might surpass the US in equity market capitalization terms by 2030 and become the single largest equitymarket in the world.
Greater trade and financial linkagesamong the EM have increased their resilience as a group. Strong growth inthe EM has then protected commodity-
exporting countries from slowdowns inthe advanced economies. China’scontinued rapid growth during the crisis,fueled by a surge in investment, hasboosted the demand for commoditiesfrom EM, such as Brazil and Chile, andhas increased the demand for rawmaterials and intermediate inputs fromother Asian EM. This increase in tradeflows among EM economies has alsobeen accompanied by a rise in financialflows within this group.

8/6/2019 Back in Fashion_Why Emerging Markets Are Still Attractive_April 2011
http://slidepdf.com/reader/full/back-in-fashionwhy-emerging-markets-are-still-attractiveapril-2011 8/36
Why Emerging Markets are still attractive Page 8
As a negative tone, today, the unrest in the MENA zone that raises concerns about oil’s impact on global growth.Oil price increases have been associated with economic downturns in the past. According to JP Morgan, a 20%rise in crude oil prices, roughly the recent move in Brent crude from its Q4’10 average – should shave 0.25% off annualized global growth during H1’11.
The events in the MEZA zone raise upside risks to commodity prices (reinforcing our bullish view on commoditysector). Not only risk is driving oil, oil is also driving everything else. Indeed, the steep increases in purchases of agricultural commodities by vulnerable North African countries (combined with global climate shocks that arehitting harvests) are putting further upward pressure on agricultural commodity prices, exacerbating the inflationthreat within EM. Thus, inflation fears remain a concern, with consumer prices increasing in advanced andemerging countries alike.
In the developed world, with some exceptions, inflation is still below 3%, but has accelerated, over the last sixmonths, in UK, Canada and Spain, while it decreased slightly in Switzerland and Australia. US inflation hasaccelerated slightly, but remains low at only 1.6% (rate hikes are therefore rather unlikely). In the emerging world,inflation, over the last six months in Brazil has increased to 6% despite relatively high interest rates. This exceedsthe historical average by about 1.3 standard deviations and is well above the central banks 4.5% inflation target.Inflation has also accelerated and stands at levels above historical average in South Korea, Poland, Singaporeand China. These countries have already raised policy rates within the last six months. In India, inflation (9.5%)remains slightly above average, even though it decreased by 4% over the last six months. Russia has historicallyendured comparably high rates of inflation. Over the last six months, inflation has rapidly increased to 9.6%,which is still below its seven-year average.
Among others, one of the reason why inflation expectations in the EM world are gaining concerns is from the well-known problem of EM consumer basket composition and the subsequent rapid diffusion of rising food (andenergy) prices in the consumer price index (CPI), while in number of key advanced economies it is not the case.in the US, the food component as a percentage of overall CPI is 7.8%. In China, it is 31.4%. In India, 47.1%.

8/6/2019 Back in Fashion_Why Emerging Markets Are Still Attractive_April 2011
http://slidepdf.com/reader/full/back-in-fashionwhy-emerging-markets-are-still-attractiveapril-2011 9/36
Why Emerging Markets are still attractive Page 9
In an article in the December 2008BIS Quarterly Review, Cecchetti andMoessner 3 show that impact of foodinflation falls disproportionatelyheavily on EM economies, with theweight of food in the average CPIbasket for emerging economiesaround 30%, while in matureeconomies it weighs less than half ataround 13%.
This means that for any givenincrease in raw commodity prices,the increase in CPI food inflationwill be far greater in EM countriesthan in DM economies.
By contrast, the weight of energy in both EM and DM CPI is roughly the same at around 7.7% for both, and thecontribution in headline inflation is much higher (close to four times higher) in the DM economies than in the EMones. So, while a given increase in raw food prices has a larger flow through to EM CPI inflation, this relationshipis reversed with oil, as many EM economies subsidize energy prices to consumers. It should be noted thatsome of them control selected food prices through administrative measures and subsidies as well.
The divergence in economicperformance relative to longer-term trends is also another apparent reason in theperformance of EM inflationover the past years. To assesswhich countries are morevulnerable to inflation risks, JPMorgan4 suggests making a
judgment based on whether EMeconomies are in their respectiveeconomic cycles, i.e. are theygrowing above potential andtherefore do not have muchslacks5 in their economy and viceversa. Secondly, whether thecountry has a floating (or fixed) exchange rate regime which allows for some currency appreciation to help slowthe economy and contain inflation pressures. The result is amazing: not all EM economies are running hot.
3 Cecchetti, S., & Moessner, R. (December 2008) Commodity prices and inflation dynamics. BIS Quarterly Review, 55-64. 4 JP Morgan Asset Management (February 2011): “2011 Outlook – Global Emerging Markets Equity”.5 Economic slack stands for the unused portion of the economic productive capacity.
Contribution to headl ine inflation by CPI component, Mid 2008 to January 2011
Headline Food Contribution Energy Contribution Non Food
inflation weight (%) to headline in % weight (%) to headline in % and Energy in %
DM economies 3.8 13.3 0.7 18.4 7.7 1.4 36.8 1.7 44.7
EM economies 8.2 29.5 3.8 46.3 7.7 0.9 11.0 3.5 42.7
Source: BIS, Credit Suisse.

8/6/2019 Back in Fashion_Why Emerging Markets Are Still Attractive_April 2011
http://slidepdf.com/reader/full/back-in-fashionwhy-emerging-markets-are-still-attractiveapril-2011 10/36
Why Emerging Markets are still attractive Page 10
More, the “good” news is thus that most EM economies still seem to be operating with some slack and mostcountries now operate a floating exchange rate regime. JP Morgan result clearly show that there are somenotable markets that appear to have sustainably outrun their potential and thus face inflation risks , but not all.China, for example, has been significantly outpacing the 8-8.5% growth rate viewed as trend growth. India hasslightly overshot the 6%+ trend rate, while Indonesia has also begun to outperform the long-term trend. However,Brazil has grown at trend rate, and most other significant markets have lagged trend and thus should retaindisinflationary slack. Therefore inflation looks to be a selective rather than a systemic risk within EM. Conversely,Russia and Turkey, as well as Brazil are better positioned to avoid near-term inflation risks as they all fall at or below their respective trend growth levels.
Another interesting empirical investigation, based on the deviation of core inflation to the unit labor coast (ULC)relative to output gap6, rapports that Brazil, Turkey and China are at greatest risk of over-heating. Furthermore,Russia and Indonesia need to be treated with some caution given the absence of slack in their economies andtheir rising ULCs. India is also a strong candidate for over-heating because it ranks highest on normalized outputgap measure as well as experiencing the highest core inflation in the EM universe. Thus, the BRIC bloc, alongwith Indonesia and Turkey, are running “hot”. At the other extreme, South Africa, Korea and the Philippinesappear to have plenty of slack available. So, mind the output gap…
Many emerging economies are currently in the process of normalizing their monetary and fiscal policies in order to prevent overheating of their economies, which should slow (but not reverse) growth momentum to a healthypace. Nevertheless, inflation and growth in the emerging world are likely to persist at levels higher than in the DM
economies over the coming economic cycle, mainly due to the impetus of rapidly rising food prices.
6 By taking the difference between ULCs and inflation, they highlight those economies where the rise in ULCs is likely to beleading inflation higher, and where, therefore, we may suppose that over-heating conditions are most likely to prevail. MRBPartners (February 2011): “ EM Inflation: Will the BRICs Trigger a Hard Landing”.

8/6/2019 Back in Fashion_Why Emerging Markets Are Still Attractive_April 2011
http://slidepdf.com/reader/full/back-in-fashionwhy-emerging-markets-are-still-attractiveapril-2011 11/36
Why Emerging Markets are still attractive

8/6/2019 Back in Fashion_Why Emerging Markets Are Still Attractive_April 2011
http://slidepdf.com/reader/full/back-in-fashionwhy-emerging-markets-are-still-attractiveapril-2011 12/36

8/6/2019 Back in Fashion_Why Emerging Markets Are Still Attractive_April 2011
http://slidepdf.com/reader/full/back-in-fashionwhy-emerging-markets-are-still-attractiveapril-2011 13/36
Why Emerging Markets are still attractive Page 13
Today, debt is cheap while thecost of equity has done quitethe opposite. The EMBI spreadaveraged 800bps through the 90sand is under 300bps today. All inyields are at lows of less than 6%given the extraordinarily low yieldson US treasuries. This makes debtfunding look very attractive. Anumber of EM companies havetaken advantage of favorableterms to issue debt recently. Also,the equity risk premium hasremained elevated – at arounddouble its historical average, even after retreating from its 2008 peak. This combination of falling debt costs andrising equity costs suggests a higher mix of debt to equity on the corporate balance sheet should be used tooptimize the cost of capital. Indeed, to minimize the cost of capital (WACC), a deduced leverage ratio above
current levels is required.
Forcing the net debt to equity ratios to stay at 43%, the level that optimizes the WACC, UBS develops a modelpays excess equity back to shareholders and raises the payout ratio to maintain the net debt to equity ratio at43% in the future. For EM in aggregate the starting net debt to equity ratio was 29%. Forcing this to 43%necessitates a mixture of increasing debt and reducing equity. The equity reduction is paid back to shareholder ina special dividend. The payout ratio also increases and as time goes on could converge to or even pass the worldpayout ratio (47%). The new dividend yield would also be higher than the world (3%) making EM even moreattractive as a region. Not only does EM offer the only source of growth in global equities but could offer ahigher yield too.
4. EM equity fundamentals are healthy, on absolute and relative terms
In terms of valuations, EM equities remain attractive in both absolute than relative (to the DM, of course) terms.
EM equities currently trade on 11.5x 12 month forward earnings, compared to the World on 12.1x, andbelow the long-term average of 13.3x (15.65% discount to history). This is a PE discount of 5% to the world,which has closed from a wide of 14% earlier in 2010 and as wide as 30% in October 2008. Both EMEA (9.2x) andLATAM (11.2x) trade at a discount to GEM leaving Asia (12.8x) as the sole premium. On the sector basis, thebulk of the value is in the domestic orientated sectors, especially Financials. In our view, Energy and Materialsectors offer good value too where as Technology is overvalued.
P/BV should be viewed alongside RoE in order to be useful. High valuations usually accompany high profitabilityand mispricing often exists when this relationship breaks down. Furthermore, investors usually compare current
P/BV with its long-term average (1.80x) as a yardstick for value. EM is currently valued at 1.74x next year’sprojected book value, so broadly in line with long-run average . EMEA (1.48x) is the only region trading at adiscount to GEM leaving Asia (1.86x) and LATAM (1.7) as the premiums. On the sector basis, the bulk of thevalue is also in the domestic orientated sectors, especially non cyclical consumers.
2011 should likely see the return of the valuation premium of GEM to the World on a PE basis asinvestors recognize and are willing to pay for the superior growth prospects the GEM universe has tooffer.

8/6/2019 Back in Fashion_Why Emerging Markets Are Still Attractive_April 2011
http://slidepdf.com/reader/full/back-in-fashionwhy-emerging-markets-are-still-attractiveapril-2011 14/36
Why Emerging Markets are still attractive

8/6/2019 Back in Fashion_Why Emerging Markets Are Still Attractive_April 2011
http://slidepdf.com/reader/full/back-in-fashionwhy-emerging-markets-are-still-attractiveapril-2011 15/36
Why Emerging Markets are still attractive Page 15
Turning to top-line analyses, EM corporate earnings have almost entirely erased their 2008-9 collapse. TrailingEPS on MSCI GEMs fell in the recent recession by 42% from peak-to-trough and have since rebounded by 70%,to stand just a fraction below their mid-2008 all-time high. This V-shaped earnings recovery has gone further inEM than in global markets as a whole.
Earnings may be rebounding, but forward growth momentum continues to slow. After falling by 28% in 2009,reported MSCI GEMs earnings shot up by 64% during 2010. Rolling 12-month forward EPS forecasts for GEMspeaked at around 30% in early-2010 and have now eased back to just 17% growth.
Given sales growth is about in line with the nominal GDP forecast coupled with modest margin expansion, we can
expect these earnings expectations to be met, ceteris paribus. The 12-month forward consensus data for eachEM region show a similar picture both to GEMs as a whole and, in large part, to each other. While the slowdownin this forward consensus data is more rapid in Asia (down now to only 16% growth), EPS growth projections for LATAM and EMEA have also eased to around 20%.
For 2011, current consensus forecasts are, as would be expected, at similar levels to those shown in the chart:13.6% for EM Asia, 19.3% for LATAM and 20.7% for EMEA. Switching to sectors, Technology is the only sector expected to post a YoY decline in earnings next year. Although the Telecoms sector is largely in an ex-growthphase, growth in EMEA is surprisingly strong. The strongest growth is reserved for the Financials, Materials andUtilities sectors. Growth prospects elsewhere are broadly in line with the GEM aggregate.
Dividends for EM aggregate are expected to grow by 17% and 22% in 2010 and 2011, respectively.Furthermore it is expected to be the strongest grower of dividends in 2011 supported by earnings. We expect bigincreases in dividends for the Healthcare sector in both 2010 and 2011 too.
EM free cash flow (FCF) yields are foreseen at 0.6% and 3.0% in 2010 and 2011. Korea is still forecasted tobe FCF negative in 2010 but is expected to give positive yield for 2011. Telecoms are expected to post thestrongest FCF yields in both 2010 and 2011, with EMEA leading from the front. All the regions are expected to becash generative in 2011.

8/6/2019 Back in Fashion_Why Emerging Markets Are Still Attractive_April 2011
http://slidepdf.com/reader/full/back-in-fashionwhy-emerging-markets-are-still-attractiveapril-2011 16/36
Why Emerging Markets are still attractive Page 16
5. EM equities are not a crowded trade
According to IFF data and estimates7,net inflows of non-resident portfolioequity have been particularly strong in2010. It is projected to total USD 186billion in 2010, up from USD 149billion in 2009. Portfolio equity flowshad reversed sharply in 2008, so therevival inflows in 2009 and, to a lesser extent in 2010, possibly reflects thereturn of investors who had initiallyfeared that the global crisis would bedevastating for the corporate sector inEM economies. In 2011, net portfolioequity flows are forecast to remainhigh, at USD 143 billion.
By region, flows into Emerging Asia are forecast to be largest, at USD 93 billion, with about USD 36 billion andUSD 30 billion going into China and India, respectively. Non-resident portfolio equity flows into Latin Americancountries have been particularly strong. For the year as a whole, they are forecast to be USD 72 billion. Netportfolio equity flows to Africa and the Middle East are a relatively small absolute amount (about USD 10 billion),but have rebounded strongly in 2010, led by Egypt. Flows to Emerging Europe are also reviving, but are likely tobe lower for 2010 as a whole (USD 12 billion). The main disappointment has been Russia.
This growing momentum in portfolio equity flows is consistent with the relative strength of the outlook for EMeconomies. And it is also more than simply a tactical bounce as global investors are really processing in shiftingtheir asset allocations towards EM assets, driven by the attraction of superior growth. This is proven by thesteadily rise of the share of the capitalization of EM equities in the global total in recent years.
With so many problems afflicting previously prestigious companies in DM economies, the relative risk of investingin EM companies has declined. Not only. Inflows in our view are supported by strong fundamentals, and even soare not at extraordinary magnitudes. Indeed, many observers tend to focus on the absolute number and point atthe record level of inflowsand use this as a basis for arguing that EM is acrowded trade. When thesize of these inflows isnormalized i.e. adjustedfor the change in theunderlying size of the
equity market, theanalysis is no more thesame. Indeed, it appearsthat the money in thesystem that left in thesecond half of 2008 hasonly just returned.
Furthermore, EM equityfunds experienced a multi-year period of inflows prior to the financial crisis before fears over positioning called this into question.
7 Source: the Institute for International Finance (IIF).

8/6/2019 Back in Fashion_Why Emerging Markets Are Still Attractive_April 2011
http://slidepdf.com/reader/full/back-in-fashionwhy-emerging-markets-are-still-attractiveapril-2011 17/36
Why Emerging Markets are still attractive Page 17
Many EM will double or triple over thenext few years. But EM are alsoextremely small as a percentage of total global market capitalization.There are good reasons why theUnited States and the UnitedKingdom are among the highestcapitalizations. In part, this is becausea higher percentage of companies arepublicly traded in the United Statesand the United Kingdom, whereas inother countries, many more areprivately held, family-owned, or indeed government-run. Individually,almost all EM are less than 0.5% of total world capitalization. When
compare the total market caps of some of these markets alongside the market caps of some well-known blue chip
stocks, we can see that Microsoft (MSFT) has a bigger market cap than all of Indonesia, General Electric (GE)and Wells Fargo (WFC) have market caps almost double that of all of the Philippines, Monsanto (MON) and TimeWarner (TWX) have bigger market caps than all of Vietnam and Pakistan, and GAP Inc’s (GPS) market cap isalmost double that of Sri Lanka’s.
Additionally, supporting data, which show that EM positions held by global equity funds are far from beingextreme. Indeed, according to EPFR, global funds are still underweight emerging market equities despitesubstantial inflows. Global Investors must raise their allocation to EM from 7% to 14% just to maintain aneutral position against the World benchmark. The longer-term perspective also indicates that EM equitiesare underrepresented within the World. In the long run, EM share of the world’s equity market should becomparable to their share of global economic output: EM GDP on a PPP basis now contributes roughly 50%to the World whereas the equity base, at least the free-float portion, is only 14% of the World.
STILL CONSTRUCTIVE ON THE ASSET CLASS
EM have been in a sweet spot this past year or two as liquidity unleashed by Western central banks has pumpedup the market, fuelling double-digit returns. Many different surveys realized last year forecasted EM returns to far
outstrip DM equity gains in 2011.

8/6/2019 Back in Fashion_Why Emerging Markets Are Still Attractive_April 2011
http://slidepdf.com/reader/full/back-in-fashionwhy-emerging-markets-are-still-attractiveapril-2011 18/36
Why Emerging Markets are still attractive Page 18
A survey realized by UBS lastDecember shows that investorscontinued to expect equities to be thebest performing asset class of 2011,while they were expecting EM to returnabout 20% this year. When asked abouttheir position relative to the asset class,half of the globally investing specialistsargue being only moderately overweight
End of 2010, EM were a consensus tradefor 2011, looking for further heavy inflowsof investment dollars, raising evenquestions over how much more new money they can comfortably absorb without igniting an asset bubble. Mostinvestors and managers also picked EM as a top bet for 2011, citing double-digit returns, underpinned by risingincomes and fast economic growth. Equity portfolio flows to EM were set to reach USD 186 billion in 2010, and,while they were seen falling a touch to USD 143 billion in 2011, according to the Institute for International Finance
(IIF), they will still be more than double the USD 62 billion annual average seen between 2005 and 2009.
While inflows have been strong enough to prompt some to wonder whether the EM story is already fully priced,we believe they still offer plenty of potential. Our argument is straightforward: the most impressive reforms in theasset class over the past decade were not necessarily the macro reforms we’re all familiar with – lower inflation,better budget positions etc – but rather the improvement in corporate capital discipline and the resultingimprovement in operating efficiency, (reduced) financial leverage, and returns on equity. These improvements areallowing profits to participate in more rapid EM economic growth, leading to a secular rise in the share of globalprofits that are accruing to EM companies.
Therefore, in general, we remainpositive on the wider investment
case for emerging markets. Webelieve EM will continue to have robustgrowth potential driven by strongdomestic demand and investments.Domestic consumption will increasinglydrive economic growth. 2 other supports worth to be discussed here:the global amply liquidity and thestructural weakness of the greenback.
Global ample liquidity: don’t fight the Fed … Indeed, during Fed easing, EM equities perform the bestafter the trough in Fed funds rate. Using data since 1990, this has been the case in all three occasions
of prolonged easing of monetary policy by the Fed: 1991-1994, 2001-2004 and 2008 to date.
Today the situation is symmetrical with both 1993 and 2003. As in 1992, rates are low in support of a weakbanking system and a sluggish economy. As the Fed expands its balance sheet and drives nominal and realyields to ever lower levels, investors seek higher yields, growth and stores of value outside the US in non-dollar denominated assets. As in 1993 and 2003, EM equities have been a favorite destination for investors, along withEM bonds and real estate.

8/6/2019 Back in Fashion_Why Emerging Markets Are Still Attractive_April 2011
http://slidepdf.com/reader/full/back-in-fashionwhy-emerging-markets-are-still-attractiveapril-2011 19/36
Why Emerging Markets are still attractive

8/6/2019 Back in Fashion_Why Emerging Markets Are Still Attractive_April 2011
http://slidepdf.com/reader/full/back-in-fashionwhy-emerging-markets-are-still-attractiveapril-2011 20/36
Why Emerging Markets are still attractive Page 20
The result was a hunt for higher yield and higher growth assets. Indeed, EM appreciated by over 70% in 1993(and almost 200% between 1991 and 1993), as inflows swamped the asset class.
This wall of capital altered, however, the behavior of EM policy makers. In order to protect their financial system,domestic economy and exporters, some countries imposed controls on speculative capital: Chile (1991), Brazil(1993), Colombia (1993), whereas Malaysia (1994) left it late and had virtually to close off its capital account.
Elsewhere, Mexico and the Pacific Rim in particular, embraced the inflows and used them to finance increases ininvestment and consumption. Private sector credit grew rapidly, the current account deficit widened further andexternal debt built up. Problems occurred when capital started to leave. Once confidence weakened, capital flighttook place and FX reserves had to be deployed to support the currency. As FX reserves dwindled, the currencywas eventually devalued, culminating in crisis.
Crises during the late 1990s were almost inevitable and in their simplest form were associated with an overvalued(often pegged) exchange rate and a current account deficit funded by short term capital inflows.
2011 is more like 2003 than 1993. Indeed,
valuations today better reflect 2003 levels;likewise commodity prices are rising. GEMbalance sheets are strong and currenciesundervalued. Although we recognize that globalgrowth today is more fragile, Fed easing isalways very positive for GEM assets. Check for the aftermath of Fed easing, however.
Unlike 1994, when the Fed hiked interest ratesin 2004, there were no dislocations in EmergingMarkets. Currencies were fundamentallyinexpensive and well supported. The current
global macro backdrop is favorable for highyield and high growth plays. With the prospect of further capital controls, the likelihood is that capital moves intodebt instruments of longer maturity and eventually equities.
Structurally weaker dollar : feeble dollar amplifies EM returns. It is also about carry trade in which ultra-lowUS interest rates enables investors to borrow in dollars and buy riskier assets, including commodities, foreigncurrencies and EM stocks.
The USD offers limited upside potentialand should remain in range-tradingmode, as measured by the trade-weighted DXY index. The combination
of loose monetary policy and a lack of amedium term plan to reduce the USfiscal imbalances will likely result in aweak USD, even if the growth outlookproves to be surprisingly strong. Whathappens when the Fed turnsaggressive?
Renewed bouts of risk aversion willlikely be a recurring theme in 2011 andwill help to limit downward pressure on
the USD. USD dollar firmness is usually negative for EM’ relative performance. If so, risks to EM, both in
absolute and relative performance terms, are skewed to the downside. So, keep an eye on the greenback.
8/6/2019 Back in Fashion_Why Emerging Markets Are Still Attractive_April 2011
http://slidepdf.com/reader/full/back-in-fashionwhy-emerging-markets-are-still-attractiveapril-2011 21/36
Why Emerging Markets are still attractive Page 21
Even though the US dollar remains weak relative to EM currencies, there could be a significant reboundsometime in 2011 as the US economy shows signs of gradual recovery. While this would not derail a long termstructural uptrend in EM assets, this will likely bring episodes of relative underperformance vis-à-vis of the DMassets, mainly the US ones. Also, more capital controls are likely to stay in EM countries particularly if foreigndirect investment flows continue to disrupt their exchange rates. Las, but not least, inflation is under upwardpressure in emerging economies and there will be further policy tightening in these countries. In contrast, the Fedis still preoccupied with high unemployment and continues to favor easy money policies. Policy tightening andthe resultant liquidity squeeze in emerging economies may continue to ensure a period of share priceunderperformance relative to their US counterparts.
RISKS TO THE MODEL
Risks are the following.
Policy and political risks
Capital controls: strong foreign inflows and continued FX appreciation have prompted EM central banks to
implement capital control measures.
For equity investors, controls designed to reduce the effective carry in fixed income markets are ok. Broader capital controls which reduce the ability of equity investors to buy and sell would be negative as they reduceliquidity and increase volatility.
Anti-asset inflation policies: central banks are targeting asset prices in EM to counter asset inflation. Thesepolicies introduce economic and sector specific risks. Note how poorly real estate stocks have performed in EMdespite low interest rates.
Trade wars: high US unemployment, China’s large current account surplus and polarized politics in the USincrease the risk of a trade war.
Economic risks
Uncertain outlook for commodities: our commodities and energy underweight is driven by a combination of long term economic cycles and a potential inflection point in the growth of Chinese material demand. The timingis complicated by the large influence of financial investors on commodity markets. The timing risk in a bearishview on commodity companies is high. Industrial metal prices rallied since May while global leading indicators fell.Correlation of commodities to risk assets (equities) is high today. Momentum in a world of zero interest rates is anattractive attribute. An UW commodity call is unlikely to work at this point. When it does eventually the correctionmay prove to be violent as financial investors exit.
Unintended consequences of QE2: if QE2 results in a sharp increase in commodity prices it may choke-off
growth and ultimately be counterproductive.
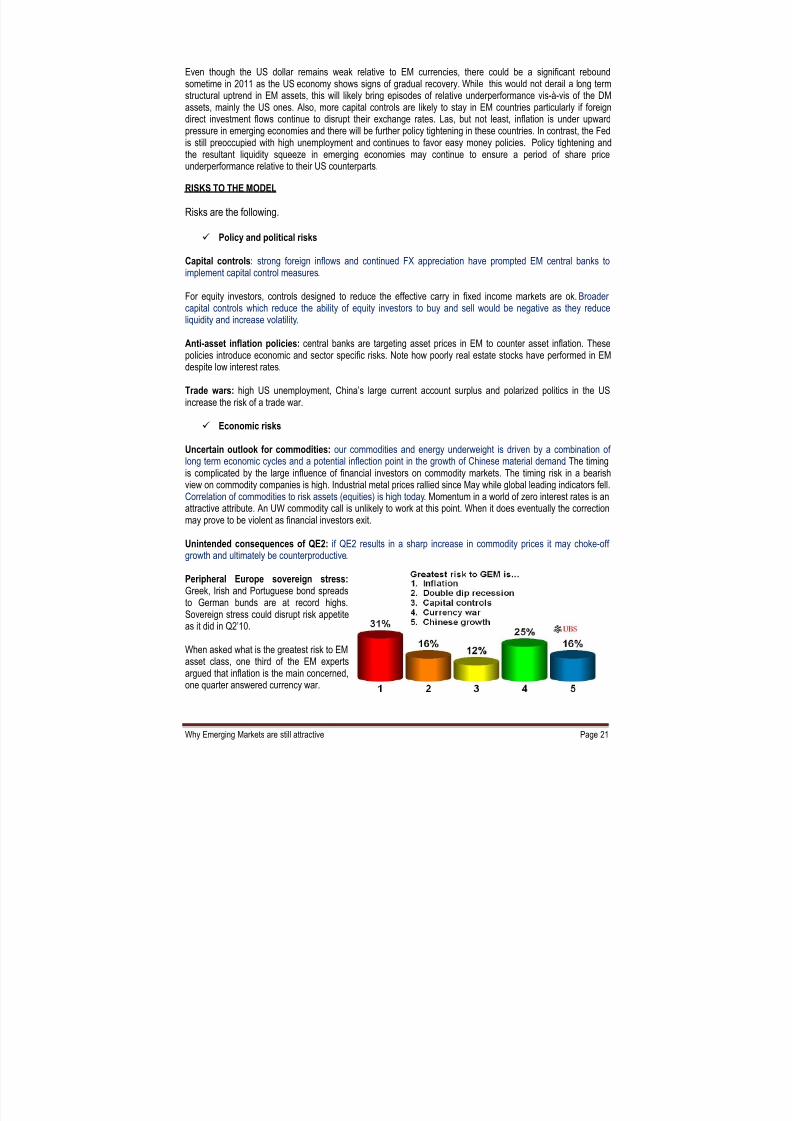
Peripheral Europe sovereign stress:Greek, Irish and Portuguese bond spreadsto German bunds are at record highs.Sovereign stress could disrupt risk appetiteas it did in Q2’10.
When asked what is the greatest risk to EMasset class, one third of the EM expertsargued that inflation is the main concerned,one quarter answered currency war.

8/6/2019 Back in Fashion_Why Emerging Markets Are Still Attractive_April 2011
http://slidepdf.com/reader/full/back-in-fashionwhy-emerging-markets-are-still-attractiveapril-2011 22/36
Why Emerging Markets are still attractive Page 22
HOW TO PLAY THE EM
Yes, kind of danger signals are flashing all over the EM. Global growth is slowing, though remains firm, above thetrend. Inflation is heating up. And political instability is upending governments in the Middle East and North Africaand could spread further. But those who bailout now could miss out on big opportunities. Investors have pulledmoney from EM mutual funds for six of the past seven weeks, according to EPFR Global.
Bank of America (BofA)Merrill Lynch noted asignificant move awayfrom the EM in its latestHedge Fund Monitor inMarch, a report thatexamines hedge fundasset flows on a seven-day basis. But it observesthat this move was less
than the exit in the long-only space, where over a4-week stretch inFebruary more than 10%of EM inflows werereversed. The Merrill
Lynch hedge funds data is only a snapshot of flows in the last week of February and anecdotally, sentiments areat odds with its findings. And it appears that there is a feeling that the shrewdest hedge fund managers and usersof alternatives are maintaining or even increasing their emerging market positions. But since mid March, the trendhas totally reversed, as it is seen in the graph..
Contrary opinion indicators (anda few others) are signaling thatthe correction is either over or has passed the first bottom in atrading range. More, EM stocks,which had been lagging in2011, have soared in the pasttwo weeks, sending theemerging markets ETFs to newbull market highs One of thebest technical tools for locatingstrengthening markets is
relative strength – specifically,the normalized RSI index. Thistool helps quantize the relativeperformance of different stocksor indexes- even if they havevastly different volatilities - byputting the numbers on thesame normalized scale. The chart below shows the five year performance of the large cap S&P 500 ETF (SPY)and the emerging market ETF (EEM). The index in green is the difference between their 14 week RSI indexes(EEM-SPY). A positive reading means EM have been outperforming while negative readings mean they havebeen underperforming. The chart indicates that once a low has been made the momentum swings all theway back to EM with few false signals.

8/6/2019 Back in Fashion_Why Emerging Markets Are Still Attractive_April 2011
http://slidepdf.com/reader/full/back-in-fashionwhy-emerging-markets-are-still-attractiveapril-2011 23/36
Why Emerging Markets are still attractive

8/6/2019 Back in Fashion_Why Emerging Markets Are Still Attractive_April 2011
http://slidepdf.com/reader/full/back-in-fashionwhy-emerging-markets-are-still-attractiveapril-2011 24/36
Why Emerging Markets are still attractive Page 24
Additionally, EM are no more the monolith they used to be. Some countries look strong despite - or because of -the recent turmoil, with solid growth prospects, little inflation pressure and the ability to capitalize on rising oilprices. Among them, say money managers and market strategists: Russia, Mexico, Thailand, Taiwan, Turkey andthe Czech Republic. In fact, the average "correlation" between the MSCI index and its component nations hasdropped to 0.53 on March 2 from 0.8 on Dec. 31, according to financial-data firm FactSet. By another measure,the emerging markets are less connected than they have been since at least 1995. Goldman Sachs Group Inc.recently measured the difference between actual economic activity in 24 emerging-market nations and thehistorical trend, a spread known as the output gap. It found that there is more divergence now than at any pointsince at least 1995.
Where to Buy- and Sell? As previouslymentioned, Long-only fund managershave been quick to take fright at therising inflation in the emerging markets,but as fast as they tilt their allocationstowards the developed world, hedgefunds are snapping up their unwanted
emerging market stock. Although somemacro hedge funds have trimmed backemerging market exposure, their exit from countries such as Brazil has been less marked than in the wider retailinvestment community.
Given all of these factors- growth, inflation, political stability and oil- many money managers and strategists citeRussia, Thailand, Taiwan, Turkey and the Czech Republic as the best plays now. Russia is the most sensitive tooil-price swings, with about three-quarters of its public companies in oil and energy. The correlation between oiland stock prices there is 0.92, the highest among emerging markets. Yet despite the recent run-up, Russia'sprice/earnings ratio based on 12-months of analyst earnings forecasts is just 6.8, well below its historical averageof 8.1. It is cheap largely because earnings are projected to soar from rising oil prices.
Taiwan is another favorite among money managers and strategists. The HSBC Taiwan Purchasing Managers'Index, a growth measure, jumped by 9.3% in January from a 5.4% rise in November, signaling a strengtheningeconomy. Yet its consumer-price index, the main inflation gauge, rose just 1.33% year over year in February.Mexico, too, looks attractive. Its central bank recently raised the range of its growth forecast to 3.8% to 4.8% from3.2% to 4.2%. And like Indonesia, Mexico is a net oil exporter. It also should get a boost from a recovering U.S.economy, since exports to its northern neighbor make up nearly a quarter of its GDP. Thailand, Turkey and theCzech Republic also seem like good bets based on their solid growth prospects and moderate inflation, saystrategists and fund managers.
Where should investors tread most carefully? Start with India, a major energy importer. Inflation is running highand growth is expected to drop to 6% this year from 8% in 2010, according to Lombard Street Research. Yetdespite the recent selloff, India's stocks aren't cheap, with a P/E of 14.6, compared with a long-term average of
13.8. China is facing many of the same problems, and it isn't clear whether policy makers, who have boostedinterest rates three times since October, will be able to engineer a soft economic landing while controlling prices.
MY GLOBAL ASSET ALLOCATION
For the independent investment research BCA, investors should avoid the temptation to bottom fish in emergingmarkets for now. BCA argues that EM relative performance will be at risk again, especially versus the S&P 500,after a period of stabilization. The odds are that the US dollar might surprise on the upside, thus investors shouldnot be short the dollar versus EM currencies. Hence, it should not be surprising that EM have started to catchsome bids in the past two weeks with some investors bottom-fishing.

8/6/2019 Back in Fashion_Why Emerging Markets Are Still Attractive_April 2011
http://slidepdf.com/reader/full/back-in-fashionwhy-emerging-markets-are-still-attractiveapril-2011 25/36
Why Emerging Markets are still attractive
Wa
Our Global Tactical Asset Allocation (GTAA) portfolio provides comonths and over) views or Global Asset Allocation Portfolio. For m
-6.0 -4.0 -2.0
Fixed Income; -5.0
Real Esta
Cash; -3.0
tch our Global Tactical Asset Allocation (GTAA) Portfolio
ncise investments that we expect to create returns over a tactical (1-3 months) timore: [email protected].
0.0 2.0 4.0
Developed Markets; 2.0
All Afric
Other Frontier Markets;2.0
Mature EmergingMarkets; 0.0
Alternatives; 0.0
Commodities; 0.0
Foreign Exchange; 1.0
Hedge Funds; 0.0
te; -1.0

8/6/2019 Back in Fashion_Why Emerging Markets Are Still Attractive_April 2011
http://slidepdf.com/reader/full/back-in-fashionwhy-emerging-markets-are-still-attractiveapril-2011 26/36
Why Emerging Markets are still attractive Page 26
Should we be contrarian or momentum? There is no doubt some funds managers have gone short on EM -the high oil price is not good for places like India but this is less so for China and Russia. Even if shifting out of EM is the best short-term trade, the smart asset allocators are unlikely to be able to pinpoint the moment to buy inagain later, though looking to buy in again once conditions improve will be battling with the masses.
We move now neutral mature EM relative to the DM (mainly the S&P 500) in a global portfolio allocation .
And we decide to add Frontier Markets (FM) mainly, Africa. FM are the nascent or “little guys” amongEM. What are the rationale?
Real GDP growth : according to estimates, 8 of the 10 best GDP growth performer in 2011 are FMeconomies.
Rising domestic consumption: steady increases in FM GDP is expanding personal incomes, inducinggrowth in both savings and consumption in these economies. This, in turn, should allow frontier marketcountries to break the cycle of low incomes leading to low levels of consumption, savings & investment,and productivity.

8/6/2019 Back in Fashion_Why Emerging Markets Are Still Attractive_April 2011
http://slidepdf.com/reader/full/back-in-fashionwhy-emerging-markets-are-still-attractiveapril-2011 27/36
Why Emerging Markets are still attractive Page 27
Improving domestic institutional development. According to the World Bank's Ease of DoingBusiness Index , that measures how difficult it is to start a business in a country, based on businessregulations and the protection of property rights, most frontier markets have improved their globalranking in recent years.
Growing reliance on capital markets for growth: the rising trend for FM governments to privatizelarge, previously state-run firms, along with the rapidly growing number of initial public offerings (IPOs) inthese countries, demonstrates a growing reliance on capital markets. The increase in IPOs has, in turn,also boosted the overall equity market capitalization of the frontier universe and is starting to bring thosecountries and companies to the attention of more international investors.
Africa is a land of opportunities in the 21st century. Globalinvestors should not be bogged down by the continent’s longdark history. For most international investors, however, Africa’s economy still looks tiny, accounting for only 2% of world output. But the continent is a vital region of the world.With close to a billion people (15% of global world
population) and vast natural resources, the region’sopportunities and accomplishments are frequentlyovershadowed by crises, conflicts, and chronic poverty.
Yes, Africa is a continent with great challenges, tremendousopportunities, and unappreciated accomplishments. Anddespite of recent events in Côte d’Ivoire and in the North of the continent, the political landscape of Africa is undergoingsignificant positive and lasting changes over the past 20years. Since 1990, for example, 42 of the 48 countries insub-Saharan Africa have held multi-party elections, andmost Africans today have the right to choose their leaders at
the ballot box. At present only 11 countries still havegovernments that came into office without due process.
Doing business in Africa was once perceived as a difficult and complex undertaking. The reasons: the numerousprocesses associated with conducting business, combined with a fragile investment climate and inadequateinfrastructure. But with political reform, it is reasonable to expect economic freedom and growth. With fewer conflicts, more democratic elections, and economic growth rates that gradually have begun to compete with thoseof other developing regions, Africa is proving itself again a continent of positive change. Together, all thestructural changes helped fuel an African productivity revolution by helping companies to achieve greater economies of scale, increase investment, and become more competitive. We believe the journey to prosperity in Africa has begun. It is unfortunate that the focus on backsliding and setbacks in a few countries overwhelms theencouraging picture in the rest of the continent.
Yes, the continent attracts less than 1% of global capital flows and accounts for less than 2% of worldmerchandise trade (exports and imports), 3% of world exports of commercial services, 4% of global grossdomestic production (GDP), and 5% of net capital inflows to developing regions. As a result, Africa is not aprimary destination for global capital. But without significant amounts of capital, Africa’s development objectiveswill not be achieved. While these challenges are daunting, recent data show that global capital flows into Africacan be enhanced significantly. This potential reaffirms that Africa’s challenges do indeed have solutions.
Much has been written about the rise of the BRICs (Brazil, Russia, India and China) and the shift in economicpower eastward as Asia outruns the rest of the world. But the surprising success story of the past decade lieselsewhere: Africa is now one of the world’s fastest-growing regions. An analysis by The Economist finds thatover the ten years to 2010, no fewer than six of the world’s ten fastest-growing economies were in sub-
Saharan Africa. The only BRIC country to make the top ten was China, in second place behind Angola. Theother five African sprinters were Nigeria, Ethiopia, Chad, Mozambique and Rwanda, all with annual growth rates

8/6/2019 Back in Fashion_Why Emerging Markets Are Still Attractive_April 2011
http://slidepdf.com/reader/full/back-in-fashionwhy-emerging-markets-are-still-attractiveapril-2011 28/36
Why Emerging Markets are still attractive Page 28
of around 8% or more. During the two decades to 2000 onlyone African economy (Uganda) made the top ten, against ninefrom Asia. Over the past decade sub-Saharan Africa’s realGDP growth rate jumped to an annual average of 5.7%, upfrom only 2.4% over the previous two decades. That beat Latin America’s 3.3%, but not emerging Asia’s 7.9%. Asia’sstunning performance largely reflects the vast weight of Chinaand India; most economies saw much slower growth, such as4% in South Korea and Taiwan. The simple unweightedaverage of countries’ growth rates was virtually identical in Africa and Asia.
Over the next five years Africa’s is likely to take the lead .In other words, the average African economy will outpaceits Asian counterpart. Looking even farther ahead, StandardChartered forecasts that Africa’s economy will grow at an
average annual rate of 7% over the next 20 years, slightly faster than China’s.
The key reasons behind this growth performance surge included government action to end armed conflicts,improve macroeconomic conditions, and undertake microeconomic reforms to create a better business climate. African governments increasingly adopted policies to energize markets. They privatized state-owned enterprises,increased the openness of trade, lowered corporate taxes, strengthened regulatory and legal systems, andprovided critical physical and social infrastructure. Next, Africa’s economies grew healthier as governmentsreduced the average inflation rate from 25% in the 1980s to 6% after 2000. They trimmed their foreign debt byone-quarter and shrunk their budget deficits by two-thirds. Compared with the 1970s, many governments in Africahave shown a more prudent fiscal approach to the commodity price boom in recent years. In sum, the Africanfiscal position has improved from a deficit of 2.7% of GDP at the start of the decade to a 1.9% surplus in 2008.
Most African countries have seen a significant reduction in their debt burdens partly due to the improved
macroeconomic situation, above all in the resource-rich countries. At the same time, many of the poorestcountries in Africa benefited significantly from the Heavily Indebted Poor Countries (HIPC) and the MultilateralDebt Relief Initiative projects, two important international initiatives that aimed at reducing the debt burden of theworld’s poorest countries. The regional current account position has also shown considerable improvement over the last seven years. Over the 1980s and 1990s, Africa averaged a deficit of 2.6% of GDP . This increased FDIaccounted for the bulk of new African capital inflows, which grew rapidly from 2000 to 2008.
North Africa attracted 27% of theFDI to the region in 2008, comparedwith 36% in 2007; and the 47countries of sub-Saharan Africaattracted 73% in 2008, up from 64%
in 2007. In 2006, total gross privateflows amounted to about USD 45billion, almost 6% of GDP,compared with about USD 9 billionin 2000. In aggregate terms, total African foreign exchange reservesincreased from less than USD 50billion in the mid-1990s to USD 100billion in 2002, before risingexponentially to more than USD 300billion by end-2006.

8/6/2019 Back in Fashion_Why Emerging Markets Are Still Attractive_April 2011
http://slidepdf.com/reader/full/back-in-fashionwhy-emerging-markets-are-still-attractiveapril-2011 29/36
Why Emerging Markets are still attractive Page 29
While Africa’s increased economicmomentum is widely recognized, itssources and likely staying power are lessunderstood. Further investigations showthat resources now account for only abouta third of the newfound growth.Telecommunications, banking, andretailing are flourishing. Construction isbooming. Private-investment inflows aresurging. Yet the commodity boom explainsonly part of Africa’s broader growth story. African economies are becoming moreand more diversified. Indeed, In the shiftfrom agrarian to urban economies, multiple
sectors contribute to growth. The share of GDP contributed by agriculture and natural resources shrinks with theexpansion of the manufacturing and service sectors, which create jobs and lift incomes, raising domesticdemand. On average, each 15% increase in manufacturing and services as a portion of GDP is associated with a
doubling of income per capita.
Africa benefited greatly from the surge in global commodity prices over the past decade. But Africa’s economicpotential extends well beyond commodity exporting. Natural resources account for close to the quarter of thecontinent’s GDP growth. The rest comes from other sectors, including wholesale and retail, transportation,telecommunications, and manufacturing. Domestic demand represents today 150% of the continent’s globalgrowth (20% in 2000, essentially from government spending). Private consumption accounts now for 60% of totalgrowth, while its contribution was negative during the 1990s. Investment in fixed assets is set to reach close to22%, an all-time high contribution to growth for the region, but a very low size with regard to other comparableregions.
Perhaps the strongest evidence of
Africa's efforts to become a fullparticipant in the global economy isthe wave of stock markets that havebeen set up across the continentover the past two decades. Theunfolding wave of itsstock exchanges across thecontinent has led some investors todub the African economies as thenext generation of EM. Thisdevelopment is significant not onlyfor its signaling effect to the
international investment community,but also because foreign equitycapital flowing to Africa allows African economies to achieve investment rates greater than their domestic (still low) savings rates. At presentmore than 50% of the 54 African countries operate stock exchanges. Although starting from a low base, recentstudies show that the region's stock markets have begun to help finance the growth of African companies butmust develop further to offer broader economic benefits.
This rise of some African countries to EM status gives them a tremendous economic opportunity8. Theoretically,indeed, rapid expansion of stock exchanges in the continent should contribute to economic development invarious ways. These are, among others, facilitating the privatization process, diversifying the financial services,
8 For more, ask for our paper 10 reasons why you should invest in Africa, Africa Emerging Capital Asset Allocation, July
2010. [email protected].

8/6/2019 Back in Fashion_Why Emerging Markets Are Still Attractive_April 2011
http://slidepdf.com/reader/full/back-in-fashionwhy-emerging-markets-are-still-attractiveapril-2011 30/36
Why Emerging Markets are still attractive Page 30
facilitating long term capital mobilization, provision of alternative investment opportunities, attracting foreigncapital inflows and serving as a signal of overall macroeconomic performance. Evidence is already mounting thatfinancial flows are being translated into growth in financial intermediation in these countries. To help ensuresustained growth, Africa’s countries should continue to ensure that macroeconomic policy and capital accountprudential policies are tailored to avoid the traps of volatile short-term flows, and that supervision promotesfinancial sector stability and effective intermediation.
Bottom line, we keep a positive, but moderate, view on EM going forward as the EM super cycle story remainsintact as this is where we will experience the highest top line and earnings growth led by higher GDP growth.However, the combination of a rebounding dollar , massive long positions in commodities, and monetaryconsolidation due to inflationary pressures in the EM may make the risk/reward profile for EM relativeperformance to global equities, especially US stocks, vulnerable. Also, EM inflation worries and a narrower growth gap with DM keep us favor DM vs. EM equities. So, keep an eye on the greenback back supremacy,mainly during volatile periods.
We are market weight mature EM on the asset in a global portfolio, but are strongly positive Frontier Markets.Regionally, we overweigh Asia (the growth area in EM). We suggest being Neutral EMEA (low valuations and
benign interest rates) and Underweight LATAM (lower earnings momentum and aggressive monetary tightening).We also prefer to play countries with attractive valuations and sustainable growth. We prefer the larger markets atthe expense of the smaller markets, with the exception of Indonesia, and Malaysia. We resist the temptation of Taiwan, which have one of the weakest 2011 earnings forecasts in the EM universe. We extend our Frontiers,mainly in Africa.
On the industry basis, we retain a high-beta cyclical bias, but with a preference for domestics over globalcyclicals. We overweigh Consumer Discretionary, Financials, Industrials. Materials and Energy are a Neutral. Thesupports are the following:
Global recovery: stronger US and Chinese growth are positive for GEM. The beneficiaries of stronger US and Chinese growth have been: Mexico, Korea and Taiwan. Within sectors, this has coincided with a
shift into Exporters (Technology and Industrials) and Commodity sectors (Energy, Materials) fromsectors that are dependent upon domestic growth (Consumer, Financials, Health Care, Telecoms andUtilities).
Strong dynamic domestic demand: food & Beverage, Household Personal Care, Banks and Pharmaare top picks. While the consumer related areas of the market have high PEs we believe investors aretreated to a high growth rate and a very high rate of value creation. Banks and Pharma offer truedomestic exposure at discounted valuations.
Globally, our top performers for 2011 remain equities over bonds and investment grade corporate over sovereignbonds. But do include commodities (will the Brent break well over USD100 for long?) on tight supplies and their good diversification value against certain inflation and political risks. On alternatives, we are buying equitylong/short, convertible arbitrage, and secondary buyout private equity (mainly frontier market related ones). Prefer
wheat, soy complex, and copper. We close the long in Brent and open a long in gold. We diversify away fromUSD and EUR for alternatively better EM currencies that offer better strong growth and/or fiscal profile in 2011.Our key theme for 2011 remains to favor cyclicals (Tech, Hotels, Autos, Mining). Rising geopolitical and inflationrisks also favor an OW in Commodity sectors and an MW in EM equities in a global portfolio.

8/6/2019 Back in Fashion_Why Emerging Markets Are Still Attractive_April 2011
http://slidepdf.com/reader/full/back-in-fashionwhy-emerging-markets-are-still-attractiveapril-2011 31/36
Why Emerging Markets are still attractive
Watch our Global ETF Portfolio

8/6/2019 Back in Fashion_Why Emerging Markets Are Still Attractive_April 2011
http://slidepdf.com/reader/full/back-in-fashionwhy-emerging-markets-are-still-attractiveapril-2011 32/36
Why Emerging Markets are still attractive
Data and modelization are done with Macroaxis.

8/6/2019 Back in Fashion_Why Emerging Markets Are Still Attractive_April 2011
http://slidepdf.com/reader/full/back-in-fashionwhy-emerging-markets-are-still-attractiveapril-2011 33/36
Why Emerging Markets are still attractive
Watch our Global Emerging Market ETF Portfolio

8/6/2019 Back in Fashion_Why Emerging Markets Are Still Attractive_April 2011
http://slidepdf.com/reader/full/back-in-fashionwhy-emerging-markets-are-still-attractiveapril-2011 34/36
Why Emerging Markets are still attractive
Data and modelization are done with Macroaxis.

8/6/2019 Back in Fashion_Why Emerging Markets Are Still Attractive_April 2011
http://slidepdf.com/reader/full/back-in-fashionwhy-emerging-markets-are-still-attractiveapril-2011 35/36
Why Emerging Markets are still attractive
Emerging Markets Equity Valuations

8/6/2019 Back in Fashion_Why Emerging Markets Are Still Attractive_April 2011
http://slidepdf.com/reader/full/back-in-fashionwhy-emerging-markets-are-still-attractiveapril-2011 36/36
AAAf f f r r r iiicccaaa EE
AAsssseett AAlllloocca
Specialists in African emer
Africa Emerging Capital Asset
consultancy firm, specialized in
investment managers (private an
on African markets.
We develop investment strategy
driving the global economy in
comprehensive forecasting appro
help clients make sound and confi
Our vision is to become an
opportunities in growing, emergin
We commit to offer client driven
with each client to address spec
each risk profile and investment h
We combine the spirit and visio
institute without compromising th
Africa Emerging Capital (AEC) AssetMbuku Olivier Lumenganeso, April [email protected] Nyon - Switzerland Reference N°: 2011/05872F d l i t ti N° CH 550 108792
mmmeeer r r gggiiinnnggg CCCaaapppiiitttaaalll
ttiioonn,, wwiisshhiinngg ttoo sseeiizzee AAf f r r iiccaann eemmeer r ggiinngg ooppppoor r ttuunniittiieess
ing markets
Allocation wants to be an independent inve
providing top-down and bottom-up asset alloc
/or institutional) around the world on emerging
nd recommendations by identifying key structura
general, and African economies in particular,
aches and indicators, analytic foundations, and
dent investment decisions.
accepted and sought-after investment advisor
g and frontier Africa.
research and service, by establishing strong and i
ific needs by offering investment decision-makin
orizon.
n of an entrepreneurial firm with the analytica
e highest levels of client service.
Allocation 11
1 6
stment research and
ations, and ideas to
markets, with a focus
l and cyclical themes
tilizing rigorous and
arket experience to
company regarding
teractive relationship
g process that match
l rigor of a research