back-propagation artificial neural networks in stock ... · stock market forecasting plays a key...
TRANSCRIPT
88
AESTIMATIO, THE IEB INTERNATIONAL JOURNAL OF FINANCE, 2017. 15: 88-99 2017 AESTIMATIO, THE IEB INTERNATIONAL JOURNAL OF FINANCE
Back-propagation artificial neural
networks in stock market forecasting.
An application to the Warsaw Stock Exchange WIG20Rajihy, Yasen Nermend, Kesra Alsakaa, Akeel
� RECEIVED : 2 NOVEMBER 2016
� ACCEPTED : 10 FEBRUARY 2017
AbstractStock market forecasting plays a key role in investment practice and theory, especially given
the progress made in developing automated trading systems for use in capital markets.
Traditional techniques such as statistical analysis, fundamental analysis and technical
analysis are no longer considered the best options in this field and artificial neural networks
have gained in popularity, especially for use in stock market forecasting. The back-propa-
gation algorithm is one of the most popular neural network training algorithms in financial
time series prediction. One of the biggest problems regarding the use of neural networks
trained with the back-propagation algorithm is the determination of both the number of
hidden layers and the number of neurons included in each hidden layer. In this article, we
present three competing architectures of a feed-forward network, all with only one hidden
layer but differing in the number of neurons included in that layer. The three models will
be trained with the back-propagation algorithm, in order to determine which one provides
the best forecasting performance. Data on the WIG20 (Capitalization-Weighted Stock
Market Index of the 20 largest companies on the Warsaw Stock Exchange) are used to eval-
uate the performance of the competing architectures. The results obtained show that the
architecture consisting of an input layer with N neurons, one hidden layer with 3/2(N+1)
neurons and an output layer with one neuron outperforms the other two models. Keywords: Artificial neural network, Back propagation algorithm, Stock market fore-casting. JEL classification: C45.
Rajihy, Y. Department of Computer Science, University of Babylon, Babylon 09332, Iraq. Email: [email protected].
Nermend, K. Institute of IT in Management, University of Szczecin, Szczecin 71-415, Poland. Email: [email protected].
Alsakaa, A. Department of Computer Science, University of Kerbala, Kerbala, Iraq. Email: [email protected].
RE
SEA
RC
H A
RT
ICLE
A E S T I M AT I O
DOI:10.5605/IEB.15.5
� Please cite this article as:Rajihy, Y., Nermend, K. and Alsakaa, A. (2017). Back-propagation artificial neural networks in stockmarket forecasting. An application to the Warsaw Stock Exchange WIG20, AESTIMATIO, The IEB InternationalJournal of Finance, 15, pp. 88-99. doi: 10.5605/IEB.15.5
8989
AESTIMATIO, THE IEB INTERNATIONAL JOURNAL OF FINANCE, 2017. 15: 88-99© 2017 AESTIMATIO, THE IEB INTERNATIONAL JOURNAL OF FINANCE
Redes neuronales artificiales retropropagación para la predicción en mercados de valores.Una Aplicación al índice de la Bolsa deVarsovia (WIG20)Rajihy, Yasen Nermend, Kesra Alsakaa, Akeel
ResumenLa predicción en los mercados de valores juega un papel crucial en la teoría y práctica de
la inversión, sobre todo tras los progresos que han tenido lugar en el desarrollo de siste-
mas de negociación automatizados en los mercados de capitales. Las técnicas tradicio-
nales, como el análisis estadístico, el análisis fundamental y el análisis técnico, ya no son
consideradas como las mejores opciones en el terreno de la predicción financiera y las
redes neuronales artificiales han ganado popularidad, sobre todo en ámbito de la pre-
dicción bursátil. El algoritmo de retropropagación es uno de los sistemas de entrena-
miento de redes neuronales más populares cuando de predicción financiera se trata. Uno
de los mayores problemas en lo que se refiere al uso de redes neuronales entrenadas con
un algoritmo de retropropagación es la determinación tanto del número de capas ocultas
como del número de neuronas en cada una de dichas capas. En este artículo se presentan
tres arquitecturas de una red neuronal con conexiones hacia adelante (feed-forward) y con
una única capa oculta que difieren en el número de neuronas que contiene dicha capa
oculta. Estas tres redes, entrenadas con un algoritmo de retropropagación, compiten en
cuanto a su capacidad para predecir el comportamiento del Índice de la Bolsa de Varsovia
(WIG20, que incluye las veinte mayores compañías cotizadas en la Bolsa de Varsovia).
Los resultados obtenidos muestran que la arquitectura consistente en una capa de en-
trada con N neuronas, una capa oculta con 3/2(N+1) neuronas y una capa de salidacon una neurona es la que proporciona las mejores predicciones.
Palabras clave: Redes neuronales artificiales, algoritmo de retropropagación, predicción bursátil.
A E S T I M AT I OT I E B
90 A E S T I M AT I O
Bac
k-pro
pag
atio
n a
rtifi
cial
neu
ral net
wo
rks
in s
tock
mar
ket
fore
cast
ing.
An a
pplic
atio
n t
o t
he
War
saw
Sto
ck E
xch
ange
WIG
20. R
ajihy
, Y., N
erm
end,
K. a
nd A
lsaka
a, A.
AEST
IMA
TIO
, TH
EIE
BIN
TER
NA
TIO
NA
LJO
UR
NA
LO
FFI
NA
NC
E, 2
017. 1
5: 88-9
9
� 1. Introduction
Stock market forecasting plays a key role in investment theory and practice, especially
given the progress made in developing automated trading systems for use in capital
markets. A capital market is a complex system that changes over time and that is in-
fluenced by many factors. Fluctuations in the capital market often indicate non-linear
relationships between the response variable and the covariates that supposedly ex-
plain the changes in such a response. One of the key decision-making problems in
the investment process is stock market forecasting, and so this presents one of the
biggest challenges to the scientific community. Stock market prediction is a difficult
task, primarily because of the uncertainties involved in the movement of the stock
market (Choudhry and Garg, 2008), and so it requires continuous improvement of
forecasting models.
Various conventional techniques such as statistical analysis, fundamental analysis and
technical analysis have all been used for forecasting purposes in stock markets, but they
are difficult to implement and none of them have provided the expected results.
An artificial neural network (ANN) is a large-scale, nonlinear dynamic system (Han,
2002), which is capable of performing highly nonlinear operations, self-learning, and
self-organizing (Liu and Wang, 2011). ANN is regarded as more suitable for stock mar-
ket forecasting than other techniques, since it is able to detect and learn patterns or re-
lationships from the data itself (Lam, 2004; Lee and Chiu, 2002; Lee and Chen, 2002;
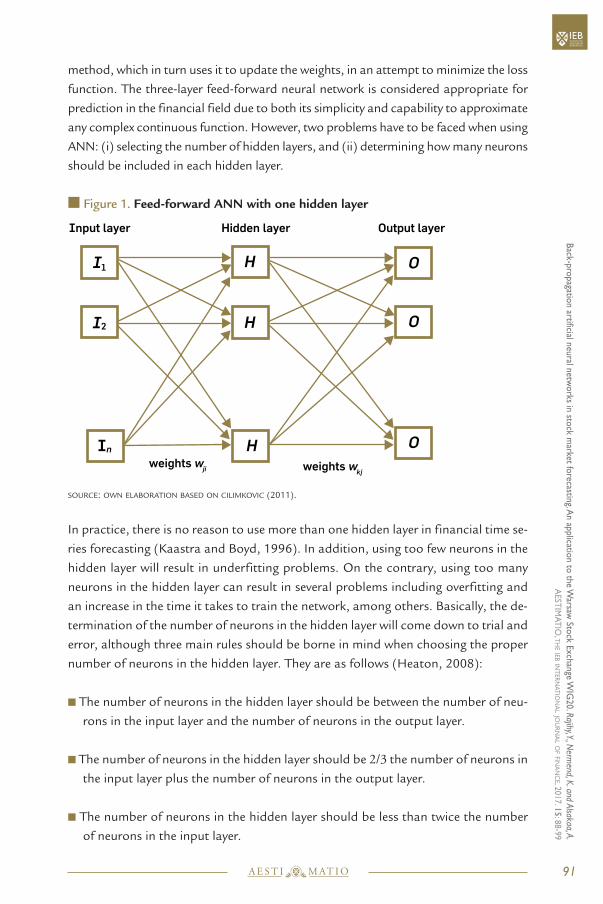
Sun et al., 2008; Leigh et al., 2002). In practice, feed-forward neural networks are usually
used in forecasting (see Figure 1). In feed-forward ANNs, the information moves in only
one direction — forward — from the input nodes, through the hidden nodes (if any)
and to the output nodes. There are no cycles or loops in the network. The most popular
neural network training algorithm for financial forecasting is the backward propagation
of errors or back-propagation (BP) algorithm, which demonstrates powerful problem-
solving ability (Werbos, 1988; Rumelhart, 1995). As is well known, back-propagation
is used in conjunction with an optimization method (usually the gradient descent
method). The algorithm repeats a two-phase cycle: propagation and updating the
weights of the neurons connections. When an input vector containing observed infor-
mation is presented to the network, it is propagated forward through the network, layer
by layer, until it reaches the output layer. The output of the network is then compared
to the desired output (also observed), using a loss function, and the error value is cal-
culated for each of the neurons in the output layer. These error values are then propa-
gated backwards, starting from the output, until each neuron has an associated error
value which roughly represents its contribution to the original output. Back-propagation
uses these error values to calculate the gradient of the loss function with respect to the
weights in the network. In the second phase, this gradient is fed to the optimization
91A E S T I M AT I O
Back-p
ropagatio
n artificial n
eural n
etwo
rks in sto
ck market fo
recasting. A
n ap
plicatio
n to
the W
arsaw Sto
ck Exch
ange W
IG20. Rajihy, Y., N
ermend, K. and Alsakaa, A.
AEST
IMA
TIO
, TH
EIE
BIN
TER
NA
TIO
NA
LJO
UR
NA
LO
FFIN
AN
CE, 2
017. 15
: 88-9
9
method, which in turn uses it to update the weights, in an attempt to minimize the loss
function. The three-layer feed-forward neural network is considered appropriate for
prediction in the financial field due to both its simplicity and capability to approximate
any complex continuous function. However, two problems have to be faced when using
ANN: (i) selecting the number of hidden layers, and (ii) determining how many neurons
should be included in each hidden layer.
� Figure 1. Feed-forward ANN with one hidden layer
SOURCE: OWN ELABORATION BASED ON CILIMKOVIC (2011).
In practice, there is no reason to use more than one hidden layer in financial time se-
ries forecasting (Kaastra and Boyd, 1996). In addition, using too few neurons in the
hidden layer will result in underfitting problems. On the contrary, using too many
neurons in the hidden layer can result in several problems including overfitting and
an increase in the time it takes to train the network, among others. Basically, the de-
termination of the number of neurons in the hidden layer will come down to trial and
error, although three main rules should be borne in mind when choosing the proper
number of neurons in the hidden layer. They are as follows (Heaton, 2008):
� The number of neurons in the hidden layer should be between the number of neu-
rons in the input layer and the number of neurons in the output layer.
� The number of neurons in the hidden layer should be 2/3 the number of neurons in
the input layer plus the number of neurons in the output layer.
� The number of neurons in the hidden layer should be less than twice the number
of neurons in the input layer.
I2
I1 H
In H
O
O
O
H
Input layer Hidden layer Output layer
weights wkjweights wji
There have been many studies on stock market forecasting using ANN over the past
three decades (White, 1989; Kimoto et al., 1990; Trippi and DeSieno, 1992; Duke,
1993; Nikolopoulos and Fellrath, 1994; Azoff, 1994; Hiemstra, 1995; Hall, 1994;
Kohara et al., 1997; Aiken and Bsat, 1999; Garliauskas, 1999; Romahi and Shen,
2000; Chan et al., 2000; Hwarng, 2001; Thawornwong, 2005; Badaway et al., 2006;
Atsalakis et al., 2009; Boyacioglu and Avci, 2010; Guresen et al., 2011; Asadi, 2012;
Adebiyi et al., 2012; Ticknor, 2013; Mantri et al., 2014).
This article compares the forecasting performance of three competing architectures of
a feedforward ANN with only one hidden layer, which meet the criteria set out by Heaton
(2008). A BP mechanism was implemented for training the corresponding ANN. In
order to evaluate their forecasting performance, data on WIG20 were used as an illus-
trative example. The empirical results show that an architecture consisting of an input
layer with N neurons, one hidden layer with 2/3(N+1) neurons and an output layer with
one neuron provide more accurate predictions than the other two competing models.
The article is organized as follows. After this introductory section, section 2 is devoted
to methodological questions, section 3 contains the prediction results provided by
the competing ANNs for the WIG20 returns, and section 4 concludes.
� 2. Research methodology
BP is one of the most popular ANN training algorithms for financial time series fore-
casting. A back-propagation artificial neural network (BP-ANN) is characterized by
the back-propagation of errors (Kao et al., 2012; Lee, 2009; Lu, 2010). BP uses the
gradient descent method for minimizing the error function in the weights space. The
error function has to be continuous and differentiable because this training method
requires the computation of the gradient of the error function in each iteration (Ben-
venuto and Piazza, 1992). The combination of weights which minimizes the error
function is considered a solution of the learning problem.
The training of a BP-ANN is as follows (Liu and Wang, 2011):
Let Inp(n) and Out(n) denote the input and output corresponding to the node nrespectively, where:
Inpn = m wmm Outm (1)
Outn = f (Inpn+ n) , (2)
with wmm being the weight of the connection from the mth node in the previous layer
to the node n, and
92 A E S T I M AT I O
Bac
k-pro
pag
atio
n a
rtifi
cial
neu
ral net
wo
rks
in s
tock
mar
ket
fore
cast
ing.
An a
pplic
atio
n t
o t
he
War
saw
Sto
ck E
xch
ange
WIG
20. R
ajihy
, Y., N
erm
end,
K. a
nd A
lsaka
a, A.
AEST
IMA
TIO
, TH
EIE
BIN
TER
NA
TIO
NA
LJO
UR
NA
LO
FFI
NA
NC
E, 2
017. 1
5: 88-9
9
f (net) = (2/1 –e–2net) –1 (3)
being the activation function of the nodes (‘net’ represents the neuron’s net input),
which introduces non-linearity into the output of the neuron (one of the most popular
activation functions in BP-ANNs is the sigmoid function), while n is the bias input
to the node, that is, a connection weight from a special unit with a constant, nonzero
activation value.
The error E in the output is calculated as follows:
E = 12N N o (PNo –OutNo)
2 , (4)
where N and o denote the number of elements in the training set and the number of
neurons in the output layer, respectively, while PNo and OutNo represent the target
and the output values, respectively. The training ends when the error E falls below
the threshold or tolerance level. The error eo in the output layer and the error en in the
hidden layer are calculated as follows:
eo = (Po –Outo) f ’ (Outo) (5)
en = m eo wmm f ’ (Outn) , (6)
where Po , Outo, Outn and represent the expected output of the oth output node,
the actual output in the output layer, the actual output value in the hidden layer and
the adjustable variable in the activation function, respectively. Note that f ’ denotes
the derivative of f . The weights and biases in both the output and hidden layers are
updated through error back-propagation. The weights wnm and (n) biases are ad-
justed according to the following equations:
wnm(k+1)= wnm(k )+ eoOutm (7)
m(k+1)= m(k )+ em (8)
where k and denote the epoch number and the learning rate, respectively.
� 3. Empirical research
In the field of stock market forecasting, historical data from the last trading day, includ-
ing data on daily opening price, daily highest price, daily lowest price, daily closing price
and daily turnover, are commonly used to predict the closing stock price of the next
93A E S T I M AT I O
Back-p
ropagatio
n artificial n
eural n
etwo
rks in sto
ck market fo
recasting. A
n ap
plicatio
n to
the W
arsaw Sto
ck Exch
ange W
IG20. Rajihy, Y., N
ermend, K. and Alsakaa, A.
AEST
IMA
TIO
, TH
EIE
BIN
TER
NA
TIO
NA
LJO
UR
NA
LO
FFIN
AN
CE, 2
017. 15
: 88-9
9
trading day (see Balachandler et al., 2002; Leigh et al, 2005; Atsalakis and Valavanis,
2009; Kao et al., 2012). These historical indicators can be used as the input of an ANN
trained with a BP algorithm, the output being the t+1-closing price of the stock market.
In this article, three-layer feedforward ANNs trained with a BP algorithm and differing
in the number of neurons in the hidden layer have been implemented in order to anal-
yse their out-of-sample forecasting performance. In line with the criteria set out by
Heaton (2008), the three architecture models considered, which differ according to
the number of neurons in the hidden layer, are the following:
Model I: N neurons in the input layer, (N–1)/2 neurons in the hidden layer and one
neuron in the output layer.
Model II: N neurons in the input layer, 2/3(N+1) neurons in the hidden layer
and one neuron in the output layer.
Model III: N neurons in the input layer, 2N–1 neurons in the hidden layer and
one neuron in the output layer.
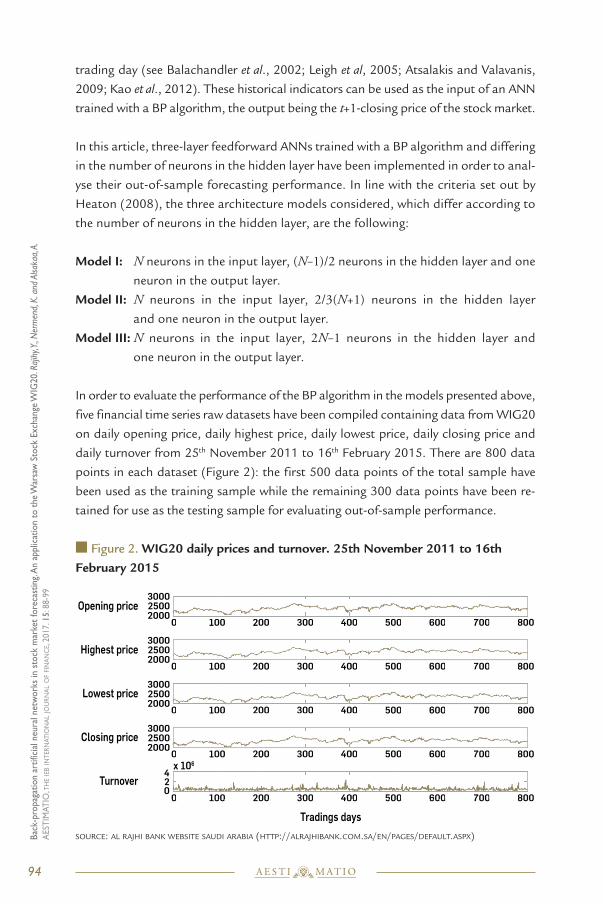
In order to evaluate the performance of the BP algorithm in the models presented above,
five financial time series raw datasets have been compiled containing data from WIG20
on daily opening price, daily highest price, daily lowest price, daily closing price and
daily turnover from 25th November 2011 to 16th February 2015. There are 800 data
points in each dataset (Figure 2): the first 500 data points of the total sample have
been used as the training sample while the remaining 300 data points have been re-
tained for use as the testing sample for evaluating out-of-sample performance.
� Figure 2. WIG20 daily prices and turnover. 25th November 2011 to 16thFebruary 2015
SOURCE: AL RAJHI BANK WEBSITE SAUDI ARABIA (HTTP://ALRAJHIBANK.COM.SA/EN/PAGES/DEFAULT.ASPX)
94 A E S T I M AT I O
Bac
k-pro
pag
atio
n a
rtifi
cial
neu
ral net
wo
rks
in s
tock
mar
ket
fore
cast
ing.
An a
pplic
atio
n t
o t
he
War
saw
Sto
ck E
xch
ange
WIG
20. R
ajihy
, Y., N
erm
end,
K. a
nd A
lsaka
a, A.
AEST
IMA
TIO
, TH
EIE
BIN
TER
NA
TIO
NA
LJO
UR
NA
LO
FFI
NA
NC
E, 2
017. 1
5: 88-9
9
Opening price
Turnover
Closing price
Lowest price
Highest price300025002000
300025002000
300025002000
300025002000
7006005004003002001000 800
7006005004003002001000 800
7006005004003002001000 800
7006005004003002001000 800
7006005004003002001000 800
Tradings days
420
x 106
00300200000
00300200000
0030000000
700600500 800
700600500 800
700600500 800
700600500 8000030000000
00000
06
000
700700700600660050000500400400300330020020010010000 800800
7007007006006600500500400400300330020020010010000 800800
70070060600600500500400400400300300200200100100100000 800800
70070060060050050040040030030020020010010000 800800
7007006060060050050040000400300300200200100100100000 800800
x 10x 1066
The forecasting performance of the three competing models proposed has been eval-
uated using the following statistical criteria: Mean Square Error (MSE), Prediction
Error (PE), Normalized Mean Square Error (NMSE), Mean Absolute Error (MAE) and
Mean Absolute Percentage Error (MAPE) as well as the Epoch Number (Epochs).
MSE, PE, NMSE, MAE and MAPE are measures of the deviation between the actual
and predicted values. Epochs represents the number of iterations required to reach
the desired error. The smaller the values of MSE, NMSE, MAE, MAPE, PE and Epoch,
the better the out-of-sample performance of the corresponding model.
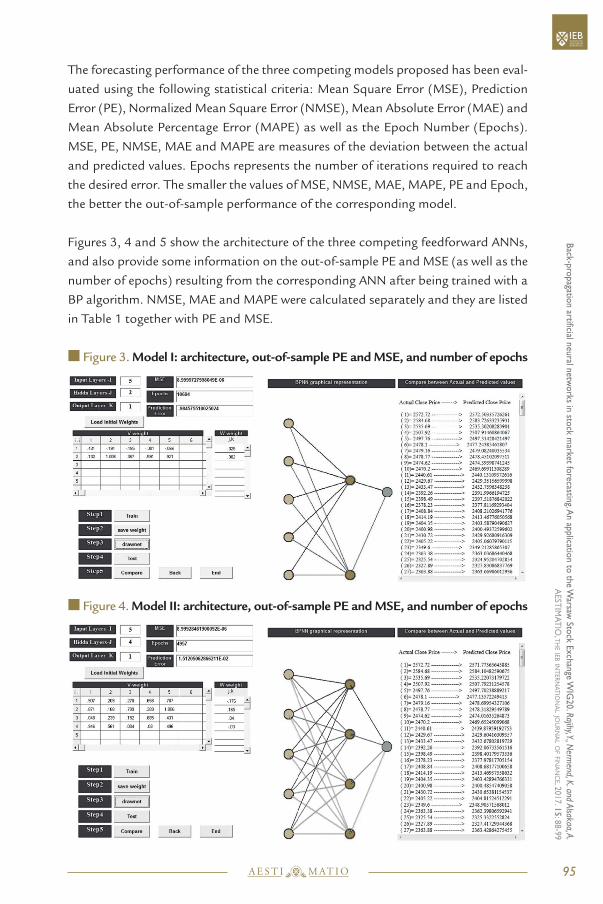
Figures 3, 4 and 5 show the architecture of the three competing feedforward ANNs,
and also provide some information on the out-of-sample PE and MSE (as well as the
number of epochs) resulting from the corresponding ANN after being trained with a
BP algorithm. NMSE, MAE and MAPE were calculated separately and they are listed
in Table 1 together with PE and MSE.
� Figure 3. Model I: architecture, out-of-sample PE and MSE, and number of epochs
� Figure 4. Model II: architecture, out-of-sample PE and MSE, and number of epochs
95A E S T I M AT I O
Back-p
ropagatio
n artificial n
eural n
etwo
rks in sto
ck market fo
recasting. A
n ap
plicatio
n to
the W
arsaw Sto
ck Exch
ange W
IG20. Rajihy, Y., N
ermend, K. and Alsakaa, A.
AEST
IMA
TIO
, TH
EIE
BIN
TER
NA
TIO
NA
LJO
UR
NA
LO
FFIN
AN
CE, 2
017. 15
: 88-9
9
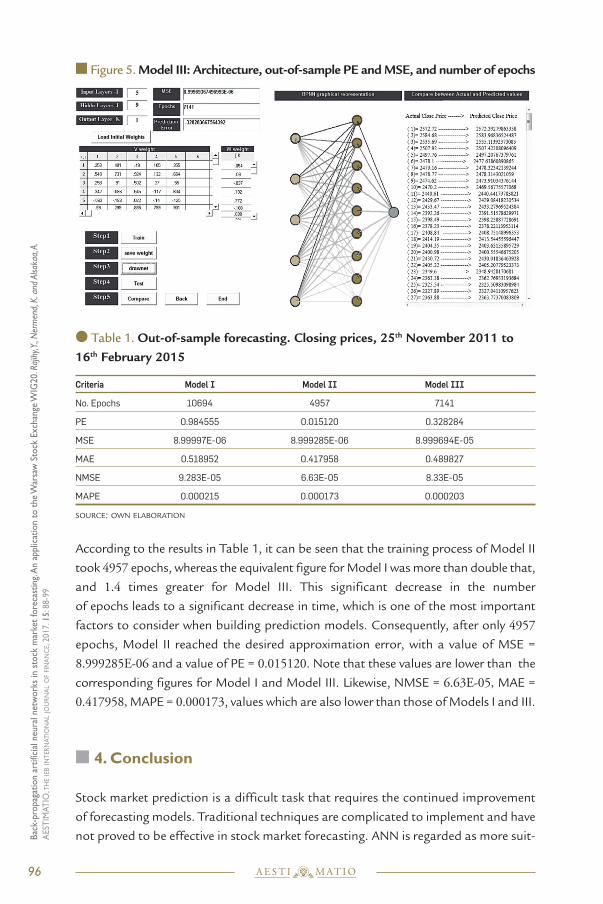
� Figure 5. Model III: Architecture, out-of-sample PE and MSE, and number of epochs
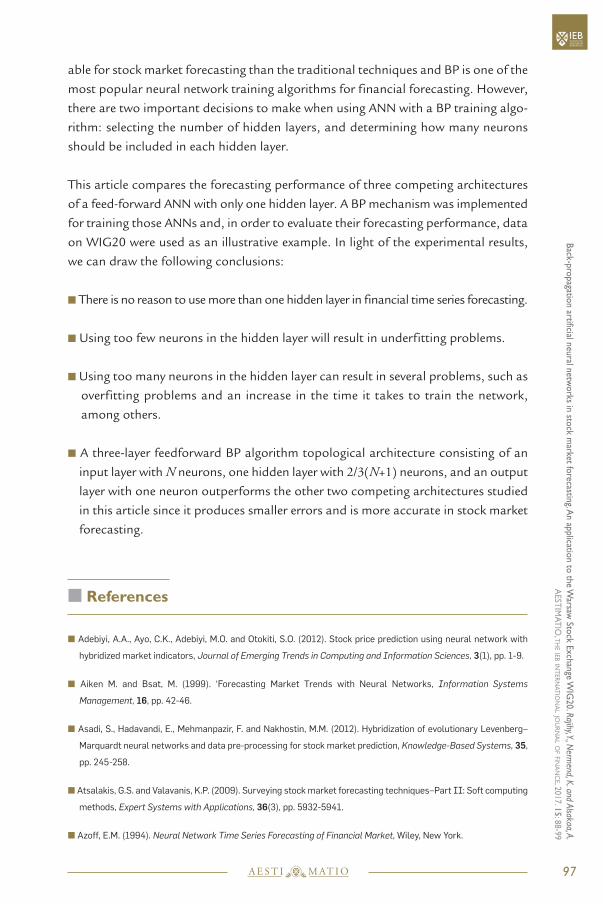
� Table 1. Out-of-sample forecasting. Closing prices, 25th November 2011 to16th February 2015
Criteria Model I Model II Model III
No. Epochs 10694 4957 7141
PE 0.984555 0.015120 0.328284
MSE 8.99997E-06 8.999285E-06 8.999694E-05
MAE 0.518952 0.417958 0.489827
NMSE 9.283E-05 6.63E-05 8.33E-05
MAPE 0.000215 0.000173 0.000203
SOURCE: OWN ELABORATION
According to the results in Table 1, it can be seen that the training process of Model II
took 4957 epochs, whereas the equivalent figure for Model I was more than double that,
and 1.4 times greater for Model III. This significant decrease in the number
of epochs leads to a significant decrease in time, which is one of the most important
factors to consider when building prediction models. Consequently, after only 4957epochs, Model II reached the desired approximation error, with a value of MSE =
8.999285E-06 and a value of PE = 0.015120. Note that these values are lower than the
corresponding figures for Model I and Model III. Likewise, NMSE = 6.63E-05, MAE =
0.417958, MAPE = 0.000173, values which are also lower than those of Models I and III.
� 4. Conclusion
Stock market prediction is a difficult task that requires the continued improvement
of forecasting models. Traditional techniques are complicated to implement and have
not proved to be effective in stock market forecasting. ANN is regarded as more suit-
96 A E S T I M AT I O
Bac
k-pro
pag
atio
n a
rtifi
cial
neu
ral net
wo
rks
in s
tock
mar
ket
fore
cast
ing.
An a
pplic
atio
n t
o t
he
War
saw
Sto
ck E
xch
ange
WIG
20. R
ajihy
, Y., N
erm
end,
K. a
nd A
lsaka
a, A.
AEST
IMA
TIO
, TH
EIE
BIN
TER
NA
TIO
NA
LJO
UR
NA
LO
FFI
NA
NC
E, 2
017. 1
5: 88-9
9
able for stock market forecasting than the traditional techniques and BP is one of the
most popular neural network training algorithms for financial forecasting. However,
there are two important decisions to make when using ANN with a BP training algo-
rithm: selecting the number of hidden layers, and determining how many neurons
should be included in each hidden layer.
This article compares the forecasting performance of three competing architectures
of a feed-forward ANN with only one hidden layer. A BP mechanism was implemented
for training those ANNs and, in order to evaluate their forecasting performance, data
on WIG20 were used as an illustrative example. In light of the experimental results,
we can draw the following conclusions:
� There is no reason to use more than one hidden layer in financial time series forecasting.
� Using too few neurons in the hidden layer will result in underfitting problems.
� Using too many neurons in the hidden layer can result in several problems, such as
overfitting problems and an increase in the time it takes to train the network,
among others.
� A three-layer feedforward BP algorithm topological architecture consisting of an
input layer with N neurons, one hidden layer with 2/3(N+1) neurons, and an output
layer with one neuron outperforms the other two competing architectures studied
in this article since it produces smaller errors and is more accurate in stock market
forecasting.
� References
� Adebiyi, A.A., Ayo, C.K., Adebiyi, M.O. and Otokiti, S.O. (2012). Stock price prediction using neural network with
hybridized market indicators, Journal of Emerging Trends in Computing and Information Sciences, 3(1), pp. 1-9.
� Aiken M. and Bsat, M. (1999). ‘Forecasting Market Trends with Neural Networks, Information Systems
Management, 16, pp. 42-46.
� Asadi, S., Hadavandi, E., Mehmanpazir, F. and Nakhostin, M.M. (2012). Hybridization of evolutionary Levenberg–
Marquardt neural networks and data pre-processing for stock market prediction, Knowledge-Based Systems, 35,
pp. 245-258.
� Atsalakis, G.S. and Valavanis, K.P. (2009). Surveying stock market forecasting techniques–Part II: Soft computing
methods, Expert Systems with Applications, 36(3), pp. 5932-5941.
� Azoff, E.M. (1994). Neural Network Time Series Forecasting of Financial Market, Wiley, New York.
97A E S T I M AT I O
Back-p
ropagatio
n artificial n
eural n
etwo
rks in sto
ck market fo
recasting. A
n ap
plicatio
n to
the W
arsaw Sto
ck Exch
ange W
IG20. Rajihy, Y., N
ermend, K. and Alsakaa, A.
AEST
IMA
TIO
, TH
EIE
BIN
TER
NA
TIO
NA
LJO
UR
NA
LO
FFIN
AN
CE, 2
017. 15
: 88-9
9
� Badaway, F.A., Abdelazim, H.Y. and Darwish, M.G. (2006). Genetic Algorithms for Predicting the Egyptian Stock
Market, Proceedings of the2005 International Conference on Information and Communication Technology,
pp. 109-122.
� Balachandher, K.G., Lai, C.H., Fauzias, M.N. and Nor, F.M. (2002). An examination of the random walk model and
technical trading rules in the Malaysian stock market, Quarterly Journal of Business and Economics, pp. 81-104.
� Benvenuto, N. and Piazza, F. (1992). On the complex backpropagation algorithm. IEEE Transactions on Signal
Processing, 40(4), pp. 967-969.
� Boyacioglu, M.A. and Avci, D. (2010). An adaptive network-based fuzzy inference system (ANFIS) for the prediction
of stock market return: the case of the Istanbul stock exchange, Expert Systems with Applications, 37(12),
pp. 7908-7912.
� Cao, L. (2003). Support vector machines experts for time series forecasting, Neurocomputing, 51, pp. 321-339.
� Cilimkovic, M. (2011). Neural Networks and Back Propagation Algorithm, Institute of Technology Blanchardstown,
Blanchardstown Road North Dublin, pp. 1-12.
� Chan, M.C., Wong, C.C. and Lam, C.C. (2000). Financial time series forecasting by neural network using conjugate
gradient learning algorithm and multiple linear regression weight initialization, Computing in Economics and
Finance, 61, pp. 326-342.
� Choudhry, R. and Garg, R. (2008). A hybrid machine learning system for stock market forecasting, International
Journal of Computer, Electrical, Automation, Control and Information Engineering, 2(3), pp. 315-318.
� Duke, J.A. (1993). Neural network futures trading—a feasibility study. In Adaptive Intelligent Systems, Society for
Worldwide Interbank Financial Telecommunications (ed.), Elsevier Science Publishers, Amsterdam, pp. 121-132.
� Kaastra, I. and Boyd, M. (1996). Designing a Neural Network for Forecasting Financial and Economic Time Series,
Neurocomputing, 10, pp. 215-236.
� Kohara, K., Ishikawa, T., Fukuhara, Y. and Nakamura, Y. (1997). Stock price prediction using prior knowledge and
neural networks, International Journal of Intelligent Systems in Accounting Finance and Management, 6(1),
Special Issue on Neural Networks, pp. 11-22.
� Garliauskas, A. (1999). Neural network chaos and computational algorithms of forecast in finance, Proceedings of
the IEEE International Conference on Systems, Man and Cybernetics1999, Vol. 2, pp. 638-643.
� Guresen, E., Kayakutlu, G. and Daim, T.U. (2011). Using artificial neural network models in stock market index
prediction, Expert Systems with Applications, 38(8), pp. 10389-10397.
� Hall, J.W. (1994). Adaptive selection of U.S. stocks with neural nets, in G.J. Deboeck (Ed.), Trading on the Edge:
Neural, Genetic and Fuzzy Systems for Chaotic Financial Markets, Willey, New York, pp. 45-65.
� Han, Q. (2002). Theory, Design and Application of Artificial Neural Network. Chemical Industry Press, New Jersey.
� Heaton, J. (2008). Introduction to neural networks with Java. 2nd Edition. Heaton Research Inc.
� Hiemstra, Y. (1995). Modeling structured nonlinear knowledge to predict stock market returns, in R.R. Trippi (Ed.),
Chaos & nonlinear dynamics in the financial markets. Theory, evidence and applications, Irwing, Chicago, IL, pp.
163-175.
� Hwarng, H.B. (2001). Insights into Neural Networks Forecasting of Time Series corresponding to ARMA (p,q)
Structures, International Journal of Management Science, Omega, 29, pp. 273-289.
� Kao L.-J., Chiu, C.-C., Lu, C.-J. and Yang, J.-L.(2013). Integration of nonlinear independent component analysis
and support vector regression for stock price forecasting, Neurocomputing, 99, pp. 534-542.
98 A E S T I M AT I O
Bac
k-pro
pag
atio
n a
rtifi
cial
neu
ral net
wo
rks
in s
tock
mar
ket
fore
cast
ing.
An a
pplic
atio
n t
o t
he
War
saw
Sto
ck E
xch
ange
WIG
20. R
ajihy
, Y., N
erm
end,
K. a
nd A
lsaka
a, A.
AEST
IMA
TIO
, TH
EIE
BIN
TER
NA
TIO
NA
LJO
UR
NA
LO
FFI
NA
NC
E, 2
017. 1
5: 88-9
9
� Kimoto, T. Asakawa, K., Yoda, M. and Takeoka, M. (1990). Stock market prediction system with modular neural
networks. Neural Networks 1990 IJCNN International Joint Conference, IEEE, pp. 1-6.
� Lam, M. (2004). Neural network techniques for financial performance prediction: integrating fundamental and
technical analysis, Decision Support Systems, 37, pp. 567-581.
� Lee T.S. and Chiu, C.C. (2002). Neural network forecasting of an opening cash price index, International Journal
of Systems Science, 33, pp. 229-237.
� Lee T.S. and Chen, N.J. (2002). Investigating the information content of non-cash-trading index futures using neural
networks, Expert Systems with Applications, 22, pp. 225-234.
� Lee, C.J. (2009). Financial time series forecasting using independent component analysis and support vector
regression, Decision Support Systems, 47(2), pp. 115-125.
� Leigh W., Purbis, R. and Ragusa, J.M. (2002). Forecasting the NYSE composite index with technical analysis, pattern
recognizer, neural network, and genetic algorithm, a case study in romantic decision support, Decision Support
Systems, 32, pp. 361-377.
� Leigh, W., Hightower, R. and Modani, N. (2005). Forecasting the New York stock exchange composite index with
past price and interest rate on condition of volume spike, Expert Systems with Applications, 28(1), pp. 1-8.
� Liu, H. and Wang, J. (2011). Integrating Independent Component Analysis and Principal Component Analysis with
Neural Network to Predict Chinese Stock Market, Mathematical Problems in Engineering, Vol. 2011, pp. 1-15.
� Lu, C.J. (2010). Integrating independent component analysis-based denoising scheme with neural network for
stock price prediction, Expert Systems with Applications, 37(10), pp. 7056-7064.
� Mantri, J.K., Gahan, P. and Nayak, B.B. (2014). Artificial neural networks—an application to stock market volatility.
In J.K. Mantri (Ed.), Soft-Computing in Capital Market, Brown Walker Press, Boca Ratón, pp. 179-193.
� Nikolopoulos, C. and Fellrath, P.F. (1994). A hybrid expert system for investment advising, Expert Systems, 11(4),
pp. 245-250.
� Romahi, Y. and Shen, Q. (2000). Dynamic Financial Forecasting with Automatically Induced Fuzzy Associations,
IEEE, pp. 493-498.
� Rumelhart, Y.C. (1995). Backpropagation: Theory, architectures, and applications, Lawrence Erlbaum Associates,
New Jersey.
� Sun, Z.L., Choi, T.M., Au, K.F. and Yu, Y. (2008). Sales forecasting using extreme learning machine with applications
in fashion retailing, Decision Support Systems, 46(1), pp. 411-419.
� Thawornwong, D.E. (2005). The use of data mining and neural networks for forecasting stock market returns,
Expert Systems with Applications, 29(4), pp. 927-940.
� Ticknor, J.L. (2013). A Bayesian regularized artificial neural network for stock market forecasting, Expert Systems
with Applications, 40(14), pp. 5501-5506.
� Trippi, R.R. and DeSieno, D. (1992). Trading equity index futures with a neural network, The Journal of Portfolio
Management, 19(1), pp. 27-33.
� Werbos, J.P. (1988). Generalization of back propagation with application to a recurrent gas market model, Neural
Networks, 1, pp. 339-356.
� White, H. (1989). Learning in artificial neural networks: a statistical perspective, Neural Computation, 1, pp. 425-464.
�
99A E S T I M AT I O
Back-p
ropagatio
n artificial n
eural n
etwo
rks in sto
ck market fo
recasting. A
n ap
plicatio
n to
the W
arsaw Sto
ck Exch
ange W
IG20. Rajihy, Y., N
ermend, K. and Alsakaa, A.
AEST
IMA
TIO
, TH
EIE
BIN
TER
NA
TIO
NA
LJO
UR
NA
LO
FFIN
AN
CE, 2
017. 15
: 88-9
9