background document ap-42, section 1.1, bituminous and ... · pdf file2-3 overfeed chain-grate...
TRANSCRIPT

EMISSION FACTOR
DOCUMENTATION FOR
AP-42 SECTION 1.1
BITUMINOUS AND SUBBITUMINOUS COAL COMBUSTION
By:
Acurex Environmental CorporationResearch Triangle Park, North Carolina 27709
Edward Aul & Associates, Inc.Chapel Hill, North Carolina 27514
E. H. Pechan and Associates, Inc.Rancho Cordova, California 95742
Contract No. 68-DO-00120Work Assignment No. II-68
EPA Project Officer: Alice C. Gagnon
Office of Air Quality Planning and StandardsOffice Of Air And Radiation
U.S. Environmental Protection AgencyResearch Triangle Park, NC 27711
April 1993

ii
DISCLAIMER
This report has been reviewed by the Office of Air Quality Planning and Standards, U. S. Environmental Protection Agency, and approved for publication. Mention oftrade names or commercial products does not constitute endorsement orrecommendation for use.

iii
TABLE OF CONTENTS
Page
LIST OF TABLES............................................................................................. vLIST OF FIGURES............................................................................................ vi
CHAPTER 1. INTRODUCTION........................................................................ 1-1
CHAPTER 2. SOURCE DESCRIPTION.......................................................... 2-1
2.1 CHARACTERIZATION OF BITUMINOUS AND SUBBITUMINOUS APPLICATIONS....................................2-1
2.2 PROCESS DESCRIPTIONS..................... .........................2-22.2.1 Suspension Firing............................ .........................2-32.2.2 Stoker Firing..............................................................2-42.2.3 Fluidized Bed Combustion.........................................2-52.2.4 Handfeed Units..........................................................2-6
2.3 EMISSIONS.........................................................................2-72.3.1 Particulate Matter Emissions.....................................2-82.3.2 Sulfur Oxide Emissions.............................................2-92.3.3 Nitrogen Oxide Emissions.........................................2-92.3.4 Carbon Monoxide Emissions.................................... 2-112.3.5 Organic Compound Emissions..................................2-122.3.6 Trace Element Emissions..........................................2-142.3.7 Fugitive Emissions.....................................................2-15
2.4 CONTROL TECHNOLOGIES.................................................2-162.4.1 Fuel Treatment/Substitution......................................2-162.4.2 Combustion Modification...........................................2-182.4.3 Post-Combustion Control..........................................2-22
REFERENCES............................................................................ 2-47
CHAPTER 3. GENERAL EMISSION DATA REVIEW AND ANALYSIS PROCEDURE........................................................... 3-1
3.1 CRITERIA POLLUTANTS.......................................................3-13.1.1 Literature Search.......................................................3-13.1.2 Literature Evaluation..................................................3-13.1.3 Emission Factor Quality Rating
3.2 SPECIATED VOCs..................................................................3-53.2.1 Literature Search.......................................................3-53.2.2 Literature Evaluation3.2.3 Data and Emission Factor Quality Rating..................3-5
3.3 AIR TOXICS............................................................................3-63.3.1 Literature Search.......................................................3-63.3.2 Literature Evaluation for Air Toxics............................3-7

iv
TABLE OF CONTENTS (continued)
Page
3.3.3 Data and Emission Factor Quality Rating Criteria.....3-73.4 N2O..........................................................................................3-8
3.4.1 Literature Search.......................................................3-83.4.2 Literature Evaluation..................................................3-83.4.3 Data and Emission Factor Quality Rating..................3-9
3.5 FUGITIVES.............................................................................3-93.6 PARTICLE SIZE DISTRIBUTION...........................................3-10
3.6.1 Literature Search.......................................................3-103.6.2 Literature Evaluation..................................................3-113.6.3 Data Quality Ranking.................................................3-12
REFERENCES.................................................................................3-18
CHAPTER 4. EMISSION FACTOR DEVELOPMENT...................................... 4-1
4.1 CRITERIA POLLUTANTS.......................................................4-14.1.1 Review of Previous AP-42 Data................................4-14.1.2 Review of New Baseline Data...................................4-24.1.3 Compilation of Baseline Emission Factors................4-54.1.4 Compilation of Controlled Emission Factors.............4-13
4.2 SPECIATED VOCs.................................................................4-134.3 AIR TOXICS............................................................................4-14
4.3.1 Review of New Data..................................................4-144.3.2 Baseline Emission Factors........................................4-174.3.3 Controlled Emission Factors......................................4-19
4.4 N2O..........................................................................................4-204.5 PARTICLE SIZEDISTRIBUTION..............................................................................4-22
4.5.1 Review of Previous AP-42 Data................................4-224.5.2 Review of New Data..................................................4-234.6.3 Compilation of Uncontrolled Emission Factors......... 4-254.6.4 Control Technology Emission Factors...................... 4-26
REFERENCES............................................................................. 4-57
CHAPTER 5. AP-42 SECTION 1.1: BITUMINOUS AND SUBBITUMINOUS COAL COMBUSTION.................................................................... 5-1
APPENDIX A. BACKGROUND FILE SPOT CHECK SUMMARY..................... A-1
APPENDIX B. CONVERSION FACTORS..........................................................B-1
APPENDIX C. MARKED-UP 1988 AP-42 SECTION 1.1................................. C-1

v
LIST OF TABLES
Table Page
2-1 U.S. Coal Consumption by Sector, 1990..................................................2-302-2 Boiler Usage by Sector.............................................................................2-312-3 Total 1985 U.S. Emissions from Coal Combustion by Use Sector...........2-322-4 NSPS Summary for Fossil Fuel-fired Boilers............................................2-332-5 Commercially Available NOx Control Techniques for
Pulverized Coal-fired Boilers.................................................................. 2-342-6 Commercially Available NOx Control Techniques for
Stoker Coal-fired Boilers......................................................................... 2-362-7 Post Combustion SO2 Controls for Combustion Sources.........................2-373-1 Speciated VOC Literature Search Results................................................3-143-2 Literature Search Checklist.......................................................................3-153-3 Evaluation of Air Toxics References.........................................................3-163-4 N2O Literature Search Checklist...............................................................3-174-1 Background Document Check..................................................................4-294-2 New SO2 Baseline Data For Bituminous Coal...........................................4-304-3 New NOx Baseline Data For Bituminous Coal...........................................4-324-4 New CO Baseline Data..............................................................................4-354-5 New PM Baseline Data For Bituminous Coal............................................4-384-6 New CH4 Baseline Data For Bituminous Coal...........................................4-394-7 Controlled Particulate Emissions...............................................................4-404-8 Controlled SOx Emissions.........................................................................4-424-9 Controlled NOx Emissions.........................................................................4-434-10 Metal Enrichment Behaviors.....................................................................4-454-11 Enrichment Ratios for Classes of Elements..............................................4-454-12 Enrichment Ratios for Boilers and ESP.....................................................4-464-13 HAP Emission Factors (English Units) for Uncontrolled
Bituminous Coal-fired Boilers.................................................................. 4-474-14 HAP Emission Factors (Metric Units) for Uncontrolled
Bituminous Coal-fired Boilers.................................................................. 4-484-15 HAP Emission Factors (English Units) for Controlled
Bituminous Coal-fired Boilers.................................................................. 4-494-16 HAP Emission Factors (Metric Units) for Controlled
Bituminous Coal-fired Boilers.................................................................. 4-504-17 Average Trace Element Removal Efficiency For Control Devices............4-514-18 N2O Emissions Data..................................................................................4-524-19 Summary of N2O Emission Factors for Bituminous and
Subbituminous Coal Combustion............................................................ 4-544-20 Particulate Sizing Data for 1986 AP-42 Database: Number
of A & B Ranked Data Sets..................................................................... 4-554-21 Comparison of Organic and Inorganic CPM Emissions From a
Coal-fired Boiler ...................................................................................... 4-554-22 Filterable Particulate for a Front Wall Fired Boiler Fueled on a
Low Sulfur Western Bituminous Coal...................................................... 4-564-23 Filterable Particulate for Subbituminous Coal Fired Fluidized
Bed Combustors with Multiclone Controls.............................................. 4-56

vi
LIST OF FIGURES
Figure Page
2-1 Single-retort horizontal-feed underfeed stoker..........................................2-382-2 Multiple-retort gravity-feed underfeed stoker.............................................2-382-3 Overfeed chain-grate stoker......................................................................2-392-4 Spreader stoker.........................................................................................2-392-5 Bubbling FBC schematic...........................................................................2-402-6 Circulating FBC schematic........................................................................2-402-7 Two-pass HRT boiler.................................................................................2-412-8 Firetube boiler...........................................................................................2-422-9 D-type packaged boiler and watertubes.................................................. 2-432-10 Four-pass Scotch boiler............................................................................2-442-11 Exposed-tube vertical boiler......................................................................2-452-12 Submerged-tube vertical boiler..................................................................2-464-1 FBC SO2 emissions vs. calcium to sulfur ratio..........................................4-28

1-1
1. INTRODUCTION
The document, "Compilation of Air Pollutant Emission Factors" (AP-42), hasbeen published by the U.S. Environmental Protection Agency (EPA) since 1972. Supplements to AP-42 have been routinely published to add new emissions sourcecategories and to update existing emission factors. An emission factor is anaverage value which relates the quantity (weight) of a pollutant emitted to a unit ofactivity of the source. In some cases, emission factors are presented in terms of anempirical formula to account for source variables. Emission factors are developedfrom source test data, material balance calculations, and engineering estimates. The uses for the emission factors reported in AP-42 include:
! Estimates of area-wide emissions;
! Emission estimates for a specific facility; and
! Evaluation of emissions relative to ambient air quality.
The EPA routinely updates AP-42 in order to respond to new emission factorneeds of State and local air pollution control programs, industry, as well as theAgency itself. Section 1.1 in AP-42, the subject of this Emission FactorDocumentation (EFD) report, pertains to bituminous and subbituminous coalcombustion in stationary, external equipment.
The purpose of this EFD is to provide background information and todocument the procedures used for the revision, update, and addition of emissionfactors for bituminous and subbituminous coal combustion. The scope of thepresent AP-42 Section 1.1 update is as follows:
! Update baseline, criteria emission factors with data identified since theprior updates;
! Modify equipment classifications to give separate treatment oftangentially-fired boilers and fluid bed combustors (FBCs);
! Extend emission factors to non-criteria species where data areavailable for volatile organic compounds (VOC) speciation, tracemetals and other air toxics, and greenhouse gases [nitrous oxide (e.g.,N2O), carbon dioxide (CO2)]; and

1-2
! Extend documentation and emission factor development for controlledoperation to reflect advances in control development and the increasedimportance of emission controls for combustion sources.
Data from approximately 20 test reports were used to revise and update emissionfactors for existing source categories; determine new emission factors for additionalnon-criteria pollutants; and add FBC units as a new source category.
The update of Section 1.1 of AP-42 began with a review of the existingversion of Section 1.1. Spot checks were made on the quality of existing emissionfactors by recalculating emission factors from selected primary data referencescontained in the background files. These recalculated emission factors were thencompared against those in the existing version of AP-42.
An extensive literature review was undertaken to improve technologydescriptions, update usage trends, and collect new test reports for criteria and non-criteria emissions. The new test reports were subjected to data quality review asoutlined in the draft EPA document, "Technical Procedures For Developing AP-42Emission Factors And Preparing AP-42 Sections" (March 6, 1992). Test reportscontaining sufficiently high quality data ratings were combined with existing data torevise emission factors or to produce new emission factors, as appropriate. Whensufficient new data were obtained that were of higher quality than existing data, oldlower-quality data were removed from the existing emission factor averages. Insome cases, data sources and test reports were identified during the literaturereview but were not received in sufficient time to incorporate into emission factordevelopment. This information has been placed in the background files for use infuture updates.
Several new emission factors for non-criteria pollutants have been added. These new emission factors pertain to total organic compounds (TOC), speciatedvolatile organic compounds (speciated VOC), air toxics, N2O, CO2, and fugitiveemissions. Additionally, in this revision, the information on control technologies forparticulate matter (PM), PM less than 10 microns (PM-10), sulfur oxide (SOx), andnitrogen oxides (NOx) emissions has been revised and updated. Add-on controls fornon-criteria pollutants are not covered here because these controls have not beendemonstrated on commercial scale combustors for this source category. Finally,because fluidized bed combustion of coal is finding increased commercialapplication in industrial and utility systems, a new source category for thiscombustion configuration has been added.
Including the introduction (Chapter 1), this EFD contains five chapters. Chapter 2 provides an overall characterization of bituminous and subbituminous coal

1-3
combustion usage. This includes a breakdown of coal application by industry, anoverview of the different source categories, a description of emissions, and adescription of the technology used to control emissions resulting from coalcombustion. Chapter 3 is a review of emissions data collection and analysisprocedures. It describes the literature search, the screening of emissions datareports, and the quality rating system for both emission data and emission factors. Chapter 4 details pollutant emission factor development. It includes the review ofspecific data sets and details of emission factor compilations. Chapter 5 presentsthe revised AP-42 Section 1.1. Appendix A provides conversion factors andexample calculations for emission factor development from test data. Appendix Bcontains an example of spot checking data from the fourth edition AP-42 primaryreferences. Appendix C contains a marked-up copy of the 1988 AP-42 Section 1.1indicating where changes have been made as a result of this update.

2-1
2. SOURCE DESCRIPTION
The amount and type of coal consumed, design of combustion equipment,and application of emission control technology have a direct bearing on emissionsfrom coal-fired combustion equipment. This chapter characterizes bituminous andsubbituminous coal combustion processes, and emission control technologies whichare commercially available in the United States.2.1 CHARACTERIZATION OF BITUMINOUS AND SUBBITUMINOUS COALS
APPLICATIONSCoal is a complex combination of organic matter and inorganic mineral matter
formed over eons from successive layers of fallen vegetation. Coal types arebroadly classified as anthracite, bituminous, subbituminous, and lignite. Theseclassifications are made according to heating value as well as relative amounts offixed carbon, volatile matter, ash, sulfur, and moisture. Formulas and tables forclassifying coals based on these properties are given in Reference 1.
In general, bituminous coals have heating values of 5,800 to 7,800 kcal/kg(10,500 to 14,000 Btu/lb) while the heating values of subbituminous coals are lowerat 4,600 to 6,400 kcal/kg (8,300 to 11,500 Btu/lb).1 Subbituminous coals aretypically higher in volatile matter, moisture, and oxygen contents than bituminouscoals and, as a result, are lower in fixed carbon content. Because of their highheating values and high volatile contents, both bituminous and subbituminous coalsburn easily when pulverized to fine powder. Because of its characteristically lowersulfur content and higher moisture content, SO2 and NOx emissions are generallylower for combustion of subbituminous coals relative to bituminous coals.
In 1990, a total of almost 860 million short tons of coal were consumed by theutility, industrial, commercial/institutional, and residential sectors.2 These foursectors can be described as follows: (1) utility boilers producing steam forgeneration of electricity; (2) industrial boilers generating steam or hot water forprocess heat, generation of electricity, or space heat; (3) boilers for space-heating ofcommercial and institutional facilities; and (4) residential furnaces for space- heatingpurposes. As shown in Table 2-1, the utility sector consumed the most fuel [over700 million metric tons (770 million short tons)]. The residential usage of coal for

2-2
space heating has generally declined since 1973 as stoker- and hand-fired furnacesand boilers have been replaced by oil, gas, and electric heating systems.2 Of thetotal coal produced in 1989, approximately 67 percent was bituminous, 24 percentsubbituminous, 9 percent lignite, and less than 1 percent anthracite.1
2.2 PROCESS DESCRIPTIONSCoal-fired boilers can be classified by type, fuel, and method of construction.
Boiler types are identified by the heat transfer method (watertube, firetube, or castiron), the arrangement of the heat transfer surfaces (horizontal or vertical, straight orbent tube), and the firing configuration (suspension, stoker, or fluidized bed). Table2-2 summarizes boiler type usage by sector. Most of the installed capacity offiretube and cast iron units is oil- and gas-fired3; however, a description of thesedesigns for coal is included here for completeness.
A watertube boiler is one in which the hot combustion gases contact theoutside of the heat transfer tubes, while the boiler water and steam are containedwithin the tubes. Coal-fired watertube boilers consist of pulverized coal, cyclone,stoker, fluidized bed, and handfeed units. Pulverized coal and cyclone boilers aretypes of suspension systems because some or all of the combustion takes placewhile the fuel is suspended in the furnace volume. In stoker-fired systems and mosthandfeed units, the fuel is primarily burned on the bottom of the furnace or on agrate. Some fine particles are entrained in upwardly flowing air, however, and areburned in suspension in the upper furnace volume. In a fluidized bed combustor,the coal is introduced to a bed of either sorbent or inert material (usually sand) whichis fluidized by an upward flow of air. Most of the combustion occurs within the bed,but some smaller particles burn above the bed in the "freeboard" space.
2.2.1 Suspension FiringIn pulverized coal-fired (PC-fired) boilers the fuel is pulverized to the
consistency of light powder and pneumatically injected through the burners into thefurnace. Combustion in PC-fired units takes place almost entirely while the coal issuspended in the furnace volume. PC-fired boilers are classified as either drybottom or wet bottom, depending on whether the ash is removed in solid or moltenstate. In dry bottom furnaces, coals with high fusion temperatures are burned,resulting in dry ash. In wet bottom furnaces, coals with low fusion temperatures areused, resulting in molten ash or slag. Wet bottom furnaces are also referred to asslag tap furnaces.

2-3
Depending upon the location of the burners and the direction of coal injectioninto the furnace, PC-fired boilers can also be classified into three different firingtypes. These are:
! Single and opposed wall, also known as face firing;! Tangential, also known as corner firing; and! Cyclone.Wall-fired boilers can be either single wall-fired, with burners on only one wall
of the furnace firing horizontally, or opposed wall-fired, with burners mounted on twoopposing walls. PC-fired suspension boilers usually are characterized by very highcombustion efficiencies, and are generally receptive to low-NOx burners and othercombustion modification techniques. Tangential or corner-fired boilers have burnersmounted in the corners of the furnace. The fuel and air are injected toward thecenter of the furnace to create a vortex that is essentially the burner. Because of thelarge flame volumes and relatively slow mixing, tangential boilers tend to be lowerNOx emitters for baseline uncontrolled operation. Cyclone furnaces are oftencategorized as a PC-fired system even though the coal burned in a cyclone iscrushed to a maximum size of about 4.75 mm (4 mesh). The coal is fed tangentially,with primary air, into a horizontal cylindrical furnace. Smaller coal particles areburned in suspension while larger particles adhere to the molten layer of slag on thecombustion chamber wall. Cyclone boilers are high-temperature, wet bottom-typesystems. Because of their high furnace heat release rate, cyclones are high NOx
emitters and are generally more difficult to control with combustion modifications.2.2.2 Stoker Firing
Stoker firing systems account for the vast majority of coal-fired watertubeboilers for industrial, commercial, and institutional applications.4 Most packagedstoker units designed for coal firing are less than 29 MW (100 million Btu/hr) heatinput.5 Field erected units with capacities in excess of 116 MW (400 million Btu/hr)are common. Stoker systems can be divided into three groups: underfeed stokers,overfeed stokers, and spreader stokers. These systems differ in how fuel issupplied to either a moving or stationary grate for burning. One important similarityamong all stokers is that all design types use underfeed air to combust the coal charon the grate, combined with one or more levels of overfire air introduced above thegrate. This helps ensure complete combustion of volatiles and low combustionemissions.
Underfeed stokers are generally of two types: the horizontal-feed, side-ash-discharge type shown in Figure 2-1; and the gravity-feed, rear-ash-discharge typeshown in Figure 2-2. The horizontal-feed, side-ash-discharge type of stoker is used

2-4
primarily in small boilers supplying relatively constant steam loads of less than about14,000 kg/hr (30,000 lb/hr).1 The gravity-feed, rear-ash-discharge underfeed stokercan be as large as 150 MW (500 million Btu/hr) heat input capacity1, although thereare a few underfeed coal stokers of up to 440 MW (1500 million Btu/hr)3.
An overfeed stoker, shown in Figure 2-3, uses a moving grate assembly. Coal is fed from a hopper onto a continuous grate which conveys the fuel into thefurnace. Caking bituminous coals can cause agglomeration and matting which canrestrict the airflow through the grate causing further combustion problems.5 Thethree types of grates used with overfeed coal stokers are the chain, travelling, andwater-cooled vibrating grates. These overfeed stoker systems are often referred toby the type of grate employed. Overfeed coal-fired systems typically range up to100 MW (350 million Btu/hr) heat input.
In a spreader stoker, shown in Figure 2-4, mechanical or pneumatic feedersdistribute coal uniformly over the surface of a moving grate. The injection of the fuelinto the furnace and onto the grate combines suspension burning with a thin, fast-burning fuel bed. The amount of fuel burned in suspension depends primarily onfuel size and composition, and air flow velocity. Generally, fuels with finer sizedistributions, higher volatile matter contents, and lower moisture contents result in agreater percentage of combustion and corresponding heat release rates insuspension above the bed.6 Heat input capacities of spreader stokers typicallyrange from 1 to 130 MW (5 to 450 million Btu/hr).3 Unlike overfeed stokers, fuelswith the potential to cake have little negative effect on spreader stokers and can begenerally fired with success in these units.5
2.2.3 Fluidized Bed CombustionFluidized bed combustion boilers, while not constituting a significant
percentage of the total boiler population, have nonetheless gained popularity in thelast decade, and today generate steam for industries, cogenerators, independentpower producers, and utilities. Fluidized bed combustion is a boiler design whichcan lower sulfur dioxide (SO2) and NOx emissions without the use of post-combustion or add-on controls. A calcium-based limestone or dolomitic sorbent isoften used for the bed material to capture SO2 evolved during combustion. Thesulfur is retained as a solid sulfate and is removed from the flue gas stream by theparticulate control device. Emissions of thermal NOx are reduced because FBCs areable to operate at lower combustion temperatures compared to the moreconventional designs, thus reducing the fixation of atmospheric nitrogen. Typicalmaximum firing temperatures for FBCs are 930oC (1700oF) compared with typicalfurnace-exit-gas-temperatures of 1430oC (2600oF) for dry bottom boilers and up to

2-5
1760oC (3200oF) for wet bottom boilers.1 Conversion of fuel nitrogen to NOx is alsosuppressed with FBC compared to suspension firing.
There are two major categories of FBC systems: (1) atmospheric, operatingat or near ambient pressures, and (2) pressurized, operating from 4 to 30atmospheres (60 to 450 psig). Pressurized FBC systems are being demonstrated attwo utility sites in the U.S.; however, they are not yet considered fullycommercialized. The remainder of this section will therefore describe onlyatmospheric FBCs.
Figures 2-5 and 2-6 show the two principal types of atmospheric FBC boilers,bubbling bed and circulating bed. The fundamental distinguishing feature betweenthese types is the fluidization velocity. In the bubbling bed design, the fluidizationvelocity is relatively low, ranging between 1.5 and 3.6 m/s (5 and 12 ft/s), in order tominimize solids carryover or elutriation from the combustor. Circulating FBCs,however, employ fluidization velocities as high as 9 m/s (30 ft/s) to promote thecarryover or circulation of the solids. High temperature cyclones are used incirculating FBCs and in some bubbling FBCs to capture the solid fuel and bedmaterial for return to the primary combustion chamber. The circulating FBCmaintains a continuous, high volume recycle rate which increases the residencetime compared to the bubbling bed design. Because of this feature, circulatingFBCs often achieve higher combustion efficiencies and better sorbent utilizationthan bubbling bed units.7
2.2.4 Handfeed UnitsSmall, coal-fired boilers and furnaces are sometimes found in small industrial,
commercial, institutional, or residential applications. Small firetube boilers in theseinstallations are sometimes capable of being hand-fired. From an emissionsstandpoint, handfeed units can have high carbon monoxide (CO) and VOCemissions because of generally low combustion efficiencies due, in part, to thepresence of quench surfaces. Most small units may not have particulate controlswhile some are only equipped with simple cyclone or multiclone collectors. Smallboilers and furnaces without particulate controls do not generally have emissionfactors as high as large uncontrolled industrial boilers because typical combustionintensities and firebox velocities are lower in the smallest units. Lower fireboxvelocities mean that smaller quantities of particulate matter are entrained in thecombustion gases.
The most common types of firetube boilers used with coal are the horizontalreturn tubular (HRT), Scotch, vertical, and the firebox. Cast iron boilers are alsosometimes available as coal-fired units in a handfeed configuration. The HRT
2-6
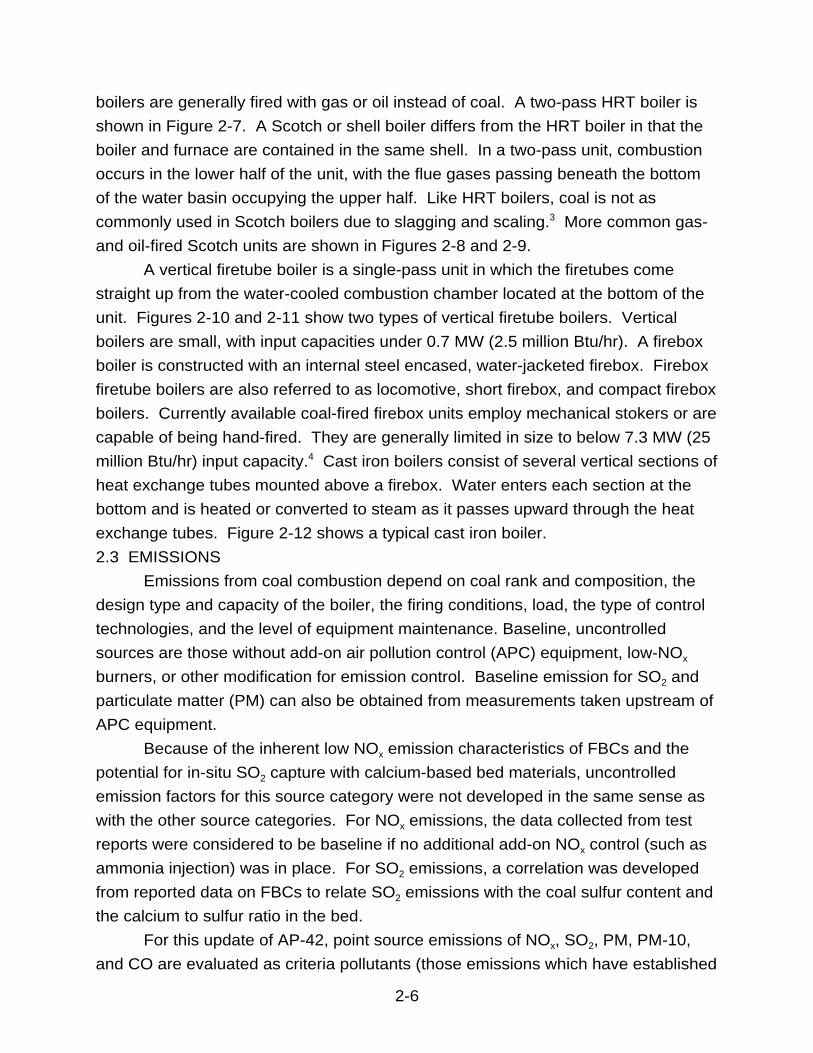
boilers are generally fired with gas or oil instead of coal. A two-pass HRT boiler isshown in Figure 2-7. A Scotch or shell boiler differs from the HRT boiler in that theboiler and furnace are contained in the same shell. In a two-pass unit, combustionoccurs in the lower half of the unit, with the flue gases passing beneath the bottomof the water basin occupying the upper half. Like HRT boilers, coal is not ascommonly used in Scotch boilers due to slagging and scaling.3 More common gas-and oil-fired Scotch units are shown in Figures 2-8 and 2-9.
A vertical firetube boiler is a single-pass unit in which the firetubes comestraight up from the water-cooled combustion chamber located at the bottom of theunit. Figures 2-10 and 2-11 show two types of vertical firetube boilers. Verticalboilers are small, with input capacities under 0.7 MW (2.5 million Btu/hr). A fireboxboiler is constructed with an internal steel encased, water-jacketed firebox. Fireboxfiretube boilers are also referred to as locomotive, short firebox, and compact fireboxboilers. Currently available coal-fired firebox units employ mechanical stokers or arecapable of being hand-fired. They are generally limited in size to below 7.3 MW (25million Btu/hr) input capacity.4 Cast iron boilers consist of several vertical sections ofheat exchange tubes mounted above a firebox. Water enters each section at thebottom and is heated or converted to steam as it passes upward through the heatexchange tubes. Figure 2-12 shows a typical cast iron boiler.2.3 EMISSIONS
Emissions from coal combustion depend on coal rank and composition, thedesign type and capacity of the boiler, the firing conditions, load, the type of controltechnologies, and the level of equipment maintenance. Baseline, uncontrolledsources are those without add-on air pollution control (APC) equipment, low-NOx
burners, or other modification for emission control. Baseline emission for SO2 andparticulate matter (PM) can also be obtained from measurements taken upstream ofAPC equipment.
Because of the inherent low NOx emission characteristics of FBCs and thepotential for in-situ SO2 capture with calcium-based bed materials, uncontrolledemission factors for this source category were not developed in the same sense aswith the other source categories. For NOx emissions, the data collected from testreports were considered to be baseline if no additional add-on NOx control (such asammonia injection) was in place. For SO2 emissions, a correlation was developedfrom reported data on FBCs to relate SO2 emissions with the coal sulfur content andthe calcium to sulfur ratio in the bed.
For this update of AP-42, point source emissions of NOx, SO2, PM, PM-10,and CO are evaluated as criteria pollutants (those emissions which have established

2-7
National Primary and Secondary Ambient Air Quality Standards8). This updateincludes point source emissions of some non-criteria pollutants (e.g., N2O, VOCs,and air toxics) as well as data on particle size distribution to support PM-10 emissioninventory efforts. Emissions of CO2 are also being considered because of itspossible participation in global climatic change and the corresponding interest inincluding this gas in emission inventories. Most of the carbon in fossil fuels isemitted as CO2 during combustion. Minor amounts of carbon are emitted as CO oras carbon retained in the fly ash. Finally, fugitive emissions associated with the useof coal at the combustion source are being included in this update of AP-42.
The total 1985 emissions of PM, SO2, and NOx emissions resulting frombituminous coal combustion in the major use sectors are summarized in Table 2-3shown below. Table 2-4 summarizes the federal New Source PerformanceStandards (NSPS)9-12 applicable to PM, SO2, and NOx emissions from fossil fuel-firedboilers.
A general discussion of emissions of criteria and non-criteria pollutants fromcoal combustion is given in the following paragraphs.2.3.1 Particulate Matter Emissions
Uncontrolled PM emission from coal-fired boilers include the ash in the fuel aswell as unburned carbon resulting from incomplete combustion. Emission factors forPM have generally been expressed as a function of fuel ash content. Coal ash mayeither settle out in the boiler (bottom ash) or be carried out with the flue gas (fly ash). The distribution of ash between the bottom and fly ash fractions directly affects thePM emissions rate13 and is a function of the following:
! Boiler firing method -- The type of firing is perhaps the most important factor in determining ash distribution. For example, stoker-fired unitsemit less fly ash than dry bottom, PC boilers; and
! Wet or dry bottom furnace -- Wet bottom cyclone furnaces removeapproximately 70 percent of ash as slag or bottom ash; with dry bottomunits, the inverse is roughly the case, where 70 percent of ash exits theboiler with the combustion gases to be treated by particulate collectors.
Boiler load also affects PM emissions from coal-fired boilers. In general,decreasing load tends to reduce PM emissions; however, the magnitude of thereduction varies considerably depending on boiler type, fuel, and boiler operation.
Soot blowing is a source of intermittent PM emissions in coal-fired boilers. Steam soot blowing is used periodically to dislodge ash from heat transfer surfacesin the furnace, convective section, and economizer/preheater. On small boilers withsingle soot blowers, soot blowing may only take place for a few seconds once a

2-8
shift. Large boilers may have numerous soot blowers installed and operated in acycle which may approach "continuous" soot blowing. 2.3.2 Sulfur Oxide Emissions
Sulfur oxide emissions are generated during coal combustion from theoxidation of sulfur contained in the fuel. The emissions of SOx from conventionalcombustion systems are predominantly in the form of SO2. On average, more than95 percent of the fuel sulfur is converted to SO2, about 1 to 5 percent is furtheroxidized to sulfur trioxide (SO3), and about 1 to 3 percent is converted to sulfateparticulate. Sulfur trioxide readily reacts with water vapor (both in air and in fluegases) to form sulfuric acid mist.
Uncontrolled SOx emissions are almost entirely dependent on the sulfurcontent of the fuel and, with the exception of fluidized bed combustors, are notaffected by boiler type, size, or burner design15. There is some potential that stokerboilers firing high ash coal with a significant alkaline content could result in SO2
emissions which are lower than a PC-fired boiler firing the same fuel due to sulfurretention as an alkali sulfate in the ash bed on the grate. In some cases,combustion of highly alkaline, Western subbituminous coals can result in 20 percentof the sulfur in the coal being retained in the bottom ash or fly ash.16 However, thedata reviewed did not justify the presentation of separate emission factors for stoker-fired systems. Therefore, as in the earlier versions of AP-42, a consistent SO2
emission factor, based only on fuel sulfur content (within a coal rank), was retainedfor all combustion configurations, with the single exception of FBC units. 2.3.3 Nitrogen Oxide Emissions
Oxides of nitrogen formed in combustion processes are due either to thermalfixation of atmospheric nitrogen in the combustion air ("thermal NOx") or to theconversion of chemically bound nitrogen in the fuel ("fuel NOx"). The term NOx
customarily refers to the composite of nitric oxide (NO), and nitrogen dioxide (NO2).Nitrous oxide is excluded, but is an oxide of definite interest. Test data have shownthat for most stationary combustion systems, over 95 percent of the emitted NOx isin the form of NO.15
The qualitative global kinetics of thermal NOx formation have shown that NOx
formation rates are exponentially dependent on temperature, and proportional to N2
concentration in the flame, the square root of the oxygen (O2) concentration in theflame, and the residence time.17 Thus, the formation of thermal NOx is affected byfour factors: (1) peak temperature, (2) nitrogen concentration, (3) oxygenconcentration or flame stoichiometry, and (4) time of exposure at peak temperature. The emission trends resulting from changes in these factors are fairly consistent for

2-9
all types of boilers -- an increase in flame temperature, oxygen availability, and/orresidence time at high temperatures leads to an increase in thermal NOx productionregardless of the boiler type.
Fuel nitrogen conversion is the more important NOx forming mechanism incoal-fired combustion systems because of the high nitrogen content in the fuel. FuelNOx can account for 80 percent of the total NOx emissions in coal firing.18 Thepercent conversion of fuel nitrogen to NOx can vary greatly. Anywhere from 5 to 60percent of nitrogen in the coal can be converted to NOx.17 Furthermore, test dataindicate that the percent of fuel nitrogen conversion decreases as the fuel nitrogencontent increases.19
A number of variables influence how much NOx is formed by these twomechanisms. One important variable is firing configuration. The NOx emissions fromtangentially (corner) fired boilers are, on the average, less than those of horizontallyopposed units. Also important are the firing practices employed during boileroperation. Low excess air (LEA) firing, flue gas recirculation (FGR), stagedcombustion (SC), or some combination thereof may result in NOx reductions of 5 to60 percent. (See Section 2.4.1 for a discussion of these techniques). Loadreduction can likewise decrease NOx production. The NOx emissions may bereduced from 0.5 to 1 percent for each percentage reduction in load from full loadoperation. Levels of NOx emissions do not decrease significantly in response to loadreductions in some boilers and have, in some cases, been observed to increase(due to the higher excess air levels sometimes required to maintain stablecombustion). It should be noted that the discussion of these variables, with theexception of excess air, applies to the NOx emissions only of large coal-fired boilers. Low excess air firing is possible in many small boilers, but the resulting NOx
reductions are not nearly so significant. Test data on pulverized coal combustion utility boilers indicate that N2O
emissions were always less than 10 ppm20 and often less than 1 ppm in the unitstested.21 Generally, N2O emissions from FBC boilers can be higher, but aregenerally less than 100 ppm with U.S. coals.22 Some of the higher N2O emissionsthat have been reported are from European FBC installations and pilot plantstudies.23 Some pilot plant configurations have been suspected of producingspuriously high N2O emissions data which are not representative.
At the third N2O workshop held in France in June 1988,24 data were presentedsuggesting the presence of an N2O sampling artifact in sampling containers awaitinganalysis. Recent N2O emissions data indicate that direct N2O emissions from coalcombustion units are considerably below the measurements made prior to 1988.
2-10
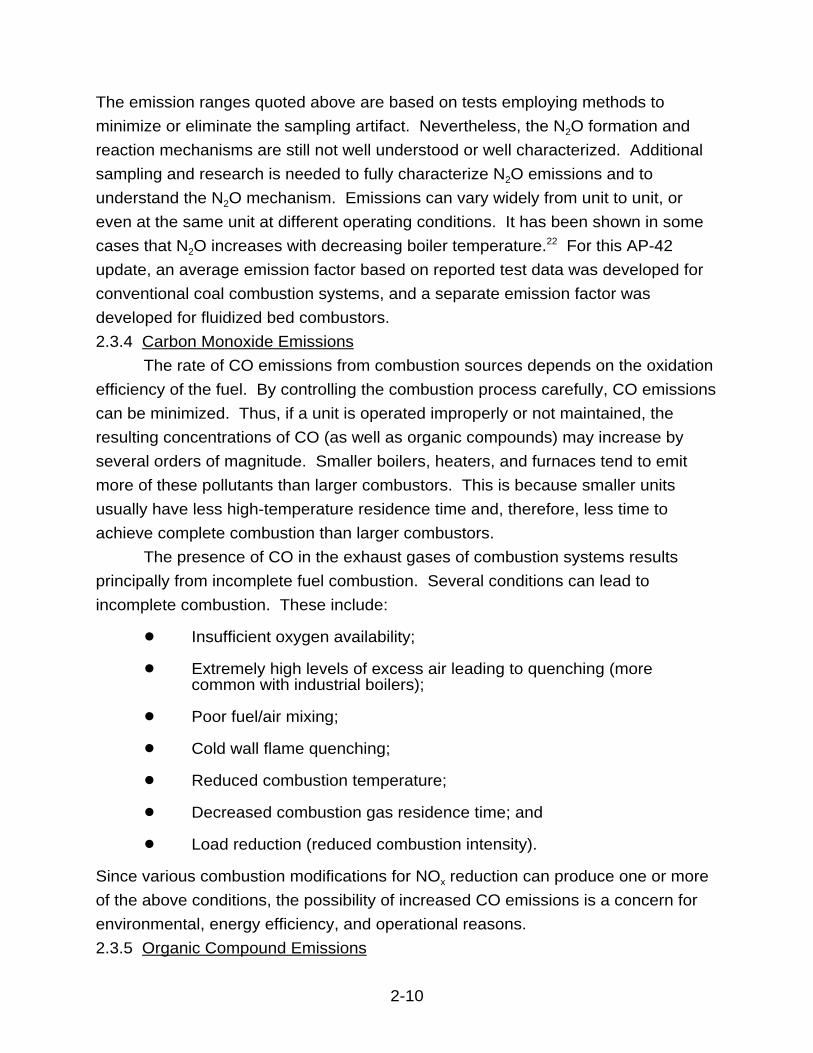
The emission ranges quoted above are based on tests employing methods tominimize or eliminate the sampling artifact. Nevertheless, the N2O formation andreaction mechanisms are still not well understood or well characterized. Additionalsampling and research is needed to fully characterize N2O emissions and tounderstand the N2O mechanism. Emissions can vary widely from unit to unit, oreven at the same unit at different operating conditions. It has been shown in somecases that N2O increases with decreasing boiler temperature.22 For this AP-42update, an average emission factor based on reported test data was developed forconventional coal combustion systems, and a separate emission factor wasdeveloped for fluidized bed combustors.2.3.4 Carbon Monoxide Emissions
The rate of CO emissions from combustion sources depends on the oxidationefficiency of the fuel. By controlling the combustion process carefully, CO emissionscan be minimized. Thus, if a unit is operated improperly or not maintained, theresulting concentrations of CO (as well as organic compounds) may increase byseveral orders of magnitude. Smaller boilers, heaters, and furnaces tend to emitmore of these pollutants than larger combustors. This is because smaller unitsusually have less high-temperature residence time and, therefore, less time toachieve complete combustion than larger combustors.
The presence of CO in the exhaust gases of combustion systems resultsprincipally from incomplete fuel combustion. Several conditions can lead toincomplete combustion. These include:
! Insufficient oxygen availability;
! Extremely high levels of excess air leading to quenching (morecommon with industrial boilers);
! Poor fuel/air mixing;
! Cold wall flame quenching;
! Reduced combustion temperature;
! Decreased combustion gas residence time; and
! Load reduction (reduced combustion intensity).
Since various combustion modifications for NOx reduction can produce one or moreof the above conditions, the possibility of increased CO emissions is a concern forenvironmental, energy efficiency, and operational reasons. 2.3.5 Organic Compound Emissions

2-11
Total organic compounds include VOCs which remain in a gaseous state inambient air, semi-volatile organic compounds and condensible organic compounds. According to the Federal Register, VOC has been defined as any organic compoundexcluding CO, CO2, carbonic acid, metallic carbides or carbonates, and ammoniumcarbonate which participates in atmospheric photochemical reactions. The followingadditional compounds have been deemed to be of "negligible photochemicalreactivity" and so are exempt from the definition of VOC: methane, ethane, methylchloroform, methylene chloride, and most chlorinated-fluorinated compounds(commonly referred to as CFCs). Although these compounds are considered"exempt" from most ozone control programs due to their low photochemicalreactivity rates, they are of concern when developing complete emission inventorieswhich are necessary for the design of effective ozone control strategies. The termTOC will be considered to include all organic compounds, i.e. VOCs plus the"exempt" compounds including methane and ethane, toxic compounds, aldehydes,perchloroethylene, semi-volatiles, and condensibles (as measured by EPAReference Methods).25
Emissions of VOCs are primarily characterized by the criteria pollutant class ofunburned vapor phase hydrocarbons. Unburned hydrocarbon emissions caninclude essentially all vapor phase organic compounds emitted from a combustionsource. These are primarily emissions of aliphatic, oxygenated, and low molecularweight aromatic compounds which exist in the vapor phase at flue gastemperatures. These emissions include all alkanes, alkenes, aldehydes, carboxylicacids, and substituted benzenes (e.g., benzene, toluene, xylene, ethyl benzene,etc.).26,27
The remaining organic emissions are composed largely of compoundsemitted from combustion sources in a condensed phase. These compounds canalmost exclusively be classed into a group known as polycyclic organic matter(POM), and a subset of compounds called polynuclear aromatic hydrocarbons (PNAor PAH). There are also PAH-nitrogen analogs. Information available in theliterature on POM compounds generally pertains to these PAH groups. Because ofthe dominance of PAH information (as opposed to other POM categories) in theliterature, many reference sources have inaccurately used the terms POM and PAHinterchangeably.
Polycyclic organic matter can be especially prevalent in the emissions fromcoal burning, because a large fraction of the volatile matter in coal exits as POM.4 Afew comments are in order concerning an extremely toxic subclass of PNA -- thepolychlorinated and polybrominated biphenyls (PCBs and PBBs). A theoretical

2-12
assessment of PCB formation in combustion sources28 concluded that, althoughPCB formation is thermodynamically possible for combustion of fuels containingsome chlorine (e.g., some coals and residual oil), it is unlikely due to short reactionresidence times at conditions favoring PCBs and to low chlorine concentrations. Also with efficient mixing, oxygen availability, and adequate residence time attemperatures in the 800-1000 °C (1470-1830 °F) range, PCBs [together withpolychlorinated dibenzo-p-dioxins (PCDD) and polychlorinated dibenzofurans(PCDF)] may be efficiently destroyed.29 Other research has shown, however, thatchlorinated PNAs can be formed via catalyzed reactions on fly ash particles at lowtemperatures in equipment downstream of the combustion device.61
Formaldehyde is formed and emitted during the combustion of hydrocarbon-based fuels including coal and oil. Formaldehyde is present in the vapor phase ofthe flue gas. Since formaldehyde is subject to oxidation and decomposition at thehigh temperatures encountered during combustion, large units with efficientcombustion resulting from closely regulated air-fuel ratios, uniformly highcombustion chamber temperatures, and relatively long retention times should havelower formaldehyde emission rates than do small, less efficient combustion units.30,31
2.3.6 Trace Element EmissionsTrace elements are also emitted from the combustion of coal. For this update
of AP-42, trace metals included in the list of 189 hazardous air pollutants under TitleIII of the 1990 Clean Air Act Amendments (CAAA-90)32 are considered. The quantityof trace metals emitted depends on combustion temperature, fuel feed mechanismand the composition of the fuel. The temperature determines the degree ofvolatilization of specific compounds contained in the fuel. The fuel feed mechanismaffects the partitioning of emissions into bottom ash and fly ash.
The quantity of any given metal emitted, in general, depends on:
! Its concentration in the fuel;
! The combustion conditions;
! The type of particulate control device used, and its collection efficiency as a function of particle size; and
! The physical and chemical properties of the element itself.
It has become widely recognized that some trace metals concentrate incertain waste particle streams from a combustor (bottom ash, collector ash, flue gasparticulate), while others do not.4 Various classification schemes to describe this

2-13
partitioning have been developed.33-35 The classification scheme used by Baig etal.35 is as follows:
! Class 1: Elements which are approximately equally distributedbetween fly ash and bottom ash, or show little or no small particleenrichment;
! Class 2: Elements which are enriched in fly ash relative to bottom ash, or show increasing enrichment with decreasing particle size;
! Class 3: Elements which are intermediate between Class 1 and 2;
! Class 4: Volatile elements which are emitted in the gas phase.
By understanding trace metal partitioning and concentration in fine particulate,it is possible to postulate the effects of combustion controls on incremental tracemetal emissions.4 For example, several NOx controls for boilers reduce peak flametemperatures [e.g., staged combustion, flue gas recirculation (FGR), reduced airpreheat, and load reduction]. If combustion temperatures are reduced, fewer Class2 metals will initially volatilize, and fewer will be available for subsequentcondensation and enrichment on fine particulate matter. Therefore, for combustorswith particulate controls, lowered volatile metal emissions should result due toimproved particulate removal. Flue gas emissions of Class 1 metals (the non-segregating trace metals) should remain relatively unchanged.
Lowered local O2 concentrations are also expected to affect segregatingmetal emissions from boilers with particle controls. Lowered O2 availabilitydecreases the possibility of volatile metal oxidation to less volatile oxides. Underthese conditions, Class 2 metals should remain in the vapor phase into the coolersections of the boiler. More redistribution to small particles should occur andemissions should increase. Again, Class 1 metals should not be significantlyaffected.
Other combustion NOx controls which decrease local O2 concentrations(staged combustion and low NOx burners) may also reduce peak flametemperatures. Under these conditions, the effect of reduced combustiontemperature is expected to be stronger than that of lowered O2 concentrations.2.3.7 Fugitive Emissions
Fugitive emissions are pollutants which escape from an industrial process dueto leakage, materials handling, inadequate operational control, transfer or storage. Depending on how the fugitive emissions are measured, under what conditions, andfor what specific type of operation used, emission factors tend to vary widely invalidity, absolute value, and methodology of calculation.

2-14
The fly ash handling operations in most modern utility and industrialcombustion sources consist of pneumatic systems or enclosed and hooded systemswhich are vented through small fabric filters or other dust control devices. Thefugitive PM emissions from these systems are therefore minimal. Fugitiveparticulate emissions can sometimes occur during transfer operations from silos totrucks or rail cars.2.4 CONTROL TECHNOLOGIES
Only controls for criteria pollutants are discussed here because controlsspecifically for non-criteria emissions have not been demonstrated orcommercialized for coal combustion sources.
Control techniques may be classified into three broad categories: fueltreatment/substitution, combustion modification, and post-combustion control. Fueltreatment includes coal cleaning using physical, chemical, or biological processes. Combustion modification and post-combustion control are both applicable andwidely commercialized for coal combustion sources. Combustion modification isapplied primarily for NOx control purposes, although for small units, some reductionin PM emissions may be available through improved combustion practice. Postcombustion control is applied to emissions of PM, SO2, and, to some extent, NOx forcoal combustion.
Particulate emissions may be categorized as either filterable or condensible. Filterable emissions are generally considered to be the particles that are trapped bythe glass fiber filter in the front half of a Reference Method 5 or Method 17 samplingtrain. Particles less than 0.3 microns and vapors pass through the filter. Condensible particulate matter (CPM) is material that is emitted in the vapor statewhich later condenses to form homogeneous and/or heterogeneous aerosolparticles. The condensible particulate emitted from boilers fueled on coal or oil isprimarily inorganic in nature.2.4.1 Fuel Treatment/Substitution
Fuel treatment (or benefication) and fuel substitution are pre-combustiontechniques for reducing NOx, SO2, and PM emissions from combustion sources. Fuel substitution involves the use of naturally occurring clean fuels, whereasbenefication provides a physically or a chemically cleaned fuel.
Naturally occurring low sulfur coals may allow a source to meet SO2 emissionlimits or reduce emissions with no additional controls. Low sulfur coal is sometimesdefined as run-of-mine (ROM) coal which can comply with a given emissionstandard. Although the terms "high" and "low" are dependent on the specifics of thefuel analysis (and the area where the coal was mined), generally the break point

2-15
between high and low sulfur coal is considered to be around 1100 ng/J (2.5 lbs SO2
per million Btu of heat input).36 This is roughly equivalent to 1.5 percent sulfur forbituminous coals, and about 1.0 percent for subbituminous coals. Nearly 85 percentof the reserve base of low sulfur coal is located in states west of the MississippiRiver. The bulk of western coals are, however, of a lower rank than are the Easterncoals.
Low sulfur western coals can be burned in stoker-fired systems as long asthere is sufficient undergrate air to handle any caking that may occur. Also, manylow sulfur western coals have low ash fusion temperatures which may causeslagging on the grate for some stoker designs.
Pulverized coal and FBC boilers can be designed for almost any type of coal. However, once a design is set (especially for PC systems), substitutions are limitedto coals with compatible combustion characteristics and ash properties. Fluidizedbed boilers are generally more tolerant of alternate or "off-spec" fuels. The choice ofalternate coal will depend on the type of pulverizer at the boiler site (for PC-firedsystems), the spacing of watertubes in the steam generator and superheatersections, and the materials used in the furnace wall.37 Also, the higher resistivity ofthe fly ash from the combustion of low sulfur coal may affect the particulate controlperformance of the ESP.
Physical coal benefication consists of a series of steps including sizereduction, classification, cleaning, dewatering and drying, waste disposal, andpollution control. Basic physical coal cleaning techniques have been commercial forat least 50 years.36 Currently, more than 50 percent of domestic coal is cleaned tosome level before use.36 There are in excess of 500 coal cleaning plants in the U.S.,most of which are located east of the Mississippi River. Although coal cleaning wasoriginally envisioned as an ash reduction technology, it also accomplishes reductionin SO2 emissions. The level of reduction is dependent on the pyritic (inorganic)sulfur content and the nature and extent of cleaning operations (primarily crushing)done on the feed coal. Current, commercial physical coal cleaning plants arecapable of removing 20 to 50 percent of the pyritic sulfur.36 Assuming the highrange to be achievable, and using published levels of pyritic and total sulfur forindividual coals,38 the total possible reduction in SO2 emissions for commonbituminous coals are:
! Illinois No. 6: 27%! Upper Freeport: 47%! Upper Kittanning: 11%

2-16
These reduction values are shown for illustration purposes only since the ratioof pyritic to organic sulfur can vary substantially alon ghe length of a seam (e.g.,reductions could bary between 20 and 40 percent for Illinois No. 6 coal). It is evidentthat the degree of SO2 removal available with physical coal benefication depends onthe cleaning process as well as the coal type and pyritic/organic sulfur ratio. It isalso clear that the removal of SO2 is well below the 90 percent level usually requiredunder the New Source Performance Standards (NSPS).10-12
Several chemical and biological benefication processes are underdevelopment, but are not yet commercialized for full-scale coal combustionapplications. These advanced cleaning processes are being designed to work onthe organically bound sulfur as opposed to most of the physical processes which areaimed at the pyritic sulfur. The goals of the research and development efforts whichhave been funded by the U.S. Department of Energy, the Electric Power ResearchInstitute, and private industry is to produce a coal that can meet the NSPS andClean Air Act Amendments of 1990 SO2 emission limits without additional controls.2.4.2 Combustion Modification
Combustion modification includes any physical or operational change in thefurnace or boiler apparatus itself.4,39-44 Maintenance of the burner system, forexample, is important to assure proper mixing and subsequent minimization of anyunburned combustibles. Periodic tuning is important in small units for maximumoperating efficiency and emission control, particularly of smoke and CO.
2.4.2.1 Particulate Matter Control. Uncontrolled PM emissions from smallstoker-fired and handfeed coal combustion sources can be minimized by employinggood combustion practice. This involves operation of the combustion source withinrecommended load ranges, controlling the rate of load changes, and ensuringsteady and uniform fuel introduction. Proper design of combustion air deliverysystems can also minimize uncontrolled PM emissions. Insufficient combustion airwill generate soot and condensible organic compound emissions. Conversely, theuse of excessive air flow under the grate, beyond that necessary to complete charburnout and to cool the grate can give high PM emissions. Also, localized areas ofhigh velocities near the fuel bed can entrain ash into the flue gases leaving thecombustor. Excess air in these types of units should be introduced through overfireair ports where possible for volatile burnout and upper furnace temperature control.
Large industrial and utility boilers are generally well designed and maintainedso that soot and condensible organic compound emissions are minimized. Particulate matter emissions are more a result of entrained fly ash in suspension-

2-17
fired and FBC systems. Therefore, post combustion controls are necessary toreduce PM emissions from these sources.
2.4.2.2 Nitrogen Oxide Control. Combustion modifications, such as limitedexcess air firing, flue gas recirculation, staged combustion and reduced loadoperation, are primarily used to control NOx emissions in large coal-fired facilities.
The formation of thermal NOx occurs in part through the Zeldovichmechanism:
(2-1) N2 + O 76 NO + N (2-2) N + O2 76 NO + O (2-3) N + OH 76 NO + H
Reaction (2-1) is generally the rate determining step due to its large activationenergy.4 On an overall, idealized, global basis, the thermal NOx formation rate isrelated to N2 concentration, combustion temperature, and O2 concentration by thefollowing equation:4
(2-4) [NO] = k1 exp(-k2/T) [N2] [O2]1/2 twhere:
[ ] = mole fractionT = temperature (°K)t = residence time k1, k2 = reaction rate coefficient constants
This idealized relationship suggests thermal NOx formation can be controlled by fourapproaches: (1) reduction of peak temperature of reaction, (2) reduction of N2
concentration, (3) reduction of oxygen level or stoichiometric ratio, and (4) reductionof the residence time of exposure at peak temperature. Typically, the N2 molefraction in hydrocarbon-air flames is on the order of 0.7 and is difficult to modify.4 Therefore, combustion modification techniques to control thermal NOx in boilershave focused on reducing oxygen level, peak temperature, and time of exposure atpeak temperature in the primary flame zones of the furnaces. Equation 2-4 alsoshows that thermal NOx formation depends exponentially on temperature,parabolically on oxygen concentration, and linearly on residence time. Thereforeinitial efforts to control NOx emissions are often focused on methods to reduce peakflame temperatures.
In boilers fired on coal, the control of fuel NOx is also very important inachieving the desired degree of NOx reduction, since fuel NOx can account for 80percent of the total NOx formed.18,45,46 Fuel nitrogen conversion to NOx is highlydependent on the fuel to air ratio in the combustion zone, and in contrast to thermalNOx formation, is relatively insensitive to small changes in combustion zone

2-18
temperature.47 In general, increased mixing of fuel and air increases nitrogenconversion which, in turn, increases fuel NOx. Thus, to reduce fuel NOx formation,the most common combustion modification technique is to suppress combustion airlevels below the theoretical amount required for complete combustion. The lack ofoxygen creates reducing conditions that, given sufficient time at high temperatures,cause volatile fuel nitrogen to convert to N2 rather than NO.
In the formation of both thermal and fuel NOx, all of the above reactions andconversions do not take place at the same time, temperature, or rate. The actualmechanisms for NOx formation in a specific situation are dependent on the quantityof fuel-bound nitrogen and the temperature and stoichiometry of the flame zone. Although the NOx formation mechanisms are different, both thermal and fuel NOx arepromoted by rapid mixing of fuel and combustion air. This rate of mixing may itselfdepend on fuel characteristics such as the atomization quality of liquid fuels or theparticle fineness of solid fuels.48 Additionally, thermal NOx is greatly increased byincreased residence time at high temperatures under oxidizing conditions. Thus,primary combustion modification controls for both thermal and fuel NOx typically relyon the following control approaches:
! Decrease residence time at high temperatures and oxidizing conditions(for oxidizing conditions):
- Decreased adiabatic flame temperature through dilution,
- Decreased combustion intensity,
- Increased flame cooling,
- Decreased primary flame zone residence time,
! Decrease primary flame zone O2 level:
- Decreased overall O2 level,
- Controlled (delayed) mixing of fuel and air, and
- Use of fuel-rich primary flame zone.
Tables 2-5 and 2-6 summarize available NOx control techniques currently in use ofunder full-scale demonstration on pulverized coal-fired boilers and stoker coal-firedboilers, respectively.
For cyclone boilers, natural gas reburning has been investigated as acombustion modification NOx control technique. In this process, natural gas isinjected into a furnace reburn zone downstream from the cyclone burners. Theinjection of additional fuel creates a fuel-rich zone in which NOx from the cyclone

2-19
burners is converted to molecular nitrogen and water vapor. Additional air isinjected downstream of the reburn zone to complete the combustion of unburnedfuel. Flue gas recirculation may be employed to facilitate mixing of natural gas withthe flue gas and penetration of natural gas into the furnace.
Parametric tests for natural gas reburning aplied to a 108 MW electric output(MWe) cyclone boiler using 18 percent natural gas injection and FGR showed thatNOx emissions were reduced to approximately 300 ppm (at 3 percent O2),corresponding to a 58 percent reduction efficiency.62 However, the reburn systemresulted in an unacceptable amount of slag build-up on the near wall of thesecondary furnace. The use of a water-cooled natural gas injection system in lieu ofthe FGR system eliminated the excess slag build up but NOx reduction efficienciesdropped to 46 to 48 percent, based on preliminary testing. 2.4.2.3 Fluidized Bed Combustion. Fluidized bed combustion is often considereda combustion modification for SO2 control because FBC can sometimes be retrofit toconventional combustors and boilers. Limestone or dolomite added to the bed iscalcined to lime and reacts with SO2 to form calcium sulfate. Bed materials can alsoeffectively capture trace metals. Bed temperatures are typically maintained between760 and 870 °C (1400 to 1600 °F) to promote the sulfation reaction and to preventash fusion. Particulate matter emitted from the boiler is generally captured in acyclone and recirculated or sent to disposal. Additional particulate controlequipment, such as an ESP or baghouse, may be used after the cyclone to furtherreduce particulate emissions.2.4.3 Post-Combustion Control
2.4.3.1 Particulate Matter Control. The post-combustion control of PMemissions from coal-fired combustion sources can be accomplished by using one ormore of the following particulate control devices:
! Electrostatic precipitator (ESP),! Fabric filter (or baghouse),! Wet scrubber,! Cyclone or muliclone collector, or! Side stream separator.Filterable particulate emissions can be controlled to various levels by all of
these devices. Cyclones, ESPs, and fabric filters have little effect on measuredcondensible particulate matter (CPM) because they are generally operated attemperatures above the upper limit of the front-half of EPA Method 5 [135oC(275oF)]. Most CPM would remain vaporized and pass through the control device.

2-20
Wet scrubbers, however, reduce the gas stream temperature so they couldtheoretically remove some of the CPM.
Electrostatic precipitation technology is applicable to a variety of coalcombustion sources. Because of their modular design, ESPs can be applied to awide range of system sizes. Application of an ESP should have no adverse effecton combustion system performance.49 The operating parameters that influence ESPperformance include:
! Fly ash mass loading,! Particle size distribution,! Fly ash electrical resistivity, and! Precipitator voltage and current.
Other factors that determine ESP collection efficiency are collection plate area, gasflow velocity, and cleaning cycle. Data for ESPs applied to coal-fired sources showfractional collection efficiencies greater than 99 percent for fine (less than 0.1micron) and coarse particles (greater than 10 microns).50 These data show areduction in collection efficiency for particle diameters between 0.1 and 10 microns.
Fabric filtration has been widely applied to coal combustion sources since theearly 1970's. A fabric filter (baghouse) consists of a number of filtering elements(bags) along with a bag cleaning system contained in a main shell structureincorporating dust hoppers. Bag materials, such as fiberglass, Nomex,TM or TeflonTM
are selected based on operating temperature, particle abrasiveness, and acid gascontent in the flue gases. Woven, non-woven (felted), and texturized filamentfabrics are chosen based on collection efficiency and cleanability requirements.
The particulate removal efficiency of fabric filters is dependent on a variety ofparticle and operational characteristics. Particle characteristics that affect thecollection efficiency include:
! Particle size distribution,! Particle cohesion characteristics, and! Particle electrical resistivity.
Operational parameters that affect fabric filter collection efficiency include:! Air-to-cloth ratio (A/C),! Operating pressure loss,! Cleaning sequence,! Interval between cleaning,! Cleaning method, and! Cleaning intensity.

2-21
In addition, fabric properties affect the particle collection efficiency and sizedistribution:
! Structure of fabric! Fiber composition! Bag propertiesIn fabric filtration, both the collection efficiency and the pressure drop across
the bag surface increase as the dust layer on the bag builds up. The method andfrequency of bag cleaning determines the overall collection performance andpressure drop as well as the bag life. Cleaning processes include mechanicalshaking, reverse-flow, and pulse-jet. Mechanical shaking and reverse-flow systemsrequire lower air to cloth (A/C) ratios (2 to 3 rather than 6 to 12 for pulse jet) and aretypically found in the electric utility industry, whereas pulse-jet types are used acrossmost of the industrial and commercial size spectrum. There is increased interest inpulse-jet baghouses in the very large systems because of the equipment sizeadvantage. Emission tests conducted on an industrial spreader stoker equippedwith a reverse-flow fabric filter have shown fractional efficiencies as high as 99.9percent for particles in the 0.02 to 2 micron size range.51 Other reported test data forseven industrial boilers equipped with baghouses showed controlled PM emissionsranging from 4.1 to 15 ng/J (0.010 to 0.035 lb/million Btu) and fractional efficienciesof 99.7 to 99.9+ percent.52
The above tests indicate that fabric filter performance is not significantlyaffected by boiler design type or size. It should be noted that most bag materials willdevelop holes or leak paths due to flex abrasion wear, hot embers ("sparklers"), orfailure of attachment points. Very small leaks can substantially diminish thecollection efficiency of a baghouse system, particularly in the size range below 10microns. Therefore, careful design and an established maintenance program areimportant for continued performance at the specified levels.
Wet scrubbers, including venturi and flooded disc scrubbers, tray or towerunits, turbulent contact absorbers, or high pressure spray impingement scrubbersare applicable for PM as well as SO2 control on coal-fired combustion sources. Onedisadvantage of using scrubbers for PM control is the disposal requirements of theresulting wet sludge as opposed to the dry product as produced by ESPs, fabricfilters, or cyclone collectors. Tray tower units are best suited for SO2 control and areeffective only for particles greater than 1 micron in diameter. Venturi type scrubbersare effective down to the submicron range. Scrubber collection efficiency dependson particle size distribution, gas side pressure drop through the scrubber, and water(or scrubbing liquor) pressure. Reported fractional efficiencies for a venturi scrubber

2-22
range between 95.00 and 99.89 percent for a 2 micron particle.53 Correspondingpressure drops ranged from 2 to 10 kPa (8 to 40 inches of water).
Cyclone separators can be installed singly, in series, or grouped as in a multi-cyclone or multiclone collector. These devices are referred to as mechanicalcollectors because they do not rely on electrical, liquid, or barrier principles forremoval of PM from a gas stream. The collection efficiency of a mechanicalcollector depends strongly on the effective aerodynamic particle diameter. Althoughthese devices will reduce PM emissions from coal combustion, they are relativelyineffective for collection of PM-10. Mechanical collectors are often used as aprecollector upstream of an ESP, fabric filter, or wet scrubber so that these devicescan be specified for lower particle loadings to reduce capital and/or operating costs. Mechanical collectors are designed for a specified range of gas flows. Because theavailable collection efficiencies for a given collector depend on inlet velocity, thesedevices are not effective for a combustion source which typically operates over wideload ranges. The typical overall collection efficiency for mechanical collectorsranges from 90 to 95 percent.
The side-stream separator combines a multi-cyclone and a small pulse-jetbaghouse to more efficiently collect small diameter particles that are difficult tocapture by a mechanical collector alone. Most applications to date for side-streamseparators have been on small stoker boilers.
Atmospheric fluidized bed combustion (AFBC) boilers may tax conventionalparticulate control systems. The particulate mass concentration exiting AFBCboilers is typically 2 to 4 times higher than pulverized coal boilers54. AtmosphericFBC particles are also, on average, smaller in size, irregularly shaped with highersurface area and porosity relative to pulverized coal ashes. The effect is a higherpressure drop.
The AFBC ash is more difficult to collect in ESPs than pulverized coal ashbecause AFBC ash has a higher electrical resistivity and the use of multiclones forrecycling, inherent with the AFBC process, tends to reduce exit gas streamparticulate size54.
2.4.3.2 SO2 Control. Commercialized post-combustion flue gasdesulfurization (FGD) uses an alkaline reagent to absorb SO2 in the flue gas andproduces a sodium or a calcium sulfate compound. These solid sulfate compoundsare then removed in downstream particulate control devices as described in Section2.4.3.1. Flue gas desulfurization technologies are categorized as wet, semi-dry, ordry depending on the state of the reagent as it leaves the absorber vessel. Theseprocesses are either regenerable such that the reagent material can be treated and

2-23
reused, or are non-regenerable in which all waste streams are de-watered anddiscarded. Table 2-7 summarizes commercially available post-combustion SO2
control technologies. Wet regenerable FGD processes are attractive because they have the
potential for better than 95 percent sulfur removal efficiency, have minimal waste-water discharges, and produce saleable sulfur product.36 Some of the current non-regenerable calcium based processes can, however, produce a saleable gypsumproduct.
To date, wet systems are the most commonly applied. Wet systems generallyuse alkali slurries as the SOx absorbent medium and can be designed to removegreater than 90 percent of the incoming SOx. Lime/limestone scrubbers, sodiumscrubbers, and dual alkali scrubbing are among the commercially proven wet FGDsystems. The effectiveness of these devices depends not only on control devicedesign but also on operating variables.
The lime and limestone scrubbing process uses a slurry of calcium oxide(CaO) or limestone (CaCO3) to absorb SO2 in a wet scrubber. Control efficiencies inexcess of 91 percent for lime and 94 percent for limestone over extended periodshave been demonstrated.53 The process produces a calcium sulfite and calciumsulfate mixture. Calcium sulfite and calcium sulfate crystals precipitate in a holdtank. The hold tank effluent is recycled to the scrubber to absorb additional SO2. Aslip stream from the hold tank is sent to a solid-liquid separator to removeprecipitated solids. The waste solids, typically 35 to 70 weight percent solids, aregenerally disposed of by ponding or landfill.
Sodium scrubbing processes generally employ a wet scrubbing solution ofsodium hydroxide (NaOH) or sodium carbonate (Na2CO3) to absorb SO2 from theflue gas. Sodium scrubbers are generally limited to smaller sources because of highreagent costs; however, these systems have been installed on industrial boilers upto 125 MW (430 million Btu/hr) thermal input.14 SO2 removal efficiencies of up to96.2 percent have been demonstrated.53 Because the SO2 removal efficiency canvary during load swings and process upsets, a long term mean efficiency of at least91 percent is necessary to comply with the 90 percent NSPS reduction requirementbased on a 30-day rolling average. The operation of the scrubber is characterizedby a low liquid-to-gas ratio [1.3 to 3.4 l/m3 (10 to 25 gal/ft3)] and a sodium alkalisorbent which has a high reactivity relative to lime or limestone sorbents. Thescrubbing liquid is a solution rather than a slurry because of the high solubility ofsodium salts.

2-24
The double or dual alkali system uses a clear sodium alkali solution for SO2
removal followed by a regeneration step using lime or limestone to recover thesodium alkali and produce a calcium sulfite and sulfate sludge. Most of the effluentfrom the sodium scrubber is recycled back to the scrubber, but a slipstream iswithdrawn and reacts with lime or limestone in a regeneration reactor. Theregeneration reactor effluent is sent to a thickener where the solids areconcentrated. The overflow is sent back to the system while the underflow is furtherconcentrated in a vacuum filter (or other device) to about 50 percent solids content. The solids are washed to recover soluble sodium compounds which are returned tothe scrubber. Performance data indicate average SO2 removal efficiencies of 90 to96 percent.14 However, initial reports of long-term operating histories with dual alkaliscrubbing have indicated system reliability averages of only slightly higher than 90percent.54
Spray drying is a dry scrubbing approach to FGD. The technology is bestsuited for low to medium sulfur coals with sulfur contents up to 3 percent, but maybe applied to higher sulfur-content coals. A solution or slurry of alkaline material issprayed into a reaction vessel as a fine mist and contacted with the flue gas for arelatively long period of time (5 to 10 seconds). The SO2 reacts with the alkalisolution or slurry to form liquid phase salts. The slurry is dried by the hot flue gas toabout one percent free moisture. The dried material continues to react with SO2 inthe flue gas to form sulfite and sulfate salts. The spray dryer solids are entrained inthe flue gas and carried out of the dryer to a particulate control device such as anESP or baghouse. Systems using a baghouse for particulate removal reportadditional SO2 capture across the baghouse.
Spray drying is a relatively new FGD technology and extensive large-scalecommercial experience is limited. Vendors have offered commercial guarantees ofup to 90 percent capture on low sulfur (less than 2 percent) coal.14 Pilot data oncalcium-based sorbents have also showed SO2 reduction efficiencies of 90percent.14 Spray drying with sodium-based sorbents should produce greaterremoval efficiencies due to the greater reactivity of sodium hydroxide or sodiumcarbonate compared with lime.
A number of dry and wet sorbent injection technologies are underdevelopment to capture SO2 in the furnace, the boiler sections, or ductworkdownstream of the boiler. These technologies are generally designed for retrofitapplications and are well suited for coal combustion sources requiring moderateSO2. There are commercial applications of furnace sorbent injection in Europe;

2-25
however, the technologies are not yet commercialized in the U.S. The objectives forSO2 removal efficiencies are between 25 and 50 percent.36
2.4.3.3 NOx Control. The injection of ammonia (NH3)- or urea-basedreagents into the furnace or flue gas path for NOx control is considered to be post-combustion control. This process, known as Selective Non-Catalytic Reduction(SNCR), is seeing some commercial application, primarily for industrial FBC boilersin California. In bubbling bed FBCs, the reagent is injected above the bed in thefreeboard space. In circulating bed FBCs, injection occurs just prior to, orsometimes within, the first stage cyclone separator.
The NOx reduction reactions occur in a relatively narrow temperature windowbetween 920 and 1030 °C (1700 to 1900 °F). Because of the typically limitedresidence times available in this temperature range, the reagent must be injected athigh velocity or with steam or air assist in order to achieve good mixing. Poor qualitymixing or excessive reagent use results in emissions of ammonia (slip) in the fluegas. Demonstrated efficiencies for NOx reduction range from 30 to 50 percent forbubbling bed FBCs, and up to 80 percent for circulating bed FBCs at NOx/NH3 molarratios between 2 and 4.55 Reduction efficiencies are apparently higher for circulatingFBCs because of the residence time and intense mixing available in the cyclone.

2-26
TABLE 2-1. U.S. COAL CONSUMPTION BY SECTOR in 19902
SectorTotal Consumption,
103 metric tons (103 short tons)
Electric Utility 701,759 (773,549)
Industrial (Excluding Coke Plants) 69,246 (76,330)
Residential/Commercial 6,100 (6,724)
Total For All Sectors 777,105 (856,603)

2-27
TABLE 2-2. BOILER USAGE BY SECTOR
SectorCapacity,
MWBoilertype Application
Utility >100 Watertube Electricity Generation
Industrial 10-100 Watertube
Watertube
Watertube
Firetube
Firetube
Electricity Generation
Process Steam
Space Heating
Process Steam
Space Heating
Commercial 0.5-10 Watertube
Firetube
Cast Iron
Space Heating
Space Heating
Space Heating
Residential <0.5 Cast Iron Space Heating

2-28
TABLE 2-3. TOTAL 1985 EMISSIONS FROM COAL COMBUSTIONBY USE SECTOR13
Annual emissions, 103 metric tons (103 short tons)
Sector SO2 NOx TSPa VOC
Residential
Commercial/ Institutional
Industrial
ElectricGeneration
Total
27 (30)
126 (139)
1,478 (1,629)
13,427 (14,801)
20,998 (23,146)
1.8 (2)
26 (29)
513 (565)
5,084 (5,604)
18,635 (20,541)
10 (11)
15 (17)
102 (112)
432 (476)
7,605 (8,383)
7 (8)
0.9 (1)
5 (6)
26 (29)
20,024 (22,073)
a Total suspended particulate.

2-29
TABLE 2-4. NSPS SUMMARY FOR FOSSIL FUEL-FIRED BOILERS
Standard
Boilersize,MWt
(million Btu/hr) Fuel
PM,ng/J
(lb/million Btu)[% reduction]
SO2,ng/J
(lb/million Btu)[% reduction]
NOx,ng/J
(lb/million Btu)[% reduction]
Subpart D
Boilers BuiltAfter8/17/1971
>73(>250)
Gas
Oil
Bit. & Subbit.Coal
43(0.10)
43(0.10)
43(0.10)
NA
340(0.80)
520(1.20)
86(0.20)
129(0.30)
300(0.70)
Subpart Da
Boilers BuiltAfter9/18/1978
>73(>250)
Gas
Oil
Bit. & Subbit.Coal
13(0.03)[NA]
13(0.03)[70]
13(0.03)[99]
340(0.80)[90]a
340(0.80)[90]a
520(1.20)[90]b
86(0.20)[25]
130(0.30)[30]
260c
(0.60)[65]
Subpart Db
Industrial-Commercial-Institutional
Boilers BuiltAfter6/19/1984
29 - 73(100 - 250)
Gas
DistillateOil
Residual Oil
PulverizedBit. & Subbit.
Coal
Spreader Stoker& FBC
Mass-FeedStoker
NAd
43(0.10)
(same as fordistillate oil)
22e
(0.05)
22e
(0.05)
22e
(0.05)
NAd
340(0.80)[90]
(same as fordistillate oil)
520e
(1.20)[90]
520e
(1.20)[90]
520e
(1.20)[90]
43f
(0.10)
43f
(0.10)
130g
(0.30)
300(0.70)
260(0.60)
210(0.50)
Subpart Dc
SmallIndustrial-Commercial-Institutional
Boilers BuiltAfter 6/9/1989
2.9 - 29(10 - 100)
Gas
Oil
Bit. & Subbit.Coal
NAh
NAh,i
22i,j
(0.05)
NA
215(0.50)
520(1.20)[90]
NAh
NAj
NAj

2-30
Footnotes For Table 2-4a70 percent reduction when emissions are less than 260 ng/J (0.60 lb/million Btu).bZero percent reduction when emissions are less than 86 ng/J (0.20 lb/million Btu)c210 ng/J (0.50 lb/million Btu) for subbituminous coaldStandard applies when gas is fired in combination with oil or coal, see 40 CFR 60, Subpart Db.eStandard is adjusted for fuel combinations and capacity factor limits, see 40 CFR 60, Subpart DbfFor furnace heat release rates greater than 730,000 J/s-m3 (70,000 Btu/hr-ft3), the standard is 86 ng/J (0.20 lb/million Btu)gFir furnace heat release rates greater than 730,000 J/s-m3 (70,000 Btu/hr-ft3), the standard is 170 ng/J (0.40 lb/million Btu)hStandard applies when gas or oil is fired incombination with coal, see 40 CFR 60, Subpart Dci20 percent opacity limit applies for heat input capacities of 8.7 MWt(30 million Btu/hr) or greaterjStandard is adjusted for fuel combinations and capacity factor limits, see 40 CFR 60, Subpart Dc

TABLE 2-5. COMMERCIALLY AVAILABLE NOx CONTROL TECHNIQUES FOR PULVERIZED COAL-FIRED BOILERS
Control technique Description of techniqueEffectiveness of control,
% NOx reduction Range of applicationCommercialavailability/R&D status Comments
Low Excess Air (LEA) Reduction of combustion air 0-25 (avg. 9) Excess oxygen reduced to5.2% on the average.
Available. Added benefits of technique includeincrease in boiler efficiency, limited byincrease in CO. HC and smoke emissions.
Burners out of service(BOOS)
One or more burners on aironly. Remainder firing fuelrich.
27-39 (avg. 33) Applicable only for boilerswith minimum of 4 burners.
Available. However,extensive engineeringwork necessary beforeimplementation.
Limited by the number of burnersavailable. Load reduction required in mostcases. Possible increased slagging,corrosion.
Overfire air injection (OFA) Secondary air from OFAports above fuel rich firingburners.
5-30 Burner stoichiometry as lowas 100%.
Commercially offered butnot demonstrated forindustrial size boilers.
Requires installation of OFA ports, etc. Possible increased slagging, corrosion.
Flue gas recirculation (FGR)Recirculation of flue gas toburner windbox.
0-20 Up to 25% of the flue gasrecirculated.
Not offered becauserelatively ineffective.
Requires installation of FGR ducts, fan,etc. Can cause combustion instability. Burner windbox may need extensivemodifications.
Low NOx burner (LNB)a New burner designedutilizing controlled air-fuelmixing.
45-60 Prototype LNB limited tosize ranges above 29 MW(100 x 106 Btu/h)
Still in the developmentstage. Prototype LNBavailable from major boilermfrs.
Active R&D efforts underway.
Ammonia injection (SNCR) Injection of NH3 inconvective section of boiler.
40-60 Limited by furnacegeometry. NH3 injection ratelimited to 1.5 NH3/NO.
Commercially offered butnot demonstrated.
Elaborate NH3 injection, monitoring, andcontrol system required. Possible loadrestrictions on boiler and air preheaterfouling by ammonium bisulfate.
Reduced load (RL) Reduction of fuel and airflow to the boiler.
Varies from 45% reductionto 4% increase in NOx
Applicable to all boilers. Load can be reduced to 25%of capacity.
Available now but notimplemented because ofadverse operationalimpacts.
Load reduction often not effective becauseof increase in excess O2. Bestimplemented with increase in furnace sizefor new boilers.
aLow NOx burners are the minimum control technology required for NOx emissions from PC-fired utility boilers.

2-32
TABLE 2-6. COMMERCIALLY AVAILABLE NOx CONTROL TECHNIQUES FOR STOKER COAL-FIRED BOILERS
Control technique Description of techniqueEffectiveness of control,% NOx reduction Range of application
Commercialavailability/R&D status Comments
Low Excess Air (LEA) Reduction of air flow understoker bed
5-25 Excess oxygen limited to 5-6% minimum.
Available now but needR&D on lower limit ofexcess air.
Danger of overheating grate, clinkerformation, corrosion, and high COemissions.
Staged combustion(LEA + OFA)
Reduction of undergrate airflow and increase of overfireair flow.
5-25 Excess oxygen limited to 5%minimum.
Most stokers have OFAports as smoke controldevices but may needbetter air flow controldevices.
Need research to determine optimallocation and orientation of OFA ports forNOx emission control. Overheating grate,corrosion, and high CO emission can occurif undergrate airflow is reduced belowacceptable level as in LEA.
Load reduction (LR) Reduction of coal and airfeed to the stoker.
Varies from 49% decreaseto 25% increase in NOx(average 15% decrease).
Has been used down to 25%load.
Available. Only stokers that can reduce load withoutincreasing excess air. Not a desirabletechnique because of loss in boilerefficiency.
Reduced air preheat (RAP)Reduction of combustion airtemperature.
8 Combustion air temperaturereduced from 473K to 453K.
Available now if boiler hascombustion air heater.
Not a desirable technique because of lossin boiler efficiency.
Ammonia injection Injection of NH3 inconvective section of boiler.
40-60 (from gas- and oil-fired boiler experience).
Limited by furnacegeometry. Feasible NH3injection rate limited to 1.5NH3/NO.
Commercially offered butnot yet demonstrated.
Elaborate NH3 injection, monitoring, andcontrol system required. Possible loadrestrictions on boiler and air preheaterfouling by ammonium bisulfate.
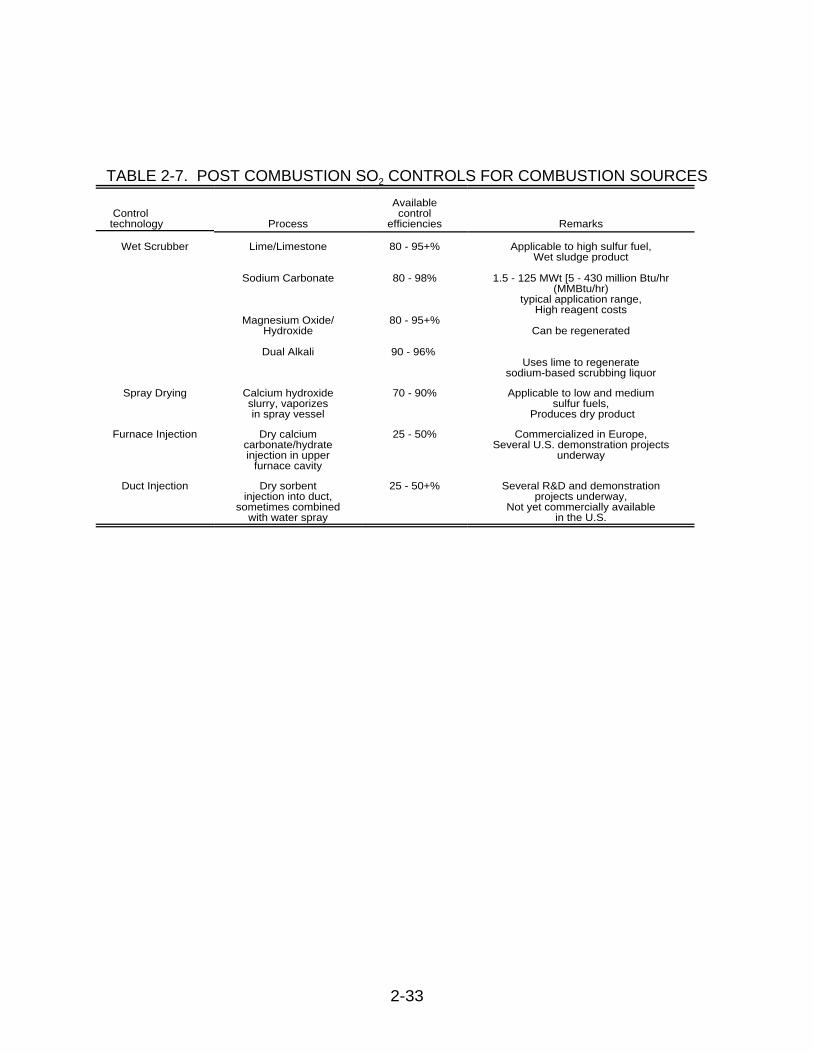
2-33
TABLE 2-7. POST COMBUSTION SO2 CONTROLS FOR COMBUSTION SOURCES
Control technology Process
Availablecontrol
efficiencies Remarks
Wet Scrubber Lime/Limestone
Sodium Carbonate
Magnesium Oxide/Hydroxide
Dual Alkali
80 - 95+%
80 - 98%
80 - 95+%
90 - 96%
Applicable to high sulfur fuel,Wet sludge product
1.5 - 125 MWt [5 - 430 million Btu/hr(MMBtu/hr)
typical application range,High reagent costs
Can be regenerated
Uses lime to regeneratesodium-based scrubbing liquor
Spray Drying Calcium hydroxideslurry, vaporizesin spray vessel
70 - 90% Applicable to low and mediumsulfur fuels,
Produces dry product
Furnace Injection Dry calciumcarbonate/hydrateinjection in upper
furnace cavity
25 - 50% Commercialized in Europe,Several U.S. demonstration projects
underway
Duct Injection Dry sorbentinjection into duct,
sometimes combinedwith water spray
25 - 50+% Several R&D and demonstrationprojects underway,
Not yet commercially availablein the U.S.


2-43
REFERENCES FOR CHAPTER 2
1. Steam, 40th Edition, Babcock and Wilcox, New York, 1992.
2. Monthly Energy Review, DOE/EIA-0035(92/04), Energy InformationAdministration, U. S. Department of Energy, Washington, DC, April 1992.
3. Devitt, T. Population and Characteristics of Industrial/Commercial Boilers inthe U.S., EPA-600/7-79-178a, U.S. Environmental Protection Agency,Research Triangle Park, NC, August 1979.
4. Lim, K.J. et al., Industrial Boiler Combustion Modification NOx Controls -Volume I Environmental Assessment, EPA-600/7-81-126a, U.S. EPA, July1981.
5. Emissions Assessment of Conventional Stationary Combustion Systems:Volume V Industrial Combustion Sources, EPA-600/7-81-003c, U.S. EPA,April 1981.
6. "Boilers and Auxiliary Equipment", Power Magazine, June 1988.
7. Lorelli, J and C. Castaldini, "Fluidized-Bed Combustion Boilers MarketAssessment," Acurex Corporation, August 1991.
8. U.S. Environmental Protection Agency, "National Primary and SecondaryAmbient Air Quality Standards," Code of Federal Regulations, Title 40, Part50, U.S. Government Printing Office, Washington DC, 1991.
9. Code Of Federal Regulations Notice (Title 40, Part 60, Subpart D): "Standards Of Performance For Electric Utility Steam Generating Units forWhich Construction is Commenced After August 17, 1971", 40 CFR 60.D.
10. Code Of Federal Regulations Notice (Title 40, Part 60, Subpart Da): "Standards Of Performance For Electric Utility Steam Generating Units forWhich Construction is Commenced After September 18, 1978", 40 CFR60.Da.
11. Code Of Federal Regulations Notice (Title 40, Part 60, Subpart Db): "Standards Of Performance For Industrial-Commercial-Institutional SteamGenerating Units", 40 CFR 60.Db.
12. Code Of Federal Regulations Notice (Title 40, Part 60, Subpart Dc): "Standards Of Performance For Small Industrial-Commercial-InstitutionalSteam Generating Units", 40 CFR 60.Dc.
13. Ray, S.S. and F.G. Parker, Characterization of Ash from Coal-Fired PowerPlants, EPA-600/7-77-010, U.S. Environmental Protection Agency,Washington DC, January 1977.
14. Fossil Fuel Fired Industrial Boilers - Background Information: Volume 1, EPA-450/3-82-006a, U.S. Environmental Protection Agency, Research TrianglePark, NC, March 1982.

2-44
15. Cato, G.A. et al., Field Testing: Application of Combustion Modifications toControl Pollutant Emissions from Industrial Boilers, Phase II, EPA-600/2-76-086a, U.S. EPA, April 1976.
16. Maloney, K.L. et al., Low-Sulfur Western Coal Use in Existing Small andIntermediate Size Boilers, EPA-600/7-78-153a, U.S. Environmental ProtectionAgency, Research Triangle Park, NC, July 1978.
17. Lim, K.J. et al., Technology Assessment Report for Industrial BoilerApplications: NOx Combustion Modification, EPA-600/7-79-178f, U.S.Environmental Protection Agency, Research Triangle Park, NC, December1979.
18. Pershing, D.W. et al., Influence of Design Variables on the Production ofThermal and Fuel NO from Residual Oil and Coal Combustion, Air: Control ofNOx and SOx Emissions, New York, American Institute of ChemicalEngineers, 1975.
19. Evaluation and Costing of NOx Controls for Existing Utility Boilers in theNESCAUM Region, EPA Contract No. 68-D9-0131, WA I-19, (Draft Report),Acurex Environmental, Mountain View, CA, September 1991.
20. Muzio, L. European Workshop on N2O Emissions, Lneti, Lisbon, Portugal,June 6-8, 1990.
21. Takahisha, Y. and S. Nishinomiya, "N2O Emissions from Fossil Fuel FiredPower Plants," Environmental Science and Technology, Vol. 25, No. 2, 1991.
22. Eleventh International Conference on Fluidized Bed Combustion, MontrealCanada, April 21-24, 1991.
23. Hiltunem, M. "N2O Emissions from CFB Boilers: Experimental Results andChemical Interpretation," Pyropower, 1990.
24. Clayton, R. et al., N2O Field Study, EPA-600/2-89-006, U.S. EnvironmentalProtection Agency, Research Triangle Park, NC, February 1989.
25. Memorandum from James Southerland, U.S. Environmental ProtectionAgency, Research Triangle Park, NC, to Contractor Project Managers for AP-42 Chapter Update, April 24, 1992.
26. Particulate Polycyclic Organic Matter, Nation Academy of Sciences,Washington, DC, 1972.
27. Vapor Phase Organic Pollutants -- Volatile Hydrocarbons and OxidationProducts, National Academy of Sciences, Washington, DC, 1976.
28. Knierien, H. A Theoretical Study of PCB Emissions from Stationary Sources,EPA-600/7-76-028, U.S. Environmental Protection Agency, ResearchTriangle Park, NC, September 1976.
29. Estimating Air Toxics Emissions From Coal and Oil Combustion Sources,EPA-450/2-89-001, U.S. U.S. Environmental Protection Agency, ResearchTriangle Park, NC, April 1989.
2-45
30. Hangebrauck, R.P., D.J. Von Lehmden, and J.E. Meeker, "Emissions ofPolynuclear Hydrocarbons and Other Pollutants from Heat-Generation andIncineration Process", J. Air Pollution Control Assoc, 14: 267-278, 1964.
31. Rogozen, M.B. et al., Formaldehyde: A Survey of Airborne Concentration andSources, California Air Resources Board, ARB report no. ARB/R-84-231,1984.
32. Clean Air Act Amendments of 1990, Conference Report To Accompany S.1603, Report 101-952, U.S. Government Printing Office, Washington, DC,October 26, 1990.
33. Klein, D.H. et al., "Pathways of Thirty-Seven Trace Elements Through Coal-Fired Power Plants", Environ. Sci. Technol., 9: 973-979, 1975.
34. Coles, D.G. et al., "Chemical Studies of Stack Fly Ash From a Coal-FiredPower Plant", Environ. Sci. Technol., 13: 455-459, 1979.
35. Baig, S. et al., Conventional Combustion Environmental Assessment, EPAContract No. 68-02-3138, U.S. Environmental Protection Agency, ResearchTriangle Park, NC, 1981.
36. South, D.W. et al., Technologies and Other Measures For ControllingEmissions: Performance, Costs, and Applicability, Acidic Deposition: State ofScience and Technology, Volume IV, Report 25, National Acid PrecipitationAssessment Program, U.S. Government Printing Office, Washington, DC,December 1990.
37. Buroff, J. et al., Technology Assessment for Industrial Boiler Applications: Coal Cleaning and Low Sulfur Coal, EPA-600/7-79-178c, U.S. EnvironmentalProtection Agency, Research Triangle Park, NC, December 1979.
38. Gluskoter, H.J. et al., Trace Elements in Coal: Occurrence and Distribution,EPA-600/7-77-064, U.S. Environmental Protection Agency, ResearchTriangle Park, NC, 1977.
39. Danielson, J.A. (ed.), Air Pollution Engineering Manual, Second Edition, AP-40, U.S. Environmental Protection Agency, Research Triangle Park, NC,1973.
40. Barrett, R.E. et al., Field Investigation of Emissions from CombustionEquipment for Space Heating, EPA-R2-73-084a, U.S. EnvironmentalProtection Agency, Research Triangle Park, NC, June 1973.
41. Bartok, W. et al., Systematic Field Study of NOx Emission Control Methods forUtility Boilers, APTD-1163, U.S. Environmental Protection Agency, ResearchTriangle Park, NC, December 1971.
42. Crawford, A.R. et al., Field Testing: Application of Combustion Modificationsto Control NOx Emissions from Utility Boilers, EPA-650/2-74-066, U.S.Environmental Protection Agency, Washington, DC, June 1974.
43. Govan, F.A. et al., "Relationships of Particulate Emissions Versus Partial toFull Load Operations for Utility-sized Boilers", Proceedings of the Third

2-46
Annual Industrial Air Pollution Control Conference, Knoxville, TN, March 29-30, 1973.
44. Hall, R.E. et al., A Study of Air Pollutant Emissions from Residential HeatingSystems, EPA-650/2-74-003, U.S. Environmental Protection Agency,Washington, DC, January 1974.
45. Pohl, J.H. and A.F. Sarofim, Devolatilization and Oxidation of Coal Nitrogen(presented at the 16th International Symposium on Combustion), August1976.
46. Pershing, D.W. and J. Wendt, Relative Contribution of Volatile and CharNitrogen to NOx Emissions From Pulverized Coal Flames, IndustrialEngineering Chemical Proceedings, Design and Development, 1979.
47. Pershing, D.W. Nitrogen Oxide Formation in Pulverized Coal Flames, Ph.D.Dissertation, University of Arizona, 1976.
48. Nutcher, P.B. High Technology Low NOx Burner Systems for Fired Heatersand Steam Generators, Process Combustion Corp., Pittsburgh, PA.Presented at the Pacific Coast Oil Show and Conference, Los Angeles, CA,November 1982.
49. EPRI CS-5040, "Precipitator Performance Estimation Procedure", preparedby Southern Research Institute, February 1987 (AP-42 #208))
50. Roeck, D.R. and R. Dennis, Technology Assessment Report for IndustrialBoiler Applications: Particulate Collection, EPA-600/7-79-178h, U.S.Environmental Protection Agency, Research Triangle Park, NC, December1979.
51. Determination of the Fractional Efficiency, Opacity Characteristics,Engineering, and Economics of a Fabric Filter Operating of a Utility Boiler,EPRI Report FP-297, Electric Power Research Institute, Palo Alto, CA.
52. Overview of the Regulatory Baseline, Technical Basis, and Alternative ControlLevels for Particulate Matter (PM) Emissions Standards for Small SteamGenerating Units, EPA-450/3-89-11, U.S. Environmental Protection Agency,Research Triangle Park, NC, May 1989.
53. Overview of the Regulatory Baseline, Technical Basis, and Alternative ControlLevels for Sulfur Dioxide (SO2) Emissions Standards for Small SteamGenerating Units, EPA-450/3-89-12, U.S. Environmental Protection Agency,Research Triangle Park, NC, May 1989.
54. EPA Industrial Boiler FGD Survey: First Quarter 1979, EPA-600/7-79-067b,U.S. Environmental Protection Agency, Research Triangle Park, NC, April1979.
55. State-of-the-Art Analysis of NOx/N2O Control for Fluidized Bed CombustionPower Plants, EPRI Contract No. RP3197-02, Acurex Report No. 90-102/ESD, Acurex Environmental, Mountain View, CA, July 1990.
56. Gaglia, B.N. and A. Hall (Gilbert/Commonwealth, Inc.). Comparison ofBubbling and Circulating Fluidized Bed Industrial Steam Generation.

2-47
Proceedings of the 1987 International Conference on Fluidized BedCombustion. The American Society of Mechanical Engineers/Electric PowerResearch Institute/Tennessee Valley Authority. New York, NY, 1987.
57. Industrial Boiler Co., Inc. Fusion Welded Horizontal Return Tubular Boiler toASME Code. Industrial Boiler Co., Inc. Thomasville, GA, Bulletin No. F3350.
58. Industrial Boiler Co., Inc. Pacemaker II. Industrial Boiler, Inc. Thomasville,GA. Bulletin No. F2350 R1. December, 1987.
59. Cleaver Brooks. Packaged Watertube Steam Boilers. Cleaver Brooks. Milwaukee, WI. Bulletin No. CBW-227 R9. July, 1987.
60. Cleaver Brooks. CB Packaged Boilers. Cleaver Brooks. Milwaukee, WI. Bulletin No. CBF-178 R11. December, 1986.
61. W.R. Seeker, et. al., Municipal Waste Combustion Study: Combustion ofMSW Combustors to Minimize Emissions of Trace Organics, EPA-530-SW-87-021c, U.S. Environmental Protection Agency, Research Triangle Park, NC,May 1987.
62. S.W. Brown and R.W. Borio, Gas Reburn System Operating Experience on aCyclone Boiler, Presented at the NOx Controls for Utility Boilers Conference,Cambridge, MA, July 1992.

3-1
3. GENERAL EMISSION DATA REVIEW AND ANALYSIS PROCEDURE
3.1 CRITERIA POLLUTANTS3.1.1 Literature Search
The first step in this revision and update involved an extensive literaturesearch to identify sources of criteria (non-criteria) pollutant emissions dataassociated with bituminous and subbituminous coal combustion. This searchincluded:
! Existing AP-42 background files;
! Files maintained by EPA's Emission Standards Division and EmissionFactor and Methodologies Section of the Office of Air Quality Planningand Standards (OAQPS);
! PM-10 documents;
! NSPS Background Information Documents;
! Various EPA emissions assessment and control technology reports;
! National Technical Information Service (NTIS) holdings;
! Reports from industry organizations including the Electric PowerResearch Institute (EPRI) and API;
! Various on-line computerized data bases and search services;
! EPA contractor reports; and
! Contractor in-house files.
A summary of these information sources is given in Table 3-1.3.1.2 Literature Evaluation
To reduce the large amount of available literature to a final group ofreferences pertinent to this task, the following general criteria were used:
1. Emissions data must be from a well documented reference;
2. The referenced study must contain results based on more than one testrun; and

3-2
3. The report must contain sufficient data to evaluate the testing procedures and source operating conditions.
Employing these criteria in a thorough review of the reports, documents, andinformation, a final set of reference materials was compiled. The data contained inthis final set of references were then subjected to a thorough quality and quantityevaluation to determine their suitability for use in emission factor calculations. Checklists were employed to facilitate and document this evaluation. The completedchecklists were placed in the background files for this AP-42 update. Data with thefollowing characteristics were excluded from further consideration:
1. Test series averages reported in units that cannot be converted to theselected reporting units;
2. Test series representing incompatible test methods (i.e., comparison ofEPA Method 5 front-half with EPA Method 5 front-and back-half);
3. Test series of controlled emissions for which the control device is notspecified;
4. Test series in which the source or control process is not clearlyidentified and described; and
5. Test series in which it is not clear whether the emissions weremeasured before or after the control device.
Data sets that were not excluded were assigned a quality rating. The ratingsystem used was that specified in the draft EPA document, "Technical ProceduresFor Developing AP-42 Emission Factors And Preparing AP-42 Sections" (March 6,1992). The data were rated as follows:
A: Multiple tests performed on the same source using sound methodologyand reported in enough detail for adequate validation. These tests arenot necessarily EPA reference method tests, although such referencemethods are preferred and certainly to be used as a guide.
B: Tests that were performed by a generally sound methodology but lackenough detail for adequate validation.
C: Tests that were based on an untested or new methodology or thatlacked a significant amount of background data.
D: Tests that were based on a generally unacceptable method but mayprovide an order-of-magnitude value for the source.
The following criteria were used to evaluate source test reports for soundmethodology and adequate detail:

3-3
1. Source operation. The manner in which the source was operated iswell documented in the report. The source was operating within typicalparameters during the test.
2. Sampling procedures. The sampling procedures conformed togenerally acceptable methodology. If actual procedures deviated fromaccepted methods, the deviations are well documented. When thisoccurred, an evaluation was made of the extent such alternativeprocedures could influence the test results.
3. Sampling and process data. Adequate sampling and process data aredocumented in the report. Many variations can occur unnoticed andwithout warning during testing. Such variations can induce widedeviations in sampling results. If a large spread between test resultscannot be explained by information contained in the test report, thedata are suspect and given a lower rating.
4. Analysis and calculations. The test reports contain original raw datasheets. The nomenclature and equations used were compared tothose (if any) specified by EPA to establish equivalency. The depth ofreview of the calculations was dictated by the reviewer's confidence inthe ability and conscientiousness of the tester, which in turn was basedon factors such as consistency of results and completeness of otherareas of the test report.
In most cases, emissions data were obtained from original sourceassessment or source test reports. In addition, there is a large body of data thathave been summarized by EPA in background documents, emissions assessmentreports, and control technology reports.
These reports were used to support regulatory development efforts, controltechnology determinations, permitting, and for setting further research priorities. Because of their intended usage, the data contained in these reports have beenproduced under rigorous quality assurance/quality control procedures and, beforebeing summarized, have undergone data quality review by EPA. Because of theseprocedures, emissions data were taken directly from the summary reports for inputinto the emission factor calculations. The data taken from these reports wereassigned a "B" quality rating. This rating was given to reflect the fact that testingfollowed EPA reference methods or otherwise sound methodology; however, thesummary reports do not contain enough raw data to verify the data reductioncalculations. To supplement the summary report information, orders were placed forcopies of the original test reports cited in the summary reports. These test reports,when received, were placed in the background files.3.1.3 Emission Factor Quality Rating
In each AP-42 section, tables of emission factors are presented for eachpollutant emitted from each of the emission points associated with the source. The

3-4
reliability or quality of each of these emission factors is indicated in the tables by anoverall Emission Factor Quality Rating ranging from A (excellent) to E (poor). Theseratings incorporate the results of the above quality and quantity evaluations on thedata sets used to calculate the final emission factors. The overall Emission FactorQuality Ratings are described as follows:
A--Excellent: Developed only from A-rated test data taken from manyrandomly chosen facilities in the industry population. The source category isspecific enough so that variability within the source category population maybe minimized.
B--Above average: Developed only from A-rated test data from a reasonablenumber of facilities. Although no specific bias is evident, it is not clear if thefacilities tested represent a random sample of the industries. As in the A-rating, the source category is specific enough so that variability within thesource category population may be minimized.
C--Average: Developed only from A- and B-rated test data from a reasonablenumber of facilities. Although no specific bias is evident, it is not clear if thefacilities tested represent a random sample of the industry. As in the A-rating,the source category is specific enough so that variability within the sourcecategory population may be minimized.
D--Below average: The emission factor was developed only from A- and B-rated test data from a small number of facilities, and there is reason tosuspect that these facilities do not represent a random sample of the industry. There also may be evidence of variability within the source categorypopulation. Limitations on the use of the emission factor are noted in theemissions factor table.
E--Poor: The emission factor was developed from C- and D-rated test data,and there is reason to suspect that the facilities tested do not represent arandom sample of the industry. There also may be evidence of variabilitywithin the source category population. Limitations on the use of these factorsare always noted.
The use of these criteria is somewhat subjective and depends to an extent onthe individual reviewer. Details of the rating of each candidate emission factor areprovided in Chapter 4 of this report.3.2 SPECIATED VOCs3.2.1 Literature Search
An extensive literature search was conducted during this revision to identifysources of speciated VOC emissions data associated with coal fired boilers. Somespecific areas of search include Tennessee Valley Authority, Electric PowerResearch Institute (EPRI)/PISCES, EPA/Air and Waste Mangement Association(AWMA) Air Toxics Symposia, and Toxic Air Pollutants: State and Local RegulatoryStrategies 1989. The details of the literature search are summarized in Table 3-2.

3-5
3.2.2 Literature EvaluationUntil recently, little concern existed for VOC speciation on stationary external
sources. Nearly all organics sampling was focused on semi-volatile compounds. Reliable methods for volatile organics sampling and analysis to low levels have onlybeen developed since the late 1980's. Therefore, available data for VOC speciationwere sparse, limiting this data evaluation essentially to the OAQPS databases, theVOC/PM Speciation Data System (SPECIATE) and the Crosswalk/Air ToxicEmission Factor data base (XATEF), and their references. 3.2.3 Data and Emission Factor Quality Rating
The ratings of emission factors in SPECIATE and XATEF should not be usedwithout first reviewing primary sources of numerical data against the criteriapresented in Chapter 3.1. The quality of the data is insufficient to satisfy therequirements for assignment of an emission factor, therefore, the data are unratableor, at best, "E" rated.3.3 AIR TOXICS3.3.1 Literature Search When possible, primary references were obtained in order to calculate orverify emission factors presented. Many of the data evaluated were not of suitablequality for developing emission factors and were therefore, eliminated for use in thisupdate.
A literature search was conducted using the Dialog Information RetrievalService. This is a broad-base data retrieval system that has access to over 400data bases. Specifically for the air toxics search, six data bases were queried bykey words relating to the processes and chemicals of concern. The data basesaccessed were: NTIS, COMPENDEX PLUS, POLLUTION ABSTRACT,CONFERENCE PAPERS, ENERGY SCIENCE & TECHNOLOGY, and EPRI. Thelist of literature generated from the search was evaluated for applicability and therelevant documents were obtained.
Searches of EPA's air toxics data bases were also performed. These databases include XATEF and SPECIATE, and the Air Chief CD ROM which containsadditional data in conjunction with XATEF and SPECIATE. The computer searcheswere performed by source category code (SCC) for all boiler sizes and types thatare fired on coal. The reference numbers were recorded for each of the "hits" andthese references were obtained for review.
Various air pollution control districts (APCDs) located in California werecontacted to obtain air toxics data collected under California Assembly Bill 2588: AirToxics "Hot Spots" Information and Assessment Act of 1987. This bill requires
3-6
reporting of emissions of a specified list of air toxic compounds. The followingAPCDs were contacted by phone and with a written information request: Bay Area,South Coast, Fresno County, North Coast Unified, Sacramento Metropolitan, SanJoaquin County, Ventura County, Calaveras County, Lake County, Lassen County,Santa Barbara, San Diego, Kern County, and the California Air Resources Board.
Several industry and non-agency sources were also contacted in order toobtain source test data for development of emission factors. These include theWestern States Petroleum Association (WSPA), the Canadian Electrical Association(CEA), the Ontario Ministry of the Environment and KEMA of the Netherlands. 3.3.2 Literature Evaluation for Air Toxics
The references obtained from the literature search were evaluated for theirapplicability for generating emission factors. Table 3-3 summarizes the datasources and indicates which sources were used in generating the emission factorsand which sources were eliminated from use. The table contains a referencenumber which corresponds to the list of references provided at the end of thissection. The references are evaluated and discussed in greater detail in Section4.3.1. The criteria used to perform this evaluation are discussed in detail in Section3.3.3.3.3.3 Data and Emission Factor Quality Rating Criteria
Emissions data used to calculate emission factors are obtained from manysources such as published technical papers and reports, documented emissions testresults, and regulatory agencies such as local air quality management districts. Thequality of these data must be evaluated in order to determine how well thecalculated emission factors represent the emissions of an entire source category. Data sources may vary from single source test runs to ranges of minimum andmaximum values for a particular source. Some data must be eliminated all togetherdue to their format or lack of documentation. Factors such as the precision andaccuracy of the sampling and analytical methods and the operating and designspecifications of the unit being tested are key in the evaluation of data viability.
The first step in evaluating a data report is to determine whether the source isa primary or secondary source. A primary source is that which reports the actualsource test results while a secondary source is one that references a data report. Many of the sources referenced by XATEF, SPECIATE, and the CD ROM aresecondary or tertiary sources. Preferably only primary sources were used in thedevelopment of emission factors. When there was not time in this work effort toobtain or evaluate the primary sources, data were taken from a secondary referenceif it appeared that an adequate evaluation of the data was performed.

3-7
The primary source reports are evaluated to determine if sufficient informationis included on the device of interest and on any abatement equipment associatedwith the device. General design parameters such as boiler size, firing configuration,atypical design parameters, fuel type, operating parameters during the test, e.g.load, are all required in order to evaluate the quality of the data. Data on the typeand number of samples, sampling and analytical methods used, sampling locations,quality control samples and procedures, modifications to methods, fuel compositionand feed rates, etc. are also needed. Sufficient documentation to determine howthe data were reduced and how emissions estimates were made are required. Thisdocumentation should include sample calculations, assumptions, correction factors,etc. Equivalent information for the abatement device(s) must also be included.
When primary data could not be obtained in the time frame of this initialupdate, secondary sources were evaluated to determine the representativeness ofthe emission factors to a source category. A judgement of the quality of the authors'analysis of the primary data was made in this case which automatically warrants alower quality rating for the emission factor. The secondary sources provide at leastan order of magnitude estimate of emissions and possibly better, however, thiscannot be evaluated without reviewing the primary data. Ideally primary data wouldbe used for development for all emission factors.3.4 N2O3.4.1 Literature Search
An extensive literature search was conducted during this revision to identifysources of N2O emissions data associated with coal fired boilers. Some specificareas of search included European N2O Workshop, Atmospheric Energy andEnvironmental Research Laboratory (AEERL), Combustion and Flame, Journal ofGeophysical Research, International Conference of Fluidized Bed Combustion, andAWMA. The details of the literature search are summarized in Table 3-4.3.4.2 Literature Evaluation
Alterations to the literature evaluation process for N2O were made to allow theinclusion of sufficient data to calculate emission factors. Data were evaluated evenif they failed one or more questions on the test report exclusion criteria checklistdescribed in Section 3.1.2. In addition to the prescribed evaluation, the data werealso evaluated for N2O sampling method.3.4.3 Data and Emission Factor Quality Rating
Data obtained through the literature search, except that derived from on-lineN2O analysis with gas chromotography/electron capture detection (GC/ECD), wererated C or poorer, because the data were based on untested or new methodology

3-8
that lacked sufficient background data. A problem has been identified in using grabsampling techniques measuring N2O emissions from coal combustion. Storingcombustion products in grab samples containing SO2, NOx and water for periods asshort as 1 hour can lead to the formation of several hundred parts per million (ppm)of N2O where none originally existed. Presented below are some improvedmethodologies for N2O sampling and analysis and their relative effects on dataquality ratings:
! On-line N2O analysis with GC/ECD (preferred method)
! Grab samples
— Removing H2O - drying the sample reduces the most importantreactant, but may not entirely eliminate N2O formation.
— Removing SO2 - scrubbing the sample through NaOH solution.
— A combination of the two (second preference)
The emission factor for pulverized coal-fired boilers was calculated with Brated data. Of the data reported, eighty percent of the values used to calculate theemission factor were below the detection limit of the analytical instrument. Therefore, the emission factor was assigned a D quality rating.
The emission factor for fluidized bed combustors was developed from D ratedtest data. Because the data were not recorded with an on-line GC/ECD N2Oanalysis and the tested facilities are not representative of the industry, the emissionfactor received an E rating.3.5 FUGITIVES
A literature search was conducted on fugitive emissions as described insection 3.1.1. A literature evaluation and data rating was not conducted for coalstorage and handling operations, because those fugitive emissions are covered insub-sections of AP-42 Chapter 11. The fly ash handling operations in most modernutility and industrial combustion sources consist of pneumatic systems or enclosedand hooded systems which are vented through small fabric filters or other dustcontrol devices. The fugitive particulate matter emissions from these systems aretherefore minimal. Fugitive particulate emissions can sometimes occur duringtransfer operations from silos to trucks or rail cars. Particulate matter emissionfactors resulting from these operations can be developed using the procedures inAP-42 Chapter 11.3.6 PARTICLE SIZE DISTRIBUTION3.6.1 Literature Search

3-9
The literature search emphasized filling the perceived gaps in the previousupdates. Updates to AP-42 are supposed to report PM-10 emissions as the sum ofthe in-stack filterable particulate and the organic and inorganic CPM. Upon reviewof the 1988 AP-42 update of particulate sizing emission data, the largest gapappeared to be the lack of CPM data.
The background files for the 1988 AP-42 update were reviewed. A Dialogdata base search was conducted, focussing on reports issued since 1980. Basedon the results of the Dialog search, NTIS documents, EPA reports, and conferenceproceedings were ordered and journal articles were collected. Conferencesymposia that were searched included the Eighth and Ninth Particulate ControlSymposia and the Air and Waste Management Association Conferences for 1988through 1991.
The following PM-10 "gap filling" documents were examined (with resultsindicated):
! "PM-10 Emission Factor Listing Developed by Technology Transfer"(EPA-450/4-89-022): The factors presented for bituminous coal camefrom AP-42.
! "Gap Filling PM-10 Emission Factors for Selected Open Area DustSources" (EPA-450/88-003): Not applicable to stationary sourcecombustion.
! "Generalized Particle Size Distributions for Use in Preparing SizeSpecific Particulate Emission Inventories" (EPA-450/4-86-013): Liststhe average collection efficiencies of various particulate control devicesfor different size fractions. This was the source of the overall collectionefficiency estimates for the 1986 PM-10 update of AP-42 Chapter 1.
The following regional EPA offices and state and regional air pollution control boardswere contacted:
! EPA Region 2
! EPA Region 3
! EPA Region 4
! EPA Region 5
! California Air Resources Board: Stationary Sources Division,Monitoring and Laboratory Division, and the Compliance Division
! Illinois Air Pollution Control
! New York Air Pollution Control
! New Jersey Air Pollution Control

3-10
! Bay Area Air Quality Management District (CA)
! Kern County Air Pollution Control District (CA)
! Stanislaus County Air Pollution Control District (CA)
! San Joaquin County Air Pollution Control District (CA)
The primary source of the particulate size distribution data for the previousAP-42 update was the Fine Particulate Emissions Information System (FPEIS). TheFPEIS has not been updated since the previous AP-42 update.
The EPA OAQPS Emissions Monitoring Branch was contacted for test datafrom method development studies for EPA Method 202.
Contacts were also made with Electric Power Research Institute (EPRI),Wheelabrator Air Pollution Control, Southern Research Institute, and Entropy.3.6.2 Literature Evaluation
The previous update was reviewed and evaluated. The size distribution datawere evaluated by spot-checking the tabulated results against the original FPEISprintouts. If during the literature search, the original test report was uncovered thatcorresponded to a particular FPEIS printout, the data were compared. The objectiveof the review was to ensure that the data collected in the 1986 update were rankedand used appropriately. The previous update was also evaluated with respect to the development ofemission factors from the particle size distribution data.
The original FPEIS printouts were also examined. There were two objectivesin the reevaluation of the FPEIS printouts:
(1) Ensure that only filterable PM was included in the cumulative percentmass results; and
(2) Search for impinger results to provide CPM emission data.
New literature was evaluated based on the use of appropriate samplingmethods and documentation of sufficient process information.3.6.3 Data Quality Ranking
Data were reviewed and ranked according to the criteria described previously(Ref. 31 ) and the data evaluation criteria presented for the previous update. Dataquality was assessed based on the particle sizing and/or PM-10 measurementmethod used and the availability of sampling and process data.
For particulate sizing and filterable PM-10 data the following criteria wereused:

3-11
A - Particle sizing tests performed by cascade impactors or PM-10measurements performed via Method 201 or 201A. The testinformation must provide enough detail for adequate validation and theisokinetics must fall between 90 and 110 percent.
B - Particle sizing tests performed via SASS trains if the sampling flowrateisokinetic value was reported and sufficient operating data were used. Cascade impactor data or Method 201 or 201A data if isokinetics notreported or if isokinetics not within the 90 to 110 percent range.
C - SASS train data if the isokinetics were not reported or if the isokineticsdid not fall within the 90 to 110 percent range.
D - Test results based on a generally unaccepted particulated sizingmethod, such as polarized light microscopy.
Although cascade impactors are generally considered the best availablemethod for measuring particulate size distributions, errors in segregating specificsizes of combustion particles arise from the following:
! Particle bounce and re-entrainment
! Diffusive deposition of fine particles
! Deposition of condensible/adsorbable gases
! Losses to the impactor walls
The effects of such errors are described in "Cascade Impactors in the Chemical andPhysical Characterization of Coal-Combustion Aerosol Particles", by John M.Ondov, Chapter 25 of Fossil Fuels Utilization: Environmental Concerns, 1986.
The ranking of data for CPM was based primarily on the methodology. MostCPM source tests have been conducted using the back-half of a Method 5, Method17 or South Coast methods 5.2 or 5.3 trains. However, these test methods do notrequire a nitrogen (N2) purge of the impingers. Without the N2 purge, dissolved SO2
remains in the impingers and is included in the inorganic CPM results. This type ofCPM data is considered very low quality. In contrast, Method 202 includes a one-hour N2 purge of the impingers immediately after sampling to remove dissolved SO2. Therefore Method 202 CPM data should be ranked higher than Method 5 or Method17 CPM data, even though Method 202 is a relatively new method. The followingrankings were selected for CPM data:
A - CPM tests performed via Method 202. The test information mustprovide enough detail for adequate validation and the isokinetics mustfall between 90 and 110 percent.
B - CPM tests performed via Method 202 but isokinetics not reported orisokinetics not within the 90 to 110 percent range. CPM tests

3-12
performed via Method 5 or Method 17 or another acceptable EPAMethod that does not include an impinger N2 purge, if the isokineticswere within the 90 to 110 percent range.
C - CPM tests performed via Method 5 or Method 17 or another acceptableEPA Method that does not include an impinger N2 purge, if theisokinetics were not reported or not within the 90 to 110 percent range.
D - Test results based on a generally unaccepted CPM method.

TABLE 3-1. LITERATURE SEARCH RESULTS
Literature TypeNew baseline
dataNOx controlinformation
Particulate controlinformation
SOX controlinformation
1. AP-42 files T T T T
2. ESD Files/ NSPS Background Information Documents
None T T T
3. CTC publications None T None None
4. ORD reports T T T T
5. NTIS
T T T T
6. EPRI None T None None
7. Contractor in-house documents
T T T T
8. API T None None None
ESD = Emission Standard Division (of EPA)CTC = Control Technology Center (of EPA)ORD = Office of Research and Development (of EPA)NTIS = National Technical Information ServiceEPRI = Electric Power Research InstituteAPI = American Petroleum Institute

3-14
TABLE 3-2. SPECIATED VOC LITERATURE SEARCH RESULTS
Literature Type Remarks
EPA/AWMA Air Toxics Symposia (1988-1990)
No Data
TOXIC AIR POLLUTANTS: State andLocal Regulatory Strategies (1989)
Called those states and localities listed in air toxicsreport. Received some data, but all was criteria data
Contractor in-house documents No useful data.
Journals No useful data.
COMPENDEX No references found.
EPRI/PISCES Available end of 1992.
Papers No useful data.

TABLE 3-3. EVALUATION OF AIR TOXICS REFERENCES
Section 3Reference
Used inupdate? Reason
Parameter ofInterest
8 No Not a primary reference. Document references other low quality references.
9 Yes Not a primary reference, however, data are presented for use for rough estimates. POM
10 No Not a primary reference. Document references 3a.
10a No Data of unacceptable quality to generate emission factors.
11 No Not a primary reference. Document references 4a and 4b.
11a No Data not of sufficient quality to generate emission factors or enrichment ratios.
11b No Emission factors units can not be converted to desired units.
12 No Fuel mixture is not applicable.
13 No Fuel mixture is not applicable.
14 No Fuel mixture is not applicable.
15 No Data from Reference 4a were sited. These data are of unacceptable quality.
16 No Document presents criteria data only.
17 No Same as Reference 2.
18 Yes Not a primary reference. Data are of sufficient quality for emission estimates. Chromium
19 Yes Not a primary reference. Data of sufficient quality for emission estimates. Formaldehyde
20 Yes Not a primary reference. Data of sufficient quality for emission estimates. Metals
21 Yes Source test data are of sufficient quality to calculate enrichment ratios and emission factors.
PAH,radionuclides,
metals
22 Yes Enrichment ratio data are of sufficient quality to present. Metals
23 Yes Emission factor data are of sufficient quality for emission estimates. Manganese
24 Yes Reference used in discussion of partitioning behavior.

3-16
TABLE 3-4. N2O LITERATURE SEARCH RESULTS
Literature Type Remarks
TOXIC AIR POLLUTANTS: State and LocalRegulatory Strategies (1989)
No useful data
Contractor in-house documents One primary reference
University of North Dakota Data apply to lignite combustion
TVA No useful data
COMPENDEX No references identified
EPRI/PISCES Available end of 1992
FBC International Conferences Did not get 11th conference proceedings;others not useful
Journals Used one journal as a primary reference
EPA workshops Some useful references
TVA = Tennessee Valley Authority

3-17
REFERENCES FOR CHAPTER 3
1. Fossil Fuel Fired Industrial Boilers - Background Information: Vols. 1 and 2,EPA-450/3-82-006a and b, U. S. Environmental Protection Agency,Research Triangle Park, NC, March 1982.
2. Overview of the Regulatory Baseline, Technical Basis, and Alternative ControlLevels for Particulate Matter (PM) Emission Standards for Small SteamGenerating Units. (Final Report), EPA-450/3-89-11, U. S. EnvironmentalProtection Agency, Research Triangle Park, NC, May 1989.
3. Overview of the Regulatory Baseline, Technical Basis, and AlternativeControl Levels for Sulfur Dioxide (SO2) Emission Standards for SmallSteam Generating Units. (Final Report), EPA-450/3-89-12, U. S.Environmental Protection Agency, Research Triangle Park, NC, May1989.
4. Overview of the Regulatory Baseline, Technical Basis, and Alternative ControlLevels for Nitrogen Oxides (NOx) Emission Standards for Small SteamGenerating Units. (Final Report), EPA-450/3-89-13, U. S. EnvironmentalProtection Agency, Research Triangle Park, NC, May 1989.
5. Emissions Assessment of Conventional Stationary Combustion Systems:Volume V, EPA-600/7-81-003c, U. S. Environmental Protection Agency,Research Triangle Park, NC, 1981.
6. Emissions Assessment of Conventional Stationary Combustion Systems:Volume IV, EPA-600/7-81-003c, U. S. Environmental Protection Agency,Research Triangle Park, NC, January 1981.
7. Evaluation and Costing of NOx Controls for Existing Utility Boilers in theNESCAUM Region, EPA Contract No. 68-D9-0131, WA I-19, (Draft Report),Acurex Environmental, Mountain View, CA, September 1991.
8. Krishnan R.E. and G.V. Helwig, "Trace Emissions from Coal and OilCombustion", Environmental Progress, 1(4): 290-295. 1982.
9. Brooks, G.W., M.B. Stockton, K.Kuhn, and G.D. Rives, Locating andEstimating Air Emission from Source of Polycyclic Organic Matter, EPA-450/4-84-007p, U.S. Environmental Protection Agency, Research TrianglePark, North Carolina, May 1988.
10. Fossil Fuel Fired Industrial Boilers - Background Information,Volume 1: Chapters 1-9, EPA-450/3-82-006a, Office of Air Quality Planning andStandards, U.S. EPA, Research Triangle Park, North Carolina, March 1982,and Fossil Fuel Fired Industrial Boilers - Background Information Volume 2: Appendices, EPA-45-/3-82-006b, OAQPS, Research Trianle Park, NorthCarolina, U.S. Environamental Protection Agency, March 1982.
11. Leavitt, C., K. Arledge, C. Shih, R. Orsini, W. Hamersma, R. Maddalone, R.Beimer, G. Richard, M. Yamada, Environmental Assessment of Coal- and Oil-Firing in a Controlled Industrial Boiler; Volume I, II, III. ComprehensiveAssessment and Appendices, EPA-600/7-78-164abc, U.S. EnvironmentalProtection Agency, Research Triangle Park, North Carolina, August 1978.

3-18
12. Ackerman, D.G., M. T. Haro, G. Richard, A.M. Takata, P.J. Weller, D.J. Bean,W.B. Cornaby, G.J. Mihlan, and S.E. Rogers, Health Impacts, Emissions,and Emission Factors for Noncriteria Pollutants Subject to De MinimisGuidelines and Emitted from Stationary Conventional Combustion Processes,EPA-450/2-80-074, U.S. Environmental Protection Agency, ResearchTriangle Park, North Carolina, June 1980.
13. Shih, C., R.A. Orsini, D.G. Ackerman, R. Moreno, E.L. Moon, L.L. Scinto, andC. Yu, Emissions Assessment of Conventional Combustion Systems: VolumeIII. External Combustion Sources for Electricity Generation, EPA-600/7-81-003a, U.S. Environmental Protection Agency, Research Triangle Park, NorthCarolina, November 1980.
14. Surprenant, N, R. Hall, S. Slater, T. Susa, M. Sussman, and C. Young, Preliminary Emissions Assessment of Conventional Stationary CombustionSystems; Volume II -Final Report, EPA-600/2-76-046B, U.S. EnvironmentalProtection Agency, Research Triangle Park, North Carolina, March 1976.
15. Van Buren, D., and L.R. Waterland, Environmental Assessment of aCoal/Water Slurry Fired Industrial Boiler, EPA-600/S7-86/004, U.S.Environmental Protection Agency, Research Triangle Park, North Carolina,May 1986.
16. Waterland, L.R., and R. DeRosier, Environmental Assessment of aWatertube Boiler Firing a Coal/Water Slurry, EPA-600/S7-86/004, U.S.Environmental Protection Agency, Research Triangle Park, North Carolina,May 1986.
17. Waterland, L.R.; R. DeRosier, H. Lips, Environmental Assessment of aCommercial Boiler Fired with a Coal/Waste Plastic Mixture, EPA-600/S7-86/011, U.S. Environmental Protection Agency, Research Triangle Park,North Carolina, May 1986.
18. Johnson, N.D. and M.T. Schultz, MOE Toxic Chemical Emissions Inventoryfor Ontario and Eastern North America, Draft Report, Prepared for OntarioMinistry of the Environment, Air Resources Branch, Rexdale, Ontario, DraftReport No. P89-50-5429/OG, March 15, 1990.
19. U.S. Environmental Protection Agency, Regional Air Pollution Study - PointSource Emission Inventory, EPA-600/4-77-014 (NTIS No. PB 269567), March1977.
20. U.S. Environmental Protection Agency, Crosswalk/Air Toxic Emission FactorData Base Management System User's Manual, Version 1.2, EPA-450/4-91-028, Research Triangle Park, North Carolina, October 1991.
21. U.S. Environmental Protection Agency, Locating and Estimating AirEmissions from Sources of Chromium, EPA-450/4-84-007g, ResearchTriangle Park, North Carolina, July 1984.
22. U.S. Environmental Protection Agency, Locating and Estimating AirEmissions From Sources of Formaldehyde (Revised), EPA-450/4-91-012,Emission Inventory Branch Technical Support Division, Research TrianglePark, North Carolina, 1991.

3-16
23. U.S. Environmental Protection Agency, Estimating Air Toxic Emissions fromCoal and Oil Combustion Sources, EPA-450/2-89-001, Research TrianglePark, North Carolina, April 1989.
24. Evans, J.C., K.H. Abel, K.B. Olsen, E.A. Lepel, R.W. Sanders, C.L. Wilkerson,D.J. Hayes, and N.F. Mangelson, Characterization of Trace Constituents atCanadian Coal-Fired Plants, Phase I:, Final Report and Appendices, Reportfor the Canadian Electrical Association, R&D, Montreal, Quebec, ContractNumber 001G194.
25. Meij, Auteru dr. R., The Fate of Trace Elements at Coal-Fired Plants,Rapportnummer:32561-MOC 92-3641, Rapport te bestellen bij: BibliotheekN.V. KEMA, February 13, 1992.
26. U.S. Environmental Protection Agency, Locating and Estimating AirEmissions from Sources of Manganese, EPA-450/4-84-007h, ResearchTriangle Park, North Carolina, September 1985
27. Lyon, W.S.; Trace Element Measurements at the Coal-Fired Steam Plant,CRC Press, 1977.
28. U.S. Environmental Protection Agency, PM-10 Emission Factor ListingDeveloped by Technology Transfer, EPA-450/4-89-022, Research TrianglePark, North Carolina, 1989.
29. U.S. Environmental Protection Agency, Gap Filling PM-10 Emission Factorsfor Selected Open Area Dust Sources, EPA-450/88-003, Research TrianglePark, North Carolina, 1988.
30. U.S. Environmental Protection Agency, Generalized Particle SizeDistributions for Use in Preparing Size Specific Particulate EmissionInventories, EPA-450/4-86-013, Research Triangle Park, North Carolina,1986.
31. U.S. Environmental Protection Agency, Technical Procedures for DevelopingAP-42 Emission Factors and Preparing AP-42 Sections - Draft, ResearchTriangle Park, North Carolina, March 1992.
4-1
4. EMISSION FACTOR DEVELOPMENT
This chapter describes the test data and methodology used to developpollutant emission factors for bituminous and subbituminous coal combustion.4.1 CRITERIA POLLUTANTS4.1.1 Review of Previous AP-42 Data
The emission factor documentation files from the prior AP-42 updates ofSection 1-1 were obtained and reviewed. The criteria emission factors weredeveloped in 1981 and documented in Reference 1. The emission factors forparticle sizing and particulate collection efficiencies by particle size were developedin 1984 in Reference 2. Initially, much of the documentation used in developingthese prior emission factors were reviewed. The references included:
! The 61 primary references cited in the 1988 Section 1.1.;! Secondary references from background files;! Memoranda and emission factor worksheets from the prior updates.
The references used in developing the prior emissions factors were checked inseveral cases as a first-level quality check on the documentation. Table 4-1 listsseveral of the cases where the reference trail was spot checked. Several anomaliesregarding reference documentation were revealed, but none which invalidated thequality of the results. A review of the 1988 version of Section 1.1 was accomplishedby spot checking the quality of existing emission factors. This was done by selectingprimary data references from the background files, reviewing data quality samplingand analytical procedures, determining completeness, and verifying that the siteemission factors in the background files could be reconstructed and were accurate. Examples of spot-check data are presented in Appendix A.
Spot checks revealed that, in general, ample A-quality rated data points wereavailable for the criteria pollutants or that most poor quality data had little affect onthe published AP-42 emission factors. However, questions regarding the quality ofthe data used to calculate the emission factors were justified and point to a need toproperly review references, assigned data quality ratings, and calculations, whendeveloping improved emission factors for well-defined equipment categories.

4-2
4.1.2 Review of New Baseline DataA total of 60 references were identified and reviewed during the literature
search. These references are listed in the checklists added to the background filesfor this update to AP-42. The original group of 60 documents was reduced to a setof rated references utilizing the criteria outlined in Chapter 3. The following is adiscussion of the data contained in each of the rated references.
Reference 3
This report covers the emissions of two hand-feed space heaters tested incooperation with the Vermont Agency of Environmental Conservation. Oxygen, CO2and CO were measured by Orsat from a grab sample collected over the testduration. SO2 and light hydrocarbons were analyzed from a grab sample in a gaschromatograph. Particulate measurement was made from front half catch of aModified Method 5 (MM5) sampling train. Hazardous air pollutants (HAPs) werealso reported. No original data sheets were found. Coal analysis was reported on adry basis and higher heating value (HHV) was reported on dry ash free basis. Emissions were calculated in the report (p.15) but appear to be reported incorrectly. Particulate emissions were recalculated using the F-factor in 40 Code of FederalRegulations (CFR) Part 60 Appendix A, EPA Method 19. Data were assigned arating of C.
Reference 4
This report covers the emissions of one 40,000 lb steam/hr (18,000 kgsteam/hr) FBC for long term performance. Data were collected to support NSPS forsmall boilers. Oxygen, CO2, SO2, NOx, and CO were analyzed by certifiedcontinuous emission monitors (CEMs). Test data for the thirty day testing period arepresented in the report in molar concentration units. Data from February 28, 1986were averaged to obtain NOx and CO emission factors. Sulfur dioxide emissionswere controlled by limestone addition to the FBC. No uncontrolled particulate datawere found. Data were given a quality rating of B.
Reference 5
This is a compliance test report for PM, SO2, and NOx on a 100 MWetangential-fired boiler for the Nebraska Department of Environmental Control inLincoln, Nebraska. Particulate was sampled after an ESP and was not useful foruncontrolled emissions. Sampling was performed by EPA Methods 6 and 7. Emissions were given in lb/million Btu (MMBTU). Data were given a quality rating ofA.
Reference 6
This is a compliance test report for SO2 on a 145 MWe PC-fired unitmanufactured by Riley Stoker Corporation. Sampling was performed by EPAMethod 6 after an ESP. Emissions were given in lb/MMBTU. Data were given aquality rating of A.

4-3
Reference 7
This is a test report for short-term testing on seven separate boilers withdifferent configurations over a five-day period. Emphasis of the report is on specificorganic compounds; however, CEMs were used to monitor O2, CO, and totalhydrocarbons (THC) during test conditions. There was inadequate information inthis report to determine reporting units and measurement method for THC. No CEMspecifications or calibration procedures were found but method is fairly wellestablished. Some sampling sites were located after ESPs but this was notexpected to significantly alter CO emissions. Sulfur dioxide and NOX data wereavailable for one of the plants tested via plant-installed CEMs after an ESP. Datawere given a quality rating of B.
Reference 8
This is a compliance test report for the Kansas Board of Public Utilities for two coal-fired cyclone boilers. Testing was done by EPA Method 6. Raw data wereavailable but titrations were not checked. Sampling was conducted at the stack aftera baghouse and ESP, respectively. A summary table listed emissions in lb/MMBTUbased on Tabulated F-factor in 40 CFR Part 60 Appendix 19. Data were given aquality rating of A.
Reference 9
This is a compliance test report for the Kansas Board of Public Utilities on aPC-fired boiler. Insufficient detail for the unit was given to specify firingconfiguration; however, this information is not necessary for emission factordevelopment at this time. Samples were taken both before and after an ESP toshow removal efficiency. Unit was operating at nominally 90 percent of nameplaterating (145 MWe). Raw data were available. Emissions were presented inlb/MMBTU based on an F-factor derived from the fuel analysis. Data were given aquality rating of A.
Reference 10
This report is an EPA/Office of Air Quality Planning and Standards(OAQPS)/Emission Measurements Branch (EMB) document describing a test ofTennessee Eastman's Boiler 24 in Kingsport, Tennessee, in support of the industrialboiler NSPS. The tests were conducted to determine the effects of boiler load, O2and preheat on NOx emissions. Continuous monitors were used to measure NOx,CO and O2; NOx was also measured using EPA Method 7. Comparison of the twoNOx methods was acceptable and the average was used for emission factorcalculation. Five of the nine runs were conducted at acceptable boiler loads (> 70percent). The remaining runs at low load (approximately 55 percent) indicated a 20percent reduction in NOx emissions with little effect on CO levels. An A rating hasbeen assigned to this data.
Reference 11
This report is an EPA/OAQPS/EMB document describing a test of anindustrial boiler with stoker gas recirculation (SGR) at Upjohn Company'sKalamazoo, MI, facility. These tests were also in support of the industrial boilerNSPS. The effects of boiler load, O2 and SGR on NOx emissions were measured. Continuous monitors were used to measure NOx, CO, and O2. Nine of the ten runswere made at boiler loads of 75 to 100 percent with O2 levels between 3.2 and 8.0
4-4
percent. These data were used in the emission factor calculations. The remainingrun at 50-percent load showed no noted effect on NOx or CO levels. An A rating hasbeen assigned to this data.
Reference 12
This report is an EPA/OAQPS/EMB report describing a test of an industrialspreader stoker at the Burlington Industries facility in Clarksville, VA. These testswere conducted in support of the industrial boiler NSPS for PM. Nine runs wereperformed at various boiler loads using a slight variation of EPA Method 5 for theparticulate measurements. The modification to the sampling method was in heatingthe filter box to 160oC (320oF) . In a previous report comparing results using thisvariation to standard Method 5 data, this method produced particulate catches of 94to 100 percent of Method 5 results. Five of the nine runs were used in the emissionfactor calculations. Three of the remaining runs were at one-third boiler load andone run exceeded the acceptable percent-isokinetic standard. A B rating wasassigned to this data because of the method modification and wide variation inresults.
Reference 13
Contains SO2 and NOx summary data for the Tennessee Valley Authority's(TVA) bubbling bed FBC (with and without fly ash reinjection) and Batelle'scirculating bed FBC. Original test reports are referenced in the document andshould be obtained in order to upgrade quality rating. Data were assigned a qualityrating of D.
4.1.3 Compilation of Baseline Emission FactorsThe references described above were used in updating the uncontrolled
(baseline) emission factors for criteria pollutants. Computerized spreadsheets wereset up to calculate new data points from the information contained in thesereferences. Sections of the spreadsheets, pertaining to specific pollutants areshown as Tables 4-2 through 4-8.
The new data points were combined with the 1988 AP-42 Section 1.1 datapoints retained from spot checking to develop new emission factors. The variousformulae and conversion factors used in the spreadsheet programs and in thecalculation of new emission factors are shown in Appendix B.
4.1.3.1 SO2 Emission Factors. The new SO2 baseline data are summarizedin Table 4-2. The following new data points were added to the emission factordatabase:
! Cyclone furnace: 3 points! Spreader stoker: 2 points! Pulverized coal, tangential fired: 1 point! Pulverized coal, dry bottom, wall fired: 1 point! Handfeed: 1 point! Bubbling bed FBC: 6 points

4-5
! Circulating bed FBC: 1 pointThe spot checks revealed only minor anomalies in the 1988 AP-42 emission
factor calculations. One test report14 appeared to have a discrepancy in the fuelanalysis procedures. For the "ALMA" site, the facility data point was developed fromthe fuel sulfur content measured on a dried and pulverized (as-fired) basis, but withthe as-received HHV. However, making this correction only changes the data pointfrom 33S to 33.7S, where S is the percent sulfur in the fuel. Also, for thesubbituminous coal testing at the same site, the coal sample averages did not matchthe emissions average periods. Again, however, making these corrections did noteffectively change the site data point. Therefore, all previous SO2 emission factorbackground data were retained in the current update effort.
For bituminous coal firing, three new data points were added for cycloneboilers, and one data point each was added for PC wall-fired and tangential-firedboilers. Of the three cyclone boiler tests, data from two tests were rated E becausethe calculated emission factors were above the theoretical maximum value of 40S;the remaining cyclone boiler test produced a B-rated emission factor of 31.5S. Testdata from the two PC-fired boilers were rated A and B. The average of the emissionfactors from these two tests was 38.1S. These data, when combined with a 1984review89 of the 1982 emission factor development effort and data base, justify arevision of the SOx emission factor from 39S to 38S for PC-fired, cyclone, spreaderstoker, and overfeed stoker boilers.
One new data point from Reference 1 was obtained for a small 2.9 KW(10,000 Btu/hr) hand-fired unit. However, this data point was assigned a C ratingand, at a value of 52.4S, was significantly different from the existing averageemission factor of 31S for underfeed and hand-fired units. Therefore, the existingAP-42 emission factor was retained.
No new data for subbituminous coal firing were identified during this update. Therefore, the existing emission factor of 35S for PC, cyclone, and spreader andoverfeed stokers was retained.
New emission factors were developed for FBCs which have been included inthis update of AP-42 as a new source category. As discussed in Chapter 2, acorrelation was developed with the coal sulfur content and the calcium-to-sulfur ratioin the bed. The data obtained from the FBC test reports are plotted against calcium-to-sulfur ratio (Ca/S) in Figure 4-1.
Four data points were obtained from Reference 4 showing the effect ofavailable Ca/S ratio on SO2 emissions. Reference 4 data were given an A rating. The FBC in Reference 4 is a bubbling bed FBC incorporating reinjection of fly ash

4-6
captured in the first stage cyclone. Fly ash reinjection results increase in highercalcium utilization and lower SO2 emissions.
Reference 13 presented summary data from both bubbling and circulatingbed FBCs. These data were given D ratings because the report lacked sufficientbackground data to fully evaluate the source operation and test methodology. However, when plotted on Figure 4-1, the data point from the bubbling bed unit withfly ash reinjection matched the data from the similar FBC in Reference 2. Becauseof the limited number of FBC test data reports which were obtained for this update ofAP-42, all these data points were used in developing the SO2 emission factorcorrelation. The data from the bubbling bed unit without fly ash reinjection do notmatch the reinjection data and therefore were not considered in the correlation. Also, the data point from the circulating bed FBC plotted on Figure 4-1 follows thesame trend as the bubbling bed units with fly ash reinjection. This behavior is notsurprising because circulating bed units are essentially an extension of bubbling bedtechnology but with higher fluidizing velocities and a high ratio of fly ash reinjection.
All data shown in Figure 4-1 from the bubbling bed units with fly ashreinjection and the circulating bed unit were curve-fit to develop a correlation for theemission factor. The best-fit equation reflecting the SO2 emissions performance ofFBCs was:
where S is the weight percent sulfur in the coal and Ca/S is the molar calcium-to-sulfur ratio in the bed. This correlation was used for the SO2 emission factor for bothbubbling bed and circulating bed FBCs. An emission factor quality rating of D wasgiven for bubbling bed units because of the limited number of facilities used to obtainthe test data. An emission factor quality rating of E was given to the circulating bedunits.
When no calcium-based sorbents are used and the bed material is inert withrespect to sulfur capture, the emission factor for underfeed stokers should be usedto estimate FBC SO2 emissions. In this case, the emission factor quality ratingsshould be E for both bubbling and circulating bed units.
4.1.3.2 NOx Emission Factors. The new NOx baseline data are summarizedin Table 4-3. The following new data points were added to the emission factordatabase:

4-7
! Cyclone furnace: 1 point! Spreader stoker: 2 points! Pulverized coal, tangential fired: 1 point! Handfed: 1 point! Bubbling bed FBC: 1 point! Circulating bed FBC: 1 point
One new data point was averaged with prior data to calculate a new emissionfactor for cyclone boilers. Although the data point value of 7.52 kg/Mg (15.04 lb/ton)was considerably below the previous AP-42 emission factor of 18.2 kg/Mg (36.4lb/ton), it appears to be of at least equal quality to the previous background data. The new emission factor of 16.9 kg/Mg (33.8 lb/ton) was calculated by averaging thenew data with the old data, all of which have a B quality rating. The emission factorrating of C was retained to indicate that a reasonable set of data points were used todevelop the emission factor; however, it is not clear that the facilities testedrepresent a random sample of the population.
Data from References 10 and 11 were averaged with the prior data forspreader stokers. The resulting change in emission factor was minor. The existingvalue of 7 kg/Mg (14 lb/ton) was changed to 6.9 kg/Mg (13.7 lb/ton). The emissionfactor rating of A was retained.
One data point for a tangential-fired boiler was obtained from Reference 5. At3.5 kg/Mg (6.9 lb/ton), this data point was somewhat below the 1988 AP-42emission factor of 7.5 kg/Mg (15 lb/ton); however, it was rated as A quality becauseReference 5 is a well-documented and complete compliance test report. A newemission factor of 7.2 kg/Mg (14.4 lb/ton) was developed by averaging the new datapoint with the old A-rated data. The emission factor rating of A was retained.
Two data points were obtained for bubbling bed FBCs. The FBC boiler inReference 4 is a bubbling bed unit installed in Prince Edward Island, Canada. Thedata quality rating given to the Reference 4 data point was A because it is acomplete and well-documented emission assessment report. Because the FBC unitin Reference 13 is the TVA 20 MWe demonstration unit, it may be morerepresentative of NOx emissions from new bubbling bed units designed to meet theFederal New Source Performance Standards. However, the data quality assignedto Reference 13 was D because of the lack of supporting information in the testreport. Therefore, only the A-rated data from Reference 4 were used for thebubbling bed FBC emission factor. The emission factor is 7.6 kg/Mg (15.2 lb/ton)and has been given an emission factor quality rating of D because the data havebeen obtained from only one facility.

4-8
One data point was obtained for a circulating fluidized bed boiler fromReference 13. Because the data quality rating is D from this standard reference, anemission factor rating of E has been assigned to this source category.
One data point was obtained from a small, hand-fed domestic furnace inReference 3. To determine if this data point should be combined with the existingdata used in the 1988 AP-42 emission factor, a detailed spot check was performed. The emission factor could be reproduced from the data contained in the reference;however, with no supporting sampling discussion or data documentation, the dataquality for the existing data point would warrant a C or D rating. Therefore, the newemission factor was developed by averaging the two data points [i.e., 7.6 kg/Mg(15.2 lb/ton) from Reference 1 and 1.5 kg/Mg (3 lb/ton) from the single data point inthe 1988 AP-42 emission factor] to obtain a value of 4.55 kg/Mg (9.1 lb/ton). Anemission factor quality rating of E was assigned for this source category.
No additional data points were obtained for overfeed and underfeed stokersnor for wet bottom wall-fired pulverized coal units. Therefore, the 1988 AP-42emission factors were retained for these sources categories. The emission factorratings of A were retained for the overfeed and underfeed stokers based on thequality of the original references.
Based on the existing AP-42 emission factor spot checks discussed inSection 4.1.1, two data points were removed from the emission factor calculation forwall-fired pulverized coal, dry bottom boilers. This resulted in a change in theemission factor from 10.5 kg/Mg (21 lb/ton) to 10.9 kg/Mg (21.7 lb/ton). Theemission factor quality rating of A was retained based on the quality of the remainingreferences.
4.1.3.3 CO Emission FactorsPC Boilers. Four new data points were obtained as shown in Table 4-4. The
two wall-fired data points were lower than the 1988 emission factor of 0.3 kg/Mg (0.6lb/ton), but the individual runs were consistent at each site. The vertical V-fired datapoint of 0.76 kg/Mg (1.52 lb/ton) was obtained from the average of individual runsthat varied from 0.16 kg/Mg (0.37 lb/ton) to 1.85 kg/Mg (2.71 lb/ton). This point wasnot used because of its variability and the fact that the resulting number was faroutside of the previous data grouping. The tangentially-fired (T-fired) data point of0.05 kg/Mg (0.10 lb/ton), although unusually low, appears to be high quality data. Two new cyclone boiler points were also found and added to the baseline database. Both were lower than the computed emission factor but were considered reliabledata. A new average emission factor of 0.25 kg/Mg (0.52 lb/ton) was computed. This compares to the previously-computed factor of 0.29 kg/Mg (0.58 lb/ton). The

4-9
current emission factor has been changed from 0.3 kg/Mg (0.6 lb/ton) to 0.25 kg/Mg(0.5 lb/ton).
The new T-fired data point was considered as a candidate for a new, separateT-fired emission factor. After it was averaged with the existing T-fired data,however, a new emission factor was not warranted.
Spreader Stoker. Two new data points were added to the existing 22 datapoints [i.e., 0.8 kg/Mg (1.60 lb/ton and 0.46 kg/Mg (0.92 lb/ton)]. Both wereconsiderably below the average emission factor of 0.29 kg/Mg (0.58 lb/ton). A newaverage emission factor of 2.46 kg/Mg (4.92 lb/ton) was computed. It isrecommended to retain the existing factor of 2.5 kg/Mg (5 lb/ton).
Overfeed and Underfeed Stoker. No new data were found. It isrecommended to retain the current value.
Hand-fed Units. Two new data points were obtained. The data wereassessed to be of C quality. A spot check of Reference 15 revealed that the priordata should be discarded in light of the new data. It is recommended to change theemission factor to 215 kg/Mg (430 lb/ton), which is a simple average of the two newdata points.
Fluidized Bed Combustors. A new data point was obtained and is shown inTable 4-4. An emission factor of 9 kg/Mg (18 lb/ton) is recommended for bothbubbling bed and circulating FBCs.
4.1.3.4 Particulate Emission FactorsPC-fired, Dry Bottom, Wall Fired. A spot check revealed one data point of low
quality. This value was removed from the emission factor data base. Because ofthe large number of data points and the proximity of the rejected point to theaverage value, this process had little effect on the new average emission factor. Anew data point shown in Table 4-5 was added to the data base. Although the newvalue was 9.16 kg/Mg (18.31 lb/ton), its addition to the data base did not cause theaverage emission factor to increase beyond 5.22 kg/Mg (10.44 lb/ton).
PC-fired, Dry Bottom, Tangentially Fired. Existing data were reviewed and anaverage emission factor was computed. The average value of four data pointsgenerated by EPA Method 5 measurements was 5.2 kg/Mg (10.3 lb/ton). Anemission factor of 5 kg/Mg (10 lb/ton) is recommended. Because only four datapoints were used, a quality rating of B was assigned.
PC-fired, Wet Bottom. The existing data were reviewed. Because only onedata point was used (the only one found using EPA Method 5), the quality rating wasconfirmed to be D.

4-10
Cyclone Furnace. The existing data were reviewed. Because only one datapoint was available and it was not obtained by an EPA-approved method, the qualityrating was downgraded to E.
Spreader Stoker. Based on the findings of the spot checks, the data pointbased on Reference 16 was discarded from the new emission factor calculation. The remaining seven data points were averaged with the one new data pointobtained from Reference 12 to give a new emission factor of 33 kg/Mg (66.0 lb/ton). The B emission factor quality rating was retained.
Spreader Stoker with Multiclones and Reinjection. Six data points were usedand all were based on EPA Method 5 measurements.
Spreader Stoker with Multiclones and No Reinjection. Twelve data pointswere used and all were based on EPA Method 5 measurements. The A qualityrating appears to be warranted since these data are from many diverse facilities. This is also an extremely specific source category and the data did not have a highdegree of variability.
Overfed Stoker. Eight data points were used and all were based on EPAMethod 5 measurements. Considerable data scatter indicates C quality data.
Overfed Stoker with Multiple Cyclones. All five data points were obtainedusing EPA Method 5 measurements. Reasonable data consistency warrants a Bquality rating.
Underfed Stoker. Although nine EPA Method 5 data points were used,considerable variability exits. A quality rating of C is recommended.
Underfed Stoker with Multiple Cyclone. A quality rating of D is recommendedbecause, although the data are consistent, only two data points are available.
Hand-fed Units. Data were reviewed from the two sources (References 17and 15). Data from Reference 17 were discounted because the unit was from anopen fireplace. Data from Reference 15 were secondary data. Two new data pointswere added, taken from Table 4-5. Because the two new data points have anaverage emission factor of approximately 7.5 kg/Mg (15 lb/ton), it is recommendedthat the emission factor remain unchanged.
Fluidized Bed Combustor, Bubbling Bed. No baseline particulate data, eitherold or new, were available. It is estimated that PM emissions would most closelymatch those of a spreader stoker with multiple cyclones and no flyash reinjection. The corresponding PM emission factor of 6 kg/Mg (12 lb/ton) is recommended foruse. This assumption warrants the lowest quality rating of E.
Fluidized Bed Combustor, Circulating Bed. No data, either old or new, wereavailable. It was estimated that PM emissions would most closely match those of a

4-11
spreader stoker with multiple cyclones and no fly ash reinjection. Its PM emissionfactor of 6 kg/Mg (12 lb/ton) is recommended for use. This assumption warrants thelowest quality rating of E.
4.1.3.5 Methane Emission Factors. Reference 15 was spot checked, and itwas found that methane (CH4) emission factors could be computed for individualboiler types. The existing data were grouped into their appropriate boiler types andnew individual emission factors were calculated. Although the same data wereused, the emission factor data quality was downgraded to B since each boiler typehad only three to five data points.
The only new data obtained were for hand-fed boilers. The spot checks ofprior data showed these data to be outdated and unusable. A new emission factorwas calculated based on two new data points as shown in Table 4-6.
No CH4 data were available for FBCs. Possibilities of using data fromcomparable combustion devices were explored. No suitable estimation procedurewas identified.
4.1.3.6 Non-CH4 Emission Factors. As with CH4, Reference 15 revealedindividual emission data for each boiler type. The existing data were grouped intoboiler categories and new individual emission factors were calculated. Although thesame data were used, the emission factor data were downgraded to B since eachboiler type had only three to five data points.
No new data were found for hand-fed units. Spot checks revealed previousdata to be outdated and unusable. Because no other data were available, theexisting emission factor was retained in this update. Its quality rating wasdowngraded to E.4.1.4 Compilation of Controlled Emission Factors
A compilation of controlled emissions and control efficiencies achievedthrough application of some of the control technologies discussed in Section 2.4 isgiven in Tables 4-7 through 4-9.4.2 SPECIATED VOCs
The VOC speciation data base was very sparse, as described in Section 3.2. The data evaluation was limited to the single report referenced in the database. Thereport contained only two references for VOC speciation data; only one of thesereferences documented the protocols used for collecting and analyzing the samples. In the one case, samples were collected with Tedlar bags using a vacuum pump. Gas chromatography was the analysis technique. There were no data sheets,calibration procedures or quality control (QC) methods mentioned and no source

4-12
operating conditions listed. Without these details, the data were considered"unratable," and not suitable for use in developing emission factors.
In the absence of developed emission factors for VOC speciation, theSPECIATE and XATEF databases for speciated VOCs can be consulted forqualitative guidance.4.3 AIR TOXICS4.3.1 Review of New Data
The data search summarized in Section 3.3 identified several keydocuments with primary test data or data compilations for air toxics emissions. Theevaluation of several of the key references follows:Reference 24
This article summarizes the emissions of certain trace metals and hazardouspollutants from bituminous coal combustion. The data presented are a summary ofa literature review. Emission factors are presented in the units of mass emitted perheat input quantity combusted and are presented for boilers of different sizes andconfigurations. The article references several primary references which wereevaluated but determined to be of insufficient quality.
Reference 25
This document is a compilation of the available information on sources andemission of POM and is not a primary reference. The document cautions the use ofthese data for development of an exact assessment of emissions from any particularfacility, however, the data are useful for providing rough estimates of POMemissions from boilers firing bituminous coal. The emission factors provided are forcontrolled devices. Data for utility boilers are used in this update because this is thelargest and most complete data set for coal combustion.
Reference 26
The data quality in this report is of unacceptable quality to generateenrichment ratios for metals or emission factors for metals, organics, and POM.
Metals: Metals samples were not taken after the boiler and beforethe multicyclones so enrichment factors for the pieces ofequipment could not be calculated. The multicyclonesmalfunctioned during the coal test rendering the metalsdata of questionable quality.
Organics: It was stated in the report (on page 6-28) that the organicsrecovered were not combustion products but werecomponents in the sample collection media and in theanalytical lab.
POM: POM data were below detection limit. The malfunctioningmulticyclones would also impact the quality of these data.

4-13
Reference 29
The data quality and documentation in this report are of unacceptable qualityto generate emission factors.
Metals: Level I sampling and analysis program which is semiquantiative (afactor of + 3) data quality. A source assessment sampling system(SASS) train and spark source mass spectroscopy (SSMS) analyseswere used. These data are not suited for calculation of enrichmentfactors or mass balances as stated in the source on page 269.
POM: The sampling and analytical procedures are also of lower quality [i.e., SASS and gas chromatography/mass spectrometry (GC/MS)].
The documentation for the analytical results is not clear as to why onlyportions of the samples were analyzed; therefore, one cannotdetermine if the entire sample is being accounted for.
Reference 28
The purpose of this document is to provide a preliminary emissionassessment of conventional stationary combustion sources. The data presenteddeals with national averages or ranges based on the best available information. Emission factors in mass emitted per heat unit input are not provided.
Reference 29
The emission factors for oil combustion that were summarized in thisdocument came from Reference 29. These data were eliminated from use in thisupdate due to their poor quality.
Reference 30
This report summarizes testing performed on several sizes and types ofboilers; however, only criteria pollutant testing was performed.
Reference 31
Measured and calculated emission factors for bituminous coal are presentedin this document. The emission factors are rated as low quality because thedocument is not a primary source and the quality of the data cannot be verified.
Reference 32
This document presents a summary of emission factors for different types ofprocesses which emit formaldehyde. The emission factors are presented in massper unit heat input. A factor is provided for coal-fired sources; however, the factorsare based on one or two tests. Also, the type of coal is not specified. The emissionfactor is therefore assigned a low rating and represents an approximate emissionestimate.
Reference 33
This document provides a summary of the emissions factors for metals, POM,and formaldehyde for bituminous coal-fired boilers. Control efficiencies are reported

4-14
for some control devices. No data are reported for uncontrolled emissions of POMand radionuclides. The formaldehyde data are from 1964 and are considered to beof unacceptable quality. The emission factors are based on source test data fromcoal-fired utility and industrial boilers. Data for different boiler configurations arepresented in the units of mass emitted per unit of fuel input.
This reference is not a primary source. The document cautions that relativelylimited data are available on toxic air pollutants resulting from these types ofprocesses and that emissions data in the document should not be used to developan exact assessment of emissions from any particular facility. Emission factors forthe processes outlined in the document are summarized and provided for use indetermining order-of-magnitude emissions. The emission factors are rated lowquality because the data acquisition and manipulation could not be verified.
Reference 34
The data quality and documentation in this report are of high enough qualityto develop enrichment ratios for metals and radionuclides on boilers and theirassociated abatement devices. Emission factors expressed as mass emitted perunit heat combusted are calculated for PAH compounds.
Reference 35
This report summarizes the current research effort in the Netherlands todetermine the fate of trace elements at coal-fired power plants. A total of sixteentest and mass balance programs were undertaken to determine enrichment ratiosfor boilers and high-efficiency cold-side ESPs. Enrichment ratios for boilers arepresented by classes of metals. Enrichment ratios for the ESPs are also presented. The data are of sufficient quality for use in this update.
Reference 36
This document presents emission factors for sources of chromium. Aliterature survey was used to compile emission estimates from bituminous coal-firedboilers. The emission data for utility boilers is used to generate the emission factor.
The data from these references were reviewed and ranked according to thequality criteria discussed in Section 3. 4.3.2 Baseline Emission Factors
Emission factors for metals, radionuclides, and other HAPs are quite oftenpresented in units of mass emitted per heat input combusted. These units areadequate for developing emission factors for organic HAPs but are not desirable fordeveloping factors for metals and radionuclides. Ideally, emission factors for traceelements should be developed as a function of the boiler firing configuration, boilersize, trace element content of the fuel, ash content, higher heating value, enrichmentratio (see discussion below), and the collection efficiency of the control device. The concepts of partitioning and enrichment are needed to describe thefate of trace metals within the boiler and collection devices. The concept ofpartitioning is used to describe the distribution of trace elements among the boiler

4-15
system outlet streams. These streams may include the bottom ash collectorhoppers, boiler/economizer/preheater hoppers, and flue gas. Enrichment refers tothe preferential migration of specific trace metals to a process stream or to a specificparticle size range, especially the respirable range and below. The process ofenrichment typically involves a control device, where collection efficiency varies byparticle size range. When metals are distributed unequally across size ranges, thecollection device will then yield disproportionate partitioning from the sizeenrichment. The physical and chemical properties of a trace metal governs how thatmetal will be distributed in the outlet streams. For example, mercury is a highlyvolatile metal and therefore, the majority of the mass of mercury in the coal tends tobe emitted from the boiler in the flue gas and not in the bottom ash or in the fly ash.
A method for describing partitioning behavior is to report the fraction of thetotal elemental mass input that has exited the boiler in an outlet stream. Anothermethod for quantifying the distribution of a metal is to calculate an enrichment ratioby comparing the trace element concentration of an outlet stream to the traceelement concentration in the inlet coal stream. The enrichment ratio calculation thatis outlined in Reference 33 is performed using the following equation:
ERij = (Cij/CRj)/(Cic/CRc)
where: ERij = enrichment ratio for element i in stream j
Cij = concentration of element i in stream j
CRj = concentration of reference element R in stream j
Cic = concentration of element i in coal
CRc = concentration of reference element R in coal
Enrichment ratios greater than 1 indicate that an element is enriched in agiven stream, e.g. stream j, or that it partitions to a given stream. The referenceelement is used because its partitioning and enrichment behavior is oftencomparable to that for the total ash. In other words, the reference element partitionswith consistent concentrations in all ash streams and normalizes the calculation. Typical reference elements are aluminum, iron, scandium, and titanium. Theenrichment behavior of elements is relatively consistent in different types of boilersand can be explained by a volatilization-condensation or adsorption mechanisms. Asummary of the enrichment behavior for air toxic metals and the reference metals is
4-16
presented in Table 4-10. Table 4-11 presents a summary of enrichment behaviorsincluding approximate enrichment ratios for particular classes of compounds.
The enrichment ratio can be used in conjunction with additional data from aspecific facility to estimate emissions of trace elements. The equation outlined inReference 35 is used to calculate the emission factor for a trace element as follows:
EF = (C/H)*F*(1-E)*ER*103
where: EF = emission factor for a specific trace element, ng/J
C = concentration of element in coal, µg/g
H = higher heating value of coal, kJ/kg
F = fraction of coal ash as fly ash
E = fractional particulate collection efficiency of control device (zero for uncontrolled emissions)
ER = enrichment factor for the trace element (ratio of concentrationof element in emitted fly ash to concentration of element in coal
ash, often based on aluminum).
In many cases, the source test programs did not include key parameters suchas: ultimate and trace element analyses of coal used for the test, measurements ofthe boiler effluent for metals and ash, and measurements of metals and ash after thecollection device. This made it impossible to calculate partitioning of metals withinthe bottom and fly ash. When supporting documentation to develop enrichmentratios were not available, emission factors in the units of mass emitted per unitthermal heat input were provided. Although this is not the optimal method ofestimating emissions, it provides a means of performing approximate emissionestimation.
Table 4-12 summarizes the enrichment ratios for metals and radionuclides forvarious uncontrolled boilers and for a high efficiency cold-side ESP. The enrichmentratios presented are the ranges for the references obtained. The quality of theseenrichment ratios is low (E quality) because of the small number of boilers testedand limited control data used to perform the calculations. Enrichment ratio data area significant data gap in the air toxic data bases.
Table 4-13 and 4-14 present summaries of emission factors in the units ofmass emitted per unit thermal heat input combusted for uncontrolled boilers. Dataare presented for metals, POM, and formaldehyde. The tables are presented in

4-17
English units and metric units, respectively. The quality rating of these data are lowbecause many of the sources of information are of low quality and the number ofdata points are too small to represent an entire source category. Limited data areavailable on organic air toxic compounds but could not be obtained for this update. The metals data were most abundant and the data for formaldehyde were verylimited. The POM data were also fairly limited. When received, these data will beadded to the AP-42 Section 1.1 Background File for consideration in the next updateof this section.4.3.3 Controlled Emission Factors
Table 4-15 and 4-16 present the summary of emission factors for variouscontrolled emissions in the units of mass emitted per unit thermal heat input. Thedata obtained in the literature review were very limited. The quality rating of thesedata are low because many of the sources of information are of low quality and thenumber of data points are too small to represent an entire source category. Table 4-17 summarizes control efficiencies for various parameters of several control devices.4.4 N2O
A total of 43 references were documented and reviewed during the literaturesearch. These references are listed at the end of this chapter.
The original group of 43 documents was reduced to a final set of primaryreferences using the criteria outlined in Chapter 3. Many of the references werebased on the pre-1988 protocol which resulted in unrelaible N2O measurementsbecause of reactions in sample containers. For the 40 references documents notused, the reason(s) for rejection are summarized below (the reference numbercorresponds to the reference list at the end of this chapter): Reference Reason for rejection
39 Data were pre-198840 Data were pre-198841 Pilot-scale boiler42 Duplicate of test in Reference 243 No N2O data44 Only information on N2O emissions from global sources45 Data were pre-198846 Data were pre-198847 Test data taken from an airplane48 Duplicate of test in Reference 1249 Duplicate of test in Reference 250 Insufficient lab, process, analytical data51 Chemical kinetics calculation52 Insufficient lab, process, analytical data53 No N2O data54 No N2O data55 Insufficient lab, process, analytical data

4-18
56 No N2O data57 Duplicate of test in Reference 258 Insufficient lab, process, analytical data59 Insufficient lab, process, analytical data60 Insufficient lab, process, analytical data61 No N2O data62 Data were pre-198863 Data were pre-198864 Data were pre-198865 Data were pre-198866 Data were pre-198867 Solid waste co-fired in boiler68 Data were pre-198869 Data were pre-198870 Data were pre-198871 Data were pre-198872 Not citable as a primary reference73 Not citable as a primary reference74 Pilot-scale boiler75 Pilot-scale boiler76 Pilot-scale boiler77 Pilot-scale boiler
This screening resulted in the selection of three references which could beused to develop N2O emission factors. The following paragraphs discuss the datacontained in each of the primary references used to develop emission factors. Emission factor calculations were made in terms of mass of pollutant per unit massof coal feed. It should be noted that the terms "controlled" and "uncontrolled" in thisdiscussion are indicative only of the location at which the measurements were made[i.e., after or before control device(s), respectively].Reference 78
This reference contained N2O emissions data from eight full-scale tests. Alltest reports were rejected except for the test report from the Italian power plant. TheItalian power plant had two sources. One source combusted fuel oil while the othersource combusted bituminous coal. The data from both the boilers were acceptable;only the coal data were used for the update of AP-42 Section 1.1.
In the Italian test report, a B quality rating was assigned to the data from bothsources. The report provided adequate detail for validation and the sampling andanalysis methodology appeared sound.
Reference 79
This reference contained data from N2O emissions tests conducted at sixboilers. Data were used from four of the sources, because the other two boilerswere operated below 70 percent of full load (although the data were comparable). The acceptable N2O emissions data correspond to coal boiler test conducted withon-line GC. The tests were conducted after the economizer and flue gas cleaning.

4-19
An A quality rating would have been applied to the data except that thecalibration data showed excessively high values; therefore a B quality rating wasassigned.
Reference 80
This reference contained data for N2O emissions from FBCs. The data are ingraphical form and presented in units of milligrams per megajoule. The conversionfrom milligram per megajoule to ppm is one milligram per megajoule equals 1.7ppm. The test was performed on a circulating fluidized bed boiler controlled byrecirculation of flue gases. The reference case is defined by a bed temperature of850 °C (1,560 °F), a primary air stoichiometry of 0.75 and excess air ratio of 1.2. The actual emission values can only be estimated from the graphs and, therefore,the data were assigned a rating of D.
The new N2O emissions data are presented in Table 4-18 and a summary ofthe emission factor results are shown in Table 4-19.4.5 PARTICLE SIZE DISTRIBUTION
For the current revision, the scope of AP-42 was extended to includesegregation of filterable and condensible PM-10 emission factors along with theparticle size distribution data. The prior AP-42 updates include detailed analysis ofparticulate size distribution data. 4.5.1 Review of 1986 AP-42 Data
The 1986 database2 was evaluated with respect to sources of data, dataanalyses, and calculations. Data retrieved and analyzed for that update were allfilterable particulate.
Table 4-20 lists the sets of A and B rated data that the 1986 AP-42 emissionfactors update used. This table shows where high-quality data are lacking. TheFine Particulate Emission Inventory System (FPEIS) data base was the primarysource of emissions data for the 1986 update. In some instances, the data weregiven a low rating because of insufficient data in the FPEIS printouts. During theliterature search, original documents with primary test data were uncovered thatcorresponded to the FPEIS documents.
The original test document for the FPEIS Test Series Number 35 in the 1986background document is EPA-600/2-75-013-a (Reference 81). The tests wereconducted on a bituminous-coal-fired spreader stoker to determine the fractionalefficiency of the boiler baghouse. Inlet and outlet data are provided for 22 tests. All22 data sets were used for the particle size distribution for baghouse controlledspreader stokers and 21 of the 22 data sets were used in the preparation of the sizedistribution data for uncontrolled spreader stoker boilers. The data were B-rated inthe 1986 update because the system operating conditions and sampling flowrateisokinetic results were unknown. Review of the report did not uncover isokinetic

4-20
results; however, there was considerable discussion of the baghouse operatingconditions. Eleven of the 22 tests were conducted under normal baghouseoperating conditions while the remaining tests were conducted under experimentalconditions. The range of conditions may explain the large variation in the controlledemissions results. For instance, the cumulative mass less than 10 microns rangedfrom 16 percent to 96 percent. However, little difference was found overall bycomparing the average distribution of the "normal" runs with the average distributionof all 22 runs. Because of this finding, it was concluded that the data need not bechanged and are indeed representative of baghouse emission distributions. Thevalues in the 1986 background document were also spot-checked against thenumbers in the plots of the original test report. The numbers compared favorably.4.5.2 Review of New Data
A search for additional data was conducted. Of primary interest was CPMdata collected via EPA Method 202 because this particulate fraction has not beenaddressed in previous AP-42 updates. Unfortunately, only methods developmentsource test data were found because this is still a relatively new protocol.
Although a variety of sources were contacted regarding particulate sizing andPM-10 data, very little additional data were located. State and district offices thatwere contacted either had no PM-10 data available or were unable to process sucha request due to other staff commitments. Several groups within the California AirResources Board were contacted because California considers condensibleparticulate as a portion of total particulate; however, no data were received.
The New Jersey Air Pollution Control Office likely has particulate sizing datafor coal emissions. Their policy is to conduct data searches only when a writtenrequest is submitted which includes lists of specific facilities.82 Because specificfacility lists were unavailable, this avenue was not pursued.
One test report83 was obtained that contained CPM emission data for coal-fired boilers. The tests were conducted by EPA/OAQPS/EMB. The test objectiveswere to determine the adequacy of and produce documentation to support DraftMethod 202; revise the candidate method based on results of laboratoryexperiments; validate the method in field tests; and revise the method, if necessary.
It was not possible to prepare emission factors from the results. The data werpresented as mg emitted/m3 and no data were presented regarding the volumetricflue gas flow rate or the size of the boiler. F-factors are provided in 40 CFR Part60.45 to convert emissions into mass emitted per unit heat input. However, to usean F-factor, one must first be able to correct the flue gas volume to zero percent O2.

4-21
No data were available regarding the percent O2 in the flue gas flow; therefore thecalculation was not conducted.
Emission factors from these tests would not be reliable because the samplingwas single-point sampling rather than a duct traverse (since the objective was toexamine the test method rather than to obtain representative data). Therefore, anyemission factors derived from this data would be of D-rating. However, inferences may be drawn regarding the relative size of the organic and inorganic fractions ofthe CPM. These results are presented in Table 4-21. The results indicate that CPMoriginating from coal-fired boilers are at least 90 percent inorganic matter.
An EPRI report84 describes tests of a 22 MW Babcock and Wilcox front wallfired boiler fueled on low-sulfur bituminous coal. The particulate sizing data werecollected with a cascade impactor upstream of the fabric filter control system. Theresults are presented in Table 4-22. Total particulate was measured both upstreamand downstream of the fabric filter via EPA Method 5. The overall baghouseefficiency was 99.8 percent. Because sufficient raw data were not provided in thereport, the data were rated B quality. Because sufficient A quality data exist forpulverized coal-fired boilers in the 1988 version of AP-42, it was not necessary toincorporate these new data.
For atmospheric fluidized bed boilers, two sets of data are available for thefilterable particulate emissions.87 A pilot AFBC unit was tested while firing bothsubbituminous coal and lignite. The purpose of these tests was to investigate thecorrosive and/or erosive properties of low-rank coal ash on heat transfer surfaces.
As part of the test, the PM exiting a multicyclone system was measured forparticule size distribution. A flow sensor multicyclone and laser aerodynamicparticle sizer (APS) provided particle size distribution data at the inlet to the scrubber(after the multiclone controls). The APS is a real-time particle sizer that measuressizes in the range of 0.5 to 15 microns.
The data are rated as D quality due to the pilot-scale size, the particulatecollection methods, and lack of sufficient background data on protocols and unitoperation. For these tests, the cumulative percent mass collection values wereinferred via interpolation of log-log graphs of the results. The particulate sizedistribution data are shown on Table 4-23.
A paper presented at the 51st American Power Conference describesparticulate size distribution data from a coal-fired pressurized fluidized bedcombustion (PFBC) unit, before and after high-pressure, high-temperature emissioncontrol devices.86 As PFBC is not a common coal-combustion device at this time,these data were not evaluated.

4-22
4.6.3 Compilation of Uncontrolled Emission FactorsThe 1988 update was reviewed with respect to the procedure used to develop
emission factors from the particle size distribution data. The uncontrolled emissionfactors were calculated for each size fraction by multiplying the total particulateemission factor by the cumulative percent mass for the given size interval. Therefore all uncontrolled emission factors will change as a result of updating thetotal PM emission factors.
It is apparent that the level of uncertainty increases as one moves from thecumulative percent mass to the uncontrolled emission factors. The uncontrolledemission factors are functions of two numbers estimated generally from differentsets of data: the cumulative percent mass, and the total PM emission factor.
The filterable PM-10 emission factors are included in the particulate sizedistribution tables. There is currently no need to prepare tables devoted only to PM-10. As CPM data become available, a new table should be added to each AP-42section. The table should include columns for filterable PM-10, inorganic CPM, andorganic CPM.4.6.4 Control Technology Emission Factors
There were two calculation steps used in the development of controlledemission factors in the 1986 particulate sizing update.2 First, a controlled emissionfactor was developed for total particulate by multiplying the uncontrolled totalparticulate emission factor from the criteria pollutant table by one of the followingestimated control efficiency factors:
! Multiple cyclone - 80 percent,! Baghouse - 99.8 percent,! ESP - 99.2 percent, and! Scrubber - 94 percent.
Next, a controlled emission factor was developed for each of the cumulative sizeranges by multiplying the controlled emission factor for total particulate by thecumulative percent mass for the size range. Thus the quality of the right-hand sideof each size distribution table in Section 1.1 of AP-42 is directly related to the qualityof three other numbers: (1) the control efficiency factors, (2) the total particulateemission factor (from the criteria pollutant table), and (3) the cumulative percentmass data. This, in part, explains the low data rating generally listed in AP-42 forthe controlled particle-specific emission factors.
The disadvantage of this procedure is the loss of emission factor quality. Theadvantage of the procedure is that it allows the determination of control device-specific controlled emission factors rather than using generalized control efficiency

4-23
results. Control device-specific controlled emission factors are better thangeneralized control efficiencies results because control efficiency is dependent onparticulate parameters, such as the resistivity, and not just the particle sizedistribution.
It is useful to note that the procedure does not assume a single controlefficiency for each particle size. Rather, it assumes a single overall efficiency andapplies this to the total particulate emission factor. The size-based emission factorsdepend on the total controlled emission factor and the percent of the total controlledmass within a particular size range. For example, collected data indicated that 71percent of controlled PM from a wet scrubber is less than or equal to 10 microns. Based on this value; on an uncontrolled emission factor of 5A kg/Mg; and on anestimated scrubber control efficiency of 94 percent, the controlled PM-10 emissionfactor is calculated as 0.21 kg/Mg:
0.71 x 5A x (1.0-0.94) = 0.21 kg/Mg.
Although different methods could be used to develop controlled emissionestimates, the procedure used in the 1986 document2 is a logical way tocompensate for sparse data. The process appears to create conservatively highvalues for the controlled emission factors, as there are occasionally controlledemission factors in the tables that are larger than the uncontrolled factors.
The particulate control efficiencies for the four technologies used throughoutthe previous update are all reasonable and were retained in the current update.


TABLE 4-1. BACKGROUND DOCUMENT CHECK
Pollutant ConfigurationReferences cited in1988 AP-42 Section 1.1
SiteNo.
Emissionfactor
References spotchecked
PM PC dry bottom 15, 16, 17, 19, 21 EPA-650/7-80-171 (20) 17 10A 15, 17PM Handfired units 49, 50SO2 Bituminous emission-based 9, 16, 17, 18, 19, 21, 31, 37, 39, 41, 42, 43,
46, 51, 52, 5549 39S 17, 18
SO2 Bituminous retention-based 17, 18, 32, 33, 34, 35, 41, 42, 44, 45 11 39S 18SO2 Subbituminous 9, 17, 31, 53, 54 15 35S 17NOx PC dry bottom 11, 14, 16, 17, 21, 56 28 21 17NOx Handfired units 50CO Handfired units 50VOC PC dry bottom 58 17 .07 58VOC PC wet bottom 58VOC Cyclone, spreader stoker, overfeed stoker 58VOC Underfeed stoker 58VOC Handfired units 58, 50CH4 PC, Cyclone, Spreader Stoker, Overfeed
Stoker58 16 .03 58
CH4 Underfeed Stoker 58CH4 Handfired Units 58, 50
A = weight percent ash in fuelS = weight percent sulfur in fuel
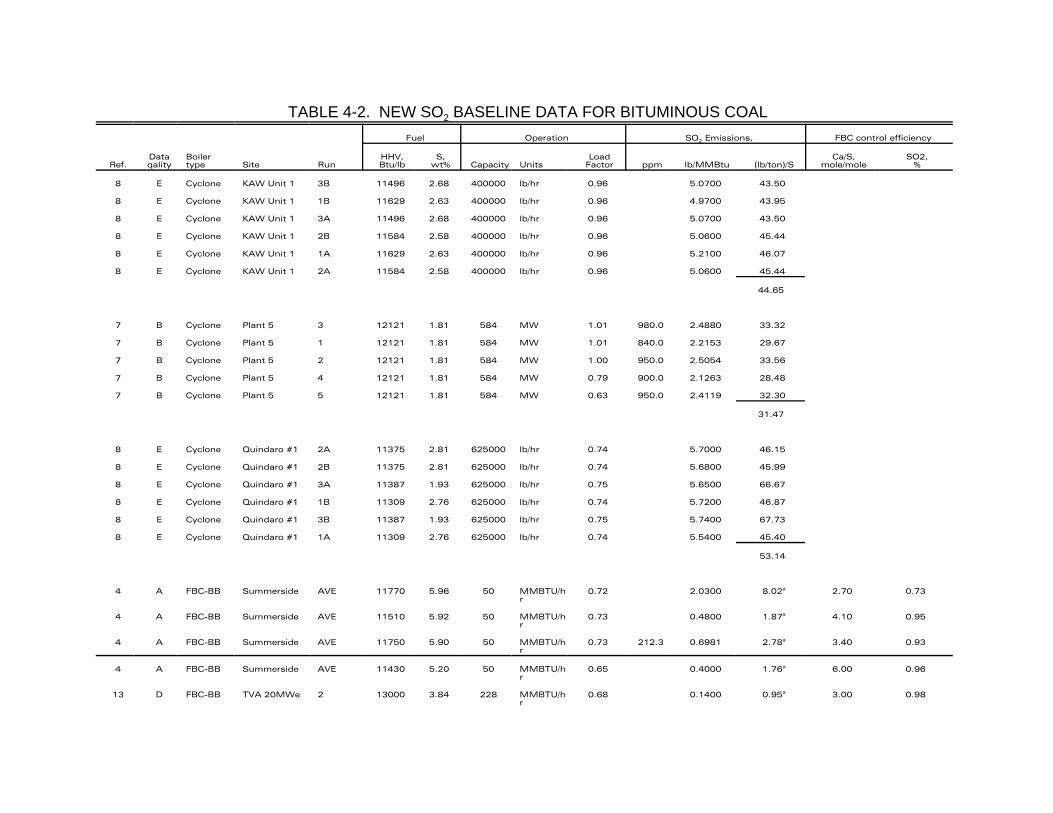
TABLE 4-2. NEW SO2 BASELINE DATA FOR BITUMINOUS COALFuel Operation SO2 Emissions, FBC control efficiency
Ref.Dataqality
Boilertype Site Run
HHV,Btu/lb
S,wt% Capacity Units
LoadFactor ppm lb/MMBtu (lb/ton)/S
Ca/S,mole/mole
SO2,%
8 E Cyclone KAW Unit 1 3B 11496 2.68 400000 lb/hr 0.96 5.0700 43.50
8 E Cyclone KAW Unit 1 1B 11629 2.63 400000 lb/hr 0.96 4.9700 43.95
8 E Cyclone KAW Unit 1 3A 11496 2.68 400000 lb/hr 0.96 5.0700 43.50
8 E Cyclone KAW Unit 1 2B 11584 2.58 400000 lb/hr 0.96 5.0600 45.44
8 E Cyclone KAW Unit 1 1A 11629 2.63 400000 lb/hr 0.96 5.2100 46.07
8 E Cyclone KAW Unit 1 2A 11584 2.58 400000 lb/hr 0.96 5.0600 45.44
44.65
7 B Cyclone Plant 5 3 12121 1.81 584 MW 1.01 980.0 2.4880 33.32
7 B Cyclone Plant 5 1 12121 1.81 584 MW 1.01 840.0 2.2153 29.67
7 B Cyclone Plant 5 2 12121 1.81 584 MW 1.00 950.0 2.5054 33.56
7 B Cyclone Plant 5 4 12121 1.81 584 MW 0.79 900.0 2.1263 28.48
7 B Cyclone Plant 5 5 12121 1.81 584 MW 0.63 950.0 2.4119 32.30
31.47
8 E Cyclone Quindaro #1 2A 11375 2.81 625000 lb/hr 0.74 5.7000 46.15
8 E Cyclone Quindaro #1 2B 11375 2.81 625000 lb/hr 0.74 5.6800 45.99
8 E Cyclone Quindaro #1 3A 11387 1.93 625000 lb/hr 0.75 5.6500 66.67
8 E Cyclone Quindaro #1 1B 11309 2.76 625000 lb/hr 0.74 5.7200 46.87
8 E Cyclone Quindaro #1 3B 11387 1.93 625000 lb/hr 0.75 5.7400 67.73
8 E Cyclone Quindaro #1 1A 11309 2.76 625000 lb/hr 0.74 5.5400 45.40
53.14
4 A FBC-BB Summerside AVE 11770 5.96 50 MMBTU/hr
0.72 2.0300 8.02a 2.70 0.73
4 A FBC-BB Summerside AVE 11510 5.92 50 MMBTU/hr
0.73 0.4800 1.87a 4.10 0.95
4 A FBC-BB Summerside AVE 11750 5.90 50 MMBTU/hr
0.73 212.3 0.6981 2.78a 3.40 0.93
4 A FBC-BB Summerside AVE 11430 5.20 50 MMBTU/hr
0.65 0.4000 1.76a 6.00 0.96
13 D FBC-BB TVA 20MWe 2 13000 3.84 228 MMBTU/hr
0.68 0.1400 0.95a 3.00 0.98

TABLE 4-2. NEW SO2 BASELINE DATA FOR BITUMINOUS COALFuel Operation SO2 Emissions, FBC control efficiency
Ref.Dataqality
Boilertype Site Run
HHV,Btu/lb
S,wt% Capacity Units
LoadFactor ppm lb/MMBtu (lb/ton)/S
Ca/S,mole/mole
SO2,%
13 D FBC-BB TVA 20MWe 1 13000 4.45 228 MMBTU/hr
0.68 0.9600 5.61a 3.00 0.87
13 D FBC-C BATTELLE 1 13000 1.50 50 MMBTU/hr
0.1200 2.08 4.50 0.95
3 C Hand-Fed CoalStove
14119 0.77 0.01 MMBTU/hr
208.0 0.8957 32.69
3 E Hand-Fed ModifiedWoodStove
13421 0.79 0.01 MMBTU/hr
430.0 2.1201 72.07
6 A PC-fired Quindaro #2 2B 11201 1.70 145 MW 0.83 2.9700 39.14
6 A PC-fired Quindaro #2 2A 11201 1.70 145 MW 0.83 2.8600 37.69
6 A PC-fired Quindaro #2 4A 11304 1.72 145 MW 0.83 2.8500 37.46
6 A PC-fired Quindaro #2 4B 11304 1.72 145 MW 0.83 2.8900 37.99
6 A PC-fired Quindaro #2 3A 11185 1.77 145 MW 0.83 2.9700 37.54
6 A PC-fired Quindaro #2 1A 11230 1.80 145 MW 0.83 2.8100 35.06
6 A PC-fired Quindaro #2 3B 11185 1.77 145 MW 0.83 2.9400 37.16
37.43
5 A PC-TFired 3 8104 0.44 100 MW 1.02 1.1000 40.52
5 A PC-TFired 2 8104 0.44 100 MW 1.02 1.0390 38.27
5 A PC-TFired 1 8104 0.44 100 MW 1.02 1.0200 37.57
38.79
aSO2 emissions controlled by the addition of sorbents (e.g., limestone) to the FBC.S = weight percent sulfur in fuel

TABLE 4-3. NEW NOx BASELINE DATA FOR BITUMINOUS COALFuel Operation NOx emissions,
Ref.Dataqality Boiler type Site Run
HHV,Btu/lb
S,wt%
N,wt%
Ash,wt% Capacity Units
Loadfactor lb/MMBtu lb/to
n
7 B Cyclone Plant 5 4 12121 1.81 13.81 584 MW 0.79 0.5773 14.00
7 B Cyclone Plant 5 1 12121 1.81 13.81 584 MW 1.01 0.5307 12.87
7 B Cyclone Plant 5 3 12121 1.81 13.81 584 MW 1.01 0.7117 17.25
7 B Cyclone Plant 5 2 12121 1.81 13.81 584 MW 1.00 0.6445 15.62
7 B Cyclone Plant 5 5 12121 1.81 13.81 584 MW 0.63 0.6387 15.48
15.04
4 A FBC-BB Summerside Avg. 11430 5.20 1.05 11.20 50 MMBtu/hr 0.65 0.6800 15.54
4 A FBC-BB Summerside Avg. 11750 5.90 1.06 9.58 50 MMBtu/hr 0.73 0.6195 14.56
4 A FBC-BB Summerside Avg. 11510 5.92 1.08 11.40 50 MMBtu/hr 0.73 0.6500 14.96
4 A FBC-BB Summerside Avg. 11770 5.96 1.03 9.73 50 MMBtu/hr 0.72 0.6700 15.77
15.21
13 D FBC-BB TVA 20MWe 1 13000 4.45 228 MMBtu/hr 0.68 0.3400 8.84
13 D FBC-BB TVA 20MWe 2 13000 3.84 228 MMBtu/hr 0.68 0.2300 5.98
7.41
13 D FBC-C BATTELLE 1 13000 1.50 50 MMBtu/hr 0.1500 3.90
3 C Hand-Fed Mod-ifiedwoodstove
13421 0.79 5.43 0.01 MMBtu/hr 0.5670 15.22

TABLE 4-3. NEW NOx BASELINE DATA FOR BITUMINOUS COALFuel Operation NOx emissions,
Ref.Dataqality Boiler type Site Run
HHV,Btu/lb
S,wt%
N,wt%
Ash,wt% Capacity Units
Loadfactor lb/MMBtu lb/to
n
5 A PC:T-Fired 1 8104 0.44 5.42 100 MW 1.02 0.4310 6.99
5 A PC:T-Fired 3 8104 0.44 5.42 100 MW 1.02 0.4140 6.71
5 A PC:T-Fired 2 8104 0.44 5.42 100 MW 1.02 0.4390 7.12
6.94
10 A Stoker-spreader
Boiler 24 2 12906 320000 lb/hr 0.82 0.7500 19.36
10 A Stoker-spreader
Boiler 24 6 13581 320000 lb/hr 0.82 0.5750 15.62
10 A Stoker-spreader
Boiler 24 7 13761 320000 lb/hr 0.81 0.6900 18.99
10 A Stoker-spreader
Boiler 24 5 13674 320000 lb/hr 1.00 0.6550 17.91
10 A Stoker-spreader
Boiler 24 1 13203 320000 lb/hr 0.81 0.6000 15.84
17.54
11 A Stoker-spreader
Kalamazoo 2 13645 90000 lb/hr 1.00 0.4347 11.86
11 A Stoker-spreader
Kalamazoo 6 13592 90000 lb/hr 0.75 0.3567 9.70
11 A Stoker-spreader
Kalamazoo 3 13617 90000 lb/hr 0.75 0.4626 12.60
11 A Stoker-spreader
Kalamazoo 8 13827 90000 lb/hr 0.75 0.5066 14.01
11 A Stoker-spreader
Kalamazoo 5 13059 90000 lb/hr 0.75 0.5345 13.96
11 A Stoker-spreader
Kalamazoo 4 13576 90000 lb/hr 1.00 0.3702 10.05
11 A Stoker-spreader
Kalamazoo 1 13727 90000 lb/hr 1.00 0.4032 11.07
11 A Stoker-spreader
Kalamazoo 9 13559 90000 lb/hr 0.75 0.3840 10.41

TABLE 4-3. NEW NOx BASELINE DATA FOR BITUMINOUS COALFuel Operation NOx emissions,
Ref.Dataqality Boiler type Site Run
HHV,Btu/lb
S,wt%
N,wt%
Ash,wt% Capacity Units
Loadfactor lb/MMBtu lb/to
n
11 A Stoker-spreader
Kalamazoo 10 13628 90000 lb/hr 0.75 0.3546 9.67
11.48

TABLE 4-4. NEW CO BASELINE DATAFuel Operation CO Emissions,
Ref.Dataqualit
y
Boilertype Fuel Site Run
HHV,Btu/lb
N,wt%
Ash,wt% Capacit
yUnits
Loadfacto
rppm lb/MMBtu lb/ton
7 B Cyclone Bituminous Plant 5 3 12121
13.81
584 MW 1.01 7.3 0.0068 0.16
7 B Cyclone Bituminous Plant 5 1 12121
13.81
584 MW 1.01 12.9 0.0129 0.31
7 B Cyclone Bituminous Plant 5 4 12121
13.81
584 MW 0.79 9.4 0.0090 0.22
7 B Cyclone Bituminous Plant 5 2 12121
13.81
584 MW 1.00 8.0 0.0075 0.18
0.22
7 B Cyclone Bituminous Plant 6 4 8895 11.06
180 MW 0.94 36.4 0.0354 0.63
7 B Cyclone Bituminous Plant 6 3 8895 11.06
180 MW 1.03 17.9 0.0168 0.30
7 B Cyclone Bituminous Plant 6 5 8895 11.06
180 MW 0.98 15.1 0.0146 0.26
7 B Cyclone Bituminous Plant 6 1 8895 11.06
180 MW 1.00 28.3 0.0277 0.49
7 B Cyclone Bituminous Plant 6 2 8895 11.06
180 MW 1.02 12.1 0.0120 0.21
0.38
4 A FBC-BB Bituminous Summerside
Avg. 11750
1.06 9.58 50 MMBtu/hr
0.73 419.2 0.6032 14.17
4 A FBC-BB Bituminous Summerside
Avg. 11510
1.08 11.40
50 MMBtu/hr
0.73 452.8 0.6418 14.78
4 A FBC-BB Bituminous Summerside
Avg. 11430
1.05 11.20
50 MMBtu/hr
0.65 800.7 1.1788 26.95
4 A FBC-BB Bituminous Summerside
Avg. 11770
1.03 9.73 50 MMBtu/hr
0.72 432.4 0.6560 15.44
17.83
3 C Hand-Fed Bituminous Modifiedwood stove
13421
5.43 0.01 MBtu/hr 4000.0 8.6283 231.60
3 C Hand-Fed Bituminous Coal stove 14119
3.09 0.01 MBtu/hr 6000.0 11.3042 319.20
275.40
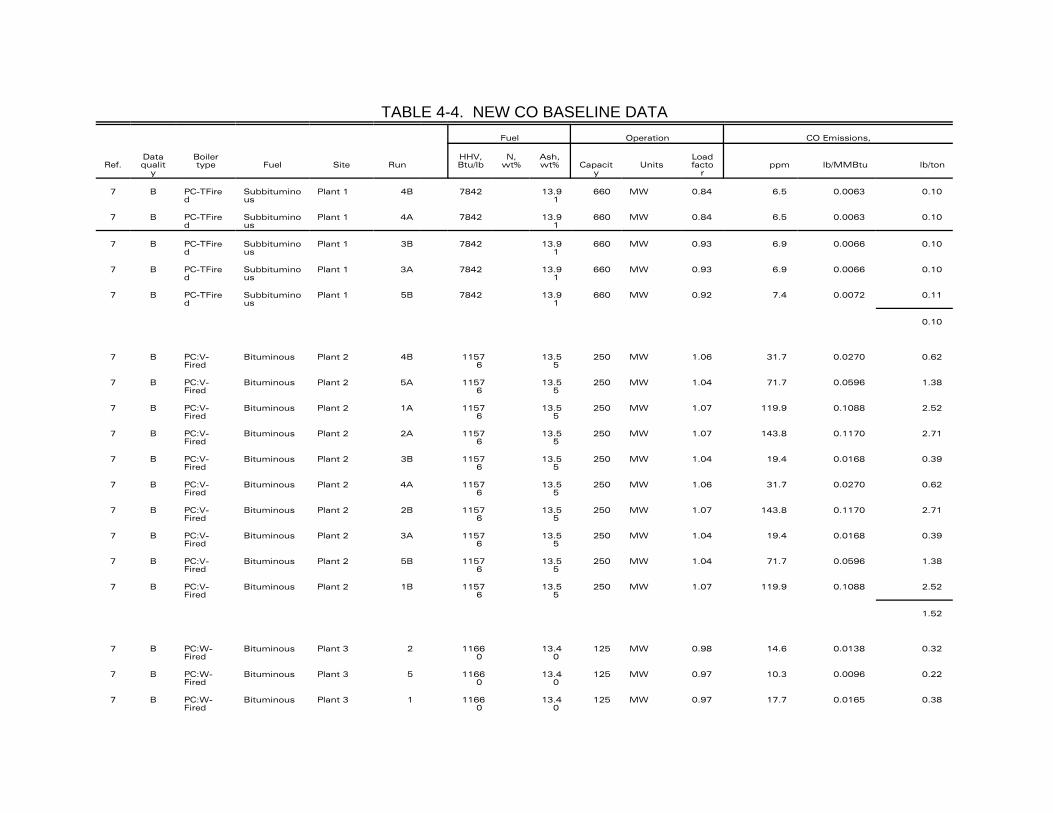
TABLE 4-4. NEW CO BASELINE DATAFuel Operation CO Emissions,
Ref.Dataqualit
y
Boilertype Fuel Site Run
HHV,Btu/lb
N,wt%
Ash,wt% Capacit
yUnits
Loadfacto
rppm lb/MMBtu lb/ton
7 B PC-TFired
Subbituminous
Plant 1 4B 7842 13.91
660 MW 0.84 6.5 0.0063 0.10
7 B PC-TFired
Subbituminous
Plant 1 4A 7842 13.91
660 MW 0.84 6.5 0.0063 0.10
7 B PC-TFired
Subbituminous
Plant 1 3B 7842 13.91
660 MW 0.93 6.9 0.0066 0.10
7 B PC-TFired
Subbituminous
Plant 1 3A 7842 13.91
660 MW 0.93 6.9 0.0066 0.10
7 B PC-TFired
Subbituminous
Plant 1 5B 7842 13.91
660 MW 0.92 7.4 0.0072 0.11
0.10
7 B PC:V-Fired
Bituminous Plant 2 4B 11576
13.55
250 MW 1.06 31.7 0.0270 0.62
7 B PC:V-Fired
Bituminous Plant 2 5A 11576
13.55
250 MW 1.04 71.7 0.0596 1.38
7 B PC:V-Fired
Bituminous Plant 2 1A 11576
13.55
250 MW 1.07 119.9 0.1088 2.52
7 B PC:V-Fired
Bituminous Plant 2 2A 11576
13.55
250 MW 1.07 143.8 0.1170 2.71
7 B PC:V-Fired
Bituminous Plant 2 3B 11576
13.55
250 MW 1.04 19.4 0.0168 0.39
7 B PC:V-Fired
Bituminous Plant 2 4A 11576
13.55
250 MW 1.06 31.7 0.0270 0.62
7 B PC:V-Fired
Bituminous Plant 2 2B 11576
13.55
250 MW 1.07 143.8 0.1170 2.71
7 B PC:V-Fired
Bituminous Plant 2 3A 11576
13.55
250 MW 1.04 19.4 0.0168 0.39
7 B PC:V-Fired
Bituminous Plant 2 5B 11576
13.55
250 MW 1.04 71.7 0.0596 1.38
7 B PC:V-Fired
Bituminous Plant 2 1B 11576
13.55
250 MW 1.07 119.9 0.1088 2.52
1.52
7 B PC:W-Fired
Bituminous Plant 3 2 11660
13.40
125 MW 0.98 14.6 0.0138 0.32
7 B PC:W-Fired
Bituminous Plant 3 5 11660
13.40
125 MW 0.97 10.3 0.0096 0.22
7 B PC:W-Fired
Bituminous Plant 3 1 11660
13.40
125 MW 0.97 17.7 0.0165 0.38

TABLE 4-4. NEW CO BASELINE DATAFuel Operation CO Emissions,
Ref.Dataqualit
y
Boilertype Fuel Site Run
HHV,Btu/lb
N,wt%
Ash,wt% Capacit
yUnits
Loadfacto
rppm lb/MMBtu lb/ton
7 B PC:W-Fired
Bituminous Plant 3 3 11660
13.40
125 MW 0.97 11.7 0.0110 0.26
7 B PC:W-Fired
Bituminous Plant 3 4 11660
13.40
125 MW 0.97 8.8 0.0082 0.19
0.28
7 B PC:W-Fired
Bituminous Plant 4 1 11920
11.78
217 MW 0.96 9.2 0.0096 0.23
7 B PC:W-Fired
Bituminous Plant 4 2 11920
11.78
217 MW 0.98 17.0 0.0176 0.42
7 B PC:W-Fired
Bituminous Plant 4 3 11920
11.78
217 MW 0.99 20.1 0.0208 0.50
7 B PC:W-Fired
Bituminous Plant 4 4 11920
11.78
217 MW 0.98 24.4 0.0250 0.60
0.43
10 A SprdrStkr
Bituminous Boiler 24 1 13203
320000
lb/hr 0.81 29.0 0.0271 0.72
10 A SprdrStkr
Bituminous Boiler 24 6 13581
320000
lb/hr 0.82 60.0 0.0572 1.55
10 A SprdrStkr
Bituminous Boiler 24 7 13761
320000
lb/hr 0.81 40.0 0.0431 1.19
10 A SprdrStkr
Bituminous Boiler 24 5 13674
320000
lb/hr 1.00 96.0 0.0928 2.54
10 A SprdrStkr
Bituminous Boiler 24 2 12906
320000
lb/hr 0.82 72.0 0.0782 2.02
1.60
11 A SprdrStkr
Bituminous Kalamazoo
2 13645
90000 lb/hr 1.00 42.0 0.0434 1.18
11 A SprdrStkr
Bituminous Kalamazoo
6 13592
90000 lb/hr 0.75 36.0 0.0315 0.86
11 A SprdrStkr
Bituminous Kalamazoo
3 13617
90000 lb/hr 0.75 24.0 0.0241 0.66
11 A SprdrStkr
Bituminous Kalamazoo
8 13827
90000 lb/hr 0.75 22.0 0.0236 0.65
11 A SprdrStkr
Bituminous Kalamazoo
5 13059
90000 lb/hr 0.75 26.0 0.0300 0.78
11 A SprdrStkr
Bituminous Kalamazoo
4 13576
90000 lb/hr 1.00 42.0 0.0353 0.96

TABLE 4-4. NEW CO BASELINE DATAFuel Operation CO Emissions,
Ref.Dataqualit
y
Boilertype Fuel Site Run
HHV,Btu/lb
N,wt%
Ash,wt% Capacit
yUnits
Loadfacto
rppm lb/MMBtu lb/ton
11 A SprdrStkr
Bituminous Kalamazoo
1 13727
90000 lb/hr 1.00 63.0 0.0548 1.51
11 A SprdrStkr
Bituminous Kalamazoo
9 13559
90000 lb/hr 0.75 28.0 0.0256 0.69
11 A SprdrStkr
Bituminous Kalamazoo
10 13628
90000 lb/hr 0.75 43.0 0.0374 1.02
0.92

TABLE 4-5. NEW PM BASELINE DATA FOR BITUMINOUS COALFuel Operation PM Emissions,
Ref.Data qality
Boiler type Site Run
HHV,Btu/lb
S,wt%
Ash,wt% Capacity Units
Load factor lb/MMBt
ulb/ton
3 C Hand-Fed Coal Stove 14119 0.77 3.09 0.01 MMBtu/hr 20.94
3 C Hand-Fed Modified WoodStove
13421 0.79 5.43 0.01 MMBtu/hr 10.14
15.54
9 A PC- Quindaro #2 1 11460 2.69 12.43 145 MW 0.91 9.9130 227.21
9 A PC- Quindaro #2 2 11460 2.69 12.43 145 MW 0.92 10.4090 238.57
9 A PC- Quindaro #2 3 11061 2.71 14.06 145 MW 0.89 12.3170 272.48
9 A PC- Quindaro #2 5 11161 2.63 13.23 145 MW 0.89 9.7040 216.61
238.72
12 B Stoker-Spreader
Clarksville 2 13885 0.69 6.10 150000 lb/hr 1.00 6.7000 186.06
12 B Stoker-Spreader
Clarksville 3 13771 0.68 6.50 150000 lb/hr 1.00 5.2200 143.77
12 B Stoker-Spreader
Clarksville 4 13728 0.62 7.50 150000 lb/hr 0.66 4.7900 131.51
12 B Stoker-Spreader
Clarksville 5 13846 0.68 6.00 150000 lb/hr 0.66 5.1600 142.89
12 B Stoker-Spreader
Clarksville 6 13808 0.85 5.40 150000 lb/hr 0.66 9.8200 271.19
175.08

TABLE 4-6. NEW CH4 BASELINE DATA FOR BITUMINOUS COALFuel Operation CH4 Emissions,
Ref.Dataqualit
y
Boilertype Fuel Run
HHV,Btu/lb
S,wt%
Ash,wt% Capacity Units ppm lb/MMbtu lb/ton
3 C Hand-Fed
Bituminous
Coal Stove 14119 0.77 3.09 0.01 MMBtu/hr 210.0 0.2261 6.38
3 C Hand-Fed
Bituminous
Modified WoodStove
13421 0.79 5.43 0.01 MMBtu/hr 95.0 0.1171 3.14
4.76

Table 4-7. CONTROLLED PM EMISSIONS
Boiler capacity,actual/design Boiler type
Fuel
Control technology
Emissions (uncontrolled/controlled),lb/MMBtu
Removalefficiency (%) Ref.S,
wt %Ash,wt %
HHV,Btu/lb
36 MW Coal/industrial Wet scrubber (311 kg/hr/2.0 kg/hr) 99.4 20
10.2/15 MW34/50 MMBtu/hr
Coal fired/spreader stoker
0.8 9.7 12,900 Side streamseparator
(23.3a/0.12) 99.5a 21
12.6-14/15 MW39-47/50 MMBtu/hr
Coal fired/spreader stoker
1.8 9.0 12,400 Side streamseparator
(24.2a/0.12) 99.5a 21
15.6-16/20 MW55-56/70 MMBtu/hr
Coal fired/spreader stoker
0.9 4.3 13,700 Side streamseparator
(21.9a/0.12) 99.4a 21
16.3-18.4/23 MW56.8-64/80 MMBtu/hr
Coal fired/spreader stoker
0.8 10.1 11,400 Side streamseparator
(26.3a/0.13) 99.6a 21
17.8-18.9/18 MW59.4-63/60 MMBtu/hr
Coal fired/spreader stoker
2.1 8.8 12,400 Side streamseparator
(24.2a/0.14) 99.4a 21
17.5-19.4/18 MW53.8-65/60 MMBtu/hr
Coal fired/spreader stoker
0.8 7.8 13,100 Side streamseparator
(22.9a/0.17) 99.3a 21
24.7-28.1/29 MW85-91/100 MMBtu/hr
Coal fired/spreader stoker
1.7 6.1 13,100 Side streamseparator
(22.9a/0.16) 99.3a 21
9/9 MW31/31 MMBtu/hr Coal fired/spreader stoker
1.3 7.8 13,200 Side streamseparator
(22.7a/0.12) 99.6a 21
50.4/69 MW172.3/236 MMBtu/hr
Coal fired 2.6 11.4 NR Wet scrubber/venturi
(NR/0.10) N/A 21
58.7-62.8/69 MW200-215/236 MMBtu/hr
Coal fired 2.5 10.4 NR Wet scrubber/venturi
(NR/0.07) N/A 21
34/37 MW115/125 MMBtu/hr
Coal fired 1.3 4.4 NR Wet scrubber/venturi
(NR/0.08) N/A 21
18.6-19/19 MW62.7-64/64 MMBtu/hr
Coal firedspreader stoker
2.8 6.9 13,600 Fabric filter (a22.1 /0.015) 99.7a 21
16-18.2/19 MW58.3-61.4/64 MMBtu/hr
Coal firedspreader stoker
0.8 6.9 NR Fabric filter (NR/0.033) N/A 21
28.5/37 MW96/125 MMBtu/hr
Coal firedspreader stoker
2.6 7.0 13,500 Fabric filter (a22.2/0.01) 100.0a 21
43.2/45 MW173.8/18 MMBtu/hr
Coal firedspreader stoker
2.9 6.5 13,800 Fabric filter (a21.7/0.028) 99.9a 21
23.4/33 MW81.7/115 MMBtu/hr
Coal fired/FBC 3.6 12.3 11,900 Fabric filter (NR/0.019 lb/MMBtu)
N/A 21
9.6/13 MW35.5/48 MMBtu/hr
Coal fired/spreader stoker
0.6 8.3 13,700 Fabric filter (a21.9 lb/MMBtu/0.016 lb/MMBtu)
99.9a 21
58.4/59 MW206/208 MMBtu/hr
Circulating FBC 0.4 8.8 12,200 Fabric filter (a24.6 lb/MMBtu/0.035 lb/MMBtu)
99.8a 21
27.8-28.6/27 MW95-98/92 MMBtu/hr
Coal fired/spreader stoker
NR 12.0 12,500 ESP (a24.0 lb/MMBtu/0.007 lb/MMBtu)
99.9a 21

Table 4-7. CONTROLLED PM EMISSIONS
Boiler capacity,actual/design Boiler type
Fuel
Control technology
Emissions (uncontrolled/controlled),lb/MMBtu
Removalefficiency (%) Ref.S,
wt %Ash,wt %
HHV,Btu/lb
32.6-34.3/35 MW112-118/120 MMBtu/hr
Coal fired/spreader stoker
1.0 11.2 12,500 ESP (a24.0 lb/MMBtu/0.006 lb/MMBtu)
99.9a 21
45.5-46.9/46 MW154-159/156 MMBtu/hr
Coal fired/spreader stoker
0.57 11.4 11,400 ESP (a26.3 lb/MMBtu/0.012 lb/MMBtu)
100.0a 21
63.5-65/73 MW218-223/250 MMBtu/hr
Coal fired/spreader stoker
0.73 6.6 13,100 ESP (a22.9 lb/MMBtu/0.021 lb/MMBtu)
99.9a 21
83.6/110 MW285/375 MMBtu/hr
Coal fired/spreader stoker
0.54 8.3 10,200 ESP (a29.4 lb/MMBtu/0.044 lb/MMBtu)
99.9a 21
57.2-64.9/110 MW195/221 MMBtu/hr
Coal fired/spreader stoker
0.63 5.4 10,600 ESP (a28.3 lb/MMBtu/0.018 lb/MMBtu)
99.9a 21
aCalculatedNR = not reported

TABLE 4-8. CONTROLLED SOx EMISSIONS
Boiler capacity,actual/design Boiler type Control technology
Emissions (uncontrolled/controlled),lb/MMBtua
Removalefficiency,
%Ref.Fuel Sa,
%
NR/36 MW Coal/industrial Wet scrubber (115 kg/h/3.7 kg/h) 96.8 20
NR/400 MWNR/1360 MMBtu/hr
Coal 2.5-2.8 Dual alkali/wet scrubber (5.4/0.65 lb/MMBTU) 88.0 22
NR/163 MWNR/570 MMBtu/hr
Coal 2.5 Dual alkali/wet scrubber (3.85/0.31 lb/MMBTU) 92.2 22
NR/40 MWNR/140 MMBtu/hr
Coal 3-3.5 Dual alkali/wet scrubber (5.6/0.47 lb/MMBTU) 91.2 22
82/82 MW280/280 MMBtu/hr
Pulverized coal 13.33 lb SO2/MMBtu Dual alkali/wet scrubber N/A 74.5 22
26/34 MW86.3/115 MMBtu/hr
Pulverized coal .96 lbSO2/MMBtu
Lime spray dry FGD N/A 92.4 22
24/69 MW82.1/235 MMBtu/hr
Coal spreader stoker 5.09 lb SO2/MMBtu Lime spray dry FGD N/A 79.7 22
48/69 MW1645/235 MMBtu/hr
Spreader stoker 5.09 lb SO2/MMBtu Lime spray dry FGD N/A 89.9 22
57/69 MW193/235 MMBtu/hr
Spreader stoker 5.09 lb SO2/MMBtu Lime spray dry FGD N/A 95.6 22
35-52/69 MW118-174/235 MMBtu/hr
Spreader stoker 6.6 lb SO2/MMBtu
Lime spray dry FGD N/A 64-96 22
69/69 MW235/235 MMBtu/hr
Pulverized coal .96 lb SO2/MMBtu
Lime spray dry FGD N/A 96.6 22
305,000 SCFM Industrial coal 3.0 Double Alkali System (18,000 ppm/ 1,800 ppm) 90 23
210,000 SCFM Industrial coal 3.2 Double Alkali System (20,000 ppm/ 2,000 ppm) 90 23
67,000 SCFM Industrial coal 3.2 Double Alkali System (20,000 ppm/ 2,000 ppm) 90 23
236,000 SCFM Industrial coal 3.2 Double Alkali System (20,000 ppm/ 2,000 ppm) 90 23
38,000 SCFM Industrial coal 3.2 Double Alkali System (20,000 ppm/ 2,000 ppm) 90 23
140,000 SCFM Industrial coal 3.2 Double Alkali System (20,000 ppm/ 2,000 ppm) 90 23
8,070 SCFM Industrial coal 2.5-3.0 Double Alkali System (10,000 ppm/ 1,000 ppm) 90.5 23
128,400 SCFM Industrial coal 2.5 Double Alkali System (8,000 ppm/ 800 ppm) 90 23
aUnless otherwise notedN/A = Not available

TABLE 4-9. CONTROLLED NOX EMISSIONS
Boiler load level Boiler type Control technology
Emissions (uncontrolled/controlled),lb/MMBtu
Removalefficiency, % Ref.Fuel N,
wt %
14.6/18 MW51/63 MMBtu/hr
Coal/spreader stoker 1.5 LEA (0.635/0.452) 29 24
23.5/28 MW79/94 MMBtu/hr
Coal/spreader stoker 1.4 LEA (0.634/0.491) 23 24
28.7/29 MW98/99 MMBtu/hr
Coal/spreader stoker 1.0 LEA (0.540/0.412) 24 24
28.7/29 MW98/99 MMBtu/hr
Coal/spreader stoker 1.0 LEA (0.572/0.401) 30 24
21.8/29 MW73.5/98 MMBtu/hr
Coal/spreader stoker 1.2 LEA (0.468/0.443) 5 24
21.8/29 MW73.5/98 MMBtu/hr
Coal/spreader stoker 1.1 LEA (0.454/0.312) 31 24
21.8/29 MW75/h/100 MMBtu/hr
Coal/spreader stoker 1.1 LEA (0.506/0.405) 20 24
22/29 MW76/100 MMBtu/hr
Coal/spreader stoker 0.5 LEA (0.483/0.418) 13 24
16.9/22 MW57.8/75 MMBtu/hr
Coal/underfed stoker 1.4 LEA (0.364/0.263) 28 24
16.9/22 MW57.8/75 MMBtu/hr
Coal/underfed stoker 1.4 LEA (0.433/0.361) 17 24
29.1/28 MW98.8/95 MMBtu/hr
Coal/overfed stoker 1.8 LEA (0.400/0.283) 29 24
28.6/28 MW96.9/95 MMBtu/hr
Coal/overfed stoker 1.4 LEA (0.229/0.211) 8 24
23/23 MW77/77 MMBtu/hr
Coal/overfed stoker 1.7 LEA (0.353/0.316) 10 24
18.2/18 MW63.6/63 MMBtu/hr
Coal/overfed stoker 1.6 LEA (0.324/0.310) 4 24
9.1/6 MW31.9/56 MMBtu/hr
Coal/vibrating grate stoker 0.9 LEA (0.277/0.209) 25 24
40-82%-150 MWe PC: tangentially fired N/A OFA (0.59/0.48) 19 25
40-82%-150 MWe PC: wall fired N/A OFA (0.77/0.06) 22 25
40-82%-150 MWe PC: wall fired N/A LNB + OFA (0.77/0.33) 57 25
40-82%-150 MWe PC: wall fired N/A LNB (0.77/0.45) 42 25
40-82%-150 MWe PC: tangentially fired N/A LBN + OFA + FGR (0.58/0.28) 52 25
40-82%-150 MWe PC: tangentially fired N/A SNCR (0.70/0.35) 50 25
40-82%-150 MWe PC: wall fired N/A SNCR (0.28/0.18) 36 25

TABLE 4-9. CONTROLLED NOX EMISSIONS
Boiler load level Boiler type Control technology
Emissions (uncontrolled/controlled),lb/MMBtu
Removalefficiency, % Ref.Fuel N,
wt %
40-82%-150 MWe PC: wall fired N/A SCR (0.28/0.08) 71 25
40-82%-150 MWe PC: tangentially fired N/A SCR (0.70/0.15) 79 25
40-82%-190 MWe Cyclone N/A NGR (1.28/0.56) 56 25
60-123 MWe/150 MWe Coal/wall fired N/A OFA (0.77/0.60) 22 25
60-123 MWe/150 MWe Coal/wall fired N/A LNB (0.77/0.45) 41 25
60-123 MWe/150 MWe Coal/wall fired N/A LNB + OFA (0.77/0.33) 57 25
60-123 MWe/150 MWe Coal/tangential N/A LNB + OFA +FGR (0.58/0.28) 52 25
60-123 MWe/150 MWe Coal/cyclone N/A reburn (1.28/0.55) 57 25
60-123 MWe/150 MWe Coal/wall + tangential N/A SCR (0.28/0.08) 71 25
60-123 MWe/150 MWe Coal/wall + tangential N/A SCR (0.70/0.15) 78 25
60-123 MWe/150 MWe Coal/wall + tangential N/A SNCR (0.28/0.18 ) 35 25
60-123 MWe/150 MWe Coal/wall + tangential N/A SNCR (0.70/0.35) 50 25
60-123 MWe/150 MWe PC: tangentially fired N/A OFA (0.59/0.48) 19 25
LEA = Low excess airOFA = Overfired air portsLNB = Low NOx burnerFGR = Flue gas recirculationNGR = Natural gas reburnN/A = Not available

TABLE 4-10 METAL ENRICHMENT BEHAVIORSClass Description Reference 35 Reference 28 Reference 39
I Equal distributionbetween fly ash andbottom ash
Aluminum (Al), Cobalt (Co), Iron(Fe), Manganese (Mn), Scandium(Sc), Titanium (Ti)
Al, Co, Chromium (Cr),Fe Mn, Sc, Ti
II Enriched in fly ashrelative to bottomash
Arsenic (As), Cadmium(Cd)
As, Cd, Lead (Pb), Antimony (Sb) As, Cd, Pb, Sb
III Somewhere inbetween Class I andII, multiple behavior
Beryllium (Be), Cr, Nickel(Ni), Mn
Cr, Ni Ni
IV Emitted in gasphase
Mercury (Hg) Hg Hg
TABLE 4-11. ENRICHMENT RATIOS FOR CLASSES OF ELEMENTSClass Description Metals Fly ash enrichment ratio
I Nonvolatile Cr, Sc, Ti, Fe ER . 1
IIa Volatile with varying condensation onash particles
As, Cd, Pb, Sb ER > 4
IIb Be, Co, Ni 2 < ER < 4
IIC Mn 1.3 < ER # 2
III Very volatile, almost no condensation Hg, Se
ER = Enrichment ratio

TABLE 4-12. ENRICHMENT RATIOS FOR BOILERS AND ESPBoiler type(SCC) Sb As Be Cd Cr Co Pb Mn Hg Ni Se
Th232
Th228
U238
Th230
Ra226
Pb210
PulverizedCoalDry Bottom (10100202)
1.07 1.25 0.55 0.56 0.98 1.02 1.48 1.07 0.72 0.97 1.01 1.43 0.96 1.19 0.98 1.33
PulverizedCoal Dry Bottom Tangential(10100212)
0.97to1.33
1.08to1.27
0.78to1.12
0.49to0.88
0.42to0.97
0.90to0.97
1.28to1.42
0.86to1.02
0.71 0.94to1.54
0.75to0.82
1.04to1.16
0.92to1.16
1.06to1.24
1.19 0.95to1.19
1.36
HighefficiencyCold-sideESP
5.4to26
5to29.6
2.1 9 1to21.7
1.1to9.9
3.0to18.3
1.4to13.8
1.0to19.3
1.8to10.1
7to86.2
0.04to0.88
1.19 1.15to1.35
1.68 0.94

TABLE 4-13. HAP EMISSION FACTORS (ENGLISH UNITS) FOR UNCONTROLLED BITUMINOUS COAL-FIREDBOILERSa
Firing configuration(SCC) As Be Cd Cr Pb Mn Hg Ni POM HCOH
Pulverized CoalConfiguration Unknown
(No SCC)N/A N/A N/A 1922 N/A N/A N/A N/A N/A 112b
Pulverized Coal Wet Bottom(10100201)
538 81 44-70 1020-1570 507c 808-2980 16 840-1290 N/A N/A
Pulverized CoalDry Bottom(10100202)
684 81 44.4 1250-1570 507c 228-2980 16 1030-1290 2.08 N/A
Pulverized coalDry Bottom, Tangential
(10100212)N/A N/A N/A N/A N/A N/A N/A N/A 2.4 N/A
Cyclone Furnace(10100203) 115 <81 28 212-1502 507c 228-1300 16 174-1290 N/A N/A
StokerConfiguration Unknown
(No SCC)N/A 73 N/A 19-300 N/A 2170 16 775-1290 N/A N/A
Spreader Stoker(10100204) 264-542 N/A 21-43 942-1570 507c N/A N/A N/A N/A 221d
Traveling Grate,Overfed Stoker
(10100205)542-1030 N/A 43-82 N/A 507c N/A N/A N/A N/A 140e
a All emission factors in lb/1016 Btu; all emission factors rated E.b Based on 2 units; 456 MWe and 133 MMBtu/hr.c Lead emission factors were taken directly from an EPA background document for support of the NAAQS.d Based on 1 unit; 59 MMBtu/hr.e Based on 1 unit; 52 MMBtu/hr.

TABLE 4-14. HAP EMISSION FACTORS (METRIC UNITS) FOR UNCONTROLLED BITUMINOUS COAL-FIREDBOILERSa
Firing configuration(SCC) As Be Cd Cr Pb Mn Hg Ni POM HCOH
Pulverized CoalConfiguration Unknown
(No SCC)N/A N/A N/A 825 N/A N/A N/A N/A N/A 48b
Pulverized Coal Wet Bottom(10100201)
231 35 18-30 439-676 218c 348-1282 7 361-555 N/A N/A
Pulverized CoalDry Bottom(10100202)
294 35 19 538-676 218c 98-1282 7 443-555 0.894 N/A
Pulverized coalDry Bottom, Tangential
(10100212)N/A N/A N/A N/A N/A N/A N/A N/A 1.03 N/A
Cyclone Furnace(10100203) 49.5-133 <34.9 12 91.2-676 218c 98-559 6.9 74.9-555 N/A N/A
StokerConfiguration Unknown
(No SCC)N/A 31.4 N/A 8.1-675 N/A 934 6.9 334-555 N/A N/A
Spreader Stoker(10100204) 114-233 N/A 9.0-18.5 N/A 218c N/A N/A N/A N/A 95d
Traveling Grate,Overfed Stoker
(10100205)233-443 N/A 19-35 N/A 218c N/A N/A N/A N/A 60e
a All emission factors in pg/J; all emission factors rated E.b Based on 2 units; 456 MWe and 39 MW.c Lead emission factors were taken directly from an EPA background document for support of the NAAQS.d Based on 1 unit; 17 MW.e Based on 1 unit; 15 MW.

TABLE 4-15. HAP EMISSION FACTORS (ENGLISH UNITS) FOR CONTROLLEDBITUMINOUS COAL-FIRED BOILERSa
Boiler configuration(SCC) Control device Cr Mn POM
Pulverized coalConfiguration unknown(no SCC)
MulticyclonesESPWet scrubberMulticyclones/wet scrubber
125.8-79900.61-1218
Pulverized coal Wet bottom(10100201)
ESPWet scrubber
78 18.6565
Cyclone Furnace(10100203)
ESPWet scrubber
19-22107
60.8126
0.4657.2
Stoker Configuration unknown
Multicyclones 62-2423 110 16.2
(no SCC) ESP 135
Pulverized coal Dry bottom(10100202)
ESPWet scrubberMulticyclones/ESP
96.2112
8.550.033-18.6
a All emission factors in lb/MMBtu; all emission factors rated E.

TABLE 4-16. HAP EMISSION FACTORS (METRIC UNITS) FOR CONTROLLEDBITUMINOUS COAL-FIRED BOILERSa
Boiler configuration(SCC) Control device Cr Mn POM
Pulverized coalConfiguration unknown (No SCC)
MulticyclonesESPWet scrubberMulticyclones/wet scrubber
5.32.5-34300.26-5.37.8
Pulverized coal Wet bottom(10100201)
ESPWet scrubber
33.5 8.02.43
Cyclone furnace(10100203)
ESPWet scrubber
8.4-9.747.3
2755.8
0.2025.3
Stoker Configuration unknown(No SCC)
Multicyclones 27.4-1072 48.7 7.2
ESP 59.7
Pulverized coal Dry bottom(10100202)
ESPWet scrubberMulticyclones/ESP
41.348.2
3.680.014-8
a All emission factors in pg/J; all emission factors rated E.

TABLE 4-17. AVERAGE TRACE ELEMENT REMOVAL EFFICIENCY FOR CONTROLDEVICESa
CompoundMechanicalprecipitation ESP
FGD scrubber
Two ESPs in series
ESP/scrubber
Two multicyclones
Arsenic 51 87.5 99.6 98.9
Beryllium 37 91.9 94.3 99.94
Cadmium 28.9 74.6 94.4b 90.5
Chromiumd 42.3 71.5 91.8b 93.7 92.9 50c
Manganese 54.3 78.1 89.1b 96.4 97.7
Nickel 49.4 79.1 96.4b 96.6 97.2
a These average control efficiencies represent measured control levels reported in the literature. They may or may not be indicative of the long-term performance of these types of controls on emissions from coal combustion sources. The average values should not be construed to represent an EPA- recommended efficiency level for these devices. Only limited data are available for lead and mercury removal efficiencies. Each emission test was weighted equally.b The type of scrubber was not specified.c These control efficiencies are for hexavalent chromium; the remaining values are for total chromium.d The chromium control efficiencies may be biased low due to contamination from sampling equipment. Emission factors calculated using these efficiencies probably represent, in most cases, upper bound estimates.

TABLE 4-19.SUMMARY OF N2O EMISSION FACTORS FOR BITUMINOUS ANDSUBBITUMINOUS COAL COMBUSTION
N2O emission factor,
Firing configuration Rating lb/ton kg/Mg
Pulverized coal fired
Dry bottom - wall fired D 0.09 0.045
Dry bottom - tangential D 0.03 0.015
Wet bottom E 0.09a 0.045a
Cyclone furnace E 0.09a 0.045a
Spreader stoker E 0.09a 0.045a
Overfeed stoker E 0.09a 0.045a
Underfeed stoker E 0.09a 0.045a
Handfired units E 0.09a 0.045a
Fluidized beds
Bubbling E 5.5b 2.7b
Circulating E 5.5 2.7
a No data; value for pulverized coal dry bottom - wall fired was assigned.b No data; value for circulating fluidized bed was assigned.

TABLE 4-18. N2O EMISSIONS DATA
Ref.Data
quality Boiler typeFueltype
Boilercapacity
Boilerload
Uncontrolled N2Oemissions,
ppmN2O emission factor,
lb/ton
78 B DRUM-BOILER NAT. CIRC. BIT. 171 MW 0.96 2.1 7.56E-02
78 B DRUM-BOILER NAT. CIRC. BIT. 171 MW 0.82 2.5 9.00E-02
78 B DRUM-BOILER NAT. CIRC. BIT. 171 MW 0.76 5.1 1.84E-01
78 B DRUM-BOILER NAT. CIRC. BIT. 171 MW 0.96 3.3 1.19E-01
1.17E-01
79 B P.C. CIRCULAR WALL-FIRED BIT. 250 MW 1.08 3.6 1.28E-01
79 B P.C. CIRCULAR WALL-FIRED BIT. 250 MW 0.92 2 7.28E-02
79 B P.C. CIRCULAR WALL-FIRED BIT. 250 MW 1.08 3.6 1.28E-01
79 B P.C. CIRCULAR WALL-FIRED BIT. 250 MW 0.92 1.8 6.55E-02
79 B P.C. CIRCULAR WALL-FIRED BIT. 250 MW 1.08 2.4 8.53E-02
79 B P.C. CIRCULAR WALL-FIRED BIT. 250 MW 1.08 4.6 1.64E-01
79 B P.C. CIRCULAR WALL-FIRED BIT. 250 MW 1.08 2.4 8.53E-02
79 B P.C. CIRCULAR WALL-FIRED BIT. 250 MW 0.92 0.7 2.55E-02
79 B P.C. CIRCULAR WALL-FIRED BIT. 250 MW 1.08 3.6 1.28E-01
79 B P.C. CIRCULAR WALL-FIRED BIT. 250 MW 1.08 2.4 8.53E-02
79 B P.C. CIRCULAR WALL-FIRED BIT. 250 MW 0.92 1.1 4.01E-02
79 B P.C. CIRCULAR WALL-FIRED BIT. 250 MW 0.92 0.9 3.28E-02
79 B P.C. CIRCULAR WALL-FIRED BIT. 250 MW 0.92 0.8 2.91E-02
79 B P.C. CIRCULAR WALL-FIRED BIT. 250 MW 1.08 2.4 8.53E-02
79 B P.C. CIRCULAR WALL-FIRED BIT. 250 MW 0.92 0.9 3.28E-02
79 B P.C. CIRCULAR WALL-FIRED BIT. 250 MW 1.08 2.4 8.53E-02
79 B P.C. CIRCULAR WALL-FIRED BIT. 250 MW 1.08 3.6 1.28E-01
79 B P.C. CIRCULAR WALL-FIRED BIT. 250 MW 1.08 2.4 8.53E-02
79 B P.C. CIRCULAR WALL-FIRED BIT. 250 MW 1.08 2.4 8.53E-02
79 B P.C. CIRCULAR WALL-FIRED BIT. 250 MW 1.08 2.4 8.53E-02
79 B P.C. CIRCULAR WALL-FIRED BIT. 250 MW 1.08 3 1.07E-01
79 B P.C. CIRCULAR WALL-FIRED BIT. 250 MW 1.08 3.6 1.28E-01
79 B P.C. CIRCULAR WALL-FIRED BIT. 250 MW 1.08 3.6 1.28E-01
79 B P.C. CIRCULAR WALL-FIRED BIT. 250 MW 1.08 2.4 8.53E-02
79 B P.C. CIRCULAR WALL-FIRED BIT. 250 MW 1.08 3.6 1.28E-01
79 B P.C. CIRCULAR WALL-FIRED BIT. 250 MW 0.92 2.1 7.65E-02
79 B P.C. CIRCULAR WALL-FIRED BIT. 250 MW 1.08 3.6 1.28E-01
79 B P.C. CIRCULAR WALL-FIRED BIT. 250 MW 1.08 2.4 8.53E-02
79 B P.C. CIRCULAR WALL-FIRED BIT. 250 MW 1.08 3.6 1.28E-01
79 B P.C. CIRCULAR WALL-FIRED BIT. 250 MW 1.08 0.7 2.49E-02
79 B P.C. CIRCULAR WALL-FIRED BIT. 250 MW 1.08 2.4 8.53E-02
79 B P.C. CIRCULAR WALL-FIRED BIT. 250 MW 0.92 1.4 5.10E-02
79 B P.C. CIRCULAR WALL-FIRED BIT. 250 MW 1.08 2.1 7.47E-02
79 B P.C. CIRCULAR WALL-FIRED BIT. 250 MW 1.08 2.4 8.53E-02
8.74E-02
79 B P.C. TRIPLE CELL WALL-FIRED BIT. 250 MW 1.09 2.4 8.64E-02
79 B P.C. TRIPLE CELL WALL-FIRED BIT. 250 MW 1.09 2.4 8.64E-02
79 B P.C. TRIPLE CELL WALL-FIRED BIT. 250 MW 1.09 2.4 8.64E-02
79 B P.C. TRIPLE CELL WALL-FIRED BIT. 250 MW 1.09 3.6 1.30E-01
79 B P.C. TRIPLE CELL WALL-FIRED BIT. 250 MW 1.09 2.4 8.64E-02
79 B P.C. TRIPLE CELL WALL-FIRED BIT. 250 MW 1.09 2.4 8.64E-02
79 B P.C. TRIPLE CELL WALL-FIRED BIT. 250 MW 1.09 3.6 1.30E-01
79 B P.C. TRIPLE CELL WALL-FIRED BIT. 250 MW 1.09 3.6 1.30E-01
79 B P.C. TRIPLE CELL WALL-FIRED BIT. 250 MW 1.09 3.6 1.30E-01
1.06E-01
79 B TANGENTIAL BIT. 700 MW 0.8 0.4 1.42E-02
79 B TANGENTIAL BIT. 700 MW 0.8 0.9 3.20E-02
79 B TANGENTIAL BIT. 700 MW 0.8 0.7 2.49E-02
79 B TANGENTIAL BIT. 700 MW 0.8 0.8 2.84E-02
79 B TANGENTIAL BIT. 700 MW 0.8 2.3 8.18E-02
79 B TANGENTIAL BIT. 700 MW 0.8 1.2 4.27E-02
79 B TANGENTIAL BIT. 700 MW 0.8 1.2 4.27E-02
79 B TANGENTIAL BIT. 700 MW 0.8 0.5 1.78E-02
79 B TANGENTIAL BIT. 700 MW 0.8 0.4 1.42E-02
79 B TANGENTIAL BIT. 700 MW 0.8 0.4 1.42E-02
79 B TANGENTIAL BIT. 700 MW 0.8 1.2 4.27E-02
79 B TANGENTIAL BIT. 700 MW 0.8 0.5 1.78E-02
79 B TANGENTIAL BIT. 700 MW 0.8 0.7 2.49E-02
79 B TANGENTIAL BIT. 700 MW 0.8 0.8 2.84E-02
79 B TANGENTIAL BIT. 700 MW 0.8 0.4 1.42E-02
79 B TANGENTIAL BIT. 700 MW 0.8 0.4 1.42E-02

TABLE 4-18. N2O EMISSIONS DATA
Ref.Data
quality Boiler typeFueltype
Boilercapacity
Boilerload
Uncontrolled N2Oemissions,
ppmN2O emission factor,
lb/ton
79 B TANGENTIAL BIT. 700 MW 0.8 1.2 4.27E-02
79 B TANGENTIAL BIT. 700 MW 0.8 0.7 2.49E-02
79 B TANGENTIAL BIT. 700 MW 0.8 1.2 4.27E-02
79 B TANGENTIAL BIT. 700 MW 0.8 0.5 1.78E-02
79 B TANGENTIAL BIT. 700 MW 0.8 0.9 3.20E-02
79 B TANGENTIAL BIT. 700 MW 0.8 1.2 4.27E-02
79 B TANGENTIAL BIT. 700 MW 0.8 0.5 1.78E-02
79 B TANGENTIAL BIT. 700 MW 0.8 0.7 2.49E-02
79 B TANGENTIAL BIT. 700 MW 0.8 0.8 2.84E-02
79 B TANGENTIAL BIT. 700 MW 0.8 0.9 3.20E-02
79 B TANGENTIAL BIT. 700 MW 0.8 0.7 2.49E-02
79 B TANGENTIAL BIT. 700 MW 0.8 1.2 4.27E-02
2.96E-02
80 C FLUIDIZED BED COMBUSTION CIRC BIT. 8 MW 136 5.55E+00
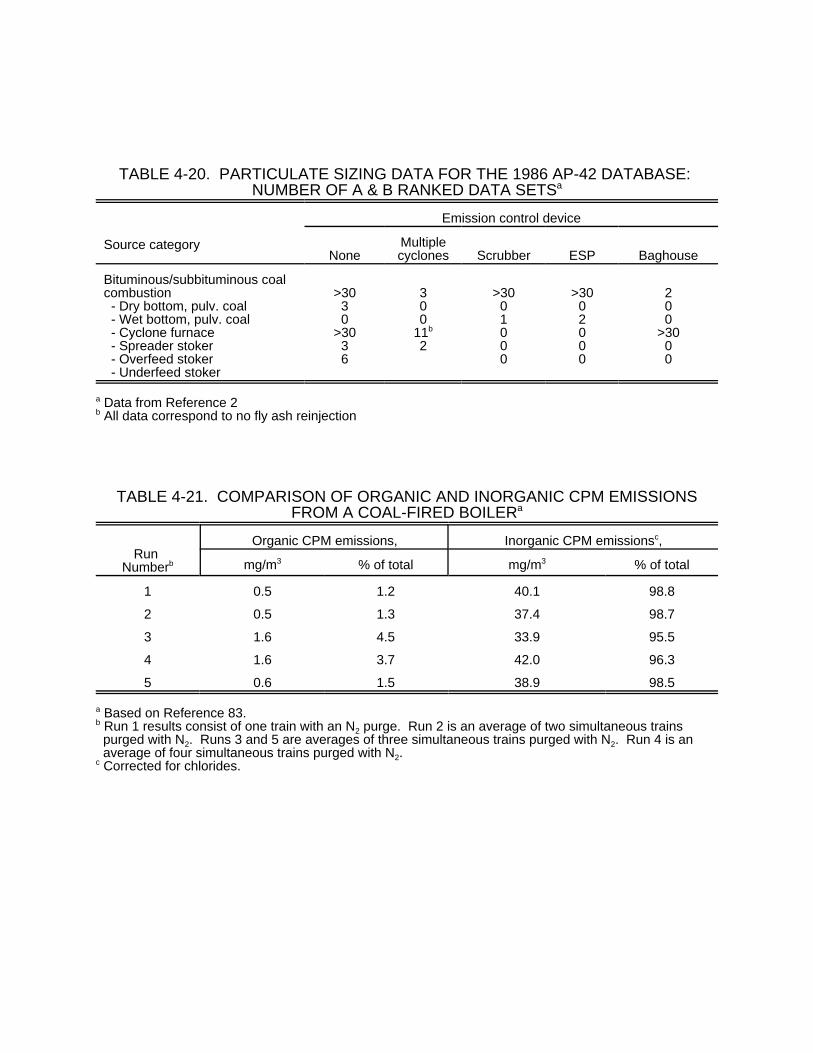
TABLE 4-20. PARTICULATE SIZING DATA FOR THE 1986 AP-42 DATABASE: NUMBER OF A & B RANKED DATA SETSa
Source category
Emission control device
NoneMultiplecyclones Scrubber ESP Baghouse
Bituminous/subbituminous coalcombustion - Dry bottom, pulv. coal - Wet bottom, pulv. coal - Cyclone furnace - Spreader stoker - Overfeed stoker - Underfeed stoker
>3030
>3036
300
11b
2
>3001000
>3002000
200
>3000
a Data from Reference 2b All data correspond to no fly ash reinjection
TABLE 4-21. COMPARISON OF ORGANIC AND INORGANIC CPM EMISSIONSFROM A COAL-FIRED BOILERa
Run Numberb
Organic CPM emissions, Inorganic CPM emissionsc,
mg/m3 % of total mg/m3 % of total
1 0.5 1.2 40.1 98.8
2 0.5 1.3 37.4 98.7
3 1.6 4.5 33.9 95.5
4 1.6 3.7 42.0 96.3
5 0.6 1.5 38.9 98.5
a Based on Reference 83.b Run 1 results consist of one train with an N2 purge. Run 2 is an average of two simultaneous trains purged with N2. Runs 3 and 5 are averages of three simultaneous trains purged with N2. Run 4 is an average of four simultaneous trains purged with N2.c Corrected for chlorides.

TABLE 4-22. FILTERABLE PARTICULATE FOR A FRONT WALL FIRED BOILERFUELED ON A LOW SULFUR WESTERN BITUMINOUS COAL
Side of duct
Filterable particulate,Cumulative mass percent less than stated size (in microns) Data
quality rating Ref.0.625 1.00 1.25 2.50 6.00 10 15
West side < 4 < 4 4 5 8 13 18 B 86
East side < 2 < 2 2 4 9 15 24 B 86
TABLE 4-23. FILTERABLE PARTICULATE FOR SUBBITUMINOUS COAL FIREDFLUIDIZED BED COMBUSTORS WITH MULTICLONE CONTROLS
Fuel
Filterable particulate,Cumulative mass percent less than stated size (in microns) Data
qualityrating Ref.0.625 1.00 1.25 2.50 6.00 10 15
Navajosubbituminous
< 2 12 22 56 82 88 90 D 85
Sarpy Creeksubbituminous
< 2 9 17 55 74 85 90 D 85

REFERENCES FOR CHAPTER 4
1. Background Data Used to Develop Emission Factors for Bituminousand Subbituminous Coal Combustion, Tom Lahre, EnvironmentalProtection Agency, September 1981.
2. Van Buran, D., D. Barbe, and A.W. Wyss, External Combustion ParticulateEmissions: Source Category Report, November 1986, EPA-600/7-86-043.
3. ANALYSIS OF RESIDENTIAL COAL STOVE EMISSIONS, EPA Contract No.68-02-3169, BATTELLE, Columbus, Ohio, July 1983.
4. Foley, J.M. and H. Schiff, Fluidized Bed Boiler Emission Test Report: Canadian Forces Base Summersude, Prince Edward Island Canada, EMBReport 86-SPB-2. U.S. Environmental Protection Agency, Research TrianglePark, NC, March 1986.
5. Gaseous & Particulate Emissions Studies Performed for Grand Island ElectricDepartment at the Platte River Generating Station Unit No. 1, Mostardi-PlatteAssociates, inc, Bensenville, Illinois, December 1982.
6. SO2 Emissions Test Report for Kansas City, Kansas Board of Public UtilitiesQuindaro Station Unit 2, Burns & McDonnell, Kansas City, Missouri, January1989.
7. Haile, C.L. et. al., Comprehensive Assessment of the Specific CompoundsPresent in Combustion Processes, EPA-560/5-83-006, U.S. EnvironmentalProtection Agency, Washington, D.C., September 1983.
8. SO2 EMISSIONS TEST REPORT for KANSAS CITY KANSAS BOARD OFPUBLIC UTILITIES - KAW STATION UNIT 1 & QUINDARO STATION UNIT1, Burns & McDonnell, Kansas City, MO, August 1988.
9. PARTICULATE EMISSION PROGRAM PERFORMED FOR BOARD OFPUBLIC UTILITIES AT THE QUINDARO POWER STATION UNIT Q2,Mostardi Platt Associates Inc., Bensenville IL, July, 1986.
10. Emissions Test Report: Tennessee Eastman Boiler 24, Kingsport, TN, EMB84-1BR-23, U.S. Environmental Protection Agency.
11. Industrial Boilers Emissions Test Report: Upjohn Co, Kalamazoo, Michigan,EMB 85-1BR-25, U.S. Environmental Protection Agency, January 1985.
12. Emissions Test Report: Burlington Industries, Clarksville, VA, EMB 82-1BR-18, U.S. Environmental Protection Agency, June 1982.
13. Fluidized Bed Combustion: Effectiveness of an SO2 Control Technology foran Industrial Boiler, EPA-450/3-85-010, U.S. Environmental ProtectionAgency, September 1984.
14. Low-Sulfur Western Coal Use in Existing Small and Intermediate Size Boilers,EPA-600-7-78-153a, U.S. Environmental Protection Agency, Washington,D.C., July 1978.

15. Atmospheric Emissions From Coal Combustion: An Inventory Guide, 999-AP-24, U. S. Environmental Protection Agency, Washington, D.C., April 1966.
16. Field Tests of Industrial Stoker Coal-fired Boilers for Emissions Control andEfficiency Improvement - Site F, EPA-600/7-80-065a, U.S. EnvironmentalProtection Agency, Washington, D.C., March 1980.
17. Source Sampling Residential Fireplaces for Emission Factor Development,EPA-450/3-76-010, U.S. Environmental Protection Agency, ResearchTriangle Park, North Carolina, November 1975.
18. Environmental Assessment of Coal- and Oil-Firing in a Controlled IndustrialBoiler, EPA/600/7-78/164C, U.S. Environmental Protection Agency, August1978.
19. Overview of the Regulatory Baseline: Technical Basis and Alternative ControlLevels for Particulate Matter (PM) - Emission Standards for Small SteamGenerating Units, EPA-450/3-89-011, U.S. Environmental Protection Agency,Research Triangle Park, NC, May 1989.
20. Overview of the Regulatory Baseline: Technical Basis and Alternative ControlLevels for Sulfur Dioxide (SO2) Emission Standards for Small SteamGenerating Units, EPA-450/3-89-012, U.S. Environmental Protection Agency,Research Triangle Park, NC, May 1989.
21. Fossil Fuel-Fired Industrial Boilers - Background Information, Volume I, EPA-450/3-82-006A, U.S. Environmental Protection Agency, Atlanta, GA, March1982.
22. Overview of the Regulatory Baseline, Technical Basis, and Alternative ControlLevels for Nitrogen Oxides (NOx) Emission Standards for Small SteamGenerating Units, EPA-450/3-89-13, U.S. Environmental Protection Agency,Research Triangle Park, NC, May 1989.
23. Evaluation and Costing of NOx Controls for Existing Utility Boilers in theNESCAUM Region, Acurex Environmental, Mountain View, CA, EPA ContractNo. 68-D9-0131, Work Assignment I-19, September 1991.
24. Krishnan R.E. and G.V. Helwig. Trace Emissions from Coal and OilCombustion. Environmental Progress. 1(4): 290-295. 1982.
25. Brooks, G.W., M.B. Stockton, K.Kuhn, and G.D. Rives, Radian Corporation. Locating and Estimating Air Emission from Source of Polycyclic OrganicMatter (POM). EPA-450/4-84-007p. U.S. Environmental Protection Agency,Research Triangle Park, North Carolina, May 1988.
26. Leavitt, Arledge, Shih, et. al., Environmental Assessment of Coal- and Oil-firing in a Controlled Industrial Boiler; Volume I, II, and III, August 1978
27. Shih, C.C.; R. A. Arisini, D.G. Ackerman, R. Moreno, E.L. Moon, L.L. Scinto,and C. Yu, Emissions Assessment of Conventional Stationary CombustionSystems: Volume III. External Combustion Sources for Electricity Generation,EPA-600/7-81-003a, November 1980,

28. Surprenant, N; R. Hall, S. Slater, T. Susa, M. Sussman, and C. Young.Preliminary Emissions Assessment of Conventional Stationary CombustionSystems; Volume II -Final Report, Report prepared by GCA/TechnologyDivision for the U.S. Environmental Protection Agency. EPA-600/2-76-046B.March 1976.
29. ORTECH Corporation. MOE Toxic Chemical Emissions Inventory for Ontarioand Eastern North America, Draft Report. Prepared by N.D. Johnson andM.T. Schultz. Prepared for Ontario Ministry of the Environment, AirResources Branch, Rexdale, Ontario. Draft Report No. P89-50-5429/OG.March 15, 1990
30. U.S. Environmental Protection Agency, Regional Air Pollution Study - PointSource Emission Inventory, Publication No. EPA-600/4-77-014 (NTIS No. PB269567), March 1977
31. Locating and Estimating Air Emissions from Sources of Chromium, EPA-450/4-84-007g, U.S. Environmental Protection Agency, July 1984
32. Locating and estimating Air Emissions from Sources of Formaldehyde(Revised), EPA-450/4-91-012, U.S. Environmental Protection Agency, March1991
33. Estimating Air Toxics Emissions from Coal and Oil Combustion Sources,EPA-450/2-89-001, Radian Corporation, N.C., RTP, Project Officer: DallasW. Safriet, April 1989
34. Evans, J.C.; K.H. Abel, K.B. Olsen, E.A. Lepel, R.W. Sanders, C.L. Wilkerson,D.J. Hayes, and N.F. Mangelson from BYU, Provo, Utah. Characterization ofTrace Constituents at Canadian Coal-Fired Plants, Phase I:, Final Report andAppendices, Report for the Canadian Electrical Association, R&D, Montreal,Quebec, Contract Number 001G194. Report by Battelle, Pacific NorthwestLaboratories, Richland, Washington
35. Meij, Auteru dr. R.; The Fate of Trace Elements at Coal-Fired Plants,Rapportnummemmer:32561-MOC 92-3641, Rapport te bestellen bij:Bibliotheek N.V. KEMA, Feruary 13, 1992.
36. Locating and Estimating Air Emissions from Sources of Manganese, EPA-450/4-84-007h, September 1985
37. Lyon, W.S., Trace Element Measurements at the Coal-Fired Steam Plant,CRC Press, 1977.
38. EPA/NOAA/NASA/USDA N2O Workshop V.I. Measurements Studies andCombustion Sources, EPA-600/8-88-079, U.S. Environmental ProtectionAgency, Research Triangle Park, NC, May 1988.
39. EPA Workshop on N2O Emissions from Combustion, EPA-600/8-86-035, U.S.Environmental Protection Agency, Research Triangle Park and Durham, NC,February 13-14, 1986.
40. Abbas, T. et. al., "Nitrous Oxide Emissions from and Industry-type Pulverized-Coal Boiler," Combustion and Flame, 87: 104-108 (1991).

41. Linak, W.P. et. al., "N2O Emissions from Fossil Fuel Combustion," CRB, MD-65, U.S. Environmental Protection Agency, Research Triangle Park, NC.
42. Oude Lohuis, J.A. et. al., "Parametric Study of N2O Formation in CoalCombustion," Fuel, Vol. 71, 9-14, January 1992.
43. Khalil, M.A.K. and R.A. Rasmussen, "The Global Sources of Nitrous Oxide,"Final Report, December 1991.
44. Hao, W.M. et. al., "Sources of Atmospheric Nitrous Oxide from Combustion,"Journal of Geophysical Research, Vol. 92, No. D3, 3098-3104, March 20,1987.
45. Hao, W.M. et. al., "Nitrous Oxide Emission from Coal, Oil, and Gas FurnaceFlames," Presented at the Twenty-first International Symposium onCombustion, 1986.
46. Khalil, M.A.K. and R.A. Rasmussen, Nitrous Oxide from Coal Fired PowerPlants: Experiments on the Centralia Power Plant, Final Report, U.S.Environmental Protection Agency, Research Triangle Park, ResearchTriangle Park, NC, December 1991.
47. Anderson, S. "N2O Emission from Fluidized Bed Combustion," Presented atthe IEA AFBC Technical Meeting, Amsterdam, November 1988.
48. Linak, W.P. et. al., "Nitrous Oxide Emission from Fossil Fuel," Journal ofGeophysical Research, June 1989, Prepared for Submission.
49. Aho, M.J. et. al., "Formation and Destruction of N2O in Pulverized FuelCombustion Environments Between 750 and 970 °C," Fuel, Vol. 69, August1990.
50. Kramlich, J.C. et. al., "Mechanisms of Nitrous Oxide Formation in CoalFlames," Combustion and Flame, 77:375-384 (1989).
51. Martin, R.J. and N.J. Brown, "Nitrous Oxides Formation and Destruction inLean, Premixed Combustion," Combustion and Flame, 80:238-255 (1990).
52. Yokoyama, T. et. al., N2O Emissions from Fossil Fuel Fired Power Plants,Central Research Institute of Electric Power Industry, Yokosuka shi, Japan.
53. Muzio, L.J. et. al., "Errors in Grab Sample Measurements of N2O fromCombustion Sources," A&WMA 39:287-293 (1989).
54. Muzio, L.J. et. al., "An Artifact in the Measurement of N2O from CombustionSources," Geophysical Research Letters, Vol. 15, No. 12, 1369-1372,November 1988.
55. Montgomery, T.A. et. al., "Continuous NDIR Analysis of N2O in CombustionEnvironments with a Field Prototype Instruments," WSS/CI Paper No. 88-71.
56. Booth, R.C. et. al., "Cofiring Natural Gas with Coal in Steam Boilers,"Presented at the Joint Power Generation Conference, Philadelphia, PA, 1988.
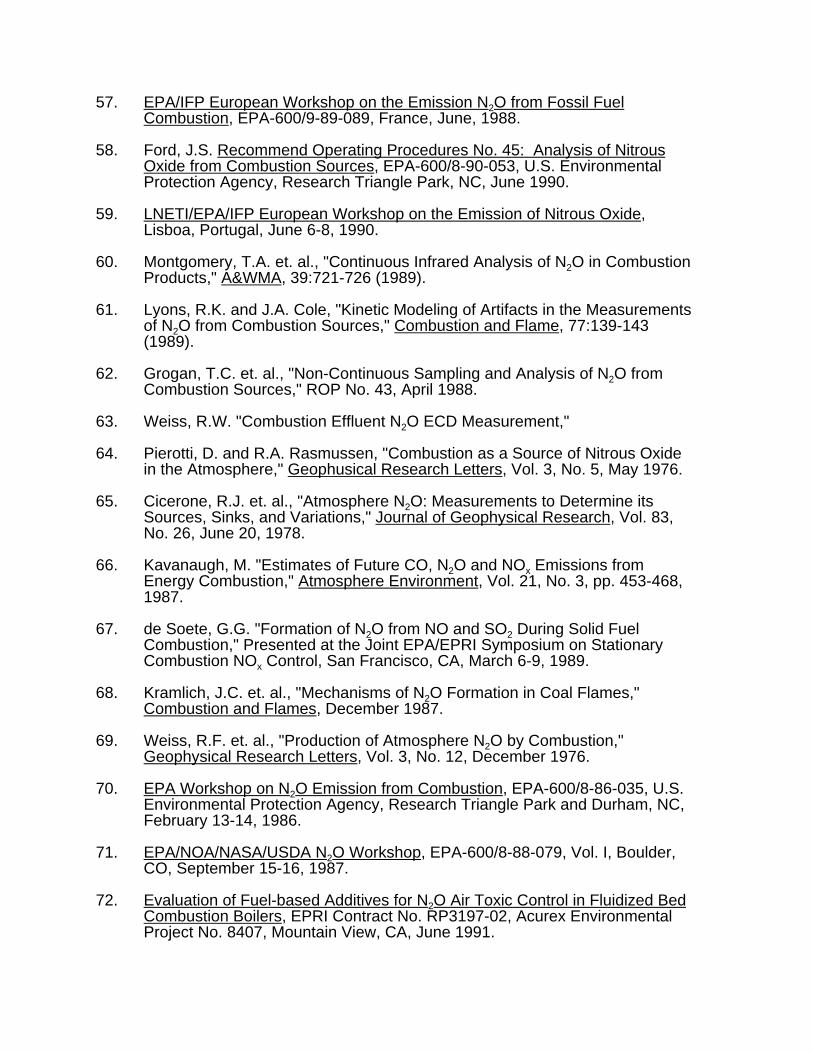
57. EPA/IFP European Workshop on the Emission N2O from Fossil FuelCombustion, EPA-600/9-89-089, France, June, 1988.
58. Ford, J.S. Recommend Operating Procedures No. 45: Analysis of NitrousOxide from Combustion Sources, EPA-600/8-90-053, U.S. EnvironmentalProtection Agency, Research Triangle Park, NC, June 1990.
59. LNETI/EPA/IFP European Workshop on the Emission of Nitrous Oxide,Lisboa, Portugal, June 6-8, 1990.
60. Montgomery, T.A. et. al., "Continuous Infrared Analysis of N2O in CombustionProducts," A&WMA, 39:721-726 (1989).
61. Lyons, R.K. and J.A. Cole, "Kinetic Modeling of Artifacts in the Measurementsof N2O from Combustion Sources," Combustion and Flame, 77:139-143(1989).
62. Grogan, T.C. et. al., "Non-Continuous Sampling and Analysis of N2O fromCombustion Sources," ROP No. 43, April 1988.
63. Weiss, R.W. "Combustion Effluent N2O ECD Measurement,"
64. Pierotti, D. and R.A. Rasmussen, "Combustion as a Source of Nitrous Oxidein the Atmosphere," Geophusical Research Letters, Vol. 3, No. 5, May 1976.
65. Cicerone, R.J. et. al., "Atmosphere N2O: Measurements to Determine itsSources, Sinks, and Variations," Journal of Geophysical Research, Vol. 83,No. 26, June 20, 1978.
66. Kavanaugh, M. "Estimates of Future CO, N2O and NOx Emissions fromEnergy Combustion," Atmosphere Environment, Vol. 21, No. 3, pp. 453-468,1987.
67. de Soete, G.G. "Formation of N2O from NO and SO2 During Solid FuelCombustion," Presented at the Joint EPA/EPRI Symposium on StationaryCombustion NOx Control, San Francisco, CA, March 6-9, 1989.
68. Kramlich, J.C. et. al., "Mechanisms of N2O Formation in Coal Flames,"Combustion and Flames, December 1987.
69. Weiss, R.F. et. al., "Production of Atmosphere N2O by Combustion,"Geophysical Research Letters, Vol. 3, No. 12, December 1976.
70. EPA Workshop on N2O Emission from Combustion, EPA-600/8-86-035, U.S.Environmental Protection Agency, Research Triangle Park and Durham, NC,February 13-14, 1986.
71. EPA/NOA/NASA/USDA N2O Workshop, EPA-600/8-88-079, Vol. I, Boulder,CO, September 15-16, 1987.
72. Evaluation of Fuel-based Additives for N2O Air Toxic Control in Fluidized BedCombustion Boilers, EPRI Contract No. RP3197-02, Acurex EnvironmentalProject No. 8407, Mountain View, CA, June 1991.

73. State-of-the-Art Analysis of NOx/N2O Control for Fluidized Bed CombustionPower Plants, EPRI Contract No. RP3197-02, Acurex Environmental FinalReport No. 90-102/ESD, Mountain View, CA, July 1990.
74. Mann, M.D. et. al., "Effect of Operating Parameters on N2O Emissions in a 1-MW CFBC," Presented at the Eighth Annual Pittsburgh Coal Conference,Pittsburgh, PA, October 1991.
75. Collings, M.E. et. al., "Nitrous Oxide Emissions in the Fluidized BedCombustion of Coal," Presented at the Western States Combustion InstituteSpring Meeting, Corvallis, OR, March 1992.
76. Mann, M.D. et. al., "Nitrous Oxide Emissions in Fluidized Bed Combustion: Fundamentals Chemistry and Combustion Testing," Energy and CombustionScience, 1992, University of North Dakota, EERC.
77. Henderson, A.K. et. al., "Design and Operation of the EERC Pilot-ScaleCirculating Fluidized-Bed Combustor," Presented at the Sixteenth BiennialLow-Rank Fuels Symposium, Billings, Montana, May 1991.
78. EPA/IFP European Workshop on the Emission of Nitrous Oxide for FuelCombustion, EPA Contract No. 68-02-4701, Ruiel-Malmaison, France, June1-2, 1988.
79. Clayton, R. et. al., N2O Field Study, EPA-600/2-89-006, U.S. EnvironmentalProtection Agency, Research Triangle Park, NC February 1989.
80. Amand, L.E. and S. Anderson, "Emissions of Nitrous Oxide from FluidizedBed Boilers," Presented at the Tenth International Conference on FluidizedBed Combustor, San Francisco, CA, 1989.
81. Bradway, R.M., et. al., Fractional Efficiency of a Utility Boiler Baghouse, EPA600/2-75-013a, August 1975.
82. Communication between S. Hughes, Acurex Environmental and C. Young,New Jersey Air Pollution Control, April 13, 1992.
83. DeWees, W. and K. Steinsberger, Method Development and Evaluation ofDraft Protocol for Measurements of Condensible Particulate Emissions, EPA-450/4-90-012, May 1990.
84. Muzio, L., et. al., Dry Particulate Removal for Coal-fired Boilers, CS-2894 Vol.1, Electric Power Research Institute, March 1983.
85. Mann, M.D., et. al., Fluidized Bed Combustion of Low Rank Coals, September1986, DOE/FE/60181-2127
86. Bossart, S.J., Advanced Particle Control Technologies for PressurizedFluidized Bed Combustion Applications, 51st American Power Conference,ASME, Chicago, 1989.
87. Berry, R.S., et. al., An Examination of EPA's August 1982 Revision of the AP-42 Bituminous Coal SOx Emission Factor, Kilkelly Environmental Associates,Inc., Utility Air Regulatory Group, April 1984.

A-1
APPENDIX A
BACKGROUND FILE DATA SPOT CHECK SUMMARY

A-2
A review of the 1988 AP-42 version of Section 1.1 was accomplished by spotchecking the quality of existing emission factors. This was sone by selectingprimary data references from the background file, reviewing data quality samplingand analytical procedures, determining completeness, and verifyuing that the siteemission factors in the background files could be reconstructed and were accurate. The results of these spot checks are summarized below; the reference numberscorrespond to the 1988 AP-42 Section 1.1 reference list. Example spot check dataare presented in Table A-1.
Reference 15
Contains six data p;oints. States in the paper that a sampling was only forcomparative purposes and emission shouldn't be taken as absolute. Couldn't get allrepresentative sampling locations due to obstruction or bends. Able to recreate"background" data values in histogram.
Reference 17
Checked "ALMA" site. Particulate tests done with bituminous andsubbituminous coal. Appears two values were averaged and entered in histogramtwice.
Sulfur dioxide data are questionable because sulfur analysis was taken fromsamples after the blower but HHV is baseed on "as received" coal. Need toeliminate some anomalous data points. Requires minor adjustment to SO2histograms. Chedked "ALMA" site. Appears that emission factor was calculatedfrom parametric test midifying combustion air. Normal operation should be used foremission factor indicating a revision of the histogram and emission factor.
Reference 18
Sample train was an unproven Method 5 midified to collect HAPs from utilityboilers. Sulfur dioxide based on sulfur retention in bottom ash was acceptable. Carbon monoxide data were not of good quality but hadd not been used in theprevious AP-42 update. Particulate data (uncontrolled) were colleced in an impropersampling location with poor flow distribution and significant swirl because it was onlytwo diameters from the inlet breaching. Data should be rated as poor quality butcalculated emission factor (96A) is very close to the AP-42 published average. therefore, inclusion or exclusion is not significant.
Reference 23
Particulate measurements were nade using currently unapproved APCO andASME methods. Correlation between tow methods was not good; test conditions,methodologies, and data collected were not well-documented (no raw data sheets). Data quality should be reated no better than C. Calculations were correct.
Reference 34
Appeared to be a well-codumented test report with good quality measurementmethodology. the source operation, however, appeared to be somewhat variablewith paramenter swings and intermittent periods of fly ash reinjection.

A-3
Reference 49
All dat for fireplaces. Several points burning coal in fireplaces. Discard data. New data available for hand-fed particulate.
Reference 50
No CH4 data. Emission factor given as "estimate", but references 1966 datanot representative of current protocols. Recommend not using current publishedemission factor.
Reference 58
No CH4 data for handfed units. All data in this report are for larger utilityboilers. Volatile organic compound data were acceptable.

TABLE A-1. SOx EMISSIONS FROM PULVERIZED COAL, DRY BOTOM BOILERSFuel Operation Controls Sampling Emission
Boilera
TypeFuelb Ref.a Site Dat
aDate
Run
No.
HHVBtu/lb
,Btu/g
S% N% Ash%
Load/Capacity
Description Method
O2
UC, C#/106
Btu Remarks
FW B 17 ALMA
75 6 10776
3.66
1.00
13.47
196/230103 lb st/hr
Cold sideESP
Shell-Emery
Vile
3.5
5.95734.9 (S)
N/A
Uses S analysis from blower catch inreport. This sample has beenground and dried substantially. HHVis taken from 1 as received ultimateanalysis. Recalculate EF data pointwith ulimate analysis Nos.Previous average appears to be 335. New average would be 33.7(S) but12.2% O2 is very high and at lowload, probably should drop. Nosampling data sheets in thisreference; they are contained inEPA60017-78-1-55b.
FW B 17 ALMA
75 9 10776
3.66
1.00
13.47
57/230103 lb st/hr
Cold sideESP
Shell-Emery
Vile
4.0
6.39637.5 (S)
N/A
FW B 17 ALMA
75 16 10776
3.66
1.00
13.47
60/230103 lb st/hr
Cold sideESP
Shell-Emery
Vile
12.2
4.90528.7 (S)
N/A
FW S 17 ALMA
75 63 9336 0.81
0.73
17.26
131/230103 lb st/hr
Cold sideESP
Shell-Emery
Vile
2.8
2.88866.6 (S)
FW S 17 ALMA
75 64 9336 0.81
0.73
17.26
170/230103 lb st/hr
Cold sideESP
Shell-Emery
Vile
2.9
1.44033.2 (S)
FW S 17 ALMA
75 72 9336 0.81
0.73
17.26
101/230103 lb st/hr
Cold sideESP
Shell-Emery
Vile
6.7
2.38755 (S)
FW S 17 ALMA
75 73 9336 0.81
0.73
17.26
94/230103 lb st/hr
Cold sideESP
Shell-Emery
Vile
5.0
1.79941.5 (S)
FW S 17 ALMA
75 74 9336 0.81
0.73
17.26
90/230103 lb st/hr
Cold sideESP
Shell-Emery
Vile
6.8
1.40732.4 (S)
FW S 17 ALMA
75 75 9336 0.81
0.73
17.26
160/230103 lb st/hr
Cold sideESP
Shell-Emery
Vile
5.8
1.36731.5
aFW-Front wall-fired pulverized coal boiler.bB-Bituminous coal, S-Subbituminous coal.cReference numbers as cited in 1988 AP-42 Section 1.1.

TABLE A-2. NOx EMISSIONS FROM PULVERIZED COAL, DRY BOTTOM BOILERSFuel Operation Sampling Emissio
n
BoilerType
Fuel Reference
Site Data
Date
Run
No.
HHVBtu/lb,Btu/g
S% N% Ash%
Load/Capacity
Method O2%
UC, C# NO2
103 Btu Remarks
FW B 17 ALMA
75 50 10776 3.66 1.09 13.47
200/230103 lbst/hr
Teco 10 5.2 0.935 Presented in summary table = 20.15 + 15.5. Burner diffuser varied from normal, high O2.
FW B 17 ALMA
75 25 10776 3.66 1.09 13.47
200/230103 lbst/hr
3.8 0.834 EF-17.97 Air Reg. as found.
FW B 17 ALMA
75 42 10776 3.66 1.09 13.47
200/230103 lbst/hr
2.9 0.785 EF-16.9 as found.
FW B 17 ALMA
75 47 10776 3.66 1.09 13.47
200/230103 lbst/hr
3.7 0.860 EF-18.54 Air Reg. as found.
FW B 17 ALMA
75 49 10776 3.66 1.09 13.47
200/230103 lbst/hr
1.8 0.481 EF-10.36Burners varied, Low O2 appears EF based onparametric O2 tests No. 47, 49, 50-yielding15.2 normal operation would be betterdescribed by "as found" No. 25, 42, 47-yielding EF-17.8.
FW S 17 ALMA
75 57A
9336 0.81 0.73 17.26
170/230103 lbst/hr
5.7 0.958 Chosen for summary table EF-17.89 old EFDvalue - 12 only high load test w/o modifyingair.
FW S 17 ALMA
75 57A
9336 0.81 0.73 17.26
170/230103 lbst/hr
avgs intable
5.1-10
25.1%of fuel
N
EF-12.04 but includes averages from allparametric tests including 25% and 50%loads.
FW S 17 ALMA
75 68 9336 0.81 0.73 17.26
170/230103 lbst/hr
2.7 0.469 CO high, 750 ppm, ignore EF-8.76.
aFW-front wall-fired pulverized coal boiler.bB-Bituminous coal, S-Subbituminous coal.cReference numbers as cited in 1988 AP-42 Section 1.1.

TABLE A-3. PM EMISSIONS FROM PULVERIZED COAL, DRY BOTTOM BOILERSFuel Operation Sampling Emissio
n
BoilerType
Fuel Reference
Site Data
Date
Run
No.
HHVBtu/lb,Btu/g
Load/Capacity
Method O2%
UC, C# NO2
103 Btu Emission Factor
HO B 15 Hartlee #3 72 1 12310 490/480 5 3.0 3.03 12.05A
HO B 15 Hartlee #3 72 2 12589 488/480 5 3.7 3.20 9.72A
HO B 15 Hartlee #3 72 3 12121 483/480 5 3.0 3.84 8.58A
HO S 15 Four Corners#4
72 1 8821 755/800 5 3.4 7.65 21.92A
HO S 15 Four Corners#4
72 2 8811 755/800 5 3.1 8.91 21.96A
FW B 15 Widows Creek#6
72 1 11452 125/125 5 3.3 4.65 15.87A
FW B 15 Widows Creek#6
72 2 11477 128/125 5 3.6 7.89 18.39A
T B 15 Barry #3 73 1 12706 293/360 5 5.0 2.0 4.89A
T B 15 Barry #3 73 2 12641 283/360 5 4.5 5.14 4.86A
FW = Front Wall.HO = Horizontally opposed pulverized coal boiler.T = tangentially fired pulverized coal boiler.B = Bituminous coal, S- Subbituminous coal.Reference numbers as cited in 1988 AP-42 Section 1.1.

B-1
APPENDIX B
CONVERSION FACTORS

B-2
TABLE B-1. CONVERSION FACTORS
Given To Obtain Multiply By
ppm lb/MBtu 2.59 X 10⁻⁹ (MW)Fd(20.9/20.9-O2) Where Fdfrom 40 CFR Part 60Appendix A M19 - usually 9820
lb/MBtu lb/ton HHV (as rec'd) =2,000/106
lb/ton kg/Mg 0.5
HHV dry, mineral matterfree
HHV (as rec'd) (100-M-A)/100
MW = Molecular weight of pollutant.O2 = Oxygen concentration at sampling point in percent.M = Moisture in as received coal sample in percent.A = Ash in as received coal sample in percent.

C-1
APPENDIX C
MARKED-UP 1988 AP-42 SECTION 1.1

REPORT ON REVISIONS TO
5TH EDITION AP-42
SECTION 1.1
Bituminous and Subbituminous
Coal Combustion
Prepared for:
Contract No. 68-D2-0160, Work Assignment 92EPA Work Assignment Officer: Roy HuntleyOffice of Air Quality Planning and Standards
Office of Air and RadiationU. S. Environmental Protection Agency
Research Triangle Park, North Carolina 27711
Prepared by:
Eastern Research GroupPost Office Box 2010
Morrisville, North Carolina 27560
October 1996

iii
Table of Contents
Page
1.0 INTRODUCTION . . . . . . . . . . . . . . . . . . . . . . . . . . . . . . . . . . . . . . . . . . . . . . . . . . . . . 1-1
2.0 REVISIONS . . . . . . . . . . . . . . . . . . . . . . . . . . . . . . . . . . . . . . . . . . . . . . . . . . . . . . . . . . 2-1
2.1 General Text Changes . . . . . . . . . . . . . . . . . . . . . . . . . . . . . . . . . . . . . . . . . . . . 2-12.2 Sulfur Oxides, SOx . . . . . . . . . . . . . . . . . . . . . . . . . . . . . . . . . . . . . . . . . . . . . . 2-12.3 Nitrogen Oxides, NOx . . . . . . . . . . . . . . . . . . . . . . . . . . . . . . . . . . . . . . . . . . . . 2-12.4 Carbon Monoxide, CO . . . . . . . . . . . . . . . . . . . . . . . . . . . . . . . . . . . . . . . . . . . . 2-32.5 Filterable Particulate Matter (PM) and PM Less Than 10 Microns (PM-10) . . 2-32.6 Particle Size Distribution, PSD . . . . . . . . . . . . . . . . . . . . . . . . . . . . . . . . . . . . . 2-32.7 Total Non-Methane Organic Compounds, TNMOC . . . . . . . . . . . . . . . . . . . . . 2-32.8 Greenhouse Gases . . . . . . . . . . . . . . . . . . . . . . . . . . . . . . . . . . . . . . . . . . . . . . . 2-32.9 Toxic Air Pollutants . . . . . . . . . . . . . . . . . . . . . . . . . . . . . . . . . . . . . . . . . . . . . . 2-6
3.0 REFERENCES . . . . . . . . . . . . . . . . . . . . . . . . . . . . . . . . . . . . . . . . . . . . . . . . . . . . . . . 3-1
4.0 REVISED SECTION 1.1 . . . . . . . . . . . . . . . . . . . . . . . . . . . . . . . . . . . . . . . . . . . . . . . . 4-1
5.0 EMISSION FACTOR DOCUMENTATION, APRIL 1993 . . . . . . . . . . . . . . . . . . . . . 5-1
Appendix A
1-1
1.0 INTRODUCTION
This report supplements the Emission Factor (EMF) Documentation for AP-42 Section
1.1, Bituminous and Subbituminous Coal Combustion, dated April, 1993. The EMF describes
the source and rationale for the material in the most recent updates to the 4th Edition, while this
report provides documentation for the updates written in both Supplements A and B to the 5th
Edition.
Section 1.1 of AP-42 was reviewed by internal peer reviewers to identify technical
inadequacies and areas where state-of-the-art technological advances need to be incorporated.
Based on this review, text has been updated or modified to address any technical inadequacies or
provide clarification.
Emission factors for criteria pollutants were checked for accuracy with information in the
EMF Document and new emission factors generated if recent test data were available. If
discrepancies were found when checking the factors with the information in the EMF Document,
the appropriate reference materials were then checked. In some cases, the factors could not be
verified with the information in the EMF Document or from the reference materials, in which
case the factors were not changed.
The emission factors for toxic air pollutants in Section 1.1 were not examined; however,
emissions data from several sources were evaluated for toxic emission factors of sufficient
quality that could replace existing factors of relatively lower quality or that would be added to the
section as new factors. None of the existing toxic emission factors were replaced, but many new
factors were added as a result of the evaluation.
Four sections follow this introduction. Section 2 of this report documents the revisions
and the basis for the changes. Section 3 presents the references for the changes documented in
this report. Section 4 presents the revised AP-42 Section 1.1, and Section 5 contains the EMF
documentation dated April, 1993.

2-1
2.0 REVISIONS
This section documents the revisions made to Section 1.1 of the 5th Edition of AP-42.
2.1 General Text Changes
Text was clarified or added concerning coal rank, firing practices, emissions, and
controls. The table presenting NOx controls for stoker coal-fired boilers was modified to include
NOx controls for all types of coal-fired boilers. Also, at the request of EPA, metric units were
removed.
2.2 Sulfur Oxides, SOx
The SOx emission factors were checked against information in Table 4-2 of the EMF
Document and no changes were required.
2.3 Nitrogen Oxides, NOx
The NOx emission factors were checked against information in Table 4-3 of the EMF
Document and no changes were required. However, data were available to create an emission
factor for a new firing configuration—cell burner fired boilers. The cell burner boiler is a special
type of an opposed wall-fired boiler that has two or three closely (vertically) spaced burners
(referred to as a "cell"). Cell burner boilers can emit up to twice as much NOx as typical wall-
fired boilers due to higher heat release rates, higher combustion temperatures, and more
turbulence in the primary combustion zone. All of these factors contribute to higher NOx levels.

Data for six cell burner units from four references were reviewed.(1-4) The data ranged from 18.5lb/ton to 44.4 lb/ton, with an average of 31 lb/ton. The data are summarized in Table 1.2.4.

2-3
Tab
le 1
. Su
mm
ary
of C
ell B
urne
r D
ata
Ref
eren
cea
Dat
aR
atin
gU
nit
Cap
acit
y (M
W)
Coa
l Typ
eH
eati
ng V
alue
,B
tu/lb
Tes
ted
Loa
d, %
NO
xlb
/mm
Btu
NO
xlb
/ton
1B
Cum
berl
and
113
00B
it (1
)13
064
781.
744
.42
1B
Cum
berl
and
213
00B
it (1
)13
016
951.
539
.05
1B
Cum
berl
and
213
00B
it (1
)13
016
100
1.4
36.4
4
1B
Fou
r C
orne
rs 4
800
Sub
bit (
2)13
016
751.
0828
.08
1B
Fou
r C
orne
rs 4
800
Sub
bit (
2)13
000
951.
0928
.34
2C
Fou
r C
orne
rs 4
800
Sub
bit (
3)13
000
100
1.27
35.1
7
1B
Har
lee
Bra
nch
348
0B
it (2
)13
848
830.
7118
.46
1B
Har
lee
Bra
nch
348
0B
it (2
)13
000
100
0.95
24.7
0
3C
Fou
r C
orne
rs 5
800
Sub
bit (
4)13
848
931.
1531
.85
4B
J.M
. Stu
art 4
610
Bit
(2)
1300
075
0.92
23.9
2
4B
J.M
. Stu
art 4
610
Bit
(2)
1300
010
01.
2231
.72
Ove
rall
Rat
ing:
Ave
rage
C1.
1831
.10
Hea
ting
Val
ue N
otes
:(1
) F
rom
ref
eren
ce, p
. 102
(2)
Typ
ical
val
ue, A
P-4
2, 5
th E
ditio
n, A
ppen
dix
A(3
) E
stim
ated
fro
m F
our
Cor
ners
5 d
ata
in R
efer
ence
5(4
) F
rom
Ref
eren
ce 4
a RE
FE
RE
NC
ES
:
from 18.5 lb/ton to 44.4 lb/ton, with an average of 31 lb/ton. The data are summarized in Table 1.

2-4
2.4 Carbon Monoxide, CO
The CO emission factors were checked against information in Table 4-4 of the EMF
Document and no changes were required.
2.5 Filterable Particulate Matter (PM) and PM Less Than 10 Microns (PM-10)
The filterable PM and PM-10 emission factors were checked against Table 4-2 of the
EMF Document and remain the same as in the 7/93 version of AP-42.
2.6 Particle Size Distribution, PSD
The PSD emission factors for dry bottom boilers, wet bottom boilers, cyclone furnaces,
spreader stokers, overfeed stokers, and underfeed stokers were checked against information in the
EMF Document and the 9/88 version of AP-42. There were no changes required.
2.7 Total Non-Methane Organic Compounds, TNMOC
The TNMOC emission factors were checked against information in the EMF Document
and no changes were necessary.
2.8 Greenhouse Gases
2.8.1 Carbon Dioxide, CO2
The CO2 emission factors provided in the footnotes to Tables 1.1-1 and 1.1-2 were based
on 100% conversion of fuel carbon content to CO2. References 5-8 suggest that 99% is a more
accurate conversion factor for solid fuel combustion. Therefore, the conversion factor in the
footnotes of Table 1.1-1 was changed from 73.3C to 72.6C.

2-5
44 ton CO212 ton C
x 0.99 × 2000lb CO2ton CO2
×1
100%' 72.6
lb CO2ton & %C
In case an ultimate analysis is not available, default CO2 emission factors for U.S. coals
were computed based on the conversion factor presented above and average carbon content (dry
basis) for each class of coal. Several references were located that listed carbon content of U.S.
coals. These reference sources were then compared and default emission factors were computed
based on the average of all reference sources for the bituminous and subbituminous coals in
Table 2. Because of the geographical variance of carbon content within each subtype, these
default factors were assigned a “C” rating.
Table 2. Default CO2 Emission Factors for U.S. CoalsEmission Factor Rating: C
Coal TypeAverage
%CaConversion
FactorbEmission Factor(lb CO2/ton coal)
Subbituminous 66.3 72.6 4810
High-Volatile Bituminous 75.9 72.6 5510
Medium-Volatile Bituminous 83.2 72.6 6040
Low-Volatile Bituminous 86.1 72.6 6250
a An average of the values given in References 9-12. Each of these references listedaverage carbon contents for each coal type (dry basis) based on extensive sampling ofU.S. coals.
b Based on the following equation:
Where: 44 = molecular weight of CO2;12 = molecular weight of carbon; and0.99 = fraction of fuel oxidized during combustion (Reference 6).

2-6
2.8.2 Methane, CH4
No data were found to improve the current “B” rated CH4 emission factors for bituminous
and subbituminous coal combustion in Tables 1.1-11 and 1.1-12.
2.8.3 Nitrous Oxide, N2O
The existing N2O emission factors for coal combustion in Table 1.1-11 were “E” rated
and may possibly be based on test data obtained before the discovery of a testing artifact that
caused erratic readings in test samples.(13) The following emission factors are based on source
test data obtained since the discovery of the N2O testing artifact and were obtained using proper
testing protocols.
Table 3. Emission Factors for Coal Combustion in Section 1.1(lb N2O/ton coal)
Combustion Category New New Previous Previous AP-42
Fluidized bed - utility B 3.5a 5.5 E
Pulverized coal - utility D 0.04b 0.09 E
Spreader-stoker - utility D 0.04b 0.09 E
Tangentially fired - utility / industrial B 0.08a 0.03 D
Wall fired - utility / industrial B 0.3a 0.09 D
a References 14, 15. b References 16, 17.
The fluidized bed emissions data are based on 17 source tests at 5 different facilities
collected by Nelson.(14) This data were regressed and emission factors were developed by Peer.(15)
The pulverized coal and spreader-stoker factor is based on data taken at six coal-fired power
plants collected by Montgomery(16) and analysis of this data conducted by Piccot.(17) The
tangentially-fired data are based on 24 source tests at 10 different facilities collected by Nelson.

2-7
E ' Cd Fd20.9
20.9 & %O2
The wall-fired data are based on 15 source tests conducted at 7 different facilities collected by
Nelson.
The data sets were converted to pounds per million BTU (lb/MMBtu) according to the
procedures given in 40 CFR 60, Appendix A. To obtain lbs/MMBtu, the emissions (in ppm)
were first multiplied by 1.141 x 10⁻⁷ (lb/scf)/ppm. These values were then converted to
lb/MMBtu using the following formula:
Where: Cd = N2O concentration (lb/scf);Fd = Fuel factor (F-factor) for coal; and%O2 = oxygen concentration in the exhaust gas.
An F-factor of 9,780 scf/MMBtu was used for bituminous coal. Lb/MMBtu values were then
converted to mass-based emission factors using a heating value of 13,000 Btu/lb for bituminous
coal (AP-42 Appendix A).
2.9 Toxic Air Pollutants
The existing toxic emission factors in Section 1.1 were not replaced but an evaluation of
toxic emissions data resulted in the development of new factors that were added to the section.
Most of the emissions data were stack test reports that presented emission factors, or reports that
presented emissions and process data from which emission factors were developed. The
following sections describe the documents evaluated and the methods used to develop the toxic
emission factors.

2-8
2.9.1 General Document Evaluation and Emission Factor Development
Section 1.1, Bituminous And Subbituminous Coal Combustion and Section 1.7, Lignite
Combustion were updated simultaneously and, therefore, emissions data from both types of
combustion were of interest during the emissions data evaluation.
The focus of the emissions data evaluation was on toxic air pollutants, especially metals.
Several documents provided emissions data for compounds that are not considered hazardous air
pollutants and these data were not used to develop emission factors. Because of the limited
scope of the emission factor development project, some data for toxic air pollutants were not
used. Emissions data for radionuclides were encountered but were not used because the list of
potential radionuclide emission factors is quite extensive. Emissions data for dioxins/furans
were not used unless data for the tetra— through octa— homologue groups were provided.
Because of budget constraints, the document evaluation concentrated on air emissions, or
final stack emissions, only. Emissions data obtained from sampling at control device inlets, or
outlets of intermediate control devices, were not used to develop emission factors.
Following EPA guidance, the emission factors developed for Section 1.1 of AP-42 are
expressed in units of pound of pollutant emitted per ton of coal fired (lb/ton). Thus, the
emissions documents were evaluated in order to identify emission factors, or information from
which emission factors could be developed, in units of lb/ton. Many of the documents presented
emission factors, but they were in units of pound of pollutant emitted per million British thermal
units of heat input (lb/MMBtu). In such cases, a higher heating value (HHV) for coal in units of
Btu/lb was used to convert the factor to units of lb/ton. Several of the documents provided
emissions and process information, such as emission rates and coal feed rates, that were used to
develop emission factors. Some of the documents provided coal data, such as the HHV and coal
feed rate, on a dry-basis. When the moisture content of the coal was provided, the dry-basis data
were converted to as-fired, or as-received, data. The methods used for each document to develop
the emission factors are described in Section 2.9.2 Description Of Documents Evaluated.

2-9
The majority of the documents evaluated were emissions test reports obtained from
various sources. One source of emissions information was test reports provided by the Electric
Power Research Institute (EPRI) and the U.S. Department of Energy (DOE). EPRI and DOE
conducted an extensive emissions test program at several coal-fired power plants in order to
characterize their emissions. Most of the individual facility test reports and the summary report
of the test program were provided to EPA for use in emission factor development.
Another source of information was several emissions test reports from coal-fired power
plants provided to EPA by the Northern States Power Company (NSP). In addition, several test
reports obtained by EPA from other sources were evaluated.
A computer spreadsheet was constructed for each document where calculations were
required to develop and characterize emission factors from information presented in the
document. A spreadsheet was created for every reference except Reference 18. Reference 18 is
a summary of an emissions test program conducted by EPRI and DOE. The spreadsheets were
used as mathematical tools and as a means of documenting all calculations and assumptions.
Also, information from each document that was used to characterize the emission factors was
included in the spreadsheets. For example, information provided about the boiler(s) tested was
used to assign a source classification code (SCC). In addition, any control devices in use by the
emission source were noted. The spreadsheets are included in Appendix A.
When assigning SCCs to an emission source described in a reference, the boiler was
assumed to be dry bottom unless the document specified that the boiler was wet bottom or
mentioned an ash removal method that would be indicative of a wet bottom boiler. All emission
controls described by the reference as being in use at the time the emissions data were collected
were noted and no attempt was made to judge the effect of a control device on any of the
sampled pollutants. Emissions data were characterized as "uncontrolled" unless there was no
type of pollution control device at all in use when the emissions data were collected.
2.9.2 Description of Documents Evaluated

2-10
The following paragraphs provide a summary of the information presented in each
document that was evaluated for emission factors. Also, the methods used to develop emission
factors from the information provided in each document are described. The computer
spreadsheets that were constructed for each document (except Reference 18) are contained in
Appendix A. The text descriptions are provided as a supplement to the spreadsheets in order to
ensure that the development of all emission factors is fully explained.
Reference 18
This document summarizes the results of the emissions test program conducted by EPRI
and DOE. This document presents emission factor equations for nine trace metals and emission
factors for five organic pollutants that were developed from emissions data collected during the
test program. The emission factor equations were judged to be of sufficient quality for inclusion
in AP-42 and are presented there "as is," i.e., no adjustments or conversions were made. The
organic emission factors were not used for AP-42 because they are a geometric, instead of
arithmetic, mean. The reference was assigned a data quality rating of "A." The emission factor
equations are discussed in detail in Section 2.9.3 Emission Factor Development.
Reference 19
This reference presents the results of an emissions test at the NSP Sherco Plant located in
Becker, Minnesota. The boiler tested was Unit Three, which is an 860 megawatt (MW) Babcock
and Wilcox (B&W) unit which came on line in 1987. The boiler was firing pulverized
subbituminous coal from Montana during the emissions test. Emission controls utilized during
the emissions test were a spray dryer absorber and a baghouse.
Three sampling runs were conducted for dioxins/furans, and the emissions test results are
reported as emission rates in units of grams per second (g/sec). The reference indicates that all
sampling results were above the detection limits. Emission rates in units of g/sec were converted
to pounds per hour (lb/hr).

2-11
The report did not provide coal feed rates or the HHV of the coal fired during the
emissions tests. A fuel factor (F-factor) for coal of 9,780 dry standard cubic feet per MMBtu
(dscf/MMBtu), provided in 40 Code of Federal Regulations (CFR) Part 60 Appendix A Method
19, and the stack gas volumetric flow rate, dry standard cubic feet per hour (dscf/hr) were used to
develop an energy input rate in MMBtu/hr. An HHV of 8,547 Btu/lb, provided in another stack
test report (Reference 25) from the same facility was used to convert the energy input rate to a
coal feed rate in units of ton/hr. The dioxin/furan emission rates (lb/hr) were then divided by the
coal feed rate to arrive at emission factors in lb/ton.
A data quality rating of "C" was assigned to the reference because the coal feed rate
during the emissions tests and the HHV of the coal were not provided.
Reference 20
This document presents the results of two emissions tests conducted at the NSP Sherco
plant in Becker Minnesota. One emission test was conducted on Unit Three, which is a B&W
860 MW boiler firing pulverized subbituminous coal from Montana. Unit Three came on line in
1987. Emissions controls utilized during the test were a spray dryer absorber and a baghouse.
The second emissions test was performed simultaneously on Units One and Two, which
are identical Combustion Engineering 750 MW boilers which came on line in 1976. During the
tests, both boilers were firing 70% Wyoming and 30% Montana pulverized subbituminous coal.
Emissions from Units One and Two were controlled by a venturi scrubber spray tower during the
emissions tests.
Both emissions tests consisted of three sampling runs for mercury and the results are
presented as emission rates in units of lb/hr. The reference indicates that all sampling results
were above the detection limits. In addition, the document presents the coal feed rates in ton/hr
during both tests. Mercury emission factors in units of lb/ton were developed by dividing the
emission rates by the coal feed rates.

2-12
The document was assigned a data quality rating of "A."
Reference 21
This reference presents the results of an emissions test conducted simultaneously on the
Number One, Number Three, and Number Four boilers at the NSP Black Dog Plant located in
Burnsville, Minnesota. The boilers are water tube boilers and were fired with pulverized
subbituminous coal from the Antelope and North Antelope mines during the test. Emissions
controls utilized during the test were two electrostatic precipitators (ESPs) in series.
The emissions test consisted of three sampling runs for metals and the results are
presented as emission rates in units of lb/hr. Full detection limit values were used to develop
emission rates for pollutants that were not detected in any sampling run. Stack gas volumetric
flow rates presented in the report (dscf/hr) and an average F-factor for coal of 9,780 dscf/MMBtu
were used to develop an energy input rate in units of MMBtu/hr. The reference provides an
HHV for the coal fired during the emissions test of 8,707 Btu/lb on an as-received basis. This
value was used to convert the energy input rate to a coal feed rate in ton/hr. The emission rates
were divided by the coal feed rate to arrive at emission factors in units of lb/ton.
The document was assigned a data quality rating of "B" because the coal feed rates during
the emissions test were not provided.
Reference 22
The results of an emissions test conducted on the Number Two boiler at the NSP Black
Dog plant in Burnsville, Minnesota, are presented in this report. The Number Two boiler is a
137 MW Foster-Wheeler atmospheric fluidized bed combustor (AFBC). At the time of the
emissions test, Unit Two was firing 100% Western coal (blend of Antelope and Northern
Antelope), which is subbituminous coal. Emission control devices in use during the test were a
mechanical dust collector and two ESPs in series.
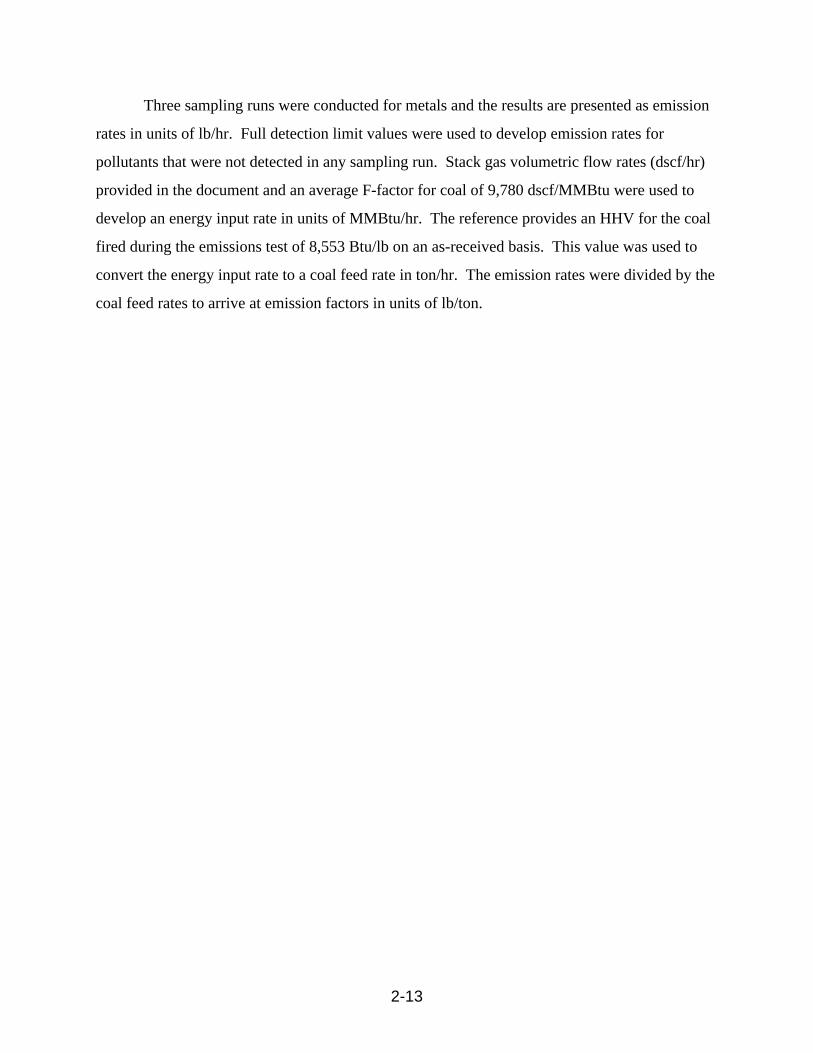
2-13
Three sampling runs were conducted for metals and the results are presented as emission
rates in units of lb/hr. Full detection limit values were used to develop emission rates for
pollutants that were not detected in any sampling run. Stack gas volumetric flow rates (dscf/hr)
provided in the document and an average F-factor for coal of 9,780 dscf/MMBtu were used to
develop an energy input rate in units of MMBtu/hr. The reference provides an HHV for the coal
fired during the emissions test of 8,553 Btu/lb on an as-received basis. This value was used to
convert the energy input rate to a coal feed rate in ton/hr. The emission rates were divided by the
coal feed rates to arrive at emission factors in units of lb/ton.

2-14
The reference was assigned a data quality rating of "B" because the coal feed rates during
the emissions test were not provided.
Reference 23
This reference presents the results of an emissions test conducted simultaneously on the
Number Three, Number Four, Number Five, and Number Six boilers at the NSP High Bridge
plant in St. Paul, Minnesota. All of these boilers are B & W boilers and are equipped to fire
pulverized coal. During the test, the boilers were fired with subbituminous coal from the
Rochelle mine. A coldside ESP was in use during the emissions test.
Three sampling runs were conducted for metals, benzene, toluene, ethylbenzene, and
xylene and the results are presented as emission rates in units of lb/hr. All sampling results for
metals were above the detection limits. Benzene, toluene, ethylbenzene, and xylene were not
detected in any sampling run and no emission factors for these pollutants were developed. Stack
gas volumetric flow rates (dscf/hr) provided in the document and an average F-factor for coal of
9,780 dscf/MMBtu were used to develop an energy input rate in MMBtu/hr. The reference
presents an HHV for the coal fired during the emissions test of 8,498 Btu/lb on an as-received
basis. This value was used to convert the energy input rate to a coal feed rate in ton/hr. The
emission rates were divided by the coal feed rates to arrive at emission factors in units of lb/ton.
This reference was assigned a data quality rating of "B" because the coal feed rates during
the emissions test were not provided.
Reference 24
This document presents the results of emissions tests conducted on the Units Six and
Seven at the NSP Riverside plant in Minneapolis, Minnesota. These boilers are pulverized

2-15
coal-fired boilers and were firing subbituminous coal from the Rochelle mine during the
emissions tests. Emission controls in use during the test consisted of a baghouse.
Three sampling runs were conducted for metals, benzene, toluene, ethylbenzene and
xylene. For metals, the emissions data from both units were combined and presented as emission
rates in units of lb/hr. The benzene, toluene, ethylbenzene and xylene emissions data are
presented separately for each unit as emission rates in lb/hr. All sampling results for metals were
above the detection limits. Toluene, ethylbenzene, and xylene were not detected in any sampling
run and no emission factors for these pollutants were developed. Stack gas volumetric flow rates
(dscf/hr) provided in the document and an average F-factor for coal of 9,780 dscf/MMBtu were
used to develop an energy input rate in MMBtu/hr. The reference provides an HHV for the coal
fired during the emissions test of 8,602 Btu/lb on an as-received basis. This value was used to
convert the energy input rate to a coal feed rate in ton/hr. The emission rates were divided by the
coal feed rates to arrive at emission factors in units of lb/ton.
The reference was assigned a data quality rating of "B" because the coal feed rates during
the emissions test were not provided.
Reference 25
The results of an emissions test conducted simultaneously on Units One and Two at the
NSP Sherburne County Generating Station located in Becker, Minnesota, are presented in this
reference. The units are identical Combustion Engineering 750 MW boilers which came on line
in 1976 and were fired with 80% Rochelle and 20% Coalstrip pulverized subbituminous coal
during the test. The boilers were controlled by a wet limestone scrubbing system consisting of
twelve individual rod venturi scrubber spray towers during the test.

2-16
Three sampling runs were conducted for metals and the results are presented as emission
rates in units of lb/hr. Full detection limit values were used to calculate emission rates for
pollutants that were not detected in any sampling run. Stack gas volumetric flow rates (dscf/hr)
provided in the document and an average F-factor for coal of 9,780 dscf/MMBtu were used to
develop an energy input rate in MMBtu/hr. The reference provides an HHV for the coal fired
during the emissions test of 8,547 Btu/lb on an as-received basis. This value was used to convert
the energy input rate to a coal feed rate in ton/hr. The emission rates were divided by the coal
feed rates to arrive at emission factors in units of lb/ton.
The reference was assigned a data quality rating of "B" because the coal feed rates during
the emissions test were not provided.
Reference 26
This document presents the results of an emissions test conducted simultaneously on
Units One and Two at the NSP Sherburne County Generating Station located in Becker,
Minnesota. The units are identical Combustion Engineering 750 MW boilers which came on line
in 1976. The document does not specify the type of coal being fired during the tests. Two other
test reports from this facility are included in this documentation (References 25 and 19) and the
boilers were firing pulverized subbituminous coal during those tests. Thus, it was assumed that
the boilers were firing pulverized subbituminous coal during the tests described in this reference.
Emissions were controlled by a wet limestone scrubbing system consisting of twelve individual
rod venturi scrubber spray towers during the emissions test.
Three sampling runs were conducted for metals and the results are presented as emission
rates in units of lb/hr. Full detection limit values were used to develop emission rates for
pollutants that were not detected in any sampling run. Stack gas volumetric flow rates (dscf/hr)
provided in the document and an average F-factor for coal of 9,780 dscf/MMBtu were used to
develop an energy input rate in MMBtu/hr. The reference does not provide an HHV for the coal
fired during the emissions test and, therefore, an HHV for coal of 8,547 Btu/lb presented in
Reference 25 (test report from the same facility) was used to convert the energy input rate to a

2-17
coal feed rate in ton/hr. The emission rates were divided by the coal feed rates to arrive at
emission factors in units of lb/ton.
The reference was assigned a data quality rating of "B" because the coal feed rates during
the emissions test were not provided.
Reference 27
The results of an emissions test conducted on Unit Three at the NSP Sherburne County
Generating Station located in Becker, Minnesota, are presented in this document. Unit Three is a
B & W 860 MW boiler which came on line in 1987 and was fired with pulverized subbituminous
coal from Montana during the emissions test. The boiler was controlled by a spray dryer
absorber and a baghouse during the emissions test.
Three sampling runs were conducted for metals and the results are presented as emission
rates in units of lb/hr. Full detection limit values were used to develop emission rates for
pollutants that were not detected in any sampling run. Stack gas volumetric flow rates (dscf/hr)
provided in the document and an average F-factor for coal of 9,780 dscf/MMBtu were used to
develop an energy input rate in MMBtu/hr. The document does not provide an HHV for the coal
fired during the test and, therefore, an HHV for coal of 8,547 Btu/lb presented in Reference 25
(test report from the same facility) was used to convert the energy input rate to a coal feed rate in
ton/hr. The emission rates were divided by the coal feed rates to arrive at emission factors in
units of lb/ton.
The reference was assigned a data quality rating of "B" because the coal feed rates during
the emissions test were not provided.

2-18
Reference 28
This reference presents the results of emission testing at a facility designated as EPRI Site
10. The boiler at this site is a fluidized bed combustor capable of producing approximately 100
MW of power at full load. According to the EPRI Synthesis Report (Reference 18), the boiler is
a circulating bed AFBC and was firing subbituminous coal during the tests. Emissions controls
utilized during the tests were flue gas desulfurization (FGD) by limestone injection into the
boiler combustion chamber and a fabric filter.
Test sampling runs were conducted for metals and organics. Because of a forced boiler
outage, only one sampling run was conducted for all compounds except benzene. Five samples
for benzene were collected at a later date. Full detection limit values were used to develop
emission factors for pollutants that were not detected in any sampling run.
Emissions test results for dibutyl phthalate, bis(2-ethylhexyl), and
N-nitrosodimethylamine are presented as concentrations in units of microgram per Normal cubic
meter (Fg/Nm3). The reference indicates that all sampling results for these pollutants were
above the detection limits. The concentrations were converted to units of pounds per dry
standard cubic feet (lb/dscf) and multiplied by the stack gas volumetric flow rate (dscf/hr) to
arrive at an emission rate in lb/hr. The reference presents a dry-basis coal feed rate of 108,626
lb/hr during the test and a coal moisture percent of 7.3. The dry coal feed rate was divided by
100% minus 7.3% (92.7%) to obtain a coal feed rate, as fired, of 117,180 lb/hr. The emission
rates for the three pollutants were divided by the coal feed rate, as fired, to obtain emission
factors in units of lb/ton.
The emissions results for the other compounds are presented as emission factors in units
of lb/1012 Btu. Full detection limit values were used to develop emission factors that are based
only on sampling results that were below detection limits. The reference presents an HHV for
the coal of 11,000 Btu/lb on a dry basis. The dry-basis HHV was divided by 100% plus 7.3%
(107.3%) to obtain a HHV of 10,252 Btu/lb for the coal, as fired. The as-fired coal HHV was
used to convert the emission factors in units of lb/1012 Btu to factors in units of lb/ton.

2-19
This reference was assigned a data quality rating of "A."
Reference 29
This document presents the results of emissions testing at a facility designated as EPRI
Site 11. The boiler tested is a 700 MW Combustion Engineering dry bottom, tangentially fired
unit with pulverized subbituminous coal from the Power River basin. Emission controls utilized
during the test were over-fire air, an ESP, and a wet limestone scrubber/absorber.
Three sampling runs were conducted for metals, formaldehyde, and naphthalene and the
results are presented as emission factors in units of lb/MMBtu. However, Run Three was invalid
because of suspected contamination. For Run One, the vapor phase samples were lost and,
therefore, were not analyzed. Emissions results for the solid phase of Run One and the Run Two
solid and vapor phase results were used to calculate the average emission factors presented in the
report. Rather than convert the emission factors presented in the reference from lb/1012 Btu to
lb/ton, the data from Run Two were used to develop emission factors. Pollutant concentrations
in Fg/Nm3 provided in the report for Run Two were converted to lb/dscf and then multiplied by
the stack gas volumetric flow rate (dscf/hr) provided in the report to obtain emission rates in
lb/hr. Full detection limit values were used to develop emission rates for pollutants that were not
detected. An F-factor for coal of 9,780 dscf/MMBtu and the stack gas volumetric flow rate
(dscf/hr) were used to calculate an energy input rate in MMBtu/hr. The reference presents an
HHV for the coal fired during the emissions test of 8,300 Btu/lb, as received. This value was
used to convert the energy input rate to a coal feed rate in ton/hr. The pollutant emission rates
were divided by the coal feed rate to obtain emission factors in units of lb/ton.
This reference was assigned a data quality rating of "B" because the coal feed rate was not
provided.
Reference 30

2-20
The results of emissions testing at a facility designated as EPRI Site 12 are presented in
this report. The boiler at Site 12 is an approximately 700 MW which commenced commercial
operation in the mid-1980's. The boiler is a B & W balanced draft, opposed-wall, natural
circulation, pulverized coal-fired, dry bottom boiler. The boiler was firing western Pennsylvania
bituminous coal and was controlled by a wet limestone scrubber and ESP during the emissions
test.
Three sampling runs were conducted for metals and organics, however, one of the metals
runs was declared invalid because of a sample processing error. The emissions results are
presented as emission factors in units of lb/1012 Btu. Full detection limit values were used to
develop emission factors that are based only on results that were below detection limits. The
reference provides an average HHV for the coal fired during the emissions test of 13,733 Btu/lb
on a dry basis and a coal moisture content of 4.12% The dry-basis HHV was converted to an
as-fired basis by dividing 13,733 Btu/lb by 104.12%, resulting in an HHV of 13,190 Btu/lb. The
as-fired coal HHV was used to convert the emission factors in units of lb/1012 Btu to factors in
units of lb/ton.
This reference was assigned a data quality rating of "A."
Reference 31
This reference presents the results of emissions testing at a facility designated as EPRI
Site 15. Site 15 has a boiler with a capacity of approximately 600 MW which began commercial
operation in 1970. The boiler is a tangentially fired furnace manufactured by

2-21
Combustion Engineering and was firing pulverized Eastern bituminous coal during the emissions
test. The pollution control system in use during the test consisted of an ESP.
Three sampling runs were conducted for metals and organics and the results are presented
as emission factors in units of lb/1012 Btu. Full detection limit values were used to develop
emission factors that are based only on results that were below detection limits. The reference
provides an HHV for the coal fired during the test of 13,000 Btu/lb, which was assumed to be on
an as-fired basis. This value was used to convert the emission factors in units of lb/1012 Btu to
factors in units of lb/ton.
A data quality rating of "A" was assigned to this reference.
Reference 32
The results of emissions testing at a facility designated as EPRI Site 19 are presented in
this report. The boiler tested at Site 19 is a B & W opposed, wall-fired unit and was burning
bituminous coal from western Virginia and Kentucky during the emissions test. An ESP was in
use during the test.
Three sampling runs were conducted for various metals. The results for antimony,
beryllium, and cobalt are presented as concentrations in units of microgram per Normal cubic
meter. The results for the three compounds were above detection limits for all sampling runs.
The concentrations were converted to lb/dscf and multiplied by the stack gas volumetric flow rate
(dscf/hr) to obtain emission rates in units of lb/hr. The reference provides an average coal feed
rate during the test of 694,000 lb/hr on a dry-basis and a coal moisture content of 6.1%. The
dry-basis coal feed rate was converted to an as-fired basis by dividing 694,000 by 93.9% (100% -
6.1%), resulting in a value of 739,084. The pollutant emission rates were divided by the coal
feed rate to obtain emission factors in units of lb/ton.

2-22
The results for the other metals are expressed as emission factors in units of lb/1012 Btu.
The reference indicates that sampling results for all compounds were above the detection limits.
The reference provides an average HHV of the coal fired during the test of 13,467 Btu/lb on a dry
basis. This HHV was converted to an as-fired HHV of 12,693 Btu/lb by dividing 13,467 by
106.1%. The as-fired coal HHV was used to convert the emission factors in units of lb/1012 Btu
to factors in units of lb/ton.
This reference was assigned a data quality rating of "A."
Reference 33
This reference presents the results of emissions testing at a facility designated as EPRI
Site 20. The boiler tested at Site 20 is a B & W wall-fired, drum type boiler with a normal
full-load value of 680 MW. The boiler was firing pulverized lignite from Wilcox, Texas during
the emissions test. Emissions controls in use during the test include two parallel cold-side ESPs
and a FGD system that uses limestone slurry for reagent.
Four sampling runs were conducted for various metals. The results for antimony are
presented as concentrations in units of microgram per Normal cubic meter. Antimony was not
detected in any of the sampling runs the concentrations are based on full detection limits. The
concentrations were converted to lb/dscf and multiplied by the stack gas volumetric flow rate
(dscf/hr) to obtain emission rates in units of lb/hr. The reference provides a coal feed rate during
the test of 618,000 lb/hr on a dry-basis and a coal moisture content of 34.4%. The dry-basis coal
feed rate was converted to an as-fired basis by dividing 618,000 by 66.4% (100% - 34.4%),
resulting in a value of 942,073. The average antimony emission rate was divided by the coal feed
rate to obtain an emission factor in units of lb/ton.
The results for the other metals are expressed as emission factors in units of lb/1012 Btu.
The reference indicates that all pollutants were detected in all sampling runs. The reference
provides an HHV of the coal fired during the test of 6,760 Btu/lb on an as-received basis. This
value was used to convert the emission factors in units of lb/1012 Btu to factors in units of lb/ton.

2-23
This reference was assigned a data quality rating of "A."
Reference 34
The results of emissions testing at a facility designated as EPRI Site 21 are presented in
this reference. The boiler at Site 21 is rated at 667 MW, gross load, and was firing bituminous
coal from Pennsylvania and West Virginia during the emissions test. Emission controls utilized
during the emissions test were a pilot ESP and FGD system. The FGD system is a spray tower
absorber using an alkaline slurry. The pilot system has demonstrated the capability to produce
the same results as a full-scale FGD system.
Eight sampling runs were conducted for metals and seven for polycyclic aromatic
hydrocarbons (PAHs). The results of the sampling runs are presented as emission factors in unit
of lb/1012 Btu. Full detection limit values were used to develop emission factors that are based
only on sampling results that were below the detection limits. The reference presents an average
HHV for the coal fired during the test of 14,032 Btu/lb on a dry basis and a coal moisture content
of 7%. The dry-basis HHV was converted to an HHV on an as-fired basis by dividing 14,032 by
107%, resulting in a value of 13,114. The as-fired coal HHV was used to convert the emission
factors in units of lb/1012 Btu to factors in units of lb/ton.
A data quality rating of "A" was assigned to this reference.

2-24
Reference 35
This reference presents the results of emissions testing at a facility designated as EPRI
Site 22. The boiler tested at Site 22 is a B & W 700 MW, wall-fired, radiant boiler. The boiler
was burning pulverized subbituminous coal from the Powder River region during the emissions
test. Emission controls used during the test were two parallel cold-side ESPs.
Three sampling runs were conducted for metals, dioxins/furans, and PAHs and the results
are presented as emission factors in units of lb/1012 Btu. Full detection limit values were used to
develop emission factors that are based only on results that were below the detection limits. The
reference provides an average HHV for the coal fired during the emissions test of 11,981 Btu/lb
on a dry-basis and a coal moisture content of 29.5%. The dry-basis HHV was converted to an
as-fired HHV of 9,252 Btu/lb by dividing 11,981 by 129.5%. The as-fired coal HHV was used to
convert the emission factors in units of lb/1012 Btu to factors in units of lb/ton.
This report was assigned a data quality rating of "A."
Reference 36
This reference presents the results of emissions testing at a facility designated as EPRI
Site 101. The boiler tested at this site is a B & W, 800 MW, wall-fired unit and was burning
pulverized subbituminous coal from New Mexico during the emissions test. Emission controls
in use during the test include low NOx burners, a fabric filter, and FGD system consisting of a
wet lime scrubber.
Three sampling runs were conducted for metals and organics. The solid phase sample for
metals test Run Two was destroyed prior to analysis and, therefore, except for mercury, the
metals emissions results are based on two sampling runs. Because mercury is present

2-25
primarily in the vapor phase, the solid phase average of Runs One and Three was used to
represent the solid phase results for mercury for Run Two.
The test runs results are presented as emission factors in units of lb/1012 Btu. The
reference presents an average HHV for the coal fired during the test of 10,190 Btu/lb on a dry
basis and a coal moisture content of 14%. The dry-basis HHV was converted to an as-fired HHV
by dividing 10,190 by 114%, resulting in a value of 8,939. The as-fired coal HHV was used to
convert the emission factors in units of lb/1012 Btu to factors in units of lb/ton.
A data quality rating of "A" was assigned to this reference.
Reference 37
The results of emissions testing at a facility designated as EPRI Site 111 are presented in
this reference. The boiler at this site is 267 MW, two-flow, single-reheat, balanced draft, drum
type boiler. The boiler was burning a Western subbituminous coal during the tests. The
pollution control system in use during the test consists of a fabric filter and spray dryers for FGD.
Two sampling runs were conducted for metals, PAHs, and various other organics. The
results are expressed as emission factors in units of lb/1012 Btu. Full detection limit values were
used to develop emission factors that are based only on sampling results that were below
detection limits. The reference provides an average HHV for the coal fired during the test of
10,020 Btu/lb on an as-received basis. This value was used to convert the emission factors in
units of lb/1012 Btu to factors in units of lb/ton.
This report was assigned a data quality rating of "A."

2-26
Reference 38
This reference presents the results of emissions testing at a facility designated as Site 114.
The unit at Site 114 is a B & W, cyclone-fired reheat boiler rated at 100 MW. Bituminous coal
from Indiana was fired during the emissions tests. Emissions sampling was conducted under two
boiler operating conditions, baseline and reburn. Emissions controls used under the baseline
operating condition consisted of an ESP. Controls used during the reburn operating condition
were an ESP along with wall-fired burners located at a higher elevation in the boiler and overfire
air to reduce NOx emissions.
Three sampling runs for metals, PAHs, and various other organics were conducted under
each operating condition and the results for each condition are reported separately and are
expressed as emission factors in units of lb/1012 Btu. PAHs are reported as "not detected" and
no emission factors were developed. For the other "not detected" pollutants, full detection limit
values were used to develop emission factors.
The reference reports an average HHV for the coal fired during the baseline condition of
13,490 Btu/lb on a dry-basis and a coal moisture content of 15.6%. The dry-basis HHV was
converted to an as-fired basis by dividing 13,490 by 115.6%, resulting in an as-fired HHV of
11,670 Btu/lb. The reported average HHV for the coal fired during the reburn condition was
13,280 Btu/lb, dry-basis, and the average content was 12.5%. The dry-basis HHV was converted
to an as-fired HHV by dividing 13,280 by 112.5%, resulting in an as-fired HHV of 11,804
Btu/lb. The as-fired coal HHVs were used to convert the emission factors in units of lb/1012 Btu
to factors in units of lb/ton.
This reference was assigned a quality rating of "A."

2-27
Reference 39
The results of emissions testing at a facility designated as EPRI Site 115 are presented in
this report. The unit tested at this site is a 117 MW B & W roof-fired boiler commissioned in
1955. The boiler was firing pulverized Western bituminous coal during the emissions tests.
Emissions tests were conducted in two phases. Emissions controls in use during both phases
included low NOx burners, overfire air, and a fabric filter. Additional controls used in Phase II
included a urea injection system for selective non-catalytic NOx reduction.
Three sampling runs were conducted for metals and organics during both operating
conditions, and the results are presented separately and are expressed as emission factors in
lb/1012 Btu. Full detection limit values were used to develop emission factors that are based
only on sampling results that were below detection limits.
The report presents an average HHV for the coal of 12,565 Btu/lb and 12,638 Btu/lb fired
during Phase I and Phase II, respectively. The reported HHV for the coal is on a dry basis and
the reference does not provide the moisture content of the coal, as received. A test report from
the facility designated as EPRI Site 111 (Reference 37) where the boiler was firing a Western
bituminous coal reports a moisture content of 9.8%. This value was used to convert the dry-basis
coal HHV at Site 115 to an as-fired basis by dividing 12,565 and 12,638 by 109.8%, resulting in
an as-fired HHV for the coal fired during Phase I testing of 11,444 Btu/lb and 11,510 Btu/lb for
the coal fired during Phase II. The as-fired coal HHVs were used to convert the emission factors
in units of lb/1012 Btu to factors in units of lb/ton.
This reference was assigned a data quality rating of "C" because an as-fired coal HHV or
information that could be used to calculate it were not provided.
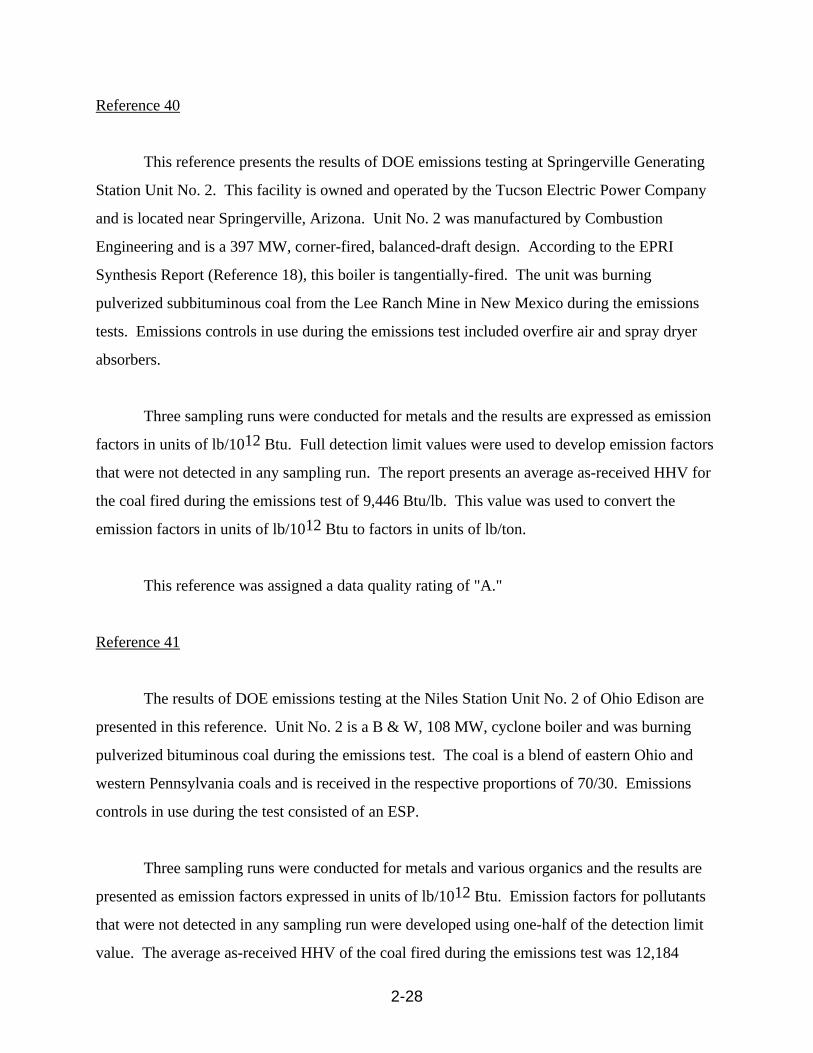
2-28
Reference 40
This reference presents the results of DOE emissions testing at Springerville Generating
Station Unit No. 2. This facility is owned and operated by the Tucson Electric Power Company
and is located near Springerville, Arizona. Unit No. 2 was manufactured by Combustion
Engineering and is a 397 MW, corner-fired, balanced-draft design. According to the EPRI
Synthesis Report (Reference 18), this boiler is tangentially-fired. The unit was burning
pulverized subbituminous coal from the Lee Ranch Mine in New Mexico during the emissions
tests. Emissions controls in use during the emissions test included overfire air and spray dryer
absorbers.
Three sampling runs were conducted for metals and the results are expressed as emission
factors in units of lb/1012 Btu. Full detection limit values were used to develop emission factors
that were not detected in any sampling run. The report presents an average as-received HHV for
the coal fired during the emissions test of 9,446 Btu/lb. This value was used to convert the
emission factors in units of lb/1012 Btu to factors in units of lb/ton.
This reference was assigned a data quality rating of "A."
Reference 41
The results of DOE emissions testing at the Niles Station Unit No. 2 of Ohio Edison are
presented in this reference. Unit No. 2 is a B & W, 108 MW, cyclone boiler and was burning
pulverized bituminous coal during the emissions test. The coal is a blend of eastern Ohio and
western Pennsylvania coals and is received in the respective proportions of 70/30. Emissions
controls in use during the test consisted of an ESP.
Three sampling runs were conducted for metals and various organics and the results are
presented as emission factors expressed in units of lb/1012 Btu. Emission factors for pollutants
that were not detected in any sampling run were developed using one-half of the detection limit
value. The average as-received HHV of the coal fired during the emissions test was 12,184

2-29
Btu/lb. This value was used to convert the emission factors in units of lb/1012 Btu to factors in
units of lb/ton.
This reference was assigned a data quality rating of "A."
Reference 42
This reference presents the results of DOE emissions testing at the Coal Creek Station
which is operated by Cooperative Power and is located about 50 miles north of Bismarck, North
Dakota. The unit tested is a 550 MW, tangentially-fired, water walled, dry bottom furnace, with
a Combustion Engineering controlled circulation boiler. The furnace is fueled by lignite from the
Falkirk mine located adjacent to the plant. Emissions controls used during the test were an ESP
and wet limestone scrubber.
Three sampling runs were conducted for metals and various organics and the results are
presented as emission factors expressed in units of lb/1012 Btu. Emission factors for pollutants
that were not detected in any sampling run were developed using one-half of the detection limit
value. The average as-received HHV for the lignite fired during the emissions test was 6,230
Btu/lb. This value was used to convert the emission factors in units of lb/1012 Btu to factors in
units of lb/ton.
This reference was assigned a data quality rating of "A."
Reference 43
The results of DOE emissions testing at Baldwin Power Station Unit 2 are presented in
this reference. Unit 2, located in Baldwin, Illinois, is a B & W cyclone furnace rated at 568 MW
and was built in 1973. The furnace was firing Illinois bituminous coal during the emissions test.
Emissions controls used during the test were an ESP.

2-30
Three sampling runs were conducted for metals and various organics, including PAHs
and dioxins/furans. Test results are reported as emission factors expressed in units of lb/1012
Btu. Full detection limit values were used to develop emission factors for pollutants that were
not detected in any sampling run. The average of the HHV values reported in the reference for
the coal fired during the emissions test was 10,633 Btu/lb, as received. The as-received coal
HHV was used to convert the emission factors in units of lb/1012 Btu to factors in units of lb/ton.
This reference was assigned a data quality rating of "A."
Reference 44
This reference presents the results of DOE emissions testing at the Boswell Energy
Center Unit 2 located in Cohasset, Minnesota. This unit is a Riley Stoker front-fired boiler built
in 1957 and rated at 69 MW. The boiler was burning pulverized western subbituminous coal
from the Powder River Basin area of Wyoming and Montana during the emissions tests.
Emissions controls in use during the test were a baghouse.
Three sampling runs were conducted for metals and various organics, including PAHs
and dioxins/furans. Emissions results are reported as emission factors expressed in units of
lb/1012 Btu. When a pollutant was not detected in any sampling run, full detection limit values
were used to calculate an emission factor. The average of the HHV values reported in the
reference for the coal fired during the emissions test was 8,798 Btu/lb, as received. This value
was used to convert the emission factors in units of lb/1012 Btu to factors in units of lb/ton.
This reference was assigned a data quality rating of "A."

2-31
Reference 45
The results of DOE emissions testing at Cardinal Plant Unit 1 located in Brilliant, Ohio,
are presented in this reference. Unit 1 is a wall-fired boiler rated at 615 MW and was burning
pulverized Pittsburgh No. 8 bituminous coal during the emissions test. The unit is equipped with
two ESPs arranged in parallel.
Three sampling runs for metals and various organics were conducted during sootblowing
operations and three were conducted during non-sootblowing conditions. Emissions results are
presented for both conditions, but only the results for non-sootblowing conditions were used to
develop AP-42 emission factors. The emissions test results are reported as emission factors
expressed in units of lb/1012 Btu. For pollutants where the results for all sampling runs were
below the detection limit, the average of the run detection limits was used to develop an emission
factor. The reference does not report a coal feed rate or the HHV of the coal fired during the
emissions test and, therefore, a value of 13,000 Btu/lb listed in Appendix A of AP-42 was used
to convert the reported emission factors to emission factors in units of lb/ton.
A data quality rating of "C" was assigned to this reference because the coal feed rate and
the coal HHV were not reported.
Reference 46
This reference presents the results of DOE emissions testing at a facility designated as
Site 16. The unit tested is a Foster Wheeler wall-fired boiler rated at 500 MW. The EPRI
Synthesis Report (Reference 18) indicates that the boiler was burning pulverized bituminous coal
from Virginia and Kentucky during the emissions test. Emissions controls in use during the test
were low NOx burners with overfire air and an ESP.

2-32
Three sampling runs were conducted for metals and various organics and the emissions
results are presented as emission factors in units of lb/1012 Btu. Full detection limit values were
used to develop emission factors that are based only on results that were below the detection
limit. The reference reports an average HHV for the coal fired during the emissions test of
13,800 Btu/lb, dry-basis, and a coal moisture content of 3.8%. The average dry-basis HHV was
divided by 103.8% to obtain an average as-fired HHV of 13,295 Btu/lb. The as-fired coal HHV
was used to convert the emission factors in units of lb/1012 Btu to factors in units of lb/ton.
This reference was assigned a data quality rating of "A."
Reference 47
The results of emissions testing at a facility designated as EPRI Site 122 are presented in
this reference. The unit tested is a cyclone boiler constructed during the 1950s and has a nominal
power production capacity of 275 MW. The boiler was burning bituminous coal from the Illinois
No. 5 Seam in Saline County, Illinois. An ESP was in use during the emissions test.
Three sampling runs were conducted for metals and organics and the emissions results are
reported as emission factors that are expressed in units of lb/1012 Btu. Full detection limit
values were used to develop emission factors that are based only on results that were below the
detection limit. The average HHV of the coal fired during the emissions test was 12,327 Btu/lb,
as fired. This value was used to convert the emission factors in units of lb/1012 Btu to factors in
units of lb/ton.
This reference was assigned a data quality rating of "A."

2-33
Reference 48
This reference presents hydrogen chloride (HCl) and hydrogen fluoride (HF) emission
factors that were developed from the results of a literature search. The literature search was
conducted under the National Acid Precipitation Assessment Program (NAPAP).
The reference lists four emission factors each, or four pairs of factors, for HCl and HF.
The factors are in units of lb/ton and represent both controlled and uncontrolled boilers. One pair
of emission factors is for electric generation (utility) and industrial boilers firing bituminous or
subbituminous coal. The second pair of factors is for utility and industrial boilers firing lignite.
The third pair of emission factors is for commercial/institutional boilers firing bituminous or
subbituminous coal. The fourth pair of factors is for commercial/institutional boilers firing
lignite.
The reference states that AP-42 procedures for assigning quality ratings were used to
assign ratings to the factors. The emission factor quality ratings were retained and it was not
necessary to assign a data quality rating to this reference.
References Examined But Not Used For Emission Factor Development
Several documents were examined and the emissions data they contained were not used
to develop emission factors because the data were not considered representative of the general
population of coal or lignite-fired boilers. For example, data from boilers that were not burning
100% coal or lignite were excluded. Data from boilers that were not operating normally or were
using experimental control devices were not used. Also, data whose use would result in
relatively low quality emission factors were not used. The following paragraphs describe the
documents that were examined but not used and an explanation of why they were not used.

2-34
Results of the May 28 - 31, 1991 Trace Metal Characterization Study and Dioxin
Emission Test on Unit 1 at the A.S. King Plant in Bayport, Minnesota. Interpoll Laboratories,
Inc., Circle Pines, Minnesota. November 6, 1991. The boiler was firing a mixture of coal (90%)
and petroleum coke (10%) at the time of the emissions tests.
Results of the July 1992 Air Toxic Emission Study on Unit 8 at the NSP Riverside Plant.
Interpoll Laboratories, Inc., Circle Pines, Minnesota. September 29, 1992. The boiler was firing
a mixture of coal (94%) and coke (6%) at the time of the emissions
tests.
Measurement of Chemical Emissions Under the Influence of Low-Nox Combustion
Modifications. Submitted To Southern Company Services, Inc. Final Report. October 8, 1993.
This facility was included in the emissions sampling program sponsored by EPRI and was
designated Site 110. The reference states, "Site 110 provides control over the emissions of NOx,
however, it does so with modified combustion conditions having the potential of producing
unwanted increases in the emissions of toxic organic compounds and conceivably undesirable
changes in the emissions of inorganic substances."
A Study of Toxic Emissions From a Coal-fired Power Plant Utilizing an ESP While
Demonstrating the ICCT CT-121 FGD Project. Radian Corporation, Austin, Texas. 28
December, 1993. This facility was included in the emissions sampling program sponsored by
EPRI and was designated DOE Site 4. The boiler was utilizing an experimental, or
"demonstration", type of flue gas desulfurization technology during the emissions tests.
Preliminary Draft. Field Chemical Emissions Monitoring Project: Site 14 Emissions
Monitoring. Radian Corporation, Austin, Texas. November, 1992. This facility was included in
the emissions sampling program sponsored by EPRI and was designated Site 14. The facility
was utilizing a pilot-scale dry FGD system at the time of the test. The pilot system consisted of a
spray dryer followed by a pulse-jet fabric filter. A portion of the flue

2-35
gas exiting the boiler was treated by the FGD system and then recombined with the gas entering
the outlet stack.
Preliminary Draft. Field Chemical Emissions Monitoring Project: Site 18 Emissions
Monitoring. Radian Corporation, Austin, Texas. April, 1993. This facility was included in the
emission sampling program sponsored by EPRI and was designated Site 18. At the time of the
emissions test, the unit was not operating under optimal conditions. One of the five coal
pulverizing mills was out of service and adjustments were made to the other four in order to
maintain a steady operating load. Due to the adjustments, operating conditions for the unit were
not normal. In addition, one of the control devices utilized by the boiler was experiencing
problems and had to be repaired after the emissions test.
Field Chemical Emissions Monitoring Project: Site 116 Emissions Report. Radian
Corporation, Austin, Texas. Preliminary Draft Report, October, 1994. This facility was included
in the emission sampling program sponsored by EPRI and was designated Site 116. The facility
was utilizing a "demonstration" pollution control system at the time of the emissions tests. A
portion of the flue gas was treated by the system and then rejoined with the flue gas exiting the
boiler prior to entering another control device.
2.9.3 Emission Factor Development
Once the evaluation of all documents was completed and spreadsheets were created to
contain the emissions information extracted from each reference, the emission factors from the
individual spreadsheets were combined into groups of factors according to pollutant type. This
grouping was performed in order to more easily identify patterns in the emission factor values
that could be attributed to coal type, boiler configuration (SCC), and/or control devices
employed. Emission factors making up a pattern would be averaged together in order to develop
an AP-42 emission factor that represents the boilers and emission controls included in the
pattern. The groups are: (1) metals emission factor equations; (2) hydrogen chloride and
hydrogen fluoride emission factors; (3) dioxin/furan emission factors; (4) metals emission
factors; (5) PAH emission factors; and, (6) emission factors for various organics. A spreadsheet

2-36
was constructed for each group of emission factors, except for the metals emission factor
equations. These spreadsheets are hereafter referred to as "main" spreadsheets.
The metals emission factor equations in Reference 18 were not revised or converted.
Because no calculations were necessary, a main spreadsheet for the emission factor equations
was not constructed. The main spreadsheet containing the HCl and HF emission factors has only
four factors for each pollutant and no extensive data manipulation was necessary. The main
spreadsheets for dioxins/furans, metals, PAHs, and organics contain factors from numerous
sources, and some processing of the data was necessary in order to develop AP-42 emission
factors. The following paragraphs describe how these data were processed.
Each main spreadsheet for dioxins/furans, metals, PAHs, and organics was constructed
with all emission factors from a single reference arranged on one row, except in the case of
multiple emission factors representing different operating conditions. In such cases, the factors
for each operating condition were arranged on one row. In addition to the emission factors, other
data obtained from the reference were included on the appropriate spreadsheet row. These data
included the reference number, number of boilers tested, coal type, boiler type, boiler MW rating,
boiler SCC, control devices used, reference data quality, and number of test runs. These data
were included in order to document and characterize the emission factors. Each type of data was
entered in a single column of the spreadsheet. For example, all SCCs are in a single column, all
coal types are in a single column, all emission factors for arsenic are in a single column, etc.
With this arrangement, the data can be sorted by SCC, coal type, and control device in order to
identify patterns in the emission factor values.
According to EPA guidance, emission factors that are based completely on detection
limits should be calculated using one half of the detection limit. When the emission factors were
extracted from the references, those factors based completely on detection limits were identified
and it was noted if full value or one-half value detection limits were used to calculate them. All
such factors were calculated using full detection limit values except for factors from Reference
41 and Reference 42, which were based on one-half detection limit values. All emission factors
in the main spreadsheets that are based completely on detection limits were divided by two

2-37
except for factors from Reference 41 and Reference 42. The factors from all references that are
based completely on detection limits are identified by a "DL/2" in the column to the right of the
emission factor.
EPA guidance also prescribes that when averaging emission factors together in order to
obtain an AP-42 factor, the average should be an arithmetic mean. In addition, values
representing factors based completely on detection limits that are larger than values representing
factors that are based on detectable sample quantities (the pollutant was detected in at least one
sampling run) should not be included in the overall averaging. In the main spreadsheets, after a
group of emission factors for a pollutant were selected to be averaged together, the factors based
only on detection limits were examined to determine if they should be included in the overall
average. The "non-detected" factors that were higher in value than "detected" factors were not
included in the overall average. In each column of pollutant emission factors, the factors
(detected and non-detected) that are included in the overall average are marked with an asterisk
in the column to the left of the factors. The average of the selected factors is at the bottom of the
column. The quality rating of the average factor is included in the column to the right of the
average factor.
When a pollutant was not detected at any facility, no AP-42 emission factor was
developed for that pollutant. These pollutants appear in the main spreadsheets with a "DL/2" to
the right of every factor for the pollutant. Although no emission factor was developed for these
pollutants, they are identified in the footnotes of the AP-42 table that they would appear in if a
factor had been developed.

2-38
The metals emission factor equations and the development of the HCl/HF emission
factors are discussed below. The factors in the dioxin/furan, metals, PAHs, and organic main
spreadsheets were sorted by SCC and control devices in order to identify patterns in the factor
values that could be attributed to one or more of these parameters. The result of this sorting is
also discussed below.
Metals Emission Factor Equations
The emission factor equations provided in Reference 18 are included in AP-42 "as is,"
i.e., no conversions or revisions were made to the equations. There are equations for nine metals
and they may be used to generate emission factors for both controlled and uncontrolled boilers.
In addition, the equations may be used to generate emission factors for all typical firing
configurations for utility, industrial, and commercial/industrial boilers. The emission factor
equations are based on statistical correlations among measured trace element concentrations in
coal, measured fractions of ash in coal, and measured particulate matter emission factors.
Because these are the major parameters affecting trace metals emissions from coal combustion, it
is recommended that the emission factor equations be used to generate emission factors when the
inputs to the equations are available. If the inputs to the emission factor equations are not
available for a pollutant and there is an emission factor for the provided in Section 1.1, then the
factor should be used. The emission factor equations are provided in Table 4.
Hydrogen Chloride and Hydrogen Fluoride Emission Factors
All HCl and HF emission factors were obtained from Reference 48. These factors are
shown in Table 5. The factors for utility/industrial boilers firing bituminous/subbituminous coal,
commercial/industrial boilers firing bituminous/subbituminous coal, and commercial/industrial
boilers firing lignite were averaged together to obtain an overall factor (one for HCl and one for
HF) that represents all three categories. The emission factors for utility/industrial boilers firing
lignite were not used in developing the AP-42 emission factors because of the relatively low
value of the emission factors.

2-39
Dioxin/Furan, Metals, PAHs, and Various Organic Emission Factors
As described above, the emission factors for these pollutants were sorted by SCC and
control device in order to identify patterns. No patterns became apparent in any of the four
spreadsheets except in the spreadsheet containing the dioxin/furan emission factors. One pattern
includes factors for a boiler controlled by a spray dryer absorber and a fabric filter and a second
pattern is for boilers controlled by an ESP (2 boilers) or fabric filter (1). What makes the patterns
apparent is that the factors for the first pattern are consistently higher in value for all
dioxins/furans than the factors for the second pattern. Thus, the dioxin/furan emission factors
added to Section 1.1 are for two control device scenarios. The factors for the other groups were
averaged together to arrive at one AP-42 factor for each pollutant. The SCCs and controls
attributed to the AP-42 factor are a combination of the SCCs and controls represented by the
individual factors.
Copies of the spreadsheets used to develop the dioxin/furan, metals, PAHs, and various
organic emission factors are shown in Tables 6, 7, 8, and 9, respectively.

2-40
Table 4. Metals Emission Factor Equations for Section 1.1 of AP-42a,b
PollutantEmissions Equationc
(lb/1012 Btu)
Antimony 0.92 x (C/A x PM)0.63
Arsenic 3.1 x (C/A x PM)0.85
Beryllium 1.2 x (C/A x PM)1.1
Cadmium 3.3 x (C/A x PM)0.5
Chromium 3.7 x (C/A x PM)0.58
Cobalt 1.7 x (C/A x PM)0.69
Lead 3.4 x (C/A x PM)0.80
Manganese 3.8 x (C/A x PM)0.60
Nickel 4.4 x (C/A x PM)0.48
aReference 18
bAll equations are rated "A." The emission factor equations are applicable to all typical firingconfigurations (SCCs) for electric generation (utility) boilers, industrial boilers, andcommercial/industrial boilers firing bituminous coal, subbituminous coal, or lignite. Also, theequations apply to boilers using typical control devices, including no controls.
cC = concentration of trace metal in the coal, parts per million by weight (ppm wt) A = weight fraction of ash in coal, (dimensionless) PM = site-specific emission factor for total particulate matter, (lb/106 Btu)

2-41
Table 5. Data Used to Develop Hydrogen Chloride and Hydrogen Fluoride EmissionFactors for Section 1.1 of AP-42a,b
BOILER SCC DESCRIPTIONS
SourceClassification
Codesc
HydrogenChloride(lb/ton)c
HydrogenFluoride(lb/ton)
Commerical/Industrial Boilers
Bituminous and Subbituminous Coal
Firing Types
Pulverized Coal Wet Bottom 1-03-002-05/21* 1.48* 0.17
Pulverized Coal Dry Bottom 1-03-002-06/22
Overfeed Stoker 1-03-002-07
Underfeed Stoker 1-03-002-08
Spreader Stoker 1-03-002-09/24
Hand-fired 1-03-002-14
Pulverized Coal Dry Bottom Tangential 1-03-002-16/26
Atmospheric Fluidized Bed Combustor 1-03-002-17/18
Cyclone Furnace 1-03-002-23
Traveling Grate Overfeed Stoker 1-03-002-25
Electric Generation & Industrial Boilers
Bituminous and Subbituminous Coal
Firing Types
Pulverized Coal Wet Bottom 1-01-002-01/21* 1.9* 0.23
1-02-002-01/21
Pulverized Coal Dry Bottom 1-01-002-02/22
1-02-002-02/22
Cyclone Furnace 1-01-002-03/23
1-02-002-03/23
Spreader Stoker 1-01-002-04/24
1-02-002-04/24
Traveling Grate Overfeed Stoker 1-01-002-05/25
1-02-002-25
Overfeed Stoker 1-02-002-05
Pulverized Coal Dry Bottom, 1-01-002-12/26
Tangential Firing 1-02-002-12

Table 5. Continued
BOILER SCC DESCRIPTIONS
SourceClassification
Codesc
HydrogenChloride(lb/ton)c
HydrogenFluoride(lb/ton)
2-42
Atmospheric Fluidized Bed 1-01-002-17
1-01-002-18
1-02-002-17
1-02-002-18
Underfeed Stoker 1-02-002-06
Commerical/Industrial Boilers
Lignite
Firing Types
Pulverized Coal 1-03-003-05* 0.351* 0.063
Pulverized Coal Tangential Firing 1-03-003-06
Traveling Grate Overfeed Stoker 1-03-003-07
Spreader Stoker 1-03-003-09
Electric Generation & Industrial Boilers
Lignite
Firing Types
Pulverized Coal 1-01-003-01 0.01 0.01
1-02-003-01
Pulverized Coal Tangential Firing 1-01-003-02
1-02-003-02
Cyclone Furnace 1-01-003-03
1-02-003-03
Traveling Grate Overfeed Stoker 1-01-003-04
1-02-003-04
Spreader Stoker 1-01-003-06
1-02-003-06
Overall Average 1.2 0.15
Quality Rating B B
aAll factors are from Reference 48.bFactors are for both uncontrolled and controlled boilers.cAn asterisk to the left of a factor indicates that it was used in calculating the overall emission factor.

2-43
Table 6. Data Used to Develop Dioxin/furan Emission Factors for Section 1.1 of AP-42
Ref.No.
CoalType
BoilerTypea MW SCCs
CONTROLDEVICE 1b
CONTROLDEVICE 2b
DATAQUALITY
No. ofTest Runsc
19 Subituminous PC,DB 860 10100222 FGD-SDA FF C 3
Quality rating
35 Subituminous PC,DB 700 10100222 ESP none A 3
43 Bituminous Cyclone 568 10100203 ESP none A 3
44 Subituminous PC,DB 69 10100222 FF none A 3 *
Average Factor
Quality rating

Table 6. Continued
2-44
Ref.No.
2.3.7.8-TCDDdc
TOTALTCDDdc
TOTALPeCDDdc
TOTALHxCDDdc
TOTALHpCDDdc
TOTALOCDDdc
19 --- 3.93e-10 7.06e-10 3.00e-09 1.00e-08 2.87e-08
Quality rating E E E E E
35 3.1e-11 DL/2* 8.7e-11 No dataDL/2 No dataDL* 1.80e-10 * 9.60e-10 *
43 2.70e-11 DL/2* 2.85e-11 * 7.85e-12 DL/2* 2.04e-11 * 5.38e-11 * 9.45e-11 DL/2*
44 1.43e-11 * 1.63e-10 * 8.16e-11 * 3.70e-11 * 1.64e-11 DL/2* 1.94e-10 *
Average Factor 1.43e-11 9.28e-11 4.47e-11 2.87e-11 8.34e-11 4.16e-10
Quality rating E D D D D D

Table 6. Continued
2-45
Ref.No.
2.3.7.8-TCDFdc
TOTALTCDFdc
TOTALPeCDFdc
TOTALHxCDFdc
TOTALHpCDFdc
TOTALOCDFd
19 --- 2.49e-09 4.84e-09 1.27e-08 4.39e-08 1.37e-07
Quality rating E E E E E
35 3.35e-11 DL/2* 1.10e-10 * 1.4e-10 * 6.5e-11 * 4.1e-11 * 7.8e-11
43 1.35e-11 DL/2* 4.06e-11 DL/2* 8.49e-11 * 1.18e-10 * 6.74e-11 * 8.83e-11
44 1.06e-10 * 1.06e-09 * 8.34e-10 * 3.92e-10 * 1.22e-10 * 3.27e-11
Average Factor 5.10e-11 4.04e-10 3.53e-10 1.92e-10 7.68e-11 6.63e-11
Quality rating D D D D D D
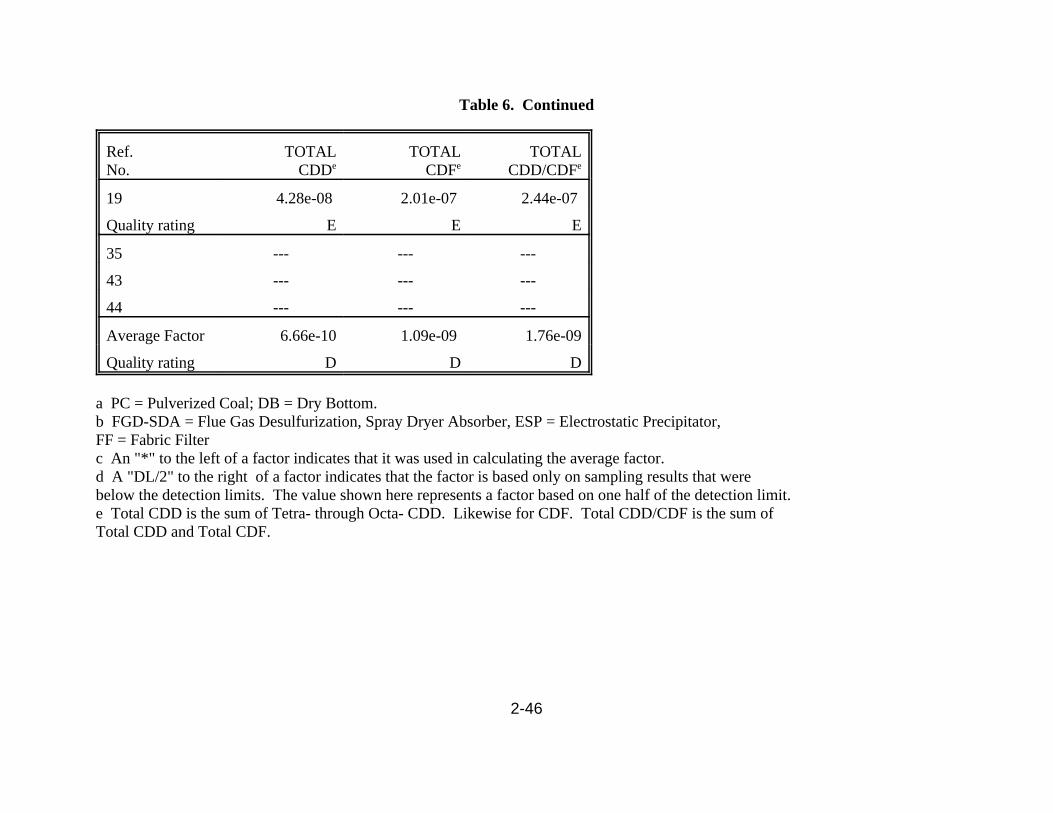
Table 6. Continued
2-46
Ref.No.
TOTALCDDe
TOTALCDFe
TOTALCDD/CDFe
19 4.28e-08 2.01e-07 2.44e-07
Quality rating E E E
35 --- --- ---
43 --- --- ---
44 --- --- ---
Average Factor 6.66e-10 1.09e-09 1.76e-09
Quality rating D D D
a PC = Pulverized Coal; DB = Dry Bottom.b FGD-SDA = Flue Gas Desulfurization, Spray Dryer Absorber, ESP = Electrostatic Precipitator, FF = Fabric Filterc An "*" to the left of a factor indicates that it was used in calculating the average factor.d A "DL/2" to the right of a factor indicates that the factor is based only on sampling results that were below the detection limits. The value shown here represents a factor based on one half of the detection limit.e Total CDD is the sum of Tetra- through Octa- CDD. Likewise for CDF. Total CDD/CDF is the sum of Total CDD and Total CDF.
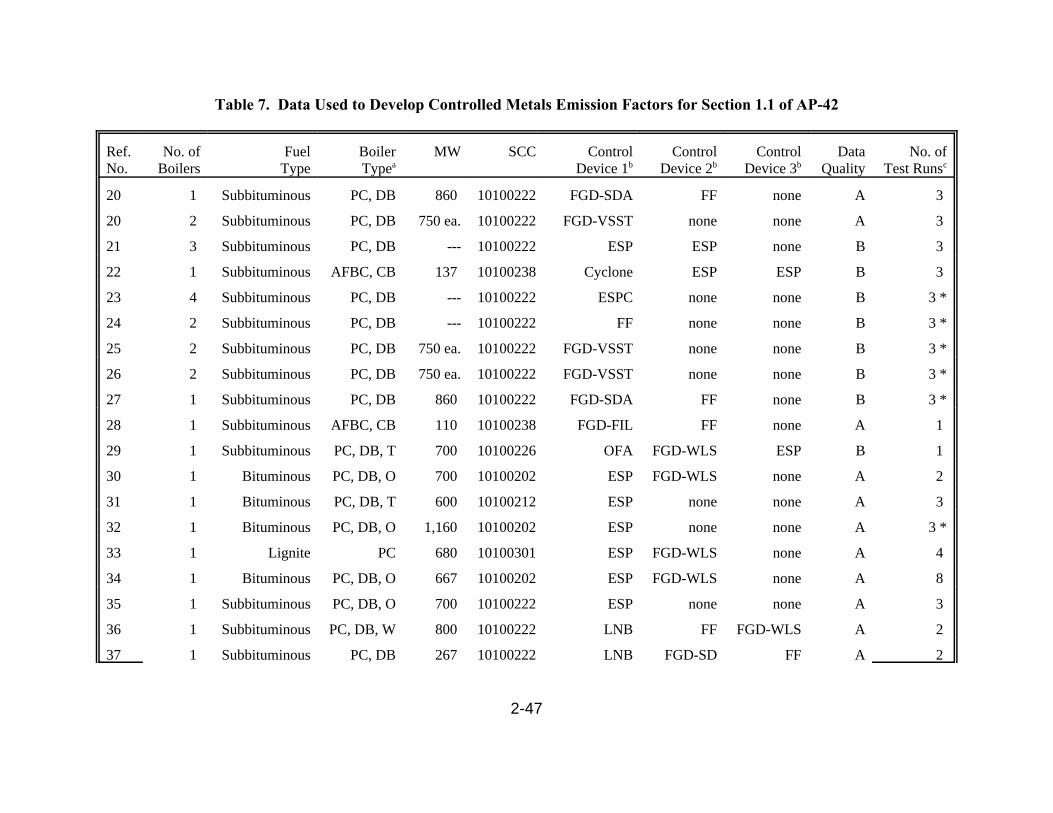
2-47
Table 7. Data Used to Develop Controlled Metals Emission Factors for Section 1.1 of AP-42
Ref.No.
No. ofBoilers
FuelType
BoilerTypea
MW SCC ControlDevice 1b
ControlDevice 2b
ControlDevice 3b
DataQuality
No. ofTest Runsc
20 1 Subbituminous PC, DB 860 10100222 FGD-SDA FF none A 3
20 2 Subbituminous PC, DB 750 ea. 10100222 FGD-VSST none none A 3
21 3 Subbituminous PC, DB --- 10100222 ESP ESP none B 3
22 1 Subbituminous AFBC, CB 137 10100238 Cyclone ESP ESP B 3
23 4 Subbituminous PC, DB --- 10100222 ESPC none none B 3 *
24 2 Subbituminous PC, DB --- 10100222 FF none none B 3 *
25 2 Subbituminous PC, DB 750 ea. 10100222 FGD-VSST none none B 3 *
26 2 Subbituminous PC, DB 750 ea. 10100222 FGD-VSST none none B 3 *
27 1 Subbituminous PC, DB 860 10100222 FGD-SDA FF none B 3 *
28 1 Subbituminous AFBC, CB 110 10100238 FGD-FIL FF none A 1
29 1 Subbituminous PC, DB, T 700 10100226 OFA FGD-WLS ESP B 1
30 1 Bituminous PC, DB, O 700 10100202 ESP FGD-WLS none A 2
31 1 Bituminous PC, DB, T 600 10100212 ESP none none A 3
32 1 Bituminous PC, DB, O 1,160 10100202 ESP none none A 3 *
33 1 Lignite PC 680 10100301 ESP FGD-WLS none A 4
34 1 Bituminous PC, DB, O 667 10100202 ESP FGD-WLS none A 8
35 1 Subbituminous PC, DB, O 700 10100222 ESP none none A 3
36 1 Subbituminous PC, DB, W 800 10100222 LNB FF FGD-WLS A 2
37 1 Subbituminous PC, DB 267 10100222 LNB FGD-SD FF A 2

Table 7. Continued
Ref.No.
No. ofBoilers
FuelType
BoilerTypea
MW SCC ControlDevice 1b
ControlDevice 2b
ControlDevice 3b
DataQuality
No. ofTest Runsc
2-48
38 1 Bituminous Cyclone 100 10100203 ESP none none A 3
38 1 Bituminous Cyclone 100 10100203 Reburn/OFA ESP none A 3
39 1 Bituminous PC, DB 117 10100202 LNB/OFA FF none B 3
39 1 Bituminous PC, DB 117 10100202 LNB/OFA SNCR FF B 3
40 1 Subbituminous PC, DB, T 422 10100226 LNB/OFA FGD-SDA FF A 3 *
41 1 Bituminous Cyclone 108 10100203 ESP none none A 3
42 1 Lignite PC, DB, T 550 10100302 ESP FGD-WLS none A 3 *
43 1 Bituminous Cyclone 568 10100203 ESP none none A 3 *
44 1 Subbituminous PC, DB 69 10100222 FF none none A 3
45 1 Bituminous PC, DB 615 10100202 ESP none none C 3 *
46 1 Bituminous PC, DB 500 10100202 LNB/OFA ESP none A 3
47 1 Bituminous Cyclone 275 10100203 ESP none none A 3
Average Factor
Quality Rating

Table 7. Continued
2-49
Ref.No. Antimonydc Arsenicdc Berylliumdc Cadmiumdc Chromiumdc Chromium VIdc
20 --- --- --- --- --- ---
20 --- --- --- --- --- ---
21 4.80e-05 DL/2* 1.06e-05 1.16e-06 DL/2* 5.31e-05 * 4.89e-05 ---
22 4.66e-06 DL/2* 9.03e-06 2.33e-07 DL/2* 1.11e-04 * 1.08e-04 ---
23 1.23e-05 * 5.63e-06 * 1.33e-06 * 1.11e-05 * 1.18e-04 ---
24 5.78e-06 * 1.89e-05 * 8.09e-06 * 4.83e-04 * 2.35e-04 ---
25 9.12e-06 * 4.42e-05 * 4.34e-06 * 1.80e-05 * 1.95e-04 ---
26 1.48e-05 * 4.26e-05 * 4.80e-06 * 4.78e-05 * 1.34e-04 ---
27 7.06e-06 * 4.14e-07 DL/2* 1.11e-07 ---* 1.59e-04 * 1.49e-05
28 --- 1.03e-05 DL/2 2.05e-06 DL/2 4.10e-06 DL/2* 3.28e-05 ---
29 ---* 1.41e-05 1.41e-06 DL/2* 1.83e-05 * 9.87e-05 ---*
30 ---* 1.19e-05 2.11e-06 DL/2* 3.17e-05 * 9.23e-05 ---
31 ---* 3.38e-04 * 1.04e-05 * 8.06e-05 * 3.12e-04 ---*
32 3.83e-05 * 2.01e-04 * 3.08e-05 * 3.30e-06 * 3.30e-04 ---*
33 8.70e-06 DL/2* 8.52e-06 * 4.73e-06 * 9.46e-06 * 3.79e-05 ---*
34 ---* 1.62e-04 * 3.41e-06 * 1.49e-05 * 7.19e-05 ---*
35 3.52e-05 DL/2* 1.61e-06 2.87e-07 DL/2* 2.96e-06 * 9.81e-06 ---
36 ---* 6.08e-06 * 6.44e-07 * 7.15e-06 * 3.93e-05 ---*
37 --- 2.11e-06 DL/2 --- 2.11e-05 DL/2 4.31e-05 DL/2 ---

Table 7. Continued
Ref.No. Antimonydc Arsenicdc Berylliumdc Cadmiumdc Chromiumdc Chromium VIdc
2-50
38 ---* 1.63e-04 * 5.60e-05 * 4.20e-05 * 3.27e-04 ---
38 ---* 1.89e-04 * 1.89e-05 * 9.44e-06 * 1.09e-04 ---
39 ---* 1.72e-05 2.29e-07 DL/2* 2.75e-06 * 1.51e-05 ---
39 ---* 3.45e-06 2.30e-07 DL/2* 8.05e-07 DL/2* 6.91e-06 ---
40 7.75e-07 * 2.83e-06 3.78e-07 DL/2* 4.91e-07 * 1.89e-06 ---
41 4.39e-06 DL/2* 1.02e-03 * 4.63e-06 * 1.71e-06 * 7.31e-05 ---*
42 2.24e-06 * 1.50e-05 1.06e-05 DL/2 1.99e-05 DL/2 --- ---*
43 3.23e-05 * 2.85e-04 * 3.00e-05 * 6.42e-05 * 1.08e-03 ---*
44 5.95e-06 DL/2* 5.70e-06 1.14e-06 DL/2 5.70e-06 DL/2* 3.59e-05 ---*
45 6.14e-05 * 9.07e-05 * 1.82e-06 * 2.20e-05 * 1.95e-04 ---*
46 ---* 2.92e-03 * 8.24e-05 * 9.57e-05 * 5.58e-04 * 1.44e-04 *
47 ---* 5.42e-03 * 9.86e-05 * 8.88e-05 * 2.47e-03 ---*
Average Factor 1.84e-05 4.08e-04 2.12e-05 5.08e-05 2.55e-04 7.95e-05
Quality Rating A A A A A D

Table 7. Continued
2-51
Ref.No. Cobaltdc Leaddc Magnesiumdc Manganesedc Mercurydc Nickeldc Seleniumd
20 --- --- --- ---* 8.40e-05 --- ---
20 --- --- --- ---* 6.82e-05 --- ---
21 ---* 3.59e-04 * 1.60e-02 * 1.04e-04 * 8.05e-05 * 1.23e-04 * 2.12e-05
22 ---* 8.59e-04 * 1.22e-02 * 1.05e-04 * 4.41e-05 * 4.91e-04 * 6.97e-06
23 ---* 6.06e-05 * 5.44e-03 * 1.38e-04 3.28e-05 DL/2* 5.84e-05 * 1.31e-05
24 ---* 1.15e-04 * 5.63e-02 * 3.32e-04 * 8.36e-05 * 5.76e-04 * 4.14e-05
25 ---* 1.26e-04 * 1.33e-02 * 5.24e-04 * 1.79e-05 * 2.36e-05 * 1.33e-04
26 ---* 1.41e-04 * 7.75e-03 * 3.91e-04 * 9.56e-05 * 7.53e-05 * 1.49e-04
27 ---* 1.34e-04 * 4.30e-04 * 3.21e-04 * 6.26e-05 * 1.01e-04 2.07e-05 DL/2
28 8.20e-06 DL/2* 1.23e-05 ---* 6.36e-04 --- 2.05e-05 DL/2 1.64e-04 DL/2
29 2.40e-05 * 1.97e-04 ---* 1.61e-03 * 5.24e-05 * 6.63e-05 2.12e-05 DL/2
30 1.32e-05 DL/2* 1.50e-04 ---* 4.22e-05 * 4.22e-06 * 1.16e-04 * 3.43e-04
31 5.20e-05 * 1.12e-04 ---* 2.24e-04 ---* 1.53e-04 * 2.00e-03
32 1.32e-04 --- ---* 1.37e-04 * 1.57e-04 * 2.01e-04 * 6.60e-03
33 9.33e-06 * 5.14e-05 ---* 1.15e-04 * 1.62e-04 * 5.81e-05 * 2.16e-03
34 1.08e-04 * 1.66e-04 ---* 3.93e-04 * 2.20e-05 * 4.41e-05 * 2.60e-04
35 6.50e-06 DL/2* 2.04e-06 * 8.70e-04 * 2.04e-05 * 7.03e-05 * 1.18e-05 * 9.81e-07
36 2.32e-06 * 1.29e-05 ---* 1.79e-04 * 3.40e-05 * 5.01e-05 * 2.50e-05
37 --- --- --- --- 6.70e-04 DL/2* 1.06e-04 ---

Table 7. Continued
Ref.No. Cobaltdc Leaddc Magnesiumdc Manganesedc Mercurydc Nickeldc Seleniumd
2-52
38 ---* 2.01e-03 ---* 4.67e-04 * 1.05e-04 * 1.82e-03 * 5.60e-03
38 ---* 1.35e-03 ---* 3.54e-04 * 8.97e-05 * 8.03e-04 * 3.54e-03
39 2.52e-06 DL/2* 1.01e-05 ---* 2.29e-05 * 4.01e-06 DL/2* 3.43e-05 * 8.24e-06
39 2.65e-06 DL/2* 9.21e-06 ---* 2.05e-05 * 9.44e-06 * 1.04e-05 * 6.90e-07 DL/2
40 2.84e-06 DL/2* 1.32e-05 ---* 2.13e-04 * 7.90e-05 * 2.84e-06 DL/2* 3.59e-07 DL/2
41 1.46e-06 DL/2* 3.90e-05 ---* 8.29e-05 * 3.41e-04 * 1.34e-05 * 1.51e-03
42 1.87e-05 * 8.60e-06 ---* 3.74e-04 * 1.18e-04 * 6.35e-05 * 1.03e-04
43 1.45e-04 * 6.08e-04 * 6.17e-03 * 4.74e-04 * 8.14e-05 * 4.70e-04 * 2.76e-03
44 1.23e-05 * 4.29e-05 * 3.61e-03 * 3.24e-04 * 3.40e-05 * 3.47e-05 * 5.68e-05
45 1.64e-05 * 9.96e-05 * 4.26e-04 * 3.90e-04 * 1.16e-05 * 1.23e-04 * 2.41e-03
46 1.73e-04 * 2.92e-04 ---* 5.58e-04 * 1.28e-04 * 4.52e-04 * 3.72e-03
47 6.41e-04 * 4.44e-03 ---* 5.05e-03 * 2.02e-04 * 1.75e-03 * 1.65e-03
Average Factor 1.03e-04 4.23e-04 1.11e-02 4.86e-04 8.30e-05 2.80e-04 1.32e-03
Quality Rating A A A A A A A

Table 7. Continued
2-53
aPC = Pulverized Coal, DB = Dry Bottom, T = Tangential, O = Opposed, W = Wall, AFBC = Atmospheric Fluidized Bed Combustor, CB = Circulating BedbESP = Electrostatic Precipitator, FGD = Flue Gas Desulfurization, FIL = Furnace Injection of Limestone, FF = Fabric Filter, LNB = Low Nox Burners, OFA = Overfire Air, SDA = Spray Dryer Absorber, SNCR = Selective Non-catalytic Reduction, WLS = Wet Limestone Scrubber, VSST = Venturi Scrubber Spray Tower These are the controls that were in place during the emissions tests.cAn asterisk before a factor indicates that the factor was used in calculating the overall average.dA "DL/2" after a number indicates that the pollutant was not detected in any of the sampling runs used to develop the factor. The value shown here represents a factor based on one half of the detection limit.

2-54
Table 8. Data Used to Develop Controlled PAH Emission Factors for Section 1.1 of AP-42
Ref.No.
No. ofBoilers
Type ofCoal
BoilerType MW SCC
ControlDevice 1b
ControlDevice 2b
ControlDevice 3b
DataQuality
No. ofTest
Runsc
29 1 Subbituminous PC,DB,T 700 10100226 OFA FGD-WLS ESP B 1
34 1 Bituminous PC,DB,O 667 10100202 ESP FGD-WLS none A 7
35 1 Subbituminous PC,DB,O 700 10100222 ESP none none A 3
37 1 Subbituminous PC,DB 267 10100222 LNB FGD-SD FF A 2
39 1 Bituminous PC,DB 117 10100202 LNB/OFA FF none B 3
41 1 Bituminous Cyclone 108 10100203 ESP none none A 3 *
42 1 Lignite PC,DB,T 550 10100302 ESP FGD-WLS none A 3 *
43 1 Bituminous Cyclone 568 10100203 ESP none none A 3
44 1 Subbituminous PC,DB 69 10100222 FF none none A 3
45 1 Bituminous PC,DB 615 10100202 ESP none none C 3
46 1 Bituminous PC,DB 500 10100202 LNB/OFA ESP none A 3
Average Factor
Quality Rating

Table 8. Continued
2-55
Ref.No. Biphenyldc
Acenaph-thenedc
Acenaph-thylenedc Anthracenedc
Benz(a)an-thracenedc
Benzo(a)-pyrenedc
29 --- --- --- --- --- ---
34 ---* 4.72e-07 * 1.97e-07 * 2.60e-07 * 3.41e-08 * 4.72e-08 *
35 ---* 1.11e-07 * 6.29e-08 * 8.51e-08 * 1.85e-08 * 2.04e-08 *
37 ---* 1.60e-06 * 6.01e-07 * 4.01e-07 * 1.80e-07 4.01e-08 DL/2*
39 --- --- --- --- --- ---
41 3.06e-06 * 6.46e-07 * 1.66e-07 * 5.04e-07 * 9.02e-08 2.92e-08 DL/2*
42 2.87e-07 * 2.16e-07 * 1.31e-07 * 1.83e-07 * 2.62e-08 * 1.12e-08 *
43 9.35e-06 DL/2* 6.70e-08 DL/2* 6.78e-07 * 5.61e-08 * 2.49e-08 5.80e-09 DL/2*
44 1.57e-06 DL/2* 7.18e-07 * 9.34e-08 * 1.09e-07 * 8.23e-08 * 3.68e-09 *
45 --- --- --- --- --- ---
46 ---* 2.15e-07 * 7.98e-08 * 9.84e-08 * 1.86e-07 * 1.09e-07 *
Average Factor 1.67e-06 5.06e-07 2.51e-07 2.12e-07 8.03e-08 3.83e-08
Quality Rating D B B B B D

Table 8. Continued
2-56
Ref.No.
Benzo(b,j,k)-fluoranthenedc
Benzo(g,h,i)-perylenedc Chrysenedc
Fluoran-thenedc Fluorenedc
Indeno(1,2,3-cd)pyrenedc
29 --- --- --- --- --- ---
34 1.73e-07 * 3.15e-08 * 1.81e-07 * 1.39e-06 * 1.68e-06 * 3.93e-08
35 5.00e-08 * 4.07e-08 * 4.63e-08 * 4.44e-07 * 2.22e-07 * 1.59e-07
37 2.40e-07 * 8.02e-08 * 4.01e-08 DL/2* 6.01e-07 * 3.61e-06 * 8.02e-08 *
39 --- --- --- --- --- ---*
41 1.71e-07 2.92e-08 DL/2* 2.17e-07 * 6.58e-07 * 7.63e-07 2.92e-08 DL/2*
42 5.61e-08 * 7.48e-09 * 6.60e-08 * 5.26e-07 * 5.17e-07 * 7.48e-09 *
43 8.32e-08 1.20e-08 DL/2 ---* 3.70e-07 * 1.04e-07 1.18e-08 DL/2*
44 5.37e-08 * 4.55e-09 DL/2 ---* 1.45e-06 * 1.56e-07 * 6.07e-09 *
45 --- --- --- --- --- ---*
46 3.99e-08 * 8.24E-08* 4.79e-08 * 2.66e-07 * 2.63e-07 * 7.18e-08
Average Factor 1.08e-07 2.74e-08 9.97e-08 7.13e-07 9.14e-07 6.06e-08
Quality Rating B D C B B C

Table 8. Continued
2-57
Ref.No. Naphthalenedc Phenanthrenedc Pyrenedc
5-methylchrysened
29 2.82e-05 DL/2 --- --- ---
34 ---* 5.51e-06 * 6.29e-07 * 3.93e-08
35 ---* 1.28e-06 * 2.96e-07 * 4.35e-09 DL/2
37 1.52e-05 * 2.61e-06 * 2.00e-07 ---
39 5.95e-06 --- --- ---
41 5.25e-06 * 1.89e-06 * 3.39e-07 ---
42 3.18e-06 * 3.91e-06 * 2.02e-07 ---
43 8.38e-06 * 1.21e-06 * 6.00e-08 ---
44 4.45e-06 * 3.70e-06 * 6.56e-07 ---
45 5.04e-05 --- --- ---
46 ---* 1.17e-06 * 2.92e-07 ---
Average Factor 1.33e-05 2.66e-06 3.34e-07 2.18e-08
Quality Rating C B B D
aPC = Pulverized Coal, DB = Dry Bottom, T = Tangential, O = OpposedbESP = Electrostatic Precipitator, FF = Fabric Filter, FGD = Flue Gas Desulfurization LNB = Low Nox Burners, OFA = Overfire Air, SD = Spray Dryer, WLS = Wet Limestone Scrubber These controls were in use during emissions tests.cAn asterisk before a factor indicates that it was used in calculating the overall average.dA DL/2 after a factor indicates that the pollutant was not detected in any of the sampling runs used to develop factor. The value shown here represents a factor based on one half of the detection limit.
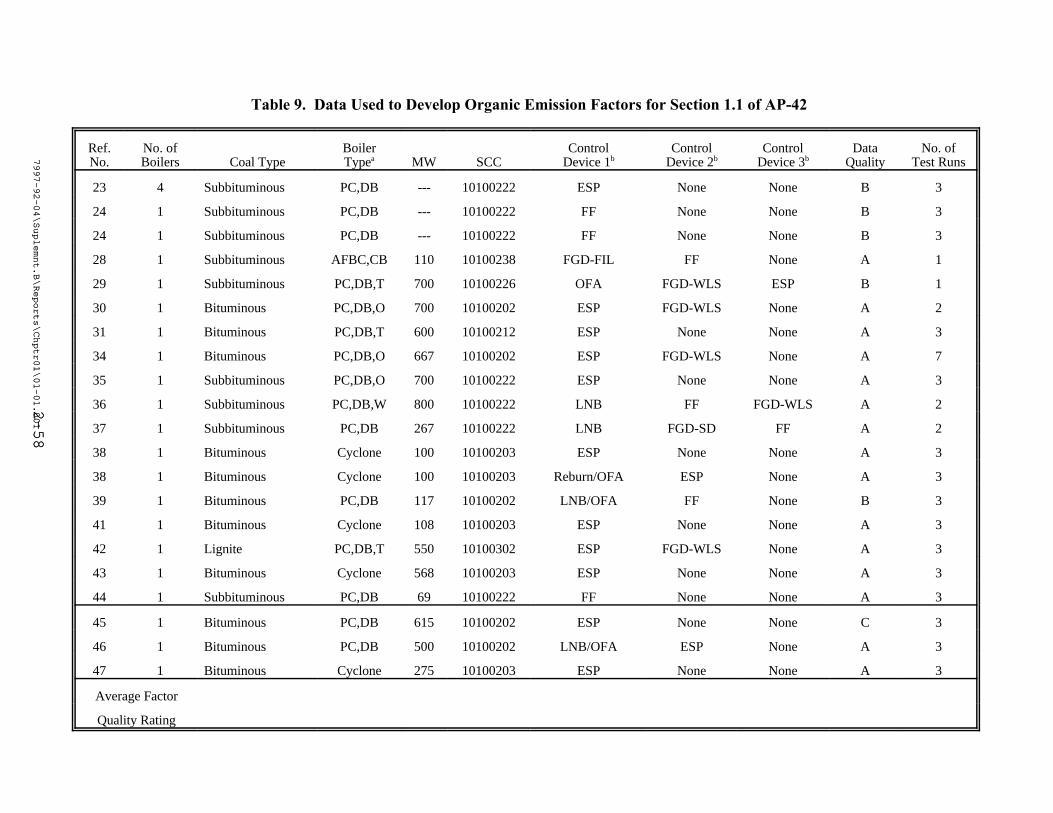
7997-92-04\Suplemnt.B\Reports\Chptr01\01-01.001
2-58
7997-92-04\Suplemnt.B\Reports\Chptr01\01-01.001
2-58
Table 9. Data Used to Develop Organic Emission Factors for Section 1.1 of AP-42
Ref.No.
No. ofBoilers Coal Type
BoilerTypea MW SCC
ControlDevice 1b
ControlDevice 2b
ControlDevice 3b
DataQuality
No. ofTest Runs
23 4 Subbituminous PC,DB --- 10100222 ESP None None B 3
24 1 Subbituminous PC,DB --- 10100222 FF None None B 3
24 1 Subbituminous PC,DB --- 10100222 FF None None B 3
28 1 Subbituminous AFBC,CB 110 10100238 FGD-FIL FF None A 1
29 1 Subbituminous PC,DB,T 700 10100226 OFA FGD-WLS ESP B 1
30 1 Bituminous PC,DB,O 700 10100202 ESP FGD-WLS None A 2
31 1 Bituminous PC,DB,T 600 10100212 ESP None None A 3
34 1 Bituminous PC,DB,O 667 10100202 ESP FGD-WLS None A 7
35 1 Subbituminous PC,DB,O 700 10100222 ESP None None A 3
36 1 Subbituminous PC,DB,W 800 10100222 LNB FF FGD-WLS A 2
37 1 Subbituminous PC,DB 267 10100222 LNB FGD-SD FF A 2
38 1 Bituminous Cyclone 100 10100203 ESP None None A 3
38 1 Bituminous Cyclone 100 10100203 Reburn/OFA ESP None A 3
39 1 Bituminous PC,DB 117 10100202 LNB/OFA FF None B 3
41 1 Bituminous Cyclone 108 10100203 ESP None None A 3
42 1 Lignite PC,DB,T 550 10100302 ESP FGD-WLS None A 3
43 1 Bituminous Cyclone 568 10100203 ESP None None A 3
44 1 Subbituminous PC,DB 69 10100222 FF None None A 3
45 1 Bituminous PC,DB 615 10100202 ESP None None C 3
46 1 Bituminous PC,DB 500 10100202 LNB/OFA ESP None A 3
47 1 Bituminous Cyclone 275 10100203 ESP None None A 3
Average Factor
Quality Rating

Table 9. Continued
7997-92-04\Suplemnt.B\Reports\Chptr01\01-01.001
2-59
Ref.No.c Acetaldehyded,c Acetophenoned,c Acroleind,c Benzened,c Benzyl-chlorided,c
bis(2-ethyl-hexyl-phthalated
23 --- --- --- *5.45E-07 DL/2 --- ---
24 --- --- --- *1.66E-02 --- ---
24 --- --- --- 6.30E-04 DL/2 --- ---
28 --- --- --- *4.10E-05 --- *9.24E-05
29 --- --- --- --- --- ---
30 --- --- --- *1.82E-05 --- ---
31 --- --- --- *2.08E-05 --- ---
34 --- --- --- --- --- ---
35 --- --- --- --- --- ---
36 --- --- --- *1.02E-05 --- ---
37 --- --- --- *4.23E-04 --- ---
38 *6.07E-05 --- --- *5.37E-05 --- ---
38 *3.07E-05 DL/2 --- --- *2.46E-05 --- ---
39 --- --- --- *5.95E-05 --- ---
41 *2.17E-03 *1.55E-05 *9.99E-04 *1.93E-04 1.44E-07 DL/2 ---
42 *8.35E-04 *6.76E-06 *1.37E-05 DL/2 *5.11E-04 *7.10E-08 ---
43 *2.91E-04 *2.62E-05 *7.55E-05 *2.57E-03 --- *9.78E-05
44 *9.60E-06 DL/2 *1.25E-05 *5.98E-05 *1.81E-03 --- *2.96E-05
45 --- --- --- *8.84E-05 *1.40E-03 ---
46 --- --- --- *1.36E-05 --- ---
47 --- --- --- *1.92E-04 --- ---
Average Factor 5.66E-04 1.52E-05 2.87E-04 1.33E-03 7.00E-04 7.33E-05
Quality Rating C D D A D D

Table 9. Continued
7997-92-04\Suplemnt.B\Reports\Chptr01\01-01.001
2-60
Ref.No.c Bromoformd,c Carbon Disulfided,c Carbon Tetrachlorided,c
2-Chloro-acetophenoned,c Chlorobenzened,c Chloroformd
23 --- --- --- --- --- ---
24 --- --- --- --- --- ---
24 --- --- --- --- --- ---
28 --- --- --- --- --- ---
29 --- --- --- --- --- ---
30 --- --- --- --- --- ---
31 --- --- --- --- --- ---
34 --- --- --- --- --- ---
35 --- --- --- --- --- ---
36 --- --- --- --- --- ---
37 --- --- --- --- --- ---
38 --- --- --- --- --- ---
38 --- --- --- --- --- ---
39 --- --- --- --- --- ---
41 5.85E-05 DL/2 *1.44E-04 *6.09E-05 DL/2 7.02E-06 6.09E-05 DL/2* *6.09E-05 DL/2
42 *3.86E-05 *4.24E-05 *3.99E-05 DL/2 --- *4.11E-05 *3.99E-05 DL/2
43 --- *2.91E-06 --- --- --- ---
44 --- *3.11E-04 --- --- *2.87E-06 ---
45 --- --- --- --- --- *7.59E-05
46 --- --- --- --- --- ---
47 --- --- --- --- --- ---
AverageFactor
3.86E-05 1.25E-04 5.04E-05 DL/2 7.02E-06 2.20E-05 5.89E-05
QualityRating
E D E D D

Table 9. Continued

Table 9. Continued
7997-92-04\Suplemnt.B\Reports\Chptr01\01-01.001
2-62
Ref.No.c Cumened,c Cyanided,c
1,3-Dichloro-propylened,c Dibutyl Phthalated,c
N-nitrosoDimethylamined,c 2,4-Dinitro-toluened
23 --- --- --- --- --- ---
24 --- --- --- --- --- ---
24 --- --- --- --- --- ---
28 --- --- --- *4.77E-05 --- ---
29 --- --- --- --- --- ---
30 --- --- --- --- --- ---
31 --- --- --- --- --- ---
34 --- --- --- --- --- ---
35 --- --- --- --- --- ---
36 --- --- --- --- --- ---
37 --- --- --- --- --- ---
38 --- --- --- --- --- ---
38 --- --- --- --- --- ---
39 --- --- --- --- --- ---
41 --- *4.39E-03 *6.09E-05 DL/2 --- --- *4.80E-07
42 --- 6.35E-04 *3.99E-05 DL/2 --- --- *8.10E-08
43 --- --- --- *6.38E-05 --- ---
44 *5.31E-06 --- --- *1.71E-05 DL/2 *7.80E-06 DL/2 ---
45 --- --- --- --- --- ---
46 --- --- --- --- --- ---
47 --- --- --- --- --- ---
AverageFactor
5.31E-06 2.51E-03 5.04E-05 DL/2 4.29E-05 DL/2 7.80E-06 DL/2 2.81E-07
QualityRating
E D D

Table 9. Continued

Table 9. Continued
7997-92-04\Suplemnt.B\Reports\Chptr01\01-01.001
2-64
Ref.No.c Dimethyl Sulfated,c Ethyl Benzened,c Ethyl Chlorided,c Ethylene Dichlorided,c Ethylene Dibromided,c
EthylideneDichlorided
23 --- *5.45E-07 DL/2 --- --- --- ---
24 --- 6.30E-04 DL/2 --- --- --- ---
24 --- 6.30E-04 DL/2 --- --- --- ---
28 --- --- --- --- --- ---
29 --- --- --- --- --- ---
30 --- --- --- --- --- ---
31 --- --- --- --- --- ---
34 --- --- --- --- --- ---
35 --- --- --- --- --- ---
36 --- --- --- --- --- ---
37 --- --- --- --- --- ---
38 --- --- --- --- --- ---
38 --- --- --- --- --- ---
39 --- --- --- --- --- ---
41 --- 6.09E-05 DL/2 6.09E-05 DL/2 6.09E-05 DL/2 --- 6.09E-05 DL/2
42 --- 3.99E-05 DL/2 *3.99E-05 DL/2 *3.99E-05 --- 3.99E-05 DL/2
43 --- *2.68E-06 --- --- --- ---
44 --- *7.51E-06 *4.40E-05 --- *1.15E-06 ---
45 *4.76E-05 --- --- --- --- ---
46 --- --- --- --- --- ---
47 --- --- --- --- --- ---
AverageFactor
4.76E-05 9.38E-05 4.20E-05 3.99E-05 1.15E-06 5.04E-05 DL/2
QualityRating
E D D E E

Table 9. Continued
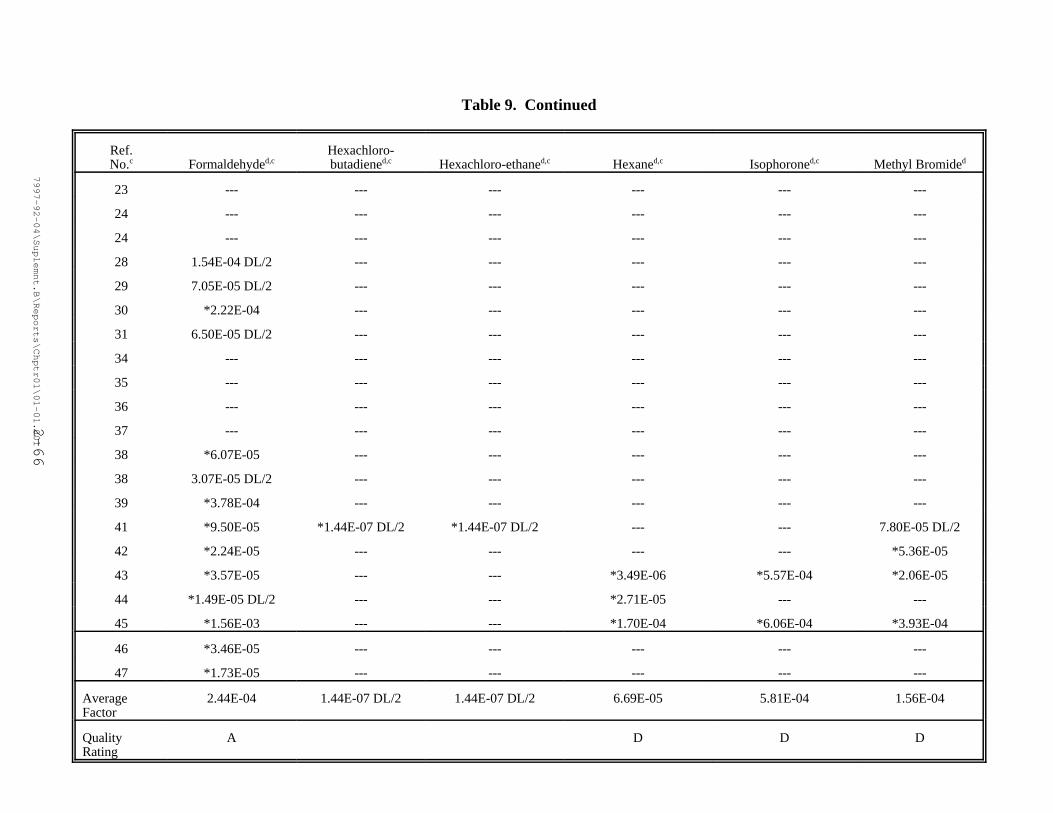
Table 9. Continued
7997-92-04\Suplemnt.B\Reports\Chptr01\01-01.001
2-66
Ref.No.c Formaldehyded,c
Hexachloro-butadiened,c Hexachloro-ethaned,c Hexaned,c Isophoroned,c Methyl Bromided
23 --- --- --- --- --- ---
24 --- --- --- --- --- ---
24 --- --- --- --- --- ---
28 1.54E-04 DL/2 --- --- --- --- ---
29 7.05E-05 DL/2 --- --- --- --- ---
30 *2.22E-04 --- --- --- --- ---
31 6.50E-05 DL/2 --- --- --- --- ---
34 --- --- --- --- --- ---
35 --- --- --- --- --- ---
36 --- --- --- --- --- ---
37 --- --- --- --- --- ---
38 *6.07E-05 --- --- --- --- ---
38 3.07E-05 DL/2 --- --- --- --- ---
39 *3.78E-04 --- --- --- --- ---
41 *9.50E-05 *1.44E-07 DL/2 *1.44E-07 DL/2 --- --- 7.80E-05 DL/2
42 *2.24E-05 --- --- --- --- *5.36E-05
43 *3.57E-05 --- --- *3.49E-06 *5.57E-04 *2.06E-05
44 *1.49E-05 DL/2 --- --- *2.71E-05 --- ---
45 *1.56E-03 --- --- *1.70E-04 *6.06E-04 *3.93E-04
46 *3.46E-05 --- --- --- --- ---
47 *1.73E-05 --- --- --- --- ---
AverageFactor
2.44E-04 1.44E-07 DL/2 1.44E-07 DL/2 6.69E-05 5.81E-04 1.56E-04
QualityRating
A D D D
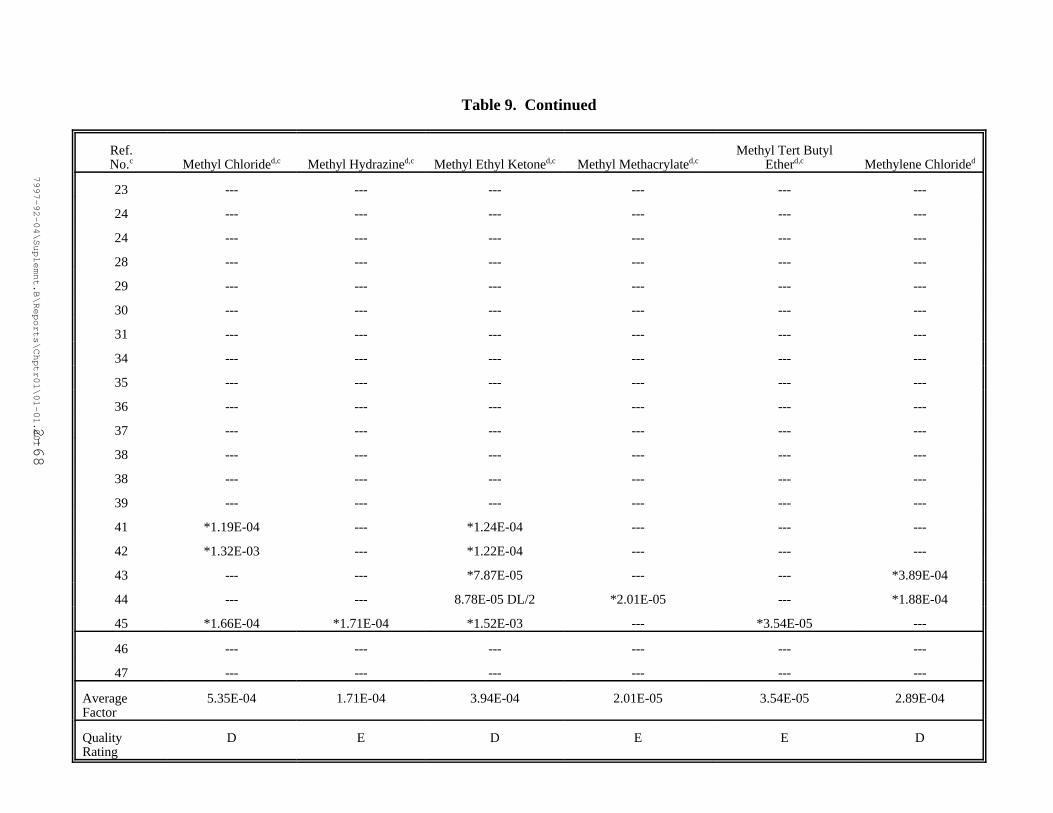
Table 9. Continued
7997-92-04\Suplemnt.B\Reports\Chptr01\01-01.001
2-68
Ref.No.c Methyl Chlorided,c Methyl Hydrazined,c Methyl Ethyl Ketoned,c Methyl Methacrylated,c
Methyl Tert ButylEtherd,c Methylene Chlorided
23 --- --- --- --- --- ---
24 --- --- --- --- --- ---
24 --- --- --- --- --- ---
28 --- --- --- --- --- ---
29 --- --- --- --- --- ---
30 --- --- --- --- --- ---
31 --- --- --- --- --- ---
34 --- --- --- --- --- ---
35 --- --- --- --- --- ---
36 --- --- --- --- --- ---
37 --- --- --- --- --- ---
38 --- --- --- --- --- ---
38 --- --- --- --- --- ---
39 --- --- --- --- --- ---
41 *1.19E-04 --- *1.24E-04 --- --- ---
42 *1.32E-03 --- *1.22E-04 --- --- ---
43 --- --- *7.87E-05 --- --- *3.89E-04
44 --- --- 8.78E-05 DL/2 *2.01E-05 --- *1.88E-04
45 *1.66E-04 *1.71E-04 *1.52E-03 --- *3.54E-05 ---
46 --- --- --- --- --- ---
47 --- --- --- --- --- ---
AverageFactor
5.35E-04 1.71E-04 3.94E-04 2.01E-05 3.54E-05 2.89E-04
QualityRating
D E D E E D

Table 9. Continued
7997-92-04\Suplemnt.B\Reports\Chptr01\01-01.001
2-70
Ref.No.c Phenold,c Propion-aldehyded,c Propylene Dichlorided,c 1,1,2,2-Tetrachloro-ethaned,c Tetrachloro-ethened,c Styrened
23 --- --- --- --- --- ---
24 --- --- --- --- --- ---
24 --- --- --- --- --- ---
28 --- --- --- --- --- ---
29 --- --- --- --- --- ---
30 --- --- --- --- --- ---
31 --- --- --- --- --- ---
34 --- --- --- --- --- ---
35 --- --- --- --- --- ---
36 --- --- --- --- --- ---
37 --- --- --- --- --- ---
38 --- --- --- --- --- ---
38 --- --- --- --- --- ---
39 --- --- --- --- --- ---
41 --- *6.09E-04 *6.09E-05 DL/2 *6.09E-05 DL/2 *7.55E-05 6.09E-05 DL/2
42 --- *1.50E-04 *3.99E-05 DL/2 *3.99E-05 DL/2 3.99E-05 DL/2 *4.11E-05
43 *2.45E-05 --- --- --- --- *4.23E-06
44 *7.55E-06 --- --- --- *9.87E-06 *3.08E-05
45 --- --- --- --- --- ---
46 --- --- --- --- --- ---
47 --- --- --- --- --- ---
AverageFactor
1.60E-05 3.79E-04 5.04E-05 DL/2 5.04E-05 DL/2 4.27E-05 2.54E-05
QualityRating
D D D D

Table 9. Continued
7997-92-04\Suplemnt.B\Reports\Chptr01\01-01.001
2-72
Ref.No.c Toluened,c
1,1,1-Trichloro-ethaned,c
1,1,2-Trichloro-ethaned,c Trichloroethened,c Xylenesd,c Vinyl Acetated
23 *5.45E-07 DL/2 --- --- --- *5.45E-07 DL/2 ---
24 6.30E-04 DL/2 --- --- --- 6.30E-04 DL/2 ---
24 6.30E-04 DL/2 --- --- --- 6.30E-04 DL/2 ---
28 --- --- --- --- --- ---
29 --- --- --- --- --- ---
30 *2.74E-05 *1.98E-05 --- --- *1.90E-05 ---
31 *1.35E-04 --- --- --- --- ---
34 --- --- --- --- --- ---
35 --- --- --- --- --- ---
36 *1.02E-05 --- --- --- --- ---
37 --- --- --- --- --- ---
38 *2.38E-05 --- --- --- --- ---
38 *1.65E-05 --- --- --- --- ---
39 *2.40E-03 --- --- --- --- ---
41 *8.53E-05 6.09E-05 DL/2 *5.85E-05 DL/2 *6.09E-05 DL/2 6.09E-05 DL/2 6.09E-05 DL/2
42 *2.99E-04 3.99E-05 DL/2 *3.99E-05 DL/2 *3.99E-05 DL/2 *4.36E-05 3.99E-05 DL/2
43 *4.25E-05 --- --- --- *3.97E-05 ---
44 *9.59E-05 --- --- --- *4.27E-05 *7.55E-06
45 *1.34E-04 --- --- --- *7.75E-05 ---
46 *1.86E-05 --- --- --- --- ---
47 *4.68E-05 --- --- --- --- ---
AverageFactor
2.38E-04 1.98E-05 4.92E-05 DL/2 5.04E-05 DL/2 3.72E-05 7.55E-06
QualityRating
A E C E

Table 9. Continued
7997-92-04\Suplemnt.B\Reports\Chptr01\01-01.001
2-74
Ref.No.c Vinyl Chlorided,c Hexachlorobenzened
23 --- ---
24 --- ---
24 --- ---
28 --- ---
29 --- ---
30 --- ---
31 --- ---
34 --- ---
35 --- ---
36 --- ---
37 --- ---
38 --- ---
38 --- ---
39 --- ---
41 *6.09E-05 DL/2 *1.44E-07 DL/2
42 *3.99E-05 DL/2 *1.12E-08 DL/2
43 --- ---
44 --- ---
45 --- ---
46 --- ---
47 --- ---
Average Factor 5.04E-05 DL/2 7.76E-08 DL/2
Quality Rating
Table 9. Continued
7997-92-04\Suplemnt.B\Reports\Chptr01\01-01.001
2-75
a PC = Pulverized Coal, DB = Dry Bottom, AFBC = Atmospheric Fluidized Bed Combustion, CB = Circulating Bed, T = Tangential, O =Opposed, W = Wall.
b Controls in use during emissions tests: ESP = Electrostatic Precipitator, FF = Fabric Filter, FGD = Flue Gas Desulfurization, FIL = FurnaceInjection of Limestone, LNB = Low Nox Burners, SD = Spray Dryer, WLS = Wet Limestone Scrubber.
c An asterisk before a factor indicates that it was used in calculating the overall emission factor.d A DL/2 after a factor indicates that the pollutant was not detected in any of the sampling runs used to develop the factor. The value shown
here represents a factor based on one-half of the detection limit.

3-1
3.0 REFERENCES
1. Stamey-Hall, S., Evaluation Of Nitrogen Oxide Emissions Data From TVA Coal-FiredBoilers, EPA-600/R-92-242, U. S. Environmental Protection Agency, Research TrianglePark, NC, December 1992.
2. Vatsky, J. and T. W. Sweeney, Development Of An Ultra-Low NOx Pulverizer CoalBurner, Presented at the EPA/EPRI 1991 Joint Symposium on Stationary CombustionNOx Control, Washington, DC, March 25-28, 1991.
3. Lu, T. L.et al, Performance Of A Large Cell-Burner Utility Boiler Retrofit With FosterWheeler Low-NOx Burners, Presented at the EPA/EPRI 1991 Joint Symposium onStationary Combustion NOx Control, Washington, DC, March 25-28, 1991.
4. Alternative Control Techniques Document—NOx Emissions From Utility Boilers, EPA-453/R-94-023, U. S. Environmental Protection Agency, Research Triangle Park, NC,March 1994.
5. Jaques, A. P., Canada’s Greenhouse Gas Emissions: Estimates for 1990, Prepared forEnvironment Canada, Report EPS 5/AP/4, 1992.
6. Marland, G. and R.M. Rotty, “Carbon Dioxide Emissions from Fossil Fuels: AProcedure for Estimation and Results for 1951-1981,” DOE/NBB-0036 TR-003, CarbonDioxide Research Division, Office of Energy Research, U.S. Department of Energy, OakRidge, TN, 1983.
7. Rosland, A., Greenhouse Gas Emissions In Norway: Inventories And EstimationMethods, Oslo: Ministry of Environment, 1993.
8. Sector-Specific Issues And Reporting Methodologies Supporting The General GuidelinesFor The Voluntary Reporting Of Greenhouse Gases Under Section 1605(b) Of TheEnergy Policy Act Of 1992, DOE/PO-0028, Volume 2 of 3, U.S. Department of Energy,1994.
9. “Alternative Control Techniques Document--NOx Emissions From Utility Boilers,” EPA-453/R-94-023, Office of Air Quality Standards, Research Triangle Park, NC, 1994.
10. “Evaluation of Significant Anthropogenic Sources of Radiatively Important TraceGases,” PB91-127753, Report prepared for the U.S. EPA, Alliance TechnologiesCorporation, Chapel Hill, NC, 1990.
11. Steam: Its Generation And Use, Babcock and Wilcox, New York, 1975.

3-2
12. Winschel, R. A., “The Relationship of Carbon Dioxide Emissions with Coal Rank andSulfur Content,” Journal Of The Air And Waste Management Association, Vol. 40, no. 6(June), pp. 861-865, 1990.
13. Muzio, L.J. and J.C. Kramlich, “An Artifact in the Measurement of N2O fromCombustion Sources,” Geophysical Research Letters, Vol 15, No. 12 (Nov), pp. 1369-1372, 1988.
14. Nelson, L. P. et al., “Global Combustion Sources of Nitrous Oxide Emissions,” ResearchProject 2333-4 Interim Report, Sacramento: Radian Corporation, 1991.
15. Peer, R. L. et al., “Characterization of Nitrous Oxide Emission Sources,” Prepared for theUS EPA Contract 68-D1-0031, Research Triangle Park, NC: Radian Corporation, 1995.
16. Montgomery, T. A. et al., “Continuous Infrared Analysis of N2O in CombustionProducts,” The Journal Of The Air And Waste Management Association, Vol. 39, No. 5,pp. 721-726, 1989.
17. Piccot, S. D. et al., “Emissions and Cost Estimates for Globally SignificantAnthropogenic Combustion Sources of NOx, N2O, CH4, CO, and CO2,” EPA ContractNo. 68-02-4288, Research Triangle Park, NC: Radian Corporation, 1990.
18. Electric Utility Trace Substances Synthesis Report Volume 1: Synthesis Report. ElectricPower Research Institute, Palo Alto, California. November, 1994.
19. Results of the March 28, 1990 Dioxin Emission Performance Test on Unit 3 at the NSPSherco Plant in Becker, Minnesota, Interpoll Laboratories, Inc., Circle Pines, MN, July11, 1990.
20. Results of the September 10 and 11, 1991 Mercury Removal Tests on the Units 1 and 2,and Unit 3 Scrubber Systems at the NSP Sherco Plant in Becker, Minnesota, InterpollLaboratories, Inc., Circle Pines, MN, October 30, 1991.
21. Results of the November 5, 1991 Air Toxic Emission Study on the No. 1, 3 & 4 Boilers atthe NSP Black Dog Plant, Interpoll Laboratories, Inc., Circle Pines, MN, January 3, 1992.
22. Results of the January 1992 Air Toxic Emission Study on the No. 2 Boiler at the NSPBlack Dog Plant, Interpoll Laboratories, Inc., Circle Pines, MN, May 4, 1992.
23. Results of the November 7, 1991 Air Toxic Emission Study on the Nos. 3, 4, 5 & 6Boilers at the NSP High Bridge Plant, Interpoll Laboratories, Inc., Circle Pines, MN,January 3, 1992.

3-3
24. Results of the December 1991 Air Toxic Emission Study on Units 6 & 7 at the NSPRiverside Plant, Interpoll Laboratories, Inc., Circle Pines, MN, February 28, 1992.
25. Results of the May 29, 1990 Trace Metal Characterization Study on Units 1 and 2 at theSherburne County Generating Station in Becker, Minnesota, Interpoll Laboratories, Inc.,Circle Pines, MN, July 1990.
26. Results of the May 1, 1990 Trace Metal Characterization Study on Units 1 and 2 at theSherburne County Generating Station, Interpoll Laboratories, Inc., Circle Pines, MN, July18, 1990.
27. Results of the March 1990 Trace Metal Characterization Study on Unit 3 at the SherburneCounty Generating Station, Interpoll Laboratories, Circle Pines, MN, June 7, 1990.
28. Field Chemical Emissions Monitoring Project: Site 10 Emissions Monitoring, RadianCorporation, Austin, TX, October 1992.
29. Field Chemical Emissions Monitoring Project: Site 11 Emissions Monitoring, RadianCorporation, Austin, TX, October 1992.
30. Field Chemical Emissions Monitoring Project: Site 12 Emissions Monitoring, RadianCorporation, Austin, TX, November 1992.
31. Field Chemical Emissions Monitoring Project: Site 15 Emissions Monitoring, RadianCorporation, Austin, TX, October 1992.
32. Field Chemical Emissions Monitoring Project: Site 19 Emissions Monitoring, RadianCorporation, Austin, TX, April 1993.
33. Field Chemical Emissions Monitoring Project: Site 20 Emissions Monitoring, RadianCorporation, Austin, TX, March 1994.
34. Field Chemical Emissions Monitoring Project: Site 21 Emissions Monitoring, RadianCorporation, Austin, TX, August 1993.
35. Field Chemical Emissions Monitoring Project: Site 22 Emissions Report, RadianCorporation, Austin, TX, February 1994.
36. Field Chemical Emissions Monitoring Project: Site 101 Emissions Report, RadianCorporation, Austin, TX, October 1994.
37. Field Chemical Emissions Monitoring Project: Site 111 Emissions Report, RadianCorporation, Austin, TX, May 1993.

3-4
38. Field Chemical Emissions Monitoring Project: Site 114 Report, Radian Corporation,Austin, TX, May 1994.
39. Field Chemical Emissions Monitoring Project: Site 115 Emissions Report, RadianCorporation, Austin, TX, November 1994.
40. “Characterizing Toxic Emissions from a Coal-Fired Power Plant Demonstrating theAFGD ICCT Project and a Plant Utilizing a Dry Scrubber/Baghhouse System, Final DraftReport”, Springerville Generating Station Unit No. 2, Southern Research Insititute,Birmingham, Alabama, December 1993.
41. Draft Final Report, A Study of Toxic Emissions from a Coal-Fired Power Plant-NilesStation No. 2. Volumes One, Two, and Three, Battelle, Columbus, Ohio, December 29,1993.
42. Draft Final Report, A Study of Toxic Emissions from a Coal-Fired Power Plant Utilizingan ESP/Wet FGD System, Volumes One, Two, and Three, Battelle, Columbus, OH,December 1993.
43. Toxics Assessment Report, Illinois Power Company, Baldwin Power Station—Unit 2,Baldwin, Illinois, Volume I—Main Report, Roy F. Weston, Inc., West Chester, PA,December 1993.
44. Toxics Assessment Report, Minnesota Power Company Boswell Energy Center—Unit 2,Cohasset, Minnesota, Volume I—Main Report, Roy F. Weston, Inc., West Chester, PA,December 1993.
45. Assessment of Toxic Emissions From a Coal Fired Power Plant Utilizing an ESP, FinalReport—Revision 1, Energy and Environmental Research Corporation, Irvine, CA,December 23, 1993.
46. 500-MW Demonstration of Advanced Wall-Fired Combustion Techniques for theReduction of Nitrogen Oxide (NOx) Emissions from Coal-Fired Boilers, RadianCorporation, Austin, TX.
47. Field Chemical Emissions Monitoring Report: Site 122, Final Report, Task 1 ThirdDraft, EPRI RP9028-10, Southern Research Institute, Birmingham, AL, May 1995.
48. Hydrogen Chloride And Hydrogen Fluoride Emission Factors For The NAPAPInventory, EPA-600/7-85-041, U. S. Environmental Protection Agency, October, 1985.

4-1
4.0 REVISED SECTION 1.1
This section contains the revised Section 1.1 of AP-42, 5th Edition. The electronic
version can be located on the EPA TTN CHIEF Web site at
http://www.epa.gov/ttn/chief/ap42c1.html

5-1
5.0 EMISSION FACTOR DOCUMENTATION, APRIL 1993
This section contains the Emission Factor Documentation for Section 1.1, Bituminous
and Subbituminous Coal Combustion, dated April 1993. The electronic version can be located
on the EPA TTN at http:\\134.67.104.12\html\chief\fbgdocs.htm.

REFERENCE 19 OF AP-42 SECTION 1.1 BACKGROUND DOCUMENTATION
5-1
Appendix A
TEST REPORT TITLE: RESULTS OF THE MARCH 28, 1990 DIOXIN EMISSIONPERFORMANCE TEST ON UNIT 3 AT THE NSP SHERCOPLANT IN BECKER, MINNESOTA
FACILITY: NSP SHERCOUNIT NO.: 3 LOCATION: Becker, MinnesotaFILENAME SHERCO3.tbl
PROCESS DATA
Run 1 Run 2 Run 3
Oxygen (% v/v)a 6.30 5.80 5.80
Vol. Flow Rate (dscf/m)b 1,971,603 1,939,776 1,952,851
Vol. Flow Rate (dscf/hr) 118,296,180 116,386,560 117,171,060
F-factor (dscf/MMBtu)c 9,780 9,780 9,780
Heat input (MMBtu/hr) 8,450 8,598 8,656
HHV Bituminous Coal(Btu/lb)d
8,547 8,547 8,547
HHV Bituminous Coal(Btu/ton)
17,094,000 17,094,000 17,094,000
Coal Feed (ton/hr) 494 503 506
Coal typee Subbituminous
Boiler configuratione Pulverized, dry bottom
Coal sourcee Montana
SCC 10100222
Control device 1e Flue Gas Desulfurization, Spray Dryer absorber
Control device 2e Baghouse
Data Quality C- Coal heating value and feed rate not provided.
Process Parameterse 860 megawatts, on line in 1987.
Test methodsf MM5
Number of test runsg 3

REFERENCE 19 OF AP-42 SECTION 1.1 BACKGROUND DOCUMENTATION
5-2
aPage 8.bPage 9.c40 CFR Pt 60, App A, Meth. 19, Bituminous coaldFrom report "Results of the May 29, 1990 Trace Metal Characterization Study on Units 1 and 2 at the Sherburne County Generating Station in Becker, Minnesota", page G-1. (Reference No. 25).ePage 1. Assumed dry bottom.fPage 1.gPage 5.

REFERENCE 19 OF AP-42 SECTION 1.1 BACKGROUND DOCUMENTATION
5-3
DIOXIN/FURAN EMISSION FACTORS
EMISSION RATES (g/sec)a
Run 1 Run 2 Run 3 AVG
TCDD 4.0e-08 2.0e-08 1.4e-08
PeCDD 7.8e-08 3.8e-08 1.7e-08
HxCDD 3.2e-07 1.6e-07 8.6e-08
HpCDD 1.19e-06 4.6e-07 2.4e-07
OCDD 3.51e-06 1.16e-06 7.2e-07
TCDF 3.2e-07 1.0e-07 4.8e-08
PeCDF 5.7e-07 2.2e-07 1.2e-07
HxCDF 1.43e-06 6.5e-07 3.2e-07
HpCDF 5.12e-06 1.97e-06 1.18e-06
OCDF 1.670e-05 5.12e-06 4.02e-06
EMISSION RATES (lb/hr)b Run 1 Run 2 Run 3 AVG
TCDD 3.18e-07 1.59e-07 1.11e-07
PeCDD 6.19e-07 3.02e-07 1.35e-07
HxCDD 2.54e-06 1.27e-06 6.83e-07
HpCDD 9.45e-06 3.65e-06 1.91e-06
OCDD 2.79e-05 9.21e-06 5.72e-06
TCDF 2.54e-06 7.94e-07 3.81e-07
PeCDF 4.52e-06 1.75e-06 9.53e-07
HxCDF 1.14e-05 5.16e-06 2.54e-06
HpCDF 4.06e-05 1.56e-05 9.37e-06
OCDF 1.33e-04 4.06e-05 3.19e-05

REFERENCE 19 OF AP-42 SECTION 1.1 BACKGROUND DOCUMENTATION
5-4
EMISSION FACTORS(lb/ton)c
Run 1 Run 2 Run 3 AVG
TCDD 6.42e-10 3.16e-10 2.19e-10 3.93e-10
PeCDD 1.25e-09 6.00e-10 2.67e-10 7.06e-10
HxCDD 5.14e-09 2.53e-09 1.35e-09 3.00e-09
HpCDD 1.91e-08 7.26e-09 3.76e-09 1.00e-08
OCDD 5.64e-08 1.83e-08 1.13e-08 2.87e-08
TCDF 5.14e-09 1.58e-09 7.52e-10 2.49e-09
PeCDF 9.15e-09 3.47e-09 1.88e-09 4.84e-09
HxCDF 2.30e-08 1.03e-08 5.02e-09 1.27e-08
HpCDF 8.22e-08 3.11e-08 1.85e-08 4.39e-08
OCDF 2.68e-07 8.08e-08 6.30e-08 1.37e-07
aPage 4bConvert g/sec to lb/hr.cDivide emission rate by coal feed rate.

REFERENCE 20 OF AP-42 SECTION 1.1 BACKGROUND DOCUMENTATIONREFERENCE 10 OF AP-42 SECTION 1.7 BACKGROUND DOCUMENTATION
5-5
TEST REPORT TITLE: RESULTS OF THE SEPTEMBER 10 AND 11, 1991 MERCURYREMOVAL TESTS ON THE UNITS 1 & 2, AND UNIT 3 SCRUBBERSYSTEMS AT THE NSP SHERCO PLANT IN BECKER,MINNESOTA
FACILITY: NSP SHERCOUNIT NO.: 3 LOCATION: Becker, MinnesotaFILENAME: SHRCO123.tbl
PROCESS DATA UNIT 3
Run 1 Run 2 Run 3
Vol. Flow Rate (dscf/m)a 1,909,745 1,908,275 1,850,934
Vol. Flow Rate (dscf/hr) 114,584,700 114,496,500 111,056,040
Coal Feed (ton/hr)b 490 494 503
Coal typec Subbituminous
Boiler configurationc Pulverized, dry bottom
Coal sourcec Montana
SCC 10100222
Control device 1c Flue Gas Desulfurization, Spray Dryer absorber
Control device 2c Baghouse
Data Quality A
Process Parametersc 860 megawatts, on line in 1987.
Test methodsc EPA 101A for mercury
Number of test runsd 3
aPage 18.bPage 7.cPage 1. Assumed to be dry bottom.dPage 5.
MERCURY EMISSION FACTORS UNIT 3
Run 1 Run 2 Run 3 AVG
EMISSION RATES (lb/hr)a 0.038 0.043 0.044
EMISSION FACTOR (lb/ton)b 7.76e-05 8.70e-05 8.75e-05 8.40e-05
aPage 5.bDivide emission rate by coal feed rate.

REFERENCE 20 OF AP-42 SECTION 1.1 BACKGROUND DOCUMENTATIONREFERENCE 10 OF AP-42 SECTION 1.7 BACKGROUND DOCUMENTATION
5-6
PROCESS DATA UNITS 1 & 2
Run 1 Run 2 Run 3
Vol. Flow Rate (dscf/m)a 3,334,932 3,376,641 3,313,486
Vol. Flow Rate (dscf/hr) 200,095,920 202,598,460 198,809,160
Coal Feed (ton/hr)b 764 775 766
Coal typec Subbituminous
Boiler configurationc Pulverized, assume dry bottom
Coal sourcec 70% Wyoming/30% Montana
SCC 10100222
Control device 1c Flue Gas Desulfurization, Venturi Scrubber Spray Tower
Control device 2c
Data Quality A
Process Parametersc 750 MW each, on line in 1976
Test methodsc EPA 101A for mercury
Number of test runsd 3
aPage 16.bPage 7.cPage 1.dPage 5.
MERCURY EMISSION FACTORS UNIT 1 & 2
Run 1 Run 2 Run 3 AVG
EMISSION RATES (lb/hr)a 0.042 0.025 0.090
EMISSION FACTOR (lb/ton)b 5.50e-05 3.23e-05 1.17e-04 6.82e-05
aPage 5.bDivide emission rate by coal feed rate.

REFERENCE 21 OF AP-42 SECTION 1.1 BACKGROUND DOCUMENTATIONREFERENCE 11 OF AP-42 SECTION 1.7 BACKGROUND DOCUMENTATION
5-7
TEST REPORT TITLE: RESULTS OF THE NOVEMBER 5, 1991 AIR TOXIC EMISSIONSTUDY ON THE NO. 1, 3 & 4 BOILERS AT THE NSP BLACK DOGPLANT
FACILITY: NSP BLACK DOGUNIT NO.: 1, 3 & 4LOCATION: Burnsville, MinnesotaFILENAME BLKDG134.tbl
PROCESS DATA METALS
Run 1 Run 2 Run 3
Oxygen (% v/v)a 7.10 6.80 6.60
Vol. Flow Rate (dscf/m)b 836,298 842,891 824,638
Vol. Flow Rate (dscf/hr) 50,177,880 50,573,460 49,478,280
F-factor (dscf/MMBtu)c 9,780 9,780 9,780
Heat input (MMBtu/hr) 3,388 3,489 3,462
HHV Bituminous Coal (Btu/lb)d 8,707 8,707 8,707
HHV Bituminous Coal (Btu/ton) 17,414,000 17,414,000 17,414,000
Coal Feed (ton/hr) 195 200 199
Coal typee Subbituminous
Boiler configuratione Pulverized, dry bottom
Coal sourcee Antelope/North Antelope
SCC 10100222
Control device 1e ESP
Control device 2e ESP
Data Quality B Had to use F-factor and average HHV to getcoal feed rate, ton/hr.
Process Parameterse Three watertube boilers at 720,000, 775,000 and1,250,000 lb/hr steam.
Test methodsf MM 5 metals
Number of test runsg 3
aPage 22.bPage 29.cPage 29.dSection 4 Results of Fuel Analyses.ePage 1. Assumed dry bottom.fPage 1.gVarious pages.

REFERENCE 21 OF AP-42 SECTION 1.1 BACKGROUND DOCUMENTATIONREFERENCE 11 OF AP-42 SECTION 1.7 BACKGROUND DOCUMENTATION
5-8
METALS EMISSION FACTORS
EMISSION RATES (lb/hr)a Run 1 Run 2 Run 3 AVG
Aluminum 8.8 9.7 10.9
Antimonyb 0.019 0.019 0.019
Arsenic 0.0021 0.0021 0.0021
Barium 0.67 0.51 0.22
Beryllium 0.00036 0.00047 0.00055
Boron 0.11 0.099 0.12
Cadmium 0.0017 0.013 0.017
Calcium 12.6 15.2 13.2
Chromium 0.0071 0.013 0.009
Copper 0.037 0.14 0.034
Iron 3.1 3.8 4.1
Lead 0.017 0.19 0.0084
Magnesium 2.7 3.2 3.6
Manganese 0.019 0.021 0.022
Mercury 0.017 0.0087 0.022
Molybdenumb 0.0063 0.0063 0.0063
Nickel 0.012 0.052 0.0092
Potassium 0.52 0.93 0.65
Selenium 0.0042 0.0042 0.0042
Silver 0.0038 0.0032 0.0078
SO2 1490 1630 1460
Sodium 1.5 2.5 1.9
Strontium 0.23 0.23 0.19
Vanadium 0.023 0.025 0.026
Zinc 0.059 0.46 0.091

REFERENCE 21 OF AP-42 SECTION 1.1 BACKGROUND DOCUMENTATIONREFERENCE 11 OF AP-42 SECTION 1.7 BACKGROUND DOCUMENTATION
5-9
EMISSION FACTORS (lb/ton)c Run 1 Run 2 Run 3 AVG
Aluminum 4.52e-02 4.84e-02 5.48e-02 4.95e-02
Antimonyb 9.77e-05 9.48e-05 9.56e-05 9.60e-05
Arsenic 1.08e-05 1.05e-05 1.06e-05 1.06e-05
Barium 3.44e-03 2.55e-03 1.11e-03 2.37e-03
Beryllium 1.85e-06 2.35e-06 2.77e-06 2.32e-06
Boron 5.65e-04 4.94e-04 6.04e-04 5.54e-04
Cadmium 8.74e-06 6.49e-05 8.55e-05 5.31e-05
Calcium 6.48e-02 7.59e-02 6.64e-02 6.90e-02
Chromium 3.65e-05 6.49e-05 4.53e-05 4.89e-05
Copper 1.90e-04 6.99e-04 1.71e-04 3.53e-04
Iron 1.59e-02 1.90e-02 2.06e-02 1.85e-02
Lead 8.74e-05 9.48e-04 4.23e-05 3.59e-04
Magnesium 1.39e-02 1.60e-02 1.81e-02 1.60e-02
Manganese 9.77e-05 1.05e-04 1.11e-04 1.04e-04
Mercury 8.74e-05 4.34e-05 1.11e-04 8.05e-05
Molybdenumb 3.24e-05 3.14e-05 3.17e-05 3.18e-05
Nickel 6.17e-05 2.60e-04 4.63e-05 1.23e-04
Potassium 2.67e-03 4.64e-03 3.27e-03 3.53e-03
Selenium 2.16e-05 2.10e-05 2.11e-05 2.12e-05
Silver 1.95e-05 1.60e-05 3.92e-05 2.49e-05
SO2 7.66e+00 8.14e+00 7.34e+00 7.71e+0
Sodium 7.71e-03 1.25e-02 9.56e-03 9.92e-03
Strontium 1.18e-03 1.15e-03 9.56e-04 1.10e-03
Vanadium 1.18e-04 1.25e-04 1.31e-04 1.25e-04
Zinc 3.03e-04 2.30e-03 4.58e-04 1.02e-03
aTable 3 (page 13?).bNot detected in any of the sampling runs, emission factor is based on detection limits.cDivide emission rate by coal feed rate.

REFERENCE 22 OF AP-42 SECTION 1.1 BACKGROUND DOCUMENTATIONREFERENCE 12 OF AP-42 SECTION 1.7 BACKGROUND DOCUMENTATION
5-10
TEST REPORT TITLE: RESULTS OF THE JANUARY 1992 AIR TOXIC EMISSION STUDYON THE NO. 2 BOILER AT THE NSP BLACK DOG PLANT
FACILITY: NSP BLACK DOGUNIT NO.: 2 LOCATION: Burnsville, MinnesotaFILENAME BLKDOG2.tbl
PROCESS DATA METALS
Run 1 Run 2 Run 3
Oxygen (% v/v)a 10.40 10.20 10.20
Vol. Flow Rate (dscf/m)b 354,118 351,097 354,635
Vol. Flow Rate (dscf/hr) 21,247,080 21,065,820 21,278,100
F-factor (dscf/MMBtu)c 9,780 9,780 9,780
Heat input (MMBtu/hr) 1,091 1,103 1,114
HHV Bituminous Coal (Btu/lb)d 8,553 8,553 8,553
HHV Bituminous Coal (Btu/ton) 17,106,000 17,106,000 17,106,000
Coal Feed (ton/hr) 64 64 65
Coal typee Subbituminous
Boiler configuratione Atmospheric Fluidized bed Combustor (AFBC), circulating bed
Coal sourcee Antelope/North Antelope
SCC 10100238
Control Device 1e Cyclone (mechanical dust collector)
Control device 2e ESP
Control device 3e ESP
Data Quality B Had to use F-factor and average HHV to getcoal feed rate (ton/hr).
Process Parameterse 137 MW
Test methodsf MM 5 metalS.
Number of test runsg 2 for lead, 3 for all othersaPage 20.bPage 25.cPage 25.dPage 31ePage 1. Coal from Antelope/Northern Antelope is subbituminous, according to another report.fPage 1.gVarious pages.

REFERENCE 22 OF AP-42 SECTION 1.1 BACKGROUND DOCUMENTATIONREFERENCE 12 OF AP-42 SECTION 1.7 BACKGROUND DOCUMENTATION
5-11
METALS EMISSION FACTORS
EMISSION RATES (lb/hr)a Run 1 Run 2 Run 3 AVG
Aluminum 1.05 1.29 1.33
Antimonyb 0.0006 0.0006 0.0006
Arsenic 0.000584 0.000603 0.000559
Barium 0.0541 0.0639 0.0691
Berylliumb 0.00003 0.00003 0.00003
Boron 0.0927 0.101 0.0847
Cadmium 0.00403 0.0117 0.00575
Calcium 4.05 4.59 4.76
Chromium 0.00573 0.0112 0.00386
Copper 0.0139 0.0177 0.0113
Iron 0.969 1.04 1.15
Lead 0.0496 0.0613
Magnesium 0.704 0.812 0.835
Manganese 0.00529 0.00615 0.00895
Mercury 0.0029 0.00265 0.00297
Molybdenum 0.0064 0.0135 0.0051
Nickel 0.0376 0.0471 0.01
Potassium 0.07 0.107 0.0901
Selenium 0.000602 0.000299 0.000445
Silverb 0.0006 0.0006 0.0006
SO2 362 356 334
Sodium 0.837 0.983 0.829
Strontium 0.056 0.0651 0.0733
Vanadium 0.00437 0.00434 0.00436
Zinc 0.122 0.092 0.0479

REFERENCE 22 OF AP-42 SECTION 1.1 BACKGROUND DOCUMENTATIONREFERENCE 12 OF AP-42 SECTION 1.7 BACKGROUND DOCUMENTATION
5-12
EMISSION FACTORS (lb/ton)c Run 1 Run 2 Run 3 AVG
Aluminum 1.65e-02 2.00e-02 2.04e-02 1.90e-02
Antimonyb 9.40e-06 9.31e-06 9.21e-06 9.31e-06
Arsenic 9.15e-06 9.35e-06 8.58e-06 9.03e-06
Barium 8.48e-04 9.91e-04 1.06e-03 9.67e-04
Berylliumb 4.70e-07 4.65e-07 4.61e-07 4.65e-07
Boron 1.45e-03 1.57e-03 1.30e-03 1.44e-03
Cadmium 6.32e-05 1.81e-04 8.83e-05 1.11e-04
Calcium 6.35e-02 7.12e-02 7.31e-02 6.93e-02
Chromium 8.98e-05 1.74e-04 5.93e-05 1.08e-04
Copper 2.18e-04 2.75e-04 1.74e-04 2.22e-04
Iron 1.52e-02 1.61e-02 1.77e-02 1.63e-02
Lead 7.77e-04 9.41e-04 8.59e-04
Magnesium 1.10e-02 1.26e-02 1.28e-02 1.22e-02
Manganese 8.29e-05 9.54e-05 1.37e-04 1.05e-04
Mercury 4.55e-05 4.11e-05 4.56e-05 4.41e-05
Molybdenum 1.00e-04 2.09e-04 7.83e-05 1.29e-04
Nickel 5.89e-04 7.31e-04 1.54e-04 4.91e-04
Potassium 1.10e-03 1.66e-03 1.38e-03 1.38e-03
Selenium 9.43e-06 4.64e-06 6.83e-06 6.97e-06
Silverb 9.40e-06 9.31e-06 9.21e-06 9.31e-06
SO2 5.67e+00 5.52e+00 5.13e+00 5.44e+00
Sodium 1.31e-02 1.52e-02 1.27e-02 1.37e-02
Strontium 8.78e-04 1.01e-03 1.13e-03 1.00e-03
Vanadium 6.85e-05 6.73e-05 6.70e-05 6.76e-05
Zinc 1.91e-03 1.43e-03 7.36e-04 1.36e-03 aPage 11bPollutant was not detected in any of the sampling runs, detection limits used to develop rates.cDivide emission rate by coal feed rate.

REFERENCE 23 OF AP-42 SECTION 1.1 BACKGROUND DOCUMENTATIONREFERENCE 13 OF AP-42 SECTION 1.7 BACKGROUND DOCUMENTATION
5-13
TEST REPORT TITLE: RESULTS OF THE NOVEMBER 7, 1991 AIR TOXIC EMISSIONSTUDY ON THE NOS. 3, 4, 5 & 6 BOILERS AT THE NSP HIGHBRIDGE PLANT
FACILITY: NSP High BridgeUNIT NO.: 3, 4, 5 & 6LOCATION: St. Paul, MinnesotaFILENAME HIBRIDGE.tbl
PROCESS DATA METALS
Run 1 Run 2 Run 3
Oxygen (% v/v)a 7.70 7.60 7.80
Vol. Flow Rate (dscf/m)b 804,786 788,668 815,076
Vol. Flow Rate (dscf/hr) 48,287,160 47,320,080 48,904,560
F-factor (dscf/MMBtu)c 9,780 9,780 9,780
Heat input (MMBtu/hr) 3,118 3,079 3,134
HHV Bituminous Coal (Btu/lb)d 8,498 8,498 8,498
HHV Bituminous Coal (Btu/ton) 16,996,000 16,996,000 16,996,000
Coal Feed (ton/hr) 183 181 184
Coal typee Subbituminous
Boiler configuratione Pulverized, dry bottom
Coal sourcee Rochelle
SCC 10100222
Control device 1e ESPC
Control device 2e None
Data Quality B Had to use F-factor and average HHV to getcoal feed rate, ton/hr.
Process Parameterse Watertube boilers with economizers and air preheaters
Test methodsf MM 5 metals, Method 18 for BTEX
Number of test runsg 3
aPage 29.bPage 37.c40 CFR Pt 60, App A, Meth. 19dPage 42ePage 1. Assumed dry bottom.fPage 1 for metals, page 3 for BTEX.gVarious pages.

REFERENCE 23 OF AP-42 SECTION 1.1 BACKGROUND DOCUMENTATIONREFERENCE 13 OF AP-42 SECTION 1.7 BACKGROUND DOCUMENTATION
5-14
METALS EMISSION FACTORS
EMISSION RATES (lb/hr)a Run 1 Run 2 Run 3 AVG
Aluminum 4.17 3.24 4.63
Antimony 0.00126 0.00456 0.00092
Arsenic 0.00126 0.00091 0.00092
Barium 0.406 0.350 0.433
Beryllium 0.00018 0.00018 0.00037
Boron 0.127 0.105 0.118
Cadmium 0.0023 0.0018 0.002
Calcium 5.25 4.12 6.45
Chromium 0.023 0.018 0.024
Copper 0.036 0.024 0.028
Iron 1.66 1.42 1.55
Lead 0.015 0.0091 0.0092
Magnesium 1.03 0.82 1.14
Manganese 0.033 0.015 0.028
Mercuryb 0.013 0.010 0.013
Molybdenum 0.059 0.046 0.061
Nickel 0.012 0.0091 0.011
Potassium 0.54 0.38 0.49
Selenium 0.0036 0.0018 0.0018
Silver 0.072 0.051 0.037
SO2 1,319 1,290 1,247
Sodium 1.22 1.02 1.40
Strontium 0.17 0.12 0.15
Vanadium 0.0066 0.0067 0.0068
Zinc 0.074 0.049 0.050

REFERENCE 23 OF AP-42 SECTION 1.1 BACKGROUND DOCUMENTATIONREFERENCE 13 OF AP-42 SECTION 1.7 BACKGROUND DOCUMENTATION
5-15
EMISSION FACTORS (lb/ton)c Run 1 Run 2 Run 3 AVG
Aluminum 2.27e-02 1.79e-02 2.51e-02 2.19e-02
Antimony 6.87e-06 2.52e-05 4.99e-06 1.23e-05
Arsenic 6.87e-06 5.02e-06 4.99e-06 5.63e-06
Barium 2.21e-03 1.93e-03 2.35e-03 2.16e-03
Beryllium 9.81e-07 9.94e-07 2.01e-06 1.33e-06
Boron 6.92e-04 5.80e-04 6.40e-04 6.37e-04
Cadmium 1.25e-05 9.94e-06 1.08e-05 1.11e-05
Calcium 2.86e-02 2.27e-02 3.50e-02 2.88e-02
Chromium 1.25e-04 9.94e-05 1.30e-04 1.18e-04
Copper 1.96e-04 1.32e-04 1.52e-04 1.60e-04
Iron 9.05e-03 7.84e-03 8.41e-03 8.43e-03
Lead 8.18e-05 5.02e-05 4.99e-05 6.06e-05
Magnesium 5.61e-03 4.53e-03 6.18e-03 5.44e-03
Manganese 1.80e-04 8.28e-05 1.52e-04 1.38e-04
Mercuryb 7.09e-05 5.52e-05 7.05e-05 6.55e-05
Molybdenum 3.22e-04 2.54e-04 3.31e-04 3.02e-04
Nickel 6.54e-05 5.02e-05 5.96e-05 5.84e-05
Potassium 2.94e-03 2.10e-03 2.66e-03 2.57e-03
Selenium 1.96e-05 9.94e-06 9.76e-06 1.31e-05
Silver 3.92e-04 2.82e-04 2.01e-04 2.92e-04
SO2 7.19e+00 7.12e+00 6.76e+00 7.02e+00
Sodium 6.65e-03 5.63e-03 7.59e-03 6.62e-03
Strontium 9.27e-04 6.62e-04 8.13e-04 8.01e-04
Vanadium 3.60e-05 3.70e-05 3.69e-05 3.66e-05
Zinc 4.03e-04 2.70e-04 2.71e-04 3.15e-04
aTable 4, page 16.bPollutant not detected in any of the sampling runs, detection limit used to develop emission factor.cDivide emission rate by coal feed rate.
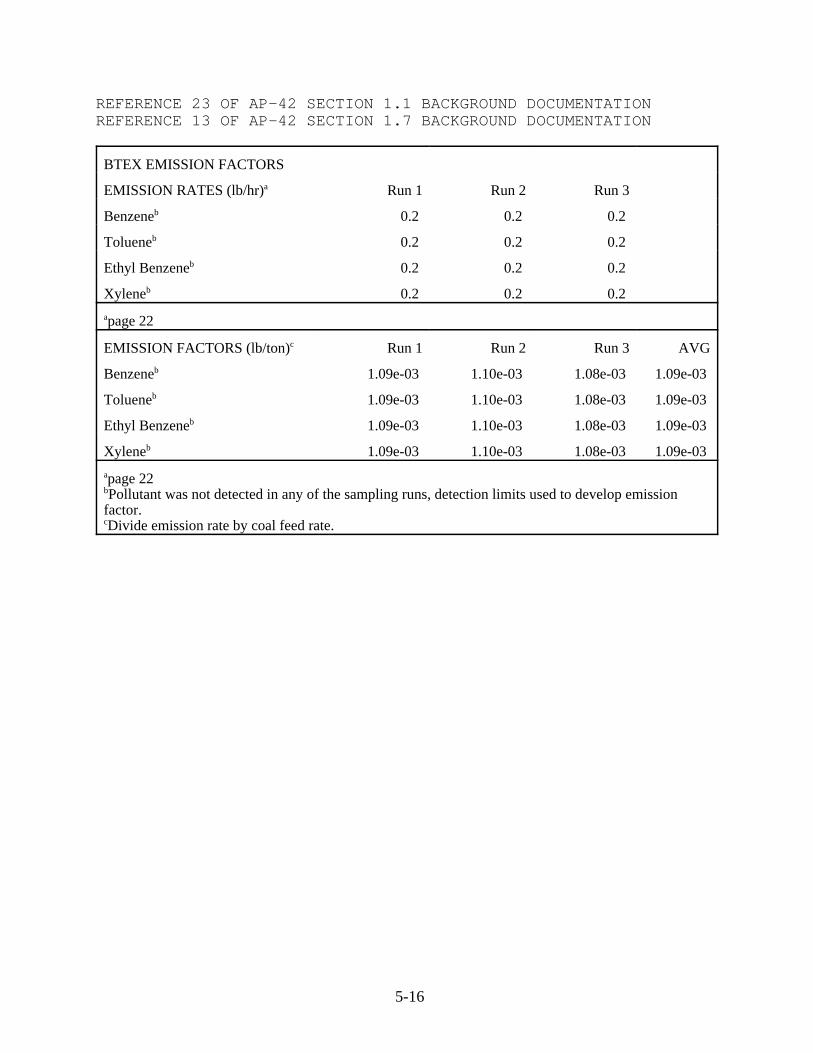
REFERENCE 23 OF AP-42 SECTION 1.1 BACKGROUND DOCUMENTATIONREFERENCE 13 OF AP-42 SECTION 1.7 BACKGROUND DOCUMENTATION
5-16
BTEX EMISSION FACTORS
EMISSION RATES (lb/hr)a Run 1 Run 2 Run 3
Benzeneb 0.2 0.2 0.2
Tolueneb 0.2 0.2 0.2
Ethyl Benzeneb 0.2 0.2 0.2
Xyleneb 0.2 0.2 0.2
apage 22
EMISSION FACTORS (lb/ton)c Run 1 Run 2 Run 3 AVG
Benzeneb 1.09e-03 1.10e-03 1.08e-03 1.09e-03
Tolueneb 1.09e-03 1.10e-03 1.08e-03 1.09e-03
Ethyl Benzeneb 1.09e-03 1.10e-03 1.08e-03 1.09e-03
Xyleneb 1.09e-03 1.10e-03 1.08e-03 1.09e-03
apage 22bPollutant was not detected in any of the sampling runs, detection limits used to develop emissionfactor.cDivide emission rate by coal feed rate.

REFERENCE 24 OF AP-42 SECTION 1.1 BACKGROUND DOCUMENTATIONREFERENCE 14 OF AP-42 SECTION 1.7 BACKGROUND DOCUMENTATION
5-17
TEST REPORT TITLE: RESULTS OF THE DECEMBER 1991 AIR TOXIC EMISSIONSTUDY ON UNITS 6 & 7 AT THE NSP RIVERSIDE PLANT
FACILITY: NSP RiversideUNIT NO.: 6, 7LOCATION: Minneapolis, MnFILENAME RIVERSID.tbl
PROCESS DATA
Coal typea Subbituminous
Boiler configurationa Pulverized, dry bottom
Coal sourcea Rochelle
SCC 10100222
Control device 1b Baghouse
Control device 2b None
Data Quality B Had to use F-factor and average HHV to getcoal feed rate (ton/hr)
Process Parametersa 575,000 lb/hr steam each; equipped with economizers and airpreheaters.
Test methodsc MM5 for PM/Metals, Method 18 for BTEX.
Number of test runsd 3
FLOW RATES, COAL FEED RATES
Unit 6
Run 1 Run 2 Run 3
Volumentric flow rate (dscf/m)e 193,851 189,541 187,122
Volumentric flow rate (dscf/hr) 11,631,060 11,372,460 11,227,320
F-Factor (dscf/MMBtu)f 9,780 9,780 9,780
O2 %v/vg 6.00 6.00 6.60
Heat input (MMBtu/hr) 848 829 785
Coal HHV (Btu/lb)h 8,602 8,602 8,602
Coal HHV (Btu/ton) 17,204,000 17,204,000 17,204,000
Coal feed rate (ton/hr) 49.28 48.19 45.66
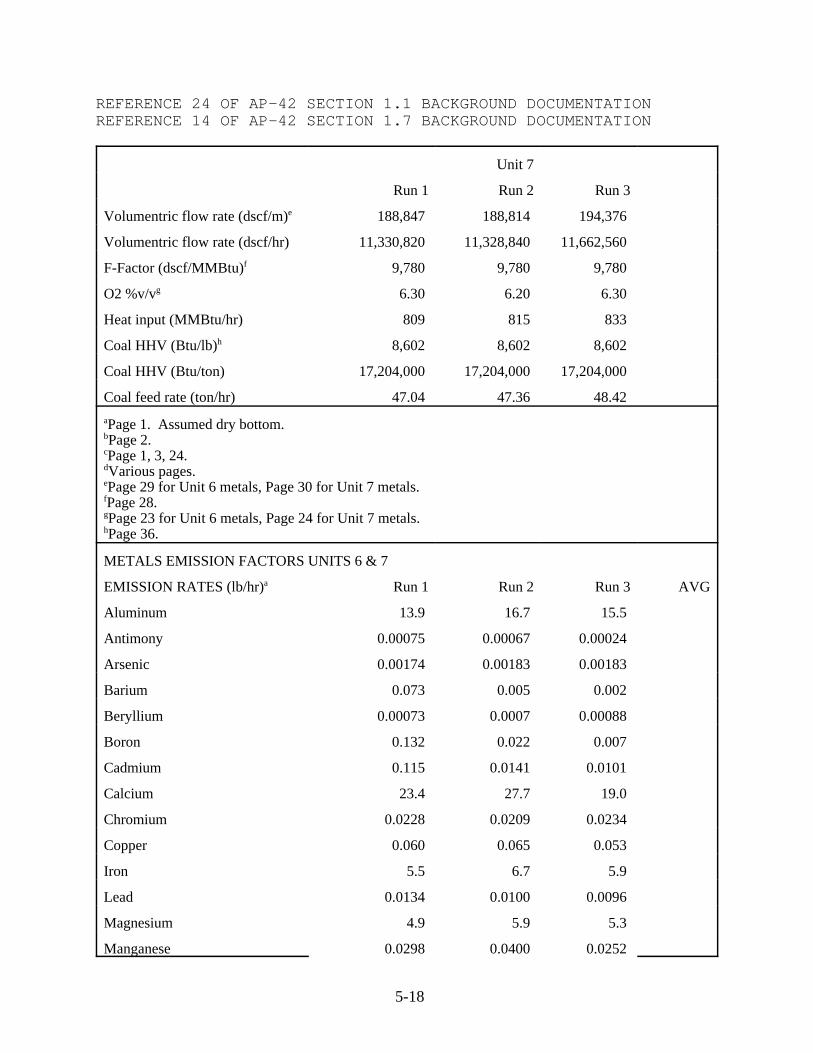
REFERENCE 24 OF AP-42 SECTION 1.1 BACKGROUND DOCUMENTATIONREFERENCE 14 OF AP-42 SECTION 1.7 BACKGROUND DOCUMENTATION
5-18
Unit 7
Run 1 Run 2 Run 3
Volumentric flow rate (dscf/m)e 188,847 188,814 194,376
Volumentric flow rate (dscf/hr) 11,330,820 11,328,840 11,662,560
F-Factor (dscf/MMBtu)f 9,780 9,780 9,780
O2 %v/vg 6.30 6.20 6.30
Heat input (MMBtu/hr) 809 815 833
Coal HHV (Btu/lb)h 8,602 8,602 8,602
Coal HHV (Btu/ton) 17,204,000 17,204,000 17,204,000
Coal feed rate (ton/hr) 47.04 47.36 48.42
aPage 1. Assumed dry bottom.bPage 2.cPage 1, 3, 24.dVarious pages.ePage 29 for Unit 6 metals, Page 30 for Unit 7 metals.fPage 28.gPage 23 for Unit 6 metals, Page 24 for Unit 7 metals.hPage 36.
METALS EMISSION FACTORS UNITS 6 & 7
EMISSION RATES (lb/hr)a Run 1 Run 2 Run 3 AVG
Aluminum 13.9 16.7 15.5
Antimony 0.00075 0.00067 0.00024
Arsenic 0.00174 0.00183 0.00183
Barium 0.073 0.005 0.002
Beryllium 0.00073 0.0007 0.00088
Boron 0.132 0.022 0.007
Cadmium 0.115 0.0141 0.0101
Calcium 23.4 27.7 19.0
Chromium 0.0228 0.0209 0.0234
Copper 0.060 0.065 0.053
Iron 5.5 6.7 5.9
Lead 0.0134 0.0100 0.0096
Magnesium 4.9 5.9 5.3
Manganese 0.0298 0.0400 0.0252

REFERENCE 24 OF AP-42 SECTION 1.1 BACKGROUND DOCUMENTATIONREFERENCE 14 OF AP-42 SECTION 1.7 BACKGROUND DOCUMENTATION
5-19
METALS EMISSION FACTORS UNITS 6 & 7
EMISSION RATES (lb/hr)a Run 1 Run 2 Run 3 AVG
Mercury 0.013 0.006 0.005
Molybdenum 0.00198 0.00409 0.00434
Nickel 0.0285 0.113 0.0234
Potassium 0.55 0.78 0.61
Selenium 0.00706 0.00289 0.00193
Silver 0.005 0.002 0.002
SO2 875 788 762
Sodium 2.03 2.85 2.49
Strontium 0.328 0.372 0.256
Vanadium 0.0289 0.0390 0.0347
Zinc 0.071 0.278 0.006
EMISSION FACTORS (lb/ton)b Run 1 Run 2 Run 3 AVG
Aluminum 1.44e-01 1.75e-01 1.65e-01 1.61e-01
Antimony 7.79e-06 7.01e-06 2.55e-06 5.78e-06
Arsenic 1.81e-05 1.92e-05 1.95e-05 1.89e-05
Barium 7.58e-04 5.23e-05 2.13e-05 2.77e-04
Beryllium 7.58e-06 7.33e-06 9.35e-06 8.09e-06
Boron 1.37e-03 2.30e-04 7.44e-05 5.58e-04
Cadmium 1.19e-03 1.48e-04 1.07e-04 4.83e-04
Calcium 2.43e-01 2.90e-01 2.02e-01 2.45e-01
Chromium 2.37e-04 2.19e-04 2.49e-04 2.35e-04
Copper 6.23e-04 6.80e-04 5.63e-04 6.22e-04
Iron 5.71e-02 7.01e-02 6.27e-02 6.33e-02
Lead 1.39e-04 1.05e-04 1.02e-04 1.15e-04
Magnesium 5.09e-02 6.18e-02 5.63e-02 5.63e-02
Manganese 3.09e-04 4.19e-04 2.68e-04 3.32e-04
Mercury 1.35e-04 6.28e-05 5.31e-05 8.36e-05
Molybdenum 2.06e-05 4.28e-05 4.61e-05 3.65e-05
Nickel 2.96e-04 1.18e-03 2.49e-04 5.76e-04

REFERENCE 24 OF AP-42 SECTION 1.1 BACKGROUND DOCUMENTATIONREFERENCE 14 OF AP-42 SECTION 1.7 BACKGROUND DOCUMENTATION
5-20
EMISSION FACTORS (lb/ton)b Run 1 Run 2 Run 3 AVG
Potassium 5.71e-03 8.16e-03 6.48e-03 6.79e-03
Selenium 7.33e-05 3.02e-05 2.05e-05 4.14e-05
Silver 5.19e-05 2.09e-05 2.13e-05 3.14e-05
SO2 9.08e+00 8.25e+00 8.10e+00 8.48e+00
Sodium 2.11e-02 2.98e-02 2.65e-02 2.58e-02
Strontium 3.41e-03 3.89e-03 2.72e-03 3.34e-03
Vanadium 3.00e-04 4.08e-04 3.69e-04 3.59e-04
Zinc 7.37e-04 2.91e-03 6.38e-05 1.24e-03
aTable 8, page 16.bDivide emission rate by coal feed rate.
BTEX EMISSION FACTORS UNIT 6
Emission Rates (lb/hr)a Run 1 Run 2 Run 3
Benzene 1.02 1.05 0.33
Tolueneb 0.06 0.06 0.06
Ethylbenzeneb 0.06 0.06 0.06
Xyleneb 0.06 0.06 0.06
Emission Factors (lb/ton)c avg
Benzene 2.07e-02 2.18e-02 7.23e-03 1.66e-02
Tolueneb 1.22e-03 1.25e-03 1.31e-03 1.26e-03
Ethylbenzeneb 1.22e-03 1.25e-03 1.31e-03 1.26e-03
Xyleneb 1.22e-03 1.25e-03 1.31e-03 1.26e-03
apage 19.bPollutant was not detected in any of the sampling runs. EF is based on detection limits.cDivide emission rate by coal feed rate.
BTEX EMISSION FACTORS UNIT 7
Emission Rates (lb/hr)a Run 1 Run 2 Run 3
Benzeneb 0.06 0.06 0.06
Tolueneb 0.06 0.06 0.06
Ethylbenzeneb 0.06 0.06 0.06
Xyleneb 0.06 0.06 0.06

REFERENCE 24 OF AP-42 SECTION 1.1 BACKGROUND DOCUMENTATIONREFERENCE 14 OF AP-42 SECTION 1.7 BACKGROUND DOCUMENTATION
5-21
Emission Factors (lb/ton)c
Benzeneb 1.28e-03 1.27e-03 1.24e-03 1.26e-03
Tolueneb 1.28e-03 1.27e-03 1.24e-03 1.26e-03
Ethylbenzeneb 1.28e-03 1.27e-03 1.24e-03 1.26e-03
Xyleneb 1.28e-03 1.27e-03 1.24e-03 1.26e-03
apage 19.bPollutant was not detected in any of the sampling runs. EF is based on detection limits.cDivide emission rate by coal feed rate.

REFERENCE 25 OF AP-42 SECTION 1.1 BACKGROUND DOCUMENTATIONREFERENCE 15 OF AP-42 SECTION 1.7 BACKGROUND DOCUMENTATION
5-22
TEST REPORT TITLE: RESULTS OF THE MAY 29, 1990 TRACE METALCHARACTERIZATION STUDY ON UNITS 1 AND 2 AT THESHERBURNE COUNTY GENERATING STATION IN BECKER,MINNESOTA
FACILITY: NSP ShercoUNIT NO.: 1, 2LOCATION: Becker, MinnesotaFILENAME SHERCO12.tbl
PROCESS DATA PM/METALS
Run 1 Run 2 Run 3
Oxygen (% v/v)a 6.60 6.50 6.60
Vol. Flow Rate (dscf/m)b 3,305,953 3,340,203 3,106,503
Vol. Flow Rate (dscf/hr) 198,357,180 200,412,180 186,390,180
F-factor (dscf/MMBtu)c 9,780 9,780 9,780
Heat input (MMBtu/hr) 13,877 14,119 13,040
HHV Bituminous Coal (Btu/lb)d 8,547 8,547 8,547
HHV Bituminous Coal (Btu/ton) 17,094,000 17,094,000 17,094,000
Coal Feed (ton/hr) 812 826 763
Coal typee Subbituminous
Boiler configuratione Pulverized, dry bottom
Coal sourcee 80% Rochelle/20% Coalstrip
SCC 10100222
Control device 1e Flue Gas Desulfurization, Venturi Scrubber Spray Tower
Control device 2e None
Data Quality B Had to use F-factor and average HHV to get coalfeed rate, ton/hr.
Process Parameterse 750 MW each, on line in 1976.
Test methodsf MM 5
Number of test runsg 2 for nickel, 3 for all others
aPage 7.bPage 8.c40 CFR Pt 60, App A.dPage G-1.ePage 1.fPage 1.gVarious pages.

REFERENCE 25 OF AP-42 SECTION 1.1 BACKGROUND DOCUMENTATIONREFERENCE 15 OF AP-42 SECTION 1.7 BACKGROUND DOCUMENTATION
5-23
METALS EMISSION FACTORS
EMISSION RATES (lb/hr)a Run 1 Run 2 Run 3 AVG
Aluminum 8.9725 23.3877 7.7052
Antimony 0.0084 0.0041 0.0092
Arsenic 0.0304 0.0433 0.0326
Barium 3.3101 6.4375 2.6330
Beryllium 0.0033 0.0036 0.0035
Boron 4.1097 86.2852 43.3077
Cadmium 0.0205 0.0132 0.0097
Calcium 67.2241 141.6439 72.3851
Chromium 0.2046 0.1788 0.0881
Copper 0.1302 0.1694 0.1321
Iron 10.3672 13.7879 9.5545
Lead 0.1116 0.0941 0.0969
Magnesium 7.0757 18.5219 6.6221
Manganese 0.3068 0.3294 0.6076
Mercury 0.0093 0.0196 0.0141
Molybdenum 0.0279 0.0471 0.0264
Nickel 0.0186 ---- 0.0185
Potassium 1.5806 2.0705 1.8493
Selenium 0.0818 0.1129 0.1233
Silverb 0.0112 0.0113 0.0114
Sodium 4.7419 6.8704 5.4597
Strontium 2.5197 4.5928 2.4657
Vanadium 0.2603 0.3294 0.2906
Zinc 0.2696 0.3106 0.2378
aPage 5.bPollutant was not detected in any of the sampling runs. EF is based on detection limits.

REFERENCE 25 OF AP-42 SECTION 1.1 BACKGROUND DOCUMENTATIONREFERENCE 15 OF AP-42 SECTION 1.7 BACKGROUND DOCUMENTATION
5-24
EMISSION FACTORS (lb/ton)c Run 1 Run 2 Run 3 AVG
Aluminum 1.11e-02 2.83e-02 1.01e-02 1.65e-02
Antimony 1.03e-05 4.96e-06 1.21e-05 9.12e-06
Arsenic 3.74e-05 5.24e-05 4.27e-05 4.42e-05
Barium 4.08e-03 7.79e-03 3.45e-03 5.11e-03
Beryllium 4.06e-06 4.36e-06 4.59e-06 4.34e-06
Boron 5.06e-03 1.04e-01 5.68e-02 5.54e-02
Cadmium 2.53e-05 1.60e-05 1.27e-05 1.80e-05
Calcium 8.28e-02 1.71e-01 9.49e-02 1.16e-01
Chromium 2.52e-04 2.16e-04 1.15e-04 1.95e-04
Copper 1.60e-04 2.05e-04 1.73e-04 1.80e-04
Iron 1.28e-02 1.67e-02 1.25e-02 1.40e-02
Lead 1.37e-04 1.14e-04 1.27e-04 1.26e-04
Magnesium 8.72e-03 2.24e-02 8.68e-03 1.33e-02
Manganese 3.78e-04 3.99e-04 7.97e-04 5.24e-04
Mercury 1.15e-05 2.37e-05 1.85e-05 1.79e-05
Molybdenum 3.44e-05 5.70e-05 3.46e-05 4.20e-05
Nickel 2.29e-05 2.43e-05 2.36e-05
Potassium 1.95e-03 2.51e-03 2.42e-03 2.29e-03
Selenium 1.01e-04 1.37e-04 1.62e-04 1.33e-04
Silverb 1.38e-05 1.37e-05 1.49e-05 1.41e-05
Sodium 5.84e-03 8.32e-03 7.16e-03 7.11e-03
Strontium 3.10e-03 5.56e-03 3.23e-03 3.97e-03
Vanadium 3.21e-04 3.99e-04 3.81e-04 3.67e-04
Zinc 3.32e-04 3.76e-04 3.12e-04 3.40e-04
aPage 5.bPollutant was not detected in any of the sampling runs. EF is based on detection limits.cDivide emission rate by coal feed rate.

REFERENCE 26 OF AP-42 SECTION 1.1 BACKGROUND DOCUMENTATIONREFERENCE 16 OF AP-42 SECTION 1.7 BACKGROUND DOCUMENTATION
5-25
TEST REPORT TITLE: RESULTS OF THE MAY 1, 1990 TRACE METALCHARACTERIZATION STUDY ON UNITS 1 AND 2 AT THESHERBURNE COUNTY GENERATING STATION
FACILITY: NSP ShercoUNIT NO.: 1, 2LOCATION: Becker, MinnesotaFILENAME SHRCO12A.TBL
PROCESS DATA METALS
Run 1 Run 2 Run 3
Oxygen (% v/v)a 6.60 6.60 6.70
Vol. Flow Rate (dscf/m)b 3,284,153 3,326,471 3,347,367
Vol. Flow Rate (dscf/hr) 197,049,180 199,588,260 200,842,020
F-factor (dscf/MMBtu)c 9,780 9,780 9,780
Heat input (MMBtu/hr) 13,786 13,963 13,953
HHV Bituminous Coal (Btu/lb)d 8,547 8,547 8,547
HHV Bituminous Coal (Btu/ton) 17,094,000 17,094,000 17,094,000
Coal Feed (ton/hr) 806 817 816
Coal typee Subbituminous
Boiler configuratione Pulverized, dry bottom
Coal source no data
SCC 10100222
Control device 1e Flue Gas Desulfurization, Venturi Scrubber Spray Tower
Control device 2e None
Data Quality B Had to use F-factor and average HHV to get coalfeed rate, ton/hr.
Process Parameterse 750 MW each, on line in 1976.
Test methodsf MM 5 metals.
Number of test runsg 2 for cadmium, nickel, copper and zinc; 3 for all othersaPage 14.bPage 19.c40 CFR Pt 60, App A.dFrom report "Results of the May 29, 1990 Trace Metal Characterization Study on Units 1 and 2 at the Sherburne County Generating Station in Becker, Minnesota", page G-1. (Reference No. 25)ePage 1 of "Results of the September 10 and 11, 1991 Mercury Removal Tests on the Units 1 & 2, and Unit 3 Scrubber Systems at the NSP Sherco Plant in Becker, Minnesota" (Reference 19). Dry bottom assumed.fPage 2.gVarious pages.

REFERENCE 26 OF AP-42 SECTION 1.1 BACKGROUND DOCUMENTATIONREFERENCE 16 OF AP-42 SECTION 1.7 BACKGROUND DOCUMENTATION
5-26
METALS EMISSION FACTORS
EMISSION RATES (lb/hr)a Run 1 Run 2 Run 3 AVG
Aluminum 9.58 11.06 8.86
Antimony 0.016 0.011 0.009
Arsenic 0.035 0.039 0.030
Barium 3.59 5.81 2.25
Beryllium 0.0037 0.0042 0.0038
Boron 98.0 18.1 38.1
Cadmium --- 0.029 0.049
Calcium 126 141 129
Chromium 0.133 0.101 0.092
Copper --- 0.200 0.227
Iron 14.6 14.6 12.9
Lead 0.127 0.118 0.100
Magnesium 5.36 7.65 5.91
Manganese 0.281 0.401 0.273
Mercury 0.092 0.078 0.063
Molybdenum b 0.027 0.027 0.027
Nickel --- 0.071 0.052
Potassium 2.00 1.88 1.74
Selenium 0.109 0.137 0.118
Silver 0.009 0.010 0.030
Sodium 7.67 6.42 5.13
Strontium 3.26 3.82 3.09
Vanadium 0.300 0.291 0.282
Zinc --- 0.70 0.45

REFERENCE 26 OF AP-42 SECTION 1.1 BACKGROUND DOCUMENTATIONREFERENCE 16 OF AP-42 SECTION 1.7 BACKGROUND DOCUMENTATION
5-27
EMISSION FACTORS (lb/ton)c Run 1 Run 2 Run 3 AVG
Aluminum 1.19e-02 1.35e-02 1.09e-02 1.21e-02
Antimony 1.98e-05 1.35e-05 1.10e-05 1.48e-05
Arsenic 4.34e-05 4.77e-05 3.68e-05 4.26e-05
Barium 4.45e-03 7.11e-03 2.76e-03 4.77e-03
Beryllium 4.59e-06 5.14e-06 4.66e-06 4.80e-06
Boron 1.22e-01 2.22e-02 4.67e-02 6.35e-02
Cadmium 3.55e-05 6.00e-05 4.78e-05
Calcium 1.56e-01 1.73e-01 1.58e-01 1.62e-01
Chromium 1.65e-04 1.24e-04 1.13e-04 1.34e-04
Copper 2.45e-04 2.78e-04 2.61e-04
Iron 1.81e-02 1.79e-02 1.58e-02 1.73e-02
Lead 1.57e-04 1.44e-04 1.23e-04 1.41e-04
Magnesium 6.65e-03 9.37e-03 7.24e-03 7.75e-03
Manganese 3.48e-04 4.91e-04 3.34e-04 3.91e-04
Mercury 1.14e-04 9.55e-05 7.72e-05 9.56e-05
Molybdenumb 3.35e-05 3.31e-05 3.31e-05 3.32e-05
Nickel 8.69e-05 6.37e-05 7.53e-05
Potassium 2.48e-03 2.30e-03 2.13e-03 2.30e-03
Selenium 1.35e-04 1.68e-04 1.45e-04 1.49e-04
Silver 1.12e-05 1.22e-05 3.68e-05 2.01e-05
Sodium 9.51e-03 7.86e-03 6.28e-03 7.89e-03
Strontium 4.04e-03 4.68e-03 3.79e-03 4.17e-03
Vanadium 3.72e-04 3.56e-04 3.45e-04 3.58e-04
Zinc 8.57e-04 5.51e-04 7.04e-04 aPages 5 and 7.bPollutant was not detected in any of the sampling runs. EF is based on detection limits.cDivide emission rate by coal feed rate.

REFERENCE 27 OF AP-42 SECTION 1.1 BACKGROUND DOCUMENTATIONREFERENCE 17 OF AP-42 SECTION 1.7 BACKGROUND DOCUMENTATION
5-28
TEST REPORT TITLE: RESULTS OF THE MARCH 1990 TRACE METALCHARACTERIZATION STUDY ON UNIT 3 AT THE SHERBURNECOUNTY GENERATING STATION
FACILITY: NSP SHERCOUNIT NO.: 3 LOCATION: Becker, MinnesotaFILENAME SHERCO3A.tbl
PROCESS DATA METALS
Run 1 Run 2 Run 3
Oxygen (% v/v)a 6.50 6.20 6.10
Vol. Flow Rate (dscf/m)b 1,950,168 1,965,867 1,962,255
Vol. Flow Rate (dscf/hr) 117,010,080 117,952,020 117,735,300
F-factor (dscf/MMBtu)c 9,780 9,780 9,780
Heat input (MMBtu/hr) 8,243 8,483 8,525
HHV Bituminous Coal (Btu/lb)d 8,547 8,547 8,547
HHV Bituminous Coal (Btu/ton) 17,094,000 17,094,000 17,094,000
Coal Feed (ton/hr) 482 496 499
CHROME VI
Run 1 Run 2 Run 3
Oxygen (% v/v)a 6.10 6.10 6.00
Vol. Flow Rate (dscf/m)b 1,957,528 1,950,487 1,944,863
Vol. Flow Rate (dscf/hr) 117,029,220 116,691,780
F-factor (dscf/MMBtu)c 9,780 9,780 9,780
Heat input (MMBtu/hr) 8,504 8,474 8,506
HHV Bituminous Coal (Btu/lb)d 8,547 8,547 8,547
HHV Bituminous Coal (Btu/ton) 17,094,000 17,094,000 17,094,000
Coal Feed (ton/hr) 497 496 498
Coal typee Subbituminous
Boiler configuratione Pulverized, dry bottom
Coal sourcee Montana
SCC 10100222
Control device 1e Flue Gas Desulfurization, Spray Dryer absorber
Control device 2e Baghouse

REFERENCE 27 OF AP-42 SECTION 1.1 BACKGROUND DOCUMENTATIONREFERENCE 17 OF AP-42 SECTION 1.7 BACKGROUND DOCUMENTATION
5-29
Data Quality B Had to use F-factor and average HHV to get coalfeed rate (ton/hr)
Process Parameterse 860 megawatts, on line in 1987.
Test methodsf MM5 for metals, MM13 for chrome VI.
Number of test runsg 2 for calcium, nickel, sodium and zinc. 3 for all others.aPage 12 for metals runs; page 13 for chrome VI runs.bPage 16 for metals runs, page 18 for chrome VI runs.c40 CFR Pt 60, App A, Meth. 19, Bituminous coal.dFrom report "Results of the May 29, 1990 Trace Metal Characterization Study on Units 1 and 2 at the Sherburne County Generating Station in Becker, Minnesota", page G-1. (Reference No. 25).ePage 1. Assumed dry bottom.fPage 1 for MM5, page 2 for MM 13.gVarious pages.
METALS EMISSION FACTORS
EMISSION RATES (lb/hr)a Run 1 Run 2 Run 3 AVG
Aluminum 1.91 0.493 0.742
Antimony 7.09e-03 1.62e-03 1.6e-03
Arsenicb --- 4.12e-04 4.12e-04
Bariumb 0.048 0.049 0.050
Beryllium 1.61e-05 4.93e-05 9.92e-05
Boron 19.1 3.28 13.9
Calcium --- 1.91 1.85
Chromium 0.114 0.0682 0.0520
Copper 0.789 0.384 0.188
Iron 1.04 0.759 0.248
Lead 0.123 0.0394 0.033
Magnesium 0.294 0.123 0.215
Manganese 0.0565 0.382 0.0379
Mercury 0.0411 0.0172 0.0338
Molybdenumb 0.032 0.033 0.033
Nickel --- 0.0736 0.0264
Potassium 1.83 0.624 0.602
Seleniumb 0.0199 0.0205 0.0207
Silverb 2.41e-03 2.43e-03 2.50e-03

REFERENCE 27 OF AP-42 SECTION 1.1 BACKGROUND DOCUMENTATIONREFERENCE 17 OF AP-42 SECTION 1.7 BACKGROUND DOCUMENTATION
5-30
METALS EMISSION FACTORS
EMISSION RATES (lb/hr)a Run 1 Run 2 Run 3 AVG
Sodium --- 4.62 4.80
Strontium 0.0119 0.0411 0.0412
Vanadiumb 8.04e-04 8.10e-04 8.09e-04
Zinc --- 0.262 0.172
EMISSION FACTORS (lb/ton)c Run 1 Run 2 Run 3 AVG
Aluminum 3.96e-03 9.93e-04 1.49e-03 2.15e-03
Antimony 1.47e-05 3.26e-06 3.21e-06 7.06e-06
Arsenicb 8.30e-07 8.26e-07 8.28e-07
Bariumb 9.95e-05 9.87e-05 1.00e-04 9.95e-05
Beryllium 3.34e-08 9.93e-08 1.99e-07 1.11e-07
Boron 3.96e-02 6.61e-03 2.79e-02 2.47e-02
Calcium 3.85e-03 3.71e-03 3.78e-03
Chromium 2.36e-04 1.37e-04 1.04e-04 1.59e-04
Copper 1.64e-03 7.74e-04 3.77e-04 9.29e-04
Iron 2.16e-03 1.53e-03 4.97e-04 1.39e-03
Lead 2.55e-04 7.94e-05 6.62e-05 1.34e-04
Magnesium 6.10e-04 2.48e-04 4.31e-04 4.30e-04
Manganese 1.17e-04 7.70e-04 7.60e-05 3.21e-04
Mercury 8.52e-05 3.47e-05 6.78e-05 6.26e-05
Molybdenumb 6.64e-05 6.65e-05 6.62e-05 6.63e-05
Nickel 1.48e-04 5.29e-05 1.01e-04
Potassium 3.79e-03 1.26e-03 1.21e-03 2.09e-03
Seleniumb 4.13e-05 4.13e-05 4.15e-05 4.14e-05
Silverb 5.00e-06 4.90e-06 5.01e-06 4.97e-06
Sodium 9.31e-03 9.63e-03 9.47e-03
Strontium 2.47e-05 8.28e-05 8.26e-05 6.34e-05
Vanadiumb 1.67e-06 1.63e-06 1.62e-06 1.64e-06
Zinc 5.28e-04 3.45e-04 4.36e-04 aPages 5 and 7.bPollutant was not detected in any of the sampling runs. EF is based on detection limits.cDivide emission rate by coal feed rate.

REFERENCE 27 OF AP-42 SECTION 1.1 BACKGROUND DOCUMENTATIONREFERENCE 17 OF AP-42 SECTION 1.7 BACKGROUND DOCUMENTATION
5-31
CHROME VI EMISSION FACTORS
Run 1 Run 2 Run 3 AVG
Emission Rates (lb/hr)a 0.0095 0.0028 0.0100
Emission Factors (lb/ton)b 1.91e-05 5.65e-06 2.01e-05 1.49e-05 aPage 8.bDivide emission rate by coal feed rate.

REFERENCE 28 OF AP-42 SECTION 1.1 BACKGROUND DOCUMENTATIONREFERENCE 18 OF AP-42 SECTION 1.7 BACKGROUND DOCUMENTATION
5-32
TEST REPORT TITLE: FIELD CHEMICAL EMISSIONS MONITORING PROJECT: SITE 10 EMISSIONS MONITORING. RADIAN CORPORATION, AUSTIN, TEXAS. OCTOBER, 1992.
FACILITY: EPRI SITE 10FILENAME SITE10.tbl
PROCESS DATA
Coal feed rate, dry (lb/hr)a 108,626 Coal HHV, dry (Btu/lb)b 11,000
Coal moisture percent by weightb 7.3% Coal HHV, as received (Btu/lb) 10,252
Coal feed rate, as received (lb/hr) 117,180 Coal HHV, as received (MMBtu/lb) 0.01
Coal feed rate, as received (ton/hr) 58.59 Coal HHV, as received (MMBtu/ton) 20.50
Stack gas flow rate (dscf/hr)a 15,500,000
Coal typec Subbituminous
Boiler configurationd Circulating Fluidized Bed Combustor (CFBC)
Coal sourcec Salt River
SCC 10100238
Control device 1e Flue gas desulfurization by limestone injection into the combustion chamber (FGD-FIL)
Control device 2e Fabric Filter
Data Quality A
Process Parametersd 110 megawatts
Test methodsf EPA, or EPA-approved, test methods
Number of test runsg 5 for benzene, 1 for all others.aPage C-3bPage B-3cAppendix B of EPRI Synthesis Report, page B-3.dAppendix B of EPRI Synthesis Report, page B-6.ePage 1-1fPages A-3 through A-13gPage 3-1 and B-15 for benzene, page 3-1 for others.

REFERENCE 28 OF AP-42 SECTION 1.1 BACKGROUND DOCUMENTATIONREFERENCE 18 OF AP-42 SECTION 1.7 BACKGROUND DOCUMENTATION
5-33
METALS, VOC EMISSION FACTORSa
Pollutant (lb/10^12 Btu) (lb/MMBtu) (lb/ton)c
Arsenicb 1 1.00e-06 2.05e-05
Barium 12.1 1.21e-05 2.48e-04
Berylliumb 0.2 2.00e-07 4.10e-06
Cadmiumb 0.4 4.00e-07 8.20e-06
Chloride 958 9.58e-04 1.96e-02
Chromium 1.6 1.60e-06 3.28e-05
Cobaltb 0.8 8.00e-07 1.64e-05
Copperb 2 2.00e-06 4.10e-05
Fluorideb 18 1.80e-05 3.69e-04
Lead 0.6 6.00e-07 1.23e-05
Manganese 31 3.10e-05 6.36e-04
Molybdenumb 4 4.00e-06 8.20e-05
Nickelb 2 2.00e-06 4.10e-05
Phosphorousb 24 2.40e-05 4.92e-04
Seleniumb 16 1.60e-05 3.28e-04
Vanadiumb 2 2.00e-06 4.10e-05
Formaldehydeb 15 1.50e-05 3.08e-04
Benzene 2 2.00e-06 4.10e-05 aPage 3-12bEmission factor is based only on detection limits.cMultiply emission factor, lb/MMBtu, by coal HHV, MMBtu/ton.

REFERENCE 28 OF AP-42 SECTION 1.1 BACKGROUND DOCUMENTATIONREFERENCE 18 OF AP-42 SECTION 1.7 BACKGROUND DOCUMENTATION
5-34
MISC. EMISSION FACTORS
Stack Gas Conc. Stack Gas Conc. Stack Gas Conc. Emission Rate Emission Factor
Pollutant (ug/Nm3)a (ug/dscm)b (lb/dscf)c (lb/hr)d (lb/ton)e
Dibutyl Phthalate 3.1 2.89 1.80e-10 2.80e-03 4.77e-05
bis(2-Ethylhexyl) phthalate 6.0 5.59 3.49e-10 5.41e-03 9.24e-05
N-Nitrosodiethylamine 15 13.98 8.73e-10 1.35e-02 2.31e-04 aPage 3-14bConvert Normal meter to standard meter, i.e., multiply by 273/293.cConvert ug/dscm to lb/dscf.dMultiply concentration by stack gas flow rate.eDivide emission rate by coal feed rate.

REFERENCE 29 OF AP-42 SECTION 1.1 BACKGROUND DOCUMENTATIONREFERENCE 19 OF AP-42 SECTION 1.7 BACKGROUND DOCUMENTATION
5-35
TEST REPORT TITLE: FIELD CHEMICAL EMISSIONS MONITORING PROJECT: SITE 11 EMISSIONS MONITORING. RADIAN CORPORATION, AUSTIN, TEXAS. OCTOBER, 1992.
FACILITY: EPRI SITE 11FILENAME SITE11.tbl
PROCESS DATA
Coal typea Subbituminous
Boiler configurationb Pulverized, dry, tangential
Coal sourcea Powder River Basin
SCC 10100226
Control device 1a Over Fire Air
Control device 2a ESP
Control device 3a Flue Gas Desulfurization, Wet Limestone Scrubber (Absorber)
Data Quality B
Process Parametersa 700 MW
Test methodsc EPA, or EPA-approved, test methods
Number of test runsd 1
Stack gas flow rate (dscf/m)e 1,598,400
Stack gas flow rate (dscf/hr) 95,904,000
Stack Gas O2 %e 6.9
F-factor (dscf/MMBtu)f 9,780
Heat input (MMBtu/hr) 6568.7
Coal HHV, as recieved (Btu/lb)a 8,300
Coal HHV, as received (MMBtu/lb) 0.008
Coal HHV, as received (MMBtu/ton) 16.60

REFERENCE 29 OF AP-42 SECTION 1.1 BACKGROUND DOCUMENTATIONREFERENCE 19 OF AP-42 SECTION 1.7 BACKGROUND DOCUMENTATION
5-36
Coal feed rate as received (ton/hr) 395.70 aPage 2-1.bPage 2-1. Assumed dry bottom.cAppendix A.dPage 3-18.ePage D-7.f40 CFR Pt 60, App. A, Meth. 19, bituminous coal.
METALS, VOC EMISSION FACTORS
Pollutant
ParticulatePhase
(ug/Nm3)a
VaporPhase
(ug/Nm3)aTotal
(ug/Nm3)Total
(ug/dscm)Total
(lb/dscf)
EmissionRate
(lb/hr)c
EmissionFactor
(lb/ton)d
Arsenic 1.0 NR(3) 1.0 0.93 5.82e-11 5.58e-03 1.41e-05
Barium 97 NR(6) 97.0 90.38 5.64e-09 5.41e-01 1.37e-03
Berylliumb NR(0.2) NR(1) 0.20 0.19 1.16e-11 1.12e-03 2.82e-06
Cadmium 1.3 1.3 1.21 7.56e-11 7.25e-03 1.83e-05
Chlorine 2200 2,200 2049.83 1.28e-07 1.23e+01 3.10e-02
Chromium 7.0 NR(6) 7.0 6.52 4.07e-10 3.91e-02 9.87e-05
Cobalt 1.7 NR(6) 1.7 1.58 9.89e-11 9.49e-03 2.40e-05
Copper 2.1 NR(10) 2.1 1.96 1.22e-10 1.17e-02 2.96e-05
Fluorine 130 130.00 121.13 7.56e-09 7.25e-01 1.83e-03
Lead 14 14.00 13.04 8.15e-10 7.81e-02 1.97e-04
Manganese 3.9 110 113.90 106.13 6.63e-09 6.36e-01 1.61e-03
Mercury 0.016 3.7 3.72 3.46 2.16e-10 2.07e-02 5.24e-05
Molybdenumb NR(5) NR(30) 5 4.66 2.91e-10 2.79e-02 7.05e-05
Nickel 4.7 NR(10) 4.7 4.38 2.73e-10 2.62e-02 6.63e-05

REFERENCE 29 OF AP-42 SECTION 1.1 BACKGROUND DOCUMENTATIONREFERENCE 19 OF AP-42 SECTION 1.7 BACKGROUND DOCUMENTATION
5-37
Phosphorousb NR(20) 20 18.63 1.16e-09 1.12e-01 2.82e-04

REFERENCE 29 OF AP-42 SECTION 1.1 BACKGROUND DOCUMENTATIONREFERENCE 19 OF AP-42 SECTION 1.7 BACKGROUND DOCUMENTATION
5-38
METALS, VOC EMISSION FACTORS
Pollutant
ParticulatePhase
(ug/Nm3)a
VaporPhase
(ug/Nm3)aTotal
(ug/Nm3)Total
(ug/dscm)Total
(lb/dscf)
EmissionRate
(lb/hr)c
EmissionFactor
(lb/ton)d
Seleniumb NR(3) 3 2.80 1.75e-10 1.67e-02 4.23e-05
Vanadium 2.6 NR(10) 2.6 2.42 1.51e-10 1.45e-02 3.67e-05
Formaldehydeb NR(10) 10 9.32 5.82e-10 5.58e-02 1.41e-04
Naphthaleneb NR(4) 4 3.73 2.33e-10 2.23e-02 5.64e-05 aPage 3-18, Run 2 data only (other runs invalid).bPage 3-18. Detection limit value for one run used in calculating EF.cMultiply concentration by stack gas flow rate.dDivide emission rate by coal feed rate.

REFERENCE 30 OF AP-42 SECTION 1.1 BACKGROUND DOCUMENTATIONREFERENCE 20 OF AP-42 SECTION 1.7 BACKGROUND DOCUMENTATION
5-39
TEST REPORT TITLE: FIELD CHEMICAL EMISSIONS MONITORING PROJECT: SITE 12EMISSIONS MONITORING. RADIAN CORPORATION, AUSTIN,TEXAS. NOVEMBER, 1992.
FACILITY: EPRI SITE 12FILENAME SITE12.tbl
PROCESS DATA
Coal typea Bituminous
Boiler configurationb Pulverized, dry, opposed
Coal sourcea West Pa.
SCC 10100202
Control device 1c ESP
Control device 2c Flue Gas Desulfurization, Wet Limestone Scrubber(Absorber)
Control device 3 None
Data Quality A
Process Parametersc 700 MW
Test methodsd EPA, or EPA-approved, test methods
Number of test runse 2 for Metals, 3 for VOCs.
Coal HHV, dry (Btu/lb)f 13,733
Coal moisture %f 4.12%
Coal HHV, as received (Btu/lb) 13,190
Coal HHV, as received (Btu/ton) 26,379,178
Coal HHV, as received (MMBtu/ton) 26.4
aPage 3-5.bPage 2-1. Assumed dry bottom.cPage 2-1.dAppendix A.ePage 3-11 for PM/metals, Page 3-14 for VOC.fPage 3-6.

REFERENCE 30 OF AP-42 SECTION 1.1 BACKGROUND DOCUMENTATIONREFERENCE 20 OF AP-42 SECTION 1.7 BACKGROUND DOCUMENTATION
5-40
METALS, VOC EMISSION FACTORSa
Emission Factor Emission Factor Emission Factor
Pollutant (lb/10^12 Btu) (lb/MMBtu) (lb/ton)c
Arsenic 0.45 4.50e-07 1.19e-05
Barium 6.3 6.30e-06 1.66e-04
Berylliumb 0.16 1.60e-07 4.22e-06
Cadmium 1.2 1.20e-06 3.17e-05
Chloride 2500 2.50e-03 6.59e-02
Chromium 3.5 3.50e-06 9.23e-05
Cobaltb 1.0 1.00e-06 2.64e-05
Copper 4.4 4.40e-06 1.16e-04
Fluoride 27 2.70e-05 7.12e-04
Lead 5.7 5.70e-06 1.50e-04
Manganese 1.6 1.60e-06 4.22e-05
Mercury 0.16 1.60e-07 4.22e-06
Molybdenum 4 4.00e-06 1.06e-04
Nickel 4.4 4.40e-06 1.16e-04
Selenium 13 1.30e-05 3.43e-04
Vanadiumb 1.6 1.60e-06 4.22e-05
Formaldehydeb 8.4 8.40e-06 2.22e-04
Bromomethaneb 0.43 4.30e-07 1.13e-05
1,1,1-trichloroethane 0.75 7.50e-07 1.98e-05
Benzene 0.69 6.90e-07 1.82e-05
Toluene 1.04 1.04e-06 2.74e-05
m,p-xylene 0.72 7.20e-07 1.90e-05
aPage 3-12 for metals, page 3-14 for VOC. See page 3-11 for number of non-detect runs for pm/metals.bDetection limit value for two runs used in calculating EF.cMultiply emission factor, lb/MMBtu, by coal HHV, MMBtu/ton.

REFERENCE 31 OF AP-42 SECTION 1.1 BACKGROUND DOCUMENTATIONREFERENCE 21 OF AP-42 SECTION 1.7 BACKGROUND DOCUMENTATION
5-41
TEST REPORT TITLE: FIELD CHEMICAL EMISSIONS MONITORING PROJECT: SITE 15EMISSIONS MONITORING. RADIAN CORPORATION, AUSTIN,TEXAS. OCTOBER, 1992.
FACILITY: EPRI SITE 15FILENAME SITE15.tbl
PROCESS DATA
Coal typea Bituminous
Boiler configurationb Pulverized, dry, tangential
Coal sourcea Eastern US
SCC 10100212
Control device 1a ESP cold side
Control device 2 None
Control device 3 None
Data Quality A
Process Parametersa 600 MW
Test methodsc EPA, or EPA-approved, test methods
Number of test runsd 2 for lead, 3 for all others
Coal HHV, dry (Btu/lb)e 13,000
Coal HHV, as received (Btu/ton) 26,000,000
Coal HHV, as received (MMBtu/ton) 26.0
aPage 2-1.bPage 2-1. Assumed dry bottom.cAppendix A.dPage 3-9.ePage 3-4, assumed to be as fired.

REFERENCE 31 OF AP-42 SECTION 1.1 BACKGROUND DOCUMENTATIONREFERENCE 21 OF AP-42 SECTION 1.7 BACKGROUND DOCUMENTATION
5-42
EMISSION FACTORSa
Emission Factor Emission Factor Emission Factor
Pollutant (lb/10^12 Btu) (lb/MMBtu) (lb/ton)c
Arsenic 13 1.30e-05 3.38e-04
Barium 34 3.40e-05 8.84e-04
Beryllium 0.4 4.00e-07 1.04e-05
Cadmium 3.1 3.10e-06 8.06e-05
Chloride 46,700 4.67e-02 1.21e+00
Chromium 12 1.20e-05 3.12e-04
Cobalt 2.0 2.00e-06 5.20e-05
Copper 5.5 5.50e-06 1.43e-04
Fluoride 3,850 3.85e-03 1.00e-01
Lead 4.3 4.30e-06 1.12e-04
Manganese 8.6 8.60e-06 2.24e-04
Molybdenum 5.3 5.30e-06 1.38e-04
Nickel 5.9 5.90e-06 1.53e-04
Selenium 77 7.70e-05 2.00e-03
Vanadium 14 1.40e-05 3.64e-04
Benzene 0.8 8.00e-07 2.08e-05
Formaldehydeb 5 5.00e-06 1.30e-04
Toluene 5.2 5.20e-06 1.35e-04
aPage 3-10.bEmission factors is based only on detection limits.cMultiply emission factor, lb/MMBtu, by coal HHV, MMBtu/ton.

REFERENCE 32 OF AP-42 SECTION 1.1 BACKGROUND DOCUMENTATIONREFERENCE 22 OF AP-42 SECTION 1.7 BACKGROUND DOCUMENTATION
5-43
TEST REPORT TITLE: FIELD CHEMICAL EMISSIONS MONITORING PROJECT: SITE 19 EMISSIONS MONITORING. RADIAN CORPORATION, AUSTIN, TEXAS. NOVEMBER, 1992.
FACILITY: EPRI SITE 19FILENAME SITE19.tbl
PROCESS DATA
Coal typea Bituminous Coal HHV, dry (Btu/lb)g 13,467
Boiler configurationb Pulverized, dry, opposed Coal moisture %g 6.1%
Coal source Virginia, Kentucky Coal HHV, as received (Btu/lb) 12,693
SCC 10100202 Coal HHV, as received (Btu/ton) 25,385,485
Control device 1c ESP cold side Coal HHV, as received (MMBtu/ton) 25.4
Control device 2 None Coal feed rate, dry (lb/hr)h 694,000
Control device 3 None Coal moisture percent by weightg 6.1%
Data Quality A Coal feed rate, as received (lb/hr) 739,084
Process Parametersd 1160 MW Coal feed rate, as received (ton/hr) 369.54
Test methodse EPA, or EPA-approved, test methods Stack gas flow rate (Nm3/hr)h 4,000,000
Number of test runsf 3
aPage 2-1.bPage 2-1. Assumed dry bottom.cPage 2-1.dPage 2-2.eAppendix A.fPage 3-7.gPage 3-5.hPage 3-8.

REFERENCE 32 OF AP-42 SECTION 1.1 BACKGROUND DOCUMENTATIONREFERENCE 22 OF AP-42 SECTION 1.7 BACKGROUND DOCUMENTATION
5-44
METALS
EmissionFactora
EmissionFactor
EmissionFactor
Pollutant (lb/1012 Btu) (lb/MMBtu) (lb/ton)b
Arsenic 7.9 7.90e-06 2.01e-04
Cadmium 0.13 1.30e-07 3.30e-06
Chloride 75,000 7.50e-02 1.90e+0
Chromium 13 1.30e-05 3.30e-04
Copper 12 1.20e-05 3.05e-04
Fluoride 5,800 5.80e-03 1.47e-01
Manganese 5.4 5.40e-06 1.37e-04
Mercury 6.2 6.20e-06 1.57e-04
Nickel 7.9 7.90e-06 2.01e-04
Selenium 260 2.60e-04 6.60e-03
aPage 3-8.bMultiply emission factor, lb/MMBtu, by coal HHV, MMBtu/ton.
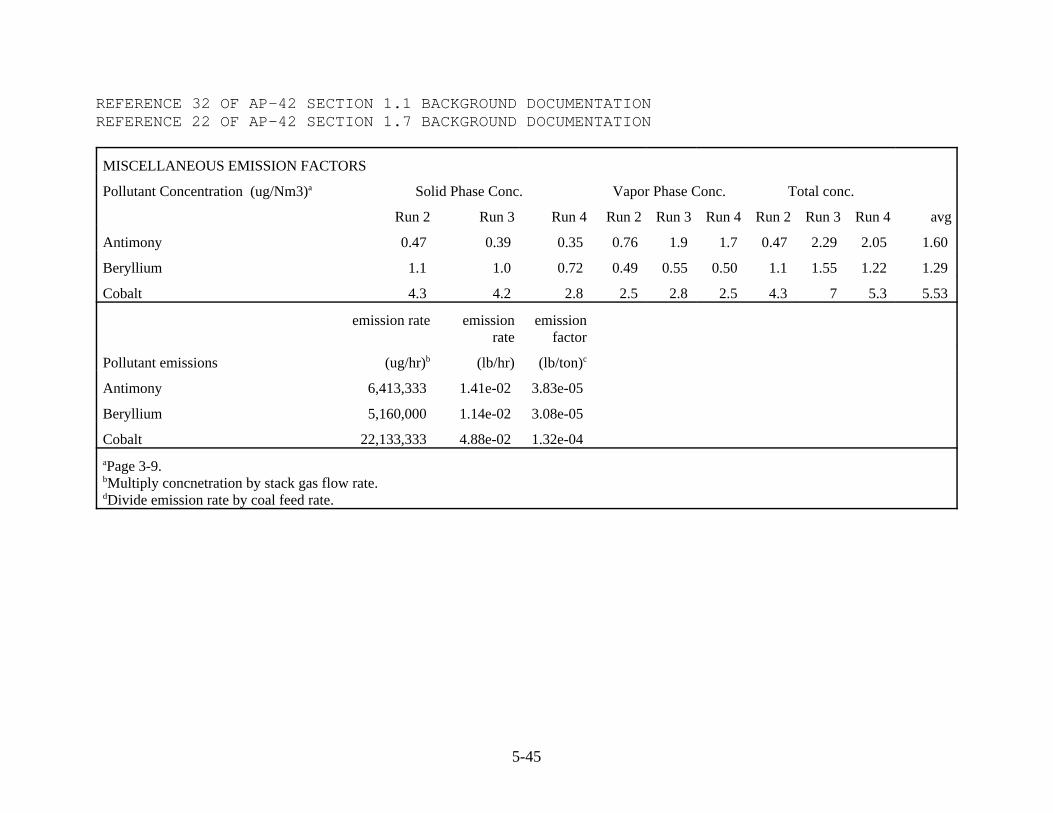
REFERENCE 32 OF AP-42 SECTION 1.1 BACKGROUND DOCUMENTATIONREFERENCE 22 OF AP-42 SECTION 1.7 BACKGROUND DOCUMENTATION
5-45
MISCELLANEOUS EMISSION FACTORS
Pollutant Concentration (ug/Nm3)a Solid Phase Conc. Vapor Phase Conc. Total conc.
Run 2 Run 3 Run 4 Run 2 Run 3 Run 4 Run 2 Run 3 Run 4 avg
Antimony 0.47 0.39 0.35 0.76 1.9 1.7 0.47 2.29 2.05 1.60
Beryllium 1.1 1.0 0.72 0.49 0.55 0.50 1.1 1.55 1.22 1.29
Cobalt 4.3 4.2 2.8 2.5 2.8 2.5 4.3 7 5.3 5.53
emission rate emissionrate
emissionfactor
Pollutant emissions (ug/hr)b (lb/hr) (lb/ton)c
Antimony 6,413,333 1.41e-02 3.83e-05
Beryllium 5,160,000 1.14e-02 3.08e-05
Cobalt 22,133,333 4.88e-02 1.32e-04
aPage 3-9.bMultiply concnetration by stack gas flow rate.dDivide emission rate by coal feed rate.

REFERENCE 33 OF AP-42 SECTION 1.1 BACKGROUND DOCUMENTATIONREFERENCE 23 OF AP-42 SECTION 1.7 BACKGROUND DOCUMENTATION
5-46
TEST REPORT TITLE: FIELD CHEMICAL EMISSIONS MONITORING PROJECT: SITE 20EMISSIONS MONITORING RADIAN CORPORATION, AUSTIN,TEXAS. MARCH, 1994.
FACILITY: EPRI SITE 20FILENAME SITE20.tbl
PROCESS DATA
Coal typea Lignite
Boiler configurationb Pulverized
Coal sourcef Wilcox, Texas
SCC 10100301
Control device 1a ESP cold side
Control device 2a Flue Gas Desulfurization- Wet Limestone Scrubber(absorber)
Control device 3 None
Data Quality A
Process Parametersa 680 MW
Test methodsc EPA, or EPA-approved, test methods
Number of test runsd 4
Coal HHV, as received (Btu/lb)e 6,760
Coal HHV, as received (Btu/ton) 13,520,000
Coal HHV, as received (MMBtu/ton) 13.5 aPage 2-1.bPage 2-5.cAppendix A.dPage 3-9.ePage 2-2.fAppendix B of EPRI Synthesis Report, page B-3.

REFERENCE 33 OF AP-42 SECTION 1.1 BACKGROUND DOCUMENTATIONREFERENCE 23 OF AP-42 SECTION 1.7 BACKGROUND DOCUMENTATION
5-47
EMISSION FACTORS EmissionFactora
EmissionFactor
EmissionFactor
Pollutant (lb/10^12 Btu) (lb/MMBtu) (lb/ton)b
Arsenic 0.63 6.30e-07 8.52e-06
Barium 42 4.20e-05 5.68e-04
Beryllium 0.35 3.50e-07 4.73e-06
Cadmium 0.70 7.00e-07 9.46e-06
Chloride 390 3.90e-04 5.27e-03
Chromium 2.8 2.80e-06 3.79e-05

REFERENCE 33 OF AP-42 SECTION 1.1 BACKGROUND DOCUMENTATIONREFERENCE 23 OF AP-42 SECTION 1.7 BACKGROUND DOCUMENTATION
5-48
EMISSION FACTORS EmissionFactora
EmissionFactor
EmissionFactor
Pollutant (lb/10^12 Btu) (lb/MMBtu) (lb/ton)b
Cobalt 0.69 6.90e-07 9.33e-06
Fluoride 430 4.30e-04 5.81e-03
Lead 3.8 3.80e-06 5.14e-05
Manganese 8.5 8.50e-06 1.15e-04
Mercury 12 1.20e-05 1.62e-04
Nickel 4.3 4.30e-06 5.81e-05
Phosphorous 21 2.10e-05 2.84e-04
Selenium 160 1.60e-04 2.16e-03
Vanadium 3.08 3.08e-06 4.16e-05 aPage 3-11, Stack data.bMultiply emission factor,lb/MMBtu, by coal HHV, MMBtu/ton.
Antimony EMISSION FACTOR: Note that antimony was not detected in any of the sampling runs.
Run 1 Run 2 Run 3 Run 4
Coal feed rate (lb/hr, dry)a 630,000 614,000 619,000 618,000
Coal moisture (%)a 33.5% 34.2% 33.6% 34.4%
Coal feed rate (lb/hr, wet) (as fired) 947,368 933,131 932,229 942,073
Coal feed rate (ton/hr) 474 467 466 471
Stack gas flow rate (Nm3/hr)b 3,100,000 3,140,000 3,100,000 3,040,000
Antimony concentration (ug/Nm3)b,c 1.31 1.07 1.13 1.29
Antimony emission rate (ug/hr)d 4,061,000 3,359,800 3,503,000 3,921,600
Antimony emission rate (lb/hr)e 8.95e-03 7.41e-03 7.72e-03 8.65e-03
Antimony emission factor (lb/ton)f 1.89e-05 1.59e-05 1.66e-05 1.84e-05
avg
1.74e-05 aPage 3-6.bPage 3-9.cPollutant was not detected in any sampling runs. EF based on detection limits.dMultiply concentration by stack gas flow rate.eConvert ug/hr to lb/hr.fDivide emission rate by coal feed rate.

REFERENCE 34 OF AP-42 SECTION 1.1 BACKGROUND DOCUMENTATIONREFERENCE 24 OF AP-42 SECTION 1.7 BACKGROUND DOCUMENTATION
5-49
TEST REPORT TITLE: FIELD CHEMICAL EMISSIONS MONITORING PROJECT: SITE 21EMISSIONS MONITORING. RADIAN CORPORATION, AUSTIN,TEXAS. AUGUST, 1993.
FACILITY: EPRI SITE 21FILENAME SITE21.tbl
PROCESS DATA
Coal typea Bituminous
Boiler configurationb Pulverized, dry, opposed
Coal sourcea Pa., W. Va.
SCC 10100202
Control device 1c ESP
Control device 2c Flue Gas Desulfurization, Wet Limestone Scrubber(Absorber)
Control device 3 None
Data Quality A
Process Parametersc 667 MW
Test methodsd EPA, or EPA-approved, test methods
Number of test runse 8 for PM/metals, 7 for semi-volatiles
Coal HHV, dry (Btu/lb)f 14,032
Coal moisture %g 7%
Coal HHV, as received (Btu/lb) 13,114
Coal HHV, as received (Btu/ton) 26,228,037
Coal HHV, as received (MMBtu/ton) 26.2 aPage 3-6.bAssumed to be pulverized, dry bottom.cPage 2-3.dAppendix A.ePage 3-10 for metals, page 3-14 for semi-volatiles.fPage 3-5.gPage 7-2.
EMISSION FACTORS Emission Factora Emission Factor Emission Factorb
Pollutant (lb/10^12 Btu) (lb/MMBtu) (lb/ton)
Acenapthene 0.018 1.80e-08 4.72e-07
Acenapthylene 0.0075 7.50e-09 1.97e-07
Anthracene 0.0099 9.90e-09 2.60e-07
Arsenic 6.17 6.17e-06 1.62e-04

REFERENCE 34 OF AP-42 SECTION 1.1 BACKGROUND DOCUMENTATIONREFERENCE 24 OF AP-42 SECTION 1.7 BACKGROUND DOCUMENTATION
5-50
EMISSION FACTORS Emission Factora Emission Factor Emission Factorb
Pollutant (lb/10^12 Btu) (lb/MMBtu) (lb/ton)
Barium 3.21 3.21e-06 8.42e-05
Benz(a)anthracene 0.0013 1.30e-09 3.41e-08
Benzo(a)pyrene 0.0018 1.80e-09 4.72e-08
Benzo(b,j,k)fluoranthenes 0.0066 6.60e-09 1.73e-07
Benzo(g,h,i)perylene 0.0012 1.20e-09 3.15e-08
Beryllium 0.13 1.30e-07 3.41e-06
Cadmium 0.57 5.70e-07 1.49e-05
Chloride 1,980 1.98e-03 5.19e-02
Chromium 2.74 2.74e-06 7.19e-05
Chrysene 0.0069 6.90e-09 1.81e-07
Cobalt 4.1 4.10e-06 1.08e-04
Copper 1.57 1.57e-06 4.12e-05
Fluoranthene 0.053 5.30e-08 1.39e-06
Fluorene 0.064 6.40e-08 1.68e-06
Fluoride 31.9 3.19e-05 8.37e-04
Indeno(1,2,3-cd)pyrene 0.0015 1.50e-09 3.93e-08
Lead 6.32 6.32e-06 1.66e-04
Manganese 15 1.50e-05 3.93e-04
Mercury 0.84 8.40e-07 2.20e-05
Molybdenum 0.61 6.10e-07 1.60e-05
Nickel 1.68 1.68e-06 4.41e-05
Phenanthrene 0.21 2.10e-07 5.51e-06
Pyrene 0.024 2.40e-08 6.29e-07
Selenium 9.9 9.90e-06 2.60e-04
Vanadium 5.50 5.50e-06 1.44e-04
5-Methyl Chrysene 0.0015 1.50e-09 3.93e-08 aPage 3-15.bMultiply emission factor, lb/MMBtu, by coal HHV, MMBtu/ton.

REFERENCE 35 OF AP-42 SECTION 1.1 BACKGROUND DOCUMENTATIONREFERENCE 25 OF AP-42 SECTION 1.7 BACKGROUND DOCUMENTATION
5-51
TEST REPORT TITLE: FIELD CHEMICAL EMISSIONS MONITORING PROJECT: SITE 22EMISSIONS REPORT. RADIAN CORPORATION, AUSTIN, TEXAS. FEBRUARY, 1994.
FACILITY: EPRI SITE 22FILENAME SITE22.tbl
PROCESS DATA
Coal typea Subbituminous
Boiler configurationb Pulverized, dry, opposed
Coal sourcea Powder River
SCC 10100222
Control device 1a ESP Cold Side
Control device 2 None
Control device 3 None
Data Quality A
Process Parametersc 700 MW
Test methodsd EPA, or EPA-approved, test methods
Number of test runse 3
Coal HHV, dry (Btu/lb)f 11,981
Coal moisture %f 29.5%
Coal HHV, as received (Btu/lb) 9,252
Coal HHV, as received (Btu/ton) 18,503,475
Coal HHV, as received (MMBtu/ton) 18.5
aPage 2-1bAssumed pulverized, dry bottom.cPage 2-2.dAppendix AePages 3-7 through 3-11fPage 3-6

REFERENCE 35 OF AP-42 SECTION 1.1 BACKGROUND DOCUMENTATIONREFERENCE 25 OF AP-42 SECTION 1.7 BACKGROUND DOCUMENTATION
5-52
METALS, ORGANIC EMISSION FACTORS
Emission Factora Emission Factor Emission Factorc
Pollutant (lb/10^12 Btu) (lb/MMBtu) (lb/ton)
Arsenic 0.087 8.70e-08 1.61e-06
Barium 16 1.60e-05 2.96e-04
Berylliumb 0.031 3.10e-08 5.74e-07
Cadmium 0.16 1.60e-07 2.96e-06
Chloride 726 7.26e-04 1.34e-02
Chromium 0.53 5.30e-07 9.81e-06
Cobaltb 0.70 7.00e-07 1.30e-05
Copper 1.0 1.00e-06 1.85e-05
Fluoride 855 8.55e-04 1.58e-02
Lead 0.11 1.10e-07 2.04e-06
Manganese 1.1 1.10e-06 2.04e-05
Mercury 3.8 3.80e-06 7.03e-05
Molybdenum 1.9 1.90e-06 3.52e-05
Nickel 0.64 6.40e-07 1.18e-05
Phosphorous 11 1.10e-05 2.04e-04
Selenium 0.053 5.30e-08 9.81e-07
Vanadium 0.78 7.80e-07 1.44e-05
Aluminum 136 1.36e-04 2.52e-03
Antimonyb 3.8 3.80e-06 7.03e-05
Calcium 325 3.25e-04 6.01e-03
Iron 52 5.20e-05 9.62e-04
Magnesium 47 4.70e-05 8.70e-04
Potassiumb 82 8.20e-05 1.52e-03
Sodium 86 8.60e-05 1.59e-03
Titanium 12 1.20e-05 2.22e-04
aPage 3-12.bEmission factor is based only on detection limits.cMultiply emission factor, lb/MMBtu, by coal HHV, MMBtu/ton.

REFERENCE 35 OF AP-42 SECTION 1.1 BACKGROUND DOCUMENTATIONREFERENCE 25 OF AP-42 SECTION 1.7 BACKGROUND DOCUMENTATION
5-53
PAH EMISSION FACTORS
Emission Factora Emission Factor Emission Factorc
Pollutant (lb/10^12 Btu) (lb/MMBtu) (lb/ton)
Acenaphthalene 0.0034 3.40e-09 6.29e-08
Acenaphthene 0.0060 6.00e-09 1.11e-07
Anthracene 0.0046 4.60e-09 8.51e-08
Benzo(a)pyrene 0.0011 1.10e-09 2.04e-08
Benzo(b,j,k)fluoranthenes 0.0027 2.70e-09 5.00e-08
Benzo(g,h,i)perylene 0.0022 2.20e-09 4.07e-08
Benz(a)anthracene 0.0010 1.00e-09 1.85e-08
Chrysene 0.0025 2.50e-09 4.63e-08
Fluoranthene 0.024 2.40e-08 4.44e-07
Fluorene 0.012 1.20e-08 2.22e-07
Indeno(1,2,3-cd)pyrene 0.0086 8.60e-09 1.59e-07
5-Methyl Chryseneb 0.00047 4.70e-10 8.70e-09
Phenanthrene 0.069 6.90e-08 1.28e-06
Pyrene 0.016 1.60e-08 2.96e-07
aPage 3-14..bEmission factor is based only on detection limits.cMultiply emission factor, lb/MMBtu, by coal HHV, MMBtu, ton.
DIOXIN/FURAN EMISSION FACTORS
Emission Factor Emission Factor Emission Factorc
Pollutant (lb/10^12 Btu)a (lb/MMBtu) (lb/ton)
2,3,7,8-TCDDb 3.3e-06 3.3e-12 6.1e-11
Total TCDD 4.7e-06 4.7e-12 8.7e-11
Total PeCDD ND ND ND
Total HxCDD ND ND ND
Total HpCDD 9.8e-06 9.8e-12 1.8e-10
OCDD 5.2e-05 5.2e-11 9.6e-10

REFERENCE 35 OF AP-42 SECTION 1.1 BACKGROUND DOCUMENTATIONREFERENCE 25 OF AP-42 SECTION 1.7 BACKGROUND DOCUMENTATION
5-54
DIOXIN/FURAN EMISSION FACTORS
Emission Factor Emission Factor Emission Factorc
Pollutant (lb/10^12 Btu)a (lb/MMBtu) (lb/ton)
2,3,7,8-TCDFb 3.6e-06 3.6e-12 6.7e-11
Total TCDF 6.2e-06 6.2e-12 1.1e-10
Total PeCDF 7.3e-06 7.3e-12 1.4e-10
Total HxCDF 3.5e-06 3.5e-12 6.5e-11
Total HpCDF 2.2e-06 2.2e-12 4.1e-11
OCDF 4.2e-06 4.2e-12 7.8e-11
aPage 3-15.bEmission factor is based only on detection limits.cMultiply emission factor, lb/MMBtu, by coal HHV, MMBtu, ton.

REFERENCE 36 OF AP-42 SECTION 1.1 BACKGROUND DOCUMENTATIONREFERENCE 26 OF AP-42 SECTION 1.7 BACKGROUND DOCUMENTATION
5-55
TEST REPORT TITLE: FIELD CHEMICAL EMISSIONS MONITORING PROJECT: SITE 101 EMISSIONS REPORT. RADIAN CORPORATION,AUSTIN, TEXAS. OCTOBER, 1994.
FACILITY: EPRI SITE 101FILENAME SITE101.tbl
PROCESS DATA
Coal typea Subbituminous
Boiler configurationb Pulverized, dry, wall-fired
Coal sourcec New Mexico
SCC 10100222
Control device 1a Low Nox Burners (LNB)
Control device 2a Fabric Filter
Control device 3a Flue Gas Desulfurization- Wet Limestone Scrubber
Data Quality A
Process Parametersa 800 MW
Test methodsd EPA, or EPA-approved, test methods
Number of test runse 3 for benzene, toluene, chloride and fluoride; 2 for all others.
Coal HHV, dry (Btu/lb)f 10,190
Coal moisture %f 14%
Coal HHV, as received (Btu/lb) 8,939
Coal HHV, as received (Btu/ton) 17,877,193
Coal HHV, as received (MMBtu/ton) 17.9
aPage 2-1.bPage 2-1, assumed dry bottom.cAppendix B of the EPRI Synthesis Report, page B-3.dAppendix A.ePage 3-10 for benzene and toluene, page 3-6 for others.fPage 3-5.

REFERENCE 36 OF AP-42 SECTION 1.1 BACKGROUND DOCUMENTATIONREFERENCE 26 OF AP-42 SECTION 1.7 BACKGROUND DOCUMENTATION
5-56
METALS, ORGANIC EMISSION FACTORS
Emission Factora Emission Factor Emission Factorb
Pollutant (lb/10^12 Btu) (lb/MMBtu) (lb/ton)
Arsenic 0.34 3.40e-07 6.08e-06
Barium 18 1.80e-05 3.22e-04
Beryllium 0.036 3.60e-08 6.44e-07
Cadmium 0.40 4.00e-07 7.15e-06
Chloride 2,500 2.50e-03 4.47e-02
Chromium 2.2 2.20e-06 3.93e-05
Cobalt 0.13 1.30e-07 2.32e-06
Copper 2.2 2.20e-06 3.93e-05
Fluoride 3,600 3.60e-03 6.44e-02
Lead 0.72 7.20e-07 1.29e-05
Manganese 10 1.00e-05 1.79e-04
Mercury 1.9 1.90e-06 3.40e-05
Molybdenum 2.6 2.60e-06 4.65e-05
Nickel 2.8 2.80e-06 5.01e-05
Phosphorous 9.2 9.20e-06 1.64e-04
Selenium 1.4 1.40e-06 2.50e-05
Vanadium 0.93 9.30e-07 1.66e-05
Benzene 0.57 5.70e-07 1.02e-05
Toluene 0.57 5.70e-07 1.02e-05
aPage 3-13.bMultiply emission factor, lb/MMBtu, by coal HHV, MMBtu/ton.

REFERENCE 37 OF AP-42 SECTION 1.1 BACGROUND DOCUMENTATIONREFERENCE 27 OF AP-42 SECTION 1.7 BACGROUND DOCUMENTATION
5-57
TEST REPORT TITLE: FIELD CHEMICAL EMISSIONS MONITORING PROJECT: SITE 111 EMISSIONS REPORT. RADIAN CORPORATION,AUSTIN, TEXAS. MAY, 1993.
FACILITY: EPRI SITE 111FILENAME SITE111.tbl
PROCESS DATA
Coal typea Subbituminous
Boiler configurationb Pulverized, dry bottom
Coal sourcec Western
SCC 10100222
Control device 1c Low Nox Burners (LNB)
Control device 2c Flue Gas Desulfurization- Spray Dryer (FGD-SD)
Control device 3c Fabric Filter (FF)
Data Quality A
Process Parametersc 267 MW
Test methodsd EPA, or EPA-approved, test methods
Number of test runse 2
Coal HHV, as fired (received) (Btu/lb)f 10,020
Coal HHV, as fired (received) (Btu/ton) 20,040,000
Coal HHV, as fired (received) (MMBtu/ton) 20.0
aPage 2-2.bAssumed dry bottom.cPage 2-1.d Page 1-4.e Page 3-12.f Page 2-2.

REFERENCE 37 OF AP-42 SECTION 1.1 BACGROUND DOCUMENTATIONREFERENCE 27 OF AP-42 SECTION 1.7 BACGROUND DOCUMENTATION
5-58
EMISSION FACTORS
EmissionFactora
EmissionFactor
Emission Factor
Pollutant (lb/10^12 Btu) (lb/MMBtu) (lb/ton)c
Arsenicb 0.21 2.10e-07 4.21e-06
Cadmiumb 2.1 2.10e-06 4.21e-05
Chromiumb 4.3 4.30e-06 8.62e-05
Mercuryb 67 6.70e-05 1.34e-03
Nickel 5.3 5.30e-06 1.06e-04
Chloride 1,250 1.25e-03 2.51e-02
Benzene 21.1 2.11e-05 4.23e-04
Naphthalene 0.76 7.60e-07 1.52e-05
Acenaphthalene 0.03 3.00e-08 6.01e-07
Acenaphthene 0.08 8.00e-08 1.60e-06
Fluorene 0.18 1.80e-07 3.61e-06
Phenanthrene 0.13 1.30e-07 2.61e-06
Anthracene 0.02 2.00e-08 4.01e-07
Fluoranthene 0.03 3.00e-08 6.01e-07
Pyrene 0.01 1.00e-08 2.00e-07
Chryseneb 0.004 4.00e-09 8.02e-08
Benz(a)anthracene 0.009 9.00e-09 1.80e-07
Benzo(b)fluoranthene 0.008 8.00e-09 1.60e-07
Benzo(k)fluoranthene 0.004 4.00e-09 8.02e-08
Benzo(a)pyreneb 0.004 4.00e-09 8.02e-08
Indeno(1,2,3-cd)pyrene 0.004 4.00e-09 8.02e-08
Benzo(g,h,i)perylene 0.004 4.00e-09 8.02e-08
aPage 3-15.bEmission factor is based only on detection limits.cMultiply emission factor, lb/MMBtu, by coal HHV, MMBtu/ton.

REFERENCE 38 OF AP-42 SECTION 1.1 BACKGROUND DOCUMENTATIONREFERENCE 28 OF AP-42 SECTION 1.7 BACKGROUND DOCUMENTATION
5-59
TEST REPORT TITLE: FIELD CHEMICAL EMISSIONS MONITORING PROJECT: SITE 114 REPORT. RADIAN CORPORATION, AUSTIN, TEXAS. MAY, 1994.
FACILITY: EPRI SITE 114FILENAME SITE114.tbl
PROCESS DATA
Coal typea Bituminous
Boiler configurationa Cyclone
Coal sourcea Indiana Lamar
SCC 10100203
Control device 1a ESP for baseline condition, Reburn/Overfire Air forcondition two
Control device 2a None for baseline, ESP for condition two
Control device 3 none
Data Quality A
Process Parametersa 100 MW
Test methodsb EPA, or EPA-approved, test methods
Number of test runsc 3
Baseline Reburn
Coal HHV, dry (Btu/lb)d 13,490 13,280
Coal moisture %d 15.6% 12.5%
Coal HHV, as received (Btu/lb) 11,670 11,804
Coal HHV, as received (Btu/ton) 23,339,100 23,608,889
Coal HHV, as received (MMBtu/ton) 23.3 23.6
aPage 2-1.bPage 1-4.cPages 3-8 and 3-9.dPages 3-4 & 3-5.

REFERENCE 38 OF AP-42 SECTION 1.1 BACKGROUND DOCUMENTATIONREFERENCE 28 OF AP-42 SECTION 1.7 BACKGROUND DOCUMENTATION
5-60
EMISSION FACTORS- BASELINE CONDITION
Emission Factora Emission Factor Emission Factorc
Pollutant (lb/10^12 Btu) (lb/MMBtu) (lb/ton)
Arsenic 7 7.00e-06 1.63e-04
Beryllium 2.4 2.40e-06 5.60e-05
Cadmium 1.8 1.80e-06 4.20e-05
Chromium 14 1.40e-05 3.27e-04
Manganese 20 2.00e-05 4.67e-04
Nickel 78 7.80e-05 1.82e-03
Lead 86 8.60e-05 2.01e-03
Selenium 240 2.40e-04 5.60e-03
Mercury 4.5 4.50e-06 1.05e-04
Chloride 4,310 4.31e-03 1.01e-01
Fluoride 64 6.40e-05 1.49e-03
Benzene 2.3 2.30e-06 5.37e-05
Toluene 1.02 1.02e-06 2.38e-05
PAHsb ND ND ND
Formaldehyde 2.6 2.60e-06 6.07e-05
Acetaldehyde 2.6 2.60e-06 6.07e-05
aPage 3-10.bND = not detected in three runs, no EF calculated. See page 3-8.cMultiply emission factor, lb/MMBtu, by coal HHV, MMBtu/ton.

REFERENCE 38 OF AP-42 SECTION 1.1 BACKGROUND DOCUMENTATIONREFERENCE 28 OF AP-42 SECTION 1.7 BACKGROUND DOCUMENTATION
5-61
EMISSION FACTORS- REBURN CONDITION
Emission Factora Emission Factor Emission Factor
Pollutant (lb/10^12 Btu) (lb/MMBtu) (lb/ton)d
Arsenic 8.0 8.00e-06 1.89e-04
Beryllium 0.8 8.00e-07 1.89e-05
Cadmium 0.4 4.00e-07 9.44e-06
Chromium 4.6 4.60e-06 1.09e-04
Manganese 15 1.50e-05 3.54e-04
Nickel 34 3.40e-05 8.03e-04
Lead 57 5.70e-05 1.35e-03
Selenium 150 1.50e-04 3.54e-03
Mercury 3.8 3.80e-06 8.97e-05
Chloride 6,000 6.00e-03 1.42e-01
Fluoride 89.9 8.99e-05 2.12e-03
Benzene 1.04 1.04e-06 2.46e-05
Toluene 0.70 7.00e-07 1.65e-05
PAHsb ND ND ND
Formaldehydec 2.6 2.60e-06 6.14e-05
Acetaldehydec 2.6 2.60e-06 6.14e-05
aPage 3-9.bND = not detected in three runs, no EF calculated. See page 3-9.cEmission factors based completely on detection limits.dMultiply emission factor, lb/MMBtu, by coal HHV, MMBtu/ton.

REFERENCE 39 OF AP-42 SECTION 1.1 BACKGROUND DOCUMENTATIONREFERENCE 29 OF AP-42 SECTION 1.1 BACKGROUND DOCUMENTATION
5-62
TEST REPORT TITLE: FIELD CHEMICAL EMISSIONS MONITORING PROJECT: SITE 115 EMISSIONS REPORT. RADIAN CORPORATION,AUSTIN, TEXAS. NOVEMBER, 1994.
FACILITY: EPRI SITE 115FILENAME SITE115.tbl
PROCESS DATA
Coal typea Bituminous
Boiler configurationb Pulverized, Dry bottom
Coal sourcea Western
SCC 10100202
PHASE I PHASE II
Control device 1c LNB/OFA LNB/OFA
Control device 2c Fabric Filter SNCR
Control device 3c none Fabric Filter
Data Quality B (coal moisture percent not provided)
Process Parametersa 117 MW
Test methodsd EPA, or EPA-approved, test methods
Number of test runse 2 for nickel during Phase I, 3 for all others
PHASE I PHASE II
Coal HHV, dry (Btu/lb)f 12,565 12,638
Coal moisture %g 9.8% 9.8%
Coal HHV, as received (Btu/lb) 11,444 11,510
Coal HHV, as received (Btu/ton) 22,887,067 23,020,036
Coal HHV, as received (MMBtu/ton) 22.9 23.0
aPage 6.bPage 6. Assumed dry bottom.cPage 6. LNB= Low Nox Burners; OFA = Overfire Air; SNCR = Selective non-catalytic reduction.dAppendix A, Table A-1.ePage 26 for Phase I, page 35 for Phase II. Also, see footnote to nickel EF in Table 3-4.fPage 20 for Phase I; Page 32 for Phase II.gThe test report does not provide a moisture content for the coal. EPRI Site 111 (Reference 19) also uses a "western bituminous" coal and the value used here is from that reference.

REFERENCE 39 OF AP-42 SECTION 1.1 BACKGROUND DOCUMENTATIONREFERENCE 29 OF AP-42 SECTION 1.1 BACKGROUND DOCUMENTATION
5-63
EMISSION FACTORS- PHASE I
Emission Factora Emission Factor Emission Factord
Pollutant (lb/10^12 Btu) (lb/MMBtu) (lb/ton)
Arsenic 0.75 7.50e-07 1.72e-05
Barium 1.1 1.10e-06 2.52e-05
Berylliumc 0.02 2.00e-08 4.58e-07
Cadmium 0.12 1.20e-07 2.75e-06
Chromium 0.66 6.60e-07 1.51e-05
Cobaltc 0.22 2.20e-07 5.04e-06
Copper 1.1 1.10e-06 2.52e-05
Lead 0.44 4.40e-07 1.01e-05
Manganese 1.0 1.00e-06 2.29e-05
Mercuryc 0.35 3.50e-07 8.01e-06
Molybdenum 0.17 1.70e-07 3.89e-06
Nickelb 1.5 1.50e-06 3.43e-05
Phosphorus 6.7 6.70e-06 1.53e-04
Selenium 0.36 3.60e-07 8.24e-06
Vanadium 0.24 2.40e-07 5.49e-06
Chloride 630 6.30e-04 1.44e-02
Fluoride 4,300 4.30e-03 9.84e-02
Benzene 2.6 2.60e-06 5.95e-05
Toluene 105 1.05e-04 2.40e-03
Formaldehyde 16.5 1.65e-05 3.78e-04
Cyanide 8 8.00e-06 1.83e-04
Naphthalene 0.26 2.60e-07 5.95e-06
apage 28, 29. ND = not detected in 3 runs, no EF developed. See page 26 for run data.bOne run invalid, data from two runs used to develop EF.cEmission factor is based only on detection limits.dMultiply emission factor, lb/MMBtu, by coal HHV, MMBtu/ton.

REFERENCE 39 OF AP-42 SECTION 1.1 BACKGROUND DOCUMENTATIONREFERENCE 29 OF AP-42 SECTION 1.1 BACKGROUND DOCUMENTATION
5-64
EMISSION FACTORS- PHASE II
Emission Factora Emission Factor Emission Factorc
Pollutant (lb/10^12 Btu) (lb/MMBtu) (lb/ton)
Arsenic 0.15 1.50e-07 3.45e-06
Barium 1.1 1.10e-06 2.53e-05
Berylliumb 0.02 2.00e-08 4.60e-07
Cadmiumb 0.07 7.00e-08 1.61e-06
Chromium 0.30 3.00e-07 6.91e-06
Cobaltb 0.23 2.30e-07 5.29e-06
Copper 1.3 1.30e-06 2.99e-05
Lead 0.40 4.00e-07 9.21e-06
Manganese 0.89 8.90e-07 2.05e-05
Mercury 0.41 4.10e-07 9.44e-06
Molybdenum 0.27 2.70e-07 6.22e-06
Nickel 0.45 4.50e-07 1.04e-05
Phosphorus 4.6 4.60e-06 1.06e-04
Seleniumb 0.06 6.00e-08 1.38e-06
Vanadium 0.29 2.90e-07 6.68e-06
Chloride 720 7.20e-04 1.66e-02
Fluoride 4,800 4.80e-03 1.10e-01
Cyanide 9 9.00e-06 2.07e-04
aPage 37.bEmission factor is based only on detection limits.cMultiply emission factor, lb/MMBtu, by coal HHV, MMBtu/ton.

REFERENCE 40 OF AP-42 SECTION 1.1 BACKGROUND DOCUMENTATIONREFERENCE 30 OF AP-42 SECTION 1.7 BACKGROUND DOCUMENTATION
5-65
TEST REPORT TITLE: CHARACTERIZING TOXIC EMISSIONS FROM A COAL-FIREDPOWER PLANT DEMONSTRATING THE AFGD ICCT PROJECTAND A PLANT UTILIZING A DRY SCRUBBER/BAGHOUSESYSTEM. SPRINGERVILLE GENERATING STATION UNIT NO. 2. SOUTHERN RESEARCH INSTITUTE, BIRMINGHAM, AL. DECEMBER, 1993.
FACILITY: Springerville, ArizonaFILENAME DOE7.tbl
PROCESS DATA
Coal typea Subbituminous
Boiler configurationb Pulverized, dry bottom, tangential
Coal sourcea New Mexico
SCC 10100226
Control device 1a Low Nox Burners- Overfire Air (LNB/OFA)
Control device 2a Flue Gas Desulfurization- Spray Dryer (FGD-SD)
Control device 3a Baghouse
Data Quality A
Process Parametersa 422 MW
Test methodsc EPA, or EPA-approved, test methods
Number of test runsd 2 for selenium, cadmium and manganese, 3 for others.
Coal HHV, as received (Btu/lb)e 9,446
Coal HHV, as received (Btu/ton) 18,892,000
Coal HHV, as received (MMBtu/ton) 18.9
aPage 3-1.b"Pulverized" from page 3-1, assumed dry bottom, "Tangential" from Appendix B of EPRI Synthesis Report. Page B-7.cPage 4-2.dPages 6-53, 6-54, and 6-55.ePage 6-2, average for conveyor.

REFERENCE 40 OF AP-42 SECTION 1.1 BACKGROUND DOCUMENTATIONREFERENCE 30 OF AP-42 SECTION 1.7 BACKGROUND DOCUMENTATION
5-66
EMISSION FACTORS
Emission Factora Emission Factor Emission Factorc
Pollutant (lb/10^12 Btu) (lb/MMBtu) (lb/ton)
Antimony 0.041 4.10e-08 7.75e-07
Arsenic 0.15 1.50e-07 2.83e-06
Barium 14.1 1.41e-05 2.66e-04
Berylliumb 0.04 4.00e-08 7.56e-07
Boron 609 6.09e-04 1.15e-02
Cadmium 0.026 2.60e-08 4.91e-07
Chromium 0.10 1.00e-07 1.89e-06
Cobaltb 0.3 3.00e-07 5.67e-06
Copper 0.98 9.80e-07 1.85e-05
Lead 0.70 7.00e-07 1.32e-05
Manganese 11.36 1.14e-05 2.15e-04
Mercury 4.18 4.18e-06 7.90e-05
Molybdenum 1.4 1.40e-06 2.64e-05
Nickelb 0.3 3.00e-07 5.67e-06
Seleniumb 0.038 3.80e-08 7.18e-07
Vanadium 1.0 1.00e-06 1.89e-05
aPage 1-11.bEmission factor is based only on detection limits.cMultiply emission factor, lb/MMBtu, by coal HHV, MMBtu/ton.
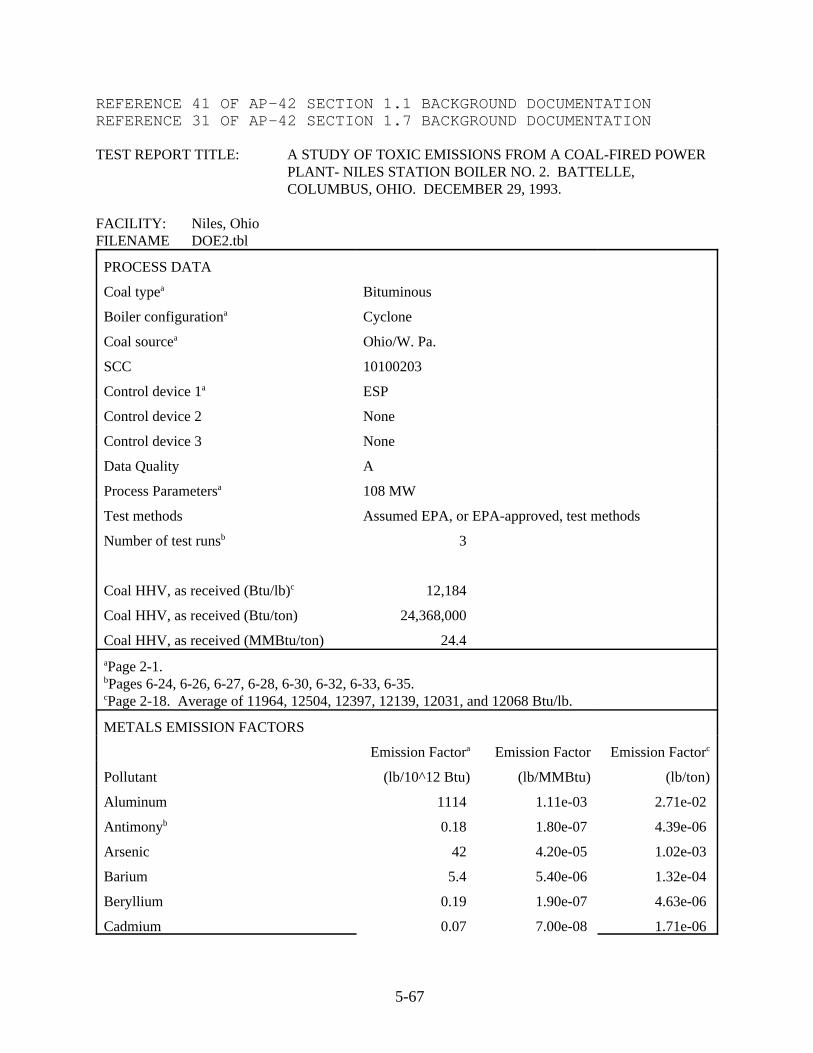
REFERENCE 41 OF AP-42 SECTION 1.1 BACKGROUND DOCUMENTATIONREFERENCE 31 OF AP-42 SECTION 1.7 BACKGROUND DOCUMENTATION
5-67
TEST REPORT TITLE: A STUDY OF TOXIC EMISSIONS FROM A COAL-FIRED POWERPLANT- NILES STATION BOILER NO. 2. BATTELLE,COLUMBUS, OHIO. DECEMBER 29, 1993.
FACILITY: Niles, OhioFILENAME DOE2.tbl
PROCESS DATA
Coal typea Bituminous
Boiler configurationa Cyclone
Coal sourcea Ohio/W. Pa.
SCC 10100203
Control device 1a ESP
Control device 2 None
Control device 3 None
Data Quality A
Process Parametersa 108 MW
Test methods Assumed EPA, or EPA-approved, test methods
Number of test runsb 3
Coal HHV, as received (Btu/lb)c 12,184
Coal HHV, as received (Btu/ton) 24,368,000
Coal HHV, as received (MMBtu/ton) 24.4 aPage 2-1.bPages 6-24, 6-26, 6-27, 6-28, 6-30, 6-32, 6-33, 6-35.cPage 2-18. Average of 11964, 12504, 12397, 12139, 12031, and 12068 Btu/lb.
METALS EMISSION FACTORS
Emission Factora Emission Factor Emission Factorc
Pollutant (lb/10^12 Btu) (lb/MMBtu) (lb/ton)
Aluminum 1114 1.11e-03 2.71e-02
Antimonyb 0.18 1.80e-07 4.39e-06
Arsenic 42 4.20e-05 1.02e-03
Barium 5.4 5.40e-06 1.32e-04
Beryllium 0.19 1.90e-07 4.63e-06
Cadmium 0.07 7.00e-08 1.71e-06

REFERENCE 41 OF AP-42 SECTION 1.1 BACKGROUND DOCUMENTATIONREFERENCE 31 OF AP-42 SECTION 1.7 BACKGROUND DOCUMENTATION
5-68
METALS EMISSION FACTORS
Emission Factora Emission Factor Emission Factorc
Pollutant (lb/10^12 Btu) (lb/MMBtu) (lb/ton)
Chromium 3.0 3.00e-06 7.31e-05
Cobaltb 0.06 6.00e-08 1.46e-06
Copper 4.0 4.00e-06 9.75e-05
Lead 1.6 1.60e-06 3.90e-05
Manganese 3.4 3.40e-06 8.29e-05
Mercury 14 1.40e-05 3.41e-04
Molybdenum 2.3 2.30e-06 5.60e-05
Nickel 0.55 5.50e-07 1.34e-05
Potassium 705 7.05e-04 1.72e-02
Selenium 62.0 6.20e-05 1.51e-03
Sodium 1767 1.77e-03 4.31e-02
Titanium 23 2.30e-05 5.60e-04
Vanadium 2.5 2.50e-06 6.09e-05 aPage 6-24, "Average" values.bPollutant was not detected in any of the sampling runs. EF is based on detection limits (1/2).cMultiply emission factor, lb/MMBtu, by coal HHV, MMBtu/ton.
AMMONIA/CYANIDE EMISSION FACTORS
Emission Factor Emission Factor Emission Factor
Pollutant (lb/10^12 Btu)a (lb/MMBtu) (lb/ton)c
Ammoniab 70 7.00e-05 1.71e-03
Cyanide 180 1.80e-04 4.39e-03 aPage 6-26, Table 6-8, "Average" values.bDetection limit values (1/2) for two runs used in developing EF.cMultiply emission factor, lb/MMBtu, by coal HHV, MMBtu/ton.
HCl, HFl EMISSION FACTORS
Emission Factor Emission Factor Emission Factor
Pollutant (lb/10^12 Btu)a (lb/MMBtu) (lb/ton)b
Hydrogen Chloride 132,049 1.32e-01 3.22e+00
Hydrogen Fluoride 8,921 8.92e-03 2.17e-01 aPage 6-27, Table 6-10, "Average" values. bMultiply emission factor, lb/MMBtu, by coal HHV, MMBtu/ton.

REFERENCE 41 OF AP-42 SECTION 1.1 BACKGROUND DOCUMENTATIONREFERENCE 31 OF AP-42 SECTION 1.7 BACKGROUND DOCUMENTATION
5-69
ORGANIC EMISSION FACTORS
Emission Factora Emission Factor Emission Factorc
Pollutant (lb/10^12 Btu) (lb/MMBtu) (lb/ton)
Chloromethane (Methyl Chloride) 4.9 4.90e-06 1.19e-04
Bromomethane (Methyl Bromide)b 3.2 3.20e-06 7.80e-05
Vinyl Chlorideb 2.5 2.50e-06 6.09e-05
Chloroethane (Ethyl Chloride)b 2.5 2.50e-06 6.09e-05
Carbon Disulfide 5.9 5.90e-06 1.44e-04
1,1-Dichloroethane (EthylideneDichloride)b
2.5 2.50e-06 6.09e-05
Chloroform b 2.5 2.50e-06 6.09e-05
1,2-Dichloroethane (EthyleneDichloride)b
2.5 2.50e-06 6.09e-05
2-Butanone (Methyl Ethyl Ketone) 5.1 5.10e-06 1.24e-04
1,1,1-Trichloroethaneb 2.5 2.50e-06 6.09e-05
Carbon Tetrachlorideb 2.5 2.50e-06 6.09e-05
Vinyl Acetateb 2.5 2.50e-06 6.09e-05
1,2-Dichloropropane (PropyleneDichloride)b
2.5 2.50e-06 6.09e-05
Trichloroetheneb 2.5 2.50e-06 6.09e-05
1,1,2-Trichloroethaneb 2.4 2.40e-06 5.85e-05
Benzene 7.9 7.90e-06 1.93e-04
1,3-Dichloropropyleneb 2.5 2.50e-06 6.09e-05
Bromoformb 2.4 2.40e-06 5.85e-05
Tetrachloroethene 3.1 3.10e-06 7.55e-05
1,1,2,2-Tetrachloroethaneb 2.5 2.50e-06 6.09e-05
Toluene 3.5 3.50e-06 8.53e-05
Chlorobenzeneb 2.5 2.50e-06 6.09e-05
Ethylbenzeneb 2.5 2.50e-06 6.09e-05
Styreneb 2.5 2.50e-06 6.09e-05
Xylenesb 2.5 2.50e-06 6.09e-05 aPage 6-28 (189 HAPs, only).bPollutant not detected in any sampling runs. EF is based on detection limits (1/2).c Multiply emission factor, lb/MMBtu, by coal HHV, MMBtu/ton.

REFERENCE 41 OF AP-42 SECTION 1.1 BACKGROUND DOCUMENTATIONREFERENCE 31 OF AP-42 SECTION 1.7 BACKGROUND DOCUMENTATION
5-70
PAH/ORGANIC EMISSION FACTORS
Emission Factora Emission Factor Emission Factorc
Pollutant (lb/10^12 Btu) (lb/MMBtu) (lb/ton)
Benzyl chlorideb 0.0059 5.90e-09 1.44e-07
Acetophenone 0.6360 6.36e-07 1.55e-05
Hexachloroethaneb 0.0059 5.90e-09 1.44e-07
Naphthalene 0.2153 2.15e-07 5.25e-06
Hexachlorobutadieneb 0.0059 5.90e-09 1.44e-07
2-Chloroacetophenone 0.2879 2.88e-07 7.02e-06
Biphenyl 0.1257 1.26e-07 3.06e-06
Acenaphthylene 0.0068 6.80e-09 1.66e-07
Acenaphthene 0.0265 2.65e-08 6.46e-07
Dibenzofurans 0.0654 6.54e-08 1.59e-06
2,4-Dinitrotoluene 0.0197 1.97e-08 4.80e-07
Fluorene 0.0313 3.13e-08 7.63e-07
Hexachlorobenzeneb 0.0059 5.90e-09 1.44e-07
Phenanthrene 0.0776 7.76e-08 1.89e-06
Anthracene 0.0207 2.07e-08 5.04e-07
Fluoranthene 0.0270 2.70e-08 6.58e-07
Pyrene 0.0139 1.39e-08 3.39e-07
Benz(a)anthracene 0.0037 3.70e-09 9.02e-08
Chrysene 0.0089 8.90e-09 2.17e-07
Benzo(b,k)fluoranthene 0.0070 7.00e-09 1.71e-07
Benzo(a)pyreneb 0.0012 1.20e-09 2.92e-08
Indeno(1,2,3-c,d)pyreneb 0.0012 1.20e-09 2.92e-08
Benzo(g,h,i)peryleneb 0.0012 1.20e-09 2.92e-08 aPage 6-30 (most common PAHs, 189 HAPs).bPollutant not detected in any sampling runs. EF is based on detection limits (1/2).cMultiply emission factor, lb/MMBtu, by coal HHV, MMBtu/ton.

REFERENCE 41 OF AP-42 SECTION 1.1 BACKGROUND DOCUMENTATIONREFERENCE 31 OF AP-42 SECTION 1.7 BACKGROUND DOCUMENTATION
5-71
DIOXINS/FURANS EMISSION FACTORS
Emission Factora Emission Factor Emission Factorc
Pollutant (lb/10^12 Btu) (lb/MMBtu) (lb/ton)
2,3,7,8-TCDDb 1.05e-06 1.05e-12 2.56e-11
OCDD 1.89e-05 1.89e-11 4.61e-10
2,3,7,8-TCDF 4.76e-06 4.76e-12 1.16e-10
OCDF 1.95e-05 1.95e-11 4.75e-10 aPage 6-32.bPollutant not detected in any sampling runs. EF is based on detection limits (1/2).cMultiply emission factor, lb/MMBtu, by coal HHV, MMBtu/ton.
ALDEHYDES EMISSION FACTORS
Emission Factora Emission Factor Emission Factorb
Pollutant (lb/10^12 Btu) (lb/MMBtu) (lb/ton)
Formaldehyde 3.9 3.90e-06 9.50e-05
Acetaldehyde 89 8.90e-05 2.17e-03
Acrolein 41 4.10e-05 9.99e-04
Propionaldehyde 25 2.50e-05 6.09e-04 aPage 6-33.bMultiply emission factor, lb/MMBtu, by coal HHV, MMBtu/ton.
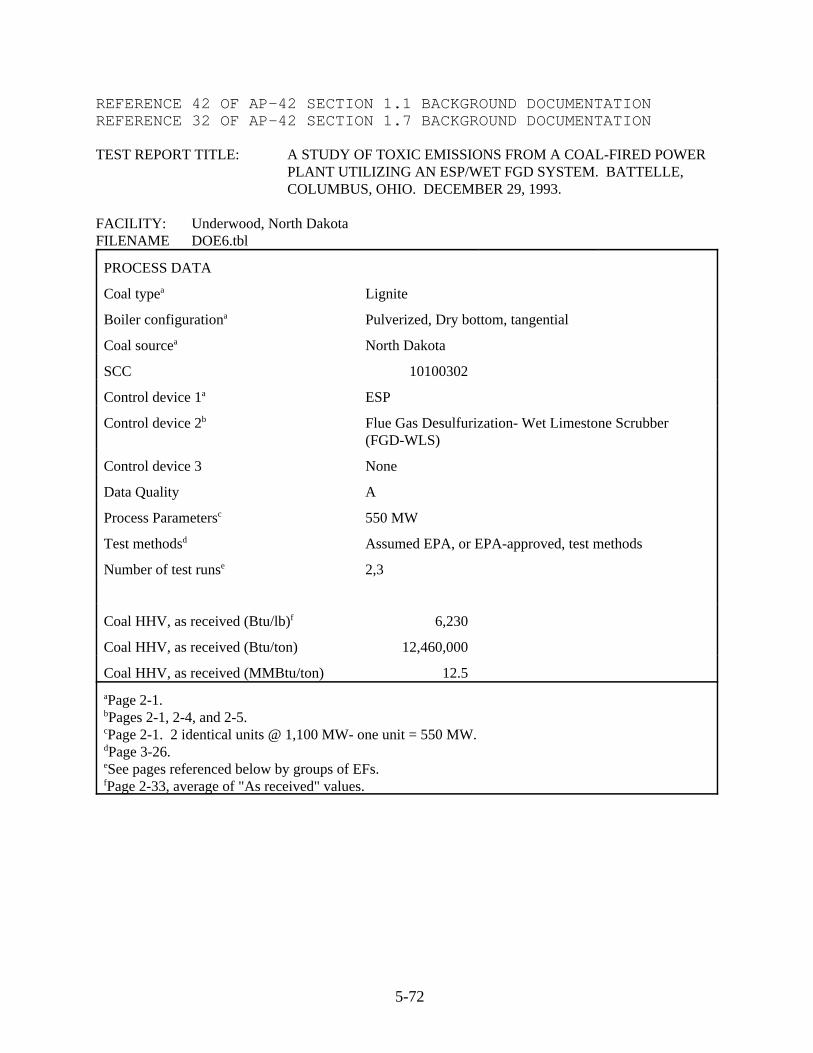
REFERENCE 42 OF AP-42 SECTION 1.1 BACKGROUND DOCUMENTATIONREFERENCE 32 OF AP-42 SECTION 1.7 BACKGROUND DOCUMENTATION
5-72
TEST REPORT TITLE: A STUDY OF TOXIC EMISSIONS FROM A COAL-FIRED POWERPLANT UTILIZING AN ESP/WET FGD SYSTEM. BATTELLE,COLUMBUS, OHIO. DECEMBER 29, 1993.
FACILITY: Underwood, North DakotaFILENAME DOE6.tbl
PROCESS DATA
Coal typea Lignite
Boiler configurationa Pulverized, Dry bottom, tangential
Coal sourcea North Dakota
SCC 10100302
Control device 1a ESP
Control device 2b Flue Gas Desulfurization- Wet Limestone Scrubber(FGD-WLS)
Control device 3 None
Data Quality A
Process Parametersc 550 MW
Test methodsd Assumed EPA, or EPA-approved, test methods
Number of test runse 2,3
Coal HHV, as received (Btu/lb)f 6,230
Coal HHV, as received (Btu/ton) 12,460,000
Coal HHV, as received (MMBtu/ton) 12.5
aPage 2-1.bPages 2-1, 2-4, and 2-5.cPage 2-1. 2 identical units @ 1,100 MW- one unit = 550 MW.dPage 3-26.eSee pages referenced below by groups of EFs.fPage 2-33, average of "As received" values.

REFERENCE 42 OF AP-42 SECTION 1.1 BACKGROUND DOCUMENTATIONREFERENCE 32 OF AP-42 SECTION 1.7 BACKGROUND DOCUMENTATION
5-73
METALS EMISSION FACTORS
Emission Factora Emission Factor Emission Factord
Pollutant (lb/10^12 Btu) (lb/MMBtu) (lb/ton)
Aluminum 578 5.78e-04 7.20e-03
Antimony 0.18 1.80e-07 2.24e-06
Arsenic 1.2 1.20e-06 1.50e-05
Barium 162 1.62e-04 2.02e-03
Berylliumb 0.85 8.50e-07 1.06e-05
Boron 19 1.90e-05 2.37e-04
Cadmiumb 1.6 1.60e-06 1.99e-05
Calcium 1308 1.31e-03 1.63e-02
Chromiumc 10.0 1.00e-05 1.25e-04
Cobalt 1.5 1.50e-06 1.87e-05
Copper 4.9 4.90e-06 6.11e-05
Lead 0.69 6.90e-07 8.60e-06
Manganese 30 3.00e-05 3.74e-04
Mercury 9.5 9.50e-06 1.18e-04
Molybdenumc 0.51 5.10e-07 6.35e-06
Nickelc 5.1 5.10e-06 6.35e-05
Potassium 109 1.09e-04 1.36e-03
Selenium 8.3 8.30e-06 1.03e-04
Sodium 218 2.18e-04 2.72e-03
Titanium 42 4.20e-05 5.23e-04
Vanadium 4.4 4.40e-06 5.48e-05
aPage 6-76, "Average" values.bPollutant was not detected in any of the sampling runs. EF is based on detection limits (1/2).cData from one run not used, EF based on data from two runs.dMultiply emission factor, lb/MMBtu, by coal HHV, MMBtu/ton.

REFERENCE 42 OF AP-42 SECTION 1.1 BACKGROUND DOCUMENTATIONREFERENCE 32 OF AP-42 SECTION 1.7 BACKGROUND DOCUMENTATION
5-74
AMMONIA/CYANIDE EMISSION FACTORS
Emission Factora Emission Factor Emission Factorc
Pollutant (lb/10^12 Btu) (lb/MMBtu) (lb/ton)
Ammoniab 1.9 1.90e-06 2.37e-05
Cyanide 51 5.10e-05 6.35e-04
aPage 6-78.bPollutant was not detected in any sampling runs. EF is based on detection limits (1/2).cMultiply emission factor, lb/MMBtu, by coal HHV, MMBtu/ton.
HCl, HFl EMISSION FACTORS
Emission Factor Emission Factor Emission Factor
Pollutant (lb/10^12 Btu)a (lb/MMBtu) (lb/ton)b
Hydrogen Chloride 1,339 1.34e-03 1.67e-02
Hydrogen Fluoride 3,976 3.98e-03 4.95e-02
aPage 6-80.bMultiply emission factor, lb/MMBtu, by coal HHV, MMBtu/ton.
ORGANIC EMISSION FACTORS
Emission Factora Emission Factor Emission Factorc
Pollutant (lb/10^12 Btu) (lb/MMBtu) (lb/ton)
Chloromethane (Methyl Chloride) 106 1.06e-04 1.32e-03
Bromomethane (Methyl Bromide) 4.3 4.30e-06 5.36e-05
Vinyl Chlorideb 3.2 3.20e-06 3.99e-05
Chloroethane (Ethyl Chloride)b 3.2 3.20e-06 3.99e-05
Carbon Disulfide 3.4 3.40e-06 4.24e-05
1,1-Dichloroethane (EthylideneDichloride)b
3.2 3.20e-06 3.99e-05
Chloroform b 3.2 3.20e-06 3.99e-05
1,2-Dichloroethane (EthyleneDichloride)
3.2 3.20e-06 3.99e-05
2-Butanone (Methyl Ethyl Ketone) 9.8 9.80e-06 1.22e-04
1,1,1-Trichloroethaneb 3.2 3.20e-06 3.99e-05
Carbon Tetrachlorideb 3.2 3.20e-06 3.99e-05
Vinyl Acetateb 3.2 3.20e-06 3.99e-05

REFERENCE 42 OF AP-42 SECTION 1.1 BACKGROUND DOCUMENTATIONREFERENCE 32 OF AP-42 SECTION 1.7 BACKGROUND DOCUMENTATION
5-75
ORGANIC EMISSION FACTORS
Emission Factora Emission Factor Emission Factorc
Pollutant (lb/10^12 Btu) (lb/MMBtu) (lb/ton)
1,2-Dichloropropane (PropyleneDichloride)b
3.2 3.20e-06 3.99e-05
Trichloroetheneb 3.2 3.20e-06 3.99e-05
1,1,2-Trichloroethaneb 3.2 3.20e-06 3.99e-05
Benzene 41 4.10e-05 5.11e-04
1,3-Dichloropropyleneb 3.2 3.20e-06 3.99e-05
Bromoform 3.1 3.10e-06 3.86e-05
Tetrachloroetheneb 3.2 3.20e-06 3.99e-05
1,1,2,2-Tetrachloroethaneb 3.2 3.20e-06 3.99e-05
Toluene 24 2.40e-05 2.99e-04
Chlorobenzene 3.3 3.30e-06 4.11e-05
Ethylbenzeneb 3.2 3.20e-06 3.99e-05
Styrene 3.3 3.30e-06 4.11e-05
Xylenes 3.5 3.50e-06 4.36e-05
aPage 6-82 (only 189 HAPs).bPollutant was not detected in any sampling runs. EF is based on detection limits (1/2).cMultiply emission factor, lb/MMBtu, by coal HHV, MMBtu/ton.
PAH/SVOC EMISSION FACTORS
Emission Factora Emission Factor Emission Factorc
Pollutant (lb/10^12 Btu) (lb/MMBtu) (lb/ton)
Naphthalene 0.2549 2.55e-07 3.18e-06
Acenaphthene 0.0173 1.73e-08 2.16e-07
Dibenzofurans 0.0516 5.16e-08 6.43e-07
2,4-Dinitrotoluene 0.0065 6.50e-09 8.10e-08
Fluorene 0.0415 4.15e-08 5.17e-07
Hexachlorobenzeneb 0.0009 9.00e-10 1.12e-08
Phenanthrene 0.3142 3.14e-07 3.91e-06
Anthracene 0.0147 1.47e-08 1.83e-07
Fluoranthene 0.0422 4.22e-08 5.26e-07

REFERENCE 42 OF AP-42 SECTION 1.1 BACKGROUND DOCUMENTATIONREFERENCE 32 OF AP-42 SECTION 1.7 BACKGROUND DOCUMENTATION
5-76
PAH/SVOC EMISSION FACTORS
Emission Factora Emission Factor Emission Factorc
Pollutant (lb/10^12 Btu) (lb/MMBtu) (lb/ton)
Pyrene 0.0162 1.62e-08 2.02e-07
Benz(a)anthracene 0.0021 2.10e-09 2.62e-08
Chrysene 0.0053 5.30e-09 6.60e-08
Benzo(b,k)fluoranthene 0.0045 4.50e-09 5.61e-08
Benzo(a)pyrene 0.0009 9.00e-10 1.12e-08
Indeno(1,2,3-c,d)pyrene 0.0006 6.00e-10 7.48e-09
Benzo(g,h,i)perylene 0.0006 6.00e-10 7.48e-09
Biphenyl 0.0230 2.30e-08 2.87e-07
Acetophenone 0.5425 5.43e-07 6.76e-06
Acenaphthylene 0.0105 1.05e-08 1.31e-07
Benzyl Chloride 0.0057 5.70e-09 7.10e-08
aPage 6-84 (most common PAHs, 189 HAPs).bPollutant was not detected in any sampling runs. EF is based on detection limits (1/2).cMultiply emission factor, lb/MMBtu, by coal HHV, MMBtu/ton.
DIOXINS/FURANS EMISSION FACTORS
Emission Factora Emission Factor Emission Factor
Pollutant (lb/10^12 Btu) (lb/MMBtu) (lb/ton)c
2,3,7,8-TCDDb 9.90e-07 9.90e-13 1.23e-11
OCDD 1.51e-05 1.51e-11 1.88e-10
2,3,7,8-TCDF 9.89e-06 9.89e-12 1.23e-10
OCDF 6.29e-06 6.29e-12 7.84e-11
aPage 6-86.bPollutant was not detected in any sampling runs. EF is based on detection limits (1/2).cMultiply emission factor, lb/MMBtu, by coal HHV, MMBtu/ton.

REFERENCE 42 OF AP-42 SECTION 1.1 BACKGROUND DOCUMENTATIONREFERENCE 32 OF AP-42 SECTION 1.7 BACKGROUND DOCUMENTATION
5-77
ALDEHYDES EMISSION FACTORS
Emission Factora Emission Factor Emission Factorc
Pollutant (lb/10^12 Btu) (lb/MMBtu) (lb/ton)
Formaldehydeb 1.8 1.80e-06 2.24e-05
Acetaldehyde 67 6.70e-05 8.35e-04
Acrolein 1.1 1.10e-06 1.37e-05
Propionaldehyde 12 1.20e-05 1.50e-04
aPage 6-88.bPollutant was not detected in any sampling runs. EF is based on detection limits (1/2).cMultiply emission factor, lb/MMBtu, by coal HHV, MMBtu/ton.

REFERENCE 43 OF AP-42 SECTION 1.1 BACKGROUND DOCUMENTATIONREFERENCE 33 OF AP-42 SECTION 1.7 BACKGROUND DOCUMENTATION
5-78
TEST REPORT TITLE: TOXICS ASSESSMENT REPORT. ILLINOIS POWER COMPANY. BALDWIN POWER STATION-UNIT 2. VOLUMES I THROUGH IV. ROY F. WESTON, INC. DECEMBER, 1993
FACILITY: Baldwin, IllinoisFILENAME DOE3.tbl
PROCESS DATA
Coal typea Bituminous
Boiler configurationa Cyclone
Coal sourcea Illinois
SCC 10100203
Control device 1b ESP
Control device 2 None
Control device 3 None
Data Quality A
Process Parametersa 568 MW
Test methodsc EPA, or EPA-approved, test methods
Number of test runsd 6 for filterable PM, 3 for other pollutants
Coal HHV, as received (Btu/lb)e 10,633
Coal HHV, as received (Btu/ton) 21,266,000
Coal HHV, as received (MMBtu/ton) 21.3
aPage 2-1.bPage 2-4.cPage 1-12.dSee pages referenced below by groups of EFs.ePage 2-23. Average of 10765, 10681, 10722, 10412, 10426 and 10794 Btu/lb, as received, non-soot blowing periods.
METALS EMISSION FACTORS
Emission Factor Emission Factor Emission Factor
Pollutant (lb/10^12 Btu)a (lb/MMBtu) (lb/ton)b
Aluminum 5.55e+03 5.55e-03 1.18e-01
Antimony 1.52e+00 1.52e-06 3.23e-05
Arsenic 1.34e+01 1.34e-05 2.85e-04
Barium 5.32e+00 5.32e-06 1.13e-04
Beryllium 1.41e+00 1.41e-06 3.00e-05

REFERENCE 43 OF AP-42 SECTION 1.1 BACKGROUND DOCUMENTATIONREFERENCE 33 OF AP-42 SECTION 1.7 BACKGROUND DOCUMENTATION
5-79
METALS EMISSION FACTORS
Emission Factor Emission Factor Emission Factor
Pollutant (lb/10^12 Btu)a (lb/MMBtu) (lb/ton)b
Boron 7.67e+03 7.67e-03 1.63e-01
Cadmium 3.02e+00 3.02e-06 6.42e-05
Calcium 3.25e+02 3.25e-04 6.91e-03
Chromium 5.06e+01 5.06e-05 1.08e-03
Cobalt 6.80e+00 6.80e-06 1.45e-04
Copper 1.89e+01 1.89e-05 4.02e-04
Iron 8.39e+03 8.39e-03 1.78e-01
Lead 2.86e+01 2.86e-05 6.08e-04
Magnesium 2.90e+02 2.90e-04 6.17e-03
Manganese 2.23e+01 2.23e-05 4.74e-04
Mercury 3.83e+00 3.83e-06 8.14e-05
Molybdenum 3.37e+01 3.37e-05 7.17e-04
Nickel 2.21e+01 2.21e-05 4.70e-04
Potassium 9.33e+02 9.33e-04 1.98e-02
Phosphorous 1.98e+02 1.98e-04 4.21e-03
Selenium 1.30e+02 1.30e-04 2.76e-03
Sodium 1.17e+03 1.17e-03 2.49e-02
Titanium 3.82e+02 3.82e-04 8.12e-03
Vanadium 1.00e+02 1.00e-04 2.13e-03
aPage 4-18, "Average" values.bMultiply emission factor, lb/MMBtu, by coal HHV, MMBtu/ton.

REFERENCE 43 OF AP-42 SECTION 1.1 BACKGROUND DOCUMENTATIONREFERENCE 33 OF AP-42 SECTION 1.7 BACKGROUND DOCUMENTATION
5-80
ORGANICS EMISSION FACTORS
Emission Factora Emission Factor Emission Factorc
Pollutant (lb/10^12 Btu) (lb/MMBtu) (lb/ton)
Phenol 1.15e+00 1.15e-06 2.45e-05
Acetophenone 1.23e+00 1.23e-06 2.62e-05
Isophorone 2.62e+01 2.62e-05 5.57e-04
Biphenylb 8.78e-01 8.78e-07 1.87e-05
Di-n-butylphthalate 3.00e+00 3.00e-06 6.38e-05
bis(2-Ethylhexyl)phthalate 4.60e+00 4.60e-06 9.78e-05
aPage 4-74.bEmission factor based on only non-detects.cMultiply emission factor, lb/MMBtu, by coal HHV, MMBtu/ton.
PAH EMISSION FACTORS
Emission Factora Emission Factor Emission Factor c
Pollutant (lb/10^12 Btu) (lb/MMBtu) (lb/ton)
Naphthalene 3.94e-01 3.94e-07 8.38e-06
Acenaphthylene 3.19e-02 3.19e-08 6.78e-07
Acenaphtheneb 6.32e-03 6.32e-09 1.34e-07
Fluorene 4.87e-03 4.87e-09 1.04e-07
Phenanthrene 5.69e-02 5.69e-08 1.21e-06
Anthracene 2.64e-03 2.64e-09 5.61e-08
Fluoranthene 1.74e-02 1.74e-08 3.70e-07
Pyrene 2.82e-03 2.82e-09 6.00e-08
Benz(a)anthraceneb 1.17e-03 1.17e-09 2.49e-08
Benzo(b,k)fluoranthene 3.91e-03 3.91e-09 8.32e-08
Benzo(a)pyreneb 5.44e-04 5.44e-10 1.16e-08
Indeno(1,2,3-c,d)pyreneb 1.11e-03 1.11e-09 2.36e-08
Benzo(g,h,i)peryleneb 1.13e-03 1.13e-09 2.40e-08
aPage 4-74.bPollutant not detected in any sampling runs. EF is based on detection limits.cMultiply emission factor, lb/MMBtu, by coal HHV, MMBtu/ton.

REFERENCE 43 OF AP-42 SECTION 1.1 BACKGROUND DOCUMENTATIONREFERENCE 33 OF AP-42 SECTION 1.7 BACKGROUND DOCUMENTATION
5-81
DIOXINS/FURANS EMISSION FACTORS
Emission Factora Emission Factor Emission Factorc
Pollutant (lb/10^12 Btu) (lb/MMBtu) (lb/ton)
2,3,7,8-TCDDb 2.54e-06 2.54e-12 5.40e-11
Total TCDD 1.34e-06 1.34e-12 2.85e-11
Total PeCDDb 7.37e-07 7.37e-13 1.57e-11
Total HxCDD 9.59e-07 9.59e-13 2.04e-11
Total HpCDD 2.53e-06 2.53e-12 5.38e-11
Total OCDDb 8.91e-06 8.91e-12 1.89e-10
2,3,7,8-TCDFb 1.27e-06 1.27e-12 2.70e-11
Total TCDFb 3.82e-06 3.82e-12 8.12e-11
Total PeCDF 3.99e-06 3.99e-12 8.49e-11
Total HxCDF 5.57e-06 5.57e-12 1.18e-10
Total HpCDF 3.17e-06 3.17e-12 6.74e-11
Total OCDF 4.15e-06 4.15e-12 8.83e-11
aPage 4-76.bPollutant not detected in any sampling runs.cMultiply emission factor, lb/MMBtu, by coal HHV, MMBtu/ton.
ALDEHYDES/KETONES EMISSION FACTORS
Emission Factora Emission Factor Emission Factorc
Pollutant (lb/10^12 Btu) (lb/MMBtu) (lb/ton)
Formaldehyde 1.68e+00 1.68e-06 3.57e-05
Acetaldehyde 1.37e+01 1.37e-05 2.91e-04
Acrolein 3.55e+00 3.55e-06 7.55e-05
Methyl Ethyl Ketone 3.70e+00 3.70e-06 7.87e-05
aPage 4-78, ESP Outlet data, only 189 HAPs.bMultiply emission factor, lb/MMBtu, by coal HHV, MMBtu/ton.

REFERENCE 43 OF AP-42 SECTION 1.1 BACKGROUND DOCUMENTATIONREFERENCE 33 OF AP-42 SECTION 1.7 BACKGROUND DOCUMENTATION
5-82
ORGANICS EMISSION FACTORS
Emission Factora Emission Factor Emission Factorc
Pollutant (lb/10^12 Btu) (lb/MMBtu) (lb/ton)
Bromomethane (Methyl Bromide) 9.70e-01 9.70e-07 2.06e-05
Carbon Disulfide 1.37e-01 1.37e-07 2.91e-06
Methylene Chlorideb 1.83e+01 1.83e-05 3.89e-04
Hexane 1.64e-01 1.64e-07 3.49e-06
Benzene 1.21e+02 1.21e-04 2.57e-03
Tolueneb 2.00e+00 2.00e-06 4.25e-05
Ethylbenzene 1.26e-01 1.26e-07 2.68e-06
Xylenes(m/p + o) 1.87e+00 1.87e-06 3.97e-05
Styrene 1.99e-01 1.99e-07 4.23e-06
aPage 4-80.bResults suspected to be biased by lab solvents, do not use.cMultiply emission factor, lb/MMBtu, by coal HHV, MMBtu/ton.

REFERENCE 44 OF AP-42 SECTION 1.1 BACKGROUND DOCUMENTATIONREFERENCE 34 OF AP-42 SECTION 1.7 BACKGROUND DOCUMENTATION
5-83
TEST REPORT TITLE: TOXICS ASSESSMENT REPORT. MINNESOTA POWERCOMPANY BOSWELL ENERGY CENTER UNIT 2. COHASSET,MINNESOTA. VOLUME 1- MAIN REPORT. ROY F. WESTON,INC. WEST CHESTER, PENNSYLVANIA. DECEMBER, 1993.
FACILITY: Cohasset, MinnesotaFILENAME DOE8.tbl
PROCESS DATA
Coal typea Subbituminous
Boiler configurationb Pulverized, Dry bottom
Coal sourcea Montana/Wyoming
SCC 10100222
Control device 1c Baghouse
Control device 2 None
Control device 3 None
Data Quality A
Process Parametersa 69 MW
Test methodsd EPA, or EPA-approved, test methods
Number of test runse 3 8,692
8,749
Coal HHV, as received (Btu/lb)f 8,798 8,839
Coal HHV, as received (Btu/ton) 17,596,000 8,815
Coal HHV, as received (MMBtu/ton) 17.6 8,871
8,820
---------------------
avg 8,798
aPage 2-1.bPage 2-1 for "pulverized", assumed dry bottom.cPage 2-4.dPage 1-12.eSee pages listing emission factors.fPage 2-23, average of 8692, 8749, 8839, 8815, 8871, 8820 Btu/lb.

REFERENCE 44 OF AP-42 SECTION 1.1 BACKGROUND DOCUMENTATIONREFERENCE 34 OF AP-42 SECTION 1.7 BACKGROUND DOCUMENTATION
5-84
METALS EMISSION FACTORS
Emission Factora Emission Factor Emission Factorc
Pollutant (lb/10^12 Btu) (lb/MMBtu) (lb/ton)
Aluminum 1.93e+03 1.93e-03 3.40e-02
Antimonyb 6.77e-01 6.77e-07 1.19e-05
Arsenic 3.24e-01 3.24e-07 5.70e-06
Barium 8.16e+01 8.16e-05 1.44e-03
Berylliumb 1.29e-01 1.29e-07 2.27e-06
Boron 6.09e+02 6.09e-04 1.07e-02
Cadmiumb 6.48e-01 6.48e-07 1.14e-05
Calcium 4.76e+02 4.76e-04 8.38e-03
Chromium 2.04e+00 2.04e-06 3.59e-05
Cobalt 7.01e-01 7.01e-07 1.23e-05
Copper 2.40e+00 2.40e-06 4.22e-05
Iron 4.12e+02 4.12e-04 7.25e-03
Lead 2.44e+00 2.44e-06 4.29e-05
Magnesium 2.05e+02 2.05e-04 3.61e-03
Manganese 1.84e+01 1.84e-05 3.24e-04
Mercury 1.93e+00 1.93e-06 3.40e-05
Molybdenum 1.29e+00 1.29e-06 2.27e-05
Nickel 1.97e+00 1.97e-06 3.47e-05
Potassium 5.71e+01 5.71e-05 1.00e-03
Phosphorous 2.67e+01 2.67e-05 4.70e-04
Selenium 3.23e+00 3.23e-06 5.68e-05
Sodium 1.97e+02 1.97e-04 3.47e-03
Titanium 5.78e+01 5.78e-05 1.02e-03
Vanadium 1.53e+00 1.53e-06 2.69e-05
aPage 4-14, "Average" values.bPollutant not detected in any sampling runs. EF is based on detection limits.cMultiply emission factor, lb/MMBtu, by coal HHV, MMBtu/ton.

REFERENCE 44 OF AP-42 SECTION 1.1 BACKGROUND DOCUMENTATIONREFERENCE 34 OF AP-42 SECTION 1.7 BACKGROUND DOCUMENTATION
5-85
ORGANICS EMISSION FACTORS
Emission Factora Emission Factor Emission Factorc
Pollutant (lb/10^12 Btu) (lb/MMBtu) (lb/ton)
n-Nitrosodimethylamineb 8.87e-01 8.87e-07 1.56e-05
Phenol 4.29e-01 4.29e-07 7.55e-06
Acetophenone 7.13e-01 7.13e-07 1.25e-05
Biphenylb 1.78e-01 1.78e-07 3.13e-06
Di-n-butylphthalateb 1.94e+00 1.94e-06 3.41e-05
bis(2-Ethylhexyl)phthalate 1.68e+00 1.68e-06 2.96e-05
aPage 4-43.bPollutant not detected in any sampling runs. EF is based on detection limits.cMultiply emission factor, lb/MMBtu, by coal HHV, MMBtu/ton.
PAH EMISSION FACTORS
Emission Factora Emission Factor Emission Factorc
Pollutant (lb/10^12 Btu) (lb/MMBtu) (lb/ton)
Naphthalene 2.53e-01 2.53e-07 4.45e-06
Acenaphthylene 5.31e-03 5.31e-09 9.34e-08
Acenaphthene 4.08e-02 4.08e-08 7.18e-07
Fluorene 8.84e-03 8.84e-09 1.56e-07
Phenanthrene 2.10e-01 2.10e-07 3.70e-06
Anthracene 6.17e-03 6.17e-09 1.09e-07
Fluoranthene 8.25e-02 8.25e-08 1.45e-06
Pyrene 3.73e-02 3.73e-08 6.56e-07
Benz(a)anthracene 4.68e-03 4.68e-09 8.23e-08
Benzo(b,j,k)fluoranthene 3.05e-03 3.05e-09 5.37e-08
Benzo(a)pyrene 2.09e-04 2.09e-10 3.68e-09
Indeno(1,2,3-c,d)pyrene 3.45e-04 3.45e-10 6.07e-09
Benzo(g,h,i)peryleneb 5.19e-04 5.19e-10 9.13e-09
aPage 4-43.bPollutant not detected in any sampling runs. EF is based on detection limits.cMultiply emission factor, lb/MMBtu, by coal HHV, MMBtu/ton.

REFERENCE 44 OF AP-42 SECTION 1.1 BACKGROUND DOCUMENTATIONREFERENCE 34 OF AP-42 SECTION 1.7 BACKGROUND DOCUMENTATION
5-86
DIOXINS/FURANS EMISSION FACTORS
Emission Factora Emission Factor Emission Factorc
Pollutant (lb/10^12 Btu) (lb/MMBtu) (lb/ton)
2,3,7,8-TCDD 8.14e-07 8.14e-13 1.43e-11
Total TCDD 9.29e-06 9.29e-12 1.63e-10
Total PeCDD 4.64e-06 4.64e-12 8.16e-11
Total HxCDD 2.10e-06 2.10e-12 3.70e-11
Total HpCDDb 1.86e-06 1.86e-12 3.27e-11
Total OCDD 1.10e-05 1.10e-11 1.94e-10
2,3,7,8-TCDF 6.03e-06 6.03e-12 1.06e-10
Total TCDF 6.04e-05 6.04e-11 1.06e-09
Total PeCDF 4.74e-05 4.74e-11 8.34e-10
Total HxCDF 2.23e-05 2.23e-11 3.92e-10
Total HpCDF 6.95e-06 6.95e-12 1.22e-10
Total OCDF 1.86e-06 1.86e-12 3.27e-11
aPage 4-45.bPollutant not detected in any sampling runs. EF is based on detection limits.cMultiply emission factor, lb/MMBtu, by coal HHV, MMBtu/ton.
ALDEHYDES/KETONES EMISSION FACTORS
Emission Factora Emission Factor Emission Factorc
Pollutant (lb/10^12 Btu) (lb/MMBtu) (lb/ton)
Formaldehydeb 1.70e+00 1.70e-06 2.99e-05
Acetaldehydeb 1.09e+00 1.09e-06 1.92e-05
Acrolein 3.40e+00 3.40e-06 5.98e-05
Methyl Ethyl Ketoneb 4.99e+00 4.99e-06 8.78e-05
aPage 4-47, ESP Outlet data, only 189 HAPs.bPollutant not detected in any sampling runs. EF is based on detection limits.cMultiply emission factor, lb/MMBtu, by coal HHV, MMBtu/ton.

REFERENCE 44 OF AP-42 SECTION 1.1 BACKGROUND DOCUMENTATIONREFERENCE 34 OF AP-42 SECTION 1.7 BACKGROUND DOCUMENTATION
5-87
VOC EMISSION FACTORS
Emission Factora Emission Factor Emission Factorc
Pollutant (lb/10^12 Btu) (lb/MMBtu) (lb/ton)
Chloroethane (ethyl chloride) 2.50e+00 2.50e-06 4.40e-05
Carbon Disulfide 1.77e+01 1.77e-05 3.11e-04
Methylene Chloride 1.07e+01 1.07e-05 1.88e-04
Hexane 1.54e+00 1.54e-06 2.71e-05
Vinyl acetateb 4.29e-01 4.29e-07 7.55e-06
2-Butanone (Methyl Ethyl Ketone) 1.64e+01 1.64e-05 2.89e-04
Benzene 1.03e-02 1.03e-08 1.81e-07
Methyl Methacrylate 1.14e+00 1.14e-06 2.01e-05
Ethylene Dibromidec 6.56e-02 6.56e-08 1.15e-06
Toluene 5.45e+00 5.45e-06 9.59e-05
Tetrachloroethene (PCE) 5.61e-01 5.61e-07 9.87e-06
Chlorobenzene 1.63e-01 1.63e-07 2.87e-06
Ethylbenzene 4.27e-01 4.27e-07 7.51e-06
Xylenes(m/p + o) 2.43e+00 2.43e-06 4.27e-05
Styrene 1.75e+00 1.75e-06 3.08e-05
Cumene 3.02e-01 3.02e-07 5.31e-06
aPage 4-49.bPollutant not detected in any sampling runs. EF is based on detection limits.cMultiply emission factor, lb/MMBtu, by coal HHV, MMBtu/ton.

REFERENCE 45 OF AP-42 SECTION 1.1 BACKGROUND DOCUMENTATIONREFERENCE 35 OF AP-42 SECTION 1.7 BACKGROUND DOCUMENTATION
5-88
TEST REPORT TITLE: ASSESSMENT OF TOXIC EMISSIONS FROM A COAL FIREDPOWER PLANT UTILIZING AN ESP. FINAL REPORT-REVISION1. ENERGY AND ENVIRONMENTAL RESEARCHCORPORATION. IRVINE, CALIFORNIA. DECEMBER 23, 1993.
FACILITY: Brilliant, Ohio, Cardinal Unit 1FILENAME DOE5.tbl
PROCESS DATA
Coal typea Bituminous
Boiler configurationb Pulverized, Dry bottom
Coal sourcea Pennysylvania
SCC 10100202
Control device 1a ESP
Control device 2 None
Control device 3 None
Data Quality C (no HHV for the coal, had to use average from AP-42)
Process Parametersa 615
Test methodsc EPA, or EPA-approved, test methods
Number of test runsd 3
Coal HHV (Btu/lb)e 13,000
Coal HHV (Btu/ton) 26,000,000
Coal HHV (MMBtu/ton) 26.0
aPage 1-1.bPage 1-1 for "pulverized", assumed dry bottom.cPage 1-4.dPage 1-5.eAppendix A of AP-42, "Typical Parameters of Various Fuels".
METALS EMISSION FACTORS
Emission Factora Emission Factor Emission Factorb
Pollutant (lb/10^12 Btu) (lb/MMBtu) (lb/ton)
Aluminum 235 2.35e-04 6.11e-03
Calcium 283 2.83e-04 7.36e-03
Iron 568 5.68e-04 1.48e-02
Magnesium 16.4 1.64e-05 4.26e-04

REFERENCE 45 OF AP-42 SECTION 1.1 BACKGROUND DOCUMENTATIONREFERENCE 35 OF AP-42 SECTION 1.7 BACKGROUND DOCUMENTATION
5-89
METALS EMISSION FACTORS
Emission Factora Emission Factor Emission Factorb
Pollutant (lb/10^12 Btu) (lb/MMBtu) (lb/ton)
Phosphorous 141 1.41e-04 3.67e-03
Potassium 88.7 8.87e-05 2.31e-03
Silicon 60.9 6.09e-05 1.58e-03
Sodium 249 2.49e-04 6.47e-03
Titanium 16.6 1.66e-05 4.32e-04
Zinc 18.3 1.83e-05 4.76e-04
Antimony 2.36 2.36e-06 6.14e-05
Arsenic 3.49 3.49e-06 9.07e-05
Barium 0.872 8.72e-07 2.27e-05
Beryllium 0.070 7.00e-08 1.82e-06
Boron 1,912 1.91e-03 4.97e-02
Cadmium 0.846 8.46e-07 2.20e-05
Chromium 7.51 7.51e-06 1.95e-04
Cobalt 0.631 6.31e-07 1.64e-05
Copper 1.39 1.39e-06 3.61e-05
Lead 3.83 3.83e-06 9.96e-05
Manganese 15.0 1.50e-05 3.90e-04
Mercury 0.448 4.48e-07 1.16e-05
Molybdenum 0.567 5.67e-07 1.47e-05
Nickel 4.72 4.72e-06 1.23e-04
Selenium 92.8 9.28e-05 2.41e-03
Silver 0.200 2.00e-07 5.20e-06
Vanadium 1.57 1.57e-06 4.08e-05
aPage 1-11.bMultiply emission factor, lb/MMBtu, by coal HHV, MMBtu/ton.

REFERENCE 45 OF AP-42 SECTION 1.1 BACKGROUND DOCUMENTATIONREFERENCE 35 OF AP-42 SECTION 1.7 BACKGROUND DOCUMENTATION
5-90
DIOXINS/FURANS EMISSION FACTORS
Emission Factora Emission Factor Emission Factorb
Pollutant (lb/10^12 Btu) (lb/MMBtu) (lb/ton)
Total TCDD 5.15e-05 5.15e-11 1.34e-09
Total HxCDD 2.23e-05 2.23e-11 5.80e-10
Total HpCDD 7.61e-06 7.61e-12 1.98e-10
Total OCDD 2.03e-05 2.03e-11 5.28e-10
2,3,7,8-TCDF 6.58e-07 6.58e-13 1.71e-11
Total PeCDF 2.79e-06 2.79e-12 7.25e-11
Total HxCDF 2.51e-05 2.51e-11 6.53e-10
Total HpCDF 2.68e-06 2.68e-12 6.97e-11
Total OCDF 1.07e-05 1.07e-11 2.78e-10
aPage 1-11.bMultiply emission factor, lb/MMBtu, by coal HHV, MMBtu/ton.
SEMIVOLATILE ORGANICS EMISSION FACTORS
Emission Factora Emission Factor Emission Factorb
Pollutant (lb/10^12 Btu) (lb/MMBtu) (lb/ton)
Benzyl Chloride 53.9 5.39e-05 1.40e-03
Isophorone 23.3 2.33e-05 6.06e-04
Dimethyl Sulfate 1.83 1.83e-06 4.76e-05
Naphthalene 1.94 1.94e-06 5.04e-05
aPage 1-11.bMultiply emission factor, lb/MMBtu, by coal HHV, MMBtu/ton.
ORGANIC EMISSION FACTORS
Emission Factora Emission Factor Emission Factorb
Pollutant (lb/10^12 Btu) (lb/MMBtu) (lb/ton)
2-Butanone (Methyl Ethyl Ketone) 48.1 4.81e-05 1.25e-03
Formaldehyde 60.0 6.00e-05 1.56e-03
Benzene 3.40 3.40e-06 8.84e-05
Bromomethane (Methyl Bromide) 15.1 1.51e-05 3.93e-04
Chloroform 2.92 2.92e-06 7.59e-05
Chloromethane (Methyl Chloride) 6.38 6.38e-06 1.66e-04

REFERENCE 45 OF AP-42 SECTION 1.1 BACKGROUND DOCUMENTATIONREFERENCE 35 OF AP-42 SECTION 1.7 BACKGROUND DOCUMENTATION
5-91
ORGANIC EMISSION FACTORS
Emission Factora Emission Factor Emission Factorb
Pollutant (lb/10^12 Btu) (lb/MMBtu) (lb/ton)
Hexane 6.53 6.53e-06 1.70e-04
m,p-Xylene 2.98 2.98e-06 7.75e-05
Methyl Hydrazine 6.57 6.57e-06 1.71e-04
Methyl Tert Butyl Ether 1.36 1.36e-06 3.54e-05
Toluene 5.16 5.16e-06 1.34e-04
aPage 1-13.bMultiply emission factor, lb/MMBtu, by coal HHV, MMBtu/ton.
OTHER EMISSION FACTORS
Emission Factora Emission Factor Emission Factorb
Pollutant (lb/10^12 Btu) (lb/MMBtu) (lb/ton)
Ammonia 40.7 4.07e-05 1.06e-03
Chlorine 1,547 1.55e-03 4.02e-02
Hydrogen Chloride 22,915 2.29e-02 5.96e-01
Hydrogen Cyanide 0.591 5.91e-07 1.54e-05
Hydrogen Fluoride 1,869 1.87e-03 4.86e-02
CO 753 7.53e-04 1.96e-02
THC 365 3.65e-04 9.49e-03
NOX 1.22e+00 3.17e+01
SOX 4.41e+00 1.15e+02
aPage 1-14. Note that SOx and NOx units are lb/MMBtu.bMultiply emission factor, lb/MMBtu, by coal HHV, MMBtu/ton.

REFERENCE 46 OF AP-42 SECTION 1.1 BACKGROUND DOCUMENTATIONREFERENCE 36 OF AP-42 SECTION 1.7 BACKGROUND DOCUMENTATION
5-92
TEST REPORT TITLE: 500-MW DEMONSTRATION OF ADVANCED WALL-FIREDCOMBUSTION TECHNIQUES FOR THE REDUCTION OFNITROGEN OXIDE (NOX) EMISSIONS FROM COAL-FIREDBOILERS. RADIAN, CORPORATION, AUSTIN, TEXAS.
FACILITY: EPRI SITE 16FILENAME SITE16.tbl
PROCESS DATA
Coal typea Bituminous
Boiler configurationb Pulverized, dry bottom
Coal sourcef Virginia/Kentucky
SCC 10100202
Control device 1a Low Nox Burners/Overfire Air (LNB/OFA)
Control device 2a ESP
Control device 3 none
Data Quality A
Process Parametersa 500 MW
Test methodsc EPA, or EPA-approved, test methods
Number of test runsd 3
Coal HHV, dry (Btu/lb)e 13,800
Coal moisture percent by weighte 3.8%
Coal HHV, as received (Btu/lb) 13,295
Coal HHV, as received (MMBtu/lb) 0.013
Coal HHV, as received (MMBtu/ton) 26.59
Coal feed rate (lb/hr,dry)e 315,000
Coal feed rate, as received, (lb/hr) 327,443
Coal feed rate, as received, (ton/hr) 164
aPage 2-1bConversation with Greg Behrens, Radian, Austin, Texas.cPage 3-1dPage 3-21, 3-22, 3-23ePage 3-7fAppendix B of EPRI Synthesis Report, page B-2

REFERENCE 46 OF AP-42 SECTION 1.1 BACKGROUND DOCUMENTATIONREFERENCE 36 OF AP-42 SECTION 1.7 BACKGROUND DOCUMENTATION
5-93
STACK EMISSION FACTORS
Pollutant (lb/10^12 Btu)a (lb/MMBtu) (lb/ton)
Arsenic 110 1.10e-04 2.92e-03
Barium 140 1.40e-04 3.72e-03
Beryllium 3.1 3.10e-06 8.24e-05
Cadmium 3.6 3.60e-06 9.57e-05
Chloride 15,000 1.50e-02 3.99e-01
Chromium 21 2.10e-05 5.58e-04
Chrome VI 5.4 5.40e-06 1.44e-04
Cobalt 6.5 6.50e-06 1.73e-04
Copper 30 3.00e-05 7.98e-04
Fluoride 5,100 5.10e-03 1.36e-01
Lead 11 1.10e-05 2.92e-04
Manganese 21 2.10e-05 5.58e-04
Mercury 4.8 4.80e-06 1.28e-04
Molybdenum 12 1.20e-05 3.19e-04
Nickel 17 1.70e-05 4.52e-04
Phosphorous 180 1.80e-04 4.79e-03
Selenium 140 1.40e-04 3.72e-03
Vanadium 41 4.10e-05 1.09e-03
Benzenec 0.51 5.10e-07 1.36e-05
Toluene 0.7 7.00e-07 1.86e-05
Formaldehyde 1.3 1.30e-06 3.46e-05
Acenaphthene 0.0081 8.10e-09 2.15e-07
Acenaphthylene 0.0030 3.00e-09 7.98e-08
Anthracene 0.0037 3.70e-09 9.84e-08
Benzo(a)pyrenec 0.0041 4.10e-09 1.09e-07
Benzo(b,j,k)fluoranthenes 0.0015 1.50e-09 3.99e-08
Benzo(g,h,i)perylenec 0.0031 3.10e-09 8.24e-08
Benz(a)anthracene 0.0070 7.00e-09 1.86e-07
Chrysene 0.0018 1.80e-09 4.79e-08

REFERENCE 46 OF AP-42 SECTION 1.1 BACKGROUND DOCUMENTATIONREFERENCE 36 OF AP-42 SECTION 1.7 BACKGROUND DOCUMENTATION
5-94
STACK EMISSION FACTORS
Pollutant (lb/10^12 Btu)a (lb/MMBtu) (lb/ton)
Fluoranthene 0.010 1.00e-08 2.66e-07
Fluorene 0.0099 9.90e-09 2.63e-07
Indeno(1,2,3-c,d)pyreneb 0.0027 2.70e-09 7.18e-08
Phenanthrene 0.044 4.40e-08 1.17e-06
Pyrene 0.011 1.10e-08 2.92e-07
aPages 3-24, 3-25. Individual run data on pages 3-21, 3-22, 3-23.

REFERENCE 47 OF AP-42 SECTION 1.1 BACKGROUND DOCUMENTATIONREFERENCE 37 OF AP-42 SECTION 1.7 BACKGROUND DOCUMENTATION
5-95
TEST REPORT TITLE: FIELD CHEMICAL EMISSIONS MONITORING REPORT: SITE 122. SOUTHERN RESEARCH INSITUTUE, BIRMINGHAM, ALABAMA. MAY, 1995.
FACILITY: EPRI SITE 122FILENAME SITE122.tbl
PROCESS DATA
Coal typea Bituminous
Boiler configurationa Cyclone
Coal sourcea Illinois
SCC 10100203
Control device 1a Electrostatic Precipitator, Cold side
Control device 2a none
Control device 3a none
Data Quality A
Process Parametersa 275 MW
Test methodsb EPA, or EPA-approved, test methods
Number of test runsc 2 for manganese, 3 for all others
Coal HHV, as fired (Btu/lb)d 12,327
Coal HHV, as fired (Btu/ton) 24,654,000
Coal HHV, as fired (MMBtu/ton) 24.7
aPage 2-1.bPage 1-3.cPages 3-17, 3-20 and 3-22.dPage 3-4.

REFERENCE 47 OF AP-42 SECTION 1.1 BACKGROUND DOCUMENTATIONREFERENCE 37 OF AP-42 SECTION 1.7 BACKGROUND DOCUMENTATION
5-96
METALS, NONMETALS AND ORGANIC EMISSION FACTORS
Emission Factora Emission Factor Emission Factorc
Pollutant (lb/10^12 Btu) (lb/MMBtu) (lb/ton)
Arsenic 220 2.20e-04 5.42e-03
Barium 69 6.90e-05 1.70e-03
Beryllium 4.0 4.00e-06 9.86e-05
Cadmium 3.6 3.60e-06 8.88e-05
Chromium 100 1.00e-04 2.47e-03
Cobalt 26 2.60e-05 6.41e-04
Lead 180 1.80e-04 4.44e-03
Manganeseb 205 2.05e-04 5.05e-03
Mercury 8.2 8.20e-06 2.02e-04
Nickel 71 7.10e-05 1.75e-03
Selenium 67 6.70e-05 1.65e-03
Vanadium 148 1.48e-04 3.65e-03
Fluorine 3.8e+03 3.80e-03 9.37e-02
Chlorine 2.3e+05 2.30e-01 5.67e+00
Sulfur (sulfur dioxide) 1.5e+06 1.50e+00 3.70e+01
Formaldehyde 0.7 7.00e-07 1.73e-05
Benzene 7.8 7.80e-06 1.92e-04
Toluene 1.9 1.90e-06 4.68e-05
aPage 3-30.bEF developed from two sampling runs. See footnote c to Table 3.10, page 3-17.cMultiply emission factor, lb/MMBtu, by coal HHV, MMBtu/ton.

5-97
TITLE: Hydrogen Chloride and Hydrogen Fluoride Emission Factors for the NAPAP EmissionInventory. EPA-600/7-85-041. October, 1985.
Filename: NAPAP.tbl
BOILER SCC DESCRIPTIONS
SourceClassification
Codes
HydrogenChloride(lb/ton)a,b
HydrogenFluoride(lb/ton)a,b
Commerical/Industrial Boilers
Bituminous and Subbituminous Coal
Firing Types
Pulverized Coal Wet Bottom 1-03-002-05/21 * 1.48 * 0.17
Pulverized Coal Dry Bottom 1-03-002-06/22
Overfeed Stoker 1-03-002-07
Underfeed Stoker 1-03-002-08
Spreader Stoker 1-03-002-09/24
Hand-fired 1-03-002-14
Pulverized Coal Dry BottomTangential
1-03-002-16/26
Atmospheric Fluidized BedCombustor
1-03-002-17/18
Cyclone Furnace 1-03-002-23
Traveling Grate Overfeed Stoker 1-03-002-25
Electric Generation & Industrial Boilers
Bituminous and Subbituminous Coal
Firing Types
Pulverized Coal Wet Bottom 1-01-002-01/21 * 1.9 * 0.23
1-02-002-01/21
Pulverized Coal Dry Bottom 1-01-002-02/22
1-02-002-02/22
Cyclone Furnace 1-01-002-03/23
1-02-002-03/23
Spreader Stoker 1-01-002-04/24
1-02-002-04/24

BOILER SCC DESCRIPTIONS
SourceClassification
Codes
HydrogenChloride(lb/ton)a,b
HydrogenFluoride(lb/ton)a,b
5-98
Traveling Grate Overfeed Stoker 1-01-002-05/25
1-02-002-25
Overfeed Stoker 1-02-002-05
Pulverized Coal Dry Bottom, 1-01-002-12/26
Tangential Firing 1-02-002-12
Atmospheric Fluidized Bed 1-01-002-17
1-01-002-18
1-02-002-17
1-02-002-18
Underfeed Stoker 1-02-002-06
Commerical/Industrial Boilers
Lignite
Firing Types
Pulverized Coal 1-03-003-05 * 0.351 * 0.063
Pulverized Coal Tangential Firing 1-03-003-06
Traveling Grate Overfeed Stoker 1-03-003-07
Spreader Stoker 1-03-003-09
Electric Generation & Industrial Boilers
Lignite
Firing Types
Pulverized Coal 1-01-003-01 0.01 0.01
1-02-003-01
Pulverized Coal Tangential Firing 1-01-003-02
1-02-003-02
Cyclone Furnace 1-01-003-03
1-02-003-03

BOILER SCC DESCRIPTIONS
SourceClassification
Codes
HydrogenChloride(lb/ton)a,b
HydrogenFluoride(lb/ton)a,b
5-99
Traveling Grate Overfeed Stoker 1-01-003-04
1-02-003-04
Spreader Stoker 1-01-003-06
1-02-003-06
Overall Average 1.2 0.15
Quality Rating B B
aPages 29, 30, 31. Factors are for both uncontrolled and controlled boilers.bAn asterisk to the left of a factor indicates that it was used in calculating the overall emission factor.
REFERENCE 48 OF AP-42 SECTION 1.1 BACKGROUND DOCUMENTATIONREFERENCE 38 OF AP-42 SECTION 1.7 BACKGROUND DOCUMENTATION


