background free cars imaging by local phase...
TRANSCRIPT
Background free CARS imaging by local phase detection
Jurna M.a, Korterik J.P.a, Otto C.b, Herek L.a and Offerhaus H.L.a
aOptical Sciences group, MESA+ Institute for Nanotechnology, Faculty of Science andTechnology (TNW), University of Twente, the Netherlands;
bBioPhysical Engineering group, MESA+ Institute for Nanotechnology, Faculty of Science andTechnology (TNW), University of Twente, the Netherlands
ABSTRACT
In this article we show that heterodyne CARS, based on a controlled and stable phase-preserving chain, can beused to measure amplitude and phase information of molecular vibration modes. The technique is validated bya comparison of the imaginary part of the heterodyne CARS spectrum to the spontaneous Raman spectrum ofpolyethylene. The detection of the phase allows for rejection of the non-resonant background from the data. Theresulting improvement of the signal to noise ratio is shown by measurements on a sample containing lipid.
Keywords: Nonlinear optics, coherent anti-Stokes Raman scattering, spectroscopy, microscopy, heterodyne,phase detection
1. INTRODUCTION
In the last decade Coherent Anti-Stokes Raman Scattering (CARS) microscopy has greatly advanced chemicalselective in-vivo imaging on biological tissue.1,2 Narrowband CARS provides high resolution detection of molec-ular transitions3 and images can be obtained at video rate.4 Coincidence between the difference frequency ofthe pump and Stokes input wavelengths with a vibrational mode of a molecule, resonantly enhances the probedCARS (anti-Stokes) output signal.5 A small amount of CARS signal is also created non-resonantly. Dependingon the ratio of resonant to non-resonant molecules in the focal volume, the non-resonant signal can overwhelma small resonant signal. Samples that contain a lot of water, such as cells, give rise to a significant non-resonantsignal, observed as a background over the full image. The intensity differences in such images are not based onchemical selectivity alone, but contain interferences between the resonant and non-resonant signal. SpontaneousRaman imaging does not suffer from the coherent addition of non-resonant background signal, but lacks oncoherent addition of the resonant signal yielding an acquisition speed for the resonant signal that is often toolow to monitor biological processes. The frequency dependence of the Raman active vibrational modes can bedescribed by the Lorenzian resonances in the spectrum of the non-linear susceptibility χ3
R(ω):
χ(3)R (ω) ∝
∑
Ωk
(ak
Ωk − ω − iΓk
), (1)
where ω = ωpump − ωStokes, Ωk is the vibrational resonance of mode k with strength ak and Γk is the full widthhalf maximum of the vibrational band. Both CARS and Raman spectra depend on χ
(3)R (ω), but in a different
way. The Raman spectrum has only vibration resonant contributions and can be expressed as:
IRaman(ω) ∝ Im[χ
(3)R (ω)
]. (2)
The CARS spectrum has resonant and non-resonant contributions. The non-resonant susceptibility χ(3)NR is
independent of frequency and introduces an offset in the real part of the resonant susceptibility. The CARSspectrum can be described as:
ICARS(ω) ∝∣∣∣χ(3)
R (ω) + χ(3)NR
∣∣∣2
. (3)
Send correspondence to H.L. Offerhaus E-mail: [email protected]

1064 n
m
CARS
SHG OPO
10
64
nm
532nm
10
64
nm
idle
rsig
na
l (L
O)
CA
RS
idle
r
10
64
nm
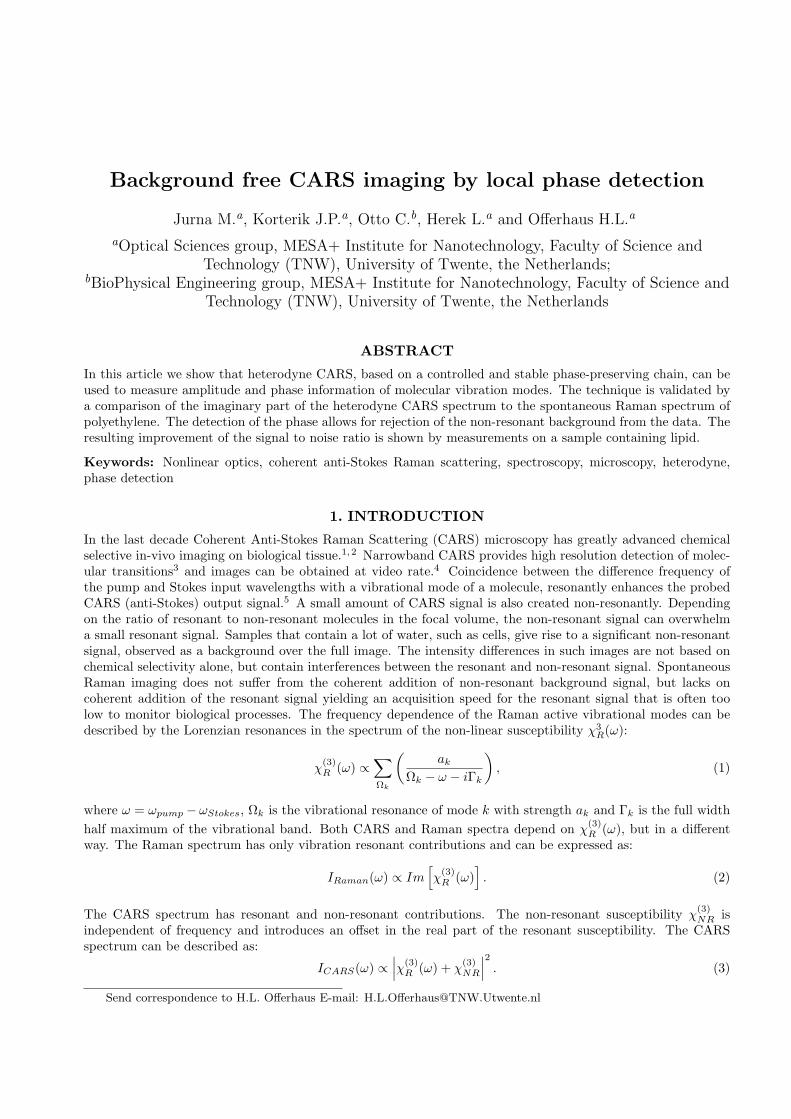
Figure 1. Energy diagram showing the optical chain for the phase-preserved generation of the wavelengths for the CARSprocess and Local Oscillator.
This shows that the Raman and CARS spectra are related to each other, but a direct comparison can onlybe achieved if both the CARS spectral amplitude and phase are measured. Interferometric detection6 providesamplitude and phase information and therefore enables CARS imaging without the background (due to e.g.water) of the non-resonant susceptibility. Interferometric detection also provides interferometric amplification.In this manuscript we focus on those situations where the detection is limited by the non-resonant backgroundrather than the detector noise; we threat only the rejection of the background.
Several methods have been explored to remove the non-resonant background in narrowband CARS, forexample PCARS (Polarization CARS)7,8 makes use of the different polarization properties of the resonantand non-resonant CARS signal. The non-resonant background can be rejected by placing an analyzer beforethe detector to select only the resonant contribution. However, when the polarization difference between theresonant and non-resonant signal is small, a large part of the resonant signal is rejected. Another establishedtechnique is epi-CARS,9 where the CARS signal is detected in the backward direction. This technique doesnot offer discrimination between resonant and non-resonant CARS signal directly but between large and smallobjects in the focal volume. Small resonant objects give rise to a CARS signal in both the forward and backwarddirection, where as the surrounding bulk medium causes only non-resonant CARS signal in the forward direction.A recently developed technique is FMCARS (Frequency Modulated CARS),10 where discrimination betweenresonant and non-resonant signal is based on modulation of the input frequency for the generation of the CARSsignal. Detection at the modulation frequency provides an image that can be compared to the spontaneousRaman image, given some assumptions for the lineshape. It requires a constant non-resonant background forfaithful reproduction of the resonant amplitude distribution. FMCARS can also be used in the spectral domainby measuring two discrete wavelengths,11 rather then the modulated integrated signal. Dual pump CARS12
measures the non-resonant background separately, requiring an extra laser input, long integration times andhigh stability. Other techniques include time-resolved CARS13 and spatial phase control CARS.14,15
In interferometric CARS6 the signal is mixed with a reference signal so that amplitude and phase can be detecteddirectly and background free images can be obtained without loss of signal. We have recorded the spectral phaseand used it to isolate the imaginary part of the heterodyne CARS spectrum, which can be directly compared tothe spontaneous Raman spectrum. The signals are in very good agreement with each other. Subsequently, wedemonstrate the use of the phase to obtain background free images.
2. INTERFEROMETRIC DETECTION
Interferometric detection mixes a reference field, the so-called Local Oscillator (LO) field, with the generatedCARS field at the anti-Stokes (AS) frequency. The total intensity on the detector can be written as:
Idetector = |ELO|2 + |EAS |2 + 2ELOEEx ·[
χ(3)NR + Re(χ(3)
R )]cosφ +
[Im(χ(3)
R )]sinφ
, (4)
where the CARS field EAS ∝ EEx
[χ
(3)R + χ
(3)NR
]and the excitation field EEx = E2
PumpEStokes. φ is the phasedifference between the excitation field and the LO field. This is the phase difference that distinguishes between

Scan area
poly
eth
yle
ne (
PE
)
Agaro
se g
el
Top view
Side view
Figure 2. Schematic of sample used for spectroscopic measurement of amplitude and phase.
the real (non-resonant) and the imaginary (resonant, Raman) part. For homodyne interferometric detection, awell-controlled and stable LO is required to interfere with the generated CARS field. This LO must be phase-and wavelength-locked to the generated CARS signal. It has been shown previously that the LO can be createdin bulk media,6,16 using a cascaded phase-preserving chain17 or by using a Polarization CARS scheme.18 Figure1 shows the energy diagram of the phase-preserving chain. The laser source (1064 nm) is partially frequencydoubled to 532 nm. The 532 nm beam synchronously pumps an Optical Parametric Oscillator (OPO), creatinga signal and idler wavelength. The CARS signal is generated with the idler from the OPO (Stokes) and thefundamental 1064 nm (pump and probe). The signal from the OPO is phase- and wavelength-locked to thegenerated CARS signal and can therefor be used as the LO.
3. SETUP
The setup is based on a Coherent Paladin Nd:YAG laser and an APE Levante Emerald OPO, which provides awell-controlled and stable LO.17 The power of the signal (LO) of the OPO is attenuated to a level within therange for shot noise limited detection19 (few nW) and is combined with the fundamental (1064nm) and the idler(both tens of mW). At this low level, the signal of the OPO does not contribute to the CARS process betweenfundamental and idler. The three beams are scanned over the sample by galvano mirrors (Olympus FluoView300, IX71) and focused by a water objective (C.A.R.S., Olympus) lens into the sample. The generated CARSsignal and the LO are collected by a collimation lens. The fundamental (ωpump) and idler (ωStokes) are filteredby two 825-150-2p bandpass filters (Chroma) and the signal is detected by a PMT. To obtain heterodyne inter-ferometric detection the CARS frequency is phase shifted by an acousto-optical modulator (AOM) in the 1064nm branch. By detecting the laser repetition rate and using a voltage controlled oscillator (VCO), an externalfrequency of 50 kHz is added to the detected laser repetition rate and applied to the AOM. This 50kHz shifton the 1064 nm is translated to a 100 kHz shift at the CARS wavelength (twice the external shift due to twophotons at 1064 nm in the CARS process). The detected intensity on the PMT is fed to a lock-in amplifier setto detect at the 100 kHz, the maximum for our lock-in amplifier (Stanford Research SR530). Higher modulationfrequencies can be used with a different lock-in amplifier.
4. VERIFICATION OF PHASE DETECTION
We first present a spectroscopic measurement of the phase over several overlapping vibrational resonances. Thelock-in amplifier is set to 1ms integration time and we use a scanning speed of 5000 pixels/sec over 256x100pixels. From the lock-in amplifier we obtain both the amplitude and phase for every pixel. The sample, shownschematically in figure 2, comprises two adjacent areas. One side consists of agarose gel, which contributesmainly to the non-resonant signal. The other side contains also polyethylene (PE), which gives mostly resonantsignal. Scanning the sample reveals a phase step between the non-resonant and resonant sides of the sample.The height of the phase step depends on the spectral position with respect to the vibrational resonance of PE.Due to the small scan area, there is no phase difference caused by the curvature of the field of view, as wasverified by measurements on a sample containing only resonant material. The measured amplitude and phase

2600 2700 2800 2900 3000 3100 3200
0
0.5
1.0
1.5
2.0
Norm
. C
AR
S a
mplit
ude
Wavenumber [cm ]-1
2600 2700 2800 2900 3000 3100 3200
200
300
2600 2700 2800 2900 3000 3100 3200
200
250
300
350
Phase [degre
es]
0
0.5
1.0
2600 2700 2800 2900 3000 3100 3200
Wavenumber [cm ]-1
2600 2700 2800 2900 3000 3100 32002600 2700 2800 2900 3000 3100 3200
Im[ ( )]c wR
(3)
SpontaneousRaman
No
rm.
am
plit
ud
e
No
rm.
Inte
nsity
0
0.5
1.0
A
B
Figure 3. A) The CARS amplitude spectrum of the resonant PE (blue circles) and the associated phase of the spectrum(green squares). The symbols are data and the solid curves are fits based on multiple Lorenzian bands as in Eq. 1. B)
The red dotted line is the spontaneous Raman spectrum of PE and in the blue the Imχ(3)R (ω) of the data in panel A is
shown.
are shown in figure 3A. While tuning the OPO through the high frequency vibrational spectrum of PE, severalmeasurements are recorded and averaged for each region in the sample. The averages are corrected for intensityvariations of the input wavelengths. The phase is determined as the difference in phase between the non-resonantand the resonant side of the image. To show that the phase data is in agreement with the amplitude data, thecomplex dataset, containing both the phase and amplitude information, is fitted to four vibrational levels of PEshown in the CARS spectrum, modeled as Lorenzians bands (Eq. 1), with a real offset for the non-resonantbackground. The fit results in the solid curves for the amplitude and phase as shown in figure 3A, indicating thatthe measured phase and the spectral amplitude are directly related, as predicted. The phase has an additionaloffset of 8 degrees due to the refractive index difference between PE and agarose gel. The graph shows the phasedifference between the driving field (difference frequency between pump and Stokes) and the motion of the dipolesin the sample. When the driving frequency is low (left) the response is dominated by the non-resonant response(no phase difference). As the first resonance (2700 cm−1) is approached, the phase of the resonant response lagsbut since this response is weak the phase does not rise to a full difference of π. Subsequent stronger resonancespull the phase much further down. Above the resonances the non-resonant response starts to dominate again,returning the phase difference to zero.
A direct comparison to the spontaneous Raman spectrum of PE can now be made. Figure 3B shows thecomparison, in blue the imaginary part of the complex dataset and the fit of the CARS measurement are shownand the red dotted line shows the spontaneous Raman spectrum. The agreement between the fit and the Ramandata indicates that the setup is capable of accurate phase detection.

00
0.5
1.0
1.5
2.0
0
5
10
15
-3
-2
-1
0
1
2
3
0
5
10
15
10 20 30 0 10 20 30 0 10 20 30 0 10 20 30
Norm
. In
tensity
Norm
.A
mplit
ude
Norm
.A
mplit
ude
Phase [ra
d]
Distance [ m]m Distance [ m]m Distance [ m]m Distance [ m]m
A B C D
E F G H
1 2 3 4
Figure 4. The sample (35x35µm) contains lipid suspended in agarose gel imaged at 2845 cm−1. A) Forward intensityCARS image obtained with 1064nm (pump and probe) and idler (Stokes). B) Amplitude image obtained with heterodyne
CARS. C) Phase image obtained with heterodyne CARS. D) Imχ(3)R , the non-resonant free image of the sample. E-H)
Cross sections of the image above at the thin line at the bottom.
5. BACKGROUND REJECTION
To demonstrate the capability of heterodyne CARS detection for background free imaging, a sample consisting oflipids suspended in agarose gel is scanned. Figure 4 shows the CARS intensity signal generated by the idler and1064 nm. The images consist of 152x152 pixels. Figure 4A is scanned at 5000 pixels/sec and measured directly,4B,C are scanned at 600pixels/sec and show the signal after the lock-in amplifier, with an integration time of3ms/pixel. We have selected a cross section (4E) at a position (indicated by the green line) where the lipid canhardly be seen for figure 4A. In contrast, using heterodyne CARS, figure 4B,C are obtained, which show theamplitude and the related phase of the image respectively. The amplitude image shows several large lipid regionsand some smaller ones. The cross section (figure 4F,G) intersects 4 of the lipid regions, as numbered in panel 4B.The smallest lipid region (number 1) has only a signal to noise ratio of 1.5 due to the strong non-resonant signalof the agarose gel. Analyzing the phase image shows that this first region causes a clear phase step compared tothe non-resonant signal, which has a flat phase profile across the image. To obtain the background free image,the phase φ should be fixed at 1/2π with respect to the non-resonant phase (φ = 0), see also Eq. 4. By assigningthe phase in between the lipid regions (yellow in figure 4C) to the non-resonant phase, an absolute phase isobtained between the LO and the CARS signal and the resonant part can be extracted. The correspondingimage is shown in figure 4D. The first lipid region is now clearly revealed at a signal to noise ratio of >15.
6. COMPOSITION ANALYSIS
When the phase measurement are corrected for phase curvature over the field of view, phase drift and phasedifferences due to refractive index changes and the amplitude is also corrected for differences in collection efficiencyover the field of view, a more quantitative composition analysis of the measured data becomes possible. Figure5C shows the (corrected) values for all pixels in image 5A,B as points in the complex plane. The scatter plotis allowed to saturate at various positions to highlight the subtle features. The sample (commercial low-fatmayonnaise) contains water, oil and protein. The non-resonant response (mostly water) is located close tothe real axis at an amplitude around 210. The values found in the center of the droplets have an amplitudearound 610 at a phase angle of 43o degrees. These we assign to high-density oil content. For linear mixing oftwo substances one would expect a line from the point of one pure substance to the point of the other puresubstance. In this case it can be seen that the oil and water do not mix. The values that correspond to the oil

−500 0 500 1000−200
0
200
400
600
800
1000Complex planeamplitude
100 150 200 250
−600
−400
−200
0
200
400
600
phase
50 100 150 200 250
50
100
150
200
250−3
−2
−1
0
1
2
3
Figure 5. A) Amplitude and B) phase of a sample of commercial low-fat mayonnaise. C) scatterplot of the measuredcomplex amplitudes
are however highly scattered and seem to mix with a value at lower amplitude and somewhat higher angle. Wetentatively assign this value to the protein content of the sample. It can be seen that for the smallest dropletsthe limited resolution effectively mixes the values in the samples and a band is created between the protein andthe water. Although this analysis is still quite crude it can be seen that a plot of the signal positions in thecomplex plane allows for the identification or separation of multiple substances if the excitation wavelength ischosen appropriately. Mixing behaviour or inhomogeneity of substances can also be observed. In situ probing ofmixing of known substances should be possible in this way.
7. CONCLUSIONS
We have demonstrated that heterodyne CARS, based on a phase preserving chain, can be used to determineamplitude and phase information of the χ(3) of Raman active vibration modes. A comparison of the imaginarypart of the heterodyne signal to the spontaneous Raman spectrum reveals the accuracy of the information. Ap-plying this technique to imaging, we show an order of magnitude improvement in the signal of the amplitude tonoise by the suppression of the non-resonant background using the phase.
ACKNOWLEDGMENTS
This research is supported by NanoNed, a nanotechnology programme of the Dutch Ministry of Economic Affairsand partly financed by the Stichting voor Fundamenteel Onderzoek der Materie (FOM), which is financiallysupported by the Nederlandse Organisatie voor Wetenschappelijk Onderzoek (NWO). We also acknowledgeCoherent Inc. for the use of the Paladin laser and APE Berlin for the collaboration and use of a LevanteEmerald OPO. Futhermore we would like to thank Ir. L. Hartsuiker (BPE) for her help with the acquisition ofthe Raman spectra.
REFERENCES[1] Hellerer, T., Axaeng, C., Brackmann, C., Hillertz, P., Pilon, M., and Enejder, A., “Monitoring of lipid
storage in caenorhabditis elegans using coherent anti-stokes raman scattering (cars) microscopy,” Proc.Natl. Acad. Sci. U. S. A. 104, 14658–14663 (SEP 11 2007).
[2] Nan, X., Potma, E., and Xie, X., “Nonperturbative chemical imaging of organelle transport in living cellswith coherent anti-stokes raman scattering microscopy,” Biophys. J. 91, 728–735 (JUL 15 2006).
[3] Jurna, M., Korterik, J., Offerhaus, H., and Otto, C., “Noncritical phase-matched lithium triborate opticalparametric oscillator for high resolution coherent anti-stokes raman scattering spectroscopy and microscopy,”Appl. Phys. Lett. 89, 251116 (2006).
[4] Evans, C., Potma, E., Puoris’haag, M., Cote, D., Lin, C., and Xie, X., “Chemical imaging of tissue in vivowith video-rate coherent anti-Stokes Raman scattering microscopy,” Proc. Natl. Acad. Sci. U. S. A. 102,16807–16812 (2005).
[5] Cheng, J. and Xie, X., “Coherent anti-stokes raman scattering microscopy: Instrumentation, theory, andapplications,” J. Phys. Chem. B 108, 827–840 (JAN 22 2004).

[6] Potma, E., Evans, C., and Xie, X., “Heterodyne coherent anti-stokes raman scattering (cars) imaging,” Opt.Lett. 31, 241–243 (JAN 15 2006).
[7] Akhmanov, S., Bunkin, A., Ivanov, S., and Koroteev, N., “Polarization active raman spectroscopy andcoherent raman ellipsometry,” Sov.Phys. JETP 47, 667 (1978).
[8] Cheng, J., Book, L., and Xie, X., “Polarization coherent anti-stokes raman scattering microscopy,” Opt.Lett. 26, 1341–1343 (SEP 1 2001).
[9] Volkmer, A., Cheng, J., and Xie, X., “Vibrational imaging with high sensitivity via epidetected coherentanti-stokes raman scattering microscopy,” Phys. Rev. Lett. 8702 (JUL 9 2001).
[10] Ganikhanov, F., Evans, C., Saar, B., and Xie, X., “High-sensitivity vibrational imaging with frequencymodulation coherent anti-stokes raman scattering (fm cars) microscopy,” Opt. Lett. 31(12), 1872–1874(2006).
[11] Yoo, Y., Lee, D., and Cho, H., “Differential two-signal picosecond-pulse coherent anti-stokes raman scatter-ing imaging microscopy by using a dual-mode optical parametric oscillator,” Opt. Lett. 32(22), 3254–3256(2007).
[12] Burkacky, O., Zumbusch, A., Brackmann, C., , and Enejder, A., “Dual-pump coherent anti-stokes-ramanscattering microscopy,” Opt. Lett 31, 3656–3658 (DEC 15 2006).
[13] Volkmer, A., Book, L., and Xie, X., “Time-resolved coherent anti-stokes raman scattering microscopy:Imaging based on raman free induction decay,” Appl. Phys. Lett. 80, 1505 (2002).
[14] de Boeij, W., Kanger, H., Lucassen, G., Otto, C., and Greve, J., “Waveguide cars spectroscopy: A newmethod for background suppression, using dielectric layers as a model,” Appl. Spectrosc. 47, 723–730 (1993).
[15] Krishnamachari, V. and Potma, E., “Focus-engineered coherent anti-stokes raman scattering: A numericalinvestigation,” J. Opt. Soc. Am. A 24, 1138–1147 (2007).
[16] Andresen, E., Keiding, S., and Potma, E., “Picosecond anti-stokes generation in a photonic-crystal fiber forinterferometric cars microscopy,” Opt. Express 14, 7246–7251 (AUG 7 2006).
[17] Jurna, M., Buttner, E., Korterik, J., Otto, C., Rimke, I., and Offerhaus, H., “Shot noise limited heterodynedetection of cars signals,” Proc. SPIE 6860, 68600R (2008).
[18] Lu, F., Zheng, W., and Huang, Z., “Heterodyne polarization coherent anti-stokes raman scattering mi-croscopy,” Appl. Phys. Lett. 92 (MAR 24 2008).
[19] Jurna, M., Korterik, J. P., Otto, C., and Offerhaus, H. L., “Shot noise limited heterodyne detection of carssignals,” Opt. Express 15, 15207–15213 (NOV 12 2007).