background material: 2000-10 diesel fuel effects study: particulate size characterization ·...
TRANSCRIPT
SwRI 08.02062.003
LOCOMOTIVE FUEL EFFECTS STUDY:PARTICULATE SIZE CHARACTERIZATION
By
Steven G. FritzE. Robert Fanick
FINAL REPORT
Prepared For
CALIFORNIA AIR RESOURCES BOARDSTATIONARY SOURCE DIVISION - FUELS SECTION
P.O. BOX 2815SACRAMENTO, CA 95814
JANUARY 2000
iSwRI REPORT 08.02062.003
FOREWORD
This project was performed for the California Air Resources Board (ARB) under SwRIProject 08-02062-003. The technical representative for ARB was Mr. Tony Brasil, StationarySource Division - Fuels Section. The Principal Investigator was Mr. E. Robert Fanick, SeniorResearch Scientist, and the Project Manager for this work was Mr. Steven G. Fritz, SeniorResearch Engineer, both in the Department of Emissions Research. Mr. Michael J.Dammann, Group Leader in the Chemistry and Chemical Engineering Division, wasresponsible for the elemental analyses. SwRI technical personnel involved in engineoperation, emissions sampling, and emissions analysis included Messrs. C. Eddie Grinstead,William L. Shackelford, and Ernesto San Miguel, all in the Department of EmissionsResearch. Ms. Yolanda Rodriguez and Ms. Kelley L. Strate performed the chemical analysis.Data reduction was performed by Ms. Kathleen M. Jack, Ms. Deborah A. Liston, and Ms.Sylvia G. Nino, also all in the Department of Emissions Research.
iiSwRI REPORT 08.02062.003
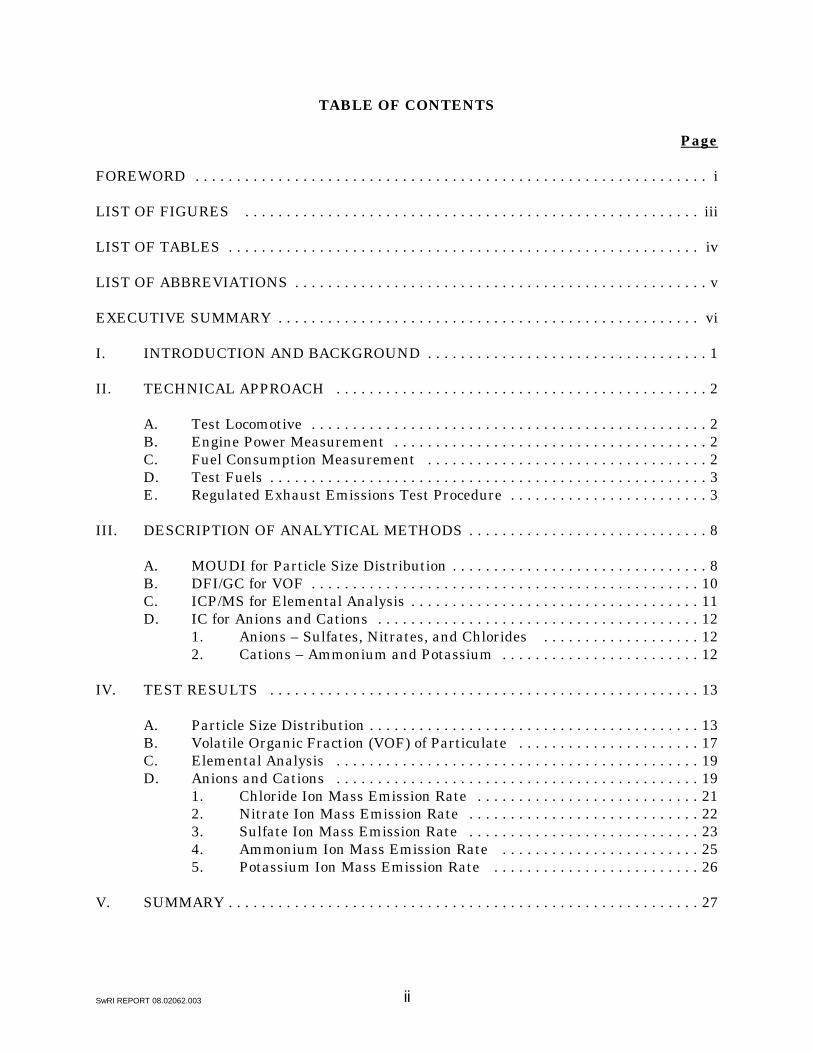
TABLE OF CONTENTS
Page
FOREWORD . . . . . . . . . . . . . . . . . . . . . . . . . . . . . . . . . . . . . . . . . . . . . . . . . . . . . . . . . . . . . . i
LIST OF FIGURES . . . . . . . . . . . . . . . . . . . . . . . . . . . . . . . . . . . . . . . . . . . . . . . . . . . . . . . iii
LIST OF TABLES . . . . . . . . . . . . . . . . . . . . . . . . . . . . . . . . . . . . . . . . . . . . . . . . . . . . . . . . . iv
LIST OF ABBREVIATIONS . . . . . . . . . . . . . . . . . . . . . . . . . . . . . . . . . . . . . . . . . . . . . . . . . . v
EXECUTIVE SUMMARY . . . . . . . . . . . . . . . . . . . . . . . . . . . . . . . . . . . . . . . . . . . . . . . . . . . vi
I. INTRODUCTION AND BACKGROUND . . . . . . . . . . . . . . . . . . . . . . . . . . . . . . . . . . 1
II. TECHNICAL APPROACH . . . . . . . . . . . . . . . . . . . . . . . . . . . . . . . . . . . . . . . . . . . . . 2
A. Test Locomotive . . . . . . . . . . . . . . . . . . . . . . . . . . . . . . . . . . . . . . . . . . . . . . . . 2B. Engine Power Measurement . . . . . . . . . . . . . . . . . . . . . . . . . . . . . . . . . . . . . . 2C. Fuel Consumption Measurement . . . . . . . . . . . . . . . . . . . . . . . . . . . . . . . . . . 2D. Test Fuels . . . . . . . . . . . . . . . . . . . . . . . . . . . . . . . . . . . . . . . . . . . . . . . . . . . . . 3E. Regulated Exhaust Emissions Test Procedure . . . . . . . . . . . . . . . . . . . . . . . . 3
III. DESCRIPTION OF ANALYTICAL METHODS . . . . . . . . . . . . . . . . . . . . . . . . . . . . . 8
A. MOUDI for Particle Size Distribution . . . . . . . . . . . . . . . . . . . . . . . . . . . . . . . 8B. DFI/GC for VOF . . . . . . . . . . . . . . . . . . . . . . . . . . . . . . . . . . . . . . . . . . . . . . . 10C. ICP/MS for Elemental Analysis . . . . . . . . . . . . . . . . . . . . . . . . . . . . . . . . . . . 11D. IC for Anions and Cations . . . . . . . . . . . . . . . . . . . . . . . . . . . . . . . . . . . . . . . 12
1. Anions – Sulfates, Nitrates, and Chlorides . . . . . . . . . . . . . . . . . . . 122. Cations – Ammonium and Potassium . . . . . . . . . . . . . . . . . . . . . . . . 12
IV. TEST RESULTS . . . . . . . . . . . . . . . . . . . . . . . . . . . . . . . . . . . . . . . . . . . . . . . . . . . . 13
A. Particle Size Distribution . . . . . . . . . . . . . . . . . . . . . . . . . . . . . . . . . . . . . . . . 13B. Volatile Organic Fraction (VOF) of Particulate . . . . . . . . . . . . . . . . . . . . . . 17C. Elemental Analysis . . . . . . . . . . . . . . . . . . . . . . . . . . . . . . . . . . . . . . . . . . . . 19D. Anions and Cations . . . . . . . . . . . . . . . . . . . . . . . . . . . . . . . . . . . . . . . . . . . . 19
1. Chloride Ion Mass Emission Rate . . . . . . . . . . . . . . . . . . . . . . . . . . . 212. Nitrate Ion Mass Emission Rate . . . . . . . . . . . . . . . . . . . . . . . . . . . . 223. Sulfate Ion Mass Emission Rate . . . . . . . . . . . . . . . . . . . . . . . . . . . . 234. Ammonium Ion Mass Emission Rate . . . . . . . . . . . . . . . . . . . . . . . . 255. Potassium Ion Mass Emission Rate . . . . . . . . . . . . . . . . . . . . . . . . . 26
V. SUMMARY . . . . . . . . . . . . . . . . . . . . . . . . . . . . . . . . . . . . . . . . . . . . . . . . . . . . . . . . . 27
iiiSwRI REPORT 08.02062.003
LIST OF FIGURES
Figure Page
1 Emissions Test Setup Used for Particulate Sampling . . . . . . . . . . . . . . . . . . . . . . . . 6
2 Isokinetic Particulate Sample Probe Used Within Dilution Tunnel
For Particle Sizing Measurements . . . . . . . . . . . . . . . . . . . . . . . . . . . . . . . . . 7
3 MOUDI Particle Size System Used at Locomotive Test Center . . . . . . . . . . . . . . . . 8
4 Particulate Collected on One of the Impaction Plates of a MOUDI Stage . . . . . . . . . 9
5 GE Locomotive Engine Particulate Size Distribution . . . . . . . . . . . . . . . . . . . . . . . 15
6 Particle Size Distribution at Idle . . . . . . . . . . . . . . . . . . . . . . . . . . . . . . . . . . . . . . . 16
7 Particle Size Distribution at Notch 8 . . . . . . . . . . . . . . . . . . . . . . . . . . . . . . . . . . . . 16
8 VOF at Idle . . . . . . . . . . . . . . . . . . . . . . . . . . . . . . . . . . . . . . . . . . . . . . . . . . . . . . . . . 18
9 VOF at Notch 8 . . . . . . . . . . . . . . . . . . . . . . . . . . . . . . . . . . . . . . . . . . . . . . . . . . . . . 18
10 Chloride Ion Mass Emission Rate at Idle . . . . . . . . . . . . . . . . . . . . . . . . . . . . . . . . . 21
11 Chloride Ion Mass Emission Rate at Notch 8 . . . . . . . . . . . . . . . . . . . . . . . . . . . . . . 21
12 Nitrate Ion Mass Emission Rate at Idle . . . . . . . . . . . . . . . . . . . . . . . . . . . . . . . . . . 22
13 Nitrate Ion Mass Emission Rate at Notch 8 . . . . . . . . . . . . . . . . . . . . . . . . . . . . . . . 22
14 Dry Sulfate Ion Mass Emission Rate at Idle . . . . . . . . . . . . . . . . . . . . . . . . . . . . . . 24
15 Dry Sulfate Ion Mass Emission Rate at Notch 8 . . . . . . . . . . . . . . . . . . . . . . . . . . . 24
16 Ammonium Ion Mass Emission Rate at Idle . . . . . . . . . . . . . . . . . . . . . . . . . . . . . . 25
17 Ammonium Ion Mass Emission Rate at Notch 8 . . . . . . . . . . . . . . . . . . . . . . . . . . . 25
18 Potassium Ion Mass Emission Rate at Idle . . . . . . . . . . . . . . . . . . . . . . . . . . . . . . . 26
19 Potassium Ion Mass Emission Rate at Notch 8 . . . . . . . . . . . . . . . . . . . . . . . . . . . . 26
ivSwRI REPORT 08.02062.003
LIST OF TABLES
Table Page
1 Selected Properties of the Two Locomotive Test Fuels . . . . . . . . . . . . . . . . . . . . . . . 4
2 Test Fuel Metals Analysis Results . . . . . . . . . . . . . . . . . . . . . . . . . . . . . . . . . . . . . . . 5
3 Elements Studies by ICP/MS . . . . . . . . . . . . . . . . . . . . . . . . . . . . . . . . . . . . . . . . . . 11
4 GE Locomotive Engine Particulate Emission Size Distribution Summary . . . . . . . 14
5 Volatile Organic Fraction (VOF) of Particulate . . . . . . . . . . . . . . . . . . . . . . . . . . . . 17
6 Exhaust Anion and Cation Mass Emissions . . . . . . . . . . . . . . . . . . . . . . . . . . . . . . . 20
7 Sulfate Mass Emission Summary . . . . . . . . . . . . . . . . . . . . . . . . . . . . . . . . . . . . . . . 23
vSwRI REPORT 08.02062.003
LIST OF ABBREVIATIONS
AAR Association of American RailroadsARB California Air Resources BoardAPI American Petroleum InstituteASTM American Society for Testing and MaterialsBTU British Thermal Unit°C degrees Centigradecc cubic centimeterCFR Code of Federal RegulationscSt centistokesDFI/GC™ direct filter injection, gas chromatographyEMD Electro-Motive Division of General Motors CorporationEP end pointEPA U.S. Environmental Protection Agency°F degrees FahrenheitFID flame ionization detectorFTP Federal Test Procedureg gramgal gallonGE Transportation Systems Division of the General Electric CompanyH2O waterhp horsepowerhr hourIBP initial boiling pointIC Ion ChromatographyICP/MS inductively-coupled plasma/mass spectroscopyin inchL literslb poundmin minutemm millimeterMOUDI micro-orifice uniform deposition impactorNIST National Institute of Standards and TechnologyOEM original equipment manufacturerPM particulate matterppm parts per millionsec secondsSOF soluble organic fractionSwRI Southwest Research InstituteUP Union Pacific RailroadVOF volatile organic fractionwt weight% percentFm micrometer (1 × 10!6 meter), micron
viSwRI REPORT 08.02062.003
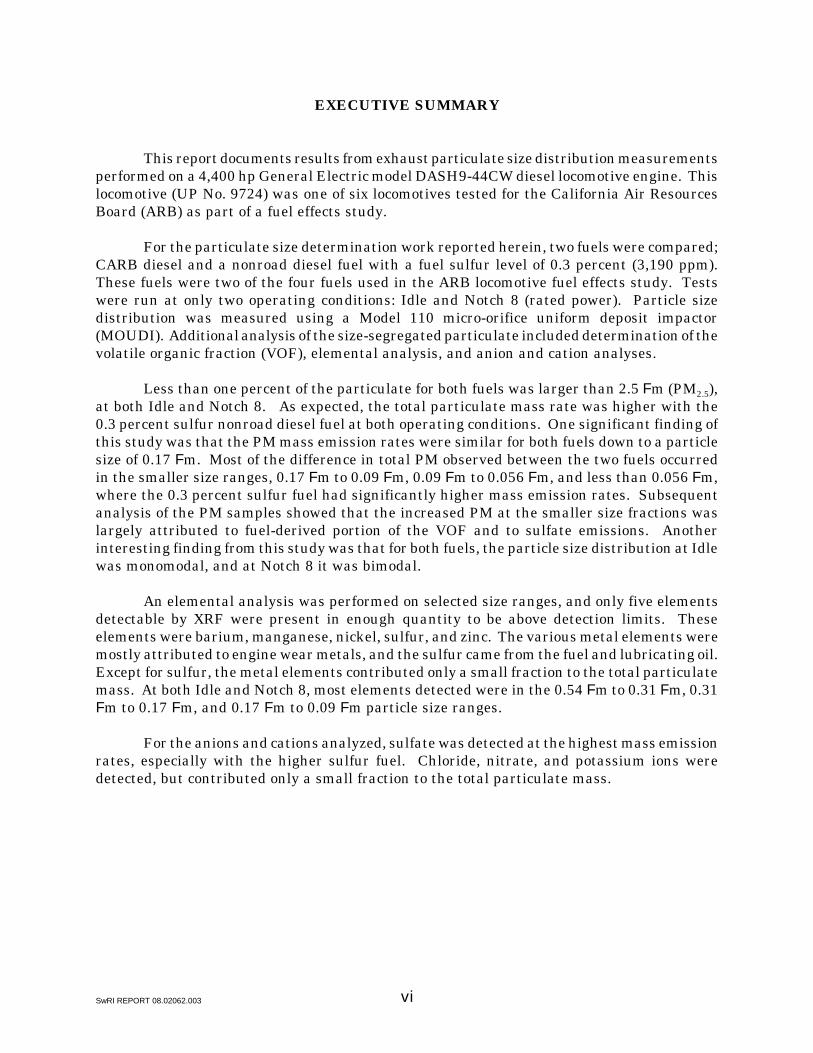
EXECUTIVE SUMMARY
This report documents results from exhaust particulate size distribution measurementsperformed on a 4,400 hp General Electric model DASH9-44CW diesel locomotive engine. Thislocomotive (UP No. 9724) was one of six locomotives tested for the California Air ResourcesBoard (ARB) as part of a fuel effects study.
For the particulate size determination work reported herein, two fuels were compared;CARB diesel and a nonroad diesel fuel with a fuel sulfur level of 0.3 percent (3,190 ppm).These fuels were two of the four fuels used in the ARB locomotive fuel effects study. Testswere run at only two operating conditions: Idle and Notch 8 (rated power). Particle sizedistribution was measured using a Model 110 micro-orifice uniform deposit impactor(MOUDI). Additional analysis of the size-segregated particulate included determination of thevolatile organic fraction (VOF), elemental analysis, and anion and cation analyses.
Less than one percent of the particulate for both fuels was larger than 2.5 Fm (PM2.5),at both Idle and Notch 8. As expected, the total particulate mass rate was higher with the0.3 percent sulfur nonroad diesel fuel at both operating conditions. One significant finding ofthis study was that the PM mass emission rates were similar for both fuels down to a particlesize of 0.17 Fm. Most of the difference in total PM observed between the two fuels occurredin the smaller size ranges, 0.17 Fm to 0.09 Fm, 0.09 Fm to 0.056 Fm, and less than 0.056 Fm,where the 0.3 percent sulfur fuel had significantly higher mass emission rates. Subsequentanalysis of the PM samples showed that the increased PM at the smaller size fractions waslargely attributed to fuel-derived portion of the VOF and to sulfate emissions. Anotherinteresting finding from this study was that for both fuels, the particle size distribution at Idlewas monomodal, and at Notch 8 it was bimodal.
An elemental analysis was performed on selected size ranges, and only five elementsdetectable by XRF were present in enough quantity to be above detection limits. Theseelements were barium, manganese, nickel, sulfur, and zinc. The various metal elements weremostly attributed to engine wear metals, and the sulfur came from the fuel and lubricating oil.Except for sulfur, the metal elements contributed only a small fraction to the total particulatemass. At both Idle and Notch 8, most elements detected were in the 0.54 Fm to 0.31 Fm, 0.31Fm to 0.17 Fm, and 0.17 Fm to 0.09 Fm particle size ranges.
For the anions and cations analyzed, sulfate was detected at the highest mass emissionrates, especially with the higher sulfur fuel. Chloride, nitrate, and potassium ions weredetected, but contributed only a small fraction to the total particulate mass.
1SwRI REPORT 08.02062.003
I. INTRODUCTION AND BACKGROUND
This project was an experimental program intended to characterize the size distributionof exhaust particles from a locomotive engine. Particulate characterization by particle sizeincluded the volatile organic carbon content, elemental analysis, and anion and cation massemission rates. The work was performed to determine the particulate composition and howthe particulate characteristics change in relation to the size of particle. Exhaust emission andfuel consumption measurements were performed using a 4,400 hp, General Electric (GE),model DASH9-44CW locomotive, provide by Union Pacific Railroad (UP).
The EPA definition of an engine exhaust particulate is any material collected on afluorocarbon-coated glass fiber or fluorocarbon-based (membrane) filter, from a dilute exhauststream, at a sample zone temperature less than 52EC (125EF). For particulate measurement,the engine’s raw exhaust is typically diluted in a tunnel, which is generally about 8 to 18inches in diameter and about 20 feet long. The dilution ratio generally ranges from 2:1 to 20:1,depending on engine operating conditions, tunnel air flow capacity, and system controlcharacteristics required to meet the sample zone temperature requirements. For a givenengine, the number and size of particles in the exhaust are functions of many variablesincluding the sample probe location in the plume. The predominant size range in terms oftotal mass is larger than 0.1 micron, and in terms of number of particles, the predominant sizeis below 0.1 micron. The dependence of particle size and number on sample probe location isdirectly related to the temperature, dilution, and "age" of the particles. As engine exhaustcools, the higher molecular weight gaseous hydrocarbons begin to condense into aerosols, theparticles tend to agglomerate, and adsorption of hydrocarbons may occur. Each mechanismresults in larger and heavier particles.
In this study, the aerodynamic diameter is defined as the diameter of a unit densitysphere (1 g/cc) having the same settling speed in air as the measured particle. Sizing devicessuch as cascade impactors use aerodynamic principles to size particles. In an impactor, asample containing particles with a mixture of shapes and densities is fractionated andcollected according to aerodynamic characteristics. As the sample stream passes throughstages in the impactor with apertures of decreasing width or diameter, flow is accelerated andprogressively smaller particles collect on impaction plates. Particles which areaerodynamically equivalent in size to the unit density spheres are collected on specific stages,calibrated under similar conditions. The mass collected on each stage indicates the percentageof particles within a specific aerodynamic diameter range.
2SwRI REPORT 08.02062.003
II. TECHNICAL APPROACH
Testing was performed at the Southwest Research Institute (SwRI) LocomotiveExhaust Emissions Test Center in San Antonio, Texas. This unique facility was establishedin 1993 in cooperation with the Association of American Railroads (AAR), and is the only non-original equipment manufacturer (non-OEM) facility capable of performing locomotive exhaustemission tests.
Presented below is an overview of the technical approach used to conduct locomotiveexhaust emissions testing for this study. A description of the locomotive selected for testing,engine power measurement, fuel consumption measurement, the test fuels used in thisprogram, exhaust emissions test procedures, and particulate measurement procedures are alsoincluded. Analytical procedures for particulate characterization are included in Section III ofthis report.
A. Test Locomotive
Exhaust particulate size distribution measurements were performed on a GeneralElectric (GE) model DASH9-44CW diesel locomotive engine. This locomotive, UP No. 9724,was one of six locomotives tested for the California Air Resources Board (ARB) as part of a fueleffects study. UP No. 9724 was manufactured in July 1994, and has the serial number 47870.It was equipped with a 4,400 hp, GE model 7FDL16N62, turbocharged diesel engine (SN970815R), which was remanufactured by GE in August 1997.
B. Engine Power Measurement
Most line-haul locomotives are equipped with the "dynamic brake" feature in which theelectric motors used for traction are reverse-excited to become generators to slow the train.The electrical power generated is dissipated in resistance grids. Those locomotives with theself-load feature can dissipate the main alternator power into these "dynamic brake"resistance grids. UP. No. 9724 was equipped with resistance load grids that were capable ofloading the engine to its full power level of 4,400 hp.
The goal of power measurements was to compute the net engine power produced toperform work, referred to as flywheel or “gross” power. Gross power for the GE locomotivewas recorded from the on-board computer display. Gross power represents the sum of“traction power” plus “auxiliary power.”
C. Fuel Consumption Measurement
Diesel fuel consumption rate was measured on a mass basis, using a mass flow meteradapted from laboratory use at SwRI. The system was equipped with a heat exchanger tocontrol fuel supply temperature to 90±10°F. Hot return fuel from the engine that normallyreturns to the locomotive fuel tank was cooled before returning to the fuel measurementreservoir ("day" tank) to assure consistent fuel supply temperature to the engine.
3SwRI REPORT 08.02062.003
D. Test Fuels
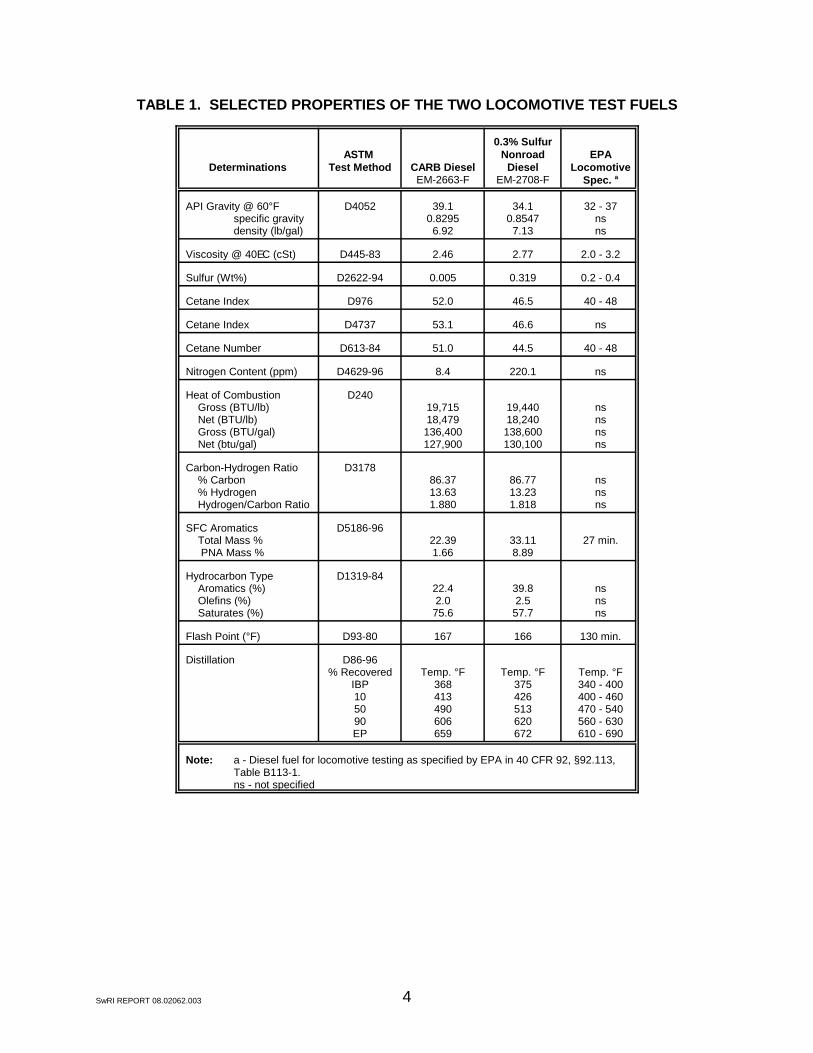
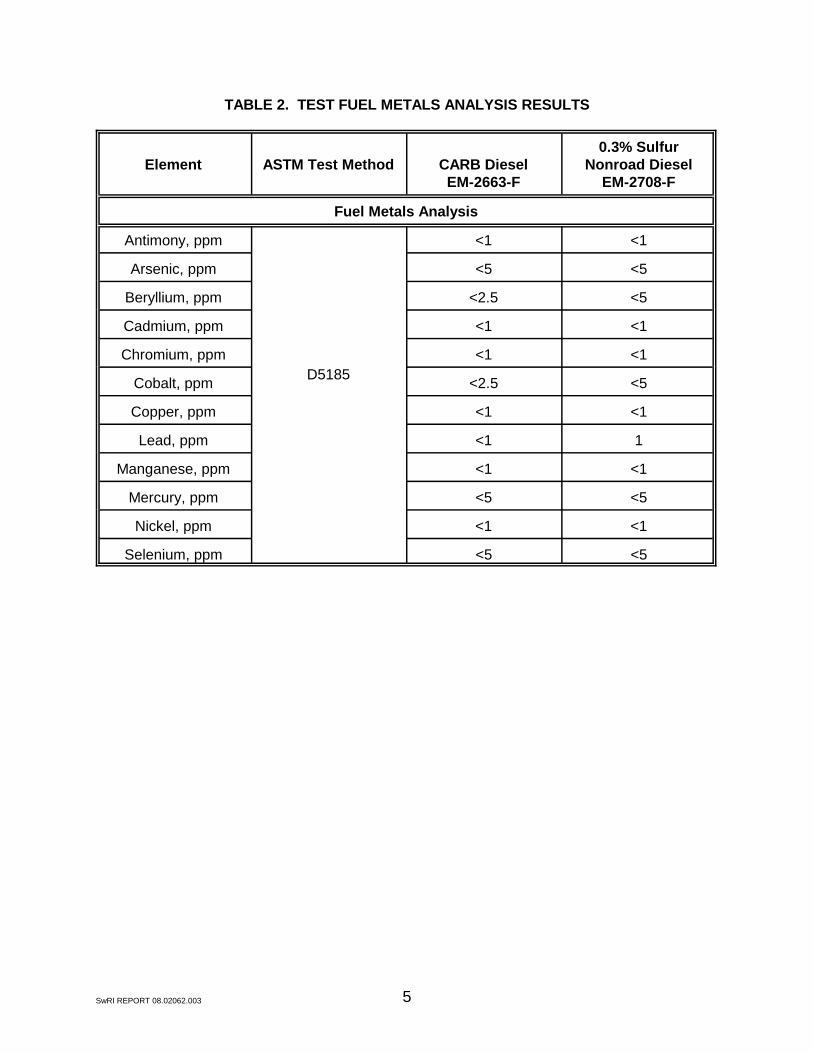
Two fuels were used for this particulate characterization study. The first fuel was a0.3 percent sulfur nonroad diesel fuel, with an aromatic level of about 40 percent and a cetanenumber of 44.5. The second fuel was a blend of two commercially available CARB diesel fuelswith a sulfur level of 50 ppm (0.005 percent) and an aromatic content of 22 percent by volume.This fuel consisted of 8,000 gallons of commercially available CARB-approved diesel fuel fromthe Texaco refinery in Los Angeles, California plus another 8,000 gallons of commercially-available CARB-approved diesel fuel from the ARCO refinery in South Gate, California. Eachfuel was delivered to the SwRI Locomotive Exhaust Emissions Test Center by truck and thefuels were mixed in a single railroad tank car. Table 1 gives selected properties for the twofuels. Table 2 gives the results of a metals analysis of the two fuels.
E. Regulated Exhaust Emissions Test Procedure
SwRI used the Federal Test Procedure (FTP) for locomotives as detailed in 40 CFR Part92, Subpart B as the basis for emission measurement techniques. For this study, two throttlenotch settings were used: Idle and Notch 8.
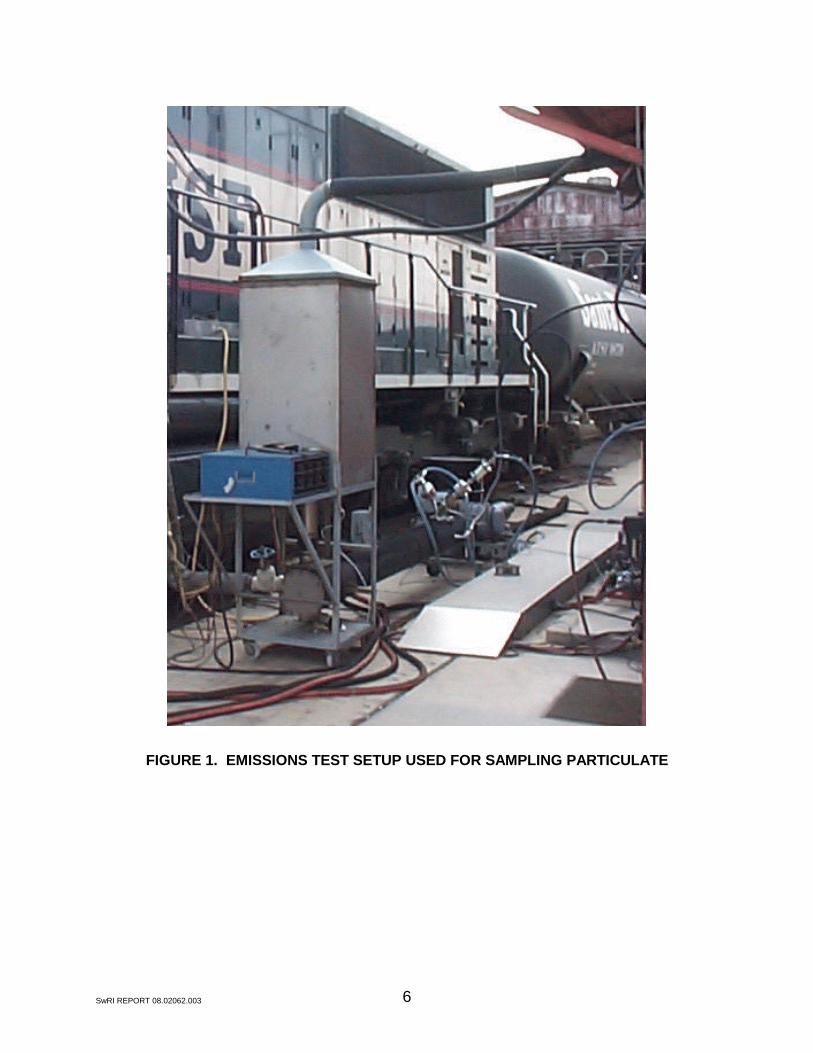
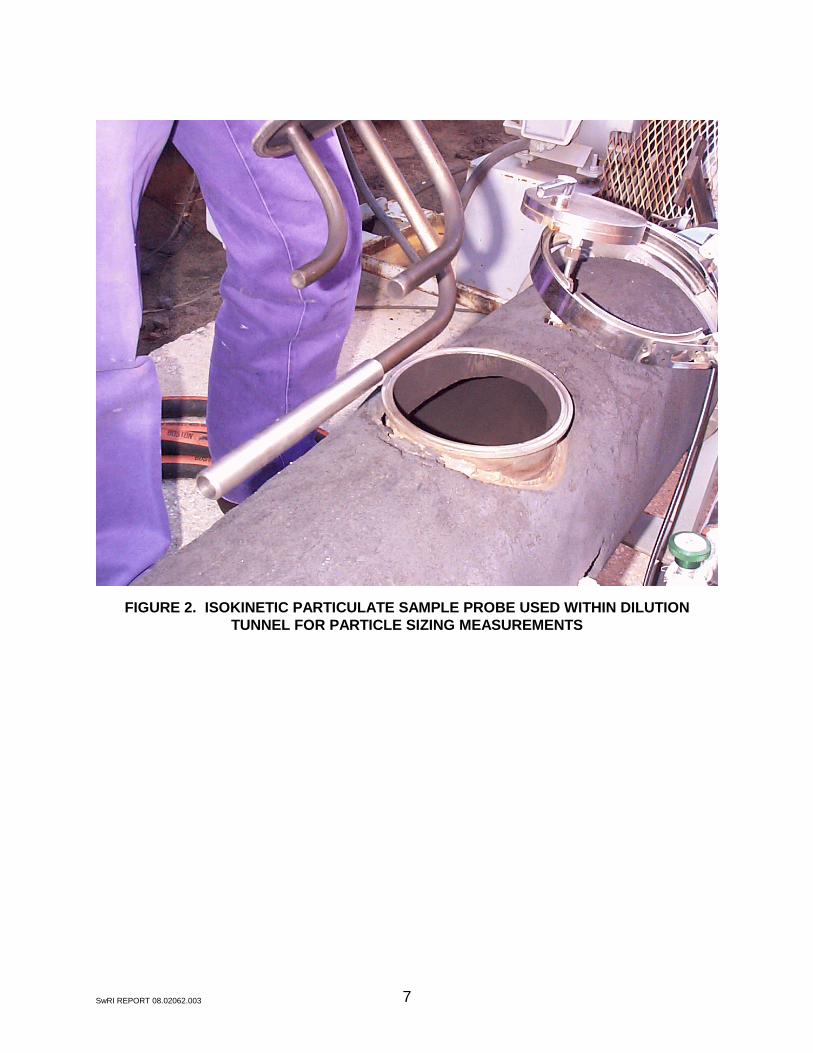
Particulate emissions were measured at each test point using a "split then dilute"technique, in which a portion of the raw locomotive exhaust was “split” off of the total flow andmixed with filtered air in a 10-inch diameter dilution tunnel. The split sample wastransferred to the dilution tunnel through a 2-inch diameter stainless steel tube that wasinsulated and electrically heated to 375°F. This dilution tunnel was located at ground level,next to the locomotive, as shown in Figure 1. Particulate samples from the dilute exhaustwere collected using an isokinetic sampling probe shown in Figure 2.
Before emission testing was started, the engine was first brought to operatingtemperature. This procedure involved operating the locomotive at Notch 8 for at least 15minutes. After the warm-up period, testing began with Idle using the 0.3 percent sulfur fuel.Four consecutive repeat tests were performed to collect sufficient samples for the variousanalytical procedures. The engine was then brought to Notch 8, and the sequence of fourconsecutive tests was repeated. After a fuel change to the CARB diesel, the sampling sequencewas repeated at Idle and Notch 8.
4SwRI REPORT 08.02062.003
TABLE 1. SELECTED PROPERTIES OF THE TWO LOCOMOTIVE TEST FUELS
DeterminationsASTM
Test Method CARB DieselEM-2663-F
0.3% SulfurNonroad
DieselEM-2708-F
EPALocomotive
Spec. a
API Gravity @ 60°Fspecific gravitydensity (lb/gal)
D4052 39.10.82956.92
34.10.85477.13
32 - 37nsns
Viscosity @ 40EC (cSt) D445-83 2.46 2.77 2.0 - 3.2
Sulfur (Wt%) D2622-94 0.005 0.319 0.2 - 0.4
Cetane Index D976 52.0 46.5 40 - 48
Cetane Index D4737 53.1 46.6 ns
Cetane Number D613-84 51.0 44.5 40 - 48
Nitrogen Content (ppm) D4629-96 8.4 220.1 ns
Heat of Combustion Gross (BTU/lb) Net (BTU/lb) Gross (BTU/gal) Net (btu/gal)
D24019,71518,479136,400127,900
19,44018,240138,600130,100
nsnsnsns
Carbon-Hydrogen Ratio % Carbon % Hydrogen Hydrogen/Carbon Ratio
D317886.3713.631.880
86.7713.231.818
nsnsns
SFC Aromatics Total Mass % PNA Mass %
D5186-9622.391.66
33.118.89
27 min.
Hydrocarbon Type Aromatics (%) Olefins (%) Saturates (%)
D1319-8422.42.0
75.6
39.82.5
57.7
nsnsns
Flash Point (°F) D93-80 167 166 130 min.
Distillation D86-96% Recovered
IBP105090EP
Temp. °F368413490606659
Temp. °F375426513620672
Temp. °F340 - 400400 - 460470 - 540560 - 630610 - 690
Note: a - Diesel fuel for locomotive testing as specified by EPA in 40 CFR 92, §92.113,Table B113-1.ns - not specified
5SwRI REPORT 08.02062.003
TABLE 2. TEST FUEL METALS ANALYSIS RESULTS
Element ASTM Test Method CARB DieselEM-2663-F
0.3% SulfurNonroad Diesel
EM-2708-F
Fuel Metals Analysis
Antimony, ppm
D5185
<1 <1
Arsenic, ppm <5 <5
Beryllium, ppm <2.5 <5
Cadmium, ppm <1 <1
Chromium, ppm <1 <1
Cobalt, ppm <2.5 <5
Copper, ppm <1 <1
Lead, ppm <1 1
Manganese, ppm <1 <1
Mercury, ppm <5 <5
Nickel, ppm <1 <1
Selenium, ppm <5 <5
6SwRI REPORT 08.02062.003
FIGURE 1. EMISSIONS TEST SETUP USED FOR SAMPLING PARTICULATE
7SwRI REPORT 08.02062.003
FIGURE 2. ISOKINETIC PARTICULATE SAMPLE PROBE USED WITHIN DILUTIONTUNNEL FOR PARTICLE SIZING MEASUREMENTS
8SwRI REPORT 08.02062.003
III. DESCRIPTION OF ANALYTICAL METHODS
This section of the report describes the analytical methods used for assessing particlesize distribution of particulate emissions, and the subsequent chemical characterization of theparticulate collected.
A. MOUDI for Particle Size Distribution
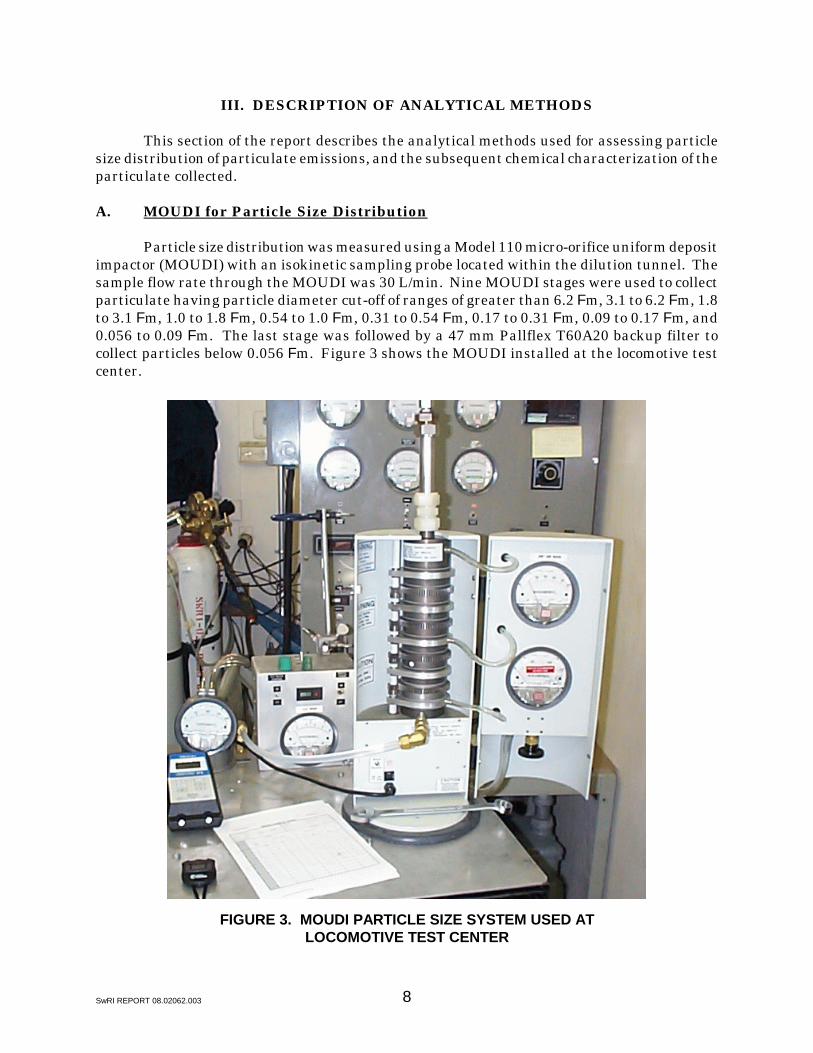
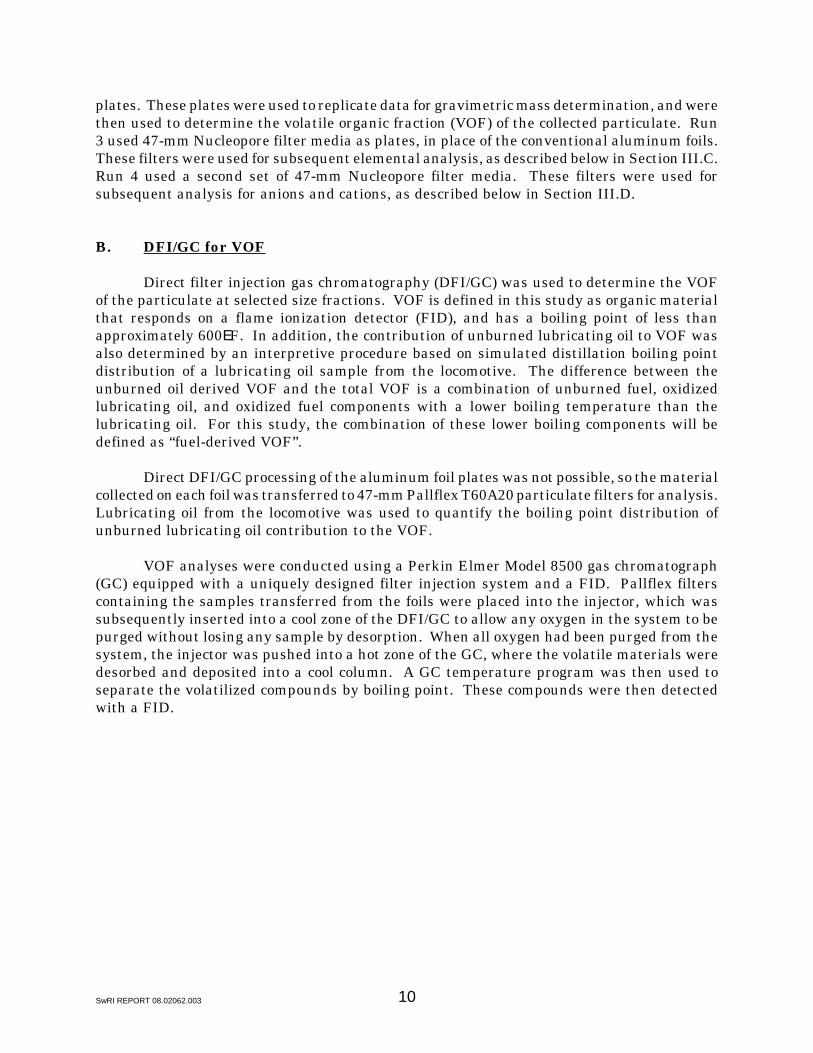
Particle size distribution was measured using a Model 110 micro-orifice uniform depositimpactor (MOUDI) with an isokinetic sampling probe located within the dilution tunnel. Thesample flow rate through the MOUDI was 30 L/min. Nine MOUDI stages were used to collectparticulate having particle diameter cut-off of ranges of greater than 6.2 Fm, 3.1 to 6.2 Fm, 1.8to 3.1 Fm, 1.0 to 1.8 Fm, 0.54 to 1.0 Fm, 0.31 to 0.54 Fm, 0.17 to 0.31 Fm, 0.09 to 0.17 Fm, and0.056 to 0.09 Fm. The last stage was followed by a 47 mm Pallflex T60A20 backup filter tocollect particles below 0.056 Fm. Figure 3 shows the MOUDI installed at the locomotive testcenter.
FIGURE 3. MOUDI PARTICLE SIZE SYSTEM USED ATLOCOMOTIVE TEST CENTER
9SwRI REPORT 08.02062.003
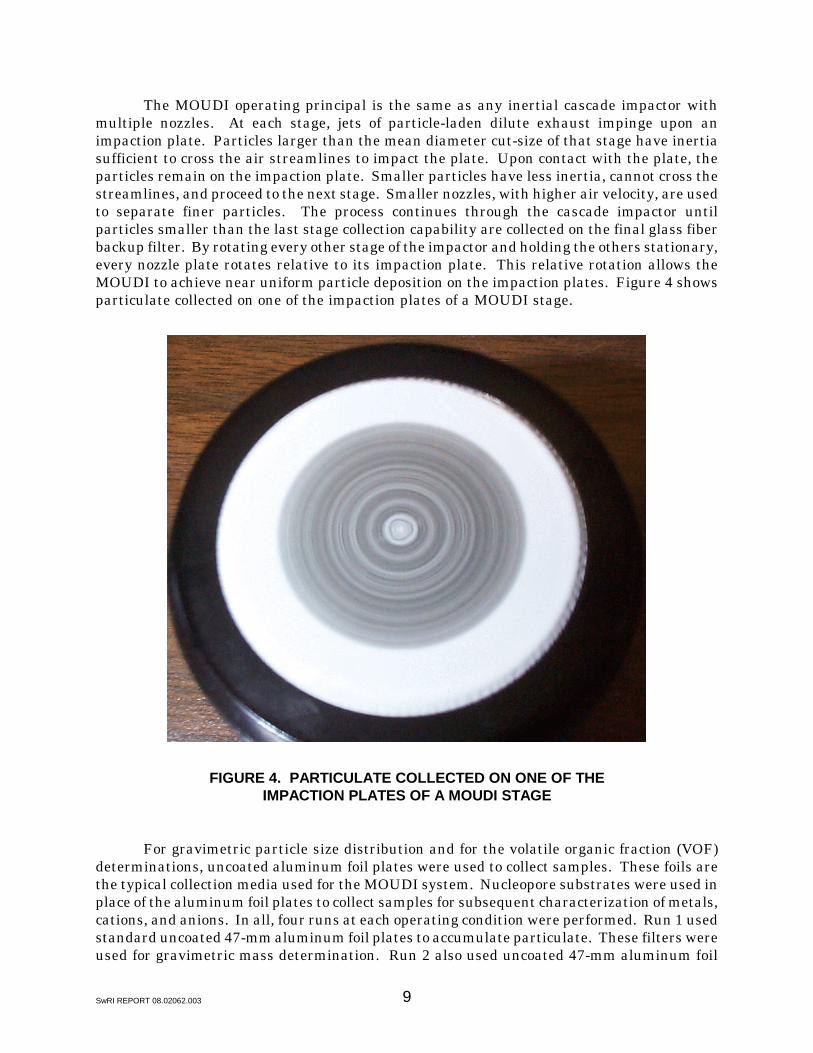
The MOUDI operating principal is the same as any inertial cascade impactor withmultiple nozzles. At each stage, jets of particle-laden dilute exhaust impinge upon animpaction plate. Particles larger than the mean diameter cut-size of that stage have inertiasufficient to cross the air streamlines to impact the plate. Upon contact with the plate, theparticles remain on the impaction plate. Smaller particles have less inertia, cannot cross thestreamlines, and proceed to the next stage. Smaller nozzles, with higher air velocity, are usedto separate finer particles. The process continues through the cascade impactor untilparticles smaller than the last stage collection capability are collected on the final glass fiberbackup filter. By rotating every other stage of the impactor and holding the others stationary,every nozzle plate rotates relative to its impaction plate. This relative rotation allows theMOUDI to achieve near uniform particle deposition on the impaction plates. Figure 4 showsparticulate collected on one of the impaction plates of a MOUDI stage.
FIGURE 4. PARTICULATE COLLECTED ON ONE OF THEIMPACTION PLATES OF A MOUDI STAGE
For gravimetric particle size distribution and for the volatile organic fraction (VOF)determinations, uncoated aluminum foil plates were used to collect samples. These foils arethe typical collection media used for the MOUDI system. Nucleopore substrates were used inplace of the aluminum foil plates to collect samples for subsequent characterization of metals,cations, and anions. In all, four runs at each operating condition were performed. Run 1 usedstandard uncoated 47-mm aluminum foil plates to accumulate particulate. These filters wereused for gravimetric mass determination. Run 2 also used uncoated 47-mm aluminum foil
10SwRI REPORT 08.02062.003
plates. These plates were used to replicate data for gravimetric mass determination, and werethen used to determine the volatile organic fraction (VOF) of the collected particulate. Run3 used 47-mm Nucleopore filter media as plates, in place of the conventional aluminum foils.These filters were used for subsequent elemental analysis, as described below in Section III.C.Run 4 used a second set of 47-mm Nucleopore filter media. These filters were used forsubsequent analysis for anions and cations, as described below in Section III.D.
B. DFI/GC for VOF
Direct filter injection gas chromatography (DFI/GC) was used to determine the VOFof the particulate at selected size fractions. VOF is defined in this study as organic materialthat responds on a flame ionization detector (FID), and has a boiling point of less thanapproximately 600EF. In addition, the contribution of unburned lubricating oil to VOF wasalso determined by an interpretive procedure based on simulated distillation boiling pointdistribution of a lubricating oil sample from the locomotive. The difference between theunburned oil derived VOF and the total VOF is a combination of unburned fuel, oxidizedlubricating oil, and oxidized fuel components with a lower boiling temperature than thelubricating oil. For this study, the combination of these lower boiling components will bedefined as “fuel-derived VOF”.
Direct DFI/GC processing of the aluminum foil plates was not possible, so the materialcollected on each foil was transferred to 47-mm Pallflex T60A20 particulate filters for analysis.Lubricating oil from the locomotive was used to quantify the boiling point distribution ofunburned lubricating oil contribution to the VOF.
VOF analyses were conducted using a Perkin Elmer Model 8500 gas chromatograph(GC) equipped with a uniquely designed filter injection system and a FID. Pallflex filterscontaining the samples transferred from the foils were placed into the injector, which wassubsequently inserted into a cool zone of the DFI/GC to allow any oxygen in the system to bepurged without losing any sample by desorption. When all oxygen had been purged from thesystem, the injector was pushed into a hot zone of the GC, where the volatile materials weredesorbed and deposited into a cool column. A GC temperature program was then used toseparate the volatilized compounds by boiling point. These compounds were then detectedwith a FID.
11SwRI REPORT 08.02062.003
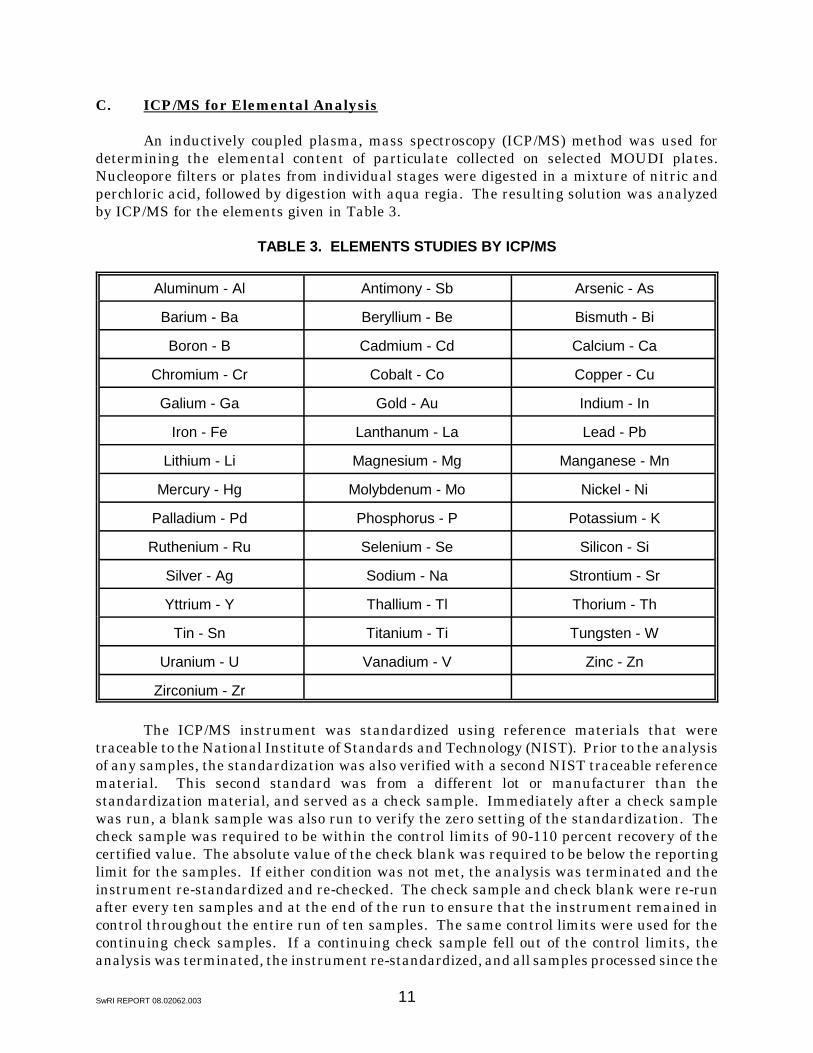
C. ICP/MS for Elemental Analysis
An inductively coupled plasma, mass spectroscopy (ICP/MS) method was used fordetermining the elemental content of particulate collected on selected MOUDI plates.Nucleopore filters or plates from individual stages were digested in a mixture of nitric andperchloric acid, followed by digestion with aqua regia. The resulting solution was analyzedby ICP/MS for the elements given in Table 3.
TABLE 3. ELEMENTS STUDIES BY ICP/MS
Aluminum - Al Antimony - Sb Arsenic - As
Barium - Ba Beryllium - Be Bismuth - Bi
Boron - B Cadmium - Cd Calcium - Ca
Chromium - Cr Cobalt - Co Copper - Cu
Galium - Ga Gold - Au Indium - In
Iron - Fe Lanthanum - La Lead - Pb
Lithium - Li Magnesium - Mg Manganese - Mn
Mercury - Hg Molybdenum - Mo Nickel - Ni
Palladium - Pd Phosphorus - P Potassium - K
Ruthenium - Ru Selenium - Se Silicon - Si
Silver - Ag Sodium - Na Strontium - Sr
Yttrium - Y Thallium - Tl Thorium - Th
Tin - Sn Titanium - Ti Tungsten - W
Uranium - U Vanadium - V Zinc - Zn
Zirconium - Zr
The ICP/MS instrument was standardized using reference materials that weretraceable to the National Institute of Standards and Technology (NIST). Prior to the analysisof any samples, the standardization was also verified with a second NIST traceable referencematerial. This second standard was from a different lot or manufacturer than thestandardization material, and served as a check sample. Immediately after a check samplewas run, a blank sample was also run to verify the zero setting of the standardization. Thecheck sample was required to be within the control limits of 90-110 percent recovery of thecertified value. The absolute value of the check blank was required to be below the reportinglimit for the samples. If either condition was not met, the analysis was terminated and theinstrument re-standardized and re-checked. The check sample and check blank were re-runafter every ten samples and at the end of the run to ensure that the instrument remained incontrol throughout the entire run of ten samples. The same control limits were used for thecontinuing check samples. If a continuing check sample fell out of the control limits, theanalysis was terminated, the instrument re-standardized, and all samples processed since the

12SwRI REPORT 08.02062.003
last compliant check sample were re-run. Detection limits were on the order of 1 to 5 Fg/filterfor most elements.
D. IC for Anions and Cations
Anions and cations accumulated on each Nucleopore filter impactor plate werequantified using an ion chromotography (IC) process, where selected stages were extracted byshaking each Nucleopore filter in a solution of 60 percent isopropanol (IPA) and 40 percentwater. Analyses of the extracted anions and cations were conducted using an IC equippedwith a conductivity detector.
1. Anions -- Sulfate, Nitrate, and Chloride Ions
Sulfuric acid on the filter was converted to ammonium sulfate by exposure toammonia vapor in a conditioning chamber. The soluble sulfates and other anions were thenleached from the filter with a measured volume of 60 percent IPA and 40 percent water. Analiquot of this extract was injected via autosampler into an IC. Anions were separated byanalytical column with a dilute solution of sodium bicarbonate and sodium carbonate as theeluent, and then passed through a conductivity detector. The retention time on columnprovide identification of the anions, with the intensity of the signal corresponding to theconcentration of the anion detected.
2. Cations -- Ammonium and Potassium Ions
Cations were analyzed in a similar manner as the anions except the eluent wasnitric acid. The soluble cations were leached from the Nucleopore filter with a measuredvolume of 60 percent IPA and 40 percent water. An aliquot of this extract was injected viaautosampler into an IC. Cations were separated by analytical column, and passed through aconductivity detector. The retention time on column provided identification of the cations,with intensity of the signal corresponding to the cation concentration.
13SwRI REPORT 08.02062.003
IV. TEST RESULTS
A. Particle Size Distribution
Table 4 summarizes the results of the GE locomotive particle size distribution at Idleand Notch 8 for both fuels. Given are particulate matter (PM) mass emission rates in tendiscrete particle size ranges, and a total particulate mass rate, which is the sum of all thestage fractions collected plus the backup filter.
As described in Section III.A of this report, duplicate tests were performed using thestandard foil media and Nucleopore media in the MOUDI at each of the two operatingconditions, and for each of the two test fuels. The data in Table 4 shows that the particle sizedistribution obtained with the foil plates and the Nucleopore media as an impaction plateyielded similar results, although the sum of the stage values (the total PM emission rate) wasconsistently higher when using the Nucleopore media compared to the foil plates. Table 4 alsocontains the PM rate for each test condition and fuel that is based on conventional PMsampling techniques using 90mm Pallflex T60A20 filter media. The value reported as “TotalPM by 90mm” is the average of triplicate tests reported to the ARB as part of the main testprogram on this locomotive. Comparing the 90mm PM results to the PM totals by the MOUDIshow that the Nucleopore media seemed to agree better than the foils, with the possibleexception of the first Notch 8 run with the 0.3 percent sulfur fuel, where the total PM byMOUDI was almost twice as high as the 90 mm PM. Comparing the PM totals by MOUDIusing foil plates are often compared against total PM measured with conventional samplingsystems, and MOUDI total PM values are typically in the range of 60 to 90 percent of thosemeasured by conventional 90mm filters. In this case, the Nucleopore filters used as impactionplates seemed to collect more mass at each stage compared to the foil plates, although the sizedistributions were similar. Due to the fact that the foil plates are the collection mediatypically used in MOUDI sampling, the following discussion of particle size is based on datausing the foils.
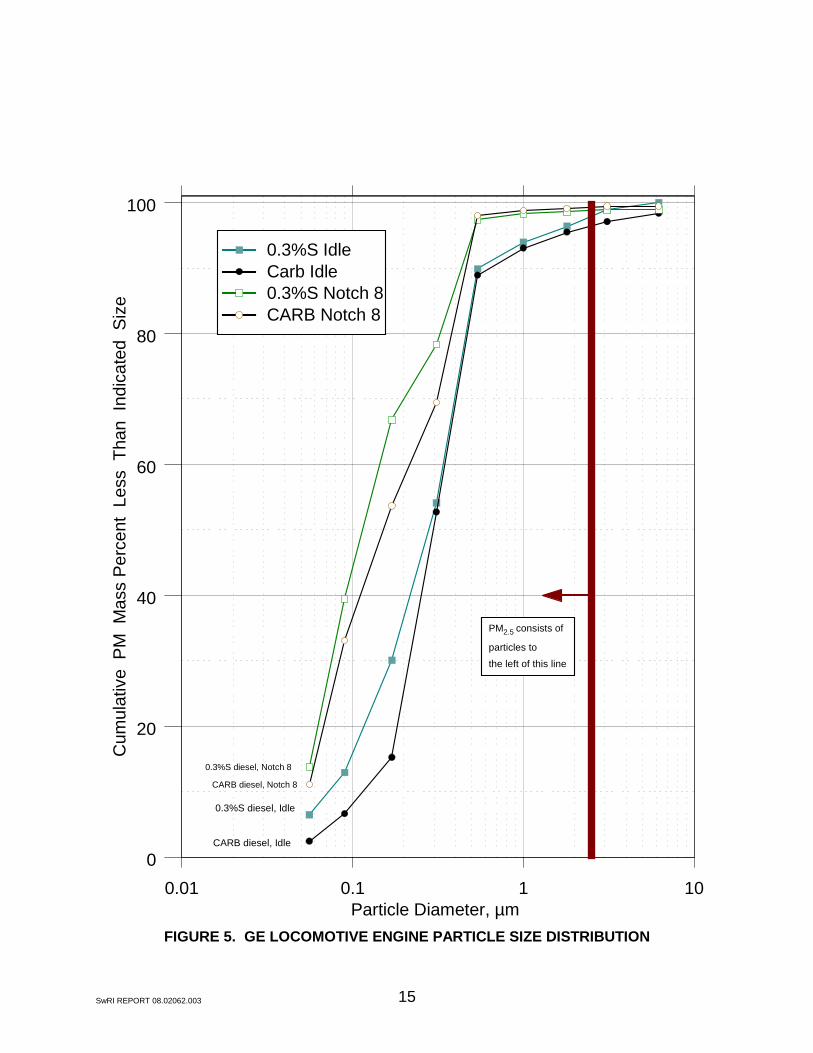
The duplicate runs using the foil media were averaged, and the results are presentedin Figure 5, in percentages of total PM mass as a function of particle size. At Idle, for bothfuels, about 1 percent of the total PM mass was from particles larger than 2.5 Fm. At Notch8, less than 1 percent of the total PM mass was from particles larger than 2.5 Fm, for bothfuels. Figure 5 also shows that the 0.3 percent sulfur fuel had a larger percentage of smallerparticles than the CARB diesel, at both Idle and Notch 8. Also, there was a larger fraction ofsmaller particles at Notch 8 than at Idle.
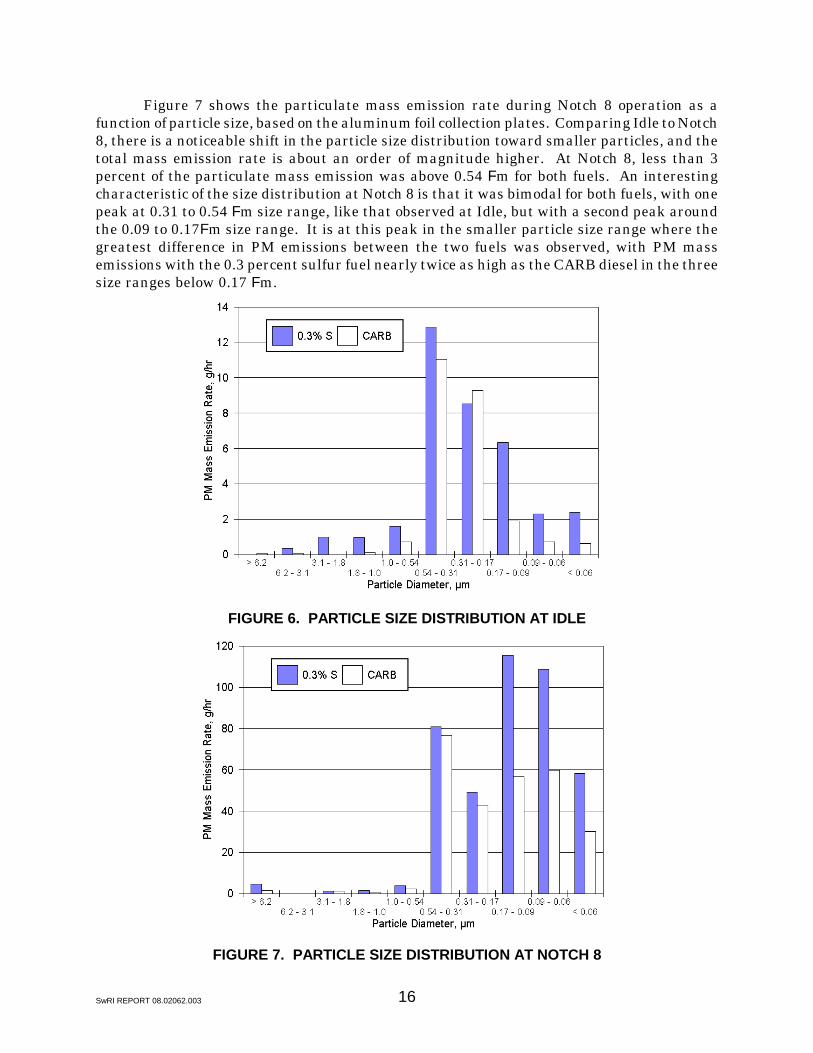
Figure 6 shows the particulate mass emission rate during Idle operation as a functionof particle size, based on the aluminum foil collection plates. Both fuels exhibited amonomodal distribution, with the largest mass fraction at the 0.31 to 0.54 Fm size range. ThePM mass emission rate was higher with the 0.3 percent sulfur fuel at all size ranges exceptat the 0.17 to 0.31Fm size range.
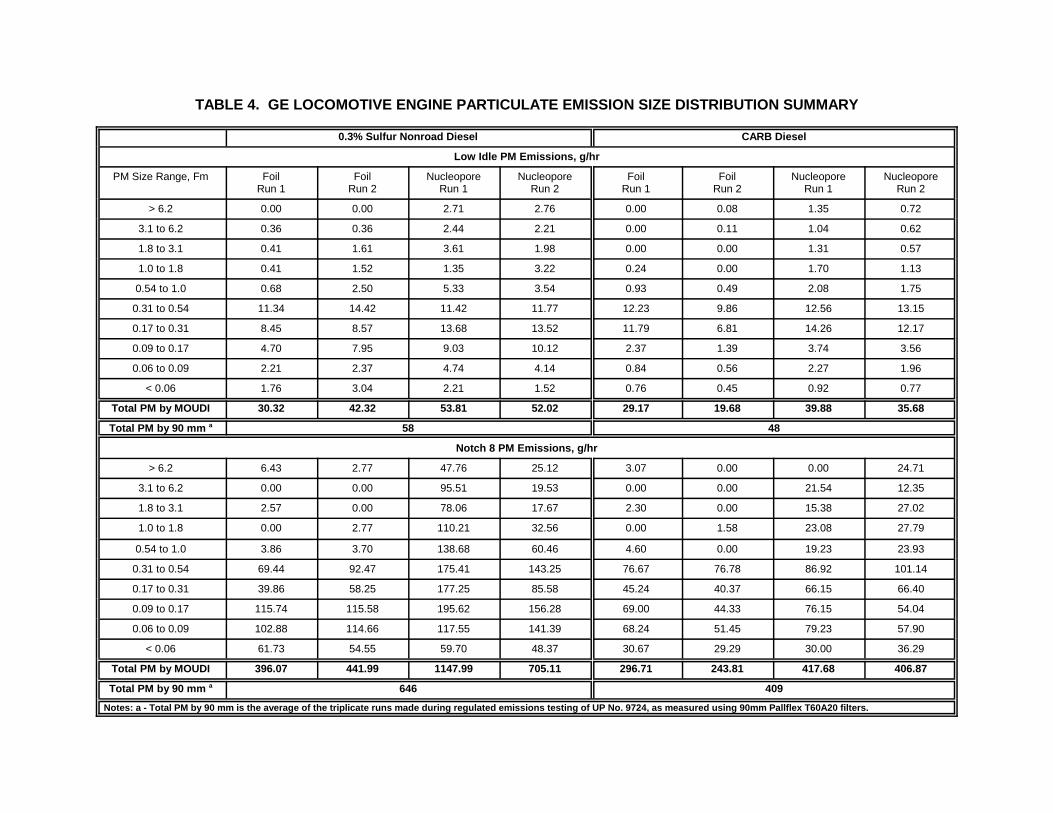
TABLE 4. GE LOCOMOTIVE ENGINE PARTICULATE EMISSION SIZE DISTRIBUTION SUMMARY
0.3% Sulfur Nonroad Diesel CARB Diesel
Low Idle PM Emissions, g/hr
PM Size Range, Fm FoilRun 1
FoilRun 2
NucleoporeRun 1
NucleoporeRun 2
FoilRun 1
FoilRun 2
NucleoporeRun 1
NucleoporeRun 2
> 6.2 0.00 0.00 2.71 2.76 0.00 0.08 1.35 0.72
3.1 to 6.2 0.36 0.36 2.44 2.21 0.00 0.11 1.04 0.62
1.8 to 3.1 0.41 1.61 3.61 1.98 0.00 0.00 1.31 0.57
1.0 to 1.8 0.41 1.52 1.35 3.22 0.24 0.00 1.70 1.13
0.54 to 1.0 0.68 2.50 5.33 3.54 0.93 0.49 2.08 1.75
0.31 to 0.54 11.34 14.42 11.42 11.77 12.23 9.86 12.56 13.15
0.17 to 0.31 8.45 8.57 13.68 13.52 11.79 6.81 14.26 12.17
0.09 to 0.17 4.70 7.95 9.03 10.12 2.37 1.39 3.74 3.56
0.06 to 0.09 2.21 2.37 4.74 4.14 0.84 0.56 2.27 1.96
< 0.06 1.76 3.04 2.21 1.52 0.76 0.45 0.92 0.77
Total PM by MOUDI 30.32 42.32 53.81 52.02 29.17 19.68 39.88 35.68
Total PM by 90 mm a 58 48
Notch 8 PM Emissions, g/hr
> 6.2 6.43 2.77 47.76 25.12 3.07 0.00 0.00 24.71
3.1 to 6.2 0.00 0.00 95.51 19.53 0.00 0.00 21.54 12.35
1.8 to 3.1 2.57 0.00 78.06 17.67 2.30 0.00 15.38 27.02
1.0 to 1.8 0.00 2.77 110.21 32.56 0.00 1.58 23.08 27.79
0.54 to 1.0 3.86 3.70 138.68 60.46 4.60 0.00 19.23 23.93
0.31 to 0.54 69.44 92.47 175.41 143.25 76.67 76.78 86.92 101.14
0.17 to 0.31 39.86 58.25 177.25 85.58 45.24 40.37 66.15 66.40
0.09 to 0.17 115.74 115.58 195.62 156.28 69.00 44.33 76.15 54.04
0.06 to 0.09 102.88 114.66 117.55 141.39 68.24 51.45 79.23 57.90
< 0.06 61.73 54.55 59.70 48.37 30.67 29.29 30.00 36.29
Total PM by MOUDI 396.07 441.99 1147.99 705.11 296.71 243.81 417.68 406.87
Total PM by 90 mm a 646 409Notes: a - Total PM by 90 mm is the average of the triplicate runs made during regulated emissions testing of UP No. 9724, as measured using 90mm Pallflex T60A20 filters.
15SwRI REPORT 08.02062.003
0.01 0.1 1 10Particle Diameter, µm
0
20
40
60
80
100
Cum
ulat
ive
PM
Mas
s Pe
rcen
t Le
ss T
han
Indi
cate
d S
ize
0.3%S IdleCarb Idle0.3%S Notch 8CARB Notch 8
CARB diesel, Idle
CARB diesel, Notch 8
0.3%S diesel, Notch 8
PM2.5 consists of
particles tothe left of this line
0.3%S diesel, Idle
FIGURE 5. GE LOCOMOTIVE ENGINE PARTICLE SIZE DISTRIBUTION
16SwRI REPORT 08.02062.003
Figure 7 shows the particulate mass emission rate during Notch 8 operation as afunction of particle size, based on the aluminum foil collection plates. Comparing Idle to Notch8, there is a noticeable shift in the particle size distribution toward smaller particles, and thetotal mass emission rate is about an order of magnitude higher. At Notch 8, less than 3percent of the particulate mass emission was above 0.54 Fm for both fuels. An interestingcharacteristic of the size distribution at Notch 8 is that it was bimodal for both fuels, with onepeak at 0.31 to 0.54 Fm size range, like that observed at Idle, but with a second peak aroundthe 0.09 to 0.17Fm size range. It is at this peak in the smaller particle size range where thegreatest difference in PM emissions between the two fuels was observed, with PM massemissions with the 0.3 percent sulfur fuel nearly twice as high as the CARB diesel in the threesize ranges below 0.17 Fm.
FIGURE 6. PARTICLE SIZE DISTRIBUTION AT IDLE
FIGURE 7. PARTICLE SIZE DISTRIBUTION AT NOTCH 8
17SwRI REPORT 08.02062.003
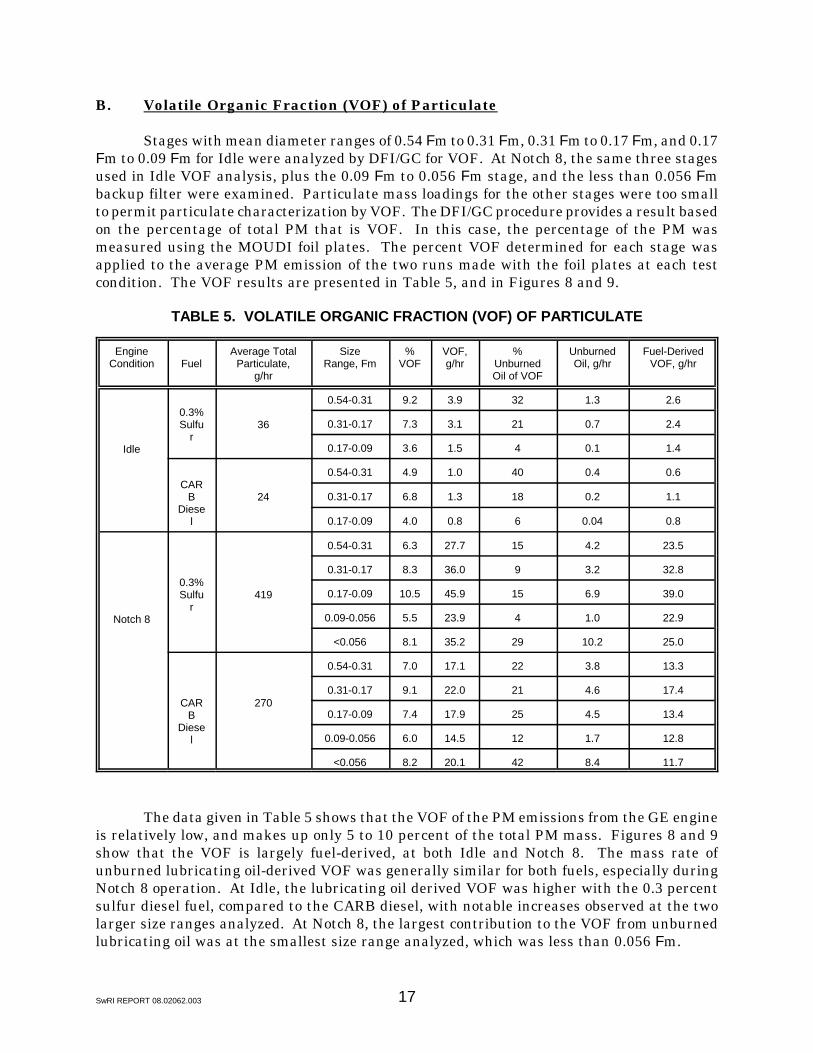
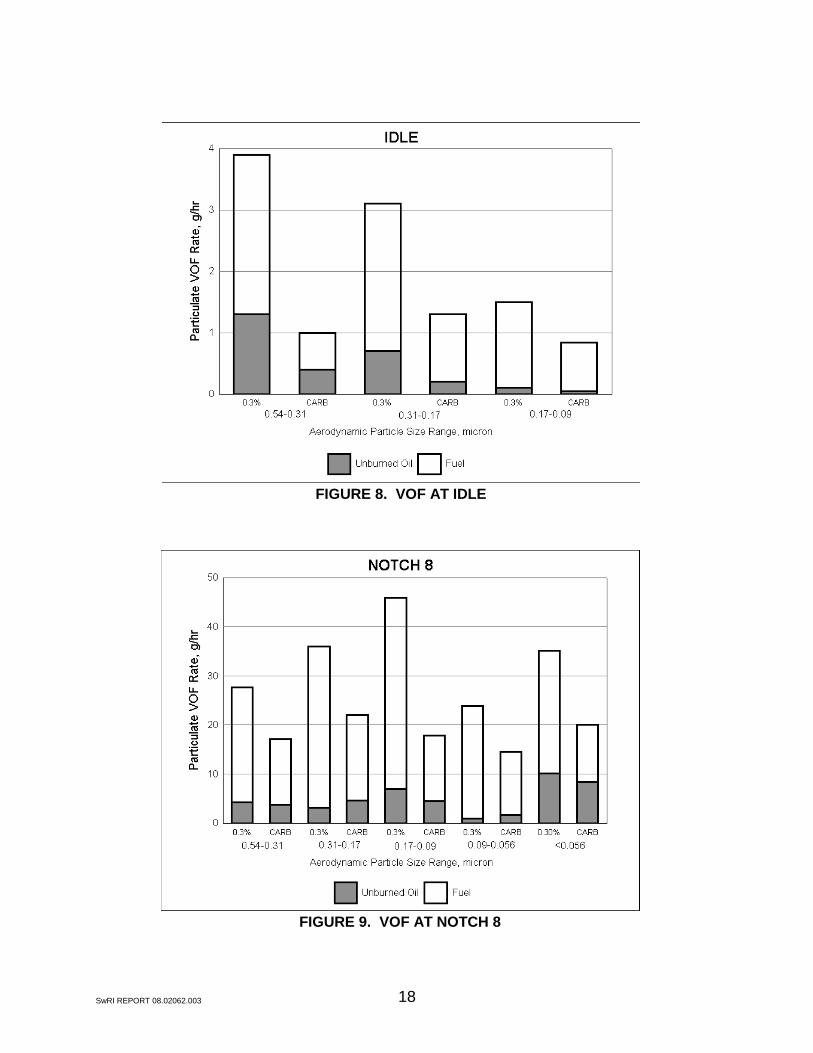
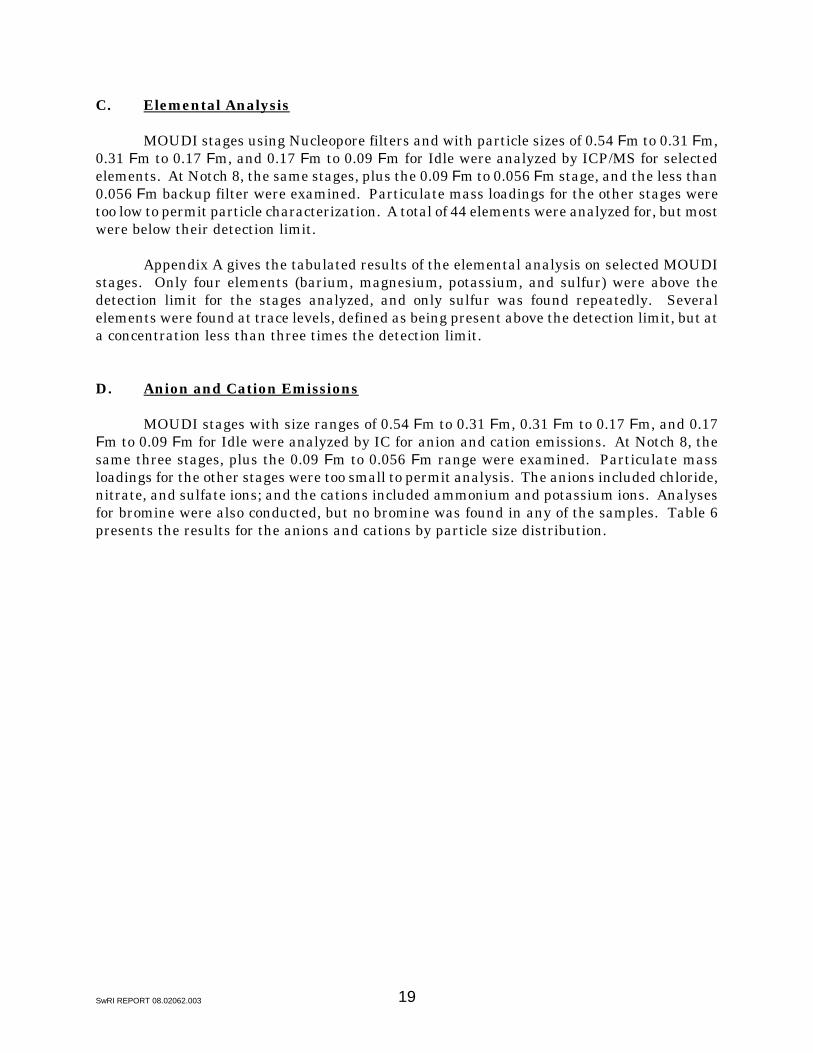
B. Volatile Organic Fraction (VOF) of Particulate
Stages with mean diameter ranges of 0.54 Fm to 0.31 Fm, 0.31 Fm to 0.17 Fm, and 0.17Fm to 0.09 Fm for Idle were analyzed by DFI/GC for VOF. At Notch 8, the same three stagesused in Idle VOF analysis, plus the 0.09 Fm to 0.056 Fm stage, and the less than 0.056 Fmbackup filter were examined. Particulate mass loadings for the other stages were too smallto permit particulate characterization by VOF. The DFI/GC procedure provides a result basedon the percentage of total PM that is VOF. In this case, the percentage of the PM wasmeasured using the MOUDI foil plates. The percent VOF determined for each stage wasapplied to the average PM emission of the two runs made with the foil plates at each testcondition. The VOF results are presented in Table 5, and in Figures 8 and 9.
TABLE 5. VOLATILE ORGANIC FRACTION (VOF) OF PARTICULATE
EngineCondition Fuel
Average TotalParticulate,
g/hr
SizeRange, Fm
%VOF
VOF,g/hr
%UnburnedOil of VOF
UnburnedOil, g/hr
Fuel-DerivedVOF, g/hr
Idle
0.3%Sulfu
r36
0.54-0.31 9.2 3.9 32 1.3 2.6
0.31-0.17 7.3 3.1 21 0.7 2.4
0.17-0.09 3.6 1.5 4 0.1 1.4
CARB
Diesel
24
0.54-0.31 4.9 1.0 40 0.4 0.6
0.31-0.17 6.8 1.3 18 0.2 1.1
0.17-0.09 4.0 0.8 6 0.04 0.8
Notch 8
0.3%Sulfu
r419
0.54-0.31 6.3 27.7 15 4.2 23.5
0.31-0.17 8.3 36.0 9 3.2 32.8
0.17-0.09 10.5 45.9 15 6.9 39.0
0.09-0.056 5.5 23.9 4 1.0 22.9
<0.056 8.1 35.2 29 10.2 25.0
CARB
Diesel
270
0.54-0.31 7.0 17.1 22 3.8 13.3
0.31-0.17 9.1 22.0 21 4.6 17.4
0.17-0.09 7.4 17.9 25 4.5 13.4
0.09-0.056 6.0 14.5 12 1.7 12.8
<0.056 8.2 20.1 42 8.4 11.7
The data given in Table 5 shows that the VOF of the PM emissions from the GE engineis relatively low, and makes up only 5 to 10 percent of the total PM mass. Figures 8 and 9show that the VOF is largely fuel-derived, at both Idle and Notch 8. The mass rate ofunburned lubricating oil-derived VOF was generally similar for both fuels, especially duringNotch 8 operation. At Idle, the lubricating oil derived VOF was higher with the 0.3 percentsulfur diesel fuel, compared to the CARB diesel, with notable increases observed at the twolarger size ranges analyzed. At Notch 8, the largest contribution to the VOF from unburnedlubricating oil was at the smallest size range analyzed, which was less than 0.056 Fm.
18SwRI REPORT 08.02062.003
FIGURE 8. VOF AT IDLE
FIGURE 9. VOF AT NOTCH 8
19SwRI REPORT 08.02062.003
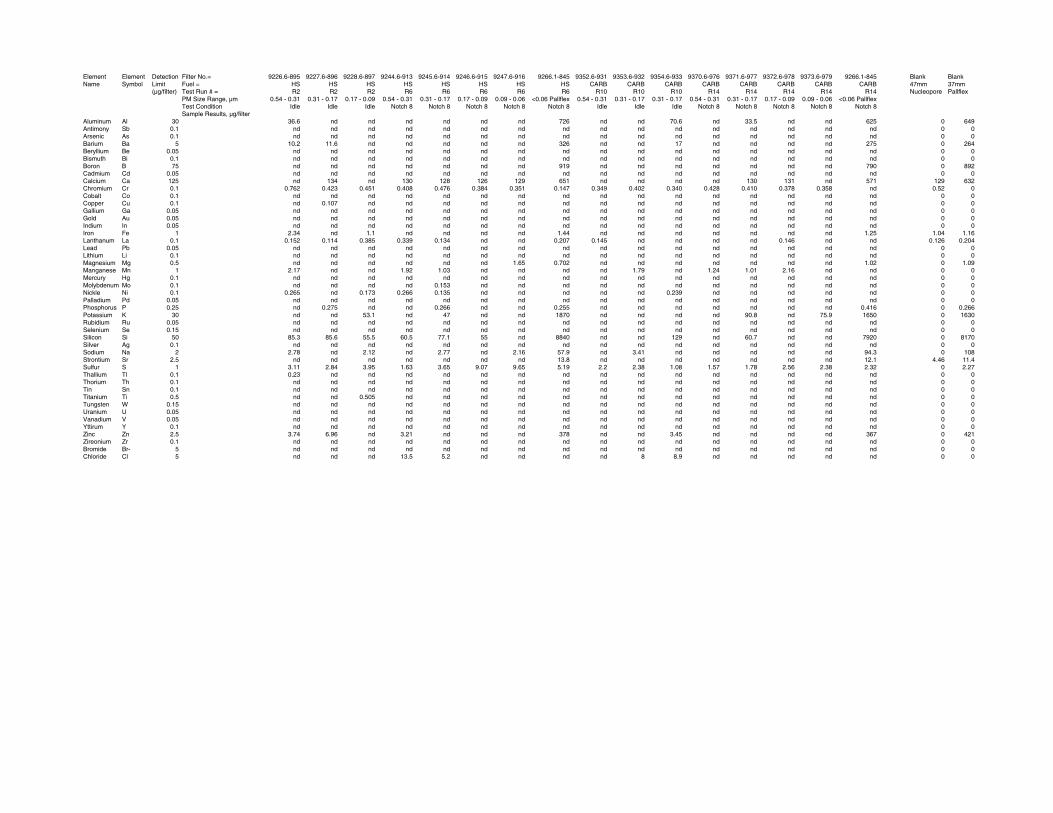
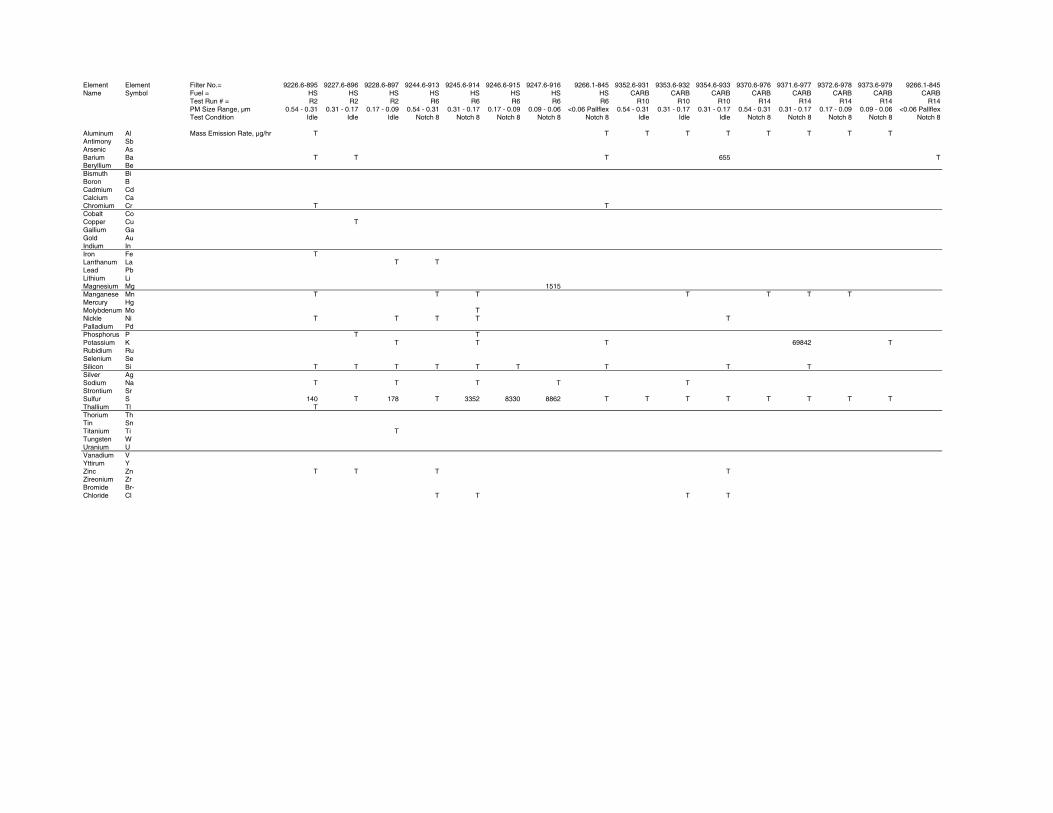
C. Elemental Analysis
MOUDI stages using Nucleopore filters and with particle sizes of 0.54 Fm to 0.31 Fm,0.31 Fm to 0.17 Fm, and 0.17 Fm to 0.09 Fm for Idle were analyzed by ICP/MS for selectedelements. At Notch 8, the same stages, plus the 0.09 Fm to 0.056 Fm stage, and the less than0.056 Fm backup filter were examined. Particulate mass loadings for the other stages weretoo low to permit particle characterization. A total of 44 elements were analyzed for, but mostwere below their detection limit.
Appendix A gives the tabulated results of the elemental analysis on selected MOUDIstages. Only four elements (barium, magnesium, potassium, and sulfur) were above thedetection limit for the stages analyzed, and only sulfur was found repeatedly. Severalelements were found at trace levels, defined as being present above the detection limit, but ata concentration less than three times the detection limit.
D. Anion and Cation Emissions
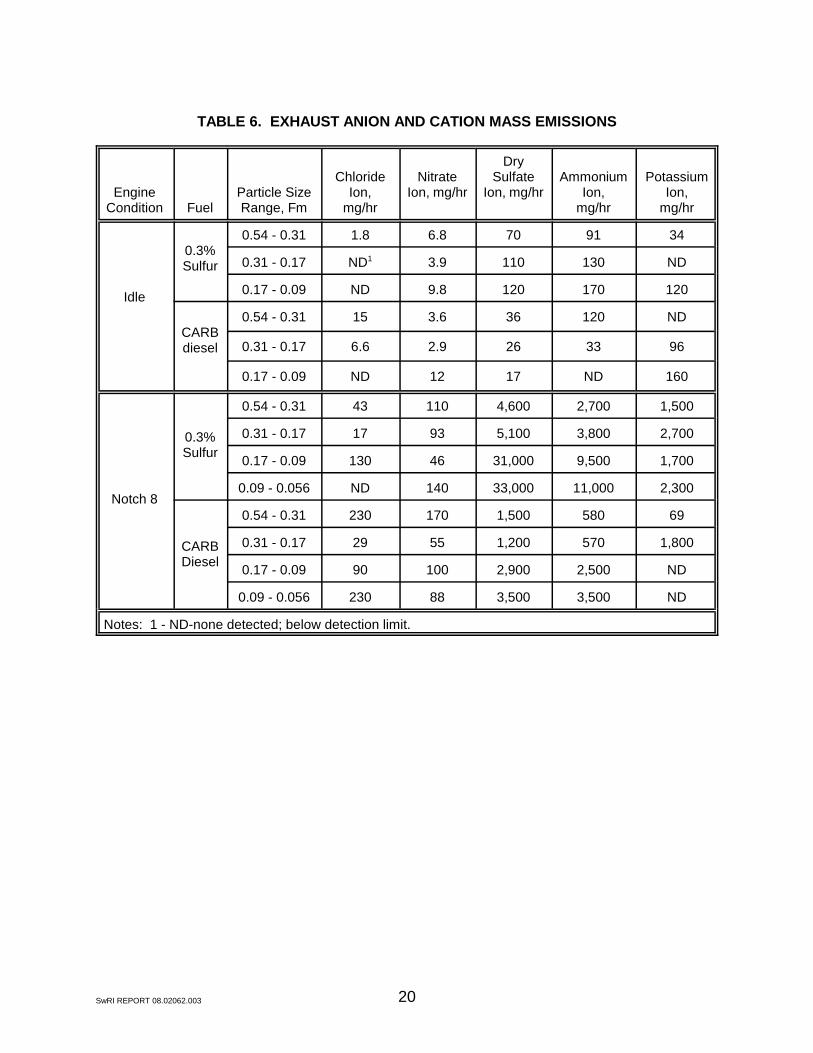
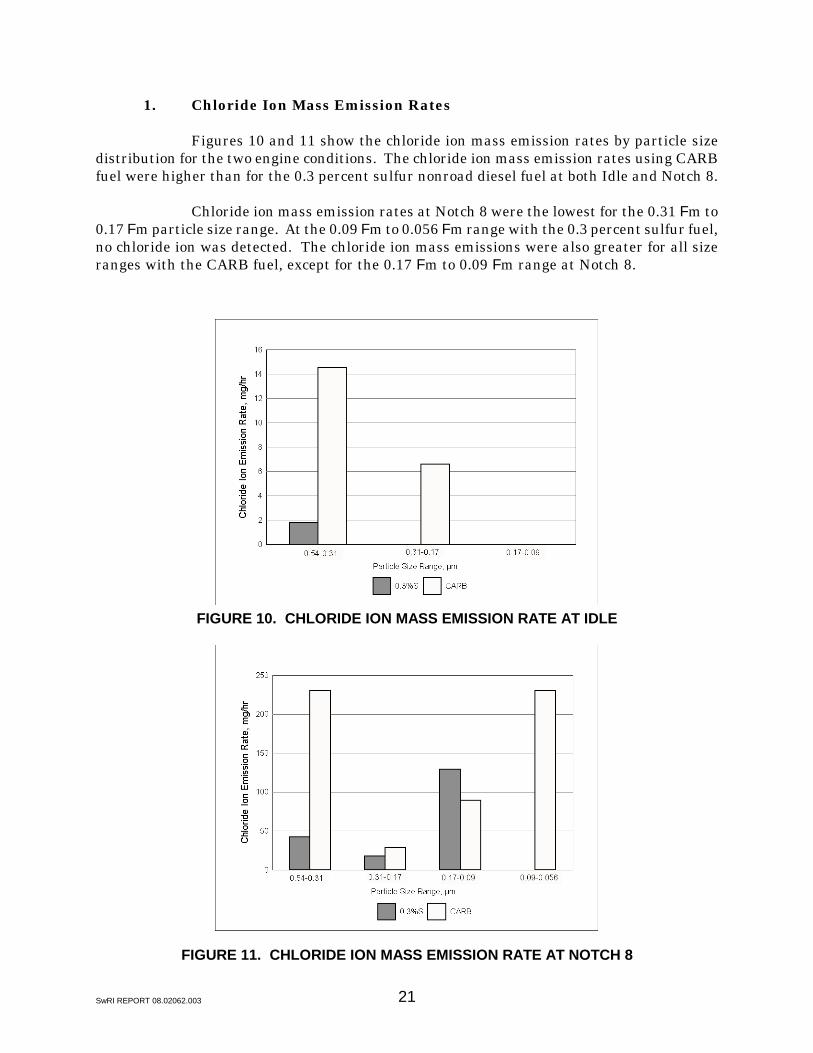
MOUDI stages with size ranges of 0.54 Fm to 0.31 Fm, 0.31 Fm to 0.17 Fm, and 0.17Fm to 0.09 Fm for Idle were analyzed by IC for anion and cation emissions. At Notch 8, thesame three stages, plus the 0.09 Fm to 0.056 Fm range were examined. Particulate massloadings for the other stages were too small to permit analysis. The anions included chloride,nitrate, and sulfate ions; and the cations included ammonium and potassium ions. Analysesfor bromine were also conducted, but no bromine was found in any of the samples. Table 6presents the results for the anions and cations by particle size distribution.
20SwRI REPORT 08.02062.003
TABLE 6. EXHAUST ANION AND CATION MASS EMISSIONS
EngineCondition Fuel
Particle SizeRange, Fm
ChlorideIon,
mg/hr
NitrateIon, mg/hr
DrySulfate
Ion, mg/hrAmmonium
Ion,mg/hr
PotassiumIon,
mg/hr
Idle
0.3%Sulfur
0.54 - 0.31 1.8 6.8 70 91 34
0.31 - 0.17 ND1 3.9 110 130 ND
0.17 - 0.09 ND 9.8 120 170 120
CARBdiesel
0.54 - 0.31 15 3.6 36 120 ND
0.31 - 0.17 6.6 2.9 26 33 96
0.17 - 0.09 ND 12 17 ND 160
Notch 8
0.3%Sulfur
0.54 - 0.31 43 110 4,600 2,700 1,500
0.31 - 0.17 17 93 5,100 3,800 2,700
0.17 - 0.09 130 46 31,000 9,500 1,700
0.09 - 0.056 ND 140 33,000 11,000 2,300
CARBDiesel
0.54 - 0.31 230 170 1,500 580 69
0.31 - 0.17 29 55 1,200 570 1,800
0.17 - 0.09 90 100 2,900 2,500 ND
0.09 - 0.056 230 88 3,500 3,500 ND
Notes: 1 - ND-none detected; below detection limit.
21SwRI REPORT 08.02062.003
1. Chloride Ion Mass Emission Rates
Figures 10 and 11 show the chloride ion mass emission rates by particle sizedistribution for the two engine conditions. The chloride ion mass emission rates using CARBfuel were higher than for the 0.3 percent sulfur nonroad diesel fuel at both Idle and Notch 8.
Chloride ion mass emission rates at Notch 8 were the lowest for the 0.31 Fm to0.17 Fm particle size range. At the 0.09 Fm to 0.056 Fm range with the 0.3 percent sulfur fuel,no chloride ion was detected. The chloride ion mass emissions were also greater for all sizeranges with the CARB fuel, except for the 0.17 Fm to 0.09 Fm range at Notch 8.
FIGURE 10. CHLORIDE ION MASS EMISSION RATE AT IDLE
FIGURE 11. CHLORIDE ION MASS EMISSION RATE AT NOTCH 8
22SwRI REPORT 08.02062.003
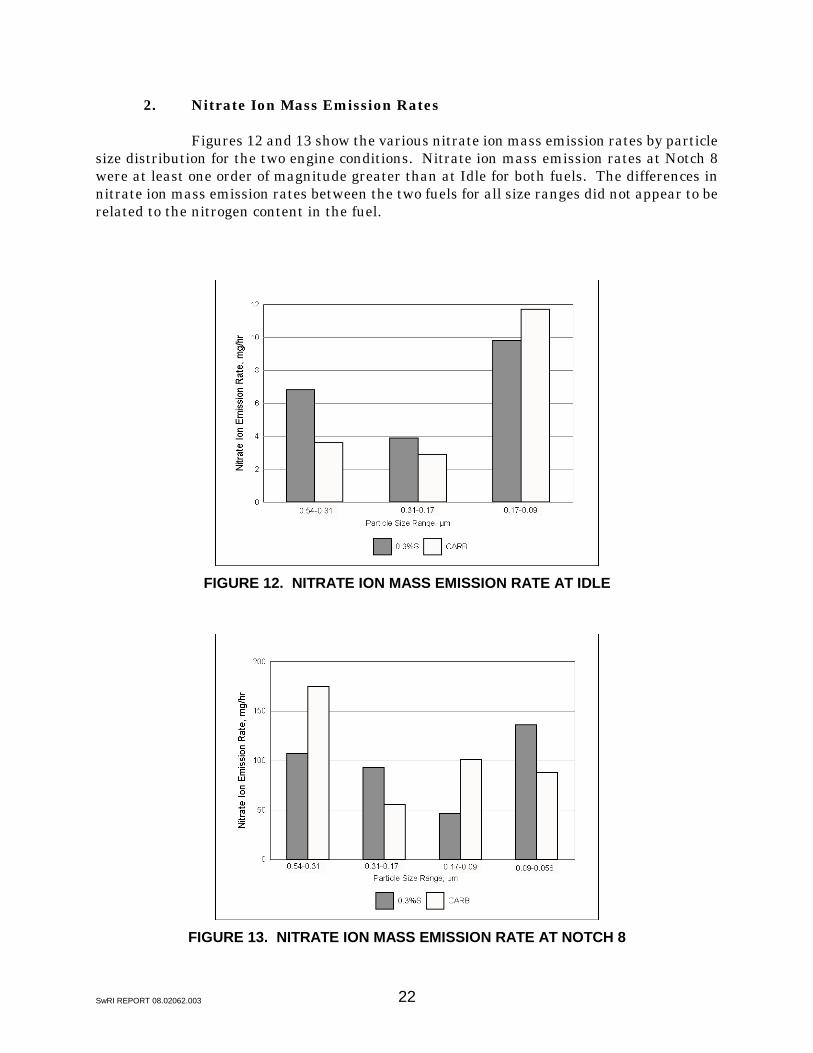
2. Nitrate Ion Mass Emission Rates
Figures 12 and 13 show the various nitrate ion mass emission rates by particlesize distribution for the two engine conditions. Nitrate ion mass emission rates at Notch 8were at least one order of magnitude greater than at Idle for both fuels. The differences innitrate ion mass emission rates between the two fuels for all size ranges did not appear to berelated to the nitrogen content in the fuel.
FIGURE 12. NITRATE ION MASS EMISSION RATE AT IDLE
FIGURE 13. NITRATE ION MASS EMISSION RATE AT NOTCH 8
23SwRI REPORT 08.02062.003
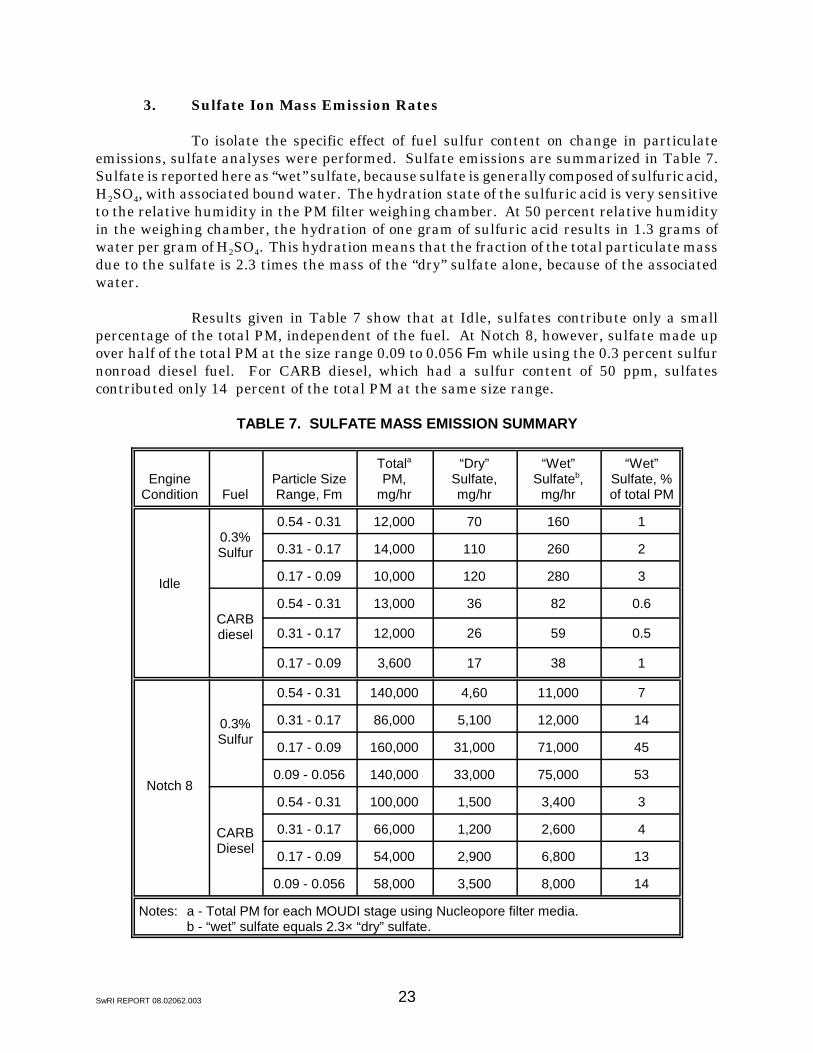
3. Sulfate Ion Mass Emission Rates
To isolate the specific effect of fuel sulfur content on change in particulateemissions, sulfate analyses were performed. Sulfate emissions are summarized in Table 7.Sulfate is reported here as “wet” sulfate, because sulfate is generally composed of sulfuric acid,H2SO4, with associated bound water. The hydration state of the sulfuric acid is very sensitiveto the relative humidity in the PM filter weighing chamber. At 50 percent relative humidityin the weighing chamber, the hydration of one gram of sulfuric acid results in 1.3 grams ofwater per gram of H2SO4. This hydration means that the fraction of the total particulate massdue to the sulfate is 2.3 times the mass of the “dry” sulfate alone, because of the associatedwater.
Results given in Table 7 show that at Idle, sulfates contribute only a smallpercentage of the total PM, independent of the fuel. At Notch 8, however, sulfate made upover half of the total PM at the size range 0.09 to 0.056 Fm while using the 0.3 percent sulfurnonroad diesel fuel. For CARB diesel, which had a sulfur content of 50 ppm, sulfatescontributed only 14 percent of the total PM at the same size range.
TABLE 7. SULFATE MASS EMISSION SUMMARY
EngineCondition Fuel
Particle SizeRange, Fm
TotalaPM,
mg/hr
“Dry”Sulfate,mg/hr
“Wet”Sulfateb,
mg/hr
“Wet”Sulfate, %of total PM
Idle
0.3%Sulfur
0.54 - 0.31 12,000 70 160 1
0.31 - 0.17 14,000 110 260 2
0.17 - 0.09 10,000 120 280 3
CARBdiesel
0.54 - 0.31 13,000 36 82 0.6
0.31 - 0.17 12,000 26 59 0.5
0.17 - 0.09 3,600 17 38 1
Notch 8
0.3%Sulfur
0.54 - 0.31 140,000 4,60 11,000 7
0.31 - 0.17 86,000 5,100 12,000 14
0.17 - 0.09 160,000 31,000 71,000 45
0.09 - 0.056 140,000 33,000 75,000 53
CARBDiesel
0.54 - 0.31 100,000 1,500 3,400 3
0.31 - 0.17 66,000 1,200 2,600 4
0.17 - 0.09 54,000 2,900 6,800 13
0.09 - 0.056 58,000 3,500 8,000 14
Notes: a - Total PM for each MOUDI stage using Nucleopore filter media.b - “wet” sulfate equals 2.3× “dry” sulfate.
24SwRI REPORT 08.02062.003
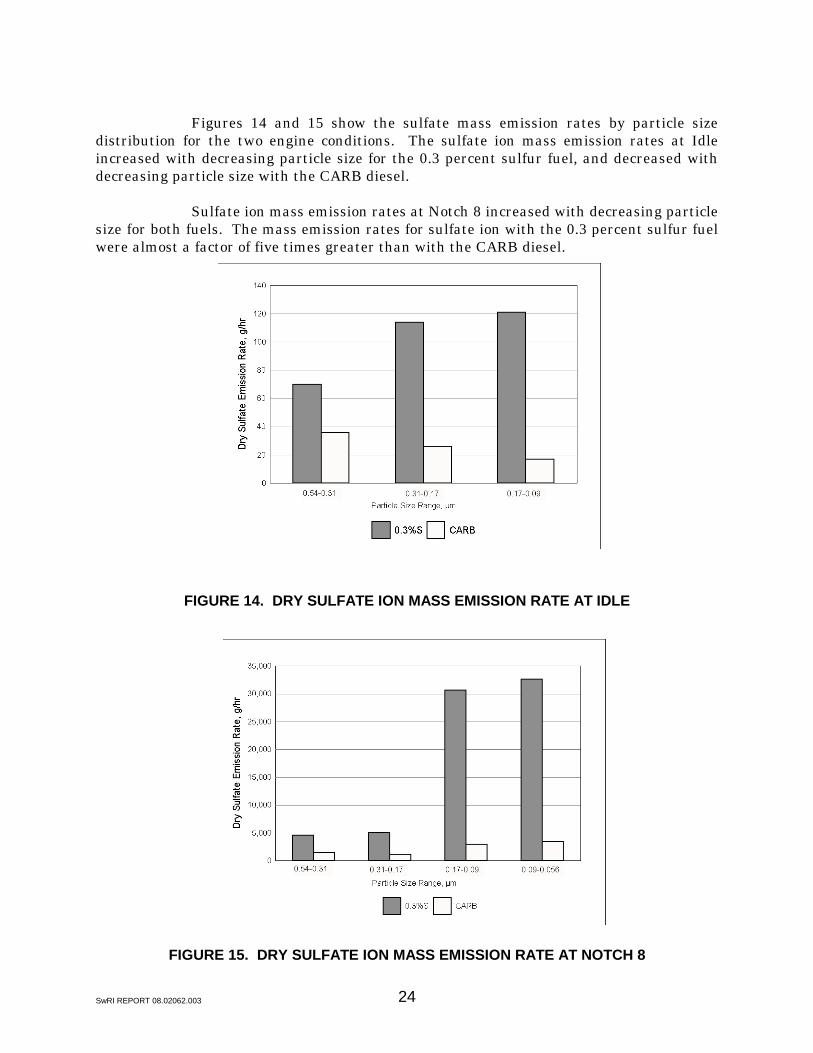
Figures 14 and 15 show the sulfate mass emission rates by particle sizedistribution for the two engine conditions. The sulfate ion mass emission rates at Idleincreased with decreasing particle size for the 0.3 percent sulfur fuel, and decreased withdecreasing particle size with the CARB diesel.
Sulfate ion mass emission rates at Notch 8 increased with decreasing particlesize for both fuels. The mass emission rates for sulfate ion with the 0.3 percent sulfur fuelwere almost a factor of five times greater than with the CARB diesel.
FIGURE 14. DRY SULFATE ION MASS EMISSION RATE AT IDLE
FIGURE 15. DRY SULFATE ION MASS EMISSION RATE AT NOTCH 8

25SwRI REPORT 08.02062.003
4. Ammonium Emissions
Figures 16 and 17 show ammonium ion mass emission rates by particle sizedistribution for the two engine conditions. Ammonium mass emission rates at Idle increasedwith smaller particle size for the 0.3 percent sulfur fuel, and decreased with smaller particlesize range with the CARB diesel. Overall, ammonium mass emissions were greater for the 0.3percent sulfur fuel, except for the 0.54 to 0.31 Fm size range for CARB diesel. Ammonium ionmass emissions at Notch 8 increased with decreasing particle size for both fuels.
FIGURE 16. AMMONIUM ION MASS EMISSION RATE AT IDLE
FIGURE 17. AMMONIUM ION MASS EMISSION RATE AT NOTCH 8
26SwRI REPORT 08.02062.003
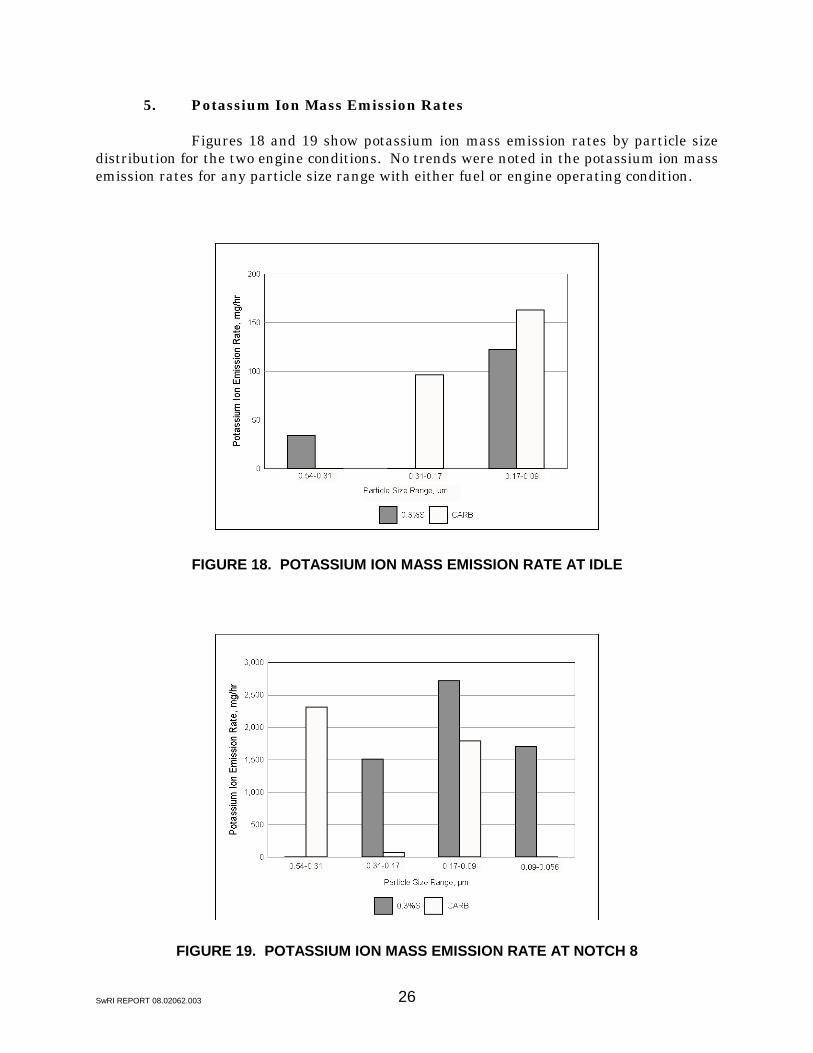
5. Potassium Ion Mass Emission Rates
Figures 18 and 19 show potassium ion mass emission rates by particle sizedistribution for the two engine conditions. No trends were noted in the potassium ion massemission rates for any particle size range with either fuel or engine operating condition.
FIGURE 18. POTASSIUM ION MASS EMISSION RATE AT IDLE
FIGURE 19. POTASSIUM ION MASS EMISSION RATE AT NOTCH 8
27SwRI REPORT 08.02062.003
V. SUMMARY
Testing was performed to provide the ARB with data on the characterization of totalparticulate for various particle size fractions from a 4,400 hp GE locomotive. Two fuels wereused in this study, a 0.3 percent sulfur nonroad diesel, and a CARB diesel. Sampling forparticle sizing was conducted at two different operating conditions, Idle and Notch 8.Particulate characterization by particle size included volatile organic content, elementalanalysis, and anion and cation levels.
Less than one percent of the particles were larger than 2.5 Fm for both fuels. Theparticle size distribution at Idle was monomodal, and at Notch 8 it was bimodal.
Total particulate mass emission was higher with the higher sulfur fuel for bothoperating conditions. Particulate emissions by particle size were similar for both fuels, downto a particle size range between 0.31 Fm to 0.17 Fm. At the smaller size ranges (0.17 Fm to0.09 Fm, 0.09 Fm to 0.056 Fm, and less than 0.056 Fm), the CARB fuel produced lower massesof particles. This difference was also reflected in the fuel-derived VOF and the sulfatecontribution to the total particulate mass. The sulfate mass emission rate was proportionalto the fuel sulfur level.
Only five of 44 chemical elements were noted above the detection limit for the particlesize ranges analyzed. The metal elements were mostly attributed to engine wear metals, andsulfur was associated with the fuel and lubricating oil. Except for sulfur, the metal elementswere only a small fraction of the total particulate. At Idle and Notch 8, most of the detectedelements were found in the larger particle size ranges (0.54 Fm to 0.31 Fm, 0.31 Fm to 0.17Fm and 0.17 Fm to 0.09 Fm).
When operating at Idle, the 0.3 percent sulfur fuel showed a decrease in the VOF withdecreasing particle size, while the CARB diesel yielded the highest VOF mass rate in theintermediate 0.31 Fm to 0.17 Fm size range. The percent of VOF attributed to unburnedlubricating oil decreased with smaller particle sizes for both fuels at Idle, with the largestcontribution occurring in the 0.54 Fm to 0.31 Fm size range. No consistent trends were notedfor the Notch 8 condition.
For Notch 8, the average total particulate mass rate and the VOF were larger with the0.3 percent sulfur fuel than with CARB diesel. Unburned lubricating oil derived VOFcontributed about 57 percent of the VOF for the 0.3 percent sulfur fuel and about 64 percentfor CARB diesel. At Notch 8, the unburned lubricating oil derived VOF was similar for bothfuels, with the highest levels found in particles less than 0.056 Fm. The higher VOF levelswith the 0.3 percent sulfur fuel were mostly fuel-derived VOF.
For the cations and anions, sulfate was highest with the higher sulfur fuel. Chloride,nitrate, and potassium ions were found to be only a small fraction of the total particulate. Themass emission rates for each ion were higher at Notch 8 than at Idle.
SwRI REPORT 08.02062.003
APPENDIX A
ELEMENTAL ANALYSIS RESULTS
BlankBlank9266.1-8459373.6-9799372.6-9789371.6-9779370.6-9769354.6-9339353.6-9329352.6-9319266.1-8459247.6-9169246.6-9159245.6-9149244.6-9139228.6-8979227.6-8969226.6-895Filter No.=DetectionElementElement37mm47mmCARBCARBCARBCARBCARBCARBCARBCARBHSHSHSHSHSHSHSHSFuel =LimitSymbolNamePallflexNucleoporeR14R14R14R14R14R10R10R10R6R6R6R6R6R2R2R2Test Run # = (µg/filter)
<0.06 Pallflex0.09 - 0.060.17 - 0.090.31 - 0.170.54 - 0.310.31 - 0.170.31 - 0.170.54 - 0.31<0.06 Pallflex0.09 - 0.060.17 - 0.090.31 - 0.170.54 - 0.310.17 - 0.090.31 - 0.170.54 - 0.31PM Size Range, µmNotch 8Notch 8Notch 8Notch 8Notch 8IdleIdleIdleNotch 8Notch 8Notch 8Notch 8Notch 8IdleIdleIdleTest Condition
Sample Results, µg/filter6490625ndnd33.5nd70.6ndnd726ndndndndndnd36.630AlAluminum
00ndndndndndndndndndndndndndndndnd0.1SbAntimony00ndndndndndndndndndndndndndndndnd0.1AsArsenic
2640275ndndndnd17ndnd326ndndndndnd11.610.25BaBarium00ndndndndndndndndndndndndndndndnd0.05BeBeryllium00ndndndndndndndndndndndndndndndnd0.1BiBismuth
8920790ndndndndndndnd919ndndndndndndnd75BBoron00ndndndndndndndndndndndndndndndnd0.05CdCadmium
632129571nd131130ndndndnd651129126128130nd134nd125CaCalcium00.52nd0.3580.3780.4100.4280.3400.4020.3490.1470.3510.3840.4760.4080.4510.4230.7620.1CrChromium00ndndndndndndndndndndndndndndndnd0.1CoCobalt00ndndndndndndndndndndndndndnd0.107nd0.1CuCopper00ndndndndndndndndndndndndndndndnd0.05GaGallium00ndndndndndndndndndndndndndndndnd0.05AuGold00ndndndndndndndndndndndndndndndnd0.05InIndium
1.161.041.25ndndndndndndnd1.44ndndndnd1.1nd2.341FeIron0.2040.126ndnd0.146ndndndnd0.1450.207ndnd0.1340.3390.3850.1140.1520.1LaLanthanum
00ndndndndndndndndndndndndndndndnd0.05PbLead00ndndndndndndndndndndndndndndndnd0.1LiLithium
1.0901.02ndndndndndndnd0.7021.65ndndndndndnd0.5MgMagnesium00ndnd2.161.011.24nd1.79ndndndnd1.031.92ndnd2.171MnManganese00ndndndndndndndndndndndndndndndnd0.1HgMercury00ndndndndndndndndndndnd0.153ndndndnd0.1MoMolybdenum00ndndndndnd0.239ndndndndnd0.1350.2660.173nd0.2650.1NiNickle00ndndndndndndndndndndndndndndndnd0.05PdPalladium
0.26600.416ndndndndndndnd0.255ndnd0.266ndnd0.275nd0.25PPhosphorus16300165075.9nd90.8ndndndnd1870ndnd47nd53.1ndnd30KPotassium
00ndndndndndndndndndndndndndndndnd0.05RuRubidium00ndndndndndndndndndndndndndndndnd0.15SeSelenium
817007920ndnd60.7nd129ndnd8840nd5577.160.555.585.685.350SiSilicon00ndndndndndndndndndndndndndndndnd0.1AgSilver
108094.3ndndndndnd3.41nd57.92.16nd2.77nd2.12nd2.782NaSodium11.44.4612.1ndndndndndndnd13.8ndndndndndndnd2.5SrStrontium2.2702.322.382.561.781.571.082.382.25.199.659.073.651.633.952.843.111SSulfur
00ndndndndndndndndndndndndndndnd0.230.1TlThallium00ndndndndndndndndndndndndndndndnd0.1ThThorium00ndndndndndndndndndndndndndndndnd0.1SnTin00ndndndndndndndndndndndndnd0.505ndnd0.5TiTitanium00ndndndndndndndndndndndndndndndnd0.15WTungsten00ndndndndndndndndndndndndndndndnd0.05UUranium00ndndndndndndndndndndndndndndndnd0.05VVanadium00ndndndndndndndndndndndndndndndnd0.1YYttirum
4210367ndndndnd3.45ndnd378ndndnd3.21nd6.963.742.5ZnZinc00ndndndndndndndndndndndndndndndnd0.1ZrZireonium00ndndndndndndndndndndndndndndndnd5Br-Bromide00ndndndndnd8.98ndndndnd5.213.5ndndnd5ClChloride
9266.1-8459373.6-9799372.6-9789371.6-9779370.6-9769354.6-9339353.6-9329352.6-9319266.1-8459247.6-9169246.6-9159245.6-9149244.6-9139228.6-8979227.6-8969226.6-895Filter No.=ElementElementCARBCARBCARBCARBCARBCARBCARBCARBHSHSHSHSHSHSHSHSFuel =SymbolName
R14R14R14R14R14R10R10R10R6R6R6R6R6R2R2R2Test Run # = <0.06 Pallflex0.09 - 0.060.17 - 0.090.31 - 0.170.54 - 0.310.31 - 0.170.31 - 0.170.54 - 0.31<0.06 Pallflex0.09 - 0.060.17 - 0.090.31 - 0.170.54 - 0.310.17 - 0.090.31 - 0.170.54 - 0.31PM Size Range, µm
Notch 8Notch 8Notch 8Notch 8Notch 8IdleIdleIdleNotch 8Notch 8Notch 8Notch 8Notch 8IdleIdleIdleTest Condition
TTTTTTTT TMass Emission Rate, µg/hrAlAluminum SbAntimony AsArsenic
T 655 T TTBaBarium BeBeryllium BiBismuth BBoron CdCadmium CaCalcium T TCrChromium CoCobalt T CuCopper GaGallium AuGold InIndium TFeIron TT LaLanthanum PbLead LiLithium 1515 MgMagnesium TTT T TT TMnManganese HgMercury T MoMolybdenum T TTT TNiNickle PdPalladium T T PPhosphorus T 69842 T T T KPotassium RuRubidium SeSelenium T T T TTTTTTSiSilicon AgSilver T T T T TNaSodium SrStrontium TTTTTTTT886283303352T178T140SSulfur TTlThallium ThThorium SnTin T TiTitanium WTungsten UUranium VVanadium YYttirum T T TTZnZinc ZrZireonium Br-Bromide TT TT ClChloride