background studies for the miner coherent neutrino ... · background studies for the miner coherent...
TRANSCRIPT

Background Studies for the MINER Coherent Neutrino Scattering ReactorExperiment
G. Agnoleta, W. Bakera, D. Barkerb, R. Becka, T.J. Carrollc, J. Cesarc, P. Cushmanb, J.B. Dentd,S. De Rijckc, B. Duttaa, W. Flanaganc, M. Frittsb, Y. Gaoa,e, H.R. Harrisa, C.C. Haysa, V. Iyerf,
A. Jastrama, F. Kadribasica, A. Kennedyb, A. Kubika, I. Ogawag, K. Langc, R. Mahapatraa, V. Mandicb,R.D. Martinh, N. Mastb, S. McDeavitti, N. Mirabolfathia, B. Mohantyf, K. Nakajimag, J. Newhousei,
J.L. Newsteadj, D. Phanc, M. Progac, A. Robertsk, G. Rogachevl, R. Salazarc, J. Sanderk, K. Senapatif,M. Shimadag, L. Strigaria, Y. Tamagawag, W. Teizera, J.I.C. Vermaaki, A.N. Villanob, J. Walkerm,
B. Webba, Z. Wetzela, S.A. Yadavallic
aDepartment of Physics and Astronomy, and the Mitchell Institute for Fundamental Physics and Astronomy, Texas A&MUniversity, College Station, TX 77843, USA
bSchool of Physics & Astronomy, University of Minnesota, Minneapolis, MN 55455, USAcDepartment of Physics, University of Texas at Austin, Austin, TX 78712, USA
dDepartment of Physics, University of Louisiana at Lafayette, Lafayette, LA 70504, USAeDepartment of Physics & Astronomy, Wayne State University, Detroit, MI 48201, USA
fSchool of Physical Sciences, National Institute of Science Education and Research, Jatni - 752050, IndiagGraduate School of Engineering, University of Fukui, Fukui, 910-8507, Japan
hDepartment of Physics, Engineering Physics & Astronomy, Queen’s University, Kingston, Ontario, CanadaiTEES Nuclear Science Center, Texas A&M University, College Station, TX 77843, USA
jDepartment of Physics, Arizona State University, Tempe, AZ 85287, USAkDepartment of Physics, University of South Dakota, Vermillion, SD 57069, USA
lCyclotron Institute, Texas A&M University, College Station, TX 77843, USAmDepartment of Physics, Sam Houston State University, Huntsville, TX 77341, USA
Abstract
The proposed Mitchell Institute Neutrino Experiment at Reactor (MINER) experiment at the NuclearScience Center at Texas A&M University will search for coherent elastic neutrino-nucleus scattering withinclose proximity (about 2 meters) of a 1 MW TRIGA nuclear reactor core using low threshold, cryogenicgermanium and silicon detectors. Given the Standard Model cross section of the scattering process and theproposed experimental proximity to the reactor, as many as 5 to 20 events/kg/day are expected. We discussthe status of preliminary measurements to characterize the main backgrounds for the proposed experiment.Both in situ measurements at the experimental site and simulations using the MCNP and GEANT4 codesare described. A strategy for monitoring backgrounds during data taking is briefly discussed.
1. Introduction
The cross section for the coherent elastic scattering of neutrinos off of nuclei (CEνNS) [1] is a long-standing prediction of the Standard Model, but has yet to be measured experimentally in part due to theextremely low energy threshold needed for detection with typical high flux neutrino sources such as nuclearreactors. Improvements in semiconductor detector technologies [2] which utilize the Neganov-Luke phononamplification method [3] have brought CEνNS detection within reach. The Mitchell Institute NeutrinoExperiment at Reactor (MINER) experiment, currently under development at the Nuclear Science Center(NSC) at Texas A&M University, will leverage this detector technology to detect CEνNS and measure itscross section. If successful, the CEνNS interactions can be used to probe new physics scenarios includinga search for sterile neutrino oscillations, the neutrino magnetic moment, and other processes beyond theStandard Model [4–7]. The experiment will utilize a megawatt-class TRIGA (Training, Research, Isotopes,General Atomics) pool reactor stocked with low-enriched (about 20%) 235U. This reactor has an uniqueadvantage of having a movable core and provides access to deploy detectors as close as about 1 m from the
Preprint submitted to Nuclear Instruments and Methods A September 8, 2016
arX
iv:1
609.
0206
6v1
[ph
ysic
s.in
s-de
t] 7
Sep
201
6

reactor, allowing for a varying distance from the neutrino source to the detector. At these short baselines,and given the Standard Model cross section, we expect to detect as many as 5 to 20 events/kg/day in therange of recoil energy between 10 and 1000 eVnr.
An important aspect of the proposed experiment are the backgrounds induced by both the core andenvironmental sources. These backgrounds include gammas and neutrons from the reactor, muons andmuon-induced neutrons from cosmic rays, and ambient gammas. The rate of such backgrounds must becomparable to or below the expected rate of the neutrino recoil signal. We take a rate of 100 events/kg/dayin the range of recoil energy between 10 and 1000 eVnr as the target level of acceptable background rate,corresponding to a signal to background ratio of about 0.1 to 0.2. Events outside of this energy window areacceptable to a reasonable level (about 100 Hz total event rate) and can serve to normalize backgrounds inthe signal region.
The paper is organized as follows. In Section 2, a brief description of the experimental location is given.Section 3 describes the modeling of the reactor core and experiment in the MCNP and GEANT4 framework.Sections 4, 5, and 6 describe the in situ measurements of the gamma, neutron, and cosmic muon backgroundsrespectively, including comparison to the simulation for the gamma and neutron backgrounds. Section 7combines the simulation with the in situ measurements to estimate a background rate in the detectors givena preliminary shielding design. Finally, status and prospects are described in Section 8.
2. Description of Experimental Site
The NSC reactor facility pool is surrounded by roughly 2 meters of high density concrete (about 3.5 g/cm3
density) which acts as a shield to the high flux of neutron and gamma byproducts in the reactor. A cavity inthis wall, dubbed the “Thermal Column”, was used in the past to facilitate close proximity to the reactor formaterial neutron irradiation. The cavity is located in the lower research area of the NSC and is in the samehorizontal plane as the reactor core (see Figure 1). The cavity has many advantages as an experimentallocation, including the ability to access an area in very close proximity to the core, a natural overburdenprovided by the concrete wall to reduce the rate of cosmic muons, and an open area to allow placement ofoptimized shielding between the core and the detectors. A schematic diagram of the Thermal Column canbe seen in Figure 1 and a photograph from the outside of the cavity is shown in Figure 2.
Figure 1: Schematic side view of the reactor pool and experimental cavity where the proposed detector and shielding will beconstructed.
3. Background Simulation
3.1. Reactor Core ModelFission processes in the reactor produce large fluxes of both gammas and neutrons near the core. The
energy spectrum and production rate of these backgrounds are predicted using a core model developed at the
2

Figure 2: Photograph from the outside of the empty experimental cavity.
NSC, shown in Figure 3, and applied in the MCNP [8] framework. The TRIGA reactor of the NSC featuresa 90 fuel element, low-enriched uranium core operating at a nominal power of 1 MW. The fuel burn-up ofthe relatively new core (installed in 2006) is modeled in a 15 axial layer configuration for each fuel elementand includes a wide range of fission products in the fuel material resulting in a high detail model of thereactor.
Figure 3: Visualization of the TRIGA reactor core as modeled in MCNP. The small circles in the picture represent the variousfuel and control rods while the green rectangles are graphite reflectors. The fuel rods are about 3.58 cm in diameter and 38.1 cmin length.
Using the MCNP reactor core model, we calculated the neutron energy spectrum produced by the reactorshown on the left in Figure 4, with fluxes of 5.8× 1011 cm−2 s−1 fast component (> 100 keV kinetic energy)and 7.7 × 1012 cm−2 s−1 thermal component (< 0.625 eV kinetic energy). A moderator can be used toconvert the fast neutron flux to a thermal flux which can be shielded using a thermal neutron absorber suchas boron, cadmium or gadolinium.
The simulated gamma spectrum is shown on the right in Figure 4, with a total flux of 9.0×1011 cm−2 s−1.This gamma energy spectrum can be attenuated by conventional high density materials such as lead.
3.2. GEANT4 Geometry Model
A model geometry of the experimental hall was constructed in the GEANT4 [? ] (v10.2.1) framework.Correct description of the atomic composition of the surrounding materials is critical since backgroundsstrongly depend on the materials used and secondary production of backgrounds in these materials must be
3

Figure 4: Calculated neutron (left) and gamma (right) spectra just outside the core volume (before shielding), obtained usingthe MCNP core model as described in the text. The neutron spectrum is bin-by-bin normalized to EAve/(E2 − E1) whereE1 and E2 are the energy values at the respective bin edges and EAve is the average of these bin edge values. The 2.2 MeVline in the gamma spectrum is the result of neutron capture on Hydrogen in the surrounding water, while excesses in binsnear 6 and 8 MeV are due to statistical fluctuations. The total fluxes from these calculations are 5.8 × 1011 cm−2 s−1 fastneutrons component (> 100 keV kinetic energy), 7.7 × 1012 cm−2 s−1 thermal neutrons (< 0.625 eV kinetic energy), and9.0 × 1011 cm−2 s−1 gammas.
included. Detailed material descriptions with isotope composition to the level of ppm are provided by theNSC and are included in the GEANT4 model.
Reactor gammas and neutrons were generated with an energy spectrum as produced by the MCNP coremodel described above. The flux is modeled to originate from a 30 × 30 cm2 square plane representing theactive face of the reactor closest to the experimental cavity. To model different core positions, this sourcesurface was moved to the corresponding core face position. To significantly save computational time, particleswere simulated with only momenta along a direction from the reactor core to the experimental cavity,perpendicular to the source plane. The “Shielding” [10] physics list was used in all GEANT4 simulationsdescribed in this paper.
Since the initial flux from the reactor is large and the desired target rate at the detectors must below, we implemented a variance reduction scheme to obtain good statistical significance of the backgroundcharacteristics at the detector site. GEANT4 has multiple built-in variance reduction schemes available tousers, and we chose the ‘importance sampling’ scheme for this application. In the importance samplingscheme, the geometry is divided up into different regions, each with an importance score assigned. As aparticle is propagated across the boundary of two such regions, the ratio of the importance score in the newregion over that of the previous region is taken. If this ratio is larger than one, the particle is duplicated anumber of times equal to this ratio decreased by one. If less than one, a “Russian Roulette” algorithm isused to determine whether to terminate the particle with a probability equal to the ratio. Particles are thenweighted by the inverse of the importance ratio. By increasing the importance value assigned to regionsdeeper within the shielding, the number of particles making it through to the detector is greatly enhanced.We used 16 to 22 importance regions (depending on distance of the source to the detectors) of equal thicknesswith importance score increasing by factors of 2. Large statistics GEANT4 simulations (typically around109 primary particles generated) were run on both the Brazos Computing Cluster at Texas A&M Universityas well as the Texas Advanced Computing Center (TACC) cluster at the University of Texas at Austin.
A preliminary shielding design was then added to the GEANT4 geometry model to assess the backgroundexpected in the full experimental setup. Materials included 1.38 m of high density borated (5%) polyethyleneas neutron shielding and 30.5 cm of lead as gamma shielding. Additional lead and polyethylene were includedafter the initial shielding to reduce backgrounds from secondary particles which include neutrons from (γ,n)reactions and gammas released from neutron captures in the shielding materials. This shielding design isshown in Figure 5. The thickness of shielding materials in this design was chosen based on initial estimatesmade with simple GEANT4 geometry models but has not yet been optimized.
4

Figure 5: Cross section of the GEANT4 geometry model of the experimental cavity with a preliminary shield design. Inthis figure, different materials are represented by different colors. Blue: water, Dark Blue: graphite, Green: 5% Boratedpolyethylene, Light Gray: HD concrete, Dark Gray: Lead, Gold: Copper, Yellow: Plastic Scintillator. The small disks withinthe copper are germanium and silicon detectors.
4. Gamma Background Measurements
Background measurements have been conducted in the experimental cavity using a commercial HighPurity Germanium (HPGe) detector shown in Figure 6 (Canberra GC2020, approx. 0.5 kg). Due to thelarge volume of water between the detector and the reactor core, these measurements were dominated bygamma interactions. A commercially available shield was used to limit the rate registered by the detector,while maintaining a simple geometry for matching with simulations. The shield is cylindrical, comprised of a4” layer of low activity lead enclosed externally by a 1/2” thick layer of steel. Inside the shield cavity, the leadis lined with layers of high purity tin and OFHC copper, approximately 0.04” and 0.06” thick, respectively,to block lead X-rays. Measurements were made at reactor powers of 0 kW (core off), 1 kW, 98 kW, and500 kW at distances (measured from the face of the core to the face of the experimental cavity) of 3.83 m,3.33 m, and 2.83 m (see Figure 7). All measurements consist of 300 seconds of live time. The HPGe detectorwas calibrated before measurements using a 22Na source, which provides gammas with energy 511 keV and1274 keV.
Measured energy spectra are due to gammas produced in the reactor core and gammas from othersources (e.g., activated materials in the area). To properly compare simulations of the reactor core flux withmeasurements, the flux that is not coming directly from the reactor core must be subtracted. To performthis subtraction, we use the energy spectra measured at a given core position, while the reactor is turnedoff. An example of this subtraction is shown in Figure 8. It can be seen that after this subtraction, the onlyremaining spectral line is the 511 keV electron-positron annihilation line. Other lines present in the initialreactor core gamma energy spectrum are washed out due to gammas interacting in the water, graphite, andlead shielding between the core and detector.
The different core positions were simulated in GEANT4, including a model of the lead shielding and theHPGe detector used to make the measurement (shown schematically in Figure 6). Each core position insimulation was systematically 2 cm further from the detector than the corresponding position in the data,due to a correction made to the measured position after the simulation had been run. For each core position,approximately 3× 10⁹ single gamma initial events were generated using the energy spectrum obtained fromthe MCNP core model described previously. The deposited energy of gammas reaching the detector werecompared to the background-subtracted data, as shown in Figure 9. In this plot, the GEANT4 predictionwas scaled to match the integrated event count of the data in the region of deposited energy greater than100 keV. The energy resolution in the higher rate environment of the experimental cavity was dominated
5

Figure 6: Top Left: Photo of Canberra HPGe detector used in the gamma measurement. Top Right: Placement of HPGedetector and shielding in the experimental cavity for the gamma measurement. The active detector is shielded by approximately4 inches of lead provided by the commercial shield described in the text. Bottom: Cross section of GEANT4 geometry (sideview) used in simulation of this setup. The active detector is shown in yellow. The only shielding present in this configurationis the commercial gamma shielding described in the text (the experimental cavity was otherwise empty).
by pile-up effects resulting in a degradation of resolution with rate. A resolution smearing was appliedto the simulated results to account for this effect, determined using a comparison of width of the 511 keVline between the simulation and the data. A simple Gaussian fit was used to determine these line widths(ranging from about 4 keV to 8 keV), and the difference of the squares of these widths was used to define anew Gaussian which was then applied as an event-by-event smearing to the simulated energy deposits. Thesimulation and data matched quite well in shape, with about a 25% deviation for the region above 3 MeV.The large deviation in the region below 20 keV is due to detector threshold effects not accounted for in thesimulation.
We determined the scaling of event rate as a function of core position in both the measured and thesimulated spectra by taking the ratio of background-subtracted spectra at each position. This ratio is shownin Figure 10. The rate is reduced by roughly a factor of 3.5 per 0.5 m of increased distance from the corein both the data and the simulation. Because this scaling of rate with distance is reproduced to withinabout 10% in the simulation, the scaling factor needed to translate the simulated result to a rate is takento be constant regardless of the distance of the core to the detector. We take as this scaling factor the ratioof the integrated event count of the data (in the region of deposited energy greater than 100 keV) to theintegrated weighted event count in the same region in the simulated result. This scaling factor was appliedto all further simulated results to obtain rate estimations.
5. Neutron Background Measurements
Due to administrative and safety constraints preventing deployment of traditional detectors, the back-ground neutron measurement was thus far restricted to measurements needed for validation of the compu-
6
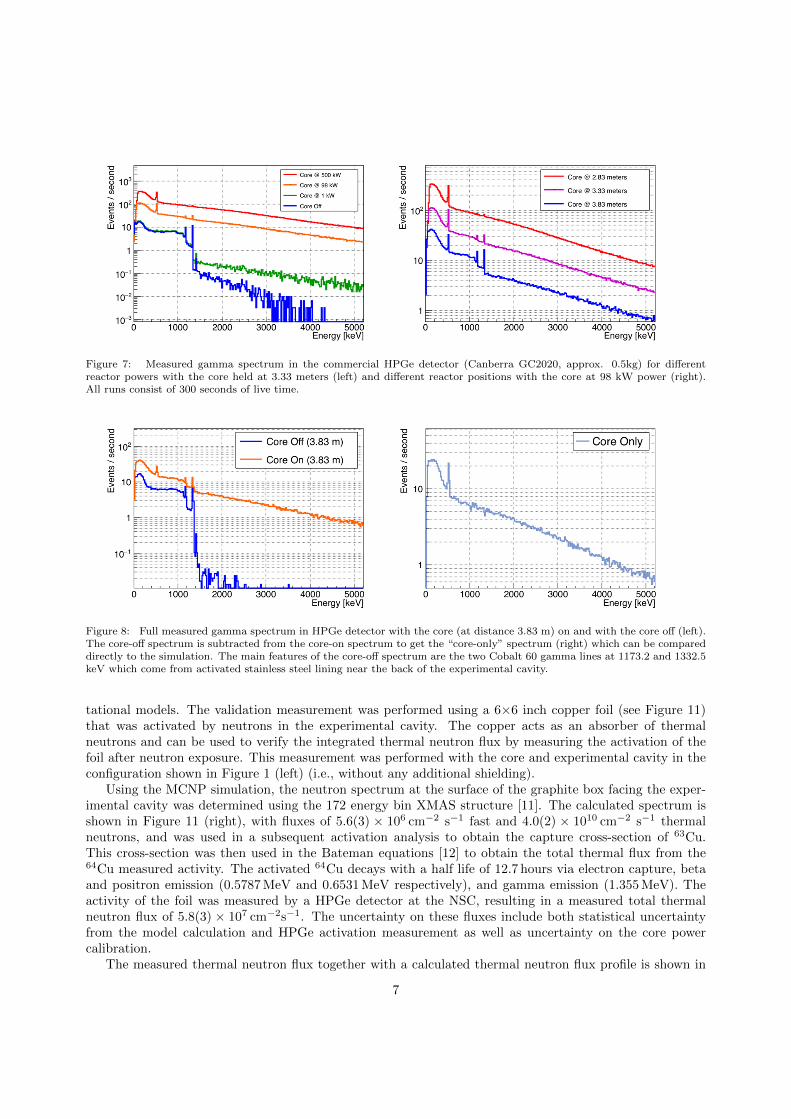
Figure 7: Measured gamma spectrum in the commercial HPGe detector (Canberra GC2020, approx. 0.5kg) for differentreactor powers with the core held at 3.33 meters (left) and different reactor positions with the core at 98 kW power (right).All runs consist of 300 seconds of live time.
Figure 8: Full measured gamma spectrum in HPGe detector with the core (at distance 3.83 m) on and with the core off (left).The core-off spectrum is subtracted from the core-on spectrum to get the “core-only” spectrum (right) which can be compareddirectly to the simulation. The main features of the core-off spectrum are the two Cobalt 60 gamma lines at 1173.2 and 1332.5keV which come from activated stainless steel lining near the back of the experimental cavity.
tational models. The validation measurement was performed using a 6×6 inch copper foil (see Figure 11)that was activated by neutrons in the experimental cavity. The copper acts as an absorber of thermalneutrons and can be used to verify the integrated thermal neutron flux by measuring the activation of thefoil after neutron exposure. This measurement was performed with the core and experimental cavity in theconfiguration shown in Figure 1 (left) (i.e., without any additional shielding).
Using the MCNP simulation, the neutron spectrum at the surface of the graphite box facing the exper-imental cavity was determined using the 172 energy bin XMAS structure [11]. The calculated spectrum isshown in Figure 11 (right), with fluxes of 5.6(3) × 106 cm−2 s−1 fast and 4.0(2) × 1010 cm−2 s−1 thermalneutrons, and was used in a subsequent activation analysis to obtain the capture cross-section of 63Cu.This cross-section was then used in the Bateman equations [12] to obtain the total thermal flux from the64Cu measured activity. The activated 64Cu decays with a half life of 12.7 hours via electron capture, betaand positron emission (0.5787 MeV and 0.6531 MeV respectively), and gamma emission (1.355 MeV). Theactivity of the foil was measured by a HPGe detector at the NSC, resulting in a measured total thermalneutron flux of 5.8(3) × 107 cm−2s−1. The uncertainty on these fluxes include both statistical uncertaintyfrom the model calculation and HPGe activation measurement as well as uncertainty on the core powercalibration.
The measured thermal neutron flux together with a calculated thermal neutron flux profile is shown in
7

Figure 9: Comparison of reactor core gamma spectrum measured by the Canberra HPGe detector and the prediction fromthe GEANT4 simulation. The GEANT4 prediction is scaled to match the integrated event count of the data for the region ofdeposited energy greater than 100 keV in order to compare shape. The large deviation in the region below 20 keV is due todetector threshold effects not accounted for in the simulation.
Figure 10: Event rate scaling as a function of deposited energy in the HPGe detector for different reactor core positions inthe measured data (left) and simulation (right). Error bars are statistical uncertainties only.
Figure 12. The data point was consistent with the expected result from the simulation within 5%, indicatingthat the neutron flux is predicted by the MCNP core model.
6. Muon Background Measurements
Bolometric detectors with low thresholds are particularly vulnerable to large energy depositions fromatmospheric muons. A typical solution for low rate experiments to this problem is to install such detectorsdeep underground, maximizing the overburden, and thus shielding of the detector. For detecting higherrate processes, such as neutrino interactions near a nuclear reactor, a higher muon rate can be tolerated.The experimental cavity proposed for this experiment provides some overburden in the form of the highdensity concrete wall surrounding the reactor pool, as the cavity is located within this wall (see Figure 1).This overburden has been characterized with regards to its muon shielding effectiveness by measurementsdescribed below.
Two polyvinyl-toluene scintillators (one smaller 1.75×0.5×0.375 in3 panel on top and a larger 13.0×3.0×0.375 in3 panel on bottom, separated by a 2 in lead brick) were installed to trigger on muons. These counterswere coupled to photomultiplier tubes via waveguides and were connected to front-end NIM electronics
8

Figure 11: Photo of the 6×6 in copper foil setup which was placed in the experimental cavity to be irradiated by neutrons(left).Neutron spectrum inside the experimental cavity at the surface of the graphite block facing the experimental cavity, as calculatedby MCNP (right). The neutron spectrum is bin-by-bin normalized to EAve/(E2 −E1) where E1 and E2 are the energy valuesat the respective bin edges and EAve is the average of these bin edge values.
to produce a coincidence signal when both scintillators triggered above threshold within a 3 ns windowof each other. Due to the high rate (and high energy) gamma environment, accidental triggers due torandom coincidence were an experimental concern. To characterize the rate of such events, the signal ofone scintillator was delayed arbitrarily to about 150 ns, maintaining all other aspects of the experimentalconditions. This setup was first exposed in the most radioactive location surveyed to get an upper limit onthe rate of random coincidence events. A 13 hr run under these conditions showed no events passing thecoincidence requirement, demonstrating that a subtraction correction for random coincidence would not benecessary.
Muon measurements were made with this setup at 5 locations. The first was made in a building adjacentto the reactor confinement building as a baseline measurement. This location has no effective overburdenand was used as a open-sky muon baseline reference. With this setup, a rate of about 1µ/min/cm2 wasmeasured at that location. The equipment was then moved to the lower research level of the reactorconfinement building. The other measurements were made in the confinement building and all share theoverburden of the 1 m thick high density concrete roof. The next measurement, performed outside of thereactor pool wall, showed a 17% reduction in muon rate compared to the baseline. The setup was theninstalled in the experimental cavity, inserted into 3 different positions in the cavity as shown in Figure 13.The measured reduction in muon rate with respect to the open-sky baseline is given in Table 1.
Position # Distance Into Cavity Muon Rate Reduction1 - 17 ± 6%2 1.0 m 50 ± 3%3 1.5 m 57 ± 6%4 2.5 m 47 ± 4%
Table 1: The muon rate reduction with respect to the open-sky measurement. Position number refers to the positions markedon the diagram in Figure 13. The open-sky measurement was taken in a separate building at the NSC facility located at groundlevel.
These measurements show a 50% reduction of muons incident upon the MINER detectors in the proposedexperimental cavity. They also guide calculations of energy depositions that will be carefully considered infinalizing the geometry of the detectors. For a given volume/mass, one must make a trade-off betweenmuon rate (determined effectively by a detector’s horizontal cross-section) and energy deposition per muon(determined by detector’s vertical dimension).
9

Figure 12: Thermal neutron flux as a function of distance from the reactor core center with only the graphite block betweencore and foil position. The data point represents the flux calculated using the measured activation of the copper foil at thatposition. The blue line (Rx Calc) indicates the flux calculated directly from the MCNP core model, while the red line (SSCalc) is this flux propagated through the graphite block and into the experimental cavity using MCNP from the core modeloutput.
7. Rate Estimate With Shielding
We then used the GEANT4 setup to estimate the backgrounds with a full preliminary shielding design,as shown in Figure 5. We generated approximately 3 × 10⁹ gamma and 4 × 10⁹ neutron events with thecore at the closest possible proximity to the experimental cavity (at the face of the graphite block shownin Figure 1). The simulation included 4 germanium detectors and 4 silicon detectors, each represented as100 mm diameter, 33 mm thickness cylinders, and backgrounds were assessed by determining the energydeposited in these volumes. Rates were determined using the scaling obtained in the previous gamma andneutron measurements. The resulting spectrum of energy deposited is shown in Figure 14.
These rates are compatible with the target background rate of 100 events/kg/day in the range of recoilenergy between 10 and 1000 eVnr and optimization of the shielding configuration will further reduce theestimated rate. The event rate outside of this window was found to be approximately 30 Hz summed inall detectors. It should be noted that moving the core further away would drastically reduce the expectedbackground, due to the addition of more water shielding between core and experiment, as well as the r−2
reduction with distance.
8. Summary and Future Prospects
We have performed in situ measurements and detailed simulations of expected backgrounds for theproposed MINER experiment with the goal of detecting CEνNS. Simulations reproduce the measurementsof thermal neutrons and gammas and were used to estimate the expected backgrounds with a full shieldingdesigned to bring the backgrounds down to a level compatible with a measurement of the CEνNS signalin the MINER experiment. This simulation has shown that it is indeed possible to reduce both neutronand gamma backgrounds to a level of about 100 events/kg/day in the range of recoil energy between 10 and1000 eVnr with the reactor core as close as about 2.3 m.
Gamma measurements will be performed with increased lead shielding and a core at the closest positionto the experiment. Neutron measurements will be performed with other foil samples to provide multiplechecks against the simulation, as well as with other detector technologies. In parallel, optimization of theshielding configuration is being performed in both the GEANT4 and MCNP simulations to further reducethe neutron and gamma background. Simulation of muon-induced neutron backgrounds are now underway,but these are expected to be small in the experimental region of interest.
10

Figure 13: Approximate position of the muon scintillation detector in the experimental cavity for the four measurementsmade.
Figure 14: Energy deposited in the germanium detectors due to neutron and gamma backgrounds as estimated using theGEANT4 simulation and shielding design shown in Figure 5. The core source was located at the closest possible proximity tothe experimental cavity. Uncertainties shown on this plot are statistical only.
Based on measurements reported here and planned in the future, we are developing plans for in situmonitoring of backgrounds for the MINER experiment. Several technologies are being considered includingsegmented, active liquid-scintillator shield, and a dedicated iZIP-type detector used by SuperCDMS [13] thatprovides excellent nuclear recoil discrimination down to 1 keV recoil energy. Also, to further monitor andcharacterize neutron backgrounds, a 6Li doped scintillator detector for thermal neutrons, and a PTP-dopedscintillator with neutron/gamma pulse shape discrimination for fast neutrons are being constructed at theTexas A&M University Cyclotron Institute.
9. Acknowledgements
The authors gratefully acknowledge the Mitchell Institute for Fundamental Physics and Astronomy forseed funding, as well as the Brazos HPC cluster at Texas A&M University (brazos.tamu.edu) and the TexasAdvanced Computing Center (TACC) at the University of Texas at Austin (www.tacc.utexas.edu) for pro-viding resources that have contributed to the research results reported within this paper. We also gratefullyacknowledge the TAMU Nuclear Science Center for facilitating the MINER experiment and providing nu-merous resources and advice in the course of planning and developing this program. R.M, R.H. and N.M
11

acknowledge the support of DOE grant DE-SC0014036 in development of synergistic activities with theSuperCDMS collaboration. G.V.R. acknowledges support by the U.S. Department of Energy, Office of Sci-ence, Office of Nuclear Science, under Award No. DE-FG02-93ER40773 and also support by the WelchFoundation (Grant No. A-1853). J.W.W. acknowledges support from NSF grant PHY-1521105 and theMitchell Institute for Fundamental Physics and Astronomy. L.S. acknowledges support from NSF grantPHY-1522717. B.D. acknowledges support from DOE grant DE-FG02-13ER42020.
References
References
[1] D. Z. Freedman, Phys. Rev. D 9, 1389 (1974). doi:10.1103/PhysRevD.9.1389[2] N. Mirabolfathi, H. R. Harris, R. Mahapatra, K. Sundqvist, A. Jastram, B. Serfass, D. Faiez and B. Sadoulet,
arXiv:1510.00999 [physics.ins-det].[3] P. N. Luke, J. Beeman, F. S. Goulding, S. E. Labov and E. H. Silver, Nucl. Instrum. Meth. A 289, 406 (1990).
doi:10.1016/0168-9002(90)91510-I[4] J. Barranco, O. G. Miranda and T. I. Rashba, JHEP 0512, 021 (2005) doi:10.1088/1126-6708/2005/12/021 [hep-
ph/0508299].[5] K. Scholberg, Phys. Rev. D 73, 033005 (2006) doi:10.1103/PhysRevD.73.033005 [hep-ex/0511042].[6] B. Dutta, Y. Gao, R. Mahapatra, N. Mirabolfathi, L. E. Strigari and J. W. Walker, arXiv:1511.02834 [hep-ph].[7] B. Dutta, R. Mahapatra, L. E. Strigari and J. W. Walker, Phys. Rev. D 93, no. 1, 013015 (2016)
doi:10.1103/PhysRevD.93.013015 [arXiv:1508.07981 [hep-ph]].[8] T. Goorley et al., Nucl. Tech. 180, 298 (2012).[9] S. Agostinelli et al., Nucl. Instrum. Meth. A506, 250-303 (2003).
[10] http://www.slac.stanford.edu/comp/physics/geant4/slac_physics_lists/shielding/physlistdoc.html.[11] Cacuci D.G., 2010. ISBN:978-0-387-98149-9.[12] H. Bateman, Proc. Cambridge Phil. Soc., 15. 423-427. 1910.[13] P. L. Brink et al., Nucl. Instrum. Meth. A 559, 414 (2006). doi:10.1016/j.nima.2005.12.026
12