backup data report niosh method no. 8320
TRANSCRIPT
NIOSH Manual of Analytical Methods (NMAM), Fifth Edition
NIOSH Manual of Analytical Methods (NMAM) 5th Edition
BACKUP DATA REPORT NIOSH Method No. 8320
Title: Butyltin trichloride in urine
Analyte: Butyltin Trichloride
Author/developer:Don C. Wickman, James B. Perkins
Date: June 24, 2016
NOTE: Method developed under contract #CDC-200-2001-0800
Disclaimer: Mention of any company or product does not constitute endorsement by the National Institute for Occupational Safety and Health, Centers for Disease Control and Prevention. In addition, citations to websites external to NIOSH do not constitute NIOSH endorsement of the sponsoring organizations or their programs or products. Furthermore, NIOSH is not responsible for the content of these websites. All web addresses referenced in this document were accessible as of the publication date.

2
BUTYLTIN TRICHLORIDE IN URINE
I. Introduction:
Butyltin compounds have been used extensively as antifouling coatings on ships and as a
consequence, much work has been done on analyzing organotins in sediments, biota, and aqueous
samples [1-13]. Included in this body of work are reviews of analytical methods [4, 10].
Of the three butyltin chlorides, monobutyl tin is the least toxic and tributyl tin the most.
This trend is also true of other alkyl tins. A single alkyl chain compound is generally less toxic
than the di- or tri-alkyltin. Of alkyl tins, the shorter the chain, e.g. ethyltins and methyltins, the
more toxic the compound; the longer chain compounds are less toxic. A number of reviews of
toxicological data on organotins are available [14-17].
There have been several reported incidences of human fatalities after exposure to organotin
compounds. In France, in 1954, a pharmaceutical preparation called Stalinon caused a number of
deaths. Stalinon was an oral capsule containing 15 mg of diethyltin diiodide prescribed for boils,
staphylococcal skin infections, osteomyelitis, anthrax and acne. The main impurities were
monoethyltin triiodide and triethyltin iodide. The triethyltin iodide was about 1.5 mg/capsule and
was believed to be the main cause of the poisoning. Over 100 of the known 217 cases of poisoning
died after an estimated dose of 3 g triethyltin iodide over 6-8 weeks. Triethyltin iodide as low as 70
mg over eight days appeared toxic in adults. Symptoms appeared after four days. If death occurred,
it was often preceded by a coma or was during convulsions or from respiratory or cardiac failure
[16].
In a separate incident, one worker out of six died twelve days after an industrial exposure to
50:50 dimethyltin and trimethyltin chloride vapor. Exposure was 1.5 hours total over three days.
No exposure levels were given. Lethal doses for mono-organotins, however, ranging from 1500 -
3
6000 mg/kg for rodents have been reported suggesting these compounds have relatively low
toxicity [15]. More recently, three died and over a thousand were poisoned by lard contaminated
with tri- and di-methyltin in China [18].
Butyltin compounds are also used as stabilizers in plastics, catalysts, and biocides. Butyltin
trichloride is increasingly used in the glass industry [19]. A thin coating of tin oxide is deposited on
glass bottles by the decomposition of butyltin trichloride at elevated temperatures. Workers in this
phase of bottle production may be exposed to the unreacted tin chloride. Because of the expanding
industrial processes employing organotin compounds, a number of papers have recently quantified
these compounds in urine, blood and air [18, 20-22]. While there are exposure limits for tin and
organic tin compounds in air, there are currently no such exposure limits for tin or butyltin
compounds in urine or blood.
Due to the organometallic nature of these compounds, a wide variety of analytical
techniques can be employed to analyze these compounds. Atomic emission and absorption
spectroscopy as well as inductively-coupled plasma mass spectrometry (ICP-MS) have been used
to quantitate tin from an inorganic perspective [3, 5, 6, 9, 11, 18, 20, 21, 23, 24]. Because of the
ionic behavior of the alkyltin halides, derivatization procedures such as Grignard reagents (which
are alkyl, vinyl, or aryl-magnesium halides), sodium tetraethylborate or sodium borohydride have
been used to convert the tin halides to pure alkyltin or alkyltin hydrides which are then
chromatographically separated and detected often utilizing a flame photometric detector (FPD) or
mass spectrometry [1, 3, 4, 12, 13, 18, 22, 25, 28, 29].

4
II. Reagents:
Reagent Vendor Purity (%) Butyltin trichloride Aldrich Chemical 95
Dibutyltin dichloride Aldrich Chemical 96 Tributyltin chloride Aldrich Chemical 96 Tetraethyl tin Acros Chemical 97 Tetrabutyl tin Acros Chemical 96 Sodium tetraethylborate Aldrich Chemical 97 Ethylmagnesium bromide Aldrich Chemical 1.0 M solution in tetrahydrofuran Hexane Burdick & Jackson Pesticide Grade Sulfuric acid Fisher Scientific 95-98Sodium acetate, acetic acid buffer, pH 4
Fisher Scientific Reagent Grade
Sodium citrate dihydrate J.T. Baker 99.6 Citric acid monohydrate Mallinckrodt 100 Toluene Burdick & Jackson Pesticide Grade Tropolone Lancaster 98 Alumina, acid, Brockman activity 1, 80-200 mesh
Fisher Scientific Chromatographic Grade
Sodium sulfate, anhydrous Fisher Scientific Reagent Grade UriSub® synthetic urine CST Technologies, Inc. N/A
Florisil® Sigma Chromatographic Grade
III. Solutions Preparation:
1% Sodium tetraethylborate was prepared by weighing typically less than 350 mg sodium
tetra-ethylborate into a 40-mL VOA glass vial with a PTFE septum. This weighing must be done in
an inert atmosphere of nitrogen. Cap the vial and store in a freezer until use. For use, add sufficient
water to prepare a 1% w/v solution by syringe through the septum. Once the solution is prepared,
the cap can be removed. Prepare fresh daily.
To prepare the citric acid/sodium citrate buffer, dissolve 20.554 g citric acid and 0.652 g
sodium citrate (~pH 2.3) in 1 L deionized water. Additional buffers at pH 3 and 4 were prepared
for method development experiments. See Table 3 in section VI. B. for buffer composition.
0.1% tropolone in toluene was prepared by dissolving 100 mg tropolone in 100 mL toluene.
5
To prepare the 1 M sulfuric acid solution, dilute 5.6 mL concentrated sulfuric acid with
water to 100 mL final volume.
IV. Materials:
o 15-mL Polypropylene centrifuge tubes with screw cap. VWR Cat. # 21008-089 or equivalent
o Centrifuge capable of at least 2400 RPM o Disposable Pasteur pipettes, 14.6 cm (5¾ in) & 22.9 cm (9 in) o ~8-mL Test or culture tubes, screw tops with PFTE-lined caps o 40-mL VOA glass vials, caps to fit with holes and PFTE septa o GC-MS capable of selected ion monitoring with autosampler and data collection
system o Microliter syringes for making standard solutions and GC injections o 5-mL Glass volumetric flasks o 1-5-mL Adjustable pipettor with tips o Glass wool o Vortex mixer o Tumbler for centrifuge tubes, approximately 20 RPM
V. Analysis:
All of the method development was performed on an HP 5890 Gas Chromatograph (GC)
coupled to an HP 5972 Mass Selective Detector and 7673B autosampler. The column used was 30
m x 0.32 mm ID with a 0.5 μm film DB-5ms. The mass spectrometer used electron impact
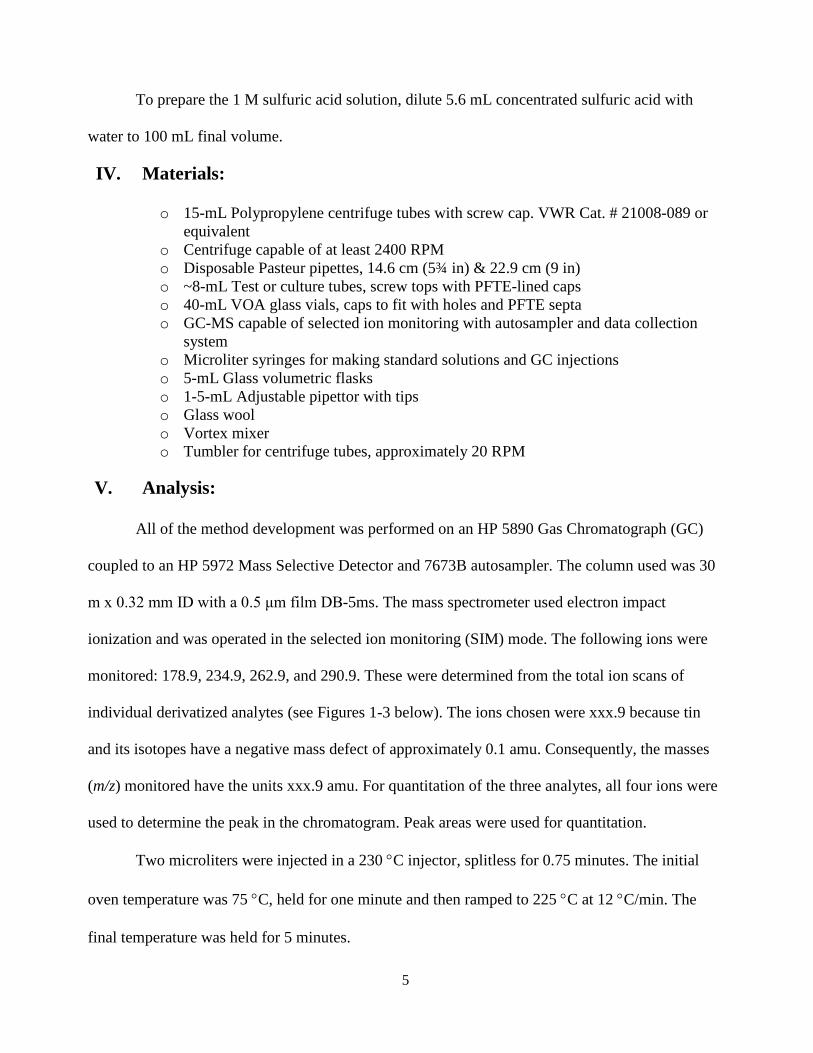
ionization and was operated in the selected ion monitoring (SIM) mode. The following ions were
monitored: 178.9, 234.9, 262.9, and 290.9. These were determined from the total ion scans of
individual derivatized analytes (see Figures 1-3 below). The ions chosen were xxx.9 because tin
and its isotopes have a negative mass defect of approximately 0.1 amu. Consequently, the masses
(m/z) monitored have the units xxx.9 amu. For quantitation of the three analytes, all four ions were
used to determine the peak in the chromatogram. Peak areas were used for quantitation.
Two microliters were injected in a 230 °C injector, splitless for 0.75 minutes. The initial
oven temperature was 75 °C, held for one minute and then ramped to 225 °C at 12 °C/min. The
final temperature was held for 5 minutes.
6
Experimentally obtained total ion spectra for the three butyltin derivatives are displayed in
Figures 1-3. Following the spectra in Figure 4 is a typical chromatogram of all three derivatives in
a mix.
Figure 1. Mass Spectrum of Butyltin Trichloride Derivative: Butyltriethyltin.

7
Figure 2. Mass Spectrum of Dibutyltin Dichloride Derivative: Dibutyldiethyltin.
Figure 3. Mass Spectrum of Tributyltin Chloride Derivative: Tributylethyltin.

8
Figure 4. Chromatogram of the Three Butyltin Derivatives.
During method development, experimental conditions and parameters were evaluated that do not
appear in the final version of the method. Data are presented from these experiments in the following
sections. This chronological presentation has led to confusion on the part of some readers. To go directly to
the experimental conditions and evaluation data found in the method, please click the appropriate
following links: Final procedure, LOD/LOQ determination, Recoveries at various concentration levels,
precision and accuracy, long-term storage.
9
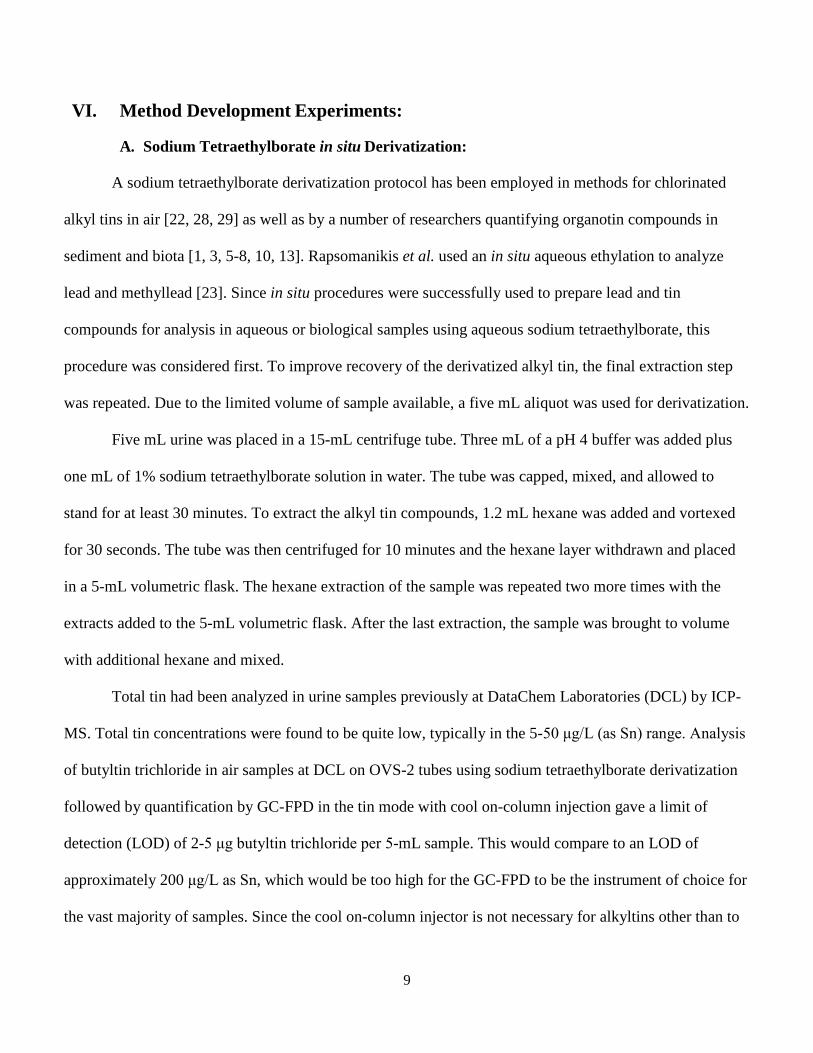
VI. Method Development Experiments:
A. Sodium Tetraethylborate in situ Derivatization:
A sodium tetraethylborate derivatization protocol has been employed in methods for chlorinated
alkyl tins in air [22, 28, 29] as well as by a number of researchers quantifying organotin compounds in
sediment and biota [1, 3, 5-8, 10, 13]. Rapsomanikis et al. used an in situ aqueous ethylation to analyze
lead and methyllead [23]. Since in situ procedures were successfully used to prepare lead and tin
compounds for analysis in aqueous or biological samples using aqueous sodium tetraethylborate, this
procedure was considered first. To improve recovery of the derivatized alkyl tin, the final extraction step
was repeated. Due to the limited volume of sample available, a five mL aliquot was used for derivatization.
Five mL urine was placed in a 15-mL centrifuge tube. Three mL of a pH 4 buffer was added plus
one mL of 1% sodium tetraethylborate solution in water. The tube was capped, mixed, and allowed to
stand for at least 30 minutes. To extract the alkyl tin compounds, 1.2 mL hexane was added and vortexed
for 30 seconds. The tube was then centrifuged for 10 minutes and the hexane layer withdrawn and placed
in a 5-mL volumetric flask. The hexane extraction of the sample was repeated two more times with the
extracts added to the 5-mL volumetric flask. After the last extraction, the sample was brought to volume
with additional hexane and mixed.
Total tin had been analyzed in urine samples previously at DataChem Laboratories (DCL) by ICP-
MS. Total tin concentrations were found to be quite low, typically in the 5-50 μg/L (as Sn) range. Analysis
of butyltin trichloride in air samples at DCL on OVS-2 tubes using sodium tetraethylborate derivatization
followed by quantification by GC-FPD in the tin mode with cool on-column injection gave a limit of
detection (LOD) of 2-5 μg butyltin trichloride per 5-mL sample. This would compare to an LOD of
approximately 200 μg/L as Sn, which would be too high for the GC-FPD to be the instrument of choice for
the vast majority of samples. Since the cool on-column injector is not necessary for alkyltins other than to
10
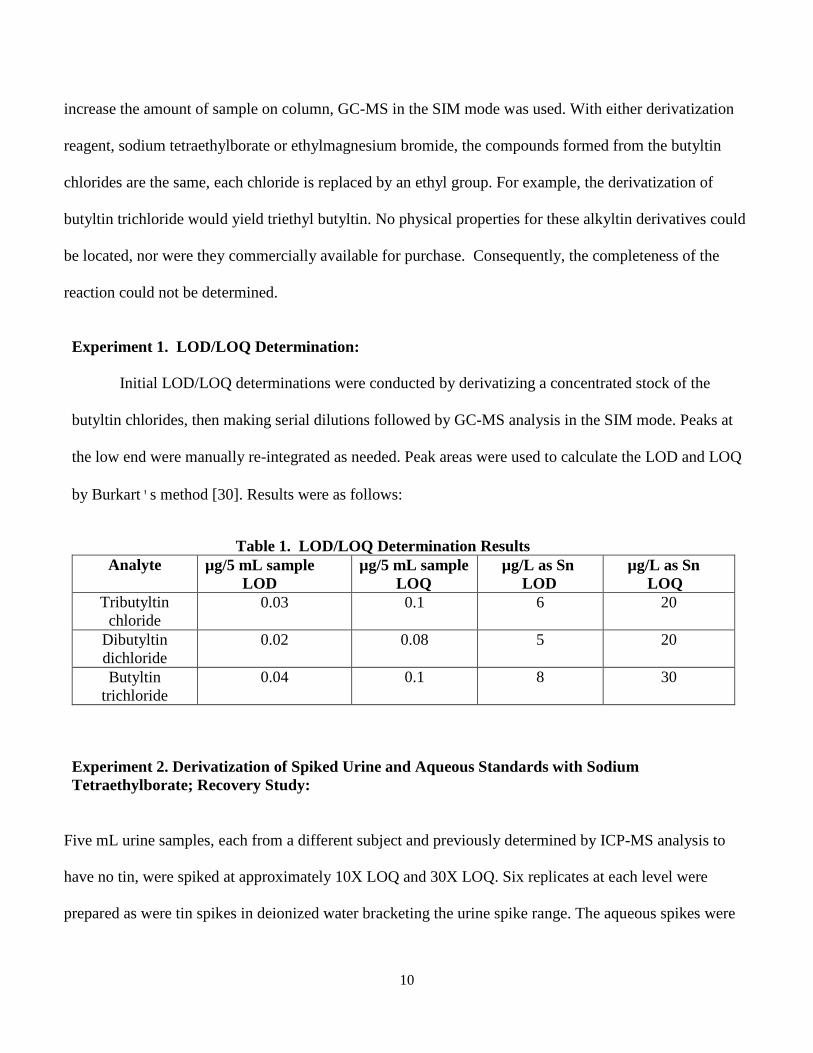
increase the amount of sample on column, GC-MS in the SIM mode was used. With either derivatization
reagent, sodium tetraethylborate or ethylmagnesium bromide, the compounds formed from the butyltin
chlorides are the same, each chloride is replaced by an ethyl group. For example, the derivatization of
butyltin trichloride would yield triethyl butyltin. No physical properties for these alkyltin derivatives could
be located, nor were they commercially available for purchase. Consequently, the completeness of the
reaction could not be determined.
Experiment 1. LOD/LOQ Determination:
Initial LOD/LOQ determinations were conducted by derivatizing a concentrated stock of the
butyltin chlorides, then making serial dilutions followed by GC-MS analysis in the SIM mode. Peaks at
the low end were manually re-integrated as needed. Peak areas were used to calculate the LOD and LOQ
by Burkart's method [30]. Results were as follows:
Table 1. LOD/LOQ Determination Results Analyte µg/5 mL sample
LOD µg/5 mL sample
LOQ µg/L as Sn
LOD µg/L as Sn
LOQ Tributyltin
chloride 0.03 0.1 6 20
Dibutyltin dichloride
0.02 0.08 5 20
Butyltin trichloride
0.04 0.1 8 30
Experiment 2. Derivatization of Spiked Urine and Aqueous Standards with Sodium Tetraethylborate; Recovery Study:
Five mL urine samples, each from a different subject and previously determined by ICP-MS analysis to
have no tin, were spiked at approximately 10X LOQ and 30X LOQ. Six replicates at each level were
prepared as were tin spikes in deionized water bracketing the urine spike range. The aqueous spikes were
11
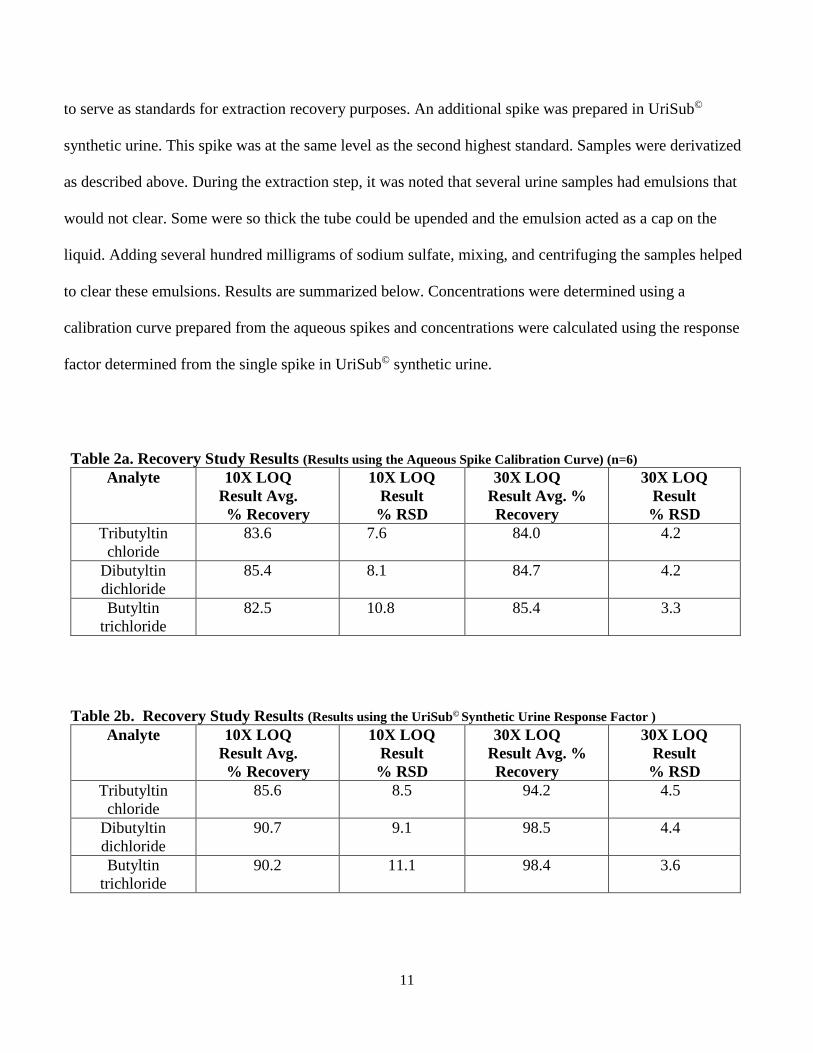
to serve as standards for extraction recovery purposes. An additional spike was prepared in UriSub©
synthetic urine. This spike was at the same level as the second highest standard. Samples were derivatized
as described above. During the extraction step, it was noted that several urine samples had emulsions that
would not clear. Some were so thick the tube could be upended and the emulsion acted as a cap on the
liquid. Adding several hundred milligrams of sodium sulfate, mixing, and centrifuging the samples helped
to clear these emulsions. Results are summarized below. Concentrations were determined using a
calibration curve prepared from the aqueous spikes and concentrations were calculated using the response
factor determined from the single spike in UriSub© synthetic urine.
Table 2a. Recovery Study Results (Results using the Aqueous Spike Calibration Curve) (n=6) Analyte 10X LOQ
Result Avg. % Recovery
10X LOQ Result
% RSD
30X LOQ Result Avg. % Recovery
30X LOQ Result
% RSD Tributyltin
chloride 83.6 7.6 84.0 4.2
Dibutyltin dichloride
85.4 8.1 84.7 4.2
Butyltin trichloride
82.5 10.8 85.4 3.3
Table 2b. Recovery Study Results (Results using the UriSub© Synthetic Urine Response Factor ) Analyte 10X LOQ
Result Avg. % Recovery
10X LOQ Result
% RSD
30X LOQ Result Avg. % Recovery
30X LOQ Result
% RSD Tributyltin
chloride 85.6 8.5 94.2 4.5
Dibutyltin dichloride
90.7 9.1 98.5 4.4
Butyltin trichloride
90.2 11.1 98.4 3.6

12
Conclusions Concerning Sodium Tetraethylborate in situ Derivatization:
The % RSD at 10X LOQ was a factor of two to three times the % RSD at 30X LOQ. While
experiments at 3X LOQ were not conducted, the concern was at that level the method would fail. Noted
too was the fact that apparent recoveries were higher when quantitating using the synthetic urine response
factor than when quantitating against standards prepared from aqueous spikes. It was decided to try the
tropolone extraction protocol instead of the in situ derivatization to see if recoveries and precision at lower
levels could be improved.
B. Derivatization with Ethylmagnesium Bromide Following Tropolone Extraction: Tropolone (2-hydroxy-2,4,6-cycloheptatrienone) has been used by a number of researchers to
complex butyltin chlorides in a variety of polar matrices to allow extraction into a non-polar solvent [5-9,
12, 18, 20, 21, 26, 27]. Derivatization is typically done by employing a Grignard reagent, although sodium
tetraethylborate can be used [5-7]. Chau et al., with an emphasis on extracting monobutyltin trichloride,
felt toluene gave the best recoveries [9]. For the next series of experiments, tropolone in toluene was used
to extract the butyltin chlorides followed by derivatization with ethylmagnesium bromide as the Grignard
reagent. The procedure used was based on the procedures outlined in the journal articles.
A number of experiments were performed to test various aspects of the tentative protocol before the
final procedure was settled on. These were either suggested by the literature or deemed necessary to
provide the best recoveries.
In the experiments described below, 15-mL centrifuge tubes were prepared containing 5 mL urine
previously determined at DCL to contain no tin. The source of the urine is described for each experiment
and could be either pooled urine or urine from different subjects. The tubes were spiked with the
previously prepared tin mix described above at a level of 10X LOQ.
13
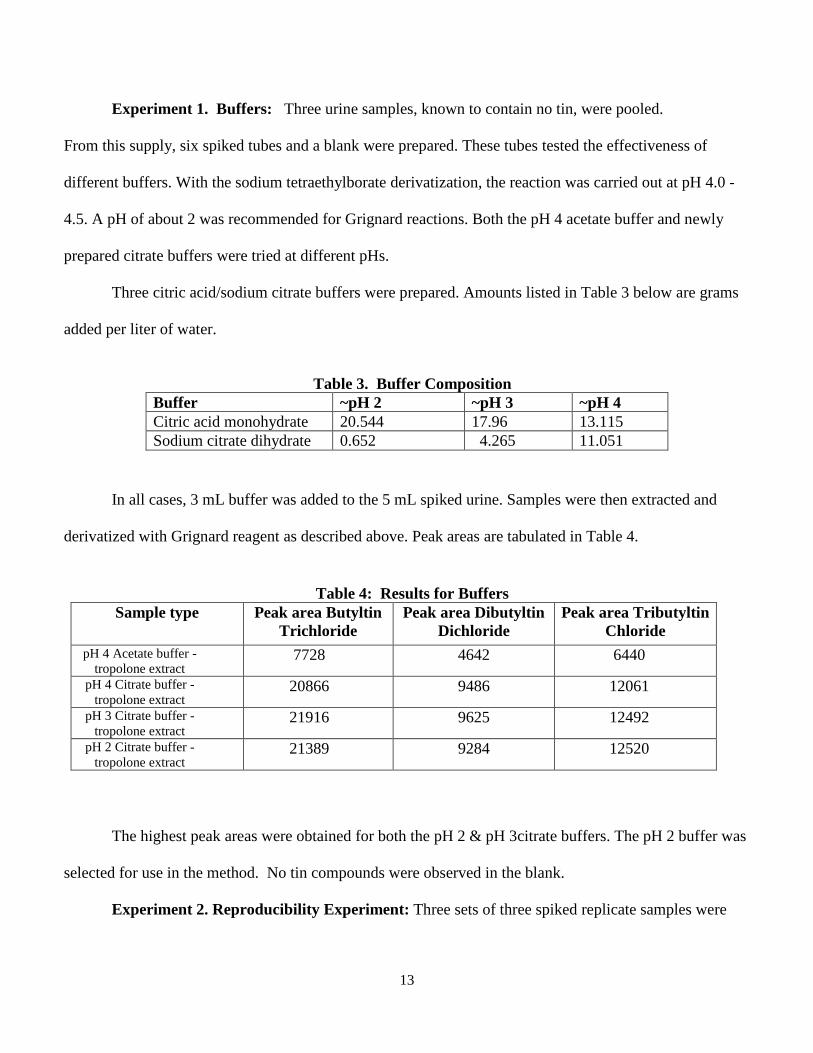
Experiment 1. Buffers: Three urine samples, known to contain no tin, were pooled.
From this supply, six spiked tubes and a blank were prepared. These tubes tested the effectiveness of
different buffers. With the sodium tetraethylborate derivatization, the reaction was carried out at pH 4.0 -
4.5. A pH of about 2 was recommended for Grignard reactions. Both the pH 4 acetate buffer and newly
prepared citrate buffers were tried at different pHs.
Three citric acid/sodium citrate buffers were prepared. Amounts listed in Table 3 below are grams
added per liter of water.
Table 3. Buffer Composition
Buffer ~pH 2 ~pH 3 ~pH 4 Citric acid monohydrate 20.544 17.96 13.115 Sodium citrate dihydrate 0.652 4.265 11.051
In all cases, 3 mL buffer was added to the 5 mL spiked urine. Samples were then extracted and
derivatized with Grignard reagent as described above. Peak areas are tabulated in Table 4.
Table 4: Results for Buffers
Sample type Peak area Butyltin Trichloride
Peak area Dibutyltin Dichloride
Peak area Tributyltin Chloride
pH 4 Acetate buffer - tropolone extract
7728 4642 6440
pH 4 Citrate buffer - tropolone extract
20866 9486 12061
pH 3 Citrate buffer - tropolone extract
21916 9625 12492
pH 2 Citrate buffer - tropolone extract
21389 9284 12520
The highest peak areas were obtained for both the pH 2 & pH 3citrate buffers. The pH 2 buffer was
selected for use in the method. No tin compounds were observed in the blank.
Experiment 2. Reproducibility Experiment: Three sets of three spiked replicate samples were

14
prepared from three different NIOSH supplied urine samples. These three sets were prepared and analyzed
the same way to see how reproducible results are. Additionally, a set of three replicate samples containing
pooled urine from the buffer experiment above were analyzed. Peak areas for the four sets of samples are
averaged and presented in Table 5.
Table 5. Results for Reproducibility Experiment Urine source Butyltin
Trichloride avg peak area
Butyltin Trichloride %RSD
Dibutyltin dichloride avg peak area
Dibutyltin dichloride %RSD
Tributyltin chloride avg peak area
Tributyltin chloride %RSD
NIOSH 12-6-B 24654 0.45 10198 0.90 14189 3.31 NIOSH 12-5-B 26832 0.78 9127 2.46 14055 0.55 NIOSH 6-5-B 24656 2.62 10044 1.82 13901 1.21 Pooled 2al 22216 3.23 9724 4.06 12831 2.54
Similar peak areas were observed for all sets of samples with the largest variation in average areas
with dibutyltin dichloride, approximately 9%. Overall, this was not viewed as a significant problem.
Experiment 3. Extraction and Cleanup Experiments: The amount of tin extracted from the
urine matrix by the tropolone-toluene extraction solution was tested. The first tropolone extract from four
spiked samples was combined, derivatized and analyzed; the second extraction was similarly prepared and
analyzed.
A number of journal articles recommended a cleanup procedure before analysis [2, 4, 6, 8, 9, 12,
18, 21]. Florisil and alumina cleanups were tried on aliquots of the combined first and second extractions.
Extraction and Cleanup Experiment Results: The efficiency of the first extraction was
determined by dividing the peak area of the first extract analysis by the sum of the areas for both extracts.
For the cleanup experiment, 1.5 mL aliquots of the first and second extracts were each passed through a 1-

15
cm column of either florisil, alumina, or sodium sulfate in a 14.6 cm (5¾ in) Pasteur pipette prior to
analysis. The column was rinsed with small portions of toluene and the volume brought to 2 mL. Peak
areas for each analyte are tabulated with the cleanup procedure used.
Table 6. Second Extraction and Sample Cleanup Results Sample type/Cleanup Step Butyltin Trichloride Dibutyltin Dichloride Tributyltin Chloride
First extract as % of total area (average)
87% 89% 82%
First extract peak area- florisil
51077 16418 26148
First extract peak area - alumina
57462 18861 28385
First extract peak area - sodium sulfate
60634 19900 29599
Second extract peak area - florisil
8117 2217 6323
Second extract peak area - alumina
8652 2249 5410
Second extract peak area - sodium sulfate
8737 2219 6781
Extraction and Cleanup Experiment Conclusions: The efficiency of the first extraction was
overall approximately 86%. The second extraction was believed necessary because of the low butyltin
concentrations expected in the field samples. Alumina appeared to be a better cleanup media than florisil
as evidenced by the slightly higher peak areas for the alumina aliquot. To eliminate any traces of water
prior to analysis, a small quantity of sodium sulfate will be used in addition. The sodium sulfate did not
seem to have a detrimental effect of the analysis results.
Experiment 4. Derivatization Kinetics: Fifteen mL of toluene-tropolone was spiked with butyltin
chlorides and mixed thoroughly. To this, 1.25 mL ethylmagnesium bromide solution was added and
vortexed. At timed intervals, 3-mL aliquots were removed and transferred to another tube containing one
mL sulfuric acid solution to quench the reaction. The alkyltins were subsequently analyzed.

16
Derivatization Kinetics Results: Peak areas vs. time of reaction quenching are shown in graphic
form in Figure 5 and in tabular form in Table 7.
Figure 5. Butyltin Kinetics
Table 7. Tabulated Peak Areas for Reaction Kinetics Time (minutes) Peak area Butyltin
Trichloride Peak area Dibutyltin
Dichloride Peak area Tributyltin
Chloride 3 71304 85909 47553 15 70850 85947 47670 30 71345 88264 48258 45 72396 87604 48034 60 72353 88762 48682
17
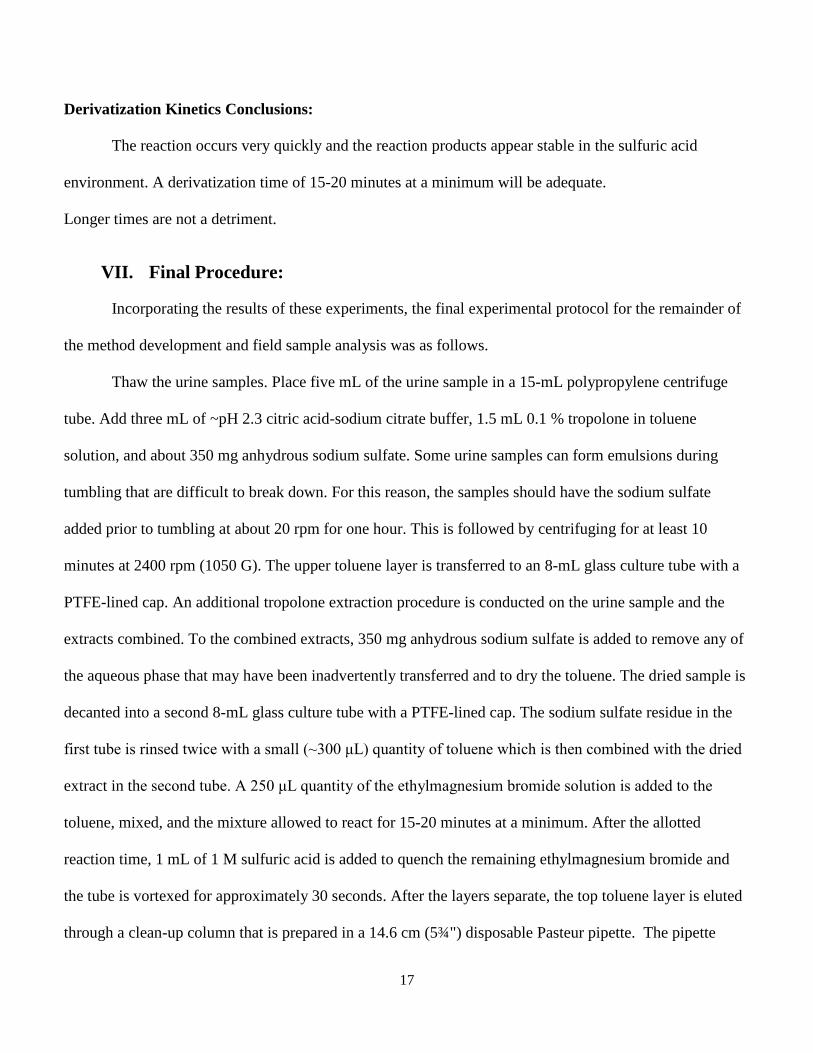
Derivatization Kinetics Conclusions:
The reaction occurs very quickly and the reaction products appear stable in the sulfuric acid
environment. A derivatization time of 15-20 minutes at a minimum will be adequate.
Longer times are not a detriment.
VII. Final Procedure:
Incorporating the results of these experiments, the final experimental protocol for the remainder of
the method development and field sample analysis was as follows.
Thaw the urine samples. Place five mL of the urine sample in a 15-mL polypropylene centrifuge
tube. Add three mL of ~pH 2.3 citric acid-sodium citrate buffer, 1.5 mL 0.1 % tropolone in toluene
solution, and about 350 mg anhydrous sodium sulfate. Some urine samples can form emulsions during
tumbling that are difficult to break down. For this reason, the samples should have the sodium sulfate
added prior to tumbling at about 20 rpm for one hour. This is followed by centrifuging for at least 10
minutes at 2400 rpm (1050 G). The upper toluene layer is transferred to an 8-mL glass culture tube with a
PTFE-lined cap. An additional tropolone extraction procedure is conducted on the urine sample and the
extracts combined. To the combined extracts, 350 mg anhydrous sodium sulfate is added to remove any of
the aqueous phase that may have been inadvertently transferred and to dry the toluene. The dried sample is
decanted into a second 8-mL glass culture tube with a PTFE-lined cap. The sodium sulfate residue in the
first tube is rinsed twice with a small (~300 μL) quantity of toluene which is then combined with the dried
extract in the second tube. A 250 μL quantity of the ethylmagnesium bromide solution is added to the
toluene, mixed, and the mixture allowed to react for 15-20 minutes at a minimum. After the allotted
reaction time, 1 mL of 1 M sulfuric acid is added to quench the remaining ethylmagnesium bromide and
the tube is vortexed for approximately 30 seconds. After the layers separate, the top toluene layer is eluted
through a clean-up column that is prepared in a 14.6 cm (5¾") disposable Pasteur pipette. The pipette

18
contains, in order from bottom to top: 1) a glass wool plug; 2) alumina, acid, Brockman activity I, 80-200
mesh, enough to form a column of approximately 1 cm and; 3) ~100 mg of anhydrous sodium sulfate. The
eluate is collected in a 5-mL volumetric flask. The tube with the sulfuric acid solution is rinsed several
times with small amounts of toluene and the rinses eluted through the clean-up column. The remaining
sample is flushed from the column by adding small portions of toluene to the top of the column. The final
volume is adjusted to 5.0 mL with toluene as needed. Analysis is by the instrument conditions described
previously.
VIII. Limit of Detection and Limit of Quantitation Determination for Method
Spiking Levels:
The LOD and LOQ were determined by spiking 5 mL of urine in 15-mL centrifuge tubes with
known concentrations of the three butyltin chlorides. A mixed standard was prepared as follows; the
solvent used in all cases was 1% acetic acid in acetonitrile. For tributyltin chloride (96%, d = 1.200
mg/μL), 10 μL were diluted in 10 mL to give a concentration of 1.152 μg/μL. For dibutyltin dichloride
(96%), 16.05 mg were dissolved in 10 mL giving a concentration of 1.54 μg/μL. For butyltin trichloride
(95%, d = 1.693 mg/μL), 10 μL were diluted in 10 mL to give a concentration of 1.608 μg/μL.
In previous work with these particular chemicals, it was found that dibutyltin dichloride was
contaminated with butyltin trichloride. The concentration of butyltin trichloride was determined in the
dibutyltin dichloride by peak area determination against a separate butyltin trichloride series of standards
and found to be 0.04987 μg butyltin trichloride per 1 μg dibutyltin dichloride.
Table 8. Stock Standard Mix Concentrations Analyte µg/µL Volume (µL) Final Volume
(mL) Final Conc. (µg/µL)
Tributyltin chloride 1.152 17.5 5 0.004032 Dibutyltin dichloride 1.54 14 5 0.004312 Butyltin trichloride 1.608 10 5 0.003431*
* includes contribution by dibutyltin contaminant.

19
Microliter amounts of the solution were spiked into 5 mL urine according to the
following schedule:
Table 9. Working Standard Spiking Schedule (Concentration in μg/ 5 mL Sample)
Standard Spiked Volume (µL)
Butyltin Trichloride
Concentration
Dibutyltin Dichloride
Concentration
Tributyltin Chloride
Concentration 1 250 0.85775 1.078 1.008 2 175 0.600425 0.7546 0.7056 3 100 0.3431 0.4312 0.4032 4 50 0.1716 0.2156 0.2016 5 24 0.085775 0.1078 0.1008 6 10 0.03431 0.04312 0.04032 7 5 0.01716 0.02156 0.02016 8 2 0.006862 0.008624 0.008064
Spiked samples were extracted with toluene-tropolone and then derivatized with ethylmagnesium
bromide followed by the column cleanup as described in the previously described procedure. An aliquot of
each sample was transferred to a GC vial for analysis by GC-MS in the SIM mode. Peak areas for butyltin
and dibutyltin were tabulated and the LOD/LOQ determined by Burkart’s method [30]. An interfering
peak was observed which prevented accurate quantitation of the tributyltin peak. This peak was composed
of the m/z 179 ion. This had not been noticed previously because the LOD/LOQ was determined by a
derivatization of a high standard followed by serial dilution of this stock. Additionally, sodium
tetraethylborate was used instead of the ethylmagnesium bromide. It is unknown if this had an effect or
not. Monitoring the m/z 179 ion was stopped prior to the retention time of the tributyltin peak. This seemed
to solve the problem and allow good quantitation of the tributyltin peak in later analyses. This would have
also required the reanalysis of the LOD/LOQ standards to determine the LOD and LOQ of tributyltin
chloride. For further method development purposes, the LOD and LOQ were estimated for this compound.
It should be noted that LODs/LOQs for this procedure are lower by about half than LOQs for the sodium
tetraethylborate derivatization. The LODs were determined to be 0.01 μg/5 mL for tributyltin chloride

20
(estimated), 0.02 μg/5 mL for dibutyltin dichloride, and 0.01 μg/5 mL for butyltin trichloride. Spiking
levels for the method development were then determined to be:
Table 10. Method Development Urine Spiking Levels (Spiking Levels in μg/5 mL Sample) Analyte LOQ 3X LOQ 10X LOQ 30X LOQ 100X LOQ Tributyltin chloride 0.05* 0.15 0.5 1.5 5 Dibutyltin dichloride 0.06 0.18 0.6 1.8 6 Butyltin trichloride 0.04 0.12 0.4 1.2 4
*Estimated LOQ
IX. Extraction Efficiency at 3X, 10X, 30X, and 100X LOQ:
A new mix of analytes based on the previously determined LOD/LOQ was prepared from the
concentrated stocks as described below:
Table 11. Extraction Efficiency Spiking Mix Analyte µg/µL Volume (µL) Final Volume
(mL) Final Conc. (µg/µL)
Tributyltin chloride 1.152 110 5 0.025344 Dibutyltin dichloride 1.54 98 5 0.030184 Butyltin trichloride 1.608 58 5 0.020158*
* includes contribution by dibutyltin contaminant.
Aliquots of this solution were spiked into 5 mL urine in 15-mL centrifuge tubes at the
four spiking levels. Six replicate samples were prepared at each level.
Table 12. Target Concentrations (Concentration Levels in μg/ 5 mL Sample) LOQ level Spiked Volume
(µL) Butyltin
Trichloride Concentration
Dibutyltin Dichloride
Concentration
Tributyltin Chloride
Concentration 100 X 200 4.03156 6.0368 5.0688 30X 60 1.20947 1.8110 1.5206 10X 20 0.40316 0.6037 0.5069 3X 6 0.12095 031811 0.1521
21
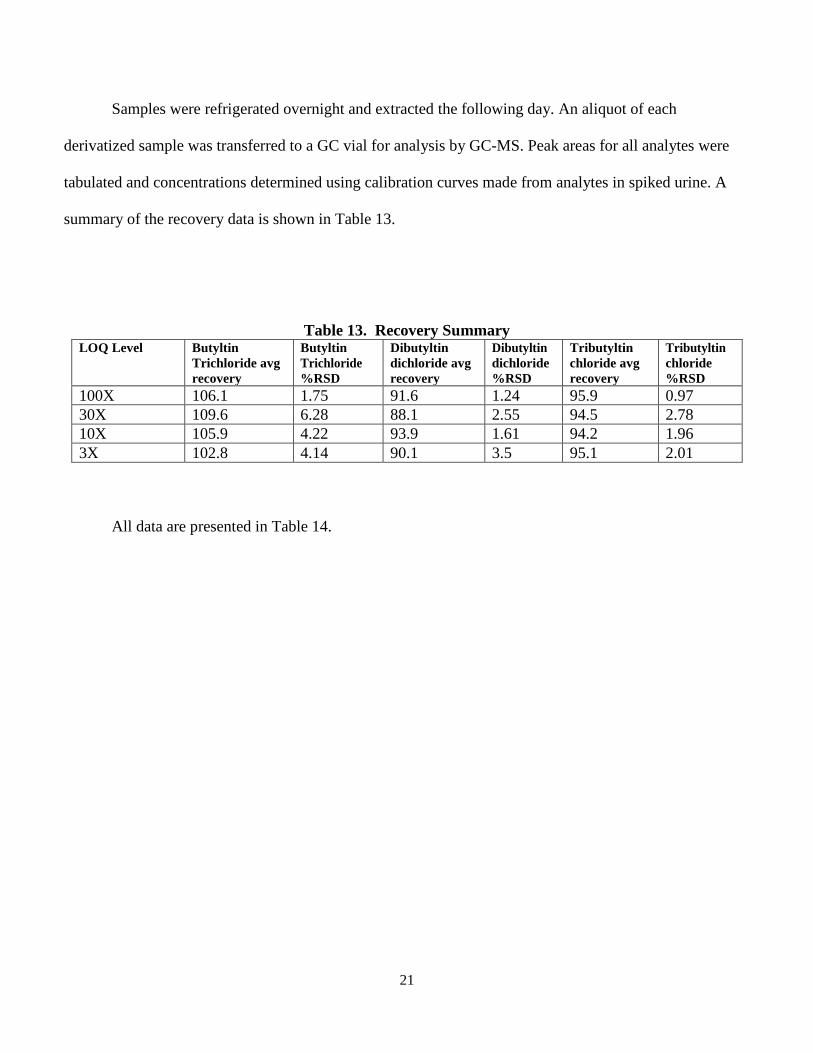
Samples were refrigerated overnight and extracted the following day. An aliquot of each
derivatized sample was transferred to a GC vial for analysis by GC-MS. Peak areas for all analytes were
tabulated and concentrations determined using calibration curves made from analytes in spiked urine. A
summary of the recovery data is shown in Table 13.
Table 13. Recovery Summary LOQ Level Butyltin
Trichloride avg recovery
Butyltin Trichloride %RSD
Dibutyltin dichloride avg recovery
Dibutyltin dichloride %RSD
Tributyltin chloride avg recovery
Tributyltin chloride %RSD
100X 106.1 1.75 91.6 1.24 95.9 0.97 30X 109.6 6.28 88.1 2.55 94.5 2.78 10X 105.9 4.22 93.9 1.61 94.2 1.96 3X 102.8 4.14 90.1 3.5 95.1 2.01
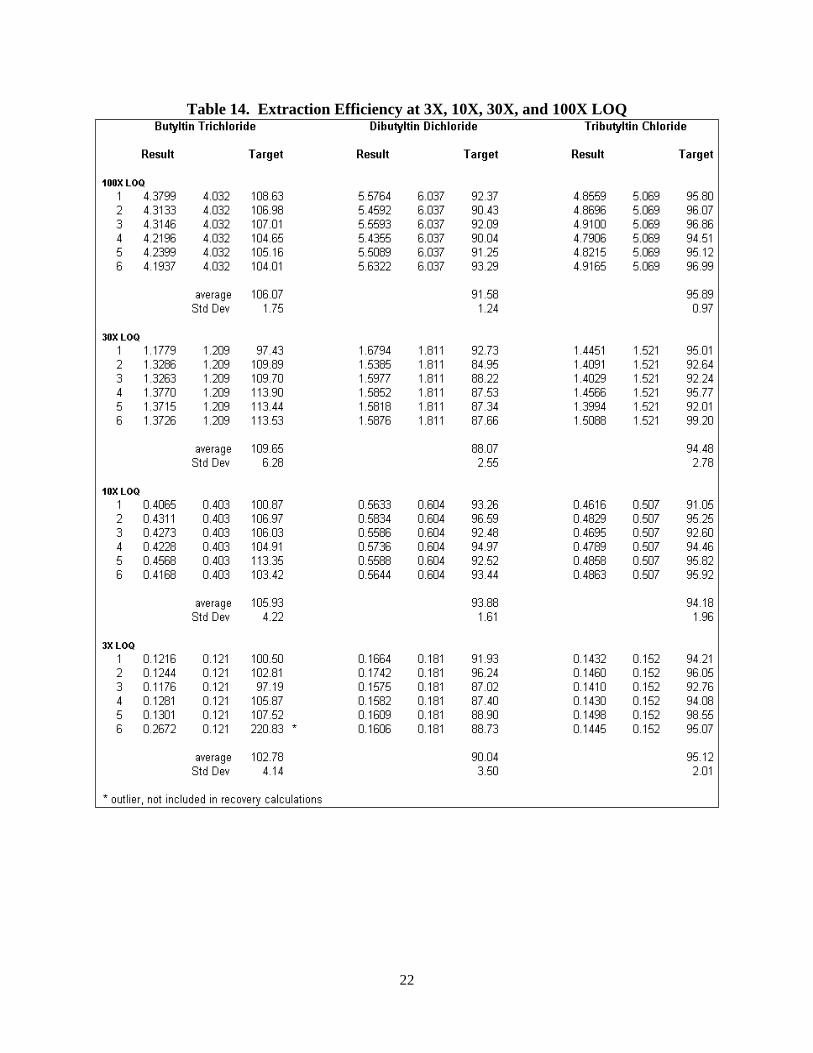
All data are presented in Table 14.
22
Table 14. Extraction Efficiency at 3X, 10X, 30X, and 100X LOQ

23
X. Precision and Accuracy: [31]
Butyltin Trichloride:
When all values are used, the Chi2 value was found to be 5.9304, the overall precision (Ŝrt)
was 0.04114 and the bias was 0.06251 (see Appendix 1 detailing results for all cases). Accuracy was
calculated to be 13.02% from these values.
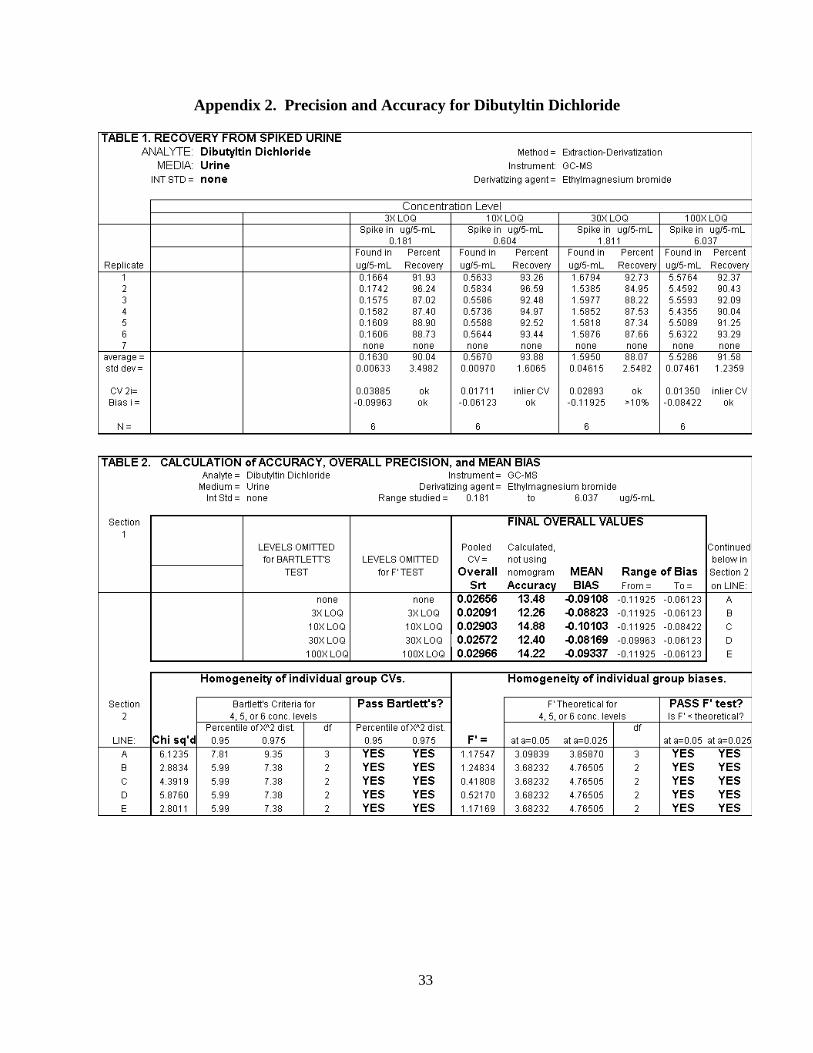
Dibutyltin Dichloride:
When all values are used, the Chi2 value was found to be 6.1235, the overall precision (Ŝrt)
was 0.02656 and the bias was -0.09108 (see Appendix 2 detailing results for all cases). Accuracy
was calculated to be 13.48% from these values.
Tributyltin Chloride:
When all values are used, the Chi2 value was found to be 4.6069, the overall precision (Ŝrt)
was 0.02150 and the bias was -0.05083 (see Appendix 3 detailing results for all cases). Accuracy
was calculated to be 8.62% from these values.
XI. Long Term Storage:
A long term storage study was done by spiking 5 mL aliquots of urine with all three analytes
at 10X LOQ. That level was chosen because most of the butyltin trichloride found in urine samples
collected for a NIOSH study was close to this concentration. Since the urine samples had been stored
frozen for an extended period of time, the storage study was conducted for ten months with the
samples frozen at -20 °C. During the course of the study, samples were removed, thawed, extracted,
derivatized, and analyzed against freshly spiked urine samples. The unspiked urine used for
standards had been frozen with the spiked samples and was spiked prior to sample preparation.
To determine the effects, if any, on the butyltin recoveries due to the use of preserving agents,
eight tubes spiked at 10X LOQ were prepared with: 1) ascorbic acid, 100 mg/5 mL aliquot; four

24
tubes and 2) nitric acid, 200 µL/5 mL aliquot; four tubes. Two each of the two preserved sets were
prepared and analyzed with the 127 and 315 day storage samples.
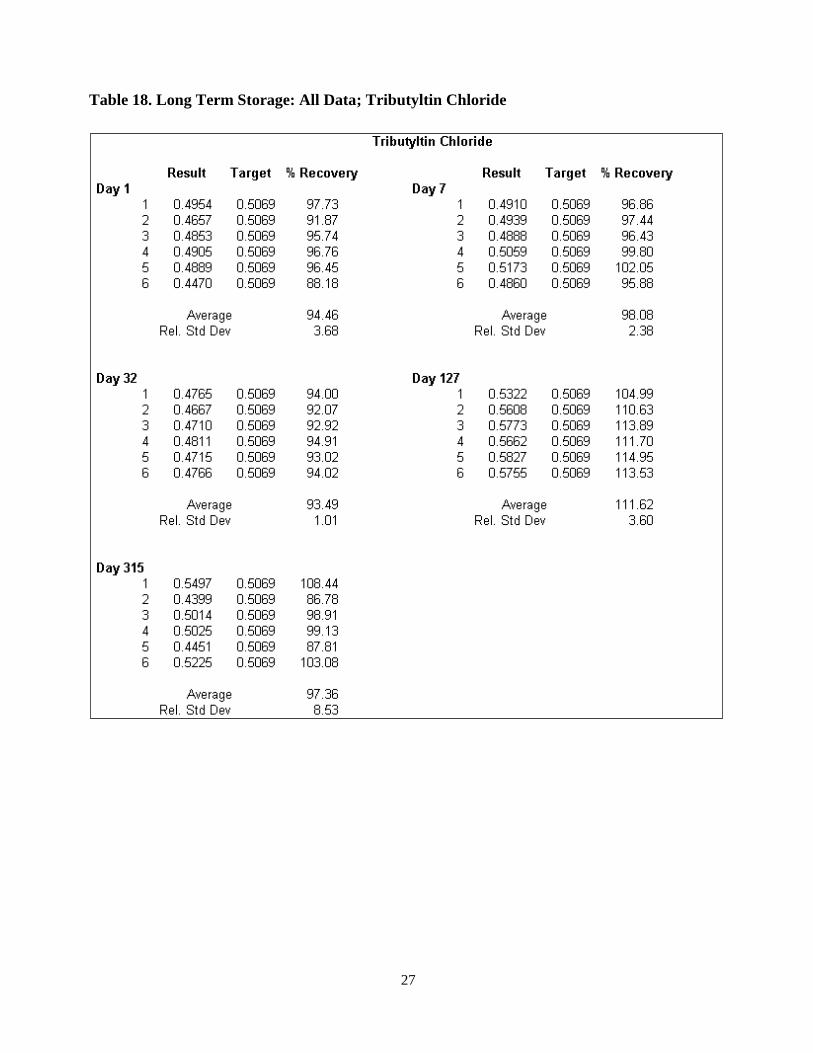
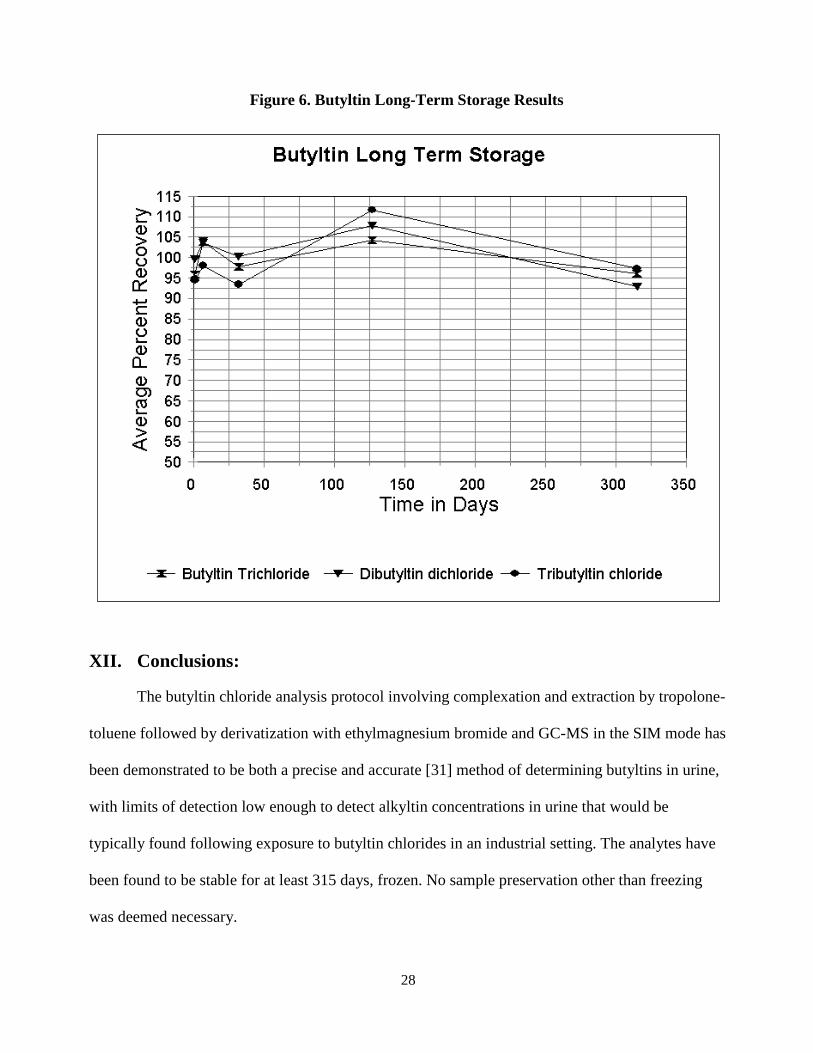
Tables 15a-c give a summary of the storage study. Tables 16-18 give the complete data set
for each of the three analytes. Figure 6 is a graphical representation of the data for all three analytes
while no preservative was being used.
Table 15a. Long Term Storage* Recovery Summaries (recoveries as % ± std deviation)
Analyte Target (µg/5mL)
Day 1 Day 7 Day 32 Day 127 Day 315
Tributyltin chloride 0.5069 94.5±3.7 98.1±2.4 93.5±1.0 111.6±3.6 97.4±8.5 Dibutyltin dichloride 0.5982 99.6±2.6 103.6±0.5 100.3±1.2 107.8±2.0 92.9±1.9 Butyltin trichloride 0.3977 95.8±2.3 104.0±1.5 97.7±1.6 103.6±3.6 96.1±3.6
*samples unpreserved Table 15b. Long Term Storage* Recovery Summaries (recoveries as %) Analyte Target
(µg/5mL) Day 127 Day 315
Tributyltin chloride 0.5069 115.6 97.4 Dibutyltin dichloride 0.5982 103.6 92.9 Butyltin trichloride 0.3977 110.6 96.1
*samples ascorbic acid preserved Table 15c. Long Term Storage* Recovery Summaries (recoveries as %) Analyte Target
(µg/5mL) Day 127 Day 315
Tributyltin chloride 0.5069 115.1 87.5 Dibutyltin dichloride 0.5982 120 91.8 Butyltin trichloride 0.3977 116.3 90.2
*samples nitric acid preserved

25
Table 16. Long Term Storage: All Data; Butyltin Trichloride

26
Table 17. Long Term Storage: All Data; Dibutyltin Dichloride
27
Table 18. Long Term Storage: All Data; Tributyltin Chloride
28
Figure 6. Butyltin Long-Term Storage Results
XII. Conclusions:
The butyltin chloride analysis protocol involving complexation and extraction by tropolone-
toluene followed by derivatization with ethylmagnesium bromide and GC-MS in the SIM mode has
been demonstrated to be both a precise and accurate [31] method of determining butyltins in urine,
with limits of detection low enough to detect alkyltin concentrations in urine that would be
typically found following exposure to butyltin chlorides in an industrial setting. The analytes have
been found to be stable for at least 315 days, frozen. No sample preservation other than freezing
was deemed necessary.

29
XIII. References:
1. Carlier-Pinasseau C, Astruc A, Lespes G, Astruc M [1996]. Determination of butyl-and phenyltin compounds in biological material by gas chromatography with flame photometric detection after ethylation with sodium tetraethylborate, J Chrom A. 750:317-325.
2. Tsuda T, Nakanishi H, Aoki S, Takebayashi J [1987]. Determination of butyltin and
phenyltin compounds in biological and sediment samples by electron-capture gas chromatography. J Chrom A. 387:361-370.
3. Cai Y, Rapsomanikis S, Andreae MO [1993]. Determination of butyltin compounds in
sediment using gas chromatography-atomic absorption spectrometry: comparison of sodium tetrahydroborate and sodium tetraethylborate derivatization menthods. Anal Chim Acta 274:243-251.
4. Abalos M., Bayona JM, Compañó R, Granados M, Leal C, Prat MD [1997]. Analytical
procedures for the determination of organotin compounds in sediment and biota: a critical review. J Chrom A 788:1-49.
5. Ashby JR, Craig PJ [1989]. New method for the production of volatile organometallic
species for analysis from the environment; some butyl tin levels in U.K. sediments. Sci Total Environ 78:219-232
6. Ceulemans M, Adams FC [1995]. Evaluation of sample preparation methods for
organotin speciation analysis in sediments - focus on monobutyltin extraction. Anal Chim Acta 317:161-170.
7. Ceulemans M, Slaets S, Adams FC [1998]. Speciation of organotin in environmental
sediment samples. Talanta 46:395-405. 8. Chau YK, Yang F, Brown M [1997]. Evaluation of derivatization techniques for the
analysis of organotin compounds in biological tissue. Anal Chim Acta 338:51-55. 9. Chau YK, Yang F, Maguire RJ [1996]. Improvement of extraction recovery for the
monobutyltin species from sediment. Anal Chim Acta 320:165-169. 10. Rapsomanikis S [1994]. Derivatization by ethylation with sodium tetraethylborate for the
speciation of metals and organometallics in environmental samples: a review. Analyst 119:1429-1439.
30
11. Iwai H, Wada O, Arakawa Y [1981]. Determination of tri-, di-, and monobutyltin and inorganic tin in biological materials and some aspects of their metabolism in rats. J Anal Tox 5:300-306.
12. Müller M [1987]. Comprehensive trace level determination of organotin compounds in
environmental samples using high-resolution gas chromatography with flame photometric detection. Anal Chem 59:617-623.
13. Looser PW, Berg M, Fent K, Muhlemann J, Schwarzenbach R.P [2000]. Phenyl- and
butyltin analysis in small biological samples by cold methanolic digestion and GC/MS. Anal Chem 72:5136-5141.
14. Kimbrough RD [1976]. Toxicity and health effects of selected organotin compounds: A
eeview. Env Health Perspect 14:51-56. 15. Syracuse Research Corporation [2003]. Toxicological Profile for Tin and Compounds.
Syracuse Research Corporation, CDC contract # 205-1999-00024. 16. Boyer I J[1989] Toxicity of dibutyltin, tributyltin and other organotin compounds to
humans and to experimental animals Tox 55(3):253-298. 17. Life Systems, Inc [1992]. Toxicological profile for tin and compounds. Under contract to
Agency for Toxic Substances and Disease Registry. 18. Gui-bin J, Qun-fang Z, Bin H, Liu J [2000]. Speciation analysis of organotin compounds
in lard poisoning accident in Jiangxi Province, China. Sci in China 43:531-539. 19. Gitlitz MH, Dirkx R, Russo DA [1992]. Letting light in; keeping heat out. Chemtech
22:552-556. 20. Dyne D, Chana BS, Smith NJ, Cocker J [1991]. Determination of triutyltin oxide and its
di- and monobutyl metabolites in urine using combined gas chromatography-atomic absorption spectrometry. Anal Chim Acta 246:351-357.
21. Gui-bin J, Qun-fang Z, Bin H [2000]. Tin compounds and major trace metal elements in
organotin-poisoned patient’s urine and blood measured by gas chromatography with flame photometric detector and inductively coupled plasma-mass spectrometry. Bull Environ Contam Tox 65:277-284.
22. Boraiko C, Yoder R, Cooper J, Lieckfield Jr. R, Remski M [2004]. Sampling and analysis
of organotin compounds in air using gas chromatography and flame photometric detection. J Occup Environ Hyg 1:50-56.
23. Rapsomanikis S, Donard OFX, Weber JH [1986]. Speciation of lead and methyllead ions

31
in water by chromatography/atomic absorption spectrometry after ethylation with sodium tetraethylborate. Anal Chem 58:35-38.
24. Clark S, Ashby J, Craig PJ [1987]. On-column hydride generation method for the
production of volatile hydrides of tin, arsenic, and antimony for the gas chromatographic analysis of dilute solutions. Analyst 112:1781-1782.
25. Jiang GB, Liu JY [2000]. Determination of butyltin compounds in aqueous samples by
gas chromatography with flame photometric detector and headspace solid-phase microextraction after in-situ hydride derivatization. Anal Sci 16:585-588.
26. Plzák Z, Polanská M, Suchánek M [1995]. Identification and determination of butyltin
compounds in water by ion trap gas chromatography-mass spectrometry after conversion to methyl or hydride derivatives. J Chrom A 699:241-252.
27. Meinema HA, Burger-Wiersma T, Versluis-de Haan G, Gevers EC [1978].
Determination of trace amounts of butyltin compounds in aqueous systems by gas chromatography/mass spectrometry. Environ Sci Tech 12:288-293.
28. NIOSH [1994]. Methyltin Chlorides:Method 5526 In: Eller PM, Cassinelli ME, eds.
NIOSH manual of analytical methods, 4th ed. Cincinnati, OH: U.S. Department of Health and Human Services, Centers for Disease Control and Prevention, National Institute for Occupational Safety and Health, DHHS (NIOSH) Publication No. 94-113.
29. ORTEP [1995]. Method: Butyltin chlorides in air. Bergkamen, Germany: Organotin
Environmental Programme Association.
30. Burkart JA [1986]. General procedures for limit of detection calculations in industrial hygiene chemistry laboratory. Appl Ind Hyg 1(3):153-155.
31. NIOSH [1995]. Guidelines for air and analytical method development and evaluation. By
Kennedy ER, Fishbach TJ, Song R, Eller PM, Shulman, SA. Cincinnati, OH: U.S. Department of Health and Human Services, Centers for Disease Control and Prevention, National Institute for Occupational Safety and Health, DHHS (NIOSH) Publication No. 95-117.

32
Appendix 1. Precision and Accuracy for Butyltin Trichloride
33
Appendix 2. Precision and Accuracy for Dibutyltin Dichloride

34
Appendix 3. Precision and Accuracy for Tributyltin Chloride

35
Appendix 4 Review of User Check for NMAM Method 8320 (Butyltin trichloride in urine) User check samples were prepared by a NIOSH researcher (Dr. Clayton B’Hymer) to be analyzed by ALS Environmental using draft NIOSH Method 8320. A total of 25 urine samples were prepared. The urine was obtained from volunteers at NIOSH and then combined and mixed into a single pool of urine from which all samples were prepared. The final volume of each sample was 20 mL. Five samples were left blank. Five samples were prepared containing each of the analytes at the levels shown in the following table. Compound Level 1 (µg/5 mL) Level 2 (µg/5 mL) Level 3 (µg/5 mL) Level 4 (µg/5 mL) Butyltin trichloride
0.128 0.250 12.5 60.5
Dibutyltin dichloride
0.121 0.237 11.85 57.5
Tributyltin chloride
0.123 0.240 12.0 58.5
The samples were shipped frozen to ALS Environmental on October 27, 2015 and arrived there the next day. The samples were analyzed on November 16, 2015. No significant deviations from the analytical procedure in NIOSH Method 8320 were noted. For this analysis, the Reporting Limit (RL, which is equivalent to the limit of quantitation, LOQ) was determined by ALS to be 0.012 µg/5 mL for all three compounds. As mentioned above, the spike levels ranged from 0.121 to 60.5 µg/5 mL, which is 10 to 5000 times the RL and fall within the range of the calibration curve. The calibration curve covers concentrations from 0.012 to 120.0 µg/5 mL. None of the butyltin chloride compounds was detected in the blank urines, which is to be expected. Summary tables for each analyte at each level are shown below and tables of data for all the samples can be found at the end of this report. Compound Target conc.
(µg/5 mL) Average Recovery (%)
RSD (%)
Butyltin trichloride 0.128 79.2 4.9 Butyltin trichloride 0.250 83.5 5.8 Butyltin trichloride 12.5 90.2 4.0 Butyltin trichloride 60.5 92.7 3.8 Overall 86.4 7.6

36
Compound Target conc. (µg/5 mL)
Average Recovery (%)
RSD (%)
Dibutyltin dichloride 0.121 68.8 7.1 Dibutyltin dichloride 0.237 74.3 1.9 Dibutyltin dichloride 11.85 80.7 6.1 Dibutyltin dichloride 57.5 76.0 5.7 Overall 74.9 7.7
Compound Target conc. (µg/5
mL) Average Recovery (%)
RSD (%)
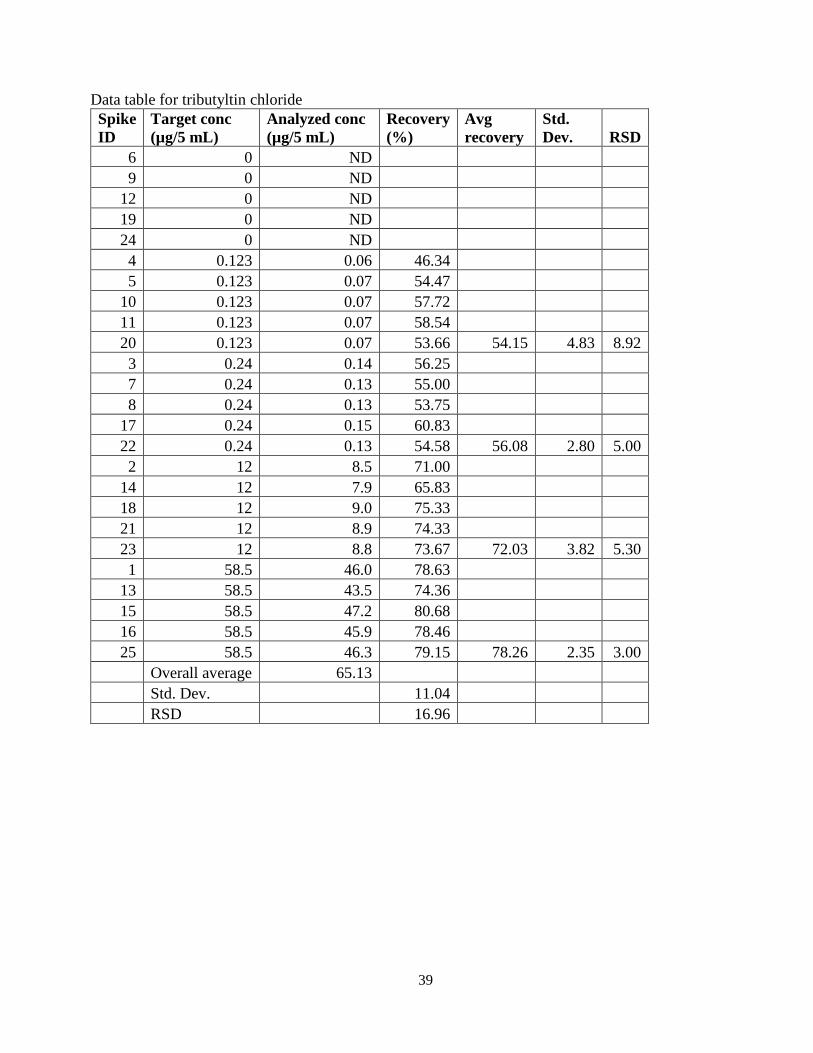
Tributyltin chloride 0.123 54.2 8.9 Tributyltin chloride 0.240 56.1 5.0 Tributyltin chloride 12.0 72.0 5.3 Tributyltin chloride 58.5 78.3 3.0 Overall 65.1 17.0
The average recovery for butyltin trichloride is very near the ± 15% accuracy (± 20% at the lowest level) recommended for bioanalytical methods by the US Food and Drug Administration [1]. The relative standard deviation (RSD, which is a measure of precision) for all levels ranged from 3.8 to 5.8 per cent, which is also well within acceptable limits. The average recoveries for dibutyltin dichloride and tributyltin chloride are outside of the recommended criteria. In the case of tributyltin chloride, values of roughly 50% recovery were found at the lower two levels. The contract lab reported no difficulties understanding the draft method nor in setting it up or analyzing the User Check samples. The User Check laboratory followed the procedure and the method has been shown to have adequate precision and accuracy for butyltin trichloride while showing less than adequate precision and accuracy for dibutyltin dichloride and tributyltin chloride. Therefore, the method was rewritten as a single analyte method. Fortunately, butyltin trichloride is the most commonly used and occupationally relevant of these three butyltin chloride compounds. It is recommended that the method, NIOSH Method 8320 (Butyltin trichloride in urine) be approved and accepted for inclusion in the NIOSH Manual of Analytical Methods. Dale Shoemaker, PhD Research Chemist June 24, 2016 [1] U.S. Food and Drug Administration. “Guidance for Industry: Bioanalytical Method Validation.” US FDA, May 2001.

37
Data table for butyltin trichloride Spike ID
Target conc (µg/5 mL)
Analyzed conc (µg/5 mL)
Recovery (%)
Avg recovery Std. Dev. RSD
6 0 ND 9 0 ND
12 0 ND 19 0 ND 24 0 ND 4 0.128 0.10 78.91 5 0.128 0.10 77.34
10 0.128 0.11 85.94 11 0.128 0.10 77.34 20 0.128 0.10 76.56 79.22 3.85 4.86 3 0.25 0.23 91.20 7 0.25 0.20 81.60 8 0.25 0.20 80.40
17 0.25 0.21 85.20 22 0.25 0.20 79.20 83.52 4.84 5.80 2 12.5 11.8 94.40
14 12.5 10.6 84.80 18 12.5 11.4 91.20 21 12.5 11.5 92.00 23 12.5 11.1 88.80 90.24 3.64 4.03 1 60.5 57.6 95.21
13 60.5 53.2 87.93 15 60.5 57.4 94.88 16 60.5 54.7 90.41 25 60.5 57.4 94.88 92.66 3.30 3.57
Overall average 86.41 Std. Dev. 6.57 RSD 7.60

38
Data table for dibutyltin dichloride Spike ID
Target conc (µg/5 mL)
Analyzed conc (µg/5 mL)
Recovery (%)
Avg recovery
Std. Dev. RSD
6 0 ND 9 0 ND
12 0 ND 19 0 ND 24 0 ND 4 0.121 0.08 63.64 5 0.121 0.08 64.46
10 0.121 0.09 75.21 11 0.121 0.08 68.60 20 0.121 0.09 71.90 68.76 4.90 7.13 3 0.237 0.18 75.53 7 0.237 0.17 72.57 8 0.237 0.17 73.00
17 0.237 0.18 74.68 22 0.237 0.18 75.53 74.26 1.40 1.88 2 11.85 9.4 79.24
14 11.85 8.6 72.83 18 11.85 9.8 82.70 21 11.85 10.0 84.39 23 11.85 10.0 84.39 80.71 4.88 6.05 1 57.5 41.7 72.52
13 57.5 42.0 73.04 15 57.5 46.5 80.87 16 57.5 42.0 73.04 25 57.5 46.3 80.52 76.00 4.29 5.65
Overall average 74.93 Std. Dev. 5.80 RSD 7.74
39
Data table for tributyltin chloride Spike ID
Target conc (µg/5 mL)
Analyzed conc (µg/5 mL)
Recovery (%)
Avg recovery
Std. Dev. RSD
6 0 ND 9 0 ND
12 0 ND 19 0 ND 24 0 ND 4 0.123 0.06 46.34 5 0.123 0.07 54.47
10 0.123 0.07 57.72 11 0.123 0.07 58.54 20 0.123 0.07 53.66 54.15 4.83 8.92 3 0.24 0.14 56.25 7 0.24 0.13 55.00 8 0.24 0.13 53.75
17 0.24 0.15 60.83 22 0.24 0.13 54.58 56.08 2.80 5.00 2 12 8.5 71.00
14 12 7.9 65.83 18 12 9.0 75.33 21 12 8.9 74.33 23 12 8.8 73.67 72.03 3.82 5.30 1 58.5 46.0 78.63
13 58.5 43.5 74.36 15 58.5 47.2 80.68 16 58.5 45.9 78.46 25 58.5 46.3 79.15 78.26 2.35 3.00
Overall average 65.13 Std. Dev. 11.04 RSD 16.96