bacterial diversity along a 2600km river continuum - …905700/fulltext01.pdf · bacterial...
TRANSCRIPT
Bacterial diversity along a 2600 km river continuum
Domenico Savio,1,2 Lucas Sinclair,3 Umer Z. Ijaz,4
Juraj Parajka,1,5 Georg H. Reischer,2,6
Philipp Stadler,1,7 Alfred P. Blaschke,1,5
Günter Blöschl,1,5 Robert L. Mach,2
Alexander K. T. Kirschner,6,8
Andreas H. Farnleitner1,2,6 and Alexander Eiler3*1Centre for Water Resource Systems (CWRS), ViennaUniversity of Technology, Vienna, Austria.2Research Group Environmental Microbiology andMolecular Ecology, Institute of Chemical Engineering,Vienna University of Technology, Vienna, Austria.5Institute of Hydraulic Engineering and Water ResourceManagement, Vienna University of Technology, Vienna,Austria.7Institute for Water Quality, Resource and WasteManagement, Vienna University of Technology, Vienna,Austria.3Department of Ecology and Genetics, Limnology,Science for Life Laboratory, Uppsala University,Uppsala, Sweden.4School of Engineering, University of Glasgow,Glasgow, UK.6Interuniversity Cooperation Centre Water and Health,www.waterandhealth.at.8Institute for Hygiene and Applied Immunology, WaterHygiene, Medical University of Vienna, Vienna, Austria.
Summary
The bacterioplankton diversity in large rivers has thusfar been under-sampled despite the importance ofstreams and rivers as components of continentallandscapes. Here, we present a comprehensivedataset detailing the bacterioplankton diversity alongthe midstream of the Danube River and its tributaries.Using 16S rRNA-gene amplicon sequencing, ouranalysis revealed that bacterial richness and even-ness gradually declined downriver in both the free-living and particle-associated bacterial communities.These shifts were also supported by beta diversityanalysis, where the effects of tributaries were negli-gible in regards to the overall variation. In addition,the river was largely dominated by bacteria that
are commonly observed in freshwaters. Dominatedby the acI lineage, the freshwater SAR11 (LD12)and the Polynucleobacter group, typical freshwatertaxa increased in proportion downriver and wereaccompanied by a decrease in soil and groundwater-affiliated bacteria. Based on views of the meta-community and River Continuum Concept, weinterpret the observed taxonomic patterns andaccompanying changes in alpha and beta diversitywith the intention of laying the foundation for aunified concept for river bacterioplankton diversity.
Introduction
Streams and rivers link terrestrial and lentic systems withtheir marine counterparts and provide numerous essentialecosystem services. They supply drinking water, are usedfor irrigation, industry and hydropower and serve as trans-port routes or for recreation. Of general importance is therole of lotic systems in biogeochemical nutrient cycling.Until recently, rivers and streams were mainly consideredas pipes shuttling organic material and nutrients from theland to the ocean (Cole et al., 2007). This view has begunto change as lotic and lentic systems are now consideredmore akin to ‘leaky funnels’ in regard to the cycling ofelements. Indeed, they play an important role in the tem-porary storage and transformation of terrestrial organicmatter (Ensign and Doyle, 2006; Cole et al., 2007;Withers and Jarvie, 2008; Battin et al., 2009). As aresult of recognizing the specific role of streams and riversin the carbon cycle (Richey et al., 2002; Battin et al.,2009; Raymond et al., 2013), the study of the diverseprocesses ongoing in the water column and sediments oflotic networks has received increasing interest (Kronvanget al., 1999; Beaulieu et al., 2010; Seitzinger et al., 2010;Aufdenkampe et al., 2011; Benstead and Leigh, 2012;Raymond et al., 2013).
When attempting to model the mechanisms of nutrientprocessing in freshwater systems, bacteria are regardedas the main transformers of elemental nutrients andviewed as substantial contributors to the energy flow(Cotner and Biddanda, 2002; Battin et al., 2009; Findlay,2010; Madsen, 2011). However, in the case of open loticsystems such as rivers, there remains a lack of knowl-edge concerning the diversity of bacterial communities(Battin et al., 2009). For example, up until the present daythere is no agreement on the distinctness of river
Received 20 August, 2014; accepted 21 April, 2015. *For correspond-ence. E-mail [email protected]; Tel. (+46) 18 471 2700;Fax (+46) 18 53 1134.
bs_bs_banner
Environmental Microbiology (2015) 17(12), 4994–5007 doi:10.1111/1462-2920.12886
© 2015 The Authors. Environmental Microbiology published by Society for Applied Microbiology and John Wiley & Sons Ltd.This is an open access article under the terms of the Creative Commons Attribution License, which permits use, distribution andreproduction in any medium, provided the original work is properly cited.

bacterioplankton communities from that of other freshwa-ter systems or the variability of its diversity along entireriver networks.
Until recently, it was only known that the most abundanttaxa comprising riverine bacterioplankton seem to resem-ble lake bacteria and can thus be regarded as ‘typical’freshwater bacteria (Zwart et al., 2002; Lozupone andKnight, 2007; Newton et al., 2011). In particular, bacteriaaffiliated with the phyla Proteobacteria (particularlyBetaproteobacteria), Actinobacteria, Bacteroidetes,Cyanobacteria and Verrucomicrobia were found to domi-nate the bacterial communities in rivers (Crump et al.,1999; Zwart et al., 2002; Cottrell et al., 2005; Winteret al., 2007; Lemke et al., 2008; Mueller-Spitz et al.,2009; Newton et al., 2011; Liu et al., 2012). A recentmetagenome study corroborates a general dominanceof the phyla Proteobacteria and Actinobacteria, andmore specifically the clear dominance of the cosmopolitanfreshwater lineage acI of the phylum Actinobacteriain the Amazon river (Ghai et al., 2011). The dominanceof Actinobacteria and Proteobacteria in riverinebacterioplankton was also confirmed in three recent high-throughput sequencing studies on the Upper MississippiRiver (USA; Staley et al., 2013), the Yenisei River (RUS;Kolmakova et al., 2014) and the River Thames (UK; Readet al., 2015). Staley and colleagues (2013) were the first
to suggest a persistent and ubiquitous ‘core bacterialcommunity’ along a river stretch. Read and colleagues(2015) examined the longitudinal development of thebacterioplankton community at 23 sites along the rivernetwork of the 9948 km2 Thames basin. They found a shiftfrom a Bacteroidetes-dominated community in the head-waters to an Actinobacteria-dominated community in thelower reaches near the river mouth and location of thesampling point in the river network to be the most predic-tive parameter. These patterns they interpreted as evi-dence for ecological succession along the river continuum.
However, the existing studies focused on relatively smallriver basins and/or a small number of sampling sites. Inlarge river basins, however, one would expect that thespatial patterns of bacterial community compositions mani-fest themselves more clearly than in small ones due to thelarger contrast in environmental conditions. In this paper,we analyse the results from a second-generation sequenc-ing experiment by separately investigating the free-livingand particle-associated bacterioplankton communitiesalong 96 sites in the network of the entire Danube basin(Fig. 1). The Danube River is 2780 km in length and drainsa catchment area of 801 000 km2 with 83 million inhabit-ants (Schmedtje et al., 2004; Sommerwerk et al., 2010).Based on our results, we propose that the bacterioplanktoncommunities in the midstream of such a large river develop
Fig. 1. Overview and detailed map of the Danube river catchment showing all sampling sites during the Joint Danube Survey 2; red dotsindicate sampling points in the midstream of the Danube River; blue dots represent sampling points in tributaries before mergingwith the Danube River. Blue-shaded font indicates official numbering of river kilometres, starting with rkm 2600 at the uppermost site to rkm 0at the river mouth. Country abbreviations and large cities are written in black. The map was created using Quantum GIS (Quantum GISDevelopment Team, 2011).
River bacterioplankton diversity 4995
© 2015 The Authors. Environmental Microbiology published by Society for Applied Microbiology and John Wiley & Sons Ltd,Environmental Microbiology, 17, 4994–5007

gradually and increasingly independent from tributary andriparian influence as a result of the interplay betweendispersal-facilitated (‘mass effects’) and environmentalcondition-based sorting (‘species sorting’; Leibold et al.,2004; Crump et al., 2007; 2012). Moreover, we argue thatthese processes, represented in the meta-communityconcept, can be linked to the River Continuum Concept(RCC; Vannote et al., 1980), which explains the role of thehydrological flow conditions, the riparian zone, substrateand food as important factors in determining communitystructures along entire river systems.
Results
Selected environmental and geomorphologicalparameters
In total, more than 280 individual parameters, includingchemical, microbiological, ecotoxicological, radiologicaland biological parameters were investigated within theJoint Danube Survey 2 (Liska et al., 2008). Alkalinity, pH,concentration of nitrate as well as dissolved silicatesexhibited a gradually decreasing trend along the river aspreviously described by Liska and colleagues (2008) and
illustrated in Fig. S1D–G. Total phytoplankton biomass(Chla) showed a peak between river kilometre 1481 and1107 (sites 38–55) with total bacterial production followinga similar trend, whereas total suspended solid concentra-tion increased considerably in the last 900 kilometresbefore reaching the Black Sea (Fig. S1H–J).
Several geomorphological measures were calculatedsuch as ‘river kilometre’, ‘catchment area’, ‘mean dendriticstream length’ and ‘cumulative dendritic distanceupstream’ and were compared with each other. Forexample, ‘mean dendritic stream length’ correlated veryclosely with ‘river kilometre’ (as defined by the distance tomouth; linear model R2 = 0.98; P < 0.001; Fig. S1A). Incontrast, ‘cumulative dendritic distance upstream’ corre-lated almost perfectly with ‘catchment area’ (linear modelR2 > 0.99; P < 0.001; Fig. S1C). From a hydrological pointof view, it can be argued that ‘mean dendritic streamlength’ is a better proxy of stream residence time than‘cumulative dendritic distance upstream’, as it representsthe average travel time of a drop of water, assumingrandomly distributed spring discharges and constant flowvelocities in the river system (Rodriguez-Iturbe et al.,2009).
Core microbial community
In total, sequencing resulted in 1 572 361 sequence reads(further referred to as ‘reads’) after quality filtering andclustered into clustering into 8697 bacterial operationaltaxonomic units (OTUs). The majority of bacteria-assigned OTUs (4402 out of 8697) were only representedby less than 10 reads in the entire dataset. As a conse-quence, 3243 of 8697 OTUs (∼37%) were present in onlyone to four samples, and an additional 2219 OTUs (∼26%)were present in as few as five to nine samples. Besidesthese rare OTUs, the core community of the DanubeRiver, as operationally defined by all OTUs that appearedin at least 90% of all Danube River samples, comprised89 OTUs in the free-living bacterioplankton (0.2–3.0 μm)and 141 OTUs in the particle-associated fraction(> 3.0 μm). On average, 81% of all reads of the free-livingriver community and 63% of all reads of the particle-associated river community were part of their respectivecore community. The relative abundance of the core com-munities in both fractions increased significantly towardsthe river mouth with similar slopes revealed by regressionanalysis (Fig. 2).
Variability in river bacterioplankton alpha diversity
To investigate alpha diversity, we calculated the Chao1richness estimator and Pielou’s evenness index for bothsize fractions after rarefying all samples down to 7000reads and discarding 36 samples with fewer reads. We
P
P
Fig. 2. Gradual development of the read proportions assigned tothe operationally defined ‘core communities’ of the free-living andparticle-associated fraction (all OTUs occurring in at least 90% ofall Danube River samples of the respective size fraction) along‘mean dendritic stream length’. Round symbols represent samplesfrom the free-living size fraction (0.2–3.0 μm); squares representsamples from the particle-associated size fraction (> 3.0 μm). Reddots indicate samples from the free-living size fraction (0.2–3.0 μm)of the Danube River only; blue squares indicate samples from theparticle-associated fraction (> 3.0 μm) of the Danube River; opendots and squares represent tributary samples from the free-livingand particle-associated size fraction, respectively; dark blue linesindicate fitted linear models with confidence intervals of 0.95 in redand blue for the respective size fraction of the Danube Riversamples. Detailed regression statistics for the core communitydevelopment in the Danube River (exclusive tributary samples) areshown in the figure.
4996 D. Savio et al.
© 2015 The Authors. Environmental Microbiology published by Society for Applied Microbiology and John Wiley & Sons Ltd,Environmental Microbiology, 17, 4994–5007

observed the highest diversity of all samples in theupstream part of the Danube River, representing medium-sized stream reaches according to the RCC definition.Richness and evenness then gradually decreased down-stream in both size fractions (Fig. 3A and B) as confirmedby regression analysis using ‘mean dendritic streamlength’ as well as ‘river kilometre’, ‘cumulative dendriticdistance upstream’ and ‘catchment area’ (Table S1). Forbacterial richness, the regressions revealed very similarslopes for the free-living and the particle-associated frac-tions (Fig. 3A). Besides the observed trends in the mid-stream communities of the Danube River, the tributarycommunities frequently formed outliers with considerablylower richness and evenness (Fig. 3A and B).
Among the two size fractions, the estimated richnesswas consistently higher in the particle-associated commu-nities than in the free-living fraction (Wilcoxon rank sumtest; P-value < 0.001) with means of 2025 OTUs and 1248OTUs, respectively (Fig. 3A). Similar observations werereported in studies on (coastal) marine environments aswell as lentic freshwater environments (Bižic-Ionescuet al., 2014; Mohit et al., 2014), ascribing the higher alphadiversity in the particle-associated communities to thehigh heterogeneity in the particle microenvironment. Alarge spectrum of niches can be provided by the highheterogeneity among particles in rivers including mobi-lized sediments, living organisms such as planktonicalgae or zooplankton and detritus derived from terrestrialand aquatic sources. Bižic-Ionescu and colleagues (2014)even suggested that the presence of diversely colonizedparticles of different age, origin and composition can be
described based on the observation of a higher richnessin the particle-associated fraction.
Variability in river bacterioplankton beta diversity
While communities of both size fractions in the DanubeRiver covary significantly with alkalinity, nitrate concentra-tion and dissolved silicates, the particle-associated com-munities additionally covaried highly significantly with totalbacterial production, nitrite concentrations, phytoplanktonbiomass and total suspended solids (Table 1). These cor-relations indicate that chemical properties may determinebacterioplankton community composition. Nevertheless,the observed significant relationship between communitycomposition and ‘mean dendritic stream length’ (Table 1)emphasizes the underlying role of stream travel times.Still, as tributary samples were scattered in the multidi-mensional space (Fig. 4), the midstream Danube Rivercommunities are suggested to develop independentlyfrom tributary communities, which is further supportedwhen depicting tributaries according to their position ofconfluence within the Danube River (see Fig. S2).
In addition to the observation that (i) tributarybacterioplankton communities did not follow the generalpatterns of midstream Danube River communities andoften formed outliers in the ordination space, other visualimpressions from the non-metric multidimensional scaling(NMDS) are that (ii) there is a distinction in communitycomposition between the two size fractions as confirmedby permutational multivariate analysis of variance(PERMANOVA) analysis (R2 = 0.156, P-value < 0.01),
P
P
P
P
Fig. 3. The gradual development of (A) the bacterial richness (Chao1) and (B) Pielou’s evenness (J) along the ‘mean dendritic stream length’at each sampling site; red dots indicate samples from the free-living size fraction (0.2–3.0 μm) of the Danube River only (n = 27); blue squaresindicate samples from the particle-associated fraction (> 3.0 μm) of the Danube River (n = 40); open dots and squares represent tributarysamples from the free-living and particle-associated size fraction, respectively; dark blue lines indicate fitted linear models with confidenceintervals of 0.95 in red and blue for the respective fraction of Danube River samples. Detailed regression statistics for Danube River samples(exclusive tributary samples) are shown in the figure.
River bacterioplankton diversity 4997
© 2015 The Authors. Environmental Microbiology published by Society for Applied Microbiology and John Wiley & Sons Ltd,Environmental Microbiology, 17, 4994–5007

Table 1. Summary statistics of correspondence between environmental variables and the projections of bacterioplankton community samples inthe NMDS ordination based on either free-living or particle-associated size fractions for the Danube River samples only (left) and tributary samplesincluded (right). The results were obtained using the function ‘envfit’ included in the R-package ‘vegan’ (Oksanen et al., 2013).
Danube River only Danube River and tributary samples
Free livingParticleassociated Free living
Particleassociated
R2 R2 R2 R2
Official Danube River kilometrea (for tributaries rkm at confluence) 0.840*** 0.832*** 0.241*** 0.236***Official Danube River kilometrea (calculated for tributariesb) 0.840*** 0.832*** 0.628*** 0.574***Mean dendritic stream length (water residence time) 0.799*** 0.808*** 0.620*** 0.579***Median dendritic length 0.752*** 0.773*** 0.594*** 0.554***Catchment size 0.766*** 0.803*** 0.559*** 0.524***Cumulated dendritic distance 0.772*** 0.807*** 0.568*** 0.527***Nitrate 0.677*** 0.538*** 0.294** 0.099*Alkalinity 0.605*** 0.430*** 0.329** 0.159*Silicates dissolved 0.500*** 0.589*** 0.200* 0.167*Total bacterial production 0.159* 0.440*** 0.399** 0.445***Bacterial production filtered fraction 0.059 0.468*** 0.379* 0.425***Nitrite 0.220* 0.283*** 0.039 0.160*Phytoplankton biomass (Chla) 0.016 0.396*** 0.039 0.222**Total suspended solids 0.143* 0.347*** 0.117 0.166**pH 0.140 0.175** 0.088 0.031Water temperature 0.100 0.029 0.103 0.002Organic nitrogen 0.055 0.131* 0.032 0.091*Conductivity 0.200* 0.107 0.131* 0.418***Orthophosphate phosphorus 0.083 0.075 0.583*** 0.337***Ammonium 0.073 0.026 0.445** 0.301**Total phosphorus 0.057 0.063 0.078 0.400***Dissolved oxygen 0.052 0.007 0.248** 0.069
Significant codes: ***≤ 0.001 **≤ 0.01*≤ 0.05.a. rkm 2600 = upstream region [near Ulm (DE)]; rkm 0 = river mouth (Black Sea).b. To obtain the corresponding ’Danube river kilometres’ according to the official numbering (see a) for tributaries, the length of tributaries wascalculated by subtracting the official length of tributaries (Schmedtje et al., 2004) from the official length of the Danube River (2780 km; Schmedtjeet al., 2004).
Tributaries
Fig. 4. Non-metric multidimensional scalingplot of the compositional dissimilaritiesbetween communities (Bray–Curtisdissimilarities) of all samples of the DanubeRiver and its tributaries. The stress value ofNMDS was 0.17. Dots represent free-livingbacterial communities (0.2–3.0 μm); trianglesdisplay particle-associated bacterialcommunities (> 3.0 μm). Open symbolsrepresent tributary samples, whereas fullsymbols indicate communities in the DanubeRiver. The gradient from orange to blue viapurple indicates the ‘mean dendritic streamlength’ at the respective sampling site in theDanube River.
4998 D. Savio et al.
© 2015 The Authors. Environmental Microbiology published by Society for Applied Microbiology and John Wiley & Sons Ltd,Environmental Microbiology, 17, 4994–5007

and (iii) there appears to be synchrony in the communitychanges of the two size fractions along the river’s course,which we statistically verified using a Procrustes test(r = 0.96, P < 0.001). Furthermore, (iv) a permutation teston the beta dispersion values between the samples ofeach size fraction revealed a higher variability (by a factorof 0.06) in the > 3.0 μm fraction when compared with the0.2–3.0 μm fraction (P-value = 0.002) (see Fig. S3). Thissupports the idea of a larger heterogeneity in niche avail-ability in the particle-associated communities based onhigher diversity in particle age and origin.
Typical river bacterioplankton
Along the river, the bacterioplankton communitywas dominated by Actinobacteria, Proteobacteria,Bacteroidetes, Verrucomicrobia and candidate divisionOD1, with an increasing proportion of reads assigned tothe phylum Actinobacteria in the free-living size fractiondownriver (Fig. S4). In contrast, reads assigned toBacteroidetes decreased significantly along the river in
the free-living fraction. In the particle-associated fraction,these trends in phylum composition were less pro-nounced. In addition to assigning reads to the phylumlevel, we taxonomically annotated all 9322 OTUs usingsimilarity searches against the database of freshwaterbacteria developed by Newton and colleagues (2011).The analysis revealed that up to 80% of the free-living andmore than 65% of the particle-associated bacterial popu-lation inhabiting the midstream Danube River communi-ties could be assigned to previously described freshwatertaxa (Fig. 5B). In particular, these included representa-tives of the LD12-tribe belonging to the subphylum ofAlphaproteobacteria, as well as the acI-B1-, acI-A7- andacI-C2-tribes belonging to the phylum Actinobacteria.Such dominance of few freshwater taxa in riverinebacterioplankton communities (see also Zwart et al.,2002; Lozupone and Knight, 2007; Newton et al., 2011;Read et al., 2015) corroborates the idea that riverbacterioplankton resembles those of lakes.
Interestingly, in the free-living size fraction, weobserved a clear increase in the relative abundance of the
Danube River TributariesA
B
16 %
14 %
12 %
10 %
8 %
0 %
2 %
4 %
6 %
100%80%60%40%20%
0%
LD12
acI-B1
acI-A7
acI-C2
Pnec
Luna1-A2
Algor
Iluma-A1
Upstreamregion
(rkm 2600)
Flow direction
Rivermouth
(rkm 0)
Particle-associated fractionFree-living fraction
Upstreamregion
(rkm 2600)
Flow direction
Rivermouth
(rkm 0)
Free-l.
Up RM
P.-assoc.
Up RM
non-typical freshwater taxaFreshwater 'clade' or 'lineage'Freshwater taxa
Fig. 5. A heat map (A) revealing the dynamics of the eight most abundant typical freshwater tribes along the Danube River defined accordingto Newton and colleagues (2011). The gradient from black red via yellow to white indicates the relative quantitative contribution of therespective tribe to all sequence reads in any one sample, with a maximum of 16%.Panel (B) displays the overall contribution of typical freshwater tribes (dark blue) as well as clades and lineages (turquoise) according to thedefinition by Newton and colleagues (2011) to the river bacterioplankton amplicon sequences along the river; black bars represent reads thatcould not be matched to sequences of the used freshwater database (Newton et al., 2011) neither on tribe, clade or lineage-level (named‘non-typical freshwater taxa’). ‘Freshwater taxa’ and ‘freshwater clade or lineage’ represent all reads that could be matched to sequences ofthe used freshwater database at the respective similarity level. Samples from the Danube River as well as the investigated tributaries arearranged from left to the right, with increasing distance from the source and separated according to the respective size fractions.
River bacterioplankton diversity 4999
© 2015 The Authors. Environmental Microbiology published by Society for Applied Microbiology and John Wiley & Sons Ltd,Environmental Microbiology, 17, 4994–5007
four above-mentioned tribes towards the river mouth(Fig. 5A), contributing up to 35% of the community. Theincreasing relative abundance of these four tribes wasaccompanied by a general increase in relative abundanceof OTUs matching other freshwater tribes, lineages orclades according to Newton and colleagues (2011) asdepicted in Fig. 5B. In contrast, the number of OTUs notmatching any sequence of the freshwater database eitherat tribe, clade or at lineage-level decreased (Fig. 5B;labelled ‘non-typical freshwater taxa’), suggesting that
these OTUs may originate from non-aquatic sources. Inthe particle-associated fraction, typical freshwater taxawere less common (Fig. 5B).
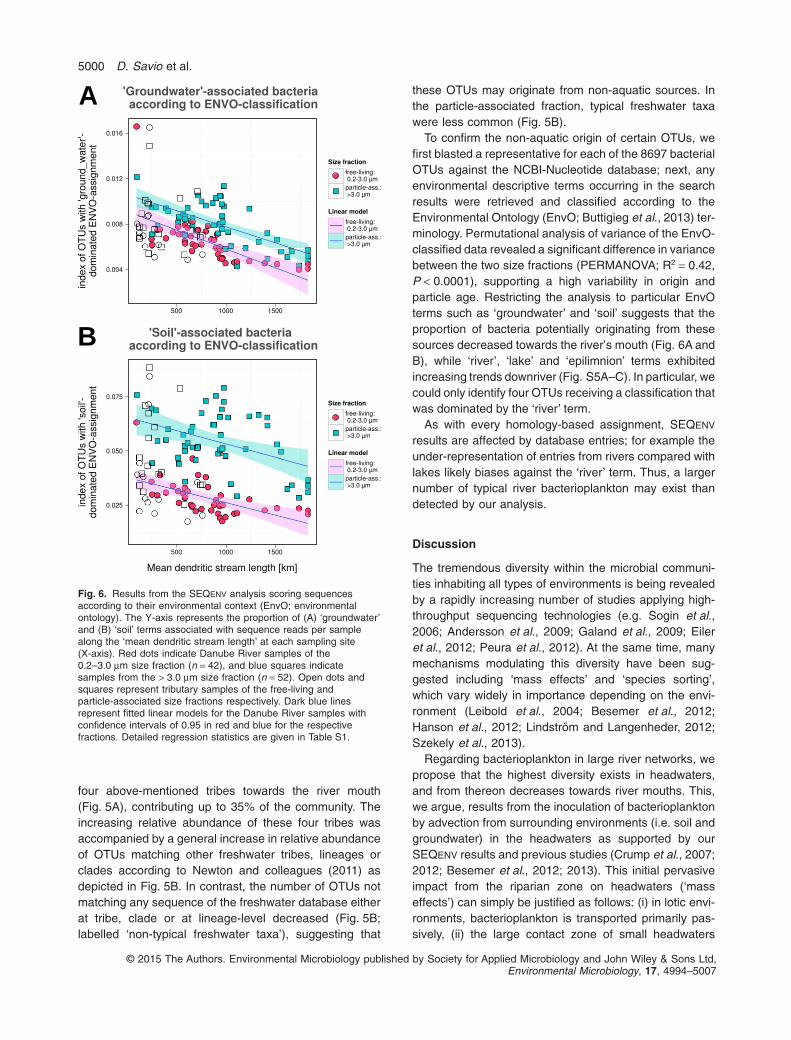
To confirm the non-aquatic origin of certain OTUs, wefirst blasted a representative for each of the 8697 bacterialOTUs against the NCBI-Nucleotide database; next, anyenvironmental descriptive terms occurring in the searchresults were retrieved and classified according to theEnvironmental Ontology (EnvO; Buttigieg et al., 2013) ter-minology. Permutational analysis of variance of the EnvO-classified data revealed a significant difference in variancebetween the two size fractions (PERMANOVA; R2 = 0.42,P < 0.0001), supporting a high variability in origin andparticle age. Restricting the analysis to particular EnvOterms such as ‘groundwater’ and ‘soil’ suggests that theproportion of bacteria potentially originating from thesesources decreased towards the river’s mouth (Fig. 6A andB), while ‘river’, ‘lake’ and ‘epilimnion’ terms exhibitedincreasing trends downriver (Fig. S5A–C). In particular, wecould only identify four OTUs receiving a classification thatwas dominated by the ‘river’ term.
As with every homology-based assignment, SEQENV
results are affected by database entries; for example theunder-representation of entries from rivers compared withlakes likely biases against the ‘river’ term. Thus, a largernumber of typical river bacterioplankton may exist thandetected by our analysis.
Discussion
The tremendous diversity within the microbial communi-ties inhabiting all types of environments is being revealedby a rapidly increasing number of studies applying high-throughput sequencing technologies (e.g. Sogin et al.,2006; Andersson et al., 2009; Galand et al., 2009; Eileret al., 2012; Peura et al., 2012). At the same time, manymechanisms modulating this diversity have been sug-gested including ‘mass effects’ and ‘species sorting’,which vary widely in importance depending on the envi-ronment (Leibold et al., 2004; Besemer et al., 2012;Hanson et al., 2012; Lindström and Langenheder, 2012;Szekely et al., 2013).
Regarding bacterioplankton in large river networks, wepropose that the highest diversity exists in headwaters,and from thereon decreases towards river mouths. This,we argue, results from the inoculation of bacterioplanktonby advection from surrounding environments (i.e. soil andgroundwater) in the headwaters as supported by ourSEQENV results and previous studies (Crump et al., 2007;2012; Besemer et al., 2012; 2013). This initial pervasiveimpact from the riparian zone on headwaters (‘masseffects’) can simply be justified as follows: (i) in lotic envi-ronments, bacterioplankton is transported primarily pas-sively, (ii) the large contact zone of small headwaters
Fig. 6. Results from the SEQENV analysis scoring sequencesaccording to their environmental context (EnvO; environmentalontology). The Y-axis represents the proportion of (A) ‘groundwater’and (B) ‘soil’ terms associated with sequence reads per samplealong the ‘mean dendritic stream length’ at each sampling site(X-axis). Red dots indicate Danube River samples of the0.2–3.0 μm size fraction (n = 42), and blue squares indicatesamples from the > 3.0 μm size fraction (n = 52). Open dots andsquares represent tributary samples of the free-living andparticle-associated size fractions respectively. Dark blue linesrepresent fitted linear models for the Danube River samples withconfidence intervals of 0.95 in red and blue for the respectivefractions. Detailed regression statistics are given in Table S1.
5000 D. Savio et al.
© 2015 The Authors. Environmental Microbiology published by Society for Applied Microbiology and John Wiley & Sons Ltd,Environmental Microbiology, 17, 4994–5007
(large surface-area-to-volume ratio) with the surroundingenvironment (soil and groundwater) facilitates the contri-bution of allochthonous bacteria to the river community(Crump et al., 2007; 2012; Besemer et al., 2012), (iii)these source environments of inoculation (soils andgroundwater) harbour a much higher diversity thanaquatic communities (e.g. Crump et al., 2012), and (iv)these newly introduced allochthonous bacteria should beat least temporarily capable of proliferating in their newlotic environment, making them constitutive members ofthe community. Overall, this process of allochthonousinput can be described by the so-called ‘mass-effect’,where dispersal of organisms exceeds the rate of localextinction (Leibold et al., 2004; Crump et al., 2007;2012).
Flowing downriver, with increasing river width anddecreasing ‘riparian influence’, we propose that ‘species-sorting’ progressively prevails over ‘mass effects’ inshaping the bacterioplankton composition. This is sup-ported by the increase of the core communities’ relativeabundance in both size fractions (Fig. 2) as well as therapidly decreasing number of first-time occurrences ofOTUs from upstream to downstream (Fig. S6). The asso-ciated progressive rise of few and more competitivetaxa is further supported by the observed simultaneousdecrease in evenness together with bacterial richness inboth size fractions downriver (Fig. 3A and B). Finally,the decrease of cell volumes along the Danube River(Velimirov et al., 2011) as well as a rise of typical fresh-water bacteria (Fig. 5A and B), representing small cellswith oligotrophic lifestyles (Salcher et al., 2011; Garciaet al., 2013), provides further evidence for the increasingimportance of ‘species-sorting’. The increasing resem-blance with lake communities (Fig. S5B and C) furthercorroborates the idea that lake and river bacterioplanktonresemble each other.
The interplay between ‘species sorting’ and ‘masseffects’ is fundamental to the meta-community concept(Leibold et al., 2004) and has previously been used toexplain the decreasing diversity along a path fromupslope soils via headwater streams to a final lake(Crump et al., 2012). The latter study suggested advec-tion of soil bacteria to strongly influence the receivingwater bodies due to the ‘mass effect’ of dispersing organ-isms exceeding the rate of ‘species sorting’ (Crump et al.,2012). For large river networks, however, this raises thequestion of when ‘species sorting’ will exceed ‘masseffects’. In contrast to ‘mass effects’, ‘species sorting’presumes that bacterial growth rates have to be shorterthan the residence time in the stream. Assuming amaximum bacterial growth rate of about 1d−1 (as calcu-lated for the bulk communities along the Danube Riverwith a maximum and mean of 0.92d−1 and 0.18d−1, respec-tively) and considering an estimated in-stream residence
time for the Danube River of 32 days (Velimirov et al.,2011), this provides sufficient time for ‘successful’ speciessorting.
In contrast to Crump and colleagues (2012), Read andcolleagues (2015) put little emphasis on the ‘mass effects’of the riparian zone and, instead, explained the down-stream shift in the bacterial communities along the RiverThames as the result of ecological succession. Theyargued that sampling sites not only represented a spatialdistribution but also a time series where downstream siteswith longer water residence times contain older river waterand a planktonic community that is in the later stages ofecological succession. However, a concept like ecologicalsuccession might not be the most suited to describebacterioplankton diversity patterns in the Danube basinwhich is much larger, and the residence times are aboutfive times as long when compared with the River Thames.First, we could not observe an initial active growth andpropagation of new pioneer species (often r-strategists)as it would be expected during ecological succession,but solely a decrease in proportions of Bacteroidetes-affiliated cells. Second, the data clearly showed adecrease in alpha diversity, both evenness and richness,downriver. Assuming a dominance of fast-growingr-strategists in the highly dynamic communities of theupstream reaches, one would expect low evenness inthese reaches. Moreover, highest production rates, asanticipated for a dominance of r-strategists, were notobserved in the upstream reaches, but the middle sectionof the Danube River [between river kilometre (rkm) 1632-1071; Velimirov et al., 2011]. Besides, elevated productionrates in the uppermost section were largely assignable toparticle-associated bacteria (Velimirov et al., 2011), indi-cating high-quality particulate substrate originating fromthe riparian zone.
Instead of viewing the community assembly in headwa-ters as the colonization of a lifeless area (primary succes-sion) or the development following a disturbance of anestablished community (secondary succession), wesimply regard streams as part of the hydrological cyclesuch as soil waters and interstitial groundwaters, in whichbacteria are transported passively. Thus, we concludethat dispersal-based concepts are more appropriate fordescribing the community assembly at the transitionbetween the different compartments. The Danube datasuggest that the ‘mass effects’ of soil and groundwaterbacteria across the streambed contact zone are importantprocesses, as reflected in the decreasing proportion ofsoil and groundwater-associated bacteria. This decreaseof the effect of the streambed contact zone can be illus-trated by comparing the uppermost and lowest reaches ofthe survey, using the ratio of wetted perimeter and cross-sectional area as a measure of river bed contact zone. Atthe Upper Danube near Ulm, Germany, an average dis-
River bacterioplankton diversity 5001
© 2015 The Authors. Environmental Microbiology published by Society for Applied Microbiology and John Wiley & Sons Ltd,Environmental Microbiology, 17, 4994–5007

charge of 40 m3 s−1 translates into a ratio of about0.83 m−1 while at the Lower Danube near Reni, Romania,an average discharge of 6300 m3 s−1 translates into a ratioof 0.056 m−1. This means that within the sampled reach,the effect of the contact zone decreases by more than10-fold downriver.
Taken together, the findings of this paper and the existingliterature (Besemer et al., 2012; 2013; Crump et al., 2012;Staley et al., 2013) suggest that the diversity ofbacterioplankton decreases from headwaters to the rivermouth due to the decreasing importance of the ‘riparianinfluence’. This is consistent with the important role theRCC assigns to the riparian zone as well as to the physicaldrivers such as river flow and wetted perimeter. Moreover,by referring to dissolved organic matter (DOM) in terms ofquality, proposing highest DOM diversity in headwatersand a downstream export of more refractory compounds,the RCC also allows us to incorporate a proposed DOM(‘food’)-based ‘species sorting’, leading to an oligotrophicfreshwater bacteria-dominated community with increasingwater residence time. Analogously, an increase in theabundance of a few, more competitive species along theriver is implied in the RCC for macroorganisms frommedium-sized reaches towards river mouths (Vannoteet al., 1980). However, to further develop and incorporatebacterioplankton into the RCC, future studies shouldaddress the role of DOM quality changes as a function ofcatchment characteristics as well as seasonal changes inphysical and chemical features of riverine systems.
In summary, the data from the Danube survey along a2600 km river continuum indicated that bacterial richnessand evenness gradually declined downriver in both thefree-living and particle-associated bacterial communities,resulting in an increase in relative abundance of typicalfreshwater taxa downstream. The decreasing influence ofsoil and groundwater bacteria downstream suggests theRCC as a valid interpretive framework which stipulates acontinuous gradient of physical conditions that elicit aseries of biological responses, resulting in consistent pat-terns of community structure and function along the riversystem.
Experimental procedures
Supporting data
Within the frame of the second Joint Danube Survey (JDS2), awide range of chemical and biological parameters was col-lected (Liska et al., 2008). All data, sampling methods as wellas analytical methods, are made publicly available via theofficial website of the International Commission for the Protec-tion of the Danube River (http://www.icpdr.org/wq-db/) anddata used in this study is provided in Table S3.. Selected datafrom Joint Danube Survey (JDS) 1 and 2 were publishedpreviously in several studies (Kirschner et al., 2009; Janaueret al., 2010; Velimirov et al., 2011; Von der Ohe et al., 2011).
Geomorphological parameters including ‘catchment area’,‘mean dendritic stream length’ and, for comparison, ‘cumula-tive dendritic distance upstream’ were calculated based ondata from the Catchment Characterisation and Modelling(CCM) River and CATCHMENT DATABASE, version 2.1 (De Jagerand Vogt, 2010). The ‘mean dendritic stream length’ wascalculated by first identifying the stream paths from all springsin the catchment area upstream a sampling site to that sam-pling site. The lengths of these paths were than averaged. Thisimplies that the shared reaches were counted multiple timesconsistent with the movement of water drops in the river basin.This parameter gives the average flow distance (assuming thespring discharges are randomly distributed in the catchment)and therefore the average residence time in the stream(assuming constant flow velocities). In contrast, the ‘cumula-tive dendritic distance upstream’ was calculated asthe sum of the blue lines on the map (counting the lengthsbelow confluences only once) which gives a geometric param-eter indicative of the drainage density, but not of residencetimes.
Additionally, as a measure of the river bed contact zone, theratio of wetted perimeter and cross-sectional area was calcu-lated for the long-term average discharge. Both the wettedperimeter and the areas are obtained from bathymetricsurveys. The product of the area and the flow velocity gives thedischarge. Here, typical values of the ratio were chosen for ashort reach upstream the sampling sites.
Study sites and sample collection
Samples were collected within the frame of the JDS 2project in 2007. The overall purpose of the Joint DanubeSurveys is to produce a comprehensive evaluation of thechemical and ecological status of the entire Danube Riveron the basis of the European Union Water Framework Direc-tive (Liska et al., 2008). During sampling from 15 August to26 September 2007, 75 sites were sampled along the main-stream of the Danube River along its navigable way fromriver kilometre (rkm) 2600 near Ulm (DE) to the river mouthat rkm 0 (Kirschner et al., 2009) as shown in Fig. 1. In addi-tion, 21 samples from the Danube’s major tributaries andbranches were included. At the most upstream sites, theDanube River is representative of a typical stream of therhithron and characterized by its tributaries Iller, Lech andIsar (Kavka and Poetsch, 2002). The trip took 43 days whichis a similar time period as the travel time of water in theDanube over this reach (see Velimirov et al., 2011). Sampleswere collected with sterile 1 L glass flasks from a waterdepth of approximately 30 cm. Glass flasks were sterilizedby rinsing with 0.5% HNO3 and autoclaving them. Fordeoxyribonucleic acid (DNA) extraction of the particle-associated bacterioplankton depending on the biomassconcentration, 120–300 ml river water was filtered through3.0 μm pore-sized polycarbonate filters (Cyclopore,Whatman, Germany) by vacuum filtration. The filtrate, whichrepresented the bacterioplankton fraction smaller than3.0 μm (later referred to as ‘free-living’ bacterioplankton),was collected in a sterile glass bottle and subsequently fil-tered through 0.2 μm pore-sized polycarbonate filters(Cyclopore, Whatman, Germany). The filters were stored at−80°C until DNA extraction.
5002 D. Savio et al.
© 2015 The Authors. Environmental Microbiology published by Society for Applied Microbiology and John Wiley & Sons Ltd,Environmental Microbiology, 17, 4994–5007

DNA extraction and quantification of bacterial DNAusing quantitative polymerase chain reaction
Genomic DNA was extracted using a slightly modified proto-col of a previously published phenol-chloroform, bead-beating procedure (Griffiths et al., 2000) using isopropanolinstead of polyethylene glycol for DNA precipitation. TotalDNA concentration was assessed applying the Quant-iTPicoGreen dsDNA Assay Kit (Life Technologies Corporation,USA), and 16S rRNA genes were quantified using Bacteria-specific quantitative polymerase chain reaction (qPCR).Quantitative PCR reactions contained 2.5 μl of 1:4 and 1:16diluted DNA extract as the template, 0.2 μM of primers 8Fand 338 (Frank et al., 2007; Fierer et al., 2008) targeting theV1-V2 region of most bacterial 16S rRNA genes and iQSYBR Green Supermix (Bio-Rad Laboratories, Hercules,USA). All primer information are available in Table S2. Theratios of measured 16S rRNA gene copy numbers in thedifferent sample dilutions that deviated markedly from oneafter multiplication with the respective dilution factor wereinterpreted as an indicator for PCR inhibition.
Preparation of 16S rRNA gene amplicon libraries
For the preparation of amplicon libraries, 16S rRNA geneswere amplified and barcoded in a two-step PCR procedure toreduce PCR bias that is introduced by long primers andsequencing adaptor overhangs (Berry et al., 2011). We fol-lowed the protocol as described by Sinclair and colleagues(2015). In short, 16S rRNA gene fragments of most bacteriawere amplified by applying primers Bakt_341F andBakt_805R (Herlemann et al., 2011; Table S2) targeting theV3-V4 variable regions. In 25 μl reactions containing 0.5 μMprimer Bakt_341F and Bakt_805R, 0.2 μM dNTPs(Invitrogen), 0.5 U Q5 HF DNA polymerase and the providedbuffer (New England Biolabs, USA), genomic DNA wasamplified in duplicate in 20 cycles. To use equal amounts ofbacterial template DNA for increased comparability andreduction of PCR bias, the final volume of environmentalDNA extract used for each sample was calculated based on16S rRNA gene copy concentration in the respective sampledetermined earlier by qPCR (see above). For 105 samples,the self-defined optimum volume of environmental DNAextract corresponding to 6.4 × 10⁵ 16S rRNA genes wasspiked into the first step PCR reactions; however, for 27samples, lower concentrations were used due to limitedamounts of bacterial genomic DNA or PCR inhibitiondetected by quantitative PCR (see above). These 132samples included eight biological replicates. Prior to theanalysis, we removed four samples due to their extremely lowgenomic DNA concentrations and 16S rRNA gene copynumbers. Duplicates of PCR products were pooled, diluted to1:100 and used as templates in the subsequent barcodingPCR. In this PCR, diluted 16S rRNA gene amplicons wereamplified using 50 primer pairs with unique barcode pairs(Sinclair et al., 2015; Table S2). The barcoding PCRs formost samples were conducted in triplicates analogous to thefirst PCR (n = 100). The remaining 32 samples that had weakbands in first step PCR due to low genomic template DNAconcentrations or high sample dilution were amplified in 6–9replicates to increase amplicon DNA yield. Barcoded PCRamplicons were pooled in an equimolar fashion after purifi-
cation using the Agencourt AMPure XP purification system(Beckman Coulter, Danvers, MA, USA) and quantification ofamplicon concentration using the Quant-iT PicoGreendsDNA Assay Kit (Life Technologies Corporation, USA).Finally, a total of 137 samples including five negative controlsresulted in four pools for sequencing.
Illumina sequencing
The sequencing was performed on an Illumina MiSeq at theSciLifeLab SNP/SEQ sequencing facility hosted by UppsalaUniversity. For each pool, the library preparation was per-formed separately following the TruSeq Sample PreparationKit V2 protocol (EUC 15026489 Rev C, Illumina) with theexception of the initial fragmentation and size selection pro-cedures. This involves the binding of the standard sequenc-ing adapters in combination with separate Illumina-specificmultiplex identifier (MID) bar codes that enables the combi-nation of different pools on the same sequencing run (Sinclairet al., 2015). After pooling, random PhiX DNA was added(5%) to provide calibration and help with the cluster genera-tion on the MiSeq’s flow cell.
16S rRNA gene amplicon data analysis
The sequence data were processed as outlined by Sinclairand colleagues (2015). After sequencing the libraries of 16SrRNA gene amplicons, the read pairs were de-multiplexedand joined using the PANDASEQ software v2.4 (Masellaet al., 2012). Next, sequence reads (further referred to as‘reads’) that did not bear the correct primer sequences at thestart and end of their sequences were discarded. Reads werethen filtered based on their PHRED scores. Chimera removaland OTU clustering at 3% sequence dissimilarity was per-formed by pooling all reads from all samples together andapplying the UPARSE algorithm v7.0.1001 (Edgar, 2013).Here, any OTU containing less than two reads was dis-carded. Each OTU was subsequently taxonomically classi-fied by operating a similarity search against the SILVAMOD
database and employing the CREST assignment algorithm(Lanzén et al., 2012). Plastid, mitochondrial and archaealOTUs were removed. In addition, OTUs were also taxonomi-cally annotated against the freshwater database (Newtonet al., 2011) using the same method. If necessary, OTU rar-efying for the purpose of standardizing sequence numberswas performed using the ‘rrarefy’-function implemented in theR package vegan (Oksanen et al., 2013). For alpha diversityanalysis (Chao1 richness estimator and Pielou’s evenness),we rarefied down to 7000 reads per sample. This was basedon one study revealing that for water samples, a sequencingdepth of 5000 16S rRNA gene reads per sample capturedmore than 80% of the trends in Chao1 richness and Pielou’sevenness (Lundin et al., 2012). Furthermore, this study couldshow that for water samples, 1000 reads per sampleexplained to 90% the trends in beta diversity (Bray–Curtisdissimilarity index). By rarefying down to 2347, which was theread number of the sample with the lowest reads, all samplescould be included in the beta-diversity analysis. Diversitymeasures, statistical analyses and plot generation were con-ducted in R (R Core Team, 2013) and using python scripts.The habitat index for the top 5000 OTUs was determined
River bacterioplankton diversity 5003
© 2015 The Authors. Environmental Microbiology published by Society for Applied Microbiology and John Wiley & Sons Ltd,Environmental Microbiology, 17, 4994–5007

using the SEQENV pipeline (http://environments.hcmr.gr/seqenv.html). The SEQENV pipeline retrieves hits to highlysimilar sequences from public repositories (NCBI Genbank)and uses a text mining module to identify EnvO (Buttigieget al., 2013) terms mentioned in the associated contextualinformation records (‘Isolation Source’ field entry for genomesin Genbank or associated PubMed abstracts). At the time ofrunning SEQENV on our dataset (version 0.8), there wereapproximately 1200 EnvO terms organized into three mainbranches (namely, environmental material, environmentalfeature and biome). However, we used SEQENV to retrieve asubset of these terms, i.e. those that contain ‘Habitat’(EnvO:00002036). Raw sequence data were submitted to theNCBI Sequence Read Archive under accession numberSRP045083.
General description of sequences
In total, DNA was extracted and sequenced from 132 filteredwater samples originating from the Danube River and itstributaries. In addition, the same procedure was applied to fivenegative control samples. The sequencing yielded two030 029 read pairs ranging from 3451 to 24 873 per sample.After quality filtering and mate pair joining as outlined inSinclair and colleagues (2015), 1 572 361 sequence readswere obtained. The OTU clustering resulted in 8697OTUs after the removal of all Plastid-, Mitochondrion-,Thaumarchaeota-, Crenarchaeota- and Euryarchaeota-assigned OTUs. Archaea-assigned OTUs were removedbecause of the use of bacteria-specific primers not giving arepresentative picture of the targetedArchaea community. Theundesirable Plastid, Mitochondrion and Archaea sequencesrepresented 19.1% of the reads and accounted for 625 OTUs.Next, for the alpha diversity analysis, we excluded any samplewith less than 7000 reads, resulting in 8648 OTUs in theremaining 88 samples. By contrast, for the beta diversityanalysis, which is less affected by rare OTUs, all samples wererandomly rarefied to the lowest number of reads in any onesample in order to include a maximum number of samples inthe analysis. This brought every sample down to 2347 reads,and any OTU containing less than two reads was discarded,which brought the total OTU count to 5082.
Acknowledgements
This study was supported by the Austrian Science Fund(FWF) as part of the ‘Vienna Doctoral Program on WaterResource Systems’ (DKplus W1219-N22) and the FWF pro-jects P25817-B22 and P23900-B22, as well as the researchproject ‘Groundwater Resource Systems Vienna’ in coopera-tion with Vienna Water (MA31). AE and LS are funded by theSwedish Foundation for Strategic Research (ICA10-0015).Infrastructure (cruise ships, floating laboratory) and logisticsfor collecting, storing and transporting samples were pro-vided by the International Commission for the Protection ofthe Danube River (ICPDR). The analyses were performedusing resources provided by the SNIC through the UppsalaMultidisciplinary Center for Advanced Computational Science(UPPMAX) under project ‘b2011035’. This product includesdata licensed from ICPDR.
Conflict of interest
The authors declare no conflict of interest.
References
Andersson, A.F., Riemann, L., and Bertilsson, S. (2009)Pyrosequencing reveals contrasting seasonal dynamics oftaxa within Baltic Sea bacterioplankton communities. ISMEJ 4: 171–181.
Aufdenkampe, A.K., Mayorga, E., Raymond, P.A., Melack,J.M., Doney, S.C., Alin, S.R., et al. (2011) Riverine cou-pling of biogeochemical cycles between land, oceans, andatmosphere. Front Ecol Environ 9: 53–60.
Battin, T.J., Luyssaert, S., Kaplan, L.A., Aufdenkampe, A.K.,Richter, A., and Tranvik, L.J. (2009) The boundless carboncycle. Nat Geosci 2: 598–600.
Beaulieu, J.J., Tank, J.L., Hamilton, S.K., Wollheim, W.M.,Hall, R.O., Mulholland, P.J., et al. (2010) Nitrous oxideemission from denitrification in stream and river networks.Proc Natl Acad Sci USA 108: 214–219.
Benstead, J.P., and Leigh, D.S. (2012) An expanded role forriver networks. Nat Geosci 5: 678–679.
Berry, D., Ben Mahfoudh, K., Wagner, M., and Loy, A.(2011) Barcoded primers used in multiplex ampliconpyrosequencing bias amplification. Appl Environ Microbiol77: 7846–7849.
Besemer, K., Peter, H., Logue, J.B., Langenheder, S.,Lindström, E.S., Tranvik, L.J., and Battin, T.J. (2012)Unraveling assembly of stream biofilm communities. ISMEJ 6: 1459–1468.
Besemer, K., Singer, G., Quince, C., Bertuzzo, E., Sloan, W.,and Battin, T.J. (2013) Headwaters are critical reservoirs ofmicrobial diversity for fluvial networks. Proc Biol Sci 280:20131760. doi: 10.1098/rspb.2013.1760
Bižic-Ionescu, M., Zeder, M., Ionescu, D., Orlic, S., Fuchs,B.M., Grossart, H.-P., and Amann, R. (2014) Comparisonof bacterial communities on limnic versus coastalmarine particles reveals profound differences in coloniza-tion. Environ Microbiol. doi:10.1111/1462-2920.12466[Epub ahead of print].
Buttigieg, P.L., Morrison, N., Smith, B., Mungall, C.J., andLewis, S.E. (2013) The environment ontology:contextualising biological and biomedical entities.J Biomed Semantics 4: 43. doi: 10.1186/2041-1480-4-43
Cole, J.J., Prairie, Y.T., Caraco, N.F., McDowell, W.H.,Tranvik, L.J., Striegl, R.G., et al. (2007) Plumbing theglobal carbon cycle: integrating inland waters into the ter-restrial carbon budget. Ecosystems 10: 172–185.
Cotner, J.B., and Biddanda, B.A. (2002) Small players, largerole: microbial influence on biogeochemical processes inpelagic aquatic ecosystems. Ecosystems 5: 105–121.
Cottrell, M.T., Waidner, L.A., Yu, L., and Kirchman, D.L.(2005) Bacterial diversity of metagenomic and PCR librar-ies from the Delaware River: metagenomic analysis offreshwater bacteria. Environ Microbiol 7: 1883–1895.
Crump, B.C., Armbrust, E.V., and Baross, J.A. (1999)Phylogenetic analysis of particle-attached and free-livingbacterial communities in the Columbia River, its estuary,and the adjacent coastal ocean. Appl Environ Microbiol 65:3192–3204.
5004 D. Savio et al.
© 2015 The Authors. Environmental Microbiology published by Society for Applied Microbiology and John Wiley & Sons Ltd,Environmental Microbiology, 17, 4994–5007

Crump, B.C., Adams, H.E., Hobbie, J.E., and Kling, G.W.(2007) Biogeography of bacterioplankton in lakes andstreams of an arctic tundra catchment. Ecology 88: 1365–1378.
Crump, B.C., Amaral-Zettler, L.A., and Kling, G.W. (2012)Microbial diversity in arctic freshwaters is structured byinoculation of microbes from soils. ISME J 6: 1629–1639.
De Jager, A.L., and Vogt, J.V. (2010) Development and dem-onstration of a structured hydrological feature codingsystem for Europe. Hydrol Sci J. 55: 661–675.
Edgar, R.C. (2013) UPARSE: highly accurate OTUsequences from microbial amplicon reads. Nat Methods10: 996–998.
Eiler, A., Heinrich, F., and Bertilsson, S. (2012) Coherentdynamics and association networks among lakebacterioplankton taxa. ISME J 6: 330–342.
Ensign, S.H., and Doyle, M.W. (2006) Nutrient spiraling instreams and river networks. J Geophys Res 111: G04009.doi: 10.1029/2005JG000114
Fierer, N., Hamady, M., Lauber, C.L., and Knight, R. (2008)The influence of sex, handedness, and washing on thediversity of hand surface bacteria. Proc Natl Acad Sci USA105: 17994–17999.
Findlay, S. (2010) Stream microbial ecology. J North AmBenthol Soc 29: 170–181.
Frank, D.N., St. Amand, A.L., Feldman, R.A., Boedeker, E.C.,Harpaz, N., and Pace, N.R. (2007) Molecular-phylogeneticcharacterization of microbial community imbalances inhuman inflammatory bowel diseases. Proc Natl Acad SciUSA 104: 13780–13785.
Galand, P.E., Casamayor, E.O., Kirchman, D.L., and Lovejoy,C. (2009) Ecology of the rare microbial biosphere of theArctic Ocean. Proc Natl Acad Sci USA 106: 22427–22432.
Garcia, S.L., McMahon, K.D., Martinez-Garcia, M.,Srivastava, A., Sczyrba, A., Stepanauskas, R., et al. (2013)Metabolic potential of a single cell belonging to one of themost abundant lineages in freshwater bacterioplankton.ISME J 7: 137–147.
Ghai, R., Rodriguez-Valera, F., McMahon, K.D., Toyama, D.,Rinke, R., Cristina Souza de Oliveira, T., et al. (2011)Metagenomics of the water column in the pristine uppercourse of the Amazon river. PLoS ONE 6: e23785. doi:10.1371/journal.pone.0023785
Griffiths, R.I., Whiteley, A.S., O’Donnell, A.G., and Bailey,M.J. (2000) Rapid method for coextraction of DNA andRNA from natural environments for analysis of ribosomalDNA- and rRNA-based microbial community composition.Appl Environ Microbiol 66: 5488–5491.
Hanson, C.A., Fuhrman, J.A., Horner-Devine, M.C., andMartiny, J.B.H. (2012) Beyond biogeographic patterns:processes shaping the microbial landscape. Nat RevMicrobiol 10: 497–506.
Herlemann, D.P., Labrenz, M., Jurgens, K., Bertilsson, S.,Waniek, J.J., and Andersson, A.F. (2011) Transitions inbacterial communities along the 2000 km salinity gradientof the Baltic Sea. ISME J 5: 1571–1579.
Janauer, G.A., Schmidt-Mumm, U., and Schmidt, B. (2010)Aquatic macrophytes and water current velocity in theDanube River. Ecol Eng 36: 1138–1145.
Kavka, G.G., and Poetsch, E. (2002) Microbiology. In JointDanube Survey: Technical Report of the International Com-
mission for the Protection of the Danube River. Literathy,P., Koller-Kreinel, V., and Liska, I. (eds). Vienna, Austria:ICPDR, pp. 138–150.
Kirschner, A.K.T., Kavka, G.G., Velimirov, B., Mach, R.L.,Sommer, R., and Farnleitner, A.H. (2009) Microbiologicalwater quality along the Danube River: integrating data fromtwo whole-river surveys and a transnational monitoringnetwork. Water Res 43: 3673–3684.
Kolmakova, O.V., Gladyshev, M.I., Rozanov, A.S., Peltek,S.E., and Trusova, M.Y. (2014) Spatial biodiversity ofbacteria along the largest Arctic river determined bynext-generation sequencing. FEMS Microbiol Ecol 89:442–450.
Kronvang, B., Hoffmann, C., Svendsen, L., Windolf, J.,Jensen, J., and Dørge, J. (1999) Retention of nutrients inriver basins. Aquat Ecol 33: 29–40.
Lanzén, A., Jørgensen, S.L., Huson, D.H., Gorfer, M.,Grindhaug, S.H., Jonassen, I., et al. (2012) CREST – clas-sification resources for environmental sequence tags.PLoS ONE 7: e49334. doi:10.1371/journal.pone.0049334.
Leibold, M.A., Holyoak, M., Mouquet, N., Amarasekare, P.,Chase, J.M., Hoopes, M.F., et al. (2004) Themetacommunity concept: a framework for multi-scale com-munity ecology. Ecol Lett 7: 601–613.
Lemke, M.J., Lienau, E.K., Rothe, J., Pagioro, T.A.,Rosenfeld, J., and DeSalle, R. (2008) Description offreshwater bacterial assemblages from the UpperParaná River floodpulse system, Brazil. Microb Ecol 57:94–103.
Lindström, E.S., and Langenheder, S. (2012) Local andregional factors influencing bacterial community assembly.Environ Microbiol Rep 4: 1–9.
Liska, I., Slobodnik, J., and Wagner, F. (2008) Joint DanubeSurvey 2, Final Scientific Report. Int. Comm. Prot. DanubeRiver.
Liu, Z., Huang, S., Sun, G., Xu, Z., and Xu, M. (2012)Phylogenetic diversity, composition and distribution ofbacterioplankton community in the Dongjiang River, China.FEMS Microbiol Ecol 80: 30–44.
Lozupone, C.A., and Knight, R. (2007) Global patterns inbacterial diversity. Proc Natl Acad Sci USA 104: 11436–11440.
Lundin, D., Severin, I., Logue, J.B., Östman, Ö., Andersson,A.F., and Lindström, E.S. (2012) Which sequencing depthis sufficient to describe patterns in bacterial α- andβ-diversity? Environ Microbiol Rep 4: 367–372.
Madsen, E.L. (2011) Microorganisms and their roles in fun-damental biogeochemical cycles. Curr Opin Biotechnol 22:456–464.
Masella, A., Bartram, A., Truszkowski, J., Brown, D., andNeufeld, J. (2012) PANDAseq: paired-end assembler forIllumina sequences. BMC Bioinformatics 13: 1–7.
Mohit, V., Archambault, P., Toupoint, N., and Lovejoy, C.(2014) Phylogenetic differences in summer attached andfree-living bacterial communities in a temperate coastallagoon, revealed via high throughput 16S rRNA genesequencing. Appl Environ Microbiol 80: 2071–2083.
Mueller-Spitz, S.R., Goetz, G.W., and McLellan, S.L.(2009) Temporal and spatial variability in nearshorebacterioplankton communities of Lake Michigan. FEMSMicrobiol Ecol 67: 511–522.
River bacterioplankton diversity 5005
© 2015 The Authors. Environmental Microbiology published by Society for Applied Microbiology and John Wiley & Sons Ltd,Environmental Microbiology, 17, 4994–5007

Newton, R.J., Jones, S.E., Eiler, A., McMahon, K.D., andBertilsson, S. (2011) A guide to the natural history of fresh-water lake bacteria. Microbiol Mol Biol Rev 75: 14–49.
Oksanen, J., Blanchet, F.G., Kindt, R., Legendre, P., Minchin,P.R., O’Hara, R.B., et al. (2013) vegan: community ecologypackage. R package version 2.0-10. URL http://CRAN.R-project.org/package=vegan.
Peura, S., Eiler, A., Bertilsson, S., Nykanen, H., Tiirola, M.,and Jones, R.I. (2012) Distinct and diverse anaerobic bac-terial communities in boreal lakes dominated by candidatedivision OD1. ISME J 6: 1640–1652.
R Core Team (2013) R: A Language and Environment forStatistical Computing. Vienna, Austria: R Foundation forStatistical Computing. URL http://www.R-project.org/.
Raymond, P.A., Hartmann, J., Lauerwald, R., Sobek, S.,McDonald, C., Hoover, M., et al. (2013) Global carbondioxide emissions from inland waters. Nature 503: 355–359.
Read, D.S., Gweon, H.S., Bowes, M.J., Newbold, L.K., Field,D., Bailey, M.J., and Griffiths, R.I. (2015) Catchment-scalebiogeography of riverine bacterioplankton. ISME J 9: 516–526.
Richey, J.E., Melack, J.M., Aufdenkampe, A.K., Ballester,V.M., and Hess, L.L. (2002) Outgassing from Amazonianrivers and wetlands as a large tropical source of atmos-pheric CO2. Nature 416: 617–620.
Rodriguez-Iturbe, I., Muneepeerakul, R., Bertuzzo, E., Levin,S.A., and Rinaldo, A. (2009) River networks as ecologicalcorridors: a complex systems perspective for integratinghydrologic, geomorphologic, and ecologic dynamics. WaterResour Res 45: W01413. doi: 10.1029/2008WR007124
Salcher, M.M., Pernthaler, J., and Posch, T. (2011) Seasonalbloom dynamics and ecophysiology of the freshwater sisterclade of SAR11 bacteria ‘that rule the waves’ (LD12). ISMEJ 5: 1242–1252.
Schmedtje, U., Bachmann, J., Behrendt, H., Birk, S., Biza, P.,D’Eugenio, J., et al. (2004) Danube Basin Analysis (WFDRoof Report 2004). The Danube River Basin District –River Basin Characteristics, Impacts of Human Activitiesand Economic Analysis Required Under Article 5, Annex IIand Annex III, and Inventory of Protected Areas RequiredUnder Article 6, Annex IV of the EU Water FrameworkDirective (2000/60/EC) – Part A – Basin-wide Overview.ICPDR, Vienna, Austria (2005) 191 pp.
Seitzinger, S.P., Mayorga, E., Bouwman, A.F., Kroeze, C.,Beusen, A.H.W., Billen, G., et al. (2010) Global river nutri-ent export: a scenario analysis of past and future trends.Global Biogeochem Cycles 24: GB0A08.
Sinclair, L., Osman, O.A., Bertilsson, S., and Eiler, A.(2015) Microbial community composition and diversityvia 16S rRNA gene amplicons: evaluating the Illuminaplatform. PLoS ONE 10: e0116955. doi:10.1371/journal.pone.0116955.
Sogin, M.L., Morrison, H.G., Huber, J.A., Welch, D.M., Huse,S.M., Neal, P.R., et al. (2006) Microbial diversity in thedeep sea and the underexplored ‘rare biosphere’. Proc NatlAcad Sci USA 103: 12115–12120.
Sommerwerk, N., Bloesch, J., Paunovic, M., Baumgartner,C., Venohr, M., Schneider-Jacoby, M., et al. (2010) Man-aging the world’s most international river: the Danube RiverBasin. Mar Freshw Res 61: 736–748.
Staley, C., Unno, T., Gould, T.J., Jarvis, B., Phillips, J.,Cotner, J.B., and Sadowsky, M.J. (2013) Application ofIllumina next-generation sequencing to characterize thebacterial community of the Upper Mississippi River. J ApplMicrobiol 115: 1147–1158.
Szekely, A.J., Berga, M., and Langenheder, S. (2013)Mechanisms determining the fate of dispersed bacterialcommunities in new environments. ISME J 7: 61–71.
Vannote, R.L., Minshall, G.W., Cummins, K.W., Sedell, J.R.,and Cushing, C.E. (1980) The river continuum concept.Can J Fish Aquat Sci 37: 130–137.
Velimirov, B., Milosevic, N., Kavka, G., Farnleitner, A., andKirschner, A.T. (2011) Development of the bacterial com-partment along the Danube River: a continuum despitelocal influences. Microb Ecol 61: 955–967.
Von der Ohe, P.C., Dulio, V., Slobodnik, J., De Deckere, E.,Kühne, R., Ebert, R.-U., et al. (2011) A new risk assess-ment approach for the prioritization of 500 classicaland emerging organic microcontaminants as potentialriver basin specific pollutants under the European WaterFramework Directive. Sci Total Environ 409: 2064–2077.
Winter, C., Hein, T., Kavka, G., Mach, R.L., and Farnleitner,A.H. (2007) Longitudinal changes in the bacterial commu-nity composition of the Danube River: a whole-riverapproach. Appl Environ Microbiol 73: 421–431.
Withers, P.J.A., and Jarvie, H.P. (2008) Delivery and cyclingof phosphorus in rivers: a review. Sci Total Environ 400:379–395.
Zwart, G., Crump, B.C., Kamst-van Agterveld, M.P., Hagen,F., and Han, S.-K. (2002) Typical freshwater bacteria: ananalysis of available 16S rRNA gene sequences fromplankton of lakes and rivers. Aquat Microb Ecol 28: 141–155.
Supporting information
Additional Supporting Information may be found in the onlineversion of this article at the publisher’s web-site:
Fig. S1. Development of selected environmental parametersalong the Danube River from the upstream region (rkm 2600;left) to the river mouth at the Black Sea (rkm 0; right). Leftpanel: alkalinity, pH, total bacterial production (TBP), totalsuspended solids (TSS); Right panel: nitrate (NO3
-), dis-solved silicates (SiO2 diss) and phytoplankton biomass(Chl-a) [PP biomass (Chl-a)].Fig. S2. Non-metric multidimensional scaling plot of thecompositional dissimilarities between communities (Bray–Curtis dissimilarities) of all samples of the Danube River andits tributaries. The stress value of the NMDS was 0.17. Dotsrepresent free-living bacterial communities (0.2–3.0 μm); tri-angles display particle-associated bacterial communities(> 3.0 μm). Open symbols represent tributary samples,whereas full symbols indicate communities in the DanubeRiver. The gradient from orange to blue via purple indicatesthe official Danube River kilometre assignment [rkm2600 = upstream region near Ulm (DE), rkm 0 = river mouthat Black Sea] at the respective sampling site in the DanubeRiver and for tributaries at the site (official rkm) of confluencewith the Danube River, independent of its length.
5006 D. Savio et al.
© 2015 The Authors. Environmental Microbiology published by Society for Applied Microbiology and John Wiley & Sons Ltd,Environmental Microbiology, 17, 4994–5007

Fig. S3. Box plot of variability in bacterial communities indifferent size fractions (0.2–3.0 μm and > 3.0 μm) based onbeta-dispersion of Bray–Curtis dissimilarities. Left: Variability(distance from centroid) in the free-living bacterial commu-nity; Right: Variability in the attached bacterial community.Fig. S4. Phylum-level taxonomic composition of the bacte-rial communities along the Danube River. The Y-axis showsthe read proportions assigned to the five most abundantphyla in the free-living fraction (left) and the particle-associated fraction (right). Lower abundant phyla wereincluded in the fraction ‘Others’ due to their low proportions.Samples are arranged from left to the right representingsequence from upstream (rkm 2600) to river mouth at theBlack Sea (rkm 0).Fig. S5. Results from the SEQENV analysis scoringsequences according to their environmental context (EnvO;environmental ontology). The Y-axis represents the propor-tion of (A) ‘river’, (B) ‘lake’ and (C) ‘epilimnion’ terms associ-ated with sequence reads per sample along the ‘meandendritic stream length’ at each sampling site (X-axis). Reddots indicate Danube River samples of the 0.2–3.0 μm sizefraction (n = 42), and blue squares indicate samples from the> 3.0 μm size fraction (n = 52). Open dots and squares rep-resent tributary samples of the free-living and particle-associated size fractions respectively. Dark blue lines
represent fitted linear models for the Danube River sampleswith confidence intervals of 0.95 in red and blue for therespective fractions. Detailed regression statistics are givenin Table S1.Fig. S6. First occurrence plot of OTUs along the DanubeRiver. Plotted are the numbers of OTUs occurring for the firsttime at the respective rkm of each sampling sites.Table S1. Summary of regression statistics (slope, intercept,multiple R-squared and P-value) for fitted linear modelsbetween the proportion of different EnvO terms associatedwith sequence reads per sample and ‘mean dendritic streamlength’ at the respective sampling site (upper section), andbetween alpha diversity measures [Chao1, Pielou’s Even-ness (J)] and geomorphological parameters (lower section).From the SEQENV analysis, regression statistics are given forthe EnvO-terms ‘groundwater’ (Fig. 6A), ‘soil’ (Fig. 6B), ‘river’(Fig. S5A), ‘lake’ (Fig. S5B) and ‘epilimnion’ (Fig. S5C). FL:free-living community of the Danube River (0.2–3.0 μm); PA:particle-associated Danube River community (> 3.0 μm).Table S2. List of used primers and barcodes for Illuminasequencing.Table S3. Results of all measured environmental and chemi-cal parameters during the JDS 2. Copy of the online availableJDS2-database-content. Export date: 2013-11-07.
River bacterioplankton diversity 5007
© 2015 The Authors. Environmental Microbiology published by Society for Applied Microbiology and John Wiley & Sons Ltd,Environmental Microbiology, 17, 4994–5007