bacterial production and biomass in the oceansweb.vims.edu/bio/microbial/kirch_final.pdf · 6 it is...
TRANSCRIPT

1
Chapter 4 in: D. Kirchman, editor, "Microbial Ecology of the Oceans." New York: Wiley
(Submitted).
Bacterial Production and Biomass in the Oceans
Hugh Ducklow
Virginia Institute of Marine Science
Box 1346
Gloucester Point, VA 23062 USA
I. Introduction
The study of bacterial growth dynamics in the sea is a relatively new field of investigation. The
subject of bacterial growth is not treated by ZoBell in his classic treatise, Marine Microbiology
(ZoBell, 1946), even though Henrici (1938) provided a surprisingly familiar look at bacterial
dynamics in freshwater lakes. Brock (1971) reviewed other early attempts to investigate bacterial
growth processes in nature, but few of his references are to the marine realm. Yet following the
introduction of new methods for assessing bacterial abundance and production rates, bacterial
production studies became commonplace on oceanographic cruises and in the literature. Nearly
all approaches until quite recently have been limited to addressing bacterioplankton as a
homogeneous assemblage, which may explain the success of the field: the new measurements
were directly amenable to compartmental modeling just when that activity began its own
renaissance, aided by the rapid evolution of the personal computer. In this chapter, I survey
recent developments in technique and provide a synthesis of current understanding of
bacterioplankton productivity and biomass levels in the sea.
A. What is bacterial production?
Bacterial production (BP) is secondary production: the synthesis of bacterial biomass, primarily
from organic precursors with some inorganic nutrients. The net effect is to move organic matter
2
from one pool to another. BP can be expressed as the rate of synthesis of cells (N) or cell mass
(B)1:
P B= •µ (1)
where µµ is the specific growth rate of the population expressed in units of inverse time, t-1,
µ =1B
dB
dt(2)
and B (or N) is the mass (number) of cells, expressed per unit of volume. As we’ll see later on,
the above definition, while exact mathematically, contains an element of ambiguity, or
circularity in practice. This is because we do not always derive estimates of P through a priori
measurements of µµ and B. In fact, one message of this chapter is that it is easiest in a practical
sense to measure P, but the key to understanding the meaning and regulation of bacterial
production is still precise and unambiguous determination of in situ values of µµ (see for example,
Ducklow et al., 1992, 1999). Kemp et al., (1993) provide a practical guide to measurements of
the three terms in Eqn. 1. There are many treatments of bacterial growth in the laboratory, but
few in nature. Cooper (1991) is the standard text on the physiology and biochemistry of
bacterial growth at the cellular level. Appendix 6 in Cohen (1995) provides a lucid, insightful
and entertaining discussion of the mathematics of human population growth, which can be
applied to bacteria with few if any modifications. Below, I will try to provide a guide for
understanding the biological processes and practical pitfalls associated with measuring and
understanding bacterial production in the sea. I will consider in turn measurement of µµ and P. I
discuss N and B in less detail, mostly insofar as they pertain to understanding and measuring µµ
and P. Finally I review the magnitude of BP in various marine systems.
1 In this chapter, I will address production mostly in terms of the biomass as carbon produced, but cell numbers will
also be discussed. Most readers can consider mass and numbers more or less interchangeably for general
understanding.
3
Is BP net or gross? The development of practical and reliable (but see below) approaches for
measuring BP allowed a meaningful dialog between marine bacteriologists and biological
oceanographers for the first time. Only after bacterial processes could be expressed in the same
units used by other oceanographers could bacteria be fitted into current paradigms of marine
trophodynamics (Williams, 1981, 1984, Azam et al., 1983). However there is still some
misunderstanding concerning the meaning of BP, especially when bacteriologists talk to
phytoplankton ecologists. Scientists working on phytoplankton have the luxury of being able to
specify primary production directly in terms of measured fluxes of mass or energy. They
measure carbon fixation rates using carbon-14 labeled CO2 (Steeman-Nielsen, 1952) or oxygen-
18 labeled water (Bender and Grande, 1987); determine changes in total CO2 or O2 dissolved in
seawater (Williams, 1993; Emerson, 1993); or quantify light absorption with optical sensors
(Marra. 1998). From such measurements two quantities, gross and net primary production, can
be estimated. Gross primary production is the total fixation of carbon during photosynthesis in
the light, whereas net primary production (NPP) is the gross production in the light less the
amount of carbon respired by phytoplankton over a 24 hr period (Falkowski and Raven 1997).
Unambiguous determination of gross and net primary production rates is complicated by the
presence in most water samples of microheterotrophs which also carry out respiration in addition
to that accomplished by the phytoplankton (Williams, 1998). But the point here is that
phytoplankton ecologists are alert to the distinctions between net and gross production, and they
expect bacteriologists to be, also. What is it that bacteriologists measure?
The short answer is that they measure net bacterial production (BPnet) but usually just call it BP,
as I will do in the remainder of this chapter (similarly, when I use PP, I am referring to NPP). All
approaches for determining bacterial production provide estimates in some fashion or other of
the net rate of biomass synthesis, without including bacterial respiration in the estimates (Jahnke
and Craven, 1995). Bacterial biomass synthesis plus respiration (R) can be termed gross
production (BPg) in loose analogy to phytoplankton production. Further misunderstanding arises
from the use of the term bacterial carbon demand (BCD) in place of gross production. In
physiological terms, BCD is determined from the gross growth efficiency Y (Lancelot and
Billen, 1985) or GGE (Goldman et al. 1987):
4
BCD BP BP Y BP Rg net net= = = +( ) (3)
( )GGE Y BP BPnet g= = (4)
Y is a traditional term from bacterial physiology for fractional growth yield, defined as the
biomass synthesized per unit total limiting nutrient utilized (Stanier et al., 1976). Bacterial
growth yields are addressed in detail in Chapter 12 and in del Giorgio and Cole (1998). Here I
just want to clarify the relationships among bacterial growth efficiency, carbon demand, net and
gross bacterial production. I should also note that while the GGE can be defined physiologically,
it is harder to specify its meaning, or value ecologically, especially over longer time scales
(Jahnke and Craven, 1995). Over sufficiently long time scales it approaches zero as most
biomass will be respired (Cole and Pace, 1995).
One further comment about BP is in order. It is common to try and assess the significance of
particular BP estimates by comparing the BP to a simultaneous determination of primary
production, usually using carbon-14. Since many routine PP measurements do not include
estimates of the production of DOC (and many estimates do include it; see Cole et al., 1988), one
should be careful to avoid using these ratios to claim “bacterial production is X% of primary
production” as I will occasionally say below. This form of statement implies that bacteria are
directly using some share of the contemporaneous primary production, when in fact what we
really wish to convey is that they are using an amount of carbon equivalent to X% of particulate
primary production. Only if a total estimate of PP (particulate plus dissolved) is available can
one really claim that BP was some fraction of the PP, in that time and place.
B. Why measure BP?
The advantages of measuring BP should be obvious to bacterial ecologists, but the rationale for
focusing on this measurement may still not be immediately apparent to other biological
oceanographers and biogeochemists. In fact, there are clear advantages for bacteriologists and
biogeochemists, as implied by the relationships shown in Eqns. 1-4, above. This rationale for
BP measurements is articulated nicely in Cole and Pace (1995).

5
1. Importance of the microbial loop.
Establishing the existence, functioning and magnitude of the microbial loop and microbial
foodwebs in the sea has been a major theme of biological oceanography over the past two
decades, since the introduction of more easily-used methods for determining BP (Fuhrman and
Azam, 1980; Ducklow, 1983; Azam, 1998). The term microbial loop per se refers to the
bacterial recovery through uptake and metabolism of dissolved organic matter (DOM) otherwise
“lost” from the trophic system via excretion, exudation and diffusion (Azam et al., 1983; Jumars
et al., 1989). BP is the key process originating the flux of DOM through the loop, and so
estimates of BP establish the importance of the microbial loop, and of microbial foodwebs
initiated by bacterivory, in marine ecosystems.
2. Quantifying biogeochemical fluxes of carbon and other elements.
Bacterioplankton in most situations in the marine environment are free-living and are sustained
by the flux of low molecular weight DOM (LMW-DOM) into the cell. Furthermore for all
practical purposes, they dominate DOC incorporation (Azam and Hodson, 1977). Only
molecules below 500-1000 Daltons MW are recognized and transported through cell membranes
by bacterial permeases. Some variable and perhaps large fraction of the LMW-DOM is derived
from the breakdown of high molecular weight DOM (HMW-DOM) by extracellular enzymes
(Somville, 1983; Hoppe, 1993; Smith et al., 1992). Both the LMW and HMW DOM pools
consist potentially of hundreds or thousands of individual compounds. These pools cannot yet
be fully characterized chemically, and we cannot measure the aggregate fluxes directly (see
Chapters 5-7 for discussion of DOM composition and dynamics). In other words it is not yet
possible to measure the total flux of DOM into bacteria, BPg, directly. The most practical
approach is to determine BP and the GGE and then derive the BCD using Eqns. 3-4, even
though the BCD is not a unique function of BP and GGE, due to interbacterial and viral carbon
cycling (Jahnke and Craven, 1995). Even without direct measurements of GGE, we can make
first-order estimates showing that DOM fluxes are large terms in the budgets of organic carbon
in marine ecosystems, just by knowing that BP is an appreciable fraction of PP (see below).
3. Estimating growth rates.
6
It is fiendishly difficult to measure bacterial growth rates in nature (Brock, 1971). Although in
principle it is straightforward to determine the right-hand terms in Eqn. 2, in practice it is
seldom possible to obtain unambiguous estimates of dB/dt. Rates of change of cell populations
in nature are usually underestimates of the actual growth rate because there is simultaneous
removal of prey cells by predators (Landry and Hassett, 1982; Ducklow and Hill, 1985a; Chapter
14) and viruses (Chapter, 13). There have been quite a few strategies employed for minimizing
or independently accounting for the removal terms, including dilution, size fractionation and
specific metabolic inhibitors, which are reviewed elsewhere in this book (Chapters 13, 14).
Growth rates are of course intrinsically interesting to know, and they are required to
parameterize models (Chapter 12). Further, if we could measure growth rates unambiguously,
and relate them to other, more easily measured variables (e.g., chlorophyll, temperature), then
the derived growth rates could be used to estimate BP from Eqn 1 for large-scale system
comparison. But in practice, it is easier to measure BP and B, and calculate µ from Eqn 1,
instead. Thus, measuring BP remains our best approach to obtaining larger data sets on growth
rates. Even here however, the approach is flawed, unless we can specify the fraction of B (or N)
which is actually growing (Zweifel and Hagstrom, 1995; Sherr et al., 1998).
II. Methods: a survey and update.
Marine bacteriology has always been challenged by methodological difficulty, imposed in large
part by the exceptionally small size and dilute concentrations of cells in a complex mix of
contaminating organisms and dead particles (Kemp et al., 1993). Any treatment of bacterial
biomass dynamics has to address methods to place critical understanding of the data in proper
context. It is important to recognize that very few direct determinations of bacterial biomass or
production have ever been made in unmanipulated or minimally manipulated samples. There is
no C-14 assay for bacterial production. Instead, both biomass and production are derived from
measurements of related quantities through application of conversion factors. Both the choice of
property analyzed and values of conversion factor influence the conclusion of the measurements.
The following review is meant to guide the reader toward both deeper and more comprehensive
treatments of each subject (e.g., Karl, 1986).

7
A. Bacterial biomass
The overwhelming majority of published studies are based on microscopic determinations of
bacterial abundance. There are other methods for estimating bacterial numbers or biomass,
notably detection of gram-negative cell walls using Limulus amebocyte lysate (LAL; Watson et
al., 1977). I limit this review to a discussion of direct detection of cells by microscopy or flow
cytometry, but it is worthwhile noting that new, automated and sensitive colorimetric assays of
LAL may make this technique more attractive. I am not yet aware of any published observations
using this modernized approach in field study.
1. Epifluorescence microscopy.
Direct microscopy had long been understood to yield substantially higher numbers of bacterial
cells in lake waters (Henrici, 1933, 1938) and seawater (Jannasch and Jones, 1959) than plate
count and other cultural techniques. But the difficulty in resolving cells by light or phase contrast
optics limited the application of the method, and so cultural estimates remained in favor, despite
the lower estimates. As ZoBell (1946, p. 52) concluded,
“At best direct counts give data which only supplement and aid in the interpretation of results obtained by cultural
procedures.”
In spite of the shortcomings of direct microscopy the approach was followed by Soviet
oceanographers, who obtained bacterial biomass estimates of the same order of magnitude as
other plankton groups. They formed a modern dynamic viewpoint about oceanic
bacterioplankton considerably in advance of Western bacteriologists (e.g., Sorokin, 1964). Direct
microscopy was finally adopted widely following the introduction of a practical method for
concentrating bacteria on optically-flat polycarbonate filters for direct counting with acridine
orange epifluorescent microscopy (AODC; Hobbie et al., 1977; Watson et al., 1977). Other,
brighter and/or more specific DNA fluorochromes have been introduced (DAPI, Porter and Feig,
1980; Sybrgreen, Noble and Fuhrman, 1998), but the original AODC protocol remains largely
unmodified, irrespective of the dye employed. Direct microscopy remains the most widely used
approach to measuring bacterioplankton abundance, and is irreplaceable as a ground truth
baseline on which microbiological interpretation can be based. Experienced microscopists are

8
remarkable image processors and data reducers, but it is hard to document properly the
information obtained visually during AO counting.
2. Flow cytometry
With the development of sensitive optics, less powerful laser systems and higher-fluorescence-
yield fluorochrome dyes, flow cytometric detection and enumeration of marine heterotrophic
bacteria is becoming an attractive alternative to microscopy. The method is preferable because
so many more cells are counted in each sample and because the heterotrophic bacteria can be
distinguished from Prochlorophytes and coccoid cyanobacteria of similar size and fluorescence
characteristics (Campbell et al., 1994), which are usually counted as heterotrophic bacteria with
microscopy. Sample preparation is much less labor-intensive, requiring only an adequate supply
of liquid nitrogen at sea. Because of the ease of sample throughput and the greater yield of
information per unit effort, flow cytometry should replace epifluorescence microscopy for most
routine applications over the next few years. Both planned and unplanned (Figure 1)
comparisons indicate that the two approaches detect essentially the same population of cells,
although region- or perhaps cruise specific variability remains to be resolved (Ducklow et al.,
submitted).
2. Cell volume and mass.
Bacterial biomass cannot be measured directly. Rather, biomass estimates are derived from
abundance or biovolume measurements multiplied times some factor for carbon per cell. Several
papers (Cho and Azam, 1990; Ducklow and Carlson, 1992; Fukuda et al., 1998) show graphs of
bacterial biomass vs chlorophyll a, indicating that bacterial biomass tends to equal or exceed
phytoplankton mass at low chlorophyll concentrations. Table 1 indicates why this might be true,
using typical carbon conversion factors (CCF) for deriving biomass. The critical dependence of
relative biomass level on assumptions about conversion factor values is obvious.
Estimation of cell volume remains technically difficult by microscopy and cytometry. Cell
volume is now routinely measured with epifluorescence microscopy using digital image analysis
of video images (Bjornsen, 1986; Ducklow et al., 1995; Carlson and Ducklow, 1996; Pomroy
and Joint, 1998). Especially when large numbers of samples must be analyzed for oceanographic

9
surveys, the analysis is limited for practical considerations to about 300-400 cells per sample,
usually without replication. A serious problem with epifluorescent Estimation of cell volume
remains technically difficult by microscopy and cytometry. Especially when large numbers of
samples must be analyzed for oceanographic surveys, the analysis is limited for practical
considerations to about 300-400 cells per sample, usually without replication. A serious problem
with epifluorescent determination of cell volume is lack of authentic standards. Fluorescent
microspheres are commonly used to calibrate measuring algorithms but they have different
emission wavelengths and fluorescence yields (i.e., they are different colored and brighter) than
native bacterioplankton, which complicates edge detection by image processing. Thus it is not
possible to compare cell volumes objectively. For example, Wiebinga et al., (1997) reported
relatively large mean cell volumes of 0.11 µm3 cell-1 for the NW Indian Ocean during the SW
Monsoon in 1992, while Pomroy and Joint found cells averaging 0.03 µm3 cell-1 slightly further
northeast in 1994. The latter value is more characteristic of oceanic regimes, and regional and
interannual differences cannot be discounted, but the standardization problem renders the debate
somewhat futile. Newer, brighter fluorochromes might alleviate this problem. Deciding which
objects seen or detected under the microscope should be counted and measured as bacterial cells
presents another difficulty. Most image analysts rely on experience and subjective criteria such
as shape, size and brightness to edit noncellular objects prior to analysis. This approach is
generally reliable for open ocean samples which contain smaller numbers of detrital particles and
other contaminants of bacterial image fields, but even experienced microscopists report
difficulty when analyzing inshore and estuarine waters with high and diverse populations of
noncellular objects. Recently Bjornsen et al., (1998) reported an image discrimination technique
using neural network-based algorithms whereby operators can “teach” image analyzers to reject
certain classes of particles. With new stains and more sophisticated numerical approaches,
microscope-based determination of cell number and size should remain a benchmark for some
time to come.
Flow cytometry appears to offer some hope of improvement. Mie theory suggests that light
scattering characteristics should be a function of cell volume or mass, making it possible to
derive mass from cytometric determination of mean forward angle light scatter (FALS) per
sample (Robertson et al. 1998). Robertson’s paper shows a good relationship between FALS and

10
dry mass for cultured cells and a natural population. A drawback currently is that marine
bacterioplankton still lie right near the lower limit of resolution for most flow cytometers,
rendering extrapolation of the relationship between FALS and cell volume down to the sizes
characteristic of native populations uncertain (P. del Giorgio, personal communication). Another
cytometric approach is to relate the mean fluorescence per sample to cell volume, determined on
parallel samples with image analysis. This approach is intuitively reasonable, as larger cells
containing more DNA should absorb more stain and fluoresce more brightly (Sherr et al., 1998).
However calibration relies on microscopy, with the difficulties already noted. Further, the
presence of inactive, nondividing cells with low DNA content, and of small, rapidly growing
cells with multiple genomes (Wiebinga et al. 1999) would also confound straightforward
interpretation of cell-specific fluorescence information. Nonetheless the large sampling rates and
multiparameter data collecting capability of flow cytometers make approaches toward cytometric
cell sizing highly attractive.
Reliable translation to cell mass is required to place bacteriological measurements of abundance
and cell volume in biogeochemically useful mass units. Initially, Fuhrman and Azam (1980),
followed by others, used a value of 120 fgC µm-1 cited in Watson et al., (1977) to derive relevant
biomass estimates. That value was based on measurements of E. coli in culture wherein the cells
were 100’s times larger than native bacterioplankton. Bratbak and Dundas (1984) and Bratbak
(1985) triggered a small revolution in bacterial appreciation with new estimates ranging 160-930
fgC µm-1, which overnight increased bacterial standing stocks in the sea by a factor of three or
more. These estimates were based on pure cultures of marine bacteria grown on lab media and
natural samples grown in enriched seawater. The first estimates of carbon per cell for native
bacterioplankton grown on naturally-occurring substrates were given by Lee and Fuhrman
(1987), who grew natural assemblages from <0.8 µm filtrates in particle-free seawater, and
related microscopic volume estimates to C and N masses measured with a CHN analyzer.
Interestingly, they determined that carbon per unit volume was itself inversely proportional to
cell volume, such that carbon per cell was relatively constant at 20 fg over the observed size
range of 0.036-0.077 µm3. 20 fgC per cell has assumed something of a canonical status in marine
bacteriology (Cho and Azam, 1990; Ducklow and Carlson, 1992). Using similar cellular mass
estimates, many investigators have concluded that bacterial biomass must equal or even exceed
11
phytoplankton biomass in many oceanic regions (Fuhrman et al. 1987; Li et al. 1992; Cho and
Azam, 1990).
The 20 fgC cell-1 value represents a high cellular carbon density, especially for the small cells <
0.05 µm3 characteristic of many oceanic regimes (≥ 400 fgC cell-1). This is toward the upper end
of the higher estimates reported by Bratbak and Dundas and others. There are independent
estimates of bacterial biomass which indicate that bacterial carbon content might be somewhat
lower. Several investigators with access to synoptic data on biomass of a comprehensive range of
plankton groups ranging from phytoplankton and bacteria through protozoans and zooplankton
attempted to constrain the bacterial carbon content using plankton biomass and total particulate
carbon and/or living carbon as constraints on the maximum bacterial stock allowable. Christian
and Karl (1994) and Caron et al. (1995), obtained estimates of 10-15 fgC cell-1 for these
“constrained” conversion factors. In another novel approach Carlson et al., (submitted) used
high-precision analyses of DOC and TCO2 to recover the bacterial carbon by difference in a
mass balance approach which also yielded GGE estimates. Their bacterial carbon content ranged
7-13 fgC cell-1 for cells 0.06 - 0.09 µm3.
The cellular carbon conversion factors reported by Lee and Fuhrman (1987) and others address
cultured material derived from natural bacterial assemblages, but they are not direct estimates of
actual in situ bacterial populations. As pointed out by Fukuda et al. (1998), these estimates might
be biased by species succession during culture, and growth on substrates supplied as artifacts of
the filtrations used to prepare the seawater culture media. Fukuda et al (1998) reported the first
direct measurements of the carbon and nitrogen content of marine bacterial assemblages. They
prepared filtrates of surface waters from a wide range of coastal and oceanic sites, with minimal
phytoplankton contamination, and analyzed carbon using the high temperature catalytic
oxidation (HTCO) methodology. The analytical approach avoided the need to concentrate
samples on GF/F filters for CHN analysis, with the attendant loss of small (possibly carbon-
dense) cells through the filters. They report mean carbon per cell of 12.4±6.3 and 30.2±12.3 fgC
cell-2 for oceanic and coastal locations, respectively, noting that if their estimates are
representative of most marine areas, use of a uniform factor like 20 fgC cell-1 would overestimate
bacterial biomass in oceanic habitats and underestimate it in coastal regions. Bacterial carbon

12
content is summarized in Table 2 and some estimates of bacterial standing stocks are given in
Section III below.
B. Bacterial Production
BP, defined above in Eqn. 1, is commonly measured indirectly using radioisotope-labeled
precursors of DNA and/or protein synthesis to yield synthesis rates which must be converted to
production rates using empirical factors. The two most common approaches use tritium-labeled
thymidine (Fuhrman and Azam, 1980) and 3H–leucine (Kirchman et al., 1985), and these
approaches (especially thymidine) have been reviewed and debated extensively (Ducklow and
Carlson, 1992; Moriarty, Robarts, Karl, 1986; Karl and Winn, 1984; Kemp et al. 1993). The
reader is directed to these reviews for more detailed discussion of bacterial production
methodology.
1. Earlier approaches.
Karl (1979) proposed the first modern method for estimating bacterial production in the sea. He
initially measured incorporation of 3H-adenine into RNA in upper- and midwater samples from
the Caribbean Sea, and later extended studies to pure cultures of phytoplankton and bacteria as
well as various oceanic and other aquatic environments (Karl et al. 1981, Karl and Winn, 1984).
In many (but possibly not all, see Fuhrman et al. 1986) marine environments 3H-adenine is
incorporated by bacteria, phytoplankton and perhaps other microorganisms, which prompted
Karl to apply the adenine technique to estimating total microbial production rates. The ambiguity
or nonspecificity of this approach is the main reason it was not adopted in many studies where
specific information on heterotrophic bacterial production was desired. Nonetheless the adenine
approach had several advantages which have not yet been approached by other methods. With
adenine it is possible to measure the intracellular specific activity of the labeled tracer precisely
by extracting 3H- and/or 32P-lebelled ATP which quickly achieves isotopic equilibrium with the
other macromolecular constituents of the cell (Karl et al., 1981). By knowing the turnover rates
of macromolecular pools the specific turnover rates (=growth rates) of the population can be
estimated directly from isotopic data. Finally, 3H-adenine is taken up very rapidly by microbial
assemblages, providing a high sensitivity method. Christian et al. (1982); Hanson and Lowry.
(1983) and Ducklow et al. 1985 applied this approach to various marine environments.
13
At about the same time as the adenine method was introduced, Hagstrom and Larsson (1979)
proposed that the frequency of dividing cells (FDC) in bacterial assemblages could be used to
derive growth rates, and thus, production rates. This approach is based on both theoretical and
empirically-established relationships between the frequency of dividing cells (cells which have
formed invaginations in the cell wall and a division plate, but have not separated) in a population
and the population division rate. A major attraction of this approach is that once it is calibrated,
no incubations are required to obtain growth rate information – a simple collection of preserved
samples can be examined following cruises or experiments to recover the rate data. However as
Hagstrom and Larsson (1979) showed, the m-FDC relationship is temperature-dependent and
nonlinear, so calibration requires incubations, much like the thymidine method or other
approaches (see below). Christian et al., (1982) showed that FDC was related to adenine and
changes in cell numbers in experimentally-manipulated samples. I am not aware of a systematic
comparison of FDC with more widely used BP methods. More significantly, the difficulty of
resolving dividing cells precisely, especially small oceanic cells, renders the method impractical
even given the no-incubation advantage. The FDC method should probably be reevaluated, given
the recent wider application of flow cytometry and image analysis techniques for investigating
cell morphology and DNA content.
2. Thymidine and leucine incorporation.
The introduction of 3H-thymidine (TdR) incorporation as a measurement of heterotrophic
bacterial production (Fuhrman and Azam, 1980, 1982; Fuhrman et al. 1980) really did usher in a
new era in the study of bacterial dynamics in marine and freshwater. The TdR approach offered a
relatively simple protocol that was specific for estimating the production rate of actively growing
bacterial cells. The pro’s and con’s of TdR have been debated at great length (Karl and Winn,
1984; Moriarty, 1985), and there are several drawbacks (Hollibaugh, 1988 Robarts 1993), but it
remains the most widely used of all bacterial production methods (Kemp et al. 1993). Two
recent developments extend the utility of the TdR method. An adaptation allowing processing of
1-2 ml samples in a microcentrifuge has vastly reduced the volumes of radioisotope and reagents
required, decreasing cost and waste production (Smith et al. 1996). Steward and Azam (1998)
propose the application of bromodeoxyuridine as an alternative, nonradioactive precursor of
DNA synthesis for estimating BP. These two approaches will help investigators who are limited
14
by money or radioactive materials prohibitions on vessels. Both approaches may even turn out to
be more sensitive than the original approach. I do not provide an extensive review here because
TdR has been quite extensively discussed elsewhere (Ducklow and Carlson, 1992; Ducklow and
Shiah, 1993). I do address the relationship between TdR incorporation and cell growth at some
length below.
The measurement of 3H-leucine incorporation (Leu) into bacterial protein was proposed as an
alternative to TdR by Kirchman et al. (1985). As Kirchman (1992) and several others have
shown, TdR and Leu incorporation rates do covary over a variety of time and space scales,
suggesting the methods both address BP-related processes. Comparison of BP estimates from the
two methods provides some idea of the uncertainty in determining BP. As originally described
by Kirchman, the Leu approach required an empirical conversion factor (CF) for estimating BP,
in a manner analogous to TdR. Kirchman (1992) used empirically-determined conversion factors
to make BP estimates for the two methods in the subarctic Pacific Ocean. He obtained slopes of
0.92±0.09 and 0.76±0.08 for (Model I) regressions of Leu-BP on TdR-BP in the 0-40 and 40-80
m layers, respectively. This data set points up the complications involved in making comparisons
between two methods which measure separate, though related physiological processes.
Agreement between Leu- and TdR-based BP estimates will be exact if unbiased CF’s can be
obtained and if the ratio of the CF’s is equal to the inverse ratio of the incorporation rates.
Kirchman (1992) found that the mean ratio of CFTdR:CFLeu was 16.1 (n=17 and 14 for TdR and
Leu), and also reported that the mean ratio of Leu:TdR for the entire water column data set was
16.8 (n=481). This is very good agreement, accounting for the good match between the BP
estimates. But since the ratio of the CF’s was slightly less than the incorporation ratio, the TdR-
based estimates of BP were slightly greater than the Leu-based estimates. If Leu:TdR
incorporation rates vary substantially through a water column, reliance on a single set of CF’s
(usually derived from just 1 or 2 depths), will probably yield differing estimates of BP.
Variations in Leu:TdR incorporation ratios can be substantial (Table 3), but there have been just
a few investigations of the meaning of this variability. Chin-Leo and Kirchman (1990) showed
how Leu:TdR could change with changes in growth rates and/or physiological state of bacterial
assemblages. Departures from balanced growth should change the incorporation ratio, since
cellular composition changes when cells shift up or down to a new growth rate (Cooper, 1991).
15
The meaning of balanced vs unbalanced growth is not straightforward in mixed natural
populations probably growing at a range of rates (see below). Tibbles (1996) showed that
Leu:TdR is temperature-dependent with ratios increasing with temperature. Since Leu and TdR
incorporation appear to have different temperature dependence, conversion factors should not be
constant with respect to temperature. Shiah and Ducklow (1997), following Brunschede et al.
(1977), suggested that “unfavorable” conditions (e.g. excessively low or high temperatures in
temperate estuaries) led bacterial populations to invest more cellular resources in biomass
synthesis (measured by Leu) than cell division (TdR). These studies all address relative changes
in Leu:TdR ratios but to date, no one has been able to explain quantitatively the significance of
the value of the ratio in any given sample, or regional differences in the ratio (Table 3). Further
insight into relationships will probably require improved models of bacterioplankton physiology,
explicitly addressing protein, RNA and DNA synthesis and cell division. Numerical simulation
models of bacterial biosynthetic pathways exist (Stephanopoulos and Vallino, 1991; Vallino et
al. 1996) but have not been applied to BP measurement scenarios.
Simon and Azam (1989) introduced another approach to BP estimation employing Leu. They
showed that the ratio of protein to carbon was highly invariable in bacterioplankton cells. From
this observation it can be deduced that carbon-based BP can be derived from Leu incorporation
without recourse to a cell-based CF or knowledge of carbon per cell (see above). If the
intracellular isotope dilution is known, or can be measured, a single CF can be established for
converting Leu to BP. Simon and Azam (1989) claimed intracellular dilution of 3H-leucine
varied by a factor of about 2, and suggested that this CF would have a range of just 1.5-3 kgC per
Mol Leu incorporated. The proliferation of CF’s for TdR and Leu complicates cross-system
comparison of BP (Ducklow and Carlson, 1992). Simon and Azam’s (1989) approach provides a
somewhat universal factor for BP estimation.
Moreover the ratio of biomass production from Leu to cellular production from TdR:
µgC-l hr-l
cells l-l hr-l
yields the biomass of the average newly-produced cell (µgC cell-1). For example, Ducklow et al.,
(1993) derived a TdR CF of 2.65 x 10¹⁸ cells mole-1 to estimate BP in the North Atlantic in 1989.
16
The mean Leu:TdR ratio given in Table 4 and Simon and Azam’s (1989) Leu CF indicate new
cells had 13 – 26 fgC cell-1 (i.e., (23*1500 to 3000)/(2.65E18)), a value within the range of cell
masses reviewed above. If ambient cell mass were known reliably, it could be compared to the
estimated mass of daughter cells to make inferences about removal rates and size selective
grazing. If, for example, newly produced cells are small, but the mean observed cell sizes were
significantly greater, one might assume that bacterivory was not intense, or at least grazers did
not seem to be selecting larger cells to ingest. Unfortunately, as I already suggested above, we
cannot easily or routinely specify cell mass reliably.
III. Growth rates and viability
A. Methods and results:
1. Cell kinetics
Observation of changes in cell numbers or mass over time is the most direct but perhaps not the
easiest way to measure BP and specific growth rates. Nonetheless the approach is worth the
effort because it affords us the most fundamental access to cell growth per se, since it is based on
direct visualization of the cell assemblage. Further, by providing an estimate of production
independent of precursor incorporation assays, this approach is commonly used to derive
empirical values for conversion factors (Kirchman et al., 1982). The slope of a plot of the natural
log of cell numbers vs time yields the specific growth rate, µ (Eqn. 1, Figure 2A). In this figure,
a uniform population of cells (e.g., a pure culture or a seawater culture of a natural assemblage
dominated by a single population) is growing exponentially with µ = 1.0 d-1. This population is
incorporating thymidine at a constant cell-specific rate of 2.8 x 10⁻²⁰ mol cell-1 hr-1. As Kirchman
et al., (1982) pointed out, the slope of the plot of the incorporation rate vs time is identical to the
abundance plot. When cells are in balanced, exponential growth, specific growth rates can be
determined from the increase in incorporation rate. This direct approach utilizing either the cell
or incorporation plots can be used to estimate growth rates and conversion factors (Christian et
al., 1982; Cuhel et al., 1983; Li, 1984; Ducklow and Hill, 1985a,b; LaRock et al., 1988; Ducklow
et al., 1992; Chrzanowski et al., 1993). Kirchman et al. (1982) suggested it was easier to measure
incorporation rates than to count cells; a view I’ll suggest is a matter of individual choice.

17
There are several important complications to the simple approach just outlined. In many if not
most natural water samples, simultaneous removal of bacterial cells by bacteriovores and viruses
can reduce or balance the specific growth rate of the prey bacterial population, giving the
appearance of a nongrowing culture, as shown for phytoplankton preyed upon by
microzooplankton (Landry and Hassett, 1982). This seems to be a very frequently-occurring case
for bacterioplankton so measures need to be taken to minimize removal, or account for it
independently. It is difficult to factor out the viral term but bacterivory has been addressed by a
variety of approaches (see Chapter X) and it will not be addressed further here. I will just note
that an unbiased estimate of the specific growth rate, corrected to the extent possible for removal
is required to derive the CF.
Another problem concerns the presence of nongrowing cells in the culture assemblage, or more
generally, heterogeneity of population growth rates. This problem has not been systematically
treated even though new techniques are beginning to show how it may be solved. Kirchman et al.
(1982), Cuhel et al. (1983) and Li (1984) all suggested that plots of incorporation rates would
reveal the mean growth rate of the cell population or fraction thereof actually incorporating the
isotopes employed. If TdR were used, this by definition would address the dividing cells. If only
part of the total cell population were growing or actively incorporating isotope, the incorporation
rates would be increasing faster than the total cell count because the cells are “diluted” by the
inactive or nongrowing fraction. Figure 2B shows a bacterial assemblage with initially 10% of
the cells growing at 1 d-1 as in Fig. XA, and the remainder of the assemblage nongrowing and
constant. TdR incorporation by the growing fraction again parallels the growing cell plot. Note
though, that the total population appears to have a lag period, caused by the gradual overgrowth
of the nongrowing cells by the active fraction (Zweifel and Hagstrom, 1995). Extrapolation from
the later stages of growth in the total counts back toward time zero provides an estimate of the
original size of growing fraction, provided population structure has not changed. Torreton and
Dufour (1996) used a similar “nongrowing fraction” model to estimate that just 0.1 – 5% of the
total cells were active in the coral atoll lagoons of the Tuamoto Archipelago.
This example shows how the problem of nongrowing cells can be addressed simply by counting
the total cell population for sufficiently long to extrapolate toward to time zero. The scenario
requires that nongrowing cells remain nongrowing in culture. In most cases in which bacterial
18
growth in seawater cultures has been studied this scenario has not been addressed directly, for
example using autoradiography or vital stains like CTC to monitor the growth of the active
fraction. Choi et al. (1996; their Figure 3A) show results from a seawater culture incubation with
total (DAPI) and “active” (CTC-stained) cell counts. The total counts have an apparent lag
period similar to the one shown in Fig. XB while the CTC counts grew without lag and
converged with the total counts, consistent with the “inactive subpopulation” model. Figure 2C
shows a more general case with two growing populations. It is easy to see from this plot that
increasing contrasts in growth rate and/or size of the two populations will enhance the curvature
of the “lag” period. Even with greatly contrasting populations, the lag period may not be detected
if sampling is infrequent, as the example shows: even daily sampling over 4-6 days would not
yield a significant departure from linearity to confirm existence of the telltale “lag” phase. Using
flow cytometry, Wiebinga et al. (1999) detected growing (at 2.4 d-1) and nongrowing bacterial
populations in seawater cultures from the Arabian Sea, showing a plot almost precisely like Fig.
XB. But with samples only at t = ca. 3, 6, 12 and 18 hr, curvature in the plot of total cells cannot
be demonstrated, and the experiment did not last long enough for the plots to converge. However
because they detected both subpopulations directly (using cytofluorimetrically-detected DNA
content), the essential structure of the assemblage was apparent.
When a total cell count is made up of growing and nongrowing, or fast and slow populations, the
incorporation rates will increase faster than cells, as noted above. This effect was observed by
Ducklow and Hill, (1985b), Ducklow et al., (1992) and Pomeroy et al., (1994). Figure 2D shows
how incorporation rates which increase faster than cells result in increasing cell-specific
incorporation rates. The leveling off of the curve is a reflection of the convergence of the active
and total populations (cf. Figure 2B). It now appears from the simple models shown here, and
indirectly suggested by Choi et al., (1996) and Wiebinga et al., (1999) that observations of
differential specific growth rates determined from cell kinetics and incorporation rates can be
explained by postulating two or more populations with different growth rates. I am not aware of
a direct test of this hypothesis using autoradiography or cytometric sorting of labeled cells to
follow the active subpopulation responsible for the growth of the incorporation plot.
2. Application to determination of conversion factors.

19
Fuhrman and Azam (1980, 1982) originally proposed a “theoretical” value for the TdR
conversion factor of 0.2-2.4 x 10¹⁸ cells produced per mole of TdR incorporated and showed that
the TdR-derived bacterial production matched that independently estimated by counting cells in
<3 µm filtrates. With an independent estimate of the specific growth rate or production rate, the
conversion factor CF required to derive BP from the TdR incorporation T is just
CF N Tder = ∗τ 0 0 (5A)
where ττ is the slope of ln(T) vs time, and with all three parameters derived from the plot shown
in Fig. 3A. This approach was termed the “derivative approach” (Kirchman et al. 1982) because
it was calculated from the slope of the regressions shown in Fig. 3A. A difficulty arises when
there is heterogeneity among the active and total populations. To address this problem Ducklow
et al., (1992) and Kirchman and Ducklow (1993) proposed a modified form of Eqn. 5A:
CF e eB bmod = ∗µ (5B)
and used regressions of cells and TdR incorporation on time to estimate the parameters B and b,
the y-intercepts of the regressions. This is just the same as Eqn 5A, except that observed N0 and
T0 are replaced by the derived t0 estimates exp(B) and exp(b). It is easy to see that if there is
significant curvilinearity in either cell or incorporation plots as shown in Figure 2, then Eqn 5A
will probably result in high CF values as a result of dividing a high N0 by a low T0 value. Eqn
5B is an attempt moderate this effect but most comparisons still indicate that this approach tends
to yield high CF values. The so-called “cumulative” approach (Bjornsen and Kuparinen (1991)
is an alternative empirical approach, which also employs time-course data on cell growth and
incorporation rates. In this approach the cumulative cells produced at each time point are
regressed on the cumulative, integrated thymidine incorporation, and the calculated slope is the
CF. This method tends to give lower values than Kirchman et al.’s (1982) “derivative “ method
(Eqn. 5A) or its modified form (Eqn. 5B) because more rapidly increasing TdR incorporation
relative to cumulative cell production lowers the slope of the plot (Figure 3B).
Figure 3 shows results of an experiment conducted in the Ross Sea in November, 1994 (Ducklow
et al. 1999; temperature ca. -1°C) to illustrate cell dynamics and calculation of CF values. The
20
upper figure shows time courses of ln cells and ln TdR incorporation. The slope of the TdR data
is clearly greater than the slope of the cells plot, suggesting not all cells were incorporating TdR.
Although it is difficult to discern clearly there was an apparent lag period in the cells plot, also
indicative of slower- growing or nongrowing cells, consistent with the larger TdR slope.
Extrapolation of the cell counts between days 5 - 9 yields an estimate of 5 x 10⁸ cells l-1 for the
growing cell population, which is 20% of the observed N0 value. CF values calculated from
these data using Eqns. 5A and B give values of 4.4 and 1.6 x 10¹⁸ cells mole-1, respectively.
Cumulative cell production is plotted against integral TdR incorporation for the same data set in
the lower graph. The Model II regression slope of the plot yields a conservative CF estimate of
3.9 x 10¹⁷ cells mole-1.
Thus three methods of deriving the CF from the same data set result in CF estimates over an
order of magnitude range. Which value is correct? The original derivative approach is correct if
there are indeed nongrowing or slowly growing cells in the assemblage. The high value of this
estimate makes sense. A smaller population incorporating TdR will probably have low T rates
requiring a large CF to obtain the correct BP. Without independent observations to verify that
some percentage of the cells were nongrowing, there is no a priori way to decide if this is the
valid formula to use. The cumulative approach makes the fewest assumptions about cell growth
and composition of the populations and their growth, but is clearly an underestimate if the
growing population is small.
At present there is no very satisfying alternative to decide on which approach to take if only total
cell counts are available. One approach would be to compare the BP estimates to those obtained
from leucine incorporation using the CF values suggested by Simon and Azam (1989). A
difficulty is that these two estimates cannot be compared directly, without also assuming a
carbon per cell factor to convert the TdR based estimates of BP into carbon production. For the
experiment shown if Fig. 3, L0, the initial rate of leucine incorporation was 0.14 nM d-1, which
using Simon and Azam’s (1989) CF of 1.5-3 kgC mole-1, gives a BP of 0.21-0.42 µgC l-1 d-1. The
T0 of 0.03 nM d-1 gives BP’s of 0.1 – 3 µgC l-1 d-1, using the three CF estimates and three
choices of C per cell (Table 4). The derivative approach seems to yield high values of BP,
whereas the other CF’s give values closer to the leucine value, depending on the cell mass.
21
B. The ecology of growing and nongrowing cells.
The models discussed above are all based on the assumption that there can be substantial
populations of inactive or nongrowing cells in natural assemblages. There is no question that at
least some bacterial species are exquisitely well adapted for long term survival (days to
centuries) in media with no energy sources. There is an enormous literature on the physiology
and biochemistry of bacterial starvation-survival in cultures, and in various natural media and
aquatic environments (Morita, 1997; Poindexter, Kjelleberg et al. 1993). Morita (1997) put
forward the view that most of the biosphere is highly oligotrophic with respect to bacterial
nutrition, and most bacteria in most habitats are in the starvation-survival state. There is
substantial evidence that sometimes sizeable fractions (from < 10 to > 75%) of marine bacterial
assemblages are not active, as indicated by autoradiography (Douglas et al. 1987; Hoppe, 1976)
or vital respiratory stains (e.g., CTC, Sherr et al., 1998 del Giorgio, 1997). Whether or not all the
inactive cells are truly dormant, inactive, or nongrowing is difficult and perhaps impractical to
establish, owing to the lack of good operational definitions for these terms, and methods to
address them.
It seems unlikely that, as posited in some of the models above, a static cell population could be
maintained at a fixed size in nature for an extended period of time. Such cells would be cropped
from the population by grazers unless they were nutritionally inferior to growing cells, and
grazers strongly prefer growing cells. Nonetheless this view was re-energized by Zweifel and
Hagstrom (1995) who used a modified DAPI staining/destaining technique to suggest that many
marine bacterial cells lacked nucleoids, and hence by definition, were nongrowing. “ghosts.”
Later Choi et al., (1996) showed that cells initially observed to be ghosts later had nucleoids and
grew actively in seawater culture. Morita (1997) showed that starving cells undergo a loss of
DNA, as part of the starvation-survival adaptation. Thus Zweifel et al’s “ghosts” are probably
similar to cells showing up as inactive in autoradiographic assays or CTC stained samples: they
contain nucleoids too small to show up on the microscope, but they are potentially viable cells.
The importance of these observations is as Zweifel and Hagstrom (1995), del Giorgio and Cole
(1998) and others have suggested. Bacterial assemblages in nature appear to be dominated by
small, highly active subpopulations coexisting with larger groups of less active, or perhaps
temporarily inactive cells. The ubiquity of removal processes (e.g., bacterivory, viral lysis,
22
adsorption and sinking) demands exchange between the active and inactive fractions of the
bacterial assemblage. Perhaps some fraction of the growing population is intermittently or
continuously “turned off” while parts of the inactive populations are reactivated, as observed by
Choi et al. (1996). Blackburn et al (1996) attempted to account for the presence of ghost cells in
a numerical simulation model by including processes by which cells could be inactivated, but did
not include reactivation and recruitment of cells back into the growing fraction.
An important caveat from the foregoing discussion is that measured production rates and fluxes
are not affected by these considerations. The fluxes are as measured (given various
uncertainties), but specific rates of growth and activity must be higher if fewer cells are actively
engaged in carrying out measured activities. This argument opens up the possibility that bacteria
in nature might be growing at rates substantially greater than estimated from bulk considerations,
to maintain measured production rates. Mean growth rates are commonly reported to lie in the
range 0.1 – 1 d-1 for habitats reaching from the equator (Kirchman et al., 1995) to the poles
(Rich et al. 1998). If the actively growing fractions of these assemblages are as small as 10% of
the total assemblage, growth rates must be scaled up accordingly. But if the active and inactive
fractions exchange substantially on the time scales of growth, then growth rates integrated over
the exchange timescale may lie somewhere in between these extremes. Clearly better insight into
the biology and ecology of bacterioplankton requires reliable ways to penetrate and resolve the
demographic structure of natural assemblages.
IV. Bacterioplankton standing stocks and production rates.
Bacterioplankton biomass and production estimates are uncertain at least by a factor of two,
owing to unexplained variability and imprecisely specified conversion factors, discussed above.
Further, variability in CCF and independent behavior of TdR and Leu incorporation and their CF
(Table 4) complicate comparisons of stock and production estimates in the literature. Ducklow
and Carlson (1992) approached this problem by back calculating a consistent set of estimates
using mean values for CCF and TCF. One possible objection to this approach is that it ignores
empirical conversion factors calibrated for a particular study (Rivkin et al. 1996). Another
complication is the basis of comparison. Many estimates are made using the euphotic zone
(depth of 1% surface irradiance), as a common depth for integration. This is a logical basis for

23
comparison to phytoplankton stocks and photosynthetic rates, but it leaves open the question of
what processes support bacterial stocks below the illuminated layer. Wiebinga (1997) and others
have pointed out that carbon produced in the euphotic zone must ultimately support BCD
throughout the water column. Choice of some greater depth is arbitrary unless one could specify
the time and space scales over which the products of local photosynthesis are dispersed prior to
bacterial utilization. This exercise could be accomplished using 3D numerical models, but only if
we also knew how to parameterize the carbon flux relevant to bacterial metabolism! Mixed layer
comparisons have the added complication that mixed layers vary over diel to interannual time
scales (Gardner et al. 1995; Michaels and Knap, 1996). There is no satisfying answer to this
minor dilemma, except perhaps to provide estimates integrated over several characteristic scales.
Here I compare euphotic zone integrals, simply because I wish to scale the resulting estimates to
phytoplankton properties.
Cole et al. (1988) synthesized data extending over seasonal to annual scales to conclude that
bacterial production was equivalent to about 20-30% of the local primary production. They
reported the data as originally presented using whatever conversions had been applied in each
study. Their exercise should be repeated. In the ensuing decade a great many additional studies
have been published, including many for the open sea, which was not well represented in the
original summary. It is not clear that the Cole et al. (1988) ratio holds for the open sea. Bacterial
production was 5-15% of C14 primary production in the subarctic Pacific in 1987-88 (Kirchman
et al. 1993). They used an empirical CF of 1.7 x 10¹⁸ cells mol-1 TdR and 20 fgC cel1-1 to derive
their estimates. Ducklow et al. (1993) concluded that BP was 15-80% of the C14 PP during the
spring phytoplankton bloom in the subarctic NE Atlantic, using a mean TCF of 2.7 x 10¹⁸ cells
mol-1, and 20 fgC cell-1. Li et al. (1993) used TCF of 1-2.3 x 10¹⁸ cells mol-1 and 20 fgC cell-1 to
conclude that BP was 8-18% of the C14 PP in the NW Atlantic at the same time. Later,
Kirchman et al (1995) and Ducklow et al. (1995) again used 20 fgC cell-1 to estimate BP in the
central equatorial Pacific during the 1992 El Niño. They did not determine empirical CF but used
a mean value from the literature of 2.2 x 10¹⁸ cells mol-1 to convert TdR to BP, obtaining BP:PP
ratios of 12-20%. In the Sargasso Sea off Bermuda, BP was 15% of PP, using 1.6 x 10¹⁸ cells
mol-1 TdR and a volumetric CCF of 120 fgC cell-1. Smith et al. (1996), Wiebinga et al. (1997)
and Pomroy and Joint (1998) all estimated BP in the Arabian Sea using a variety of TCF and
CCF, and obtained a larger range of 3-50% of PP (average 10-18%). In general, BP averages
24
about 15% of PP, excluding a few nonequilibrium situations like decaying blooms (Ducklow et
al., 1993). These estimates all used conversion factors within a factor of about 2 of each other,
lending at least ease of comparability, if not absolute reliability to the estimates.
Recent observations of heterotrophic bacterial stocks and production rates are summarized in
Table 5, and compared to corresponding, synoptic phytoplankton data. I tried to minimize some
of the concerns cited above by reporting observations for which the raw data were accessible,
and using a consistent set of CF to derive the carbon-based estimates. These data are discussed in
more detail in Ducklow (1999). This summary provides data on bacteria in open ocean regimes
including the subarctic N. Atlantic and Pacific, oligotrophic gyres in both basins, the Arabian
Sea region influenced by monsoonal upwelling, the Antarctic shelf seas, and the central
equatorial Pacific. The subarctic and equatorial Pacific are ‘high-nutrient, low-chlorophyll’
(HNLC) regimes (Longhurst, 1998). As a simple generalization, bacterial biomass in the
euphotic zone averages about 1-2 gC m-2, except in the Antarctic where it is usually much lower.
Production rates, and thus mean turnover rates, vary more widely, as do relationships with
phytoplankton properties. However it is notable that with a few exceptions, bacterial production
is usually ca. 15-20% of the corresponding PP.
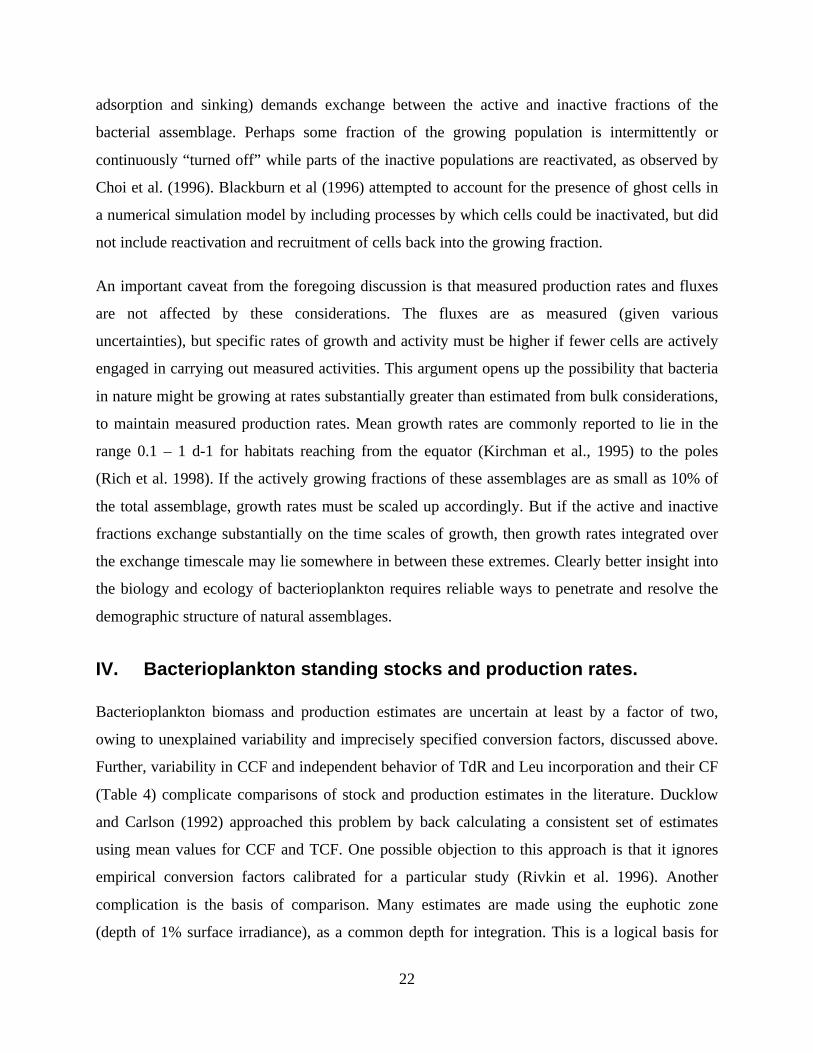
It is generally accepted that bacterial populations decline in size from estuaries and inshore areas
of greater organic and inorganic enrichment toward the more oligotrophic open sea (Sieburth,
1979). Volumetric estimates of bacterial abundance (cells per liter) range from about 1-5 x 10⁸
cells l-1 in the most oligotrophic regions studied (Cho and Azam, 1990), to over 2 x 10¹⁰ cells l-1
in rich estuaries (Ducklow and Shiah, 1993). Therefore it is surprising to compare bacterial
standing stocks in euphotic zones from different oceanic regimes (Figure 4A). Estimates from
four areas of the North Atlantic region including Chesapeake Bay, the Sargasso Sea and nearby
Gulf Stream, and the NE subarctic (sensu Longhurst, 1998) range from 0.5 to 120 x 1012 cells
m-2. There is a significant but not strong positive relationship with euphotic zone depth (Y =
0.22X + 31.74, r2 = 0.26, n= 320). Chesapeake Bay is rich in nutrients, chlorophyll a, organic
matter and light-absorbing material, with correspondingly shallow euphotic zones (mean depth, 5
m; Malone et al., 1988). The shallow euphotic depth obviously counteracts the effect of
enrichment on bacterial accumulation in the estuarine water column (Figure 4B). In spite of high
abundance, the euphotic zone standing stock is about 50% lower than in the NW Sargasso Sea
25
off Bermuda (Figure 4A and cf. Carlson and Ducklow, 1986). There are exceptions to the
general trend. The euphotic zone in the NE Atlantic subarctic became highly enriched with
bacteria following the peak of the 1989 spring bloom (Ducklow et al., 1993). In coastal Antarctic
waters of the Ross Sea (Figure 4A) and other polar regions (Karl, 1993), bacterial accumulation
seems to be strongly suppressed by temperature or factors related to plankton community
structure (Carlson et al., 1998). Generally however, even though the mean primary production
per unit volume is clearly higher in inshore habitats, including the Ross Sea (Smith and Gordon,
1997), oligotrophic regimes with deep euphotic zones are significantly more enriched in bacteria
than estuaries and coastal oceans.
This pattern becomes more surprising when we analyze bacterial production (as thymidine
incorporation). There is a significant negative relationship between euphotic zone thymidine
incorporation (nmol m-2 hr-1) and depth of the photosynthetic layer (Figure 4C; Y = -1.75X
+322; r2 = 0.18, n = 289). In this case bacterial activity is six times greater in the estuary (Figure
4D, inset) but there is no difference between the integral production in the other sites. Bacterial
utilization of organic matter results in greater euphotic zone production levels in estuaries, but
also seems to result in greater biomass accumulation in the open sea. It follows from this that
turnover rates (specific growth rates) are about tenfold greater in the estuaries.
We do not have a satisfactory theory of the regulation of bacterial stocks and production in the
sea. There is indirect evidence for bottom-up control by resource availability (Billen et al., 1990;
Ducklow, 1992). Bacterial abundance and production are significantly correlated with
phytoplankton biomass (chlorophyll a) and primary production, respectively (Cole et al., 1988).
The latter relationships are reflections of the strong and ultimate dependence of bacterial
metabolism on local primary production. This dependence may be obscured or nonexistent in
estuaries where bacterial productivity can exceed phytoplankton production (Ducklow and
Shiah, 1992) and is supported by exogenous inputs of terrestrial organic matter. Dominant
bottom-up effects suggest that bacterial stocks should increase with increasing organic matter
supply. Removal processes (top-down controls) counterbalance the bottom-up effect. Sanders et
al., (1992) compared the relationships between bacteria and heterotrophic nanoplankton
bacteriovores in high- and low-productivity regimes of both marine and freshwater habitats.
They concluded that bottom-up effects were predominant in oligotrophic systems while top-
26
down control was stronger in eutrophic systems. The data presented here indicate that top-down
effects exert a strong effect across the trophic spectrum. Removal processes maintain relatively
uniform bacterial abundance throughout the ocean outside the land-sea margin (Figure 4B).
Suppression of estuarine water column stocks seems especially intense (Figure 4A), in spite of
high local inputs of organic matter and high bacterial production (Figure 4D).
Thus it appears that the in the open sea over a wide range of geographic and trophic habitats,
bacterial stocks are high (about twice as high as in estuaries) but possibly not as productive
(averaged over the active and inactive assemblage) as once believed. This is apparently because
bacterial GGE is low, also averaging about 20% (Chapter X). If these mean figures are truly
accurate and representative, bacterial gross production (BCD) is about the same magnitude as the
local particulate net primary production estimated from C14 measurements. Better estimates of
total and bacterial respiration rates would provide a rigorous constraint on this conclusion
(Jahnke and Craven, 1995). Bacterioplankton are forced to scavenge DOM from diverse sources
(Pomeroy, 1974; Williams, 1981; Azam, 1998; Chapter X). The effective flux of DOM into
bacterial cells must approach the magnitude of the daily primary production. Top-down controls
(including viral lysis) appear to be weaker in the open sea than in estuaries. Bacteria may
constitute a stronger link to higher trophic levels inshore than offshore, where large amounts of
carbon are sequestered in the bacterial biomass. But methods for specifying DOM flux, removal
rates, BP and respiration must be improved by at least an order of magnitude in precision before
these conclusions can be verified.
There is one important caveat to the foregoing speculation. Bacterial abundance is not biomass
and thymidine is not carbon production. The patterns shown in Figure 4 will not reflect actual
stocks and production in nature if, for example, cell volumes and carbon content are larger in
estuaries than in the open sea, or if TdR conversion factors vary significantly and systematically
(e.g., Rivkin et al. 1996). Patterns of carbon flux are valuable for biogeochemical studies and
modeling, but actual patterns of abundance and biovolume are also important: bacteriovores
select and ingest cells, not carbon units. Both approaches are needed for complete understanding.
27
V. Summary
• Bacterial standing stocks in the euphotic zone average about 0.5 – 2 gC m-2 across a range of
oceanic systems. The ratio of bacterial to phytoplankton stocks varies widely, from less than
0.1 in polar coastal seas to over 2.0 in the oligotrophic gyres.
• Bacterial production is maintained in a remarkably constant ratio to primary production,
averaging about 0.15 – 0.2 across oligotrophic and oceanic HNLC and upwelling and
blooming systems. BP is generally much lower during polar coastal blooms, but can be high
following the peak phase of blooms in temperate and sub polar regimes.
• Bacterial stocks seem to be limited principally by resource limitation in lower-productivity
systems, but removal processes are more intense in coastal and estuarine systems,
suppressing standing stocks to below oceanic levels.
• Estimating bacterial biomass and production in geophysical mass units (C- or N-based
estimates) is still technically difficult and uncertain. Order of magnitude increases in
precision and perhaps accuracy are needed to gain deeper understanding of bacterial ecology
in the sea.
• Better recognition, detection and understanding of inactive cells are needed to specify rates
and mechanisms of bacterial growth.
VI. References
Azam, F. 1998. Microbial control of oceanic carbon flux: The plot thickens. Science 280:694-696.
Azam, F. and R. E. Hodson. 1977. Size distribution and activity of marine microheterotrophs,Limnol. Oceanogr. 22:492-501.
Azam, F., T. Fenchel, J. G. Field, J. S. Gray, L. A. Meyer-Reil, and F. Thingstad. 1983. Theecological role of water-column microbes in the sea. Mar. Ecol. Prog. Ser. 10:257-263.
Bender, M. L. and K.D. Grande, 1987, Production, respiration and the isotope geochemistry ofO2 in the upper water column, Global Biogeochemical Cycles 1:49-60.
Billen, G., P. Servais and S. Becquevort, 1990, Dynamics of bacterioplankton in oligotrophic and

28
eutrophic aquatic environments: bottom-up or top-down control? Hydrobiologia 207:37-42.
Blackburn, N., U. L. Zweifel and Å. Hagström. 1996. Cycling of marine dissolved organicmatter. II. A model analysis. Aquatic Microbial Ecol. 11:79-90.
Bjornsen, P. K., 1986b. Automatic determination of bacterioplankton biomass by image analysis.Appl. Environ. Microbiol. 51:1199-1204.
Blackburn, N., Å. Hagström, J. Wikner, R. Cuadros-Hansson and P. K. Bjørnsen. 1998. RapidDetermination of Bacterial Abundance, Biovolume, Morphology, and Growth by NeuralNetwork-Based Image Analysis. Appl. Environ. Microbiol. 64:3246-3255.
Bjornsen, P. K., and J. Kuparinen, 1991, Determination of bacterioplankton biomass, netproduction and growth efficiency in the Southern Ocean, Mar. Ecol. Progr. Ser. 71:185-194.
Bratbak, G. 1985. Bacterial biovolume and biomass estimates. Appl. Environ. Microbiol.49:1488-1493.
Bratbak, G. and I. Dundas. 1984. Bacterial dry matter content and biomass estimations. Appl.Environ. Microbiol. 48: 755-757.
Brock, T. D. 1971, Microbial growth rates in nature. Bacteriol. Reviews 35:39-58.
Brunschede, H., T. L. Dove and H. Bremer. 1977. Establishment of exponential growth after anutritional shift-up in Escherichia coli B/r: accumulation of deoxyribonucleic acid,ribonucleic acid, and protein. J. Bacteriol. 129: 1020-1033.
Campbell L., H. A. Nolla and D. Vaulot. 1994. The importance of Prochlorococcus tocommunity structure in the central North Pacific Ocean. Limnology and Oceanography. 39:954-961.
Campbell, L., M. R. Landry, J. Constantinou, H. A. Nolla, S. L. Brown, H. Liu and D. A.Caron. In press. Response of microbial community structure to environmental forcing inthe Arabian Sea. Deep-Sea Res. II xx:000-000.
Carlson, C. H. W. Ducklow and T. D. Sleeter. 1996. Stocks and dynamics of bacterioplankton in thenorthwestern Sargasso Sea. Deep-Sea Research II 43:491-516.
Carlson, C. A., N. R. Bates, H. W. Ducklow and D. A. Hansell. 1999. Estimation of BacterialRespiration and Growth Efficiency in the Ross Sea, Antarctica. Aquatic Microbial EcologyXX:000-000.
Caron, D.A. H. G. Dam, P. Kremer, E. J. Lessard, L. P. Madin, T. C. Malone, J. M. Napp, E. R.Peele, M. R. Roman and M. J. Youngbluth. 1995. The contribution of microorganisms toparticulate carbon and nitrogen in surface waters of the Sargasso Sea near Bermuda. Deep-Sea Res. 42:943-972.
Chin-Leo, G. and D L. Kirchman, 1990, Unbalanced growth in natural assemblages of marinebacterioplankton. Mar. Ecol. Progr. Ser. 63:1-8.
29
Cho, B. C. and Azam, F. 1990. Biogeochemical significance of bacterial biomass in the ocean’seuphotic zone. Mar. Ecol. Prog. Ser. 63: 253-259
Choi, J. W., E. B. Sherr and B. F. Sherr. 1996. Relation between presence-absence of a visible nucleiodand metabolic activity in bacterioplankton cells. Limnol. Oceanogr. 41:1161-1168.
Christian, R. R., R.B. Hanson and S.Y. Newell, 1982, Comparison of methods for measurementof bacterial growth rates in mixed batch cultures. Appl. Environ. Microbiol. 43:1160-65.
Christian, J. R and D. M. Karl. 1994. Microbial community structure at the US-JGOFS StationALOHA: Inverse methods for estimating biochemical indicator ratios. J. Geophys. Res.99:14269-14276.
Chrzanowski, T.H., K. Simek, R. H. Sada and S. Williams. 1993. Estimates of bacterial growthrate constants from thymidine incorporation and variable conversion factors. Microbial Ecol.25:121-130.
Cohen, J. E. 1995. How Many People Can the Earth Support? New York: Norton. 532 pp.
Cole, J. J. and M. L. Pace. 1995. Why measure bacterial production? A reply to the comment byJahnke and Craven. Limnol. Oceanogr. 40:441-444.
Cole, J. J., M.L. Pace, and S. Findlay. 1988. Bacterial production in fresh and saltwaterecosystems: a cross-system overview. Mar. Ecol. Progr. Ser. 43:1-10.
Cooper, S. 1991. Bacterial Growth and Division. Biochemistry and Regulation of Prokaryoticand Eukaryotic Division Cycles. New York: Academic. 501 pp.
Cuhel, R. L., C. D. Taylor and H. W. Jannasch. 1982. Assimilatory sulfur metabolism in marinemicroorganisms: Considerations for the application of sulfate incorporation into protein as ameasurement of natural population protein synthesis. Appl. Environ. Microbiol. 43:160-168.
Del Giorgio, P. A. and J. J. Cole. 1998. Bacterial growth efficiency in natural aquatic systems.Ann. Rev. Ecol. Syst. 29:503-541.
Del Giorgio, P. A., Y. T. Prairie and D. F. Bird. 1997. Coupling between rates of bacterialproduction and the number of metabolically active cells in lake bacterioplankton, measuredby CTC reduction and flow cytometry. Microb. Ecol. 34:144-154.
Douglas, D. J., J. A. Novitsky and R. O. Fournier. (1987). Microautoradiography-basedenumeration of bacteria with estimates of thymidine-specific growth and production rates.Mar. Ecol. Prog. Ser. 36: 91-99.
Ducklow, H. 1983. Production and fate of bacteria in the oceans. BioScience. 33: 494-499.
Ducklow, H.W. and S. Hill. 1985a. The growth of heterotrophic bacteria in the surface watersof Warm Core Rings. Limnology and Oceanography 30:241-262.
Ducklow, H.W. and S. Hill. 1985b. Tritiated thymidine incorporation and the growth of
30
bacteria in warm core rings. Limnology and Oceanography 30:263-274.
Ducklow, H.W., Gardner, W. and Hill, S. 1985. Bacterial growth and the decomposition of particulateorganic carbon in sediment traps. Continental Shelf Research 4:445-464.
Ducklow, H. W., Factors regulating bottom-up control of bacterial biomass in open ocean planktoncommunities. 1992. Archiv. fur Hydrobiologie Beih. Ergebn. Limnol. 37:207-217.
Ducklow, H. W., and C. A. Carlson. 1992. Oceanic bacterial productivity. Advances in MicrobialEcology, 12:113-181. New York:Plenum.
Ducklow, H. W., D. L. Kirchman, and H. L. Quinby. 1992. Bacterioplankton cell growthand macromolecular synthesis in seawater cultures during the North Atlantic springphytoplankton bloom, May 1989. Microbial Ecology 24:125-144.
Ducklow, H. W. and F.-K. Shiah. 1993. Estuarine Bacterial Production. Chapter 11, pp. 261-284 In: T.Ford, Ed., "Aquatic Microbiology: An ecological approach," London: Blackwell. 518 p.
Ducklow, H.W., Kirchman, D.L., Quinby, H.L., Carlson, C. A., and Dam, H.G. 1993. Stocks and dynamicsof bacterioplankton carbon during the spring phytoplankton bloom in the eastern North AtlanticOcean. Deep-Sea Res. 40:245-263.
Ducklow, H. W., H. L. Quinby and C. A. Carlson. 1995. Bacterioplankton dynamics in the equatorialPacific during the 1992 El Nino. Deep-Sea Res. II. 42:621-38.
Ducklow, H. W., C. A. Carlson and W. O. Smith. 1998. Bacterial growth in experimentalplankton assemblages and seawater cultures from the Phaeocystis antarctica bloom in theRoss Sea, Antarctica. Aquatic Microbial Ecology 168: 229-244.
Ducklow, H. W., L. Campbell, M. R. Landry, H. L. Quinby, D. C. Smith, G. Steward and F.Azam. 1999. Heterotrophic bacterioplankton distributions in the Arabian Sea: Ageographical test of the DOC storage hypothesis. Deep-Sea Research. (submitted).
Ducklow, H. W. 1999. The bacterial component of the oceanic euphotic zone. FEMSMicrobiology-Ecology. (submitted).
Emerson S, Quay P, Stump C, Wilbur D, Schudlich R. Determining primary production from themesoscale oxygen field. ICES Mar Sci Symp 1993;197:196-206.
Fagerbakke, K.M. M. Heldal and S. Norland. 1996. Content of carbon, nitrogen, oxygen, sulfurand phosphorus in native aquatic and cultured bacteria. Aquatic Microb. Ecol. 10:15-27.
Falkowski, P. G. and J. A. Raven. 1997. Aquatic Photosynthesis. Malden, MA: BlackwellScientific. 375 pp.
Fuhrman, J. A. , and F. Azam. 1980. Bacterioplankton secondary production estimates forcoastal waters of British Columbia, Antarctica, and California. Appl. Environ. Microbiol.39:1085-1095.
Fuhrman, J. A. , And F. Azam. 1982. Thymidine incorporation as a measure of heterotrophicbacterioplankton production in marine surface waters: evaluation and field results. Mar.

31
Biol. 66:109-120.
Fuhrman, J. A. , J.W. Ammerman, and F. Azam. 1980. Bacterioplankton in the coastal euphoticzone: distribution, activity, and possible relationships with phytoplankton. Mar. Biol. 60:201-207
Fuhrman, J. A. , T. D. Sleeter, C. A. Carlson and L. M. Proctor, 1989. Dominance of bacterialbiomass in the Sargasso Sea and its ecological implications. Mar. Ecol. Progr. Ser. 57:207-17.
Fuhrman, J., H. Ducklow, D. Kirchman, J. Hudak, T. Bell and G. McManus. 1986. Does adenineincorporation into nucleic acids measure total microbial production? Limnol. Oceanogr. 31:627-636.
Fukuda, R., H. Ogawa, T. Nagata, I. Koike. 1998. Direct Determination of Carbon and NitrogenContents of Natural Bacterial Assemblages in Marine Environments. Appl. Environ.Microbiol. 64:3352-3358.
Goldman, J., D. A. Caron and M. R. Dennett. 1987. Regulation of gross growth efficiency andammonium regeneration in bacteria by substrate C:N ratio. Limnol. Oceanogr. 32: 1239-1252.
Hagstrom, A., U. Larrson, P. Horstedt, and S. Normark, 1979, Frequency of dividing cells, a newapproach to the determination of bacterial growth rates in aquatic environments. Appl.Environ. Microbiol. 37:805-812.
Hanson, R. B. And H. K. Lowery, 1983, Nucleic acid synthesis in oceanic microplankton fromthe Drake Passage, Antarctica: evaluation of steady-state growth. Mar. Biology 73:79-89.
Henrici, A. T. 1933. Studies of freshwater bacteria. I. A direct microscopic technique. J.Bacteriol. 25:277-287.
Henrici, A. T. 1938. Studies of freshwater bacteria. IV. Seasonal fluctuations of lake bacteria inrelation to plankton production. J. Bacteriol. 35:129-139.
Hobbie, J. E., R. J. Daley, and S. Jasper. 1977. Use of Nuclepore filters for counting bacteriaby fluorescence microscopy. Appl. Environ. Microbiol. 33: 1225-1228.
Hollibaugh, J. T., 1988, Limitation of the [3H]thymidine method for estimating bacterialproductivity due to thymidine metabolism. Mar. Ecol. Progr. Ser. 43:19-30.
Hoppe, H.-G., 1976, Determination and properties of actively metabolizing heterotrophicbacteria in the sea, investigated by means of micro-autoradiography. Marine Biol. 36:291-302.
Hoppe, H.-G., 1983, Significance of exoenzymatic activities in the ecology of brackish-water:Measurements by means of methyl-umbelliferyl substrates. Mar. Ecol. Progr. Ser. 11:299-308.
32
Jahnke, R. A. and D. B. Craven. 1995. Quantifying the role of heterotrophic bacteria in thecarbon cycle: A need for respiration rate measurements. Limnol. Oceanogr. 40:436-441.
Jannasch, H. W. and G. E. Jones, 1959, Bacterial populations in sea water as determined bydifferent methods of enumeration. Limnol. Oceanogr. 4:128-139.
Jumars, P.A. , D. L. Penry, J. A. Baross, M. J. Perry and B. W. Frost. 1989. Closing themicrobial loop: dissolved organic carbon pathway to heterotrophic bacteria from incompleteingestion, digestion and absorption in animals. Deep-Sea Res. 36:483-95.
Karl, D. M., 1979, Measurement of microbial activity and growth in the ocean by rates of stableribonucleic acid synthesis. Appl. Environ. Microbiol. 38:850-60.
Karl, D. M., 1986, Determination of in situ microbial biomass, viability, metabolism, andgrowth, pp. 85-176 In: J. S.Poindexter and E. R.Leadbetter, Eds., Bacteria in Nature, volume2, Plenum, 385 pp.
Karl, D. M. 1993. “Microbial processes in the Southern Oceans.” pp. 1-63 In: E. I.Friedmann, Ed. Antarctic Microbiology. New York: Wiley.
Karl, D. M. and C. D. Winn. 1984. Adenine Metabolism and Nucleic Acid Synthesis:Applications to Microbiological Oceanography. Heterotrophic Activity in the Sea. NewYork, Plenum.
Karl, D. M., C. D. Winn and C. L. Wong, 1981, RNA Synthesis as a measure of microbialgrowth in aquatic environments. I. Evaluation verification and optimization of methods.Mar. Biol. 64:1-12.
Kemp, P. F. B. Sherr, E. Sherr and J. J. Cole. 1993. "Handbook of Methods in aquatic microbialecology" . "Handbook of Methods in aquatic microbial ecology" P. Kemp. B. and E. Sherr and J.Cole, eds.
Kirchman, D. , E. K'nees and R. Hodson. 1985. Leucine incorporation and its potential as ameasure of protein synthesis by bacteria in natural waters. Appl. Environ. Microbiol. 49:599-607.
Kirchman, D. , H. Ducklow, and R. Mitchell. 1982. Estimates of bacterial growth from changesin uptake rates and biomass. Appl. Environ. Microbiol. 44: 1296-1307.
Kirchman, D. L., J. H. Rich and R. T. Barber. 1995. Biomass and biomass production ofheterotrophic bacteria along 140 W in the equatorial Pacific: Effect of temperature on themicrobial loop. Deep Sea Res. II 42:621-639.
Kirchman DL, Keil RG, Simon M, Welschmeyer NA. 1991. Biomass and production ofheterotrophic bacterioplankton in the oceanic subarctic Pacific. Deep-Sea Res I. 40:967-88.
Kirchman, D. L. and H. W. Ducklow. 1993. “Estimating conversion factors for the thymidineand leucine methods for measuring bacterial production.” pp. 513 - 518 in: P. Kemp, et al.,Eds. Handbook of Methods in Microbial Ecology. Boca Raton: Lewis Publ. 777 p.

33
Kirchman, D. L., Ducklow, H. W., and R. Mitchell. 1982. Estimates of bacterial growth from changes inuptake rates and biomass. Appl. Environ. Microbiol. 44:1296-1307.
Kjellebrg, S., K. B. G. Flardh, T. Nysstrom and D. J. W. Moriarty. 1993. Growth Limitation andstarvation of bacteria. Pp 289-321 In: In: T. Ford, Ed., "Aquatic Microbiology: An ecologicalapproach," London: Blackwell. 518 p.
Kogure, K. and I. Koike. 1987. Particle counter determination of bacterial biomass in seaweater.Appl. Environ. Microbiol. 53:274-277.
Lancelot, C. and G. Billen. 1986. Carbon-nitrogen relationships in nutrient metabolism of coastalmarine ecosystems. Adv. Aquatic Microbiol. 3:263-321.
Landry, M. R. and R. P. Hassett. 1982. Estimating the grazing impact of marine micro-zooplankton. Mar. Biol. 67:283-288.
LaRock, P. A., J. R. Schwartz and K. G. Hofer, 1988, Pulse labeling: A method for measuringmicrobial growth rates in the ocean. J. Microb. Methods 8:281-97.
Lee, S. and J.A. Fuhrman. 1987. Relationships between biovolume and biomass of naturally-derived marine bacterioplankton. Appl. Environ. Microbiol. 52:1298-1303.
Li, W.K.W., 1984, Microbial uptake of radiolabelled substrates: Estimates of growth rates fromtime course measurements. Appl. Environ. Micro. 47:184-92.
Li, W. K. W., P. M. Dickie, B. D. Irwin, and A, M. Wood. 1992. Biomass of bacteria,cyanobacteria, prochlorophytes and photosynthetic eukaryotes in the Sargasso Sea. Deep-Sea. Res. 39:501-519.
Li W. K. W., P. M. Dickie, W. G. Harrison, and B. D. Irwin. 1993. Biomass and production ofbacteria and phytoplankton during the spring bloom in the western North Atlantic Ocean.Deep-Sea Res.. II 40:307-329.
Malone, T. C. , L. H. Crocker, S. E. Pike, and B. W. Wendler. 1988. Influences of river flow onthe dynamics of phytoplankton production in a partially stratified estuary, Mar Ecol ProgrSer 48:235-249.
Marra, J., T. D. Dickey, C. Ho, C. S. Kinkade, D. E. Sigurdson, R. A. Weller and R. T.Barber. In press. Variability in primary production as observed from moored sensors in thecentral Arabian Sea in 1995. Deep-Sea Res. II xx:000-000.
Moriarty, D. J.W. 1985. Measurement of bacterial growth rates in aquatic systems using rates ofnucleic acid synthesis. Advances in Microbial Ecology 9:245-292.
Morita, R. Y. 1997. “Bacteria in Oligotrophic Environments. Starvation-Survival Lifestyle.”Moriarty, D. J.W. 1985. Measurement of bacterial growth rates in aquatic systems usingrates of nucleic acid synthesis. Advances in Microbial Ecology 9:245-292. New York:Chapman and Hall. 529 pp.
34
Noble, R. T. and J. A. Fuhrman. 1998. Use of SYBR Green I for rapid epifluorescence counts ofmarine viruses and bacteria. Aquatic Microbial Ecol. 14:113-118.
Poindexter, J. S. 1981. Oligotrophy: Fast and Famine Existence. Adv. Microb. Ecol. 5:63-91.
Pomeroy, L. R. (1974). The ocean's food web, a changing paradigm. BioScience. 24: 499-504.
Pomeroy, L.R. Sheldon, J.E. Sheldon, W.M., Jr. 1994. Changes in bacterial numbers andleucine assimilation during estimations of microbial respiratory rates in seawater by theprecision Winkler method. APPL. ENVIRON. MICROBIOL. 60, no. 1, pp. 328-332
Pomroy, A. and I. Joint. 1998. Bacterioplankton activity in the surface waters of the ArabianSea during and after the 1994 SW Monsoon. Deep-Sea Res. II xx:000-000.
Porter, K. G. and Y. S. Feig. 1980. The use of DAPI for identifying and counting aquaticmicroflora. Limnol. Oceanogr. 25: 943-948.
Rich, J., M. Gosselin, E. Sherr, B. Sherr, and D. L. Kirchman. 1998. High bacterial production,uptake and concentrations of dissolved organic matter in the Central Arctic Ocean. Deep-Sea Res. II 44:1645-1663.
Rivkin, R.B., Anderson, M.R., Lajzerowicz, C. 1996. Microbial processes in cold oceans. 1.Relationship between temperature and bacterial growth rate. Aquat.. Microb.. Ecol.. 10:243-254.
Robarts review
Robertson, B. R., D. K. Button and A. L. Koch. 1998. Determination of the Biomasses of SmallBacteria at Low Concentrations in a Mixture of Species with Forward Light ScatterMeasurements by Flow Cytometry. Appl. Environ. Microbiol. 64:3900-3909.
Sanders, R. W. Caron, D. A. Berninger, U. G. 1992. Relationships between bacteria andheterotrophic nanoplankton in marine and fresh waters: An inter-ecosystem comparison.Marine Ecology Progress Series 86:1-14.
Sherr, B. F., P. del Giorgio and E. B. Sherr. 1998. Estimating abundance and single-cellcharacteristics of actively respiring bacteria via the redox dye CTC. Aquatic Microbial Ecol.
Shiah, F.-K. and H. W. Ducklow. 1994. Temperature and substrate regulation of bacterial abundance,production and specific growth rate in Chesapeake Bay, USA. Mar. Ecol. Progr. Ser. 103:297-308.
Shiah, F.-K. and H. W. Ducklow. 1997. Biochemical adaptations of bacterioplankton to changingenvironmental conditions: responses of leucine and thymidine incorporation to temperature andchlorophyll variations. Aquatic Microbial Ecol. 13:151-159.
Sieburth, J. McN. 1979. Sea Microbes. New York: Oxford. 491 pp.
Simon, M. and F. Azam, 1989, Protein content and protein synthesis rates of planktonic marinebacteria. Mar. Ecol. Progr. Ser. 51:201-213

35
Smith, D. C. and Azam, F. 1992. A simple, economical method for measuring bacterialprotein synthesis rates in seawater using 3H-leucine. Mar. Microbial Food Webs 6: 107-114.
Smith, D.C., Simon, M., Alldredge, A.L., Azam, F. 1992. Intense hydrolytic enzyme activity onmarine aggregates and implications for rapid particle dissolution. Nature 359:139-142.
Smith, D.C., G. F. Steward, H. L. Quinby, H. W. Ducklow and F. Azam. 1996. “Bacterial abundance andproduction in the Arabian Sea during the 1995 US JGOFS Process cruises.” American GeophysicalUnion, San Diego, February. (poster).
Smith, W.O., Jr. and L.I. Gordon. 1997. Hyperproductivity of the Ross Sea (Antarctica)polynya during austral spring. Geophys. Res. Letters 24: 233-236.
Somville, M., 1983, Measurement and study of substrate specificity of exoglucosidase in naturalwater. Appl. Environ. Microbiol. 48:1181-1185.
Sorokin, Ju. I. 1964. A quantitative study of the microflora in the central Pacific Ocean. J. duConseil. 29:25-35.
Stanier, R. Y., E. A. Adelberg and J. Ingraham. 1976. The Microbial World. 4th Ed. EnglewoodCliffs, NJ: Prentice Hall. 821 pp.
Steeman-Nielsen, E. 1952. The use of radioactive carbon (C14) for measuring organic productionin the sea.. J. Cons. Int. Explor. Mer. 18:117-140.
Stephanopoulos, G. and J. J. Vallino. 1991. Network rigidity and metabolic engineering inmetabolite overproduction. Science 252:1675-1681.
Steward, G. F. and F. Azam. 1998. Bromodeoxydeuridine as an alternative to 3H-thymidine formeasuring bacterial productivity in aquatic samples. Aquatic Microb. Ecol. (in review).
Torreton, J.-P. and P. Dufour. 1996. Bacterioplankton production determined by DNA synthesis,protein synthesis and frequency of dividing cells in Tuamoto Atoll lagoons and surroundingoceans. Microb. Ecol. 32:185-203.
Tibbles, B. J. 1996. Effects of temperature on the incorporation of leucine and thymidine bybacterioplankton and bacterial isolates. Aquatic Microbial Ecology 11:239-250.
Vallino, J. J. C. S. Hopkinson, J. E. Hobbie. 1996. Modeling bacterial utilization of dissolvedorganic matter: Optimization replaces Monod growth kinetics. Limnol. Oceanogr. 8:1591-1609.
Watson, S. W., T. J. Novitsky, H. L. Quinby, and F. W. Valois, 1977, Determination of bacterialnumber and biomass in the marine environment, Appl. Envir. Microb. 33:940-46.
Wiebinga, C. J., M. J. W. Veldhuis and H. J. W. De Baar. 1997. Abundance and productivityof bacterioplankton in relation to seasonal upwelling in the northwest Indian Ocean. Deep-Sea Res. I. 44:451-476.
36
Wiebinga, C. J., H. J. W. de Baar and M. J. W. Veldhuis. 1999. On the assessment of rates ofbacterial growth in the sea: Nucleic acid and protein synthesis in incubation experiments ofmarine bacterial assemblages. Aquatic Microbial Ecol (in press).
Williams, P. J. leB. 1981. Incorporation of microheterotrophic processes into the classicalparadigm of the planktonic food web. Kieler Meeresforsch., 5, 1-28.
Williams, P. J. leB. 1984. Bacterial production in the marine food chain: The emperor's new suitof clothes?, pp. 271-299. In: M. Fasham (Ed.), “Flows of energy and materials in marineecosystems: Theory and practice.” New York: Plenum.
Williams, P. J. leB. 1993. On the definition of plankton production terms. In: “Measurement ofprimary production from the molecular to the global scale.” ICES Marine Sci. Symp. 197:9-19 .
Williams, P. J. leB. 1993. Chemical and tracer methods of measuring plankton production. In:“Measurement of primary production from the molecular to the global scale.” ICES MarineSci. Symp. 197:20-36.
Williams, P.J. le B. 1998. The balance of plankton respiration and photosynthesis in the openoceans. Nature 394:55-57.
ZoBell, CE. 1946. Marine Microbiology. Waltham, MA: Chronica Botanica Co.
Zweifel, U. L. and Hagström, Å. 1995. Total counts of marine bacteria include a large fraction ofnon-nucleoid-containing bacteria (ghosts). Appl. Environ. Microbiol. 61: 2180-2185.

37
Table 1. Phytoplankton and bacterial biomass in the ocean.
Regime Chl Bact # C:Chl CCF1 Phyto-C Bact-Cµµg/l 109 cells/l µµg/µµg fgC/cell µµgC/l
Open sea 0.1 0.5 50 10 5 5Coastal 1 1 50 10 50 10Estuary 10 5 50 10 500 50Open sea 0.1 0.5 100 10 10 5Coastal 1 1 100 10 100 10Estuary 10 5 100 10 1000 50Open sea 0.1 0.5 50 20 5 10Coastal 1 1 50 20 50 20Estuary 10 5 50 20 500 100Open sea 0.1 0.5 100 20 10 10Coastal 1 1 100 20 100 20Estuary 10 5 100 20 1000 100Open sea 0.1 0.5 50 30 5 15Coastal 1 1 50 30 50 30Estuary 10 5 50 30 500 150Open sea 0.1 0.5 100 30 10 15Coastal 1 1 100 30 100 30Estuary 10 5 100 30 1000 1501 Carbon Conversion Factor
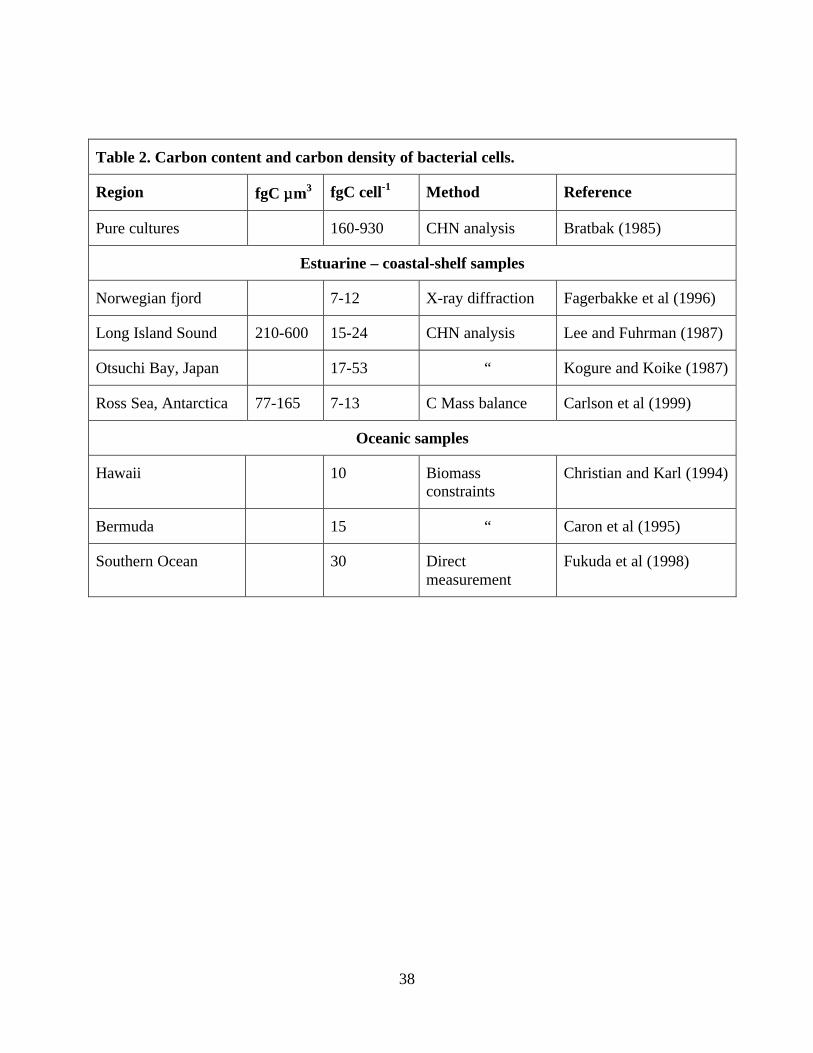
38
Table 2. Carbon content and carbon density of bacterial cells.
Region fgC µµm3 fgC cell-1 Method Reference
Pure cultures 160-930 CHN analysis Bratbak (1985)
Estuarine – coastal-shelf samples
Norwegian fjord 7-12 X-ray diffraction Fagerbakke et al (1996)
Long Island Sound 210-600 15-24 CHN analysis Lee and Fuhrman (1987)
Otsuchi Bay, Japan 17-53 “ Kogure and Koike (1987)
Ross Sea, Antarctica 77-165 7-13 C Mass balance Carlson et al (1999)
Oceanic samples
Hawaii 10 Biomassconstraints
Christian and Karl (1994)
Bermuda 15 “ Caron et al (1995)
Southern Ocean 30 Directmeasurement
Fukuda et al (1998)

39
Table 3. ratio of leucine to thymidine incorporation rates (pMol:pMol) in the upper 200 m atselected oceanic sites (Ducklow et al., 1993; 1995).
Region: North Atlantic
(47°° N., 20°° W.)
Equatorial Pacific
(0°° N., 140°° W.)
Leu:TdR ratio 18-31 May, 1989 23 Mar. – 09 Apr. 1992 02 – 21 Oct. 1992
Mean 23.0 19.7 12.8
St. Dev. 18.6 (81%) 6.1 (31%) 2.9 (22%)
Range 2.6 - 116.3 9.1 - 52.5 4.6 – 23.0
N 156 206 223

40
Table 4. Bacterial growth and conversion factors: Ross Sea Experiment.
Leucine-based BP: 0.21-0.42 µgC l-1 d-1; compare to TdR estimates in bold below):
TdR-based BP estimates from equations 5 (µgC l-1 d-1):
C cell-1 (fgC) Derivative Mod. Derivative Cumulative
10 1.14 0.43 0.10
20 2.27 0.85 0.20
30 3.41 1.28 0.30

41
Figure 1. Comparison of epifluorescence microscope vs flow cytometric counts of heterotrophic
bacteria in the upper 200 m of NW Arabian Sea in January, march and December, 1995
(Ducklow et al., submitted; Campbell et al., in press). The Model II regression line is Y=1.04X-
0.87; r2=0.69, n=421
Figure 2. Exponential growth in idealized bacterial assemblages. A. Closed circles: 100% active
cells, growing at 1 d-1. Open circles: thymidine incorporation by the growing cells. B. 90%
nongrowing “dead” cells and 10% “live” cells growing at 1 d-1. Triangles: thymidine
incorporation by growing cells. C. Apparent cell specific rate of TdR incorporation by the total
(live + dead) cell population in B. In D, there is a small “fast” and a 10 X larger, “slow”
population growing at 1 and 0.2 d-1, respectively. Note the nonexponential growth of the total
population.
Figure 3. Seawater culture growth experiment from the Ross Sea, Antarctica. Top: growth of
cells and increase in TdR incorporation rates during a 10-day incubation. Bottom: Cumulative
cells produced plotted against integral TdR incorporation. The slope of this plot is the thymidine
conversion factor (Bjornsen and Kuparinen (1991). The numbers in circles are the day sampled.
Figure 4. Bacterial standing stock (cells m-2) and production (as nmol thymidine m-2 hr-1) in the
euphotic zone. A. Euphotic zone (EZ) standing stocks. B. EZ mean abundance (stock/depth). C.
EZ integral TdR incorporation. D. EZ mean TdR incorporation rates (integral rate/depth). Inset:
same plot, with Chesapeake Bay data included. The Chesapeake Bay are presented as mean and
range (heavy line) of 162 monthly measurements made at 10 stations up and down the Bay in
1990-91 (Shiah and Ducklow, 1994). Other data sources cited in text.
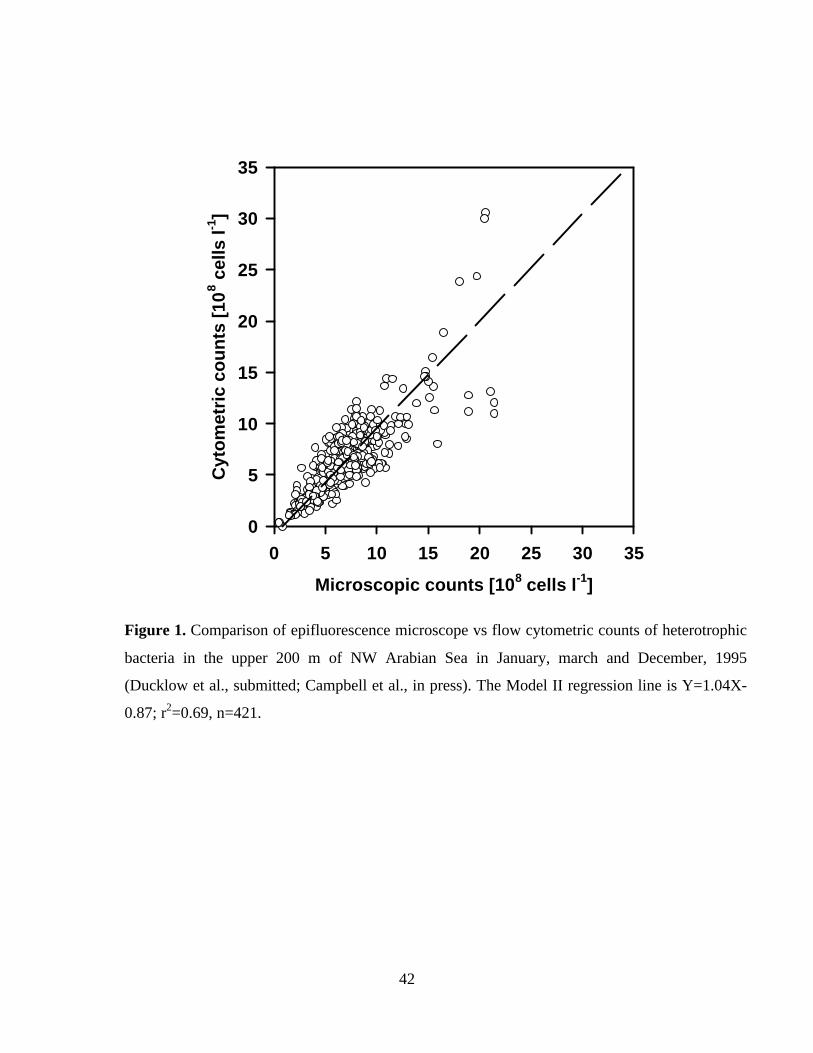
42
Microscopic counts [108 cells l-1]
0 5 10 15 20 25 30 35
Cyt
om
etri
c co
un
ts [
108 c
ells
l-1]
0
5
10
15
20
25
30
35
Figure 1. Comparison of epifluorescence microscope vs flow cytometric counts of heterotrophic
bacteria in the upper 200 m of NW Arabian Sea in January, march and December, 1995
(Ducklow et al., submitted; Campbell et al., in press). The Model II regression line is Y=1.04X-
0.87; r2=0.69, n=421.
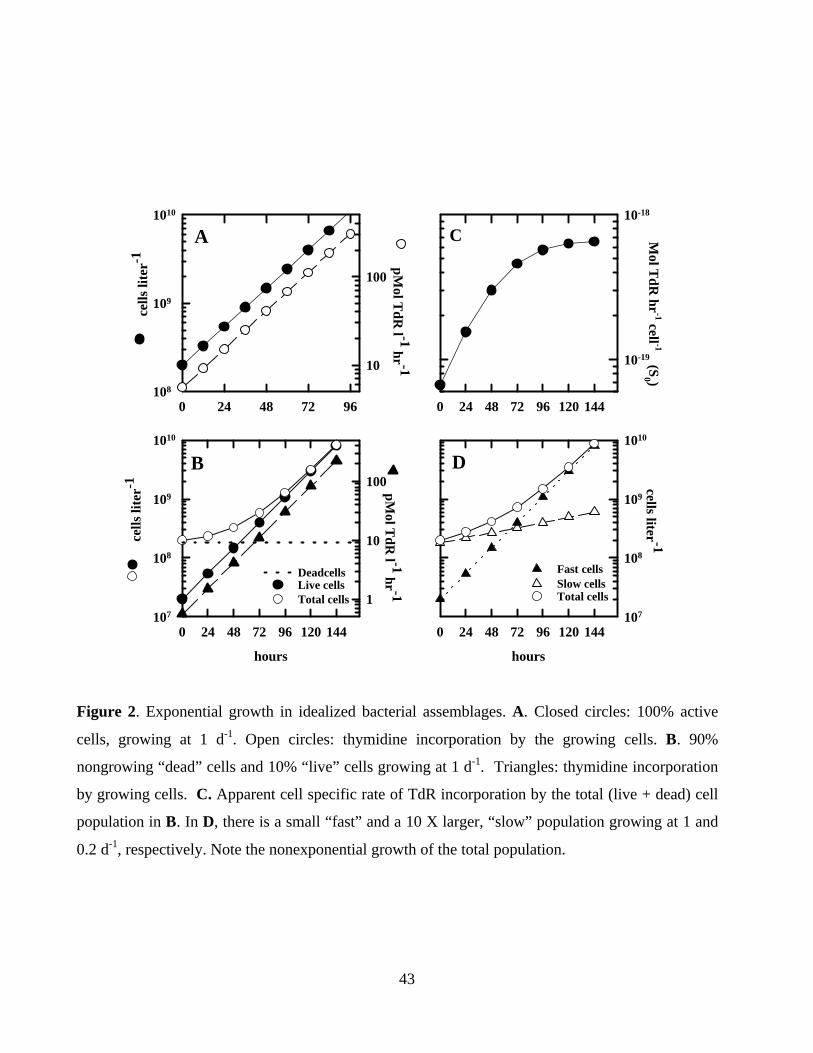
43
hours
0 24 48 72 96 120 144
cells liter -1
107
108
109
1010
0 24 48 72 96 120 144
Mol T
dR hr
-1 cell -1 (S0 )
10-19
10-18
0 24 48 72 96
cells
lite
r-1
108
109
1010
pMol T
dR l -1 hr -110
100
hours
0 24 48 72 96 120 144
cells
lite
r-1
107
108
109
1010pM
ol TdR
l -1 hr -1
1
10
100B
Live cellsTotal cells
Deadcells
A C
D
Slow cellsTotal cells
Fast cells
Figure 2. Exponential growth in idealized bacterial assemblages. A. Closed circles: 100% active
cells, growing at 1 d-1. Open circles: thymidine incorporation by the growing cells. B. 90%
nongrowing “dead” cells and 10% “live” cells growing at 1 d-1. Triangles: thymidine incorporation
by growing cells. C. Apparent cell specific rate of TdR incorporation by the total (live + dead) cell
population in B. In D, there is a small “fast” and a 10 X larger, “slow” population growing at 1 and
0.2 d-1, respectively. Note the nonexponential growth of the total population.
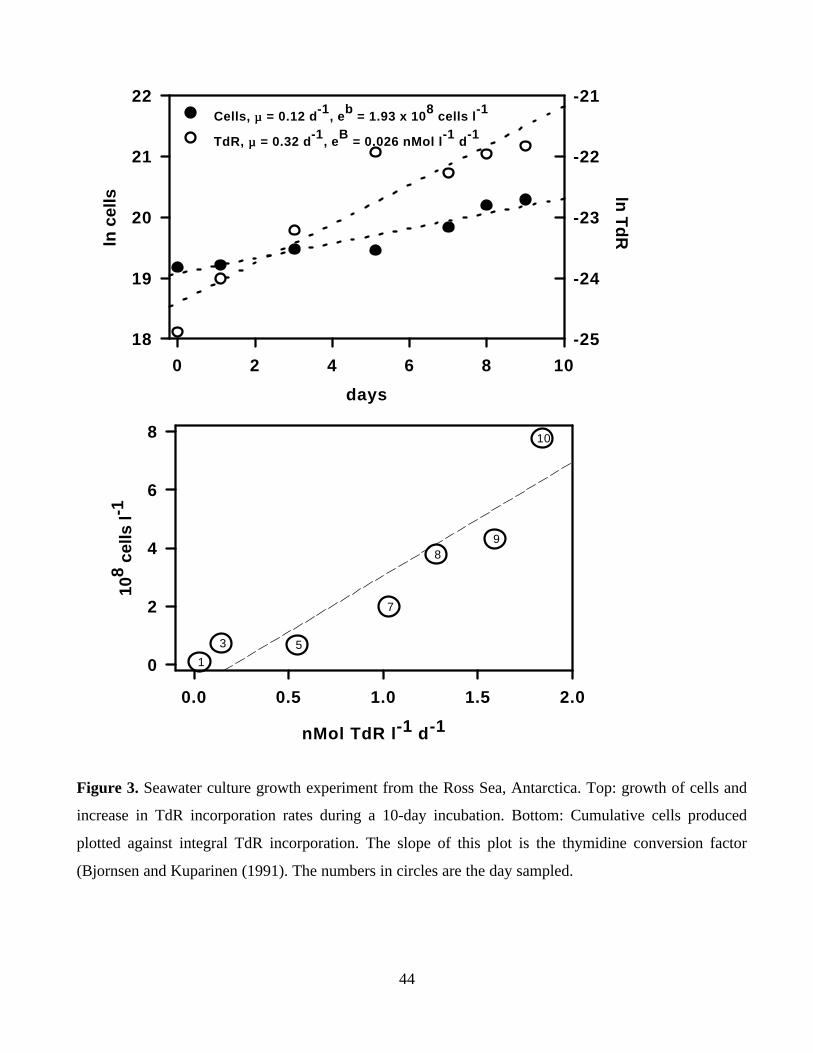
44
days
0 2 4 6 8 10
ln c
ells
18
19
20
21
22
-25
-24
-23
-22
-21Cells, µµ = 0.12 d-1, eb = 1.93 x 10⁸ cells l-1
TdR, µµ = 0.32 d-1, eB = 0.026 nMol l-1 d-1
ln T
dR
nMol TdR l-1 d-1
0.0 0.5 1.0 1.5 2.0
108 c
ells
l-1
0
2
4
6
8
1
3 5
7
8 9
10
Figure 3. Seawater culture growth experiment from the Ross Sea, Antarctica. Top: growth of cells and
increase in TdR incorporation rates during a 10-day incubation. Bottom: Cumulative cells produced
plotted against integral TdR incorporation. The slope of this plot is the thymidine conversion factor
(Bjornsen and Kuparinen (1991). The numbers in circles are the day sampled.

45
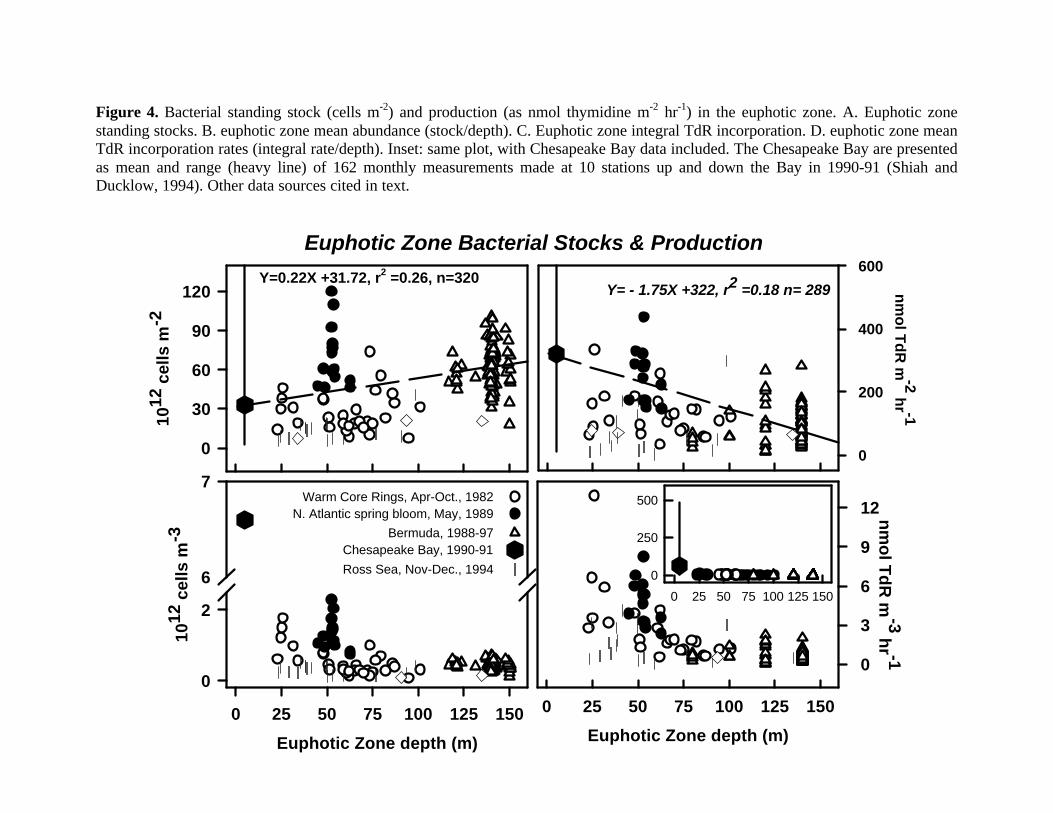
46
Figure 4. Bacterial standing stock (cells m-2) and production (as nmol thymidine m-2 hr-1) in the euphotic zone. A. Euphotic zonestanding stocks. B. euphotic zone mean abundance (stock/depth). C. Euphotic zone integral TdR incorporation. D. euphotic zone meanTdR incorporation rates (integral rate/depth). Inset: same plot, with Chesapeake Bay data included. The Chesapeake Bay are presentedas mean and range (heavy line) of 162 monthly measurements made at 10 stations up and down the Bay in 1990-91 (Shiah andDucklow, 1994). Other data sources cited in text.
Euphotic Zone depth (m)
0 25 50 75 100 125 150
nm
ol T
dR
m-2 h
r -1
0
200
400
600
Euphotic Zone depth (m)
0 25 50 75 100 125 150
nm
ol T
dR
m-3 h
r -10
3
6
9
12
Euphotic Zone depth (m)
0 25 50 75 100 125 150
1012
cel
ls m
-3
0
2
6
7
0 25 50 75 100 125 150
0
250
500
Euphotic Zone Bacterial Stocks & Production
Warm Core Rings, Apr-Oct., 1982N. Atlantic spring bloom, May, 1989
Bermuda, 1988-97Chesapeake Bay, 1990-91
1012
cel
ls m
-2
0
30
60
90
120
Ross Sea, Nov-Dec., 1994
Y=0.22X +31.72, r2 =0.26, n=320Y= - 1.75X +322, r2 =0.18 n= 289
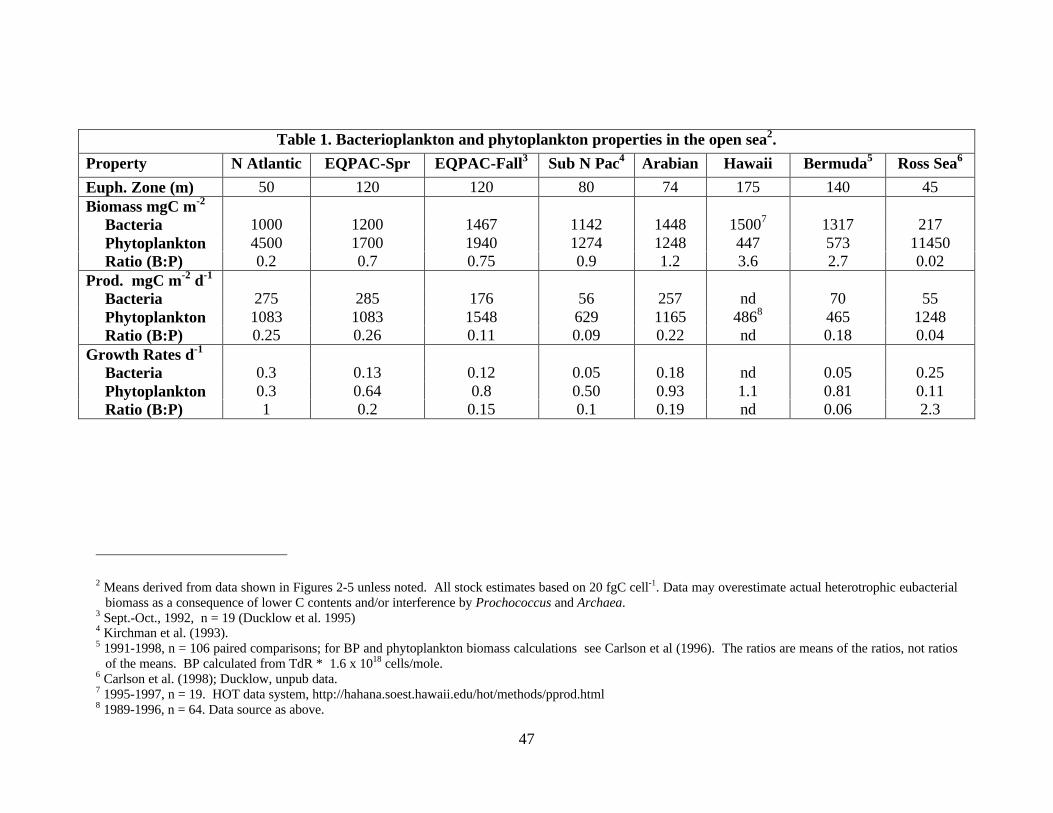
47
Table 1. Bacterioplankton and phytoplankton properties in the open sea2.
Property N Atlantic EQPAC-Spr EQPAC-Fall3 Sub N Pac4 Arabian Hawaii Bermuda5 Ross Sea6
Euph. Zone (m) 50 120 120 80 74 175 140 45Biomass mgC m-2
Bacteria 1000 1200 1467 1142 1448 15007 1317 217Phytoplankton 4500 1700 1940 1274 1248 447 573 11450Ratio (B:P) 0.2 0.7 0.75 0.9 1.2 3.6 2.7 0.02
Prod. mgC m-2 d-1
Bacteria 275 285 176 56 257 nd 70 55Phytoplankton 1083 1083 1548 629 1165 4868 465 1248Ratio (B:P) 0.25 0.26 0.11 0.09 0.22 nd 0.18 0.04
Growth Rates d-1
Bacteria 0.3 0.13 0.12 0.05 0.18 nd 0.05 0.25Phytoplankton 0.3 0.64 0.8 0.50 0.93 1.1 0.81 0.11Ratio (B:P) 1 0.2 0.15 0.1 0.19 nd 0.06 2.3
2 Means derived from data shown in Figures 2-5 unless noted. All stock estimates based on 20 fgC cell-1. Data may overestimate actual heterotrophic eubacterialbiomass as a consequence of lower C contents and/or interference by Prochococcus and Archaea.
3 Sept.-Oct., 1992, n = 19 (Ducklow et al. 1995)4 Kirchman et al. (1993).5 1991-1998, n = 106 paired comparisons; for BP and phytoplankton biomass calculations see Carlson et al (1996). The ratios are means of the ratios, not ratios
of the means. BP calculated from TdR * 1.6 x 10¹⁸ cells/mole.6 Carlson et al. (1998); Ducklow, unpub data.7 1995-1997, n = 19. HOT data system, http://hahana.soest.hawaii.edu/hot/methods/pprod.html8 1989-1996, n = 64. Data source as above.