bad habits and good practices - home | institutional … habits and good practices amit goyal, antti...
TRANSCRIPT

VOLUME 41 NUMBER 4 SUMMER 2015www.iijpm.com
The Voices of Influence | iijournals.com
Bad Habits and Good PracticesAMIT GOYAL, ANTTI ILMANEN, AND DAVID KABILLER

The Journal of PorTfolio ManageMenTSummer 2015
Bad Habits and Good PracticesAmit GoyAl, Antti ilmAnen, And dAvid KAbiller
Amit GoyAl
is a professor at the University of Lausanne in Lausanne, [email protected]
Antti ilmAnen
is a principal at AQR Capital Management in London, [email protected]
DAviD KAbiller
is a founding principal of AQR Capital Management in Greenwich, [email protected]
Good investing results require both good investments and good inves-tors. In this article, we focus on the latter and address three impor-
tant and prevalent bad habits that may hinder long-term investment performance: multi-year return chasing, under-diversif ication, and comfort seeking.1 Each is broad and manifests itself in various ways, so we provide examples and evidence related to each and summarize possible behavioral explanations. Of course, the habits can be partly overlap-ping, reinforcing each other.
For each bad habit there is a contrasting good practice, and we discuss these brief ly in the hope that recognizing and addressing bad habits and biases such as these can improve investors’ (and investment managers’) long-term results. Please note that while we focus on end-investors, we have spent our careers also battling these same bad habits in our-selves—so our perspective is fully intended as commiseration and shared experience, not as lecturing.
BAD HABIT 1: CHASING MULTI-YEAR RETURNS
Procyclic investing is often cited as the premier bad habit, so it deserves the longest discussion.2 This research shows that many investors tend to buy multi-year winners and sell multi-year laggards—whether asset
classes, strategy styles, single stocks, or funds. This is not surprising, as the human tendency to extrapolate is one of our strongest behav-ioral biases.
While multi-year return chasing has been shown to be harmful to portfolio per-formance, evidence suggests that chasing winners over the past few months may actu-ally be profitable, as financial markets tend to exhibit momentum (continuation, persis-tence, trends) over multi-month horizons up to a year. Why the seemingly stark contrast? There is good evidence that financial mar-kets tend to exhibit more mean reversion at multi-year horizons, as opposed to the shorter-term continuation patterns. Unfor-tunately, it is at this horizon that reallocation decisions tend to be made, too often making us momentum investors at reversal (multi-year) horizons—for instance, allocating more capital to a market segment that has been rising for several years, even when that market begins to change course.
Such procyclicality for institutional investors at three- to f ive-year horizons may ref lect typical performance evaluation periods. Many investors understandably lack patience when facing years of underperfor-mance, even if they are aware of the limited predictive ability in past performance and potentially high transition costs associated with firing and hiring. Academic advice to wait even longer, until statistically significant
Bad HaBits and Good Practices summer 2015
evidence is available, is not realistic for many investors. What else can investors do? We admit that it is easier to identify the problem than to offer satisfactory solu-tions. While we propose some constructive answers to this quandary, we acknowledge that certainly even these are hard to implement. Three- to five-year evaluation periods would not be so prevalent if it were otherwise.
Interestingly, procyclic f lows may reinforce market mis-valuations if they make rich things richer and cheap things cheaper. At worst, some investors may enter a market near its peak, despite exorbitant valuation levels, or capitu-late near the bottom and miss the subsequent reversal.
Statistical evidence is often only of borderline significance, partly because there exist only a limited number of independent observations of multi-year reallocation decisions. Still, participants in boards and investment committees seem to agree that multi-year return chasing is a pervasive pattern. To be clear, while we document evidence that high investor f lows sta-tistically predict low future returns, as always, corre-lation need not imply causality (e.g., inf lows making investments overcrowded and overpriced). Instead, the observed correlation could ref lect other factors; for example, f lows and returns might both be driven by previous years’ returns.
ILLUSTRATIVE EXAMPLES AND EVIDENCE
Ill-Timed Investor Flows
The best-known indirect evidence of procyclic investing’s harmful effects comes from the gap between time-weighted investment returns and dollar-weighted investor returns. Numerous studies have shown that the average returns investors historically experience are lower than the average returns for their respective strategic investment allocations, because of investors’ ill-timed activity (net inf lows after high returns and before low returns). Dichev [2007] shows that the dol-lar-weighted returns (internal rates of return) U.S. stock investors earned between 1926 and 2002 were 1.3% lower than the time-weighted (buy and hold) market returns of the NYSE/AMEX indices. The gap was an even wider 5.3% for NASDAQ investors (1973 to 2002), mainly due to the heavy inf lows during the late-1990s tech bubble and bust.
Firms such as Dalbar and Morningstar update these results regularly and attract much attention in the
financial press. These analyses are typically done at the aggregate market level, but similar patterns are shown for some individual stocks, industries, countries, and even the hedge fund industry (Dichev and Yu [2011]).3 We prefer the more direct analysis of predicting invest-ment returns with investor f lows.
For this direct evidence, we present key results from some of the best-known academic studies, which indicate that large inf lows predict low future returns. These examples cover retail and institutional f lows as well as a selection of single stocks, asset classes, and fund managers.4
Mutual Fund Flows
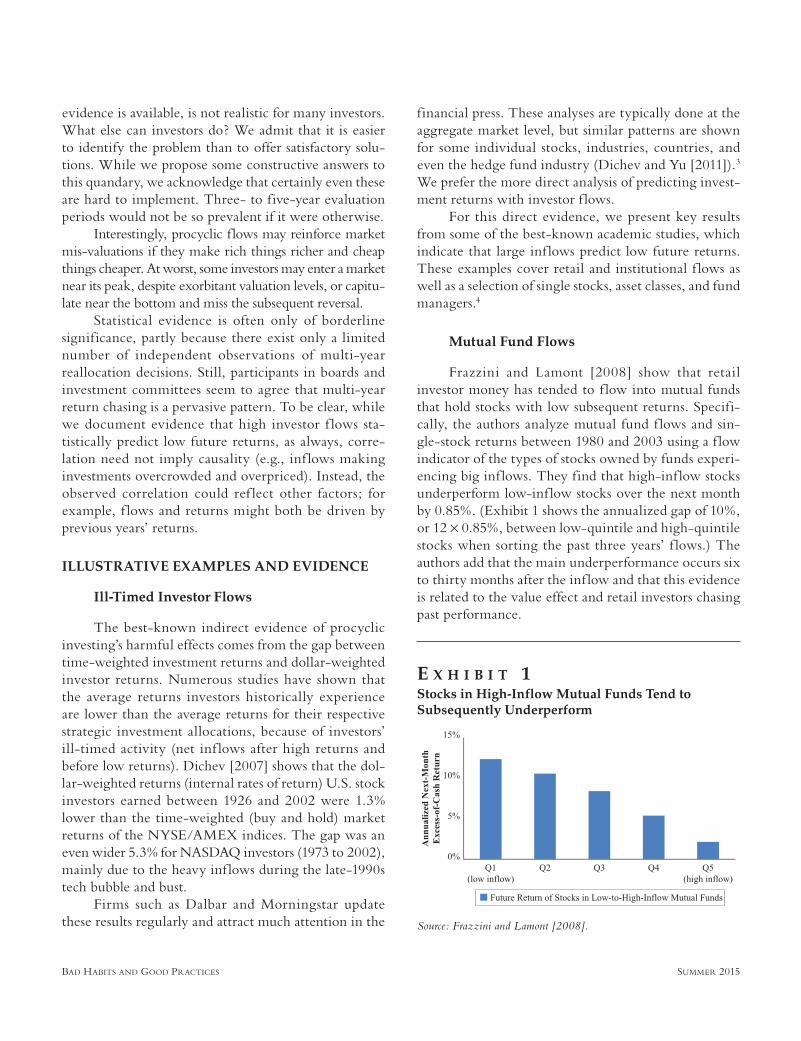
Frazzini and Lamont [2008] show that retail investor money has tended to f low into mutual funds that hold stocks with low subsequent returns. Specifi-cally, the authors analyze mutual fund f lows and sin-gle-stock returns between 1980 and 2003 using a f low indicator of the types of stocks owned by funds experi-encing big inf lows. They find that high-inf low stocks underperform low-inf low stocks over the next month by 0.85%. (Exhibit 1 shows the annualized gap of 10%, or 12 × 0.85%, between low-quintile and high-quintile stocks when sorting the past three years’ f lows.) The authors add that the main underperformance occurs six to thirty months after the inf low and that this evidence is related to the value effect and retail investors chasing past performance.
e x h i b i t 1Stocks in High-Inflow Mutual Funds Tend to Subsequently Underperform
Source: Frazzini and Lamont [2008].

The Journal of PorTfolio ManageMenTSummer 2015
Institutional Investors’ Allocation Decisions
Stewart et al. [2009] analyze institutional plan sponsor allocation activity over time, based on the PSN database of institutional products from 1984 to 2007. They document that investment products receiving contributions subsequently underperform products experiencing withdrawals. The difference is statistically signif icant, although the gap shown in Exhibit 2 is relatively modest: about 1% per annum. The bar chart contrasts past-year f lows and next-year returns, but similar patterns hold for returns over the next three to f ive years, as well as for various subcat-egories (domestic/international/global equities and bonds). The authors f ind that most of the post-f low underperformance is due to product (manager) selec-tion rather than category (asset class) reallocation, but both contribute.
Firing and Hiring Decisions
Goyal and Wahal [2008] drill into U.S. pension plan sponsors’ timing when firing and hiring invest-ment managers. Exhibit 3 shows that replacing man-agers has been clearly procyclic (no surprise there) and (more surprisingly) fired managers later tended to mildly outperform their hired replacements. This analysis uses two-year return windows before and after the event (412 paired fire/hire decisions between 1996 and 2003, an admittedly limited sample), but the patterns are similar with one- to three-year windows.
Contrasting Flow and Return Patterns
There is evidence that investors chase short-term returns as well as long-term returns. The former has presumably benefited them; the latter not. Ang et al. [2014] focus on this tension between multi-year procyclic investor f lows and multi-year mean-reverting returns.
Ang et al. [2014] use annual data from CEM Bench-marking on evolving U.S. pension funds’ asset alloca-tions between 1990 and 2011 to provide direct evidence on pension funds’ pro-cyclic tendencies. Exhibit 4 indi-cates that a positive return in one asset class (domestic or international stocks or bonds) results in an increase in target policy weights of that asset class, not just in the same and subsequent year but for several years (the solid bars are positive every year).
In contrast, financial market returns tend to exhibit clear momentum patterns over one year, but thereafter reversal patterns tend to dominate (the cross-hatch bars in Exhibit 4 are negative in years t + 2 and t + 4, sug-gesting that the continuing return-chasing allocations into the asset class in the previous year lost money). Exhibit 5 documents average autocorrelations for several asset classes over long histories; beyond the first year these tend to be negative or near zero. A comparison of Exhibits 4 and 5 suggests that pension funds in aggre-gate have not captured the shift from momentum to reversal tendencies in asset returns beyond the one-year horizon, but instead keep chasing returns over multi-year horizons.
This evidence is at the asset-class level; a large literature documents similar and perhaps stronger pat-terns within stock markets. Exhibit 6 shows evidence of multi-year reversals and one-year momentum in the
e x h i b i t 2Institutional Plan Sponsors Allocate to Products That Subsequently Underperform
Source: Stewart et al. [2009].
e x h i b i t 3Plan Sponsors’ Fire/Hire Decisions
Source: Goyal and Wahal [2008].

Bad HaBits and Good Practices summer 2015
past performance of decile-sorted U.S. stock portfolios. When sorting on one-year performance, the decile port-folios with high past-year returns subsequently outper-form the decile portfolios with low past-year returns. When sorting on f ive-year performance (excluding the past year), we observe the opposite pattern. Cross-sectional one-year momentum and multi-year reversal patterns are also evident in other countries, as well as in cross-country returns in many asset classes.5 Ironically, yet to our point, many investors are able to withstand underperformance over one year, but draw the line at three to five years—just when such underperformance empirically predicts (mildly) higher future returns.
A rarely measured variant of this bad habit involves changes in acceptable investment universes or investable assets, as well as in benchmark or policy portfolios. Such changes are typically multi-year procyclic and are rarely compared with the counterfactual of not having made this decision.
Even an investor who claims to follow the ultimate passive buy-and-hold approach must decide which assets she deems investable. Almost always, newly qualifying for investability follows strong multi-year performance,
e x h i b i t 5One-Year Momentum and Multi-Year Reversal Tendencies in Asset Class Returns
Notes: The figure shows for each asset class the average autocorrelation of lagged monthly returns in the previous 12 months (Y1) and in months lagged by 13–24 (Y2), 25–36 (Y3), 37–48 (Y4), 49–60 (Y5). The series include a multi-country composite of non-U.S. equities (equally weighted with a gradu-ally growing country universe), U.S. equities, a multi-country composite of government bonds (equally weighted with a gradually growing country universe), and the S&P GSCI commodity index. The sample period is indicated next to each asset class.
Source: Ang et al. [2014].
e x h i b i t 4Pension Fund Target Policy Weights Chase Returns over Several Years
Note: The figure shows stylized impulse response functions to a +10% return shock at time t for 1) asset class returns based on partial autocorrela-tion coefficients 0.034, -0.154, 0.076, and -0.060 and using a pooled regression of annual U.S. and non-U.S. stock and bond returns between 1900 and 2011, and for 2) pension fund policy weights, i.e., target asset class allocations across U.S. and non-U.S. stocks and bonds, with panel regression results using annual data for 1990 to 2011 among 573 U.S. pension funds from CEM Benchmarking.
Source: Ang et al. [2014].

The Journal of PorTfolio ManageMenTSummer 2015
and losing investability follows severe losses. For instance, when did most investors extend their equity portfolios to include emerging markets or frontier markets, when did they extend their fixed-income portfolio to include high-yield bonds or structured products, and when did they decide to disinvest? The case of alternative asset classes is even clearer: real estate, infrastructure, timber, farmland, commodities, private equity, private credit, and hedge funds all became increasingly widely held after extended benign periods, and these decisions were often reconsidered if persistent losses followed.
BEHAVIORAL EXPLANATIONS
We believe any list of the behavioral biases that might explain multi-year procyclic investing surely starts with extrapolation, our millennia-old tendency to learn from patterns and expect their continuation. As research has shown, humans tend to apply our instinctive desire to extrapolate even in instances when no pattern exists to be successfully extrapolated. When applied in a complex world such as f inancial markets, extrapolation, while seemingly appealing, is particularly challenging. As noted earlier, research has demonstrated that some degree of return extrapolation is appropriate, given observed return continuation patterns within a year, yet extending it to multi-year horizons can be excessive.6 Procyclic actions are reinforced by various social effects—herding, conventionality, peer risk7—and even by certain risk
management rules, such as VaR-based position sizing, stop-loss triggers, and drawdown control.
BAD HABIT 2: UNDER-DIVERSIFICATION
Many investors underappreciate or underutilize the benefits of diversification in various ways. Although many value it, they may still have less diversity in their portfolios than they think. We believe the most serious diversification problems for institutional investors are home bias and excessive dependence on equity market direction.
Security Concentration
Individual investors often hold just a few stocks. Worse, their main holding may well be the company they work for (stock options are common, and employer stock is among the default choices for retirement saving). This compounds investment risk with employment risk, as Enron employees painfully learned. Fortunately, greater access to well-diversif ied mutual funds and better default choices in retirement saving have miti-gated these problems. For founders and proprietors of individual firms, risk concentration can remain extreme for decades.
Institutional investors rarely concentrate their risks among a few single stocks, but they may fall prey to other forms of under-diversification.
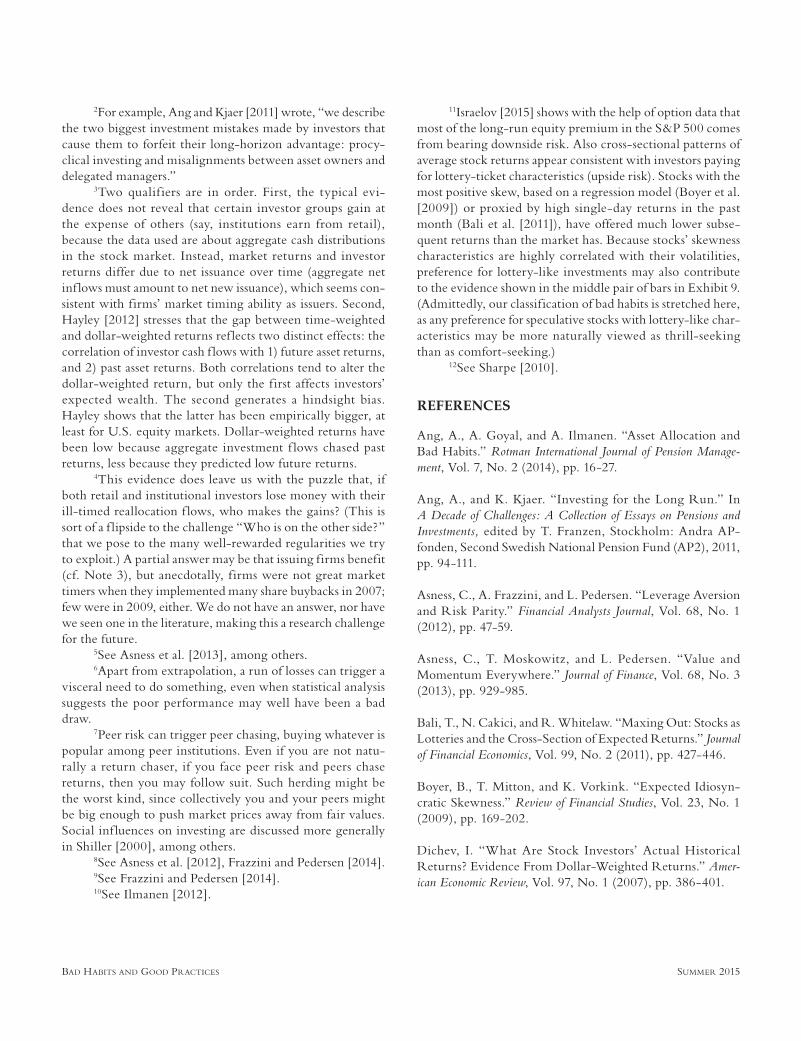
Home Bias
For most investors, the weights of own-country assets in their portfolios exceed global market-cap weights. Exhibit 7 shows some estimates for select coun-tries from 2010. Home bias has been declining over time but remains significant in every country and may be especially extreme in emerging economies. The 2013 Towers Watson Global Pension Assets Study finds that the share of domestic equities over total equities in pen-sion asset allocations has fallen in a range of developed economies, on average, from 65% in 1998 to 47% in 2012; the corresponding figures for bonds are 88% and 83%. A few decades ago, capital controls ensured that home bias was even more pronounced than in 1998; thus, this is one bad habit that has corrected significantly over time.
e x h i b i t 6One-Year Momentum and Long-Term Reversal Patterns in U.S. Stock Returns, 1931–2013
Sources: AQR, Ken French Data Library.
Bad HaBits and Good Practices summer 2015
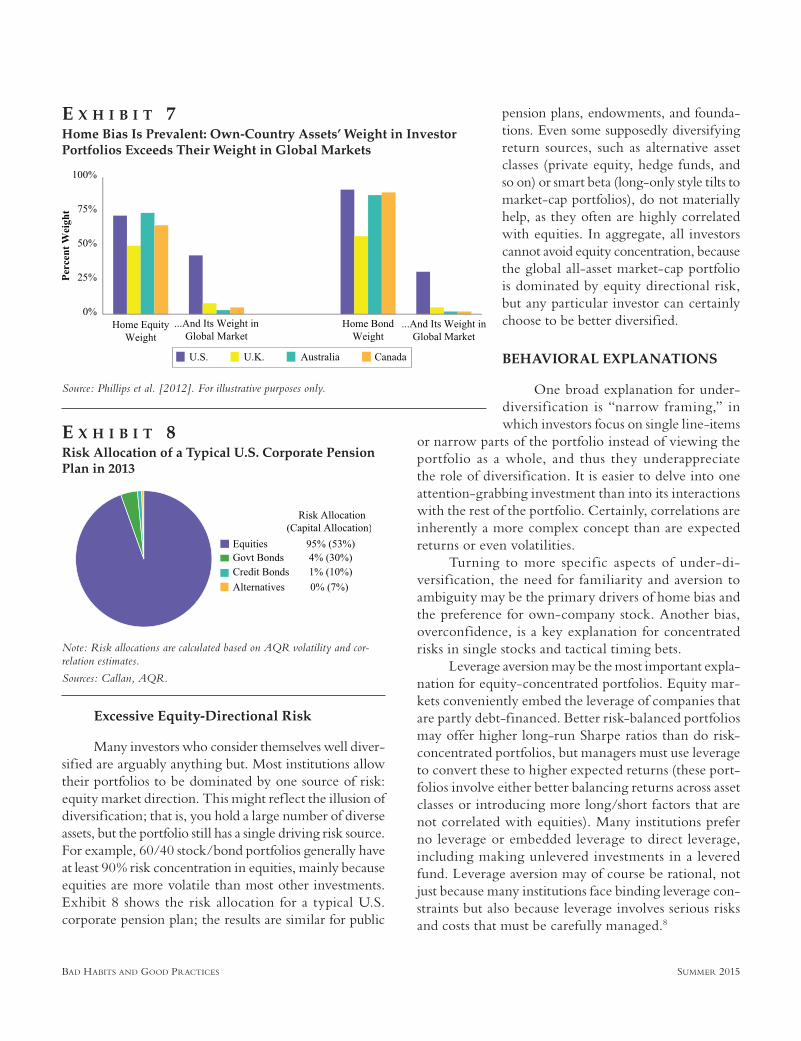
Excessive Equity-Directional Risk
Many investors who consider themselves well diver-sified are arguably anything but. Most institutions allow their portfolios to be dominated by one source of risk: equity market direction. This might ref lect the illusion of diversification; that is, you hold a large number of diverse assets, but the portfolio still has a single driving risk source. For example, 60/40 stock/bond portfolios generally have at least 90% risk concentration in equities, mainly because equities are more volatile than most other investments. Exhibit 8 shows the risk allocation for a typical U.S. corporate pension plan; the results are similar for public
pension plans, endowments, and founda-tions. Even some supposedly diversifying return sources, such as alternative asset classes (private equity, hedge funds, and so on) or smart beta (long-only style tilts to market-cap portfolios), do not materially help, as they often are highly correlated with equities. In aggregate, all investors cannot avoid equity concentration, because the global all-asset market-cap portfolio is dominated by equity directional risk, but any particular investor can certainly choose to be better diversified.
BEHAVIORAL EXPLANATIONS
One broad explanation for under-diversif ication is “narrow framing,” in which investors focus on single line-items
or narrow parts of the portfolio instead of viewing the portfolio as a whole, and thus they underappreciate the role of diversification. It is easier to delve into one attention-grabbing investment than into its interactions with the rest of the portfolio. Certainly, correlations are inherently a more complex concept than are expected returns or even volatilities.
Turning to more specif ic aspects of under-di-versif ication, the need for familiarity and aversion to ambiguity may be the primary drivers of home bias and the preference for own-company stock. Another bias, overconfidence, is a key explanation for concentrated risks in single stocks and tactical timing bets.
Leverage aversion may be the most important expla-nation for equity-concentrated portfolios. Equity mar-kets conveniently embed the leverage of companies that are partly debt-financed. Better risk-balanced portfolios may offer higher long-run Sharpe ratios than do risk-concentrated portfolios, but managers must use leverage to convert these to higher expected returns (these port-folios involve either better balancing returns across asset classes or introducing more long/short factors that are not correlated with equities). Many institutions prefer no leverage or embedded leverage to direct leverage, including making unlevered investments in a levered fund. Leverage aversion may of course be rational, not just because many institutions face binding leverage con-straints but also because leverage involves serious risks and costs that must be carefully managed.8
e x h i b i t 8Risk Allocation of a Typical U.S. Corporate Pension Plan in 2013
Note: Risk allocations are calculated based on AQR volatility and cor-relation estimates.
Sources: Callan, AQR.
e x h i b i t 7Home Bias Is Prevalent: Own-Country Assets’ Weight in Investor Portfolios Exceeds Their Weight in Global Markets
Source: Phillips et al. [2012]. For illustrative purposes only.

The Journal of PorTfolio ManageMenTSummer 2015
There may be other institutional or agency reasons for under-diversification. Some examples include con-ventionality or peer considerations supporting traditional 60/40 portfolios, domestic liabilities discouraging inter-national bond diversification, or the bandwidth limits of boards (or other owner’s representatives) to learn about many different asset classes and investment strategies.
BAD HABIT 3: SEEKING COMFORT
Some investors seek comfort when selecting invest-ments, whether individual securities or asset classes, instead of judging them purely on risk/reward merits. Such familiar and convenient investments can be struc-turally overpriced and thus deliver lower long-term returns. Conversely, investors underutilize comfort-challenging tools (leverage, shorting, and derivatives) that could be used to improve risk diversif ication. In other words, staying in the comfort zone can imply leaving Sharpe ratio on the table.
Equity Risk
As described earlier, most portfolios are dominated by equity risk. We add that for many investors, the fact
that their peers share this problem makes equity market risk more bearable. This may consequently make equity risk less rewarded in the long run than it would be if it were a less comfortable investment.
Growth/Glamor
It’s well known that value stocks tend to outperform growth/glamor stocks in the long run. (See the first pair of bars in Exhibit 9 for some empirical evidence.) The likely behavioral expla-nations are less understood. We believe the main reasons for value’s outperfor-mance include investors’ excessive multi-year extrapolation of recent growth and the greater ease of holding popular story stocks than persistent losers. Academics have debated for decades how much value versus growth/glamor pricing ref lects behavioral factors such as these, versus a rational premium for bearing
risk; we believe both contribute.
Embedded Leverage
Many investors seem to overpay for embedded leverage to avoid direct leverage. Leverage aversion can explain the higher risk-adjusted returns of low-beta or low-volatility stocks. (See middle pair of bars in Exhibit 9). Similar patterns are documented for most countries and industries, as well as defensive cross-sec-tional strategies in other asset classes, option markets, and exchange-traded funds. It is also possible to identify from holdings data which investors are more leverage averse: retail investors and mutual funds have tended to favor stocks with betas greater than one, while private equity and Warren Buffett have preferred to lever up stocks with beta of less than one.9
As noted earlier, we believe that direct leverage is a useful tool for achieving efficient risk diversification, and its risks can be manageable when leverage is com-bined with highly liquid assets (exchange-traded futures, for example) and plentiful free cash. In contrast, mixing leverage and illiquidity is a seriously bad habit, especially when illiquid assets are funded with short-term debt.
e x h i b i t 9Historical Performance of Value vs. Growth Stocks, Stable vs. Speculative Stocks, and Illiquid vs. Liquid Stocks, February 1988–March 2014
Notes: We sort stocks within each country based on different characteristics: book-to-market ratio (B/M) as well as past-year volatility and share turnover (both negated). We construct five equally weighted quintile portfolios on all three dimensions and aggregate country results by MSCI (devel-oped market) weights. We show compound returns for top and bottom quintile portfolios. For illus-trative purposes only.
Sources: AQR, MSCI.

Bad HaBits and Good Practices summer 2015
Lotteries and Insurance
Investors buy investments with a promise of large upside—assets like lottery tickets—but at the same time they buy protection against investments where the downside risk appears to loom large. Not surpris-ingly, both strategies (in financial markets as elsewhere) have delivered low long-run returns.10 Fear of left-tail risk drives many investors to overpay for crash protec-tion, especially with a recent crash fresh in the memory, while the greed of right-tail riches also drives investors to overpay for the hope of a long-shot win. Upside risk is intuitively more comfortable to bear than downside risk, so it is not surprising if the latter is better rewarded.11
Smooth Returns
Many investors like and thus overpay for smooth returns, which may explain why historical illiquidity premia on private assets are slimmer than seems war-ranted. (In this case, it’s the appearance of smoothness that comes from an inability to get timely marking to market, not actual smoothness.) The last pair of bars in Exhibit 9 suggests that even among equities, the his-torical reward for illiquidity has been modest.
BEHAVIORAL EXPLANATIONS
In short, seeking comfort may come at a price if investors derive utility from and pay for investment charac-teristics other than their return and risk. Comfort-seekers’ possible non-standard preferences include liking lotteries, smooth returns, and peers’ conventional holdings, while disliking leverage, large left-tail risks, and any sources of headline risk. As discussed, certain cognitive errors may also contribute, such as multi-year extrapolation.
We would emphasize conventionality as a poten-tially costly provider of comfort. It is never fun to lose money, but it is even worse to be wrong and alone. Keynes warned long ago about the dangers of failing unconventionally. It is hard to imagine that convention-ality would not inf luence market pricing and prospective rewards.
GOOD PRACTICES
Fortunately, each bad habit has a f lip side: a good investment practice. (See Exhibit 10.) We now brief ly
summarize some ideas on good practices. We recognize that writing about good intentions can easily sound like preaching and ask readers to bear with us. Finally, we discuss the challenge of macro-consistency practices (not everyone can follow them without moving market prices), which applies to any investment advice that deviates from market-cap weights.
Invest Strategically
Investors should carefully consider their core invest-ment beliefs. This means choosing what one believes in and trying to stick with it in a consistent, disciplined and patient manner. Accept risks for their rewards but try to recognize your risk tolerance before a breaking point. Be humble, especially when it comes to tactical asset allocation, which most often leads to a less diversi-fied portfolio. Consider countercyclical rebalancing to strategic risk-based targets, as it helps fight against the tendency towards procyclic investing, or selling near bottoms and buying near peaks.
Turning specifically to the bad habit we discussed most extensively: if the use of three- to five-year per-formance is problematic for selecting strategies or man-agers, what else can investors do? Academics may argue for even longer evaluation periods, as three to five years rarely offer enough data to reach a statistically mean-ingful conclusion. Although this may be theoretically true, various institutional needs make it hard to imple-ment in the real world. To realistically improve patience and to rely less on the return experience, investors need to spend even more time evaluating the merits of a strategy (or a manager) before investing and only select the ones in which they truly have faith. That is, investors should consider other decision criteria (e.g., people, philosophy, process) besides past performance and develop a fuller understanding of the reasonable range of outcomes. If the investment or manager then disappoints over a multi-year horizon, one could again return to examine those criteria in addition to return. For example, one can ask
e x h i b i t 1 0Bad Habits and Good Practices

The Journal of PorTfolio ManageMenTSummer 2015
whether the environment changed in a way that would undermine the original investment thesis, whether the underperformance ref lects changing relevant market valuations during the evaluation period, or whether the manager team changed. Examining correlations to risk factors or to other managers can help assess whether the manager behaved as expected or changed its approach. For investments intended as diversifiers, the matter of whether they provided the expected low correlations is especially relevant.
Diversify Risks Aggressively
The benefits of diversification form a well-known tenet of modern portfolio theory. Successful diversifica-tion requires that investors focus on the total portfolio and the possible relations between its various compo-nents, not just those components individually. This means avoiding undue risk concentrations, including equity-market direction. Similarly, we believe inves-tors should embrace intelligent risks, including tools (leverage, shorting, and derivatives) that let them fully diversify, although mixing these with illiquid assets can be particularly dangerous. Altogether, these tools can meaningfully help diversify investors’ risk allocation (not just dollar allocation, which is an easier task and often a misleading measure of portfolio risk).
Accept Discomfort If Paid to Do So
This advice applies to both investment selection and portfolio construction tools. Here, investors should consider harvesting return sources with strong evidence of giving a systematic long-run edge, such as asset class premia and certain tried and true style premia, such as value and momentum. In doing so, it is important that investors require both pervasive empirical evidence (in sample and out of sample) and economic rationale (unifying explanations, whether risk-based or behav-ioral). Further, learn from academic research and market history, including one’s own and others’ mis-takes. Lastly, dare to be unconventional, for example, applying tools that allow better risk diversification (see good practice #2).
While some of these good practices are uncontro-versial, others are merely our experience-based opinions. We further acknowledge that all three bad habit/good practice pairs raise the question of macro-consistency:
can everyone do it at the same time? All deviations from the global market-cap portfolio or buy and hold investing require that some investors take the other side of the trade.12 In some cases, our proposed good practices correct bad habits in a macro-consistent way; that is, to equilibrium investment practices that every investor could enjoy. However, in suggesting that investors adopt practices such as disciplined rebalancing (rather than fol-lowing market weights between asset classes), proactive diversification (beyond the market portfolio dominated by equity risk), and leaving the comfort zone of con-ventional return sources, we often implicitly assume that some non-equilibrium returns are available to a subset of investors—not to everyone. Our suggested best practices are motived in large part by empirical research, as dis-cussed in this article. That is, we argue that systematic behavioral biases, together with limits of arbitrage, may allow certain bad habits to persist and inf luence market pricing, and thereby give rise to (limited and difficult) opportunities in taking the other side. Were a large frac-tion of investors to follow the good practices we endorse, this would move market pricing.
CONCLUSION
Replacing bad habits with good practices is cer-tainly not easy. Habits are behavioral routines that tend to occur unconsciously and in many cases become insti-tutionalized over time. We hope that the examples and evidence presented here help investors identify and miti-gate some of these habits, as a step toward improving portfolio results over the long term.
ENDNOTES
We thank Brian Crowell, Jeremy Getson, Brian Hurst, Ronen Israel, John Liew, Thomas Maloney, Michael Men-delson, Christopher Palazzolo, Rodney Sullivan, and Daniel Villalon for helpful discussions and comments. Special thanks to Andrew Ang and Cliff Asness for discussions that origi-nated some of the ideas in this article.
The views expressed are those of the authors and not necessarily those of AQR Capital Management or its employees.
1The three habits highlighted in this article are not the only ones that may harm performance. There is plenty of literature on other bad habits, such as those related to insuff icient attention to costs and suboptimal governance arrangements.
Bad HaBits and Good Practices summer 2015
2For example, Ang and Kjaer [2011] wrote, “we describe the two biggest investment mistakes made by investors that cause them to forfeit their long-horizon advantage: procy-clical investing and misalignments between asset owners and delegated managers.”
3Two qualif iers are in order. First, the typical evi-dence does not reveal that certain investor groups gain at the expense of others (say, institutions earn from retail), because the data used are about aggregate cash distributions in the stock market. Instead, market returns and investor returns differ due to net issuance over time (aggregate net inf lows must amount to net new issuance), which seems con-sistent with firms’ market timing ability as issuers. Second, Hayley [2012] stresses that the gap between time-weighted and dollar-weighted returns ref lects two distinct effects: the correlation of investor cash f lows with 1) future asset returns, and 2) past asset returns. Both correlations tend to alter the dollar-weighted return, but only the first affects investors’ expected wealth. The second generates a hindsight bias. Hayley shows that the latter has been empirically bigger, at least for U.S. equity markets. Dollar-weighted returns have been low because aggregate investment f lows chased past returns, less because they predicted low future returns.
4This evidence does leave us with the puzzle that, if both retail and institutional investors lose money with their ill-timed reallocation f lows, who makes the gains? (This is sort of a f lipside to the challenge “Who is on the other side?” that we pose to the many well-rewarded regularities we try to exploit.) A partial answer may be that issuing firms benefit (cf. Note 3), but anecdotally, f irms were not great market timers when they implemented many share buybacks in 2007; few were in 2009, either. We do not have an answer, nor have we seen one in the literature, making this a research challenge for the future.
5See Asness et al. [2013], among others.6Apart from extrapolation, a run of losses can trigger a
visceral need to do something, even when statistical analysis suggests the poor performance may well have been a bad draw.
7Peer risk can trigger peer chasing, buying whatever is popular among peer institutions. Even if you are not natu-rally a return chaser, if you face peer risk and peers chase returns, then you may follow suit. Such herding might be the worst kind, since collectively you and your peers might be big enough to push market prices away from fair values. Social inf luences on investing are discussed more generally in Shiller [2000], among others.
8See Asness et al. [2012], Frazzini and Pedersen [2014].9See Frazzini and Pedersen [2014].10See Ilmanen [2012].
11Israelov [2015] shows with the help of option data that most of the long-run equity premium in the S&P 500 comes from bearing downside risk. Also cross-sectional patterns of average stock returns appear consistent with investors paying for lottery-ticket characteristics (upside risk). Stocks with the most positive skew, based on a regression model (Boyer et al. [2009]) or proxied by high single-day returns in the past month (Bali et al. [2011]), have offered much lower subse-quent returns than the market has. Because stocks’ skewness characteristics are highly correlated with their volatilities, preference for lottery-like investments may also contribute to the evidence shown in the middle pair of bars in Exhibit 9. (Admittedly, our classification of bad habits is stretched here, as any preference for speculative stocks with lottery-like char-acteristics may be more naturally viewed as thrill-seeking than as comfort-seeking.)
12See Sharpe [2010].
REFERENCES
Ang, A., A. Goyal, and A. Ilmanen. “Asset Allocation and Bad Habits.” Rotman International Journal of Pension Manage-ment, Vol. 7, No. 2 (2014), pp. 16-27.
Ang, A., and K. Kjaer. “Investing for the Long Run.” In A Decade of Challenges: A Collection of Essays on Pensions and Investments, edited by T. Franzen, Stockholm: Andra AP-fonden, Second Swedish National Pension Fund (AP2), 2011, pp. 94-111.
Asness, C., A. Frazzini, and L. Pedersen. “Leverage Aversion and Risk Parity.” Financial Analysts Journal, Vol. 68, No. 1 (2012), pp. 47-59.
Asness, C., T. Moskowitz, and L. Pedersen. “Value and Momentum Everywhere.” Journal of Finance, Vol. 68, No. 3 (2013), pp. 929-985.
Bali, T., N. Cakici, and R. Whitelaw. “Maxing Out: Stocks as Lotteries and the Cross-Section of Expected Returns.” Journal of Financial Economics, Vol. 99, No. 2 (2011), pp. 427-446.
Boyer, B., T. Mitton, and K. Vorkink. “Expected Idiosyn-cratic Skewness.” Review of Financial Studies, Vol. 23, No. 1 (2009), pp. 169-202.
Dichev, I. “What Are Stock Investors’ Actual Historical Returns? Evidence From Dollar-Weighted Returns.” Amer-ican Economic Review, Vol. 97, No. 1 (2007), pp. 386-401.

The Journal of PorTfolio ManageMenTSummer 2015
Dichev, I., and G. Yu. “Higher Risk, Lower Returns: What Do Hedge Fund Investors Really Earn.” Journal of Financial Economics, 100 (2011), pp. 248-263.
Frazzini, A., and O. Lamont. “Dumb Money: Mutual Fund Flows and the Cross-Section of Stock Returns.” Journal of Financial Economics, 88 (2008), pp. 299-322.
Frazzini, A., and L. Pedersen, “Betting Against Beta.” Journal of Financial Economics Vol. 111, No. 1 (2014), pp. 1-25.
Goyal, A., and S. Wahal. “The Selection and Termination of Investment Management Firms by Plan Sponsors.” The Journal of Finance, Vol. 63, No. 4 (2008), pp. 1805-1847.
Hayley, S. “Measuring Investors’ Historical Returns: Hind-sight Bias in Dollar-Weighted Returns.” Cass Business School working paper, 2012.
Ilmanen, A. “Do Financial Markets Reward Buying or Selling Insurance and Lottery Tickets?” Financial Analysts Journal, Vol. 68, No. 5 (2012), pp. 26-36.
Israelov, R. “The Upside and Downside Equity Risk Premium.” AQR white paper (forthcoming 2015).
Phillips, C., F. Kinniry, and S. Donaldson. “The Role of Home Bias in Global Asset Allocation Decisions,” The Van-guard Group, June 2012.
Sharpe, W. “Adaptive Asset Allocation Policies.” Financial Analysts Journal, Vol. 66, No. 3 (2010), pp. 45-59.
Shiller, R. Irrational Exuberance. Princeton, NJ: Princeton University Press, 2000.
Stewart, S., J. Neumann, C. Knittel, and J. Heisler. “Absence of Value: An Analysis of Investment Allocation Decisions by Institutional Plan Sponsors.” Financial Analysts Journal, Vol. 65, No. 6 (2009), pp. 34-51.
To order reprints of this article, please contact Dewey Palmieri at [email protected] or 212-224-3675.