baghouse design for milk powder collection
TRANSCRIPT
Baghouse Design for Milk Powder
Collection
James Litchwark
This thesis has been prepared in partial fulfilment of the requirements for a PhD at the
University of Canterbury, New Zealand.
Abstract
This thesis aims to improve the understanding of the factors that determine the performance
of baghouses used for milk powder collection. The research focuses specifically on the
similarities and differences between milk powder collection and other common baghouse
applications. The thesis also aims to demonstrate the value of recent developments in
computational fluid dynamics in developing predictive models of baghouse performance. It is
hoped that the findings of the thesis may find application in the New Zealand dairy industry,
where such baghouses are commonly used to collect milk powder after spray drying.
The effect of operating temperature and humidity on the performance of baghouses was
investigated by examining both the forward filtration process and pulse cleaning process.
Forward filtration was examined in a series of bench scale experiments, then scaled up to the
pilot scale to confirm the findings. The effect of humidity on the pulsing performance was
then investigated at the pilot scale.
The importance of pulse system design was investigated at the pilot scale in a separate set of
experiments. Pulse nozzle position, pulse pressure, and pulse duration were varied and the
effect on the baghouse pressure differentials was measured.
A computational fluid dynamics (CFD) filter model designed for membrane filtration was
adapted with some success to simulate a milk powder baghouse. The model was successful in
predicting the length of the low pressure zone at the top of the bag, and the general trends in
overpressure associated with changes to the pulse system geometry. The model was not
successful in predicting the acceleration of the filter bag during the pulse. The model was
used to simulate both forward filtration and pulsing, to extend the results of the experimental
investigation. The effects of changes in the pulse nozzle height, pulse nozzle diameter, and
pulse pressure were simulated, as well as the effect of gravitational settling during forward
filtration, to extend the results of the previous experiments. There is a clear opportunity
remaining for further work to extend the basic model developed here and to adapt the model
to simulate large industrial baghouses.
Experiments on the bench scale and pilot scale indicated that increased cohesive forces
between particles improve the performance of milk powder baghouses by lowering the
resistance of the filter cake during forward filtration and aiding cake removal during pulse
cleaning. Under the conditions typical of industrial milk powder baghouses, cohesive forces
are governed primarily by liquid bridging between particles, due to melted fat (particularly at
high temperatures) and softened lactose (at high humidity levels). As a range of milk powders
with different compositions are produced commercially, the relative importance of lactose-
based and fat-based cohesion differs between powder types. Cohesion promotes the
formation of porous structures in the filter cake, improving the cake permeability. In skim
milk powder (SMP), particle cohesion is dominated by softened lactose, and is highly
moisture dependent. In the bench scale experiments conducted here, increasing the relative
humidity from 6% to 17% decreased the specific cake resistance from 1.69×10⁹ m.kg
-1 to
8.23×10⁸ m.kg
-1, and decreased the proportion of powder adhering to the filter from 14% of
the total supplied powder to 3%. The combination of these effects decreased the total
resistance over the filter from 1.09×10⁹ m
-1 to 1.89×10
8 m
-1, an 83% reduction. The low
deposition at high humidity suggested that the porous cake structure formed at high humidity
levels was fragile, so that deposited particles were prone to subsequent dislodgement,
especially in areas where the shear velocity near the filter surface was high. In pilot scale
experiments, the porous cake structure formed at high humidity was more easily removed
from the filter bag, resulting in more effective pulse cleaning. It was concluded that particle
cohesion promoted cake filtration over depth filtration, as particles tended to adhere to the
cake surface immediately upon contact. As depth filtered particles are more difficult to
remove, the shift toward cake filtration at high humidity improved the pulse cleaning
performance. A high-fat milk protein concentrate (MPC) powder was also filtered on the
bench scale apparatus. Particle cohesion in the MPC powder was dominated by liquid fat, and
showed a clear dependence on temperature but not on humidity. Increasing the temperature
from 30°C to 90°C caused the specific cake resistance of the MPC to decrease from
1.06×10⁸ m
-1 to 3.94×10
7 m
-1, a 63% decrease. The deposition of MPC powder was
unaffected by either temperature or humidity.
Gravitational settling of particles in large baghouses was found to produce significant
variations in the properties of the filter cake throughout the baghouse. Experimental results
with the pilot scale baghouse found a strong decreasing trend in the particle size with
increasing height in the baghouse, with the mean particle size decreasing from 117 μm at the
bottom of the baghouse to only 31 μm near the top of the filter bag. The filter cake thickness
also decreased sharply with height. Results from the CFD simulations indicated that in the
pilot scale baghouse particles larger than 120 μm in diameter tend to fall out of the air flow
and collect in the bottom of the baghouse, instead of depositing on the filter. While industrial
baghouses tend to have a higher elutriation velocity than the pilot scale baghouse used in this
study, the large size of industrial baghouses provides ample opportunity for particles to
segregate on the basis of size. In addition, bench scale results indicated that high air velocities
near the filter surface may cause particles to rebound from the filter. This may occur in
industrial baghouses in the region near the inlet, where the air velocity is highest.
The reverse pressure differential induced in the filter bag by a cleaning pulse was found to
increase with distance from the cell plate. Positioning the nozzle too close to the bag opening
created a low pressure zone just beneath the cell plate, where the pressure remained lower
inside the bag than outside throughout the pulse. This may lead to poor cleaning at the top of
the bag. In the pilot scale baghouse, positioning the nozzle at least 0.7 m from the bag
opening eliminated the low pressure zone. The optimum distance of 0.7 m is is dependent on
the nozzle type and bag diameter, but can be directly applied to recent industrial baghouse
designs in the NZ dairy industry, which have the same nozzle type and bag diameter as the
pilot scale baghouse.
The design of the pulse cleaning system is important in achieving good baghouse
performance. Increasing the pulse tank pressure on the pilot scale baghouse from 3.5 bar to
6.5 bar caused a 30% reduction in the forward pressure differential after the pulse, while
decreasing the pulse pressure below 3.5 bar caused the pressure differentials to increase
indefinitely. Altering the nozzle position had no effect on the overall pressure differentials,
but did alter the local acceleration at different points on the filter bag during a pulse. CFD
simulations indicated that decreasing the distance between the nozzle and the bag opening
from 0.7 m to 0.1 m increased the overpressure at the bottom of the bag from 770 Pa to
3500 Pa, but this was offset by the appearance of the low pressure zone at the top of the bag
as mentioned above. CFD simulations indicated that the diameter of the pulse nozzle altered
both the mean bag overpressure generated by the pulse, and the distribution of the
overpressure over the bag surface, with the low pressure zone at the top of the bag becoming
longer at large nozzle diameters. The pulse duration was found to be unimportant, with
experiments on the pilot scale baghouse finding that this had no effect on either the overall
baghouse pressure differentials or the length of the low pressure zone at the top of the bag.
The project has extended the understanding of milk powder baghouse performance by
relating the moisture-dependent properties of lactose and the temperature-dependent melting

of dairy fats to baghouse performance. The project has also provided a useful design tool in
the form of the CFD model. The project demonstrates an opportunity for further CFD
research into baghouse design, as the basic model developed here could now be modified to
directly simulate large industrial baghouses. It is hoped that the results from this thesis will
find application in the New Zealand Dairy Industry.

Acknowledgements
I would like to thank my university supervisor, Justin Nijdam, for support at every point
along the way, including securing funding at the start of the project, reading over all my work
and providing valuable insight and feedback (a big task), and sharing your experiences of
academia. Thanks also to my co-supervisor, James Winchester, for sharing your knowledge
of the dairy industry, and for always remaining positive and showing interest in my work.
I would like to thank the technical staff at UC, in particular Tim Moore, Leigh Richardson,
and Stephen Beuzenberg, who have provided invaluable assistance in setting up my
experiments and keeping things running smoothly. Thanks also to David Fletcher for
providing all kinds of assistance with the CFD modelling (including providing your filter
model Fortran codes), and to Scott Nelson for helping to run experiments on the bench scale
filter rig. Thanks also to Simon Litchwark and other friends in the Biology department for
helping me to understand statistical methods.
Financial assistance from the Ministry of Business, Innovation, and Employment, and from
Fonterra Ltd has been greatly appreciated – without this the project would never have even
begun.
Finally, thank you to all my friends and family who have kept me sane along the way, and
also to the fellow postgraduate students who shared their experiences and reminded me that I
was not alone.
Contents
1. Introduction 1
1.1 Overview ......................................................................................................................... 1
1.1 The New Zealand Dairy Industry ................................................................................. 1
1.2 Milk Powder Baghouses ................................................................................................ 2
1.3 Rationale ......................................................................................................................... 4
1.4 Scope of This Thesis ....................................................................................................... 5
2. Background 7
2.1 Baghouses ........................................................................................................................ 7
2.1.1 Principles of separation 8
2.1.2 Baghouse Types 10
2.1.3 Filter Bags 14
2.2 Previous Baghouse Research ....................................................................................... 17
2.2.1 Powder and Gas Properties 17
2.2.2 Pulsing 19
2.2.3 Filter Materials 20
2.3 Dairy Powders .............................................................................................................. 21
2.3.1 Milk 21
2.3.2 Dairy Powders 22
2.4 Milk Powder Research ................................................................................................. 25
2.4.1 Spray Drying 25
2.4.2 Milk Powder Stickiness 25
2.5 Modelling....................................................................................................................... 30
2.5.1 Filtration Theory 30
2.5.2 General Baghouse Modelling 32
2.5.3 Computational Fluid Dynamics 34
2.6 Conclusions ................................................................................................................... 35
3. Filtration Investigation 36
3.1 Introduction .................................................................................................................. 36
3.2 Apparatus ...................................................................................................................... 38
3.2.1 Bench Scale Filtration Rig 38
3.2.2 Pilot Scale Baghouse 43
3.3 Materials ....................................................................................................................... 49
3.3.1 Powders 49
3.3.2 Filter fabric 51
3.4 Methods ......................................................................................................................... 51
3.4.1 Temperature Variation 51
3.4.2 Humidity Variation Investigation 53
3.4.3 Pilot Scale Filtration Runs 54
3.4.4 Particle Size Investigation 56
3.5 Results and Discussion ................................................................................................. 57
3.5.1 Temperature Variation 57
3.5.2 Humidity Variation 67
3.5.3 Pilot Scale Filtration Runs 72
3.5.4 Comparison of Powders 77
3.5.5 Particle Size Investigation 79
3.5.6 Analysis of Assumptions 84
3.5.7 Noise Investigation 85
3.5.8 General Discussion 89
3.6 Conclusions ................................................................................................................... 94
4. Pulse Cleaning Optimisation 95
4.1 Introduction .................................................................................................................. 95
4.2 Materials and Methods ................................................................................................ 98
4.2.1 Pulse Tank Pressure 101
4.2.2 Pulse Nozzle Height 101
4.2.3 Pulse Duration 102
4.2.4 Humidity 102
4.2.5 Analysis 104
4.3 Results and Discussion ............................................................................................... 107
4.3.1 Pulse Pressure 107
4.3.2 Pulse Nozzle Height 111
4.3.3 Pulse Duration 114
4.3.4 Humidity 118
4.3.5 General Discussion 123
4.4 Conclusions ................................................................................................................. 125
5. CFD Modelling of a Pilot Scale Baghouse 126
5.1 Introduction ................................................................................................................ 126
5.2 Geometry and Mesh Creation ................................................................................... 128
5.3 Porous Filter Model ................................................................................................... 132
5.4 Boundary Conditions ................................................................................................. 135
5.5 Mesh Dependence Study ............................................................................................ 137
5.6 Timestep ...................................................................................................................... 145
5.7 Experimental Validation ........................................................................................... 147
5.7.1 Methods 147
5.7.2 Results 153
5.8 Conclusions ................................................................................................................. 170
6. Baghouse Simulations 171
6.1 Introduction ................................................................................................................ 171
6.2 Methods ....................................................................................................................... 172
6.2.1 Particle Tracking Investigation 175
6.2.2 Pulse Pressure 176
6.2.3 Pulse Nozzle Height 176
6.2.4 Pulse Nozzle Diameter 177
6.2.5 Filter resistance 177
6.2.6 Temperature and Humidity 178
6.3 Results ......................................................................................................................... 178
6.3.1 Particle Tracking 178
6.3.2 Pulse Pressure 183
6.3.3 Pulse Nozzle Height 186
6.3.4 Pulse Nozzle Diameter 190
6.3.5 Filter resistance 195
6.3.6 Temperature 196
6.3.7 General Discussion 198
6.4 Conclusions ................................................................................................................. 202
7. Conclusions and Recommendations 203
7.1 Recommendations for Industry ................................................................................ 205
8. References 207
Appendix 1 - CFD Theory 1
Appendix 2 - Statistics 22
Appendix 3 – Publications 26

Nomenclature
Roman Symbols
A Coefficient matrix in CFD solver
A Area (m2)
Ac Coefficient matrix for coarse grid in CFD solver
Ai Area of a single mesh cell face (m2)
aij Single element of A
aw Water activity (dimensionless)
b Result vector of the matrix equation in the CFD solver
b* Intermediate result vector calculated from intermediate solution y
bi Single element of b
Cμ, C1ε, C2ε Constants in the k-ε turbulence model (dimensionless)
ci Baghouse inlet stream dust concentration (kg.m-3
)
D Diffusivity of a general property (units vary)
dbag Diameter of the filter bag (m)
dx, dy, dz Differential dimensions in a Cartesian co-ordinate system
E Total energy (J)
e Vector of error terms in CFD solver
hn Nozzle height in pulse cleaning system (m)
I Internal energy density (J.kg-1
)
J Mass flux (kg.s-1
m-2
)
K Kinetic energy density of the mean flow (J.kg-1
)
k Thermal conductivity (W.m-1
K-1
)
k’ Instantaneous turbulent kinetic energy (J.kg-1
)
kd Deposition ratio (dimensionless)
kG constant in Gordon-Taylor equation (dimensionless)
L Filter thickness (m)
m Mass of fluid (kg)
ni Vector normal to a mesh cell face
Npulse Pulse number (from start of run)
p Pressure (Pa)
P Time-average pressure (Pa)

p’ Pressure fluctuation (Pa)
PT Tank pressure for pulse cleaning system (Pa)
Q Volumetric flow (m3s
-1)
r Vector of residuals in CFD solver
Rc Filter cake resistance (m-1
)
Rf Filter fabric resistance (m-1
)
ri Residuals in curve-fitting experimental data (dimensionless)
RT Total resistance across the filter (m-1
)
Sφ Source term in generalised transport equation (units vary)
SE Source term in total energy equation (J.kg-1
)
SI Source term in internal energy equation (J.kg-1
)
sij Deformation rate in a turbulent flow (s-1
)
Sij Time-averaged component of the deformation rate in a turbulent flow (s-1
)
Fluctuating component of the deformation rate in a turbulent flow (s
-1)
Smx, Smy, Smz Source terms in momentum equations (kg.m-2
s-2
)
t time (s)
T Temperature (K)
tc Cycle time for pulse cleaning (s)
td Pulse duration (s)
Tg Glass transition temperature (K)
Tg,w, Tg,s Glass transition temperatures in Gordon-Taylor equation (K)
U Time-average velocity vector (m.s-1
)
u Velocity vector (m.s-1
)
U Time-average velocity component in the x-direction (m.s-1
)
u velocity component in the x-direction (m.s-1
)
u’ Velocity vector fluctuation (m.s-1
)
u’ Fluctuating velocity component in the x-direction (m.s-1
)
V Time-average velocity component in the y-direction (m.s-1
)
v velocity component in the y-direction (m.s-1
)
v’ Fluctuating velocity component in the y-direction (m.s-1
)
vf Filtration velocity (m.s-1
)
VP Volume of a mesh cell (m3)
W Time-average velocity component in the z-direction (m.s-1
)
w Velocity component in the z-direction (m.s-1
)
w’ Fluctuating velocity component in the z-direction (m.s-1
)
ww, ws Mass ratios in Gordon-Taylor equation (dimensionless)
x True solution vector in CFD solver
xi Single experimental measurement (units vary)
xj Single element of x
x Group mean – average of duplicates in experimental data (units vary)
y Intermediate solution vector in CFD solver
Greek Symbols
α Specific cake resistance (m.kg-1
)
αr Relaxation parameter in CFD solver (dimensionless)
β Energy dissipation function
β1, β* Constants in k-ω turbulence model (dimensionless)
β2 Constant in the SST turbulence model (dimensionless)
γ1 Constant in the k-ω turbulence model (dimensionless)
γ2 Constant in the SST turbulence model (dimensionless)
Kronecker delta (dimensionless)
ΔP, ΔPtotal Filter pressure differential (Pa)
ΔPcake Contribution of the filter cake to the pressure differential (Pa)
ΔPfilter Contribution of the filter fabric to the pressure differential (Pa)
Δx CFD mesh spacing (m)
Δt CFD timestep (s)
ε Turbulence energy dissipation per unit mass (J.kg-1
s-1
)
κ Filter permeability (m2)
λ Viscosity term for volumetric deformations (Pa.s)
μ Dynamic viscosity (Pa.s)
μt Eddy viscosity (Pa.s)
ρ Density (kg.m-3
)
σk, σε Constants in the k-ε turbulence model (dimensionless)
σω Constant in the k-ω turbulence model (dimensionless)
σω,1, σω,2 Constants in the SST turbulence model (dimensionless)
τxx, τxy etc. Viscous stress tensors (Pa)

φ General fluid property (units vary)
Φ Time-average of general fluid property (units vary)
φ’ Fluctuation in general fluid property (units vary)
ω Turbulence frequency (Hz)
Abbreviations
2-D Two-dimensional
AIC Akaike information criterion
ANOVA Analysis of variance (statistical method)
CEL CFX expression language
CFD Computational fluid dynamics
CIP Clean-in-place
DNS Direct numerical simulation
FMG Full multi-grid (CFD solution method)
GGI General grid interface
ID Internal diameter
MCMC Markov chain Monte Carlo (sampling method)
MPC, MPC42 Milk protein concentrate
PDE Partial differential equation
PID Proportional-integral-derivative (controller)
PLC Programmable logic controller
PSD Particle size distribution
PTFE Polytetrafluoroethylene
QQ plot Quantile-quantile plot (statistical method)
RANS Reynold’s averaged Navier-Stokes
RH Relative humidity
RMS Root mean square
RTD Resistance temperature detector
SMP Skim milk powder
SST Shear Stress Transport (turbulence model)
TDMA Tri-diagonal matrix algorithm
VOC Volatile organic compound
VSD Variable speed drive

1
1. Introduction
1.1 Overview
This thesis is aimed at improving the understanding of the factors that influence the
performance of pulse jet baghouses used for milk powder collection. Baghouses are
commonly used in the New Zealand dairy industry to collect milk powder after spray drying,
and it is hoped that an improved understanding will lead to reduced operating costs and
improved product quality from these baghouses. This work aims to address some particular
concerns of immediate relevance to industry. The work was funded through a partnership
between the University of Canterbury and Fonterra Ltd. Fonterra operates several milk
powder plants around New Zealand, and the results from this project are likely to be
employed in those plants.
1.1 The New Zealand Dairy Industry
Dairying in New Zealand began in 1814, when missionary Samuel Marsden brought a bull
and two heifers into the country (New Zealand Ministry for Primary Industries, 2013;
Stringleman & Scrimgeour, 2012). The first dairy factories opened in the 1880’s
(Stringleman & Scrimgeour, 2012). The emergence of refrigerated shipping around the same
time made it possible to export a wide range of dairy products, firmly establishing an export
trade. The industry has grown steadily ever since, to the point where New Zealand is now the
world’s eighth largest milk producer, with an annual production in 2013 of 18.9 billion litres
of milk (DairyNZ, 2013), representing around 2.5% of global production (Hemme, 2013).
The dairy industry is New Zealand’s largest export industry, and makes up around 25% of
merchandise export earnings (New Zealand Trade and Enterprise, 2013).
New Zealand’s largest dairy company, Fonterra, was formed in 2001 by the merger of the
two largest cooperatives, New Zealand Dairy Group and Kiwi Cooperative Dairies, along
with the New Zealand Dairy Board, which was a marketing and export agent for all
cooperatives. Fonterra now processes around 95% of the New Zealand milk supply,
amounting to 22 billion litres annually (Fonterra, 2014). Fonterra is also the world’s largest
2
dairy exporter, responsible for around one third of global cross-border dairy trade (Fonterra,
2012).
For historical reasons (mainly geographical isolation, and consequent long shipping times),
most of New Zealand’s exports are shelf stable products. Spray dried milk powder is the most
significant export product, making up 45% of New Zealand’s total dairy exports, with butter
and cheese making up another 30% (Coriolis Ltd., 2010).
1.2 Milk Powder Baghouses
Baghouses are used in the dairy industry to collect milk powder downstream of a spray drier.
In all spray driers, a proportion of the powder is collected at the bottom of the drier chamber,
while a proportion of the powder is entrained in the outlet air from the drier and must be
removed by downstream collection equipment. There are two major systems in use in New
Zealand: older plants use a combined cyclone/baghouse collection system, while newer plants
use a baghouse-only collection system.
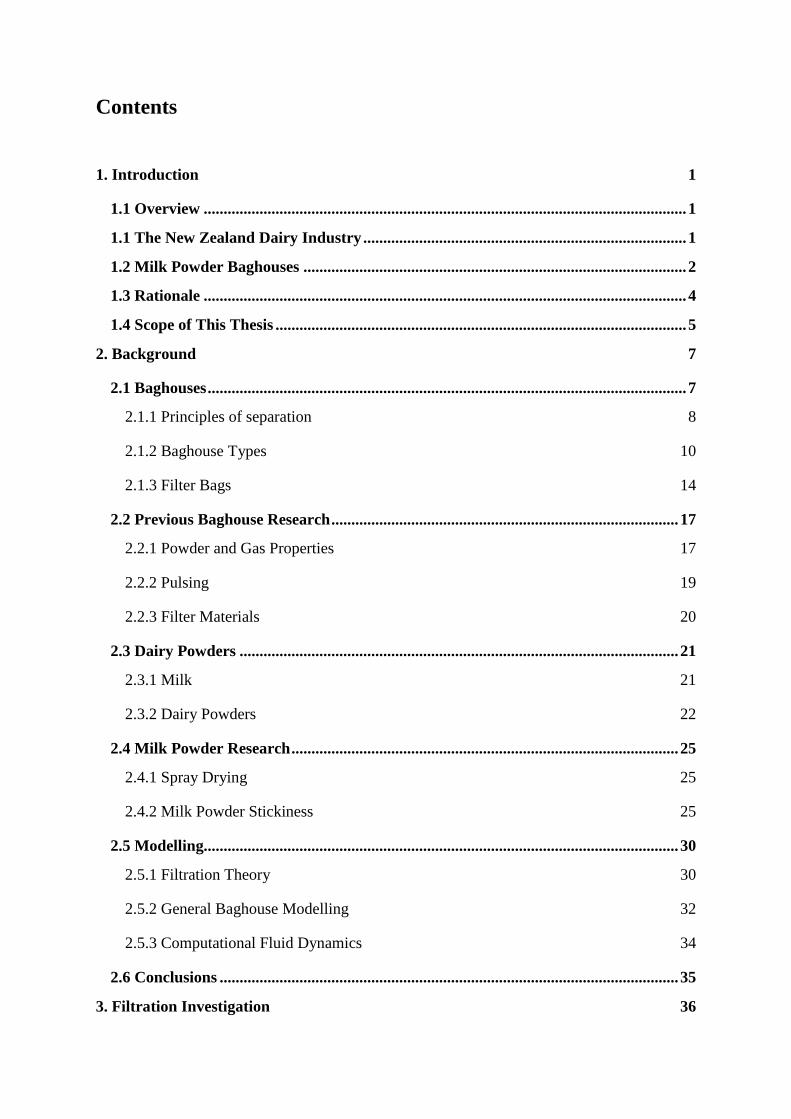
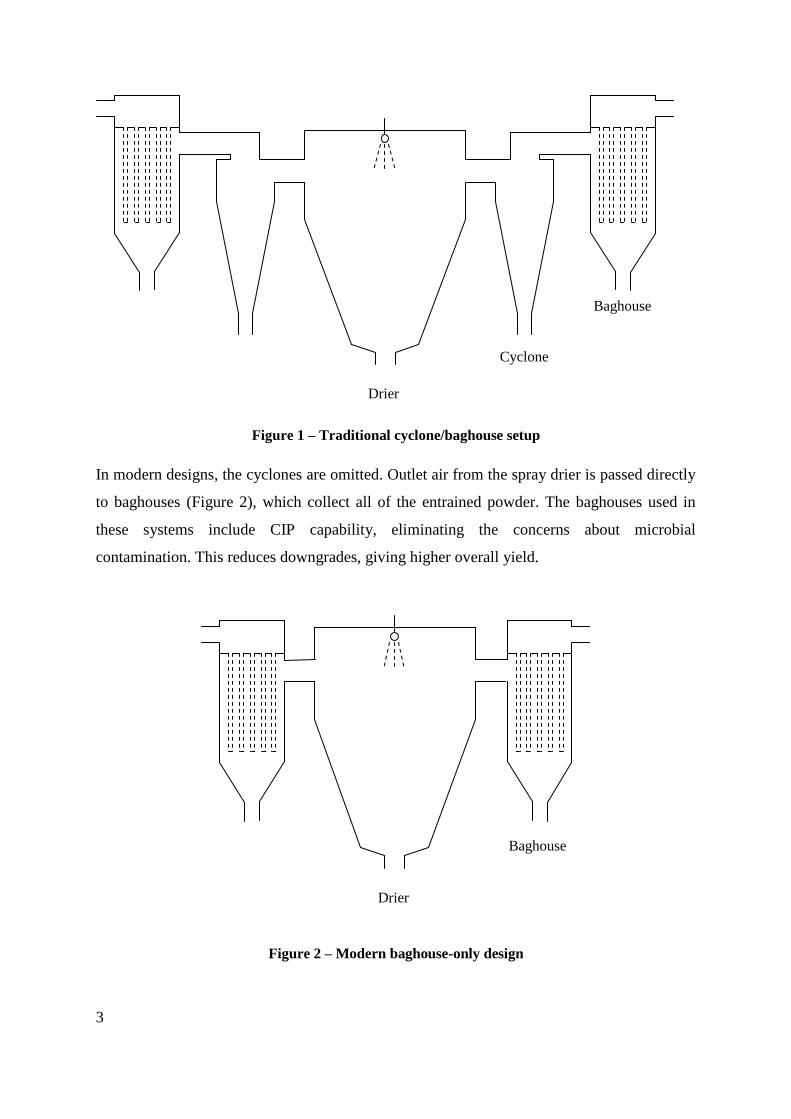
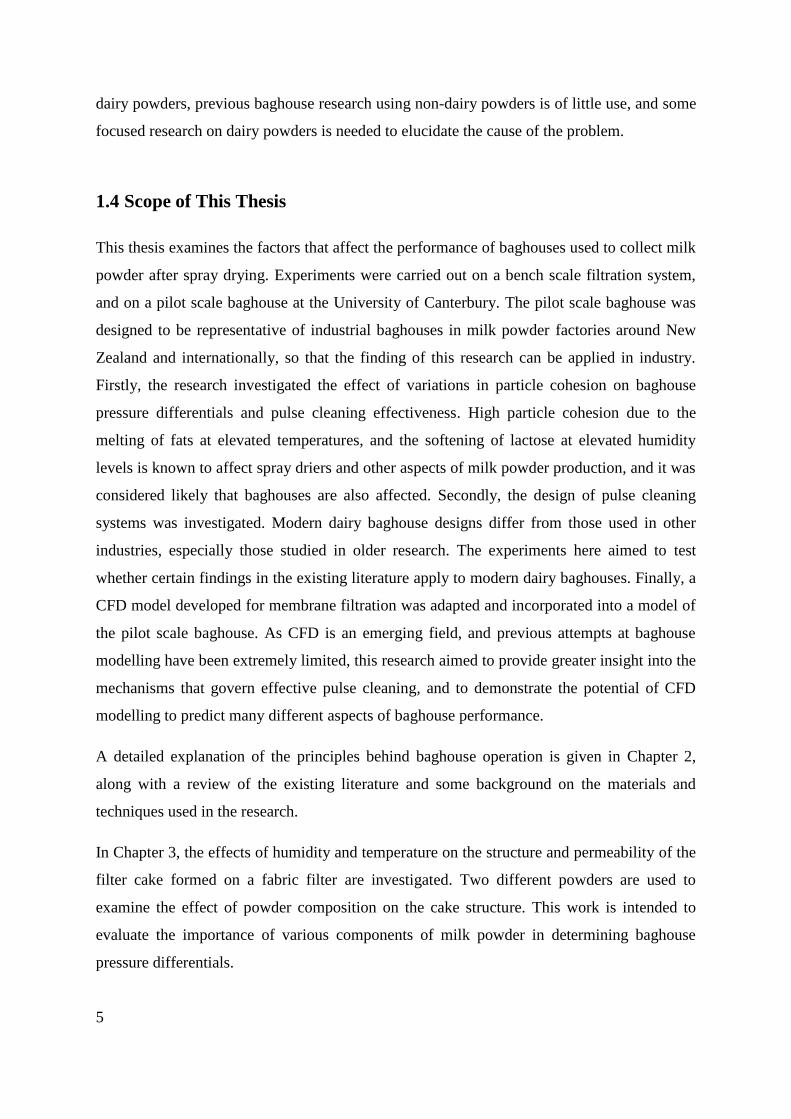
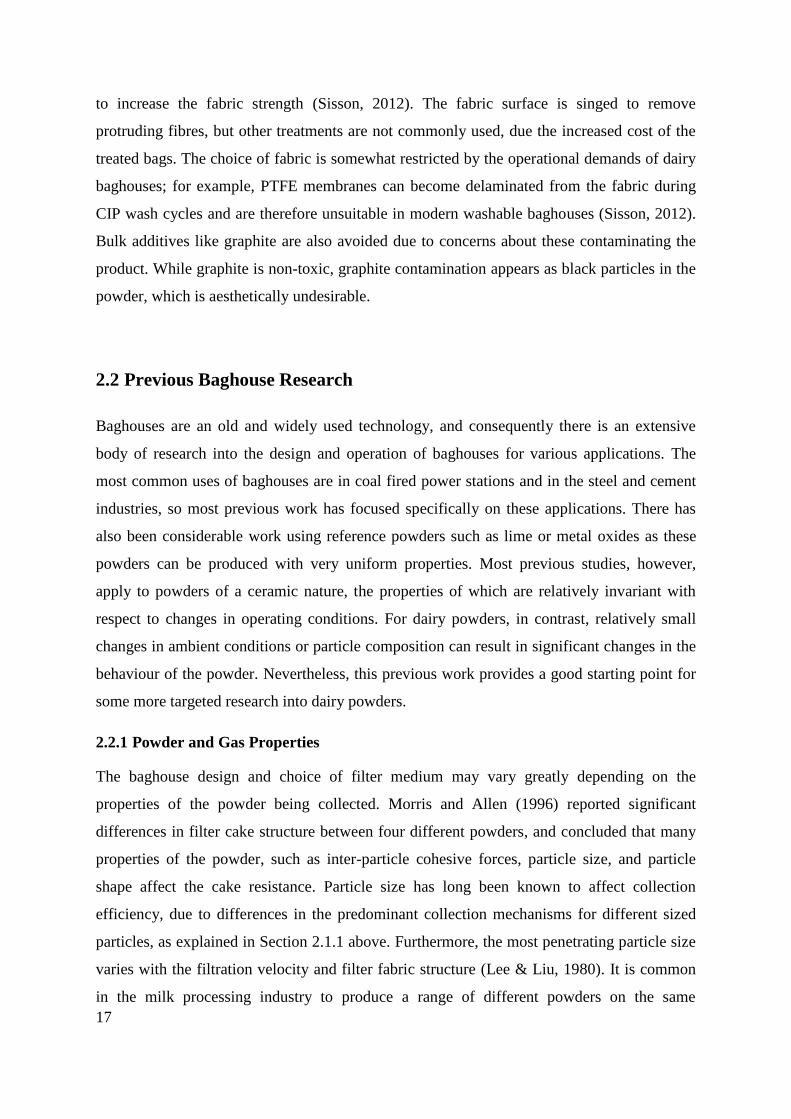
In cyclone/baghouse systems, outlet air from the spray drier is passed to cyclones (Figure 1),
which remove the bulk of the entrained powder (~98%). The outlet air from the cyclones is
then passed through baghouses, which remove the remaining powder. The baghouses used in
these systems are fairly simple, and generally do not include clean-in-place (CIP) capability.
These baghouses are therefore thought to be a potential source of microbial contamination,
and so the powder from these baghouses is considered of low quality and is frequently
downgraded to stock food.
3
Figure 1 – Traditional cyclone/baghouse setup
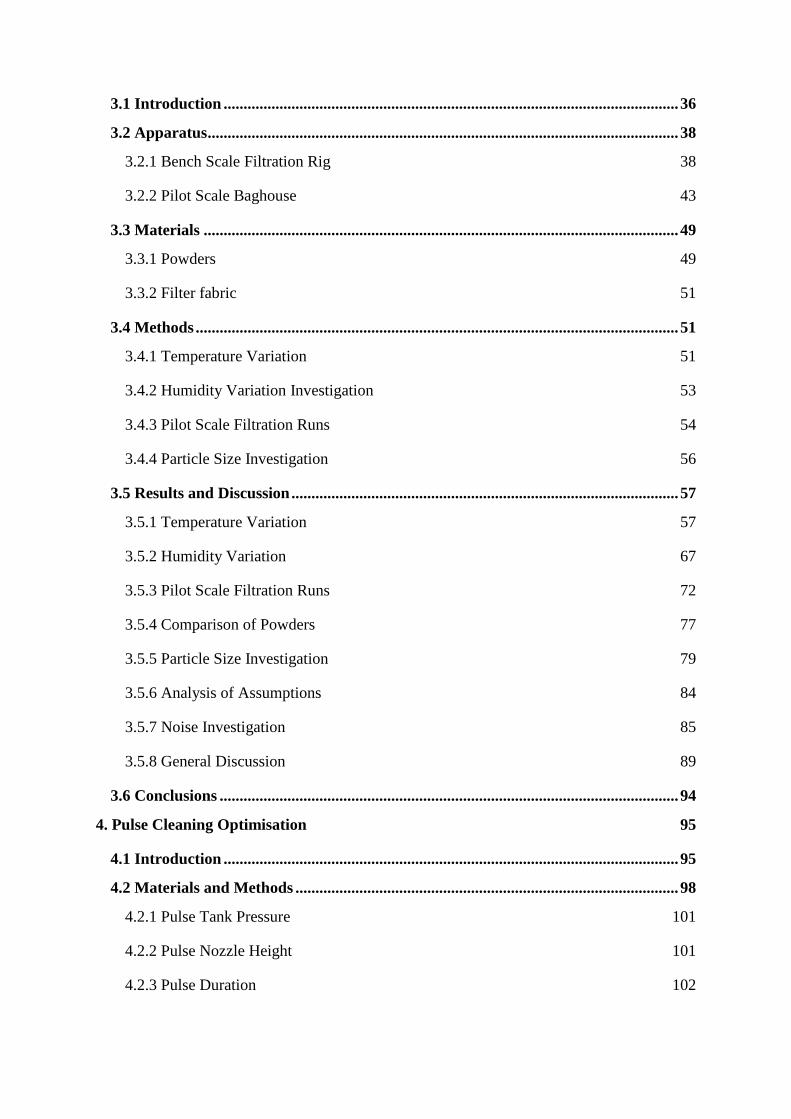
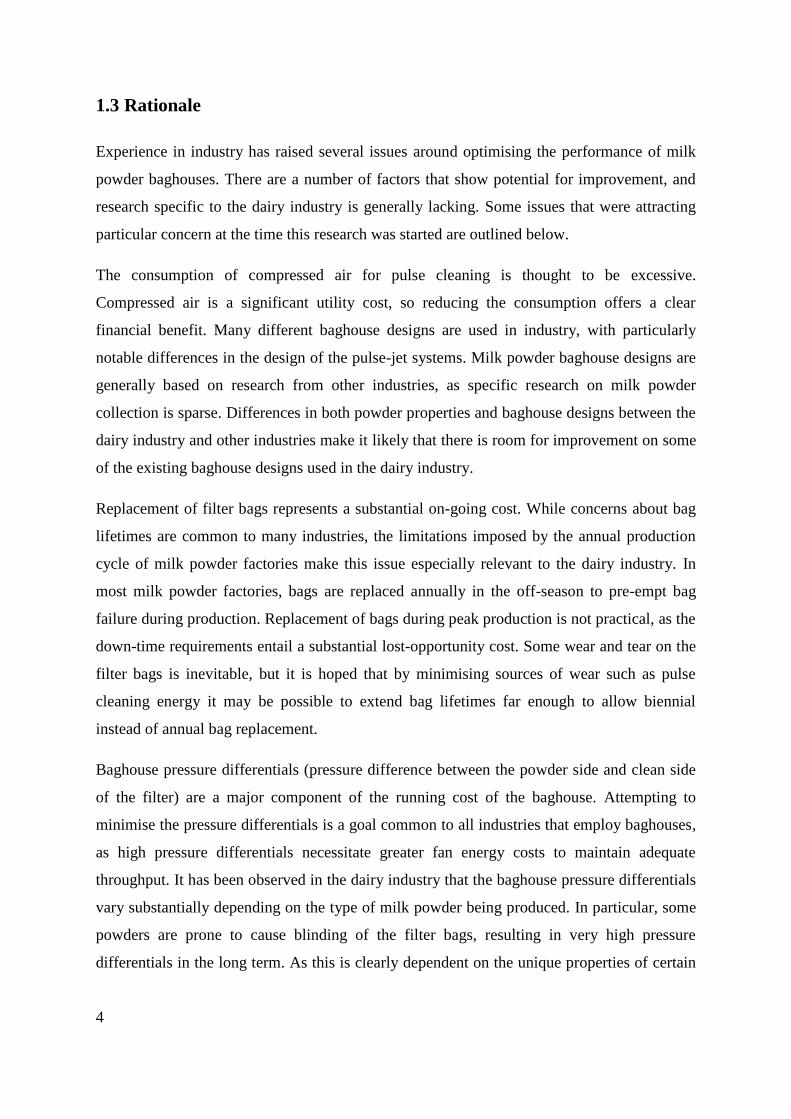
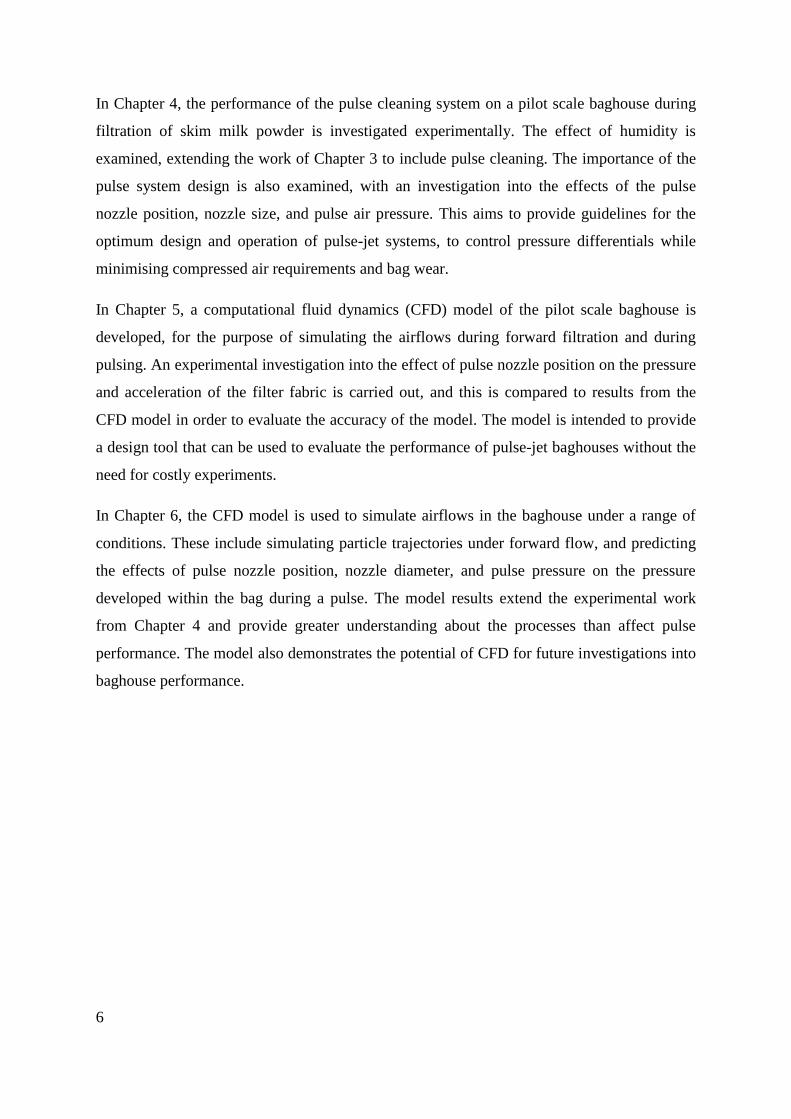
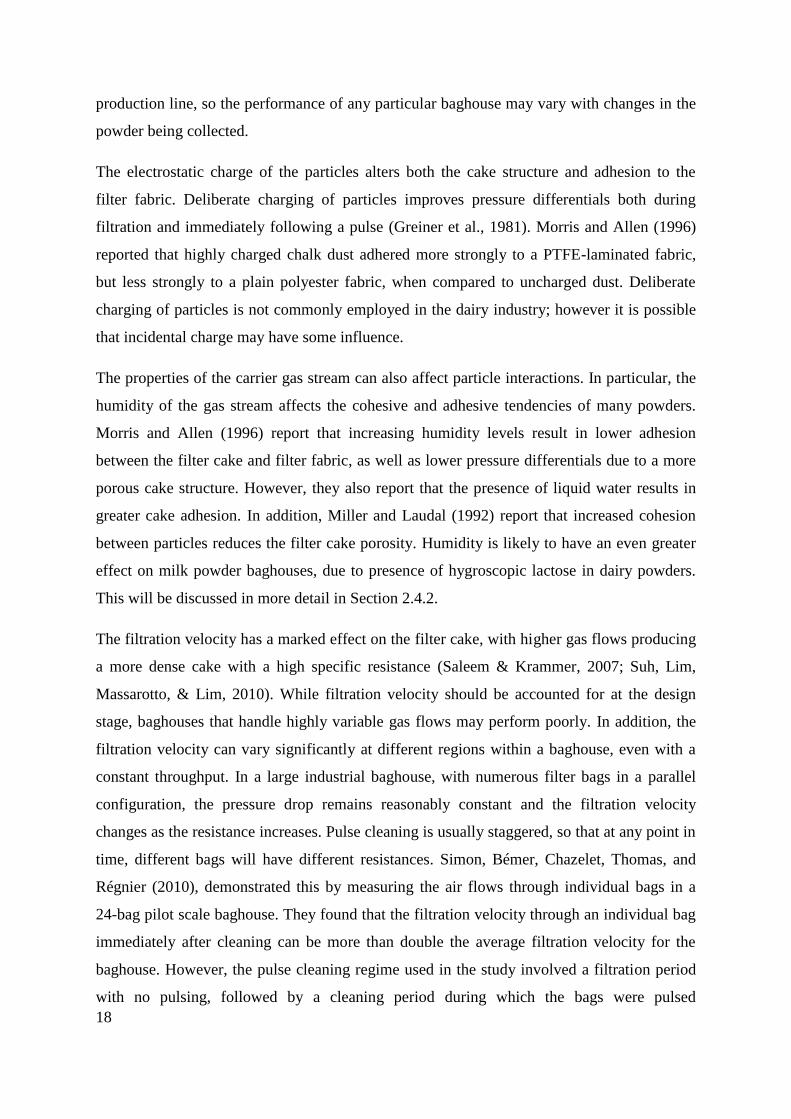
In modern designs, the cyclones are omitted. Outlet air from the spray drier is passed directly
to baghouses (Figure 2), which collect all of the entrained powder. The baghouses used in
these systems include CIP capability, eliminating the concerns about microbial
contamination. This reduces downgrades, giving higher overall yield.
Figure 2 – Modern baghouse-only design
Drier
Cyclone
Baghouse
Drier
Baghouse
4
1.3 Rationale
Experience in industry has raised several issues around optimising the performance of milk
powder baghouses. There are a number of factors that show potential for improvement, and
research specific to the dairy industry is generally lacking. Some issues that were attracting
particular concern at the time this research was started are outlined below.
The consumption of compressed air for pulse cleaning is thought to be excessive.
Compressed air is a significant utility cost, so reducing the consumption offers a clear
financial benefit. Many different baghouse designs are used in industry, with particularly
notable differences in the design of the pulse-jet systems. Milk powder baghouse designs are
generally based on research from other industries, as specific research on milk powder
collection is sparse. Differences in both powder properties and baghouse designs between the
dairy industry and other industries make it likely that there is room for improvement on some
of the existing baghouse designs used in the dairy industry.
Replacement of filter bags represents a substantial on-going cost. While concerns about bag
lifetimes are common to many industries, the limitations imposed by the annual production
cycle of milk powder factories make this issue especially relevant to the dairy industry. In
most milk powder factories, bags are replaced annually in the off-season to pre-empt bag
failure during production. Replacement of bags during peak production is not practical, as the
down-time requirements entail a substantial lost-opportunity cost. Some wear and tear on the
filter bags is inevitable, but it is hoped that by minimising sources of wear such as pulse
cleaning energy it may be possible to extend bag lifetimes far enough to allow biennial
instead of annual bag replacement.
Baghouse pressure differentials (pressure difference between the powder side and clean side
of the filter) are a major component of the running cost of the baghouse. Attempting to
minimise the pressure differentials is a goal common to all industries that employ baghouses,
as high pressure differentials necessitate greater fan energy costs to maintain adequate
throughput. It has been observed in the dairy industry that the baghouse pressure differentials
vary substantially depending on the type of milk powder being produced. In particular, some
powders are prone to cause blinding of the filter bags, resulting in very high pressure
differentials in the long term. As this is clearly dependent on the unique properties of certain
5
dairy powders, previous baghouse research using non-dairy powders is of little use, and some
focused research on dairy powders is needed to elucidate the cause of the problem.
1.4 Scope of This Thesis
This thesis examines the factors that affect the performance of baghouses used to collect milk
powder after spray drying. Experiments were carried out on a bench scale filtration system,
and on a pilot scale baghouse at the University of Canterbury. The pilot scale baghouse was
designed to be representative of industrial baghouses in milk powder factories around New
Zealand and internationally, so that the finding of this research can be applied in industry.
Firstly, the research investigated the effect of variations in particle cohesion on baghouse
pressure differentials and pulse cleaning effectiveness. High particle cohesion due to the
melting of fats at elevated temperatures, and the softening of lactose at elevated humidity
levels is known to affect spray driers and other aspects of milk powder production, and it was
considered likely that baghouses are also affected. Secondly, the design of pulse cleaning
systems was investigated. Modern dairy baghouse designs differ from those used in other
industries, especially those studied in older research. The experiments here aimed to test
whether certain findings in the existing literature apply to modern dairy baghouses. Finally, a
CFD model developed for membrane filtration was adapted and incorporated into a model of
the pilot scale baghouse. As CFD is an emerging field, and previous attempts at baghouse
modelling have been extremely limited, this research aimed to provide greater insight into the
mechanisms that govern effective pulse cleaning, and to demonstrate the potential of CFD
modelling to predict many different aspects of baghouse performance.
A detailed explanation of the principles behind baghouse operation is given in Chapter 2,
along with a review of the existing literature and some background on the materials and
techniques used in the research.
In Chapter 3, the effects of humidity and temperature on the structure and permeability of the
filter cake formed on a fabric filter are investigated. Two different powders are used to
examine the effect of powder composition on the cake structure. This work is intended to
evaluate the importance of various components of milk powder in determining baghouse
pressure differentials.
6
In Chapter 4, the performance of the pulse cleaning system on a pilot scale baghouse during
filtration of skim milk powder is investigated experimentally. The effect of humidity is
examined, extending the work of Chapter 3 to include pulse cleaning. The importance of the
pulse system design is also examined, with an investigation into the effects of the pulse
nozzle position, nozzle size, and pulse air pressure. This aims to provide guidelines for the
optimum design and operation of pulse-jet systems, to control pressure differentials while
minimising compressed air requirements and bag wear.
In Chapter 5, a computational fluid dynamics (CFD) model of the pilot scale baghouse is
developed, for the purpose of simulating the airflows during forward filtration and during
pulsing. An experimental investigation into the effect of pulse nozzle position on the pressure
and acceleration of the filter fabric is carried out, and this is compared to results from the
CFD model in order to evaluate the accuracy of the model. The model is intended to provide
a design tool that can be used to evaluate the performance of pulse-jet baghouses without the
need for costly experiments.
In Chapter 6, the CFD model is used to simulate airflows in the baghouse under a range of
conditions. These include simulating particle trajectories under forward flow, and predicting
the effects of pulse nozzle position, nozzle diameter, and pulse pressure on the pressure
developed within the bag during a pulse. The model results extend the experimental work
from Chapter 4 and provide greater understanding about the processes than affect pulse
performance. The model also demonstrates the potential of CFD for future investigations into
baghouse performance.
7
2. Background
2.1 Baghouses
Baghouses are a form of fabric filtration, and are one of the oldest and most efficient forms of
separating solid particles from gas flows (Mycock, McKenna, & Theodore, 1995). The filter
medium is a woven or felted fabric arranged into long tubular elements (bags). A typical
baghouse consists of numerous filter bags arranged within a large housing to maximise
filtration area in a given volume (Rhodes, 1990; Turner, McKenna, Mycock, & Nunn, 1998).
Baghouses offer very high collection efficiencies, often better than 99.9% (Croom, 1995;
Turner et al., 1998), and are highly scalable (Cheremisinoff, 2000), so they are suitable for a
wide range of applications, from dust collection in small woodworking workshops to product
collection at huge spray drying facilities such as milk powder plants. A key parameter in
scaling baghouses is the air/cloth ratio, or superficial filtration velocity. This is defined as the
ratio of the volumetric airflow through the baghouse to the total filter area. The optimum
air/cloth ratio depends on the application, and on other constraints such as the amount of
space available. A higher air/cloth ratio means that the baghouse will be smaller, and will
therefore have a lower capital cost; however, a high air/cloth ratio also results in a higher
pressure drop across the filter during operation (Davis, 2000), and therefore a higher
operating cost. Typical values range from 0.01 to 0.04 m.s-1
, but may be as high as 0.08 m.s-1
for some applications (Croom, 1995).
Historically, baghouses have been unsuited to high temperature applications, as natural fibre
and polymer based bags are damaged by excessive temperature. However, developments in
metallic and ceramic bags have extended the useful temperature range, so the range of
applications for which baghouses can be used is always growing (Croom, 1995; Davis, 2000;
Purchas & Sutherland, 2001). Ceramic filter bags are currently available to suit temperatures
up to 370°C (3M Ltd, 2005; Midwesco Filter Resources Inc., 2009).
The performance of a baghouse is a complex concept that must account for many factors,
depending on the application. For pollution control applications, the emissions on the
downstream side are the main concern, while for food and dairy applications, quality and
yield of the collected dust are very important. Ultimately, obtaining good baghouse
performance requires meeting these basic requirements of the process, while minimising the
8
associated costs. Costs include the initial capital cost, and on-going operating costs such as
energy usage for fans and pulse air, regular replacement of worn bags, and other
maintenance.
2.1.1 Principles of separation
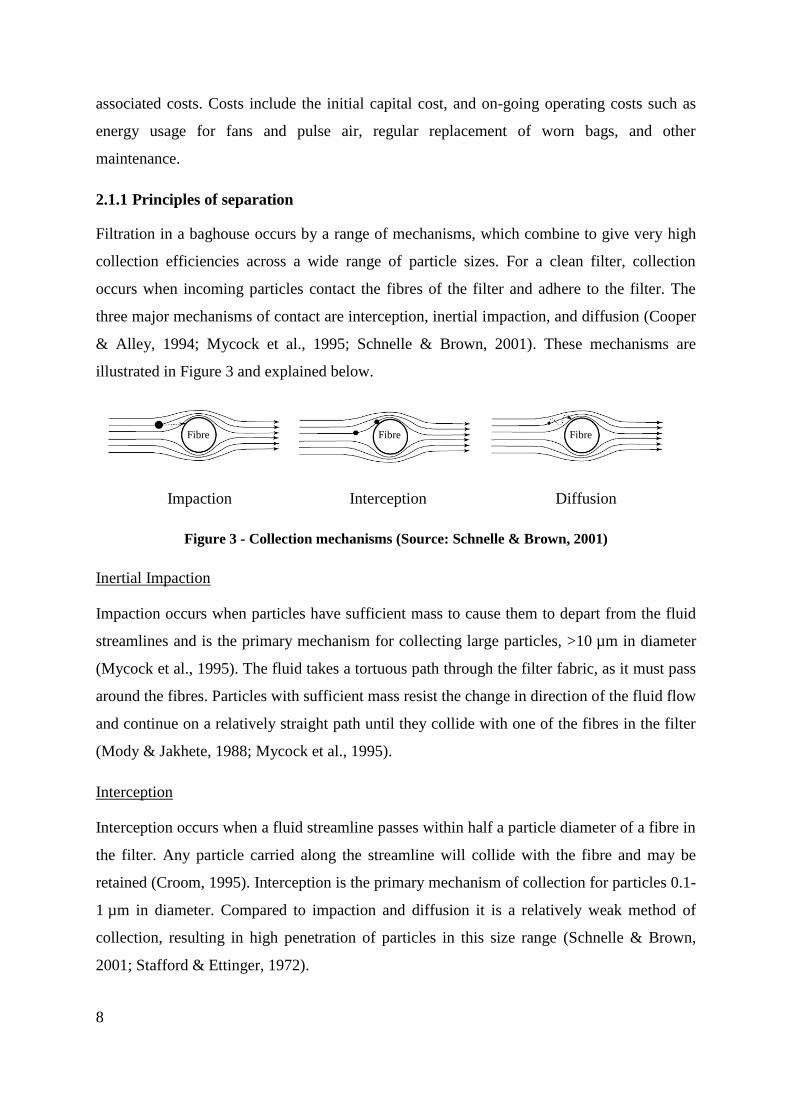
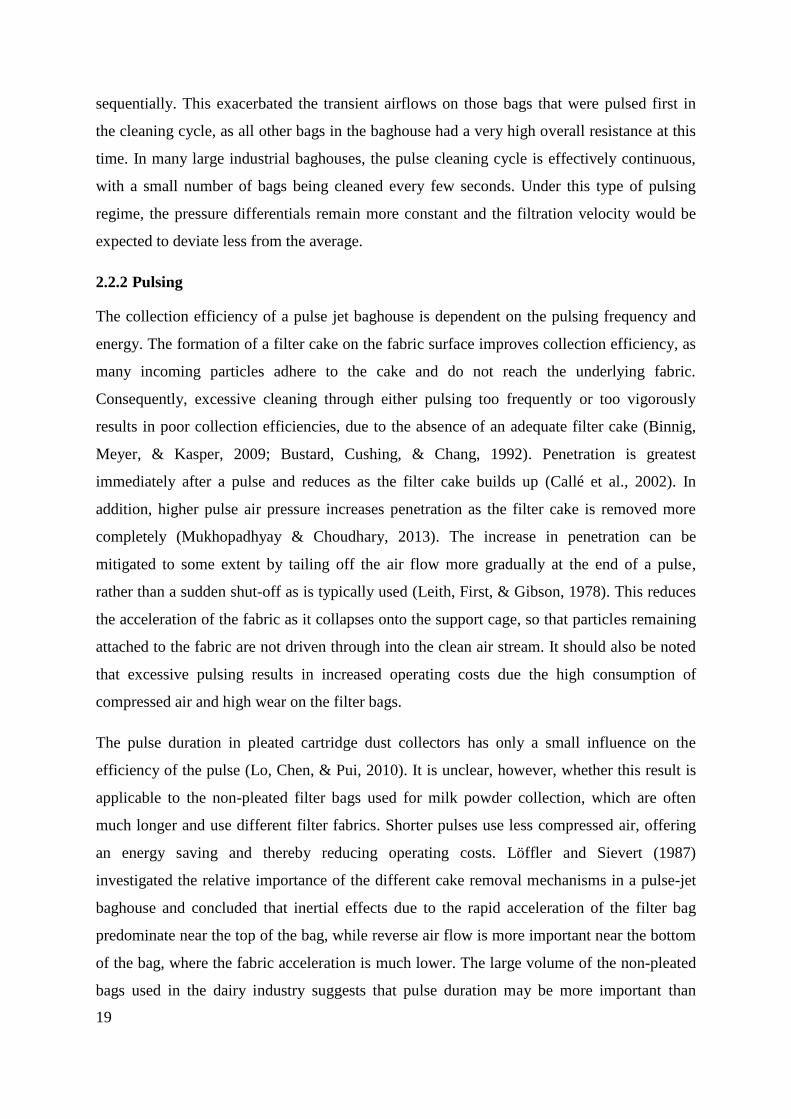
Filtration in a baghouse occurs by a range of mechanisms, which combine to give very high
collection efficiencies across a wide range of particle sizes. For a clean filter, collection
occurs when incoming particles contact the fibres of the filter and adhere to the filter. The
three major mechanisms of contact are interception, inertial impaction, and diffusion (Cooper
& Alley, 1994; Mycock et al., 1995; Schnelle & Brown, 2001). These mechanisms are
illustrated in Figure 3 and explained below.
Impaction Interception Diffusion
Figure 3 - Collection mechanisms (Source: Schnelle & Brown, 2001)
Inertial Impaction
Impaction occurs when particles have sufficient mass to cause them to depart from the fluid
streamlines and is the primary mechanism for collecting large particles, >10 µm in diameter
(Mycock et al., 1995). The fluid takes a tortuous path through the filter fabric, as it must pass
around the fibres. Particles with sufficient mass resist the change in direction of the fluid flow
and continue on a relatively straight path until they collide with one of the fibres in the filter
(Mody & Jakhete, 1988; Mycock et al., 1995).
Interception
Interception occurs when a fluid streamline passes within half a particle diameter of a fibre in
the filter. Any particle carried along the streamline will collide with the fibre and may be
retained (Croom, 1995). Interception is the primary mechanism of collection for particles 0.1-
1 µm in diameter. Compared to impaction and diffusion it is a relatively weak method of
collection, resulting in high penetration of particles in this size range (Schnelle & Brown,
2001; Stafford & Ettinger, 1972).
Fibre Fibre Fibre
9
Diffusion
Diffusion is the primary collection mechanism for very small particles (<0.1 µm). These
particles have very little inertia and tend to follow the fluid path, rather than impacting the
filter fibres (Mycock et al., 1995). However, these particles are light enough to be influenced
by the random movement of molecules in the gas. This causes the particles to move randomly
within the fluid flow, and this movement can result in the particles colliding with the fibres in
the filter (Mycock et al., 1995; Schnelle & Brown, 2001).
Cake Filtration
The above mechanisms relate mainly to filtration on a clean filter, where collection relies on
the particles colliding with the filter fibres. As filtration progresses, however, a layer of
particles builds up on the surface of the filter, known as the filter cake (Davis, 2000).
Incoming particles are then mostly retained in the filter cake, with very few particles reaching
the filter fabric. This is known as cake filtration, and is responsible for the very high
collection efficiencies (>99.9%) that baghouses attain (Cooper & Alley, 1994; Kouimtzis &
Samara, 1995). It is thought that the primary mechanism of collection in the filter cake is
sieving, whereby many of the incoming particles are simply too large to fit through the pores
in the filter cake (Davis, 2000; Mycock et al., 1995).
Other Mechanisms
Several other mechanisms may also contribute to the efficiency of a baghouse. Electrostatic
charge can result in attractive forces, encouraging agglomeration of particles and adherence
to the filter (Croom, 1995; Schnelle & Brown, 2001). In some applications, electrostatic
charge is deliberately employed to enhance the collection efficiency of the baghouse
(Darcovich, Jonasson, & Capes, 1997; Greiner, Furlong, VanOsdell, & Hovis, 1981).
Gravitational settling can also cause very large particles to settle out of the gas stream
without even contacting the filter (Croom, 1995; Darcovich et al., 1997), although this is
usually only significant with particles greater than 50 µm in diameter (Kouimtzis & Samara,
1995). In some applications, the filter may be pre-loaded with a powder cake, usually an inert
substance such as lime, to avoid emissions of harmful particulates during start-up. (Callé,
Contal, Thomas, Bémer, & Leclerc, 2002; Croom, 1995).
10
2.1.2 Baghouse Types
Baghouses are typically classified according to the method used to remove the filter cake
from the bags (Davis, 2000). As the filter cake builds up, the resistance to air flow increases,
so that a higher pressure differential is required to maintain flow through the bags. To keep
the resistance within reasonable levels, the filter cake must be periodically removed from the
filter (Mody & Jakhete, 1988). In milk powder plants, the filter cake is also a valuable
product, which will degrade in the baghouse if it is not removed regularly, so it is even more
important to have an effective cake removal method in place.
Cake removal can be done using either a “clean-on-time” regime or a “clean-on-demand”
regime (Rhodes, 1990). In a clean-on-time regime, the cleaning cycle takes place at regular
time intervals, independent of the powder load and pressure differentials. In a clean-on-
demand regime, the filter is cleaned when the flow resistance across the filter reaches a pre-
determined maximum, so the time between cleaning cycles varies, depending on the powder
loading (Rhodes, 1990). In applications with variable dust loadings, clean-on-demand designs
can offer reduced wear and longer bag lifetimes than clean-on-time systems (Sjöholm et al.,
2001).
There are several common cleaning mechanisms used in industrial baghouses. Each method
has advantages and disadvantages, depending on the type of powder being collected, the
temperature and composition of the gas stream, and baghouse size constraints. The most
common filter cleaning systems are explained below.
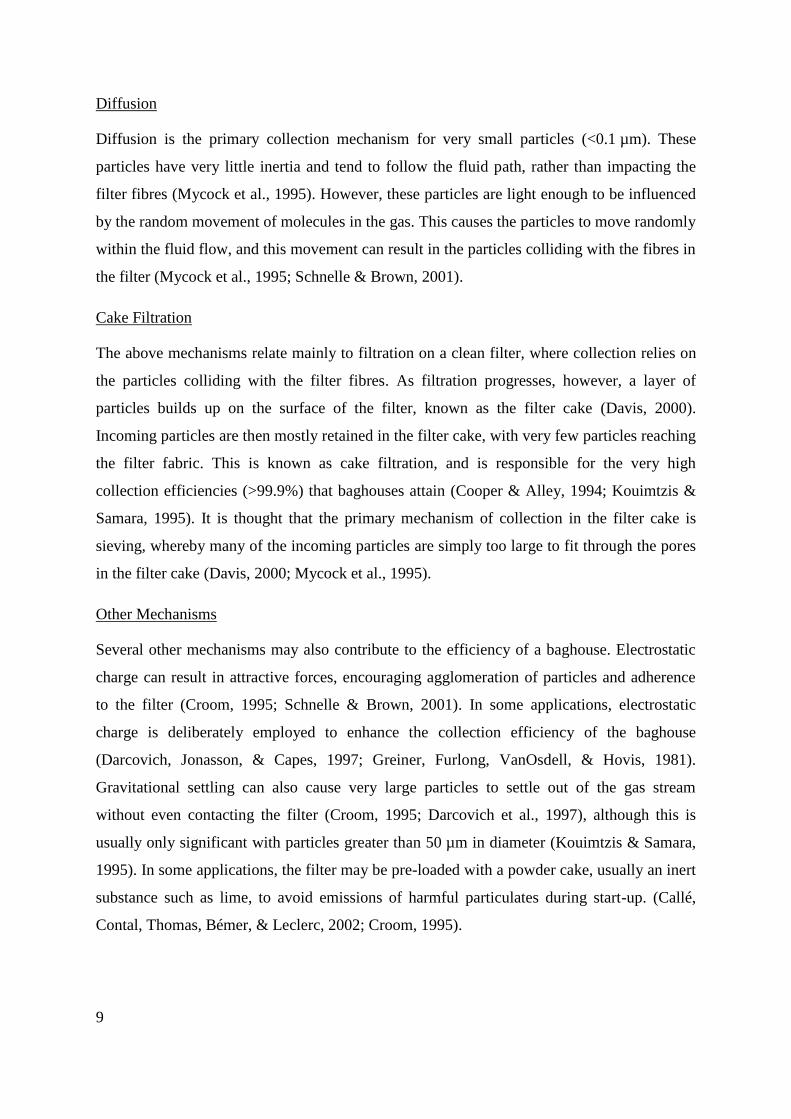
Shaker
In a shaker baghouse, shown in Figure 4, the bags are positioned with the open ends at the
bottom fitted into a holding plate, and the filter cake is collected on the inside of the bags
(Davis, 2000; Mycock et al., 1995). The closed ends at the top are attached to a shaking
mechanism, which periodically shakes the bags to dislodge the filter cake (Mycock et al.,
1995). This system is very simple to implement, however it can be ineffective with powders
that adhere strongly to the filter fabric, as the force experienced by the filter cake is limited.
The low cleaning energy leaves a significant amount of residual dust cake on the filter after
cleaning, so that high collection efficiencies are maintained (Hesketh, 1996). A major feature
of shaker baghouses is that the airflow must be stopped during the shaking process, as even a
slight positive airflow can cause re-entrainment of the powder and severely reduce the
11
effectiveness of the cleaning (Mody & Jakhete, 1988; Mycock et al., 1995). To get around
this problem, baghouses are compartmentalised, so that while one compartment is cleaned,
the gas flow can be diverted through the other compartments (Mody & Jakhete, 1988;
Mycock et al., 1995) to avoid disruptions to upstream equipment. This adds significantly to
the cost of the baghouse, making shaker baghouses relatively costly for applications where
continuous operation is required (Moore, Rubak, & Jolin, 1996). Shaking also causes
mechanical stress to the bags which can result in excessive wear compared to other systems
such as reverse air (Croom, 1995; Turner et al., 1998).
Figure 4 - Shaker baghouse (Source: Schnelle & Brown, 2001)
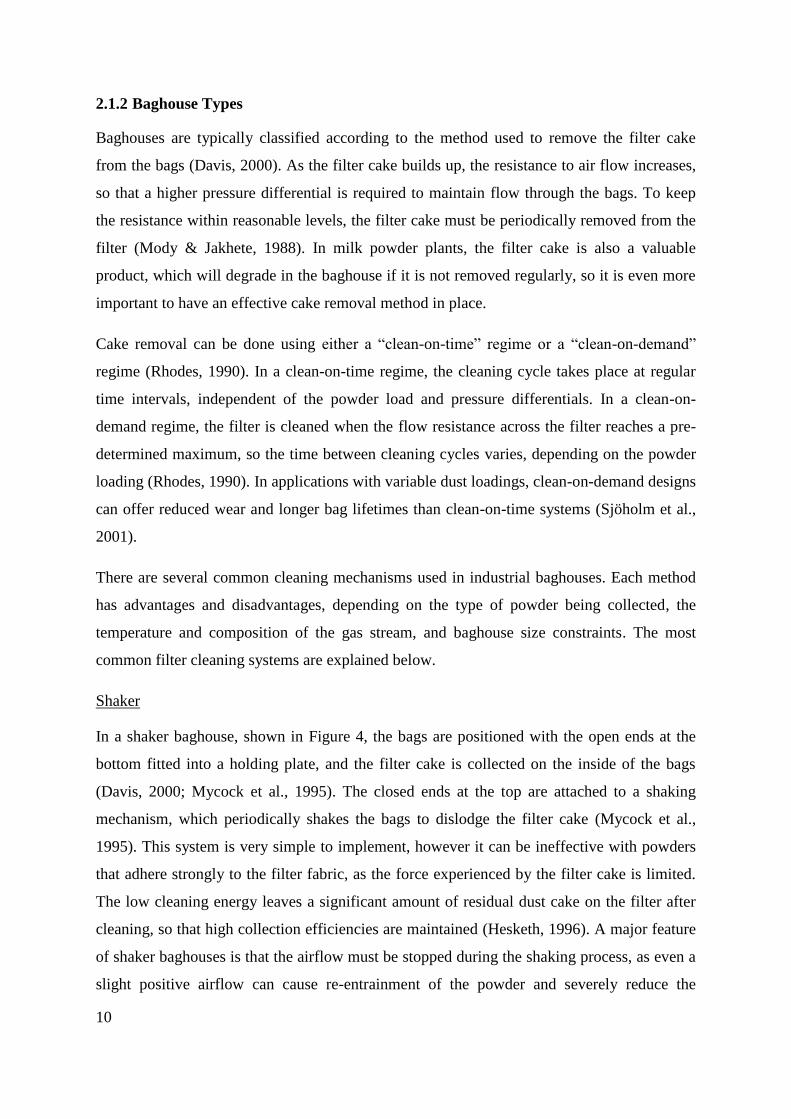
Reverse Air
In this system, the cake is removed by applying a clean air flow in the reverse direction to
filtration. The filter cake is dislodged by a combination of bag deformation and the reversed
pressure differential (Davis, 2000; Mody & Jakhete, 1988). The filter cake is typically
collected on the inside of the bags, as with shaker systems (Hesketh, 1996; Mody & Jakhete,
1988). A diagram of a typical reverse air baghouse is shown in Figure 5. To prevent the bags
from collapsing with the reverse flow, they are supported by rigid rings distributed along the
Shaker mechanism
Clean gas outlet
Gas feed
Hopper
Cell plate
Filter bags
Clean air side
Dirty air side
Inlet baffle
12
length of the bags, and the closed end is tethered to the top of the baghouse (Mody & Jakhete,
1988; Turner et al., 1998). This cleaning method is more complex and more expensive than
the shaker system, as it requires extra fans and ducting to provide the reverse flow (Sjöholm
et al., 2001). As with shaker systems, filtration must be stopped during the cleaning phase, so
reverse air baghouses are compartmentalised to allow continuous operation (Mody & Jakhete,
1988). A rest period is usually allowed between the cleaning cycle and the resumption of
flow to allow the dust to settle and avoid re-entrainment (Croom, 1995). Reverse air is a very
gentle cleaning method, and results in low wear and long bag lifetimes (Schnelle & Brown,
2001; Turner et al., 1998).
Figure 5 - Typical reverse air baghouse (Source: Turner et al., 1998)
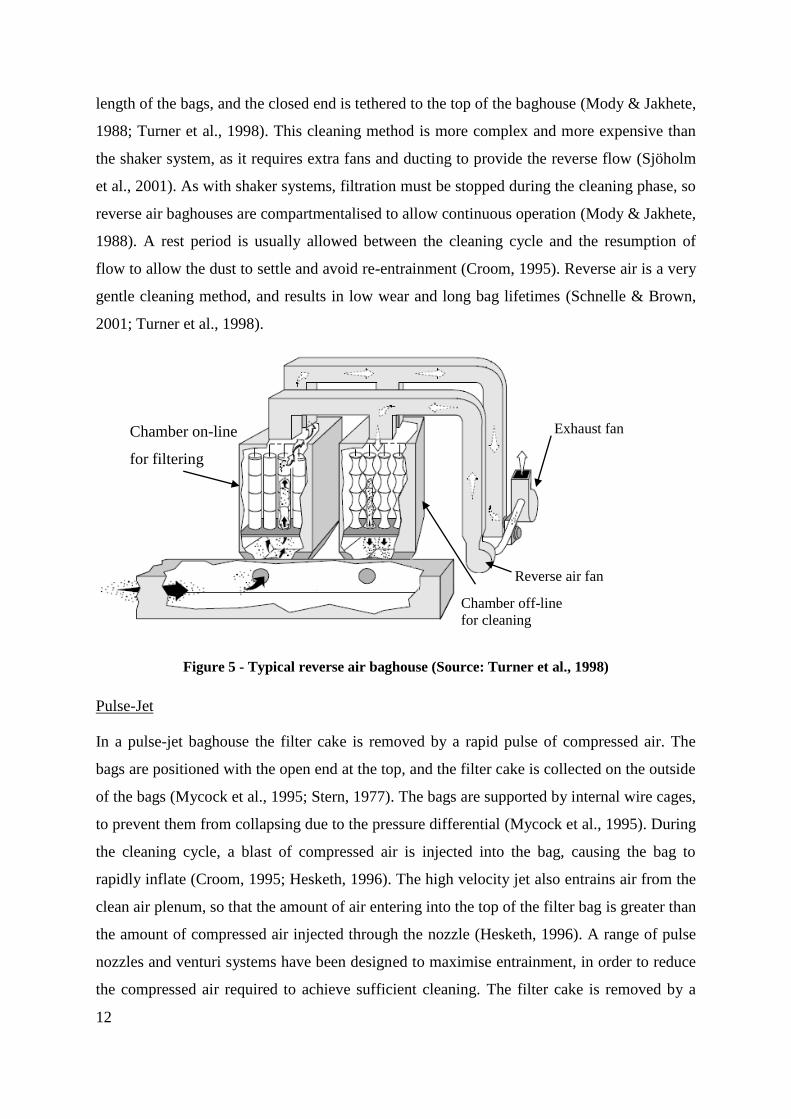
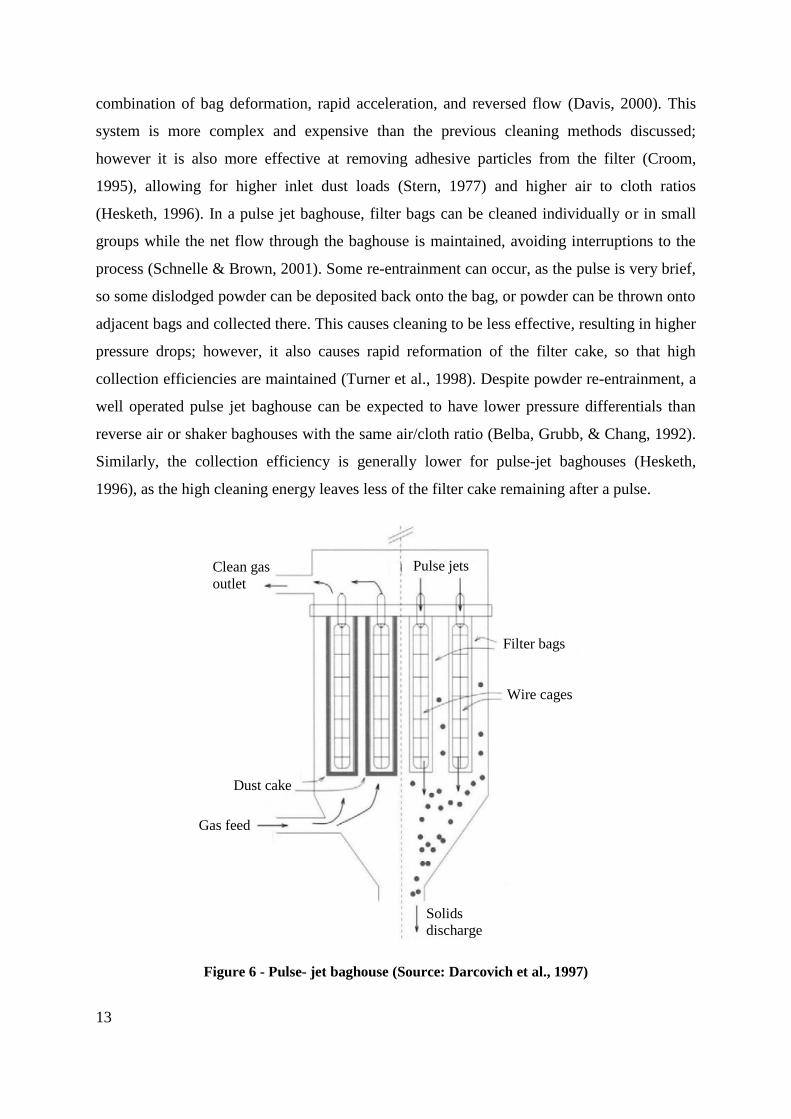
Pulse-Jet
In a pulse-jet baghouse the filter cake is removed by a rapid pulse of compressed air. The
bags are positioned with the open end at the top, and the filter cake is collected on the outside
of the bags (Mycock et al., 1995; Stern, 1977). The bags are supported by internal wire cages,
to prevent them from collapsing due to the pressure differential (Mycock et al., 1995). During
the cleaning cycle, a blast of compressed air is injected into the bag, causing the bag to
rapidly inflate (Croom, 1995; Hesketh, 1996). The high velocity jet also entrains air from the
clean air plenum, so that the amount of air entering into the top of the filter bag is greater than
the amount of compressed air injected through the nozzle (Hesketh, 1996). A range of pulse
nozzles and venturi systems have been designed to maximise entrainment, in order to reduce
the compressed air required to achieve sufficient cleaning. The filter cake is removed by a
Exhaust fan
Chamber off-line
for cleaning
Chamber on-line
for filtering
Reverse air fan
13
combination of bag deformation, rapid acceleration, and reversed flow (Davis, 2000). This
system is more complex and expensive than the previous cleaning methods discussed;
however it is also more effective at removing adhesive particles from the filter (Croom,
1995), allowing for higher inlet dust loads (Stern, 1977) and higher air to cloth ratios
(Hesketh, 1996). In a pulse jet baghouse, filter bags can be cleaned individually or in small
groups while the net flow through the baghouse is maintained, avoiding interruptions to the
process (Schnelle & Brown, 2001). Some re-entrainment can occur, as the pulse is very brief,
so some dislodged powder can be deposited back onto the bag, or powder can be thrown onto
adjacent bags and collected there. This causes cleaning to be less effective, resulting in higher
pressure drops; however, it also causes rapid reformation of the filter cake, so that high
collection efficiencies are maintained (Turner et al., 1998). Despite powder re-entrainment, a
well operated pulse jet baghouse can be expected to have lower pressure differentials than
reverse air or shaker baghouses with the same air/cloth ratio (Belba, Grubb, & Chang, 1992).
Similarly, the collection efficiency is generally lower for pulse-jet baghouses (Hesketh,
1996), as the high cleaning energy leaves less of the filter cake remaining after a pulse.
Figure 6 - Pulse- jet baghouse (Source: Darcovich et al., 1997)
Dust cake
Filter bags
Wire cages
Pulse jets
Solids
discharge
Gas feed
Clean gas
outlet
14
Other Cleaning Methods
While the three cleaning methods described above cover the vast majority of industrial
baghouses, various other methods have also been developed. These methods have either been
made obsolete by the major cleaning methods listed above, or are used only for highly
specific applications and have therefore not achieved widespread commercial use (Mycock et
al., 1995). These methods include high frequency agitation of the filter through mechanical
vibrators or sonic horns, blow-ring cleaning, where a jet ring is moved up and down the bag
with a chain or cable system, and simple manual cleaning, where the filters are manually
beaten or even removed from the baghouse and cleaned (Mycock et al., 1995). In food
processing applications, it is also common to include clean-in-place (CIP) systems, which
provide a more thorough cleaning than the typical dust removal methods. CIP cleaning
involves shutting down and thoroughly washing the baghouse with water and various
cleaning chemicals. This is costly and time-consuming, and is used only occasionally, when a
mishap causes severe blocking of the filter, or when microbiological contamination threatens
product quality.
2.1.3 Filter Bags
The size and shape of the filter bags depends on the application. Longer filter bags have
greater filter area, meaning that fewer bags are required. This reduces the footprint of the
baghouse and makes bag replacement easier. In pulse jet baghouses, long bags are difficult to
clean, as the pulse dissipates as it travels down the bag (Cooper & Alley, 1994). Also, in
designs where the bags are only secured at one end, longer bags are more prone to movement.
The movement can allow the bags to rub together, increasing wear (Gabites, 2007). The
optimal bag size must therefore reflect a balance between these factors.
Filter bags can be made from a wide range of materials, depending on the application for
which they are intended. Selection of the appropriate filter media is key to obtaining good
performance (Croom, 1995). Filter selection must take into account temperature and moisture
levels, gas stream chemistry, particle properties such as size and abrasiveness, air to cloth
ratio, and mechanical factors relating to the baghouse design (Barnett, 2000). Historically,
filters were made from natural fibres such as cotton and wool. These materials are still in use,
however they have been largely superseded by synthetic fibres, which are more adaptable to
wide ranges of temperature and pH (Kouimtzis & Samara, 1995).
15
One of the major differences in fabric types is the option of woven or non-woven fabrics.
Woven fabrics offer low resistance to flow and good release characteristics, and are
commonly used for reverse air and shaker baghouses (Mycock et al., 1995). Non-woven
fabric types have higher resistance to flow, but offer longer bag lifetimes (Mycock et al.,
1995) and higher collection efficiencies (Croom, 1995), and are commonly used in pulse jet
baghouses.
For applications with high fines (<1 µm) and low moisture levels, pleated cartridges are often
used (Moore et al., 1996). These are produced as one-piece units, with the filter medium
moulded into a plastic support structure. Pleated cartridges use a spun-bonded polyester filter
medium, which is rigid enough to maintain the pleated structure without the need for a
backing material (Barnett, 2000). The pleats greatly increase the available filter area, offering
high air flow capacity with a minimum housing size. The spun-bonded media also has a tight
pore structure which resists particle penetration, offering higher collection efficiencies and
lower pressure differentials when compared with traditional fabrics (Barnett, 2000). Pleated
cartridges can be difficult to clean, however, as dust can be trapped in the pleats, and they are
therefore not always suitable for applications with sticky powders (Sisson, 2012).
Various treatments and finishes can be applied to the basic fabric to improve various aspects
of the baghouse performance. Treatments are post-weaving modifications that affect the
entire fabric, whereas finishes are post-weaving modifications that only affect the surface of
the fabric (Davis, 2000). A range of common treatments and finishes are outlined below.
Bulk Additives
Some fabrics have specific compounds mixed into the bulk of the fabric to impart specific
properties. A common additive is graphite, which improves the electrical conductivity of the
fabric. This dissipates electrical charge and reduces the explosion risk when dealing with
flammable dusts (Sisson, 2012).
Some high performance fabrics use coatings applied to the fibres. In these fabrics, a synthetic
coating, usually PTFE, is applied to the fibres prior to felting, forming a thin film over the
fibre surface (Sisson, 2012). These coatings can improve the fabric strength and cake release
characteristics, and may be used in conjunction with the surface treatments mentioned below.
While this treatment offers great benefits over the lifetime of a baghouse, it is not commonly
used due to the high cost of the treated fabric (Sisson, 2012).
16
Heat Setting
Heat setting involves exposing the fabric to temperatures higher than those experienced
during service (Davis, 2000). This stabilizes the fabric and reduces shrinkage during service
(Menardi, 2003).
Singeing
Fabrics produced from short fibres often have fibres protruding from the surface, which can
impede cake dislodgement. Fabrics may be passed over a flame or a hot roller to burn away
these fibres, resulting in a smoother fabric surface (Lydon, 2004).
Calendaring
Calendaring is a common treatment for synthetic fabrics and involves passing the fabric
between heated rollers, with the speed and pressure tailored to give the desired effect (Lydon,
2004). This smoothes the surface, improving cleanability, and reduces pore size, improving
the collection efficiency, although it also reduces the filter permeability (Lydon, 2004).
Calendaring fuses the fibres together, reducing friability, although excessive calendaring can
weaken the fabric (Weigert & Ripperger, 1997).
Membrane Laminates
During the initial stages of filtration, prior to the formation of a filter cake, fine particles can
penetrate the filter. These particles are difficult to remove with pulsing, and result in blinding
of the filter medium. In addition, some of these particles can pass right through the filter,
adding to emissions in the cleaned air stream (Barnett, 2000). To reduce blinding and
improve the collection efficiency at this initial stage, synthetic PTFE membranes such as
Gore-Tex can be laminated onto the bag fabric (Davis, 2000; Sisson, 2012). These
membranes have a very small pore size, and arrest particles at the surface of the fabric,
preventing penetration (Barnett, 2000). The membrane raises the initial filter resistance
slightly (Davis, 2000), however the reduction in blinding means that the resistance increases
less during operation, so that the resistance may be lower on average over the lifetime of the
bag (Sisson, 2012).
The bags used in the New Zealand dairy industry are simple tubular bags, up to 6 m in length
and made from polyester needlefelts (Gabites, 2007). Needlefelts are non-woven, synthetic
fabrics, although a woven support structure called scrim is included in all pulse cleaned bags
17
to increase the fabric strength (Sisson, 2012). The fabric surface is singed to remove
protruding fibres, but other treatments are not commonly used, due the increased cost of the
treated bags. The choice of fabric is somewhat restricted by the operational demands of dairy
baghouses; for example, PTFE membranes can become delaminated from the fabric during
CIP wash cycles and are therefore unsuitable in modern washable baghouses (Sisson, 2012).
Bulk additives like graphite are also avoided due to concerns about these contaminating the
product. While graphite is non-toxic, graphite contamination appears as black particles in the
powder, which is aesthetically undesirable.
2.2 Previous Baghouse Research
Baghouses are an old and widely used technology, and consequently there is an extensive
body of research into the design and operation of baghouses for various applications. The
most common uses of baghouses are in coal fired power stations and in the steel and cement
industries, so most previous work has focused specifically on these applications. There has
also been considerable work using reference powders such as lime or metal oxides as these
powders can be produced with very uniform properties. Most previous studies, however,
apply to powders of a ceramic nature, the properties of which are relatively invariant with
respect to changes in operating conditions. For dairy powders, in contrast, relatively small
changes in ambient conditions or particle composition can result in significant changes in the
behaviour of the powder. Nevertheless, this previous work provides a good starting point for
some more targeted research into dairy powders.
2.2.1 Powder and Gas Properties
The baghouse design and choice of filter medium may vary greatly depending on the
properties of the powder being collected. Morris and Allen (1996) reported significant
differences in filter cake structure between four different powders, and concluded that many
properties of the powder, such as inter-particle cohesive forces, particle size, and particle
shape affect the cake resistance. Particle size has long been known to affect collection
efficiency, due to differences in the predominant collection mechanisms for different sized
particles, as explained in Section 2.1.1 above. Furthermore, the most penetrating particle size
varies with the filtration velocity and filter fabric structure (Lee & Liu, 1980). It is common
in the milk processing industry to produce a range of different powders on the same
18
production line, so the performance of any particular baghouse may vary with changes in the
powder being collected.
The electrostatic charge of the particles alters both the cake structure and adhesion to the
filter fabric. Deliberate charging of particles improves pressure differentials both during
filtration and immediately following a pulse (Greiner et al., 1981). Morris and Allen (1996)
reported that highly charged chalk dust adhered more strongly to a PTFE-laminated fabric,
but less strongly to a plain polyester fabric, when compared to uncharged dust. Deliberate
charging of particles is not commonly employed in the dairy industry; however it is possible
that incidental charge may have some influence.
The properties of the carrier gas stream can also affect particle interactions. In particular, the
humidity of the gas stream affects the cohesive and adhesive tendencies of many powders.
Morris and Allen (1996) report that increasing humidity levels result in lower adhesion
between the filter cake and filter fabric, as well as lower pressure differentials due to a more
porous cake structure. However, they also report that the presence of liquid water results in
greater cake adhesion. In addition, Miller and Laudal (1992) report that increased cohesion
between particles reduces the filter cake porosity. Humidity is likely to have an even greater
effect on milk powder baghouses, due to presence of hygroscopic lactose in dairy powders.
This will be discussed in more detail in Section 2.4.2.
The filtration velocity has a marked effect on the filter cake, with higher gas flows producing
a more dense cake with a high specific resistance (Saleem & Krammer, 2007; Suh, Lim,
Massarotto, & Lim, 2010). While filtration velocity should be accounted for at the design
stage, baghouses that handle highly variable gas flows may perform poorly. In addition, the
filtration velocity can vary significantly at different regions within a baghouse, even with a
constant throughput. In a large industrial baghouse, with numerous filter bags in a parallel
configuration, the pressure drop remains reasonably constant and the filtration velocity
changes as the resistance increases. Pulse cleaning is usually staggered, so that at any point in
time, different bags will have different resistances. Simon, Bémer, Chazelet, Thomas, and
Régnier (2010), demonstrated this by measuring the air flows through individual bags in a
24-bag pilot scale baghouse. They found that the filtration velocity through an individual bag
immediately after cleaning can be more than double the average filtration velocity for the
baghouse. However, the pulse cleaning regime used in the study involved a filtration period
with no pulsing, followed by a cleaning period during which the bags were pulsed
19
sequentially. This exacerbated the transient airflows on those bags that were pulsed first in
the cleaning cycle, as all other bags in the baghouse had a very high overall resistance at this
time. In many large industrial baghouses, the pulse cleaning cycle is effectively continuous,
with a small number of bags being cleaned every few seconds. Under this type of pulsing
regime, the pressure differentials remain more constant and the filtration velocity would be
expected to deviate less from the average.
2.2.2 Pulsing
The collection efficiency of a pulse jet baghouse is dependent on the pulsing frequency and
energy. The formation of a filter cake on the fabric surface improves collection efficiency, as
many incoming particles adhere to the cake and do not reach the underlying fabric.
Consequently, excessive cleaning through either pulsing too frequently or too vigorously
results in poor collection efficiencies, due to the absence of an adequate filter cake (Binnig,
Meyer, & Kasper, 2009; Bustard, Cushing, & Chang, 1992). Penetration is greatest
immediately after a pulse and reduces as the filter cake builds up (Callé et al., 2002). In
addition, higher pulse air pressure increases penetration as the filter cake is removed more
completely (Mukhopadhyay & Choudhary, 2013). The increase in penetration can be
mitigated to some extent by tailing off the air flow more gradually at the end of a pulse,
rather than a sudden shut-off as is typically used (Leith, First, & Gibson, 1978). This reduces
the acceleration of the fabric as it collapses onto the support cage, so that particles remaining
attached to the fabric are not driven through into the clean air stream. It should also be noted
that excessive pulsing results in increased operating costs due the high consumption of
compressed air and high wear on the filter bags.
The pulse duration in pleated cartridge dust collectors has only a small influence on the
efficiency of the pulse (Lo, Chen, & Pui, 2010). It is unclear, however, whether this result is
applicable to the non-pleated filter bags used for milk powder collection, which are often
much longer and use different filter fabrics. Shorter pulses use less compressed air, offering
an energy saving and thereby reducing operating costs. Löffler and Sievert (1987)
investigated the relative importance of the different cake removal mechanisms in a pulse-jet
baghouse and concluded that inertial effects due to the rapid acceleration of the filter bag
predominate near the top of the bag, while reverse air flow is more important near the bottom
of the bag, where the fabric acceleration is much lower. The large volume of the non-pleated
bags used in the dairy industry suggests that pulse duration may be more important than
20
indicated by Lo, Chen, et al. (2010), as the pulse must provide a sufficient volume of air to
inflate the bag and provide reverse flow.
Suh, Lim, and Zhu (2011) investigated the effect of the pulse nozzle position in a coke dust
baghouse, reporting an optimum distance of 0.11 m between the nozzle and the top of the
bag. However, the geometry of the baghouse used for the study, as well as the powder
properties, were significantly different to typical milk powder baghouses, so the optimum
nozzle position for dairy baghouses cannot be determined without more targeted research. In
particular, the baghouse used by Suh et al. (2011) had a venturi at the top of the bag,
providing a narrow opening for the pulse jet to enter. Milk powder baghouses generally do
not have venturis, and have a much larger opening. As the jet spreads out after leaving the
nozzle, it is likely that the larger opening results in a higher optimum nozzle position.
2.2.3 Filter Materials
The material and weave of the filter fabric is an essential aspect of baghouse design. Lamb,
Costanza, and Miller (1975) and Lamb and Costanza (1979, 1980) investigated the effect of
fibre geometry in non-woven polymer filter media. They found that fibre length and
diameter, cross-sectional shape, and crimp frequency all have effects on the permeability of
the filter media and the collection efficiency. Mukhopadhyay and Choudhary (2013) also
reported that coarser fibres resulted in lower pressure differentials and achieved optimum
pulse cleaning at lower pulse air pressures. In the dairy industry, fabrics are usually selected
based on purchase cost, rather than on performance, as the bags wear out and must be
regularly replaced. Nevertheless, obtaining fibres of different sizes may offer a cheaper
alternative to other performance-enhancing treatments such as membrane lamination.
In a study using limestone powder, Hindy, Sievert, and Löffler (1987) found that a
calendared medium performed poorly when compared to singed and membrane laminated
alternatives. The calendared fabric gave poor collection efficiencies and high pressure
differentials, especially after extended use. This is in contrast to conventional wisdom which
suggests that calendaring should improve collection efficiency and resistance to blinding due
to reduced pore sizes (Lydon, 2004; Weigert & Ripperger, 1997). As noted in Section 2.1.3,
excessive calendaring can weaken the fabric. It seems likely that the calendaring treatment
used by Hindy et al. (1987) was excessive, so that weakening of the fabric, and subsequent
fabric damage under the stresses of pulsing resulted in the poor performance observed in the
21
study. The calendaring method was not described in detail, so further research would be
useful to determine the optimum level of treatment.
2.3 Dairy Powders
2.3.1 Milk
Milk is a solution of a range of nutritional components, produced in the mammary glands of
all mammalian species as food for their young (Spreer, 1998). Humans have been collecting
the milk of domesticated animals for thousands of years, and have now developed an
enormous range of products from this basic starting material. Modern dairy products range
from traditional products such as cheese and yoghurt, to highly processed products like ice-
cream and chocolate.
The major animal used for commercial milk production is the cow, although milk obtained
from sheep and goats is also of some importance in parts of the world, especially in areas
around the Mediterranean and in parts of Africa and Asia. The composition of milk varies
considerably between species to suit the nutritional requirements of the young of that species
(Bylund, 2003).
New Zealand cows’ milk contains around 13% solids by mass (Hughes & Gray), of which the
key components are protein (casein and whey proteins), fat, carbohydrate (mostly lactose),
and ash (minerals). The composition and total production of milk varies seasonally, due to the
natural lactation cycle of the cows, with peak production occurring around October each year
(DairyNZ, 2011). The protein and fat content of milk is generally higher at the start and end
of lactation, i.e. Spring and Autumn, and lower in the middle period, while the trend for
lactose is opposite (Bansal, Habib, Rebmann, & Chen, 2009). The average composition of
New Zealand milk is indicated in Table 1.
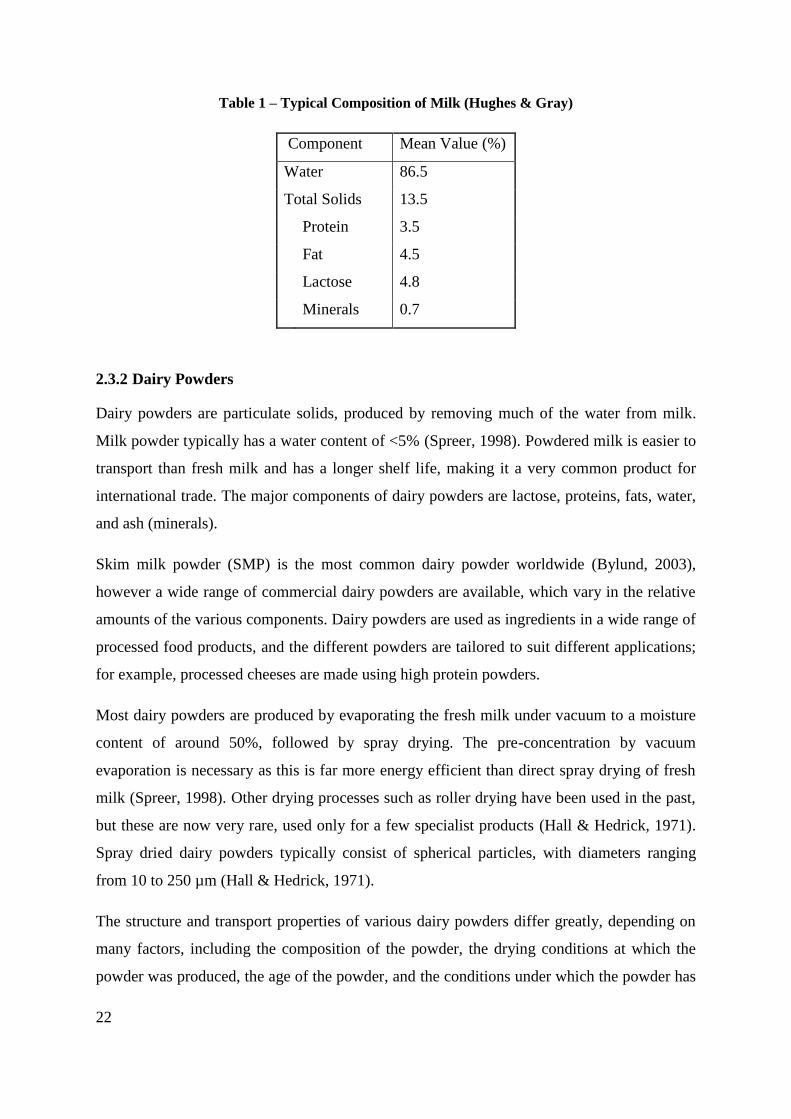
22
Table 1 – Typical Composition of Milk (Hughes & Gray)
Component Mean Value (%)
Water 86.5
Total Solids 13.5
Protein 3.5
Fat 4.5
Lactose 4.8
Minerals 0.7
2.3.2 Dairy Powders
Dairy powders are particulate solids, produced by removing much of the water from milk.
Milk powder typically has a water content of <5% (Spreer, 1998). Powdered milk is easier to
transport than fresh milk and has a longer shelf life, making it a very common product for
international trade. The major components of dairy powders are lactose, proteins, fats, water,
and ash (minerals).
Skim milk powder (SMP) is the most common dairy powder worldwide (Bylund, 2003),
however a wide range of commercial dairy powders are available, which vary in the relative
amounts of the various components. Dairy powders are used as ingredients in a wide range of
processed food products, and the different powders are tailored to suit different applications;
for example, processed cheeses are made using high protein powders.
Most dairy powders are produced by evaporating the fresh milk under vacuum to a moisture
content of around 50%, followed by spray drying. The pre-concentration by vacuum
evaporation is necessary as this is far more energy efficient than direct spray drying of fresh
milk (Spreer, 1998). Other drying processes such as roller drying have been used in the past,
but these are now very rare, used only for a few specialist products (Hall & Hedrick, 1971).
Spray dried dairy powders typically consist of spherical particles, with diameters ranging
from 10 to 250 µm (Hall & Hedrick, 1971).
The structure and transport properties of various dairy powders differ greatly, depending on
many factors, including the composition of the powder, the drying conditions at which the
powder was produced, the age of the powder, and the conditions under which the powder has
23
been stored. Several chemical processes can cause time-dependent deterioration of the
powder. These processes include oxidation of fats, crystallisation of lactose, and Maillard
browning of protein.
Fat Oxidation
Fats oxidise with exposure to oxygen in air. Oxidation negatively affects the flavour of milk
powder and limits the shelf life of whole milk powder to around 6 months under normal
conditions (Bylund, 2003). To extend the shelf life, powder can be packaged with an inert
gas, such as nitrogen (Varnam & Sutherland, 1994). This technique is commonly employed
in the New Zealand dairy industry (Winchester, 2010).
Lactose Stickiness and Crystallisation
Spray drying of milk powder causes very rapid evaporation of water. The lactose in the milk
solidifies too rapidly for crystallisation to occur, so that freshly dried powder contains lactose
in an amorphous form. Over time, and with exposure to sufficient humidity, the lactose can
absorb moisture and begin to crystallise. At room temperature, moisture sorption occurs at
humidity levels of roughly 50% or higher (Hall & Hedrick, 1971). As sorption occurs, the
particles cohere. Over time, crystallisation occurs and the particles grow into each other,
forming a solid cake (Hall & Hedrick, 1971). Eventually, the lactose is fully crystallised, and
no further sorption or caking occurs. The influence of lactose on cohesion is explained in
more detail in Section 2.4.2 below.
Protein Denaturation
Milk proteins can be denatured through exposure to heat. This is a common concern during
thermal processing of milk such as evaporation and drying. Caseins are relatively stable and
can withstand temperatures up to 140°C with minimal denaturation. Whey proteins, on the
other hand, are rapidly denatured at temperatures above 80°C (Varnam & Sutherland, 1994).
Denaturation affects the consistency of the milk and can lead to problems such as excessive
fouling and poor heat transfer due to gel formation (Varnam & Sutherland, 1994).
Maillard Reaction
The Maillard reaction is a form of non-enzymatic browning, resulting from a reaction
between an amino acid and a sugar. Maillard browning can occur in many food products, and
the range of amino acids present in most foods results in a wide range of reaction products
24
which alter the flavour and colour of the food. In milk, the major reactive compounds are
lysine and lactose (Spreer, 1998). Maillard browning is extremely slow at room temperature,
but occurs more rapidly at elevated temperatures such as those encountered during spray
drying of milk. This has a negative effect on milk powder, as it produces undesirable flavours
and discoloured particles. The short processing times involved in spray drying of milk
powder usually limit Maillard browning, however significant browning can occur in fouled
deposits, which may remain in the drier or baghouses for weeks or even months. These
deposits occasionally break loose and mix with the product. It is therefore very important to
minimise fouling to reduce the risk of contamination. Browning may also be caused by
incorrect process operation, for example overheating the drier in attempts to increase the
drying rate (Hall & Hedrick, 1971).
25
2.4 Milk Powder Research
2.4.1 Spray Drying
The physical properties of a particular milk powder are largely determined by the spray
drying process. The particle size and shape are determined by the droplet size from the
atomiser and the temperature of the drier. At high temperatures, the droplets rapidly form a
hard shell of dried material on the surface. As moisture continues to evaporate from the
droplet, bubbles of vapour are created within the droplet, forming voids within the particles
and resulting in a low particle density (Nijdam & Langrish, 2006). At lower temperatures, the
exterior of the droplet dries more slowly. Outward diffusion of moisture from the interior
keeps the shell soft, and as the droplet dries the shell collapses inward, resulting in a
convoluted particle surface. In addition, segregation of the various components in the milk
occurs during drying, with fat and protein migrating toward the particle surface while lactose
accumulates in the centre of the particle. Slower drying allows more time for this segregation
to occur, resulting in greater differences between the bulk and surface composition (Kim,
Chen, & Pearce, 2009; Nijdam & Langrish, 2006).
2.4.2 Milk Powder Stickiness
Stickiness and caking in dairy powders can cause significant problems in industry and have
been the focus of much research. The stickiness of dairy powders depends on the powder
composition, with both amorphous lactose and fat components having a significant effect on
the cohesiveness of the powder (Fitzpatrick, Barry, et al., 2007). Stickiness also depends on
storage conditions, due to phase transitions that occur within the powder at specific
temperature and moisture levels.
In powders with a high fat content, such as whole milk powder (WMP) and cream powder,
cohesiveness is thought to be primarily due to the fat melting and causing liquid bridging
between particles (Fitzpatrick, Barry, et al., 2007). Dairy powders contain many different fats
with melting points ranging from -40°C to +40°C (Kim, Chen, & Pearce, 2005b), so fat
melting is significant over a wide range of temperatures. Dairy baghouses are typically
operated at 70-80°C, so the fat is liquid during filtration. Furthermore, in spray dried dairy
powders, fat tends to accumulate on the surface of the particles (Kim, Chen, & Pearce, 2002;
Nijdam & Langrish, 2006), so even low levels of bulk fat can have significant effects on the
particle interactions. At high temperatures, the inter-particle bonds formed by fat bridging are
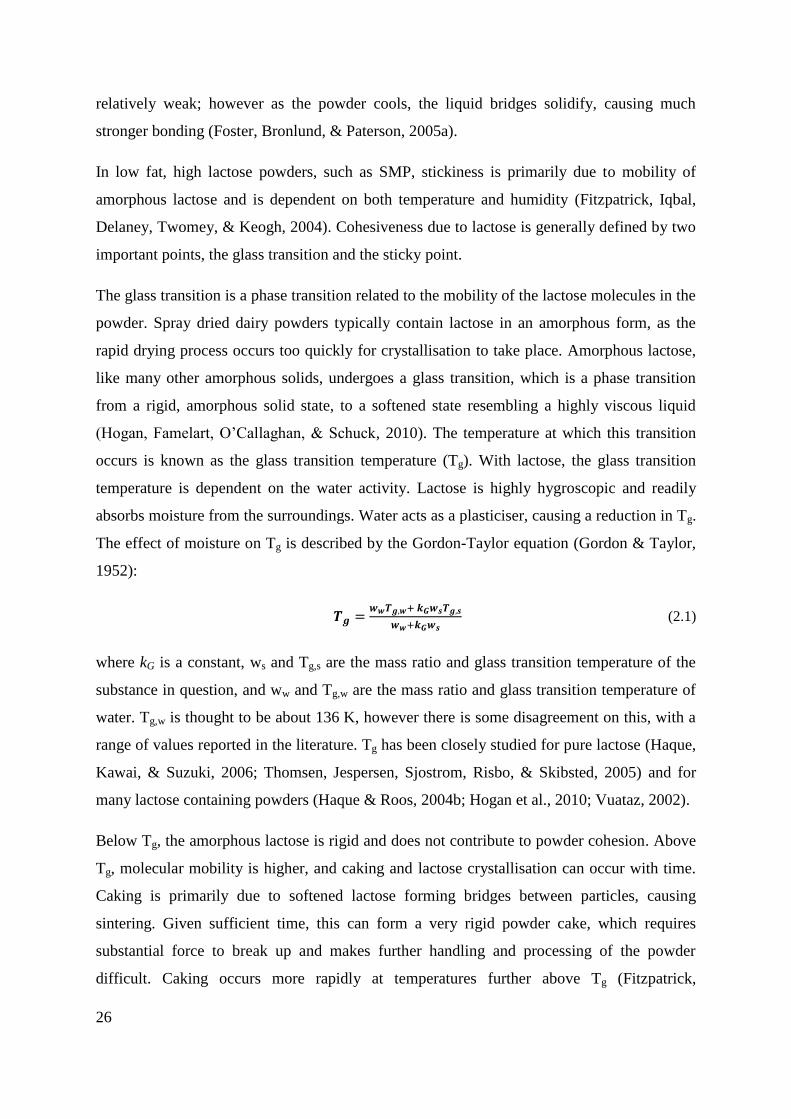
26
relatively weak; however as the powder cools, the liquid bridges solidify, causing much
stronger bonding (Foster, Bronlund, & Paterson, 2005a).
In low fat, high lactose powders, such as SMP, stickiness is primarily due to mobility of
amorphous lactose and is dependent on both temperature and humidity (Fitzpatrick, Iqbal,
Delaney, Twomey, & Keogh, 2004). Cohesiveness due to lactose is generally defined by two
important points, the glass transition and the sticky point.
The glass transition is a phase transition related to the mobility of the lactose molecules in the
powder. Spray dried dairy powders typically contain lactose in an amorphous form, as the
rapid drying process occurs too quickly for crystallisation to take place. Amorphous lactose,
like many other amorphous solids, undergoes a glass transition, which is a phase transition
from a rigid, amorphous solid state, to a softened state resembling a highly viscous liquid
(Hogan, Famelart, O’Callaghan, & Schuck, 2010). The temperature at which this transition
occurs is known as the glass transition temperature (Tg). With lactose, the glass transition
temperature is dependent on the water activity. Lactose is highly hygroscopic and readily
absorbs moisture from the surroundings. Water acts as a plasticiser, causing a reduction in Tg.
The effect of moisture on Tg is described by the Gordon-Taylor equation (Gordon & Taylor,
1952):
, ,
(2.1)
where kG is a constant, ws and Tg,s are the mass ratio and glass transition temperature of the
substance in question, and ww and Tg,w are the mass ratio and glass transition temperature of
water. Tg,w is thought to be about 136 K, however there is some disagreement on this, with a
range of values reported in the literature. Tg has been closely studied for pure lactose (Haque,
Kawai, & Suzuki, 2006; Thomsen, Jespersen, Sjostrom, Risbo, & Skibsted, 2005) and for
many lactose containing powders (Haque & Roos, 2004b; Hogan et al., 2010; Vuataz, 2002).
Below Tg, the amorphous lactose is rigid and does not contribute to powder cohesion. Above
Tg, molecular mobility is higher, and caking and lactose crystallisation can occur with time.
Caking is primarily due to softened lactose forming bridges between particles, causing
sintering. Given sufficient time, this can form a very rigid powder cake, which requires
substantial force to break up and makes further handling and processing of the powder
difficult. Caking occurs more rapidly at temperatures further above Tg (Fitzpatrick,
27
O’Callaghan, & O’Flynn, 2008). Caking is therefore commonly described in terms of the
temperature offset from the glass transition temperature, T-Tg (Fitzpatrick, Hodnett, et al.,
2007; Fitzpatrick et al., 2008). It should also be noted that the glass transition is a property of
amorphous solids, and the caking mechanisms described above do not apply to crystallised
lactose (Fitzpatrick et al., 2008; Vuataz, 2002). Nevertheless, Silalai and Roos (2010) found
that partial pre-crystallisation of the lactose increased cohesion, as the pre-existing crystals
helped to seed further crystal growth. In most commercial spray-dried powders, the lactose is
almost exclusively in amorphous form, as moisture loss and solidification during spray
drying occur too rapidly for substantial crystallisation to occur. For example, Listiohadi,
Hourigan, Sleigh, and Steele (2005) calculated the water of crystallisation in a non-
instantised SMP powder, and found none detectable, indicating that the lactose was entirely
in amorphous form.
Caking processes can also be slowed by mass transfer constraints. When a powder is
suddenly exposed to warm, humid air, it can take some time for the powder to absorb
moisture and equilibrate to the new conditions. Moisture sorption data for pure lactose is
readily available (Bronlund & Paterson, 2004), however sorption in other milk powders can
be more complex, due to the presence of protein, fat, and minerals. Moisture sorption data is
available for some specific powders, including SMP (Kockel, Allen, Hennigs, & Langrish,
2002). Foster, Bronlund, and Paterson (2005b) developed a technique for predicting moisture
sorption from powder composition, with an accuracy of around 10% for most powders.
Nevertheless, direct measurement remains the most reliable method of determining the
moisture sorption isotherm for any specific dairy powder.
The sticky point is defined as the point at which the particles become noticeably sticky as
measured by a mechanical test. Above the sticky point, the adherence of particles to each
other and to hard surfaces is essentially instantaneous. Sticky behaviour therefore affects
dynamic processes with moving particles, such as the bulk flow of powder through
processing equipment, or the adhesion of suspended particles to the inside surfaces of spray
driers and ducts. This is in contrast to the caking behaviour described above, which applies
only to static particles, for example in storage. Stickiness is therefore more relevant to active
processing such as spray drying and baghouse collection of powders, where the powder is
generally not held static for sufficient time for caking to become a problem. The sticky point
is related to the lactose glass transition, and generally follows a curve similar to the Tg curve,
28
but shifted up in temperature (Ozmen & Langrish, 2002). Consequently, the sticky point for a
powder is often reported in terms of (T-Tg)crit, the critical temperature offset from the glass
transition above which sticky behaviour occurs. Measurements of (T−Tg)crit depend on the
method used, with reported values for SMP ranging from 23.3°C using a stirrer method
(Hennigs, Kockel, & Langrish, 2001) to 37.9°C using a particle bombardment method
(Paterson, Bronlund, Zuo, & Chatterjee, 2007). This difference is most likely due to
differences in the time scales of the adhesive interactions being measured, as well as
differences in the shearing and inertial forces produced by different methods. The sticky point
measured by a particular method is the point at which the bonds formed between particles
become significant relative to the forces applied to the particles by the test method. Greater
contact time between particles allows for stronger bonds to form, so bond strength reaches
measureable levels at a lower T-Tg. In addition, Boonyai, Bhandari, and Howes (2004)
observed that for some measurement methods the sticky point may depend on the exposure
time above Tg. The particle bombardment method used by Paterson et al. (2007) results in a
short exposure time and very short contact times between the particles and the impacted
surface, and thus results in a high sticky point of 37.9°C above Tg for SMP. In contrast, the
stirrer method used by Hennigs et al. (2001) allows for slightly longer contact times between
particles in the stirred flask, and thus detects sticky behavior at a lower T-Tg level of only
23.3°C. Nevertheless, for both of these methods, the typical interaction time scale is only a
fraction of a second. In baghouses, interactions occur at a much longer time scale, with
particles in the filter cake remaining static for up to 5 minutes (the period between pulses). It
is therefore highly likely that softening of particles and increased adhesion to the filter
become important at T-Tg levels much lower than the sticky point values measured in any of
the above studies. Throughout the rest of this thesis, wherever a single value for the sticky
point is required, the (T-Tg)crit of 23.3°C reported by Hennigs et al. (2001) will be used, as
this is at the lower end of the range reported in the literature, and therefore closer to the range
expected to affect baghouse performance. The sticky point is also affected by other
components of the milk powder, and is therefore dependent on the powder composition. For
pure lactose, Paterson, Brooks, Bronlund, and Foster (2005) report a sticky point of 25°C
above Tg, while for high protein MPC powders, the sticky point may be as much as 90°C
above Tg (Hogan & O’Callaghan, 2010).
Particle stickiness may have a range of effects on different aspects of baghouse performance.
Sticky particles colliding with surfaces can adhere and cause fouling or blockages. Murti,
29
Paterson, Pearce, and Bronlund (2010) found that sticky particles readily adhere to a range of
surfaces, with surface characteristics such as elasticity and texture making little difference. It
is therefore likely that at conditions above the sticky point particles adhere more strongly to
the filter fabric, making the filter cake more difficult to remove. Measures to compensate for
this, such as increasing the compressed air pressure to the pulse, have associated costs. On the
other hand, research from other industries indicates that more cohesive particles tend to form
a more porous filter cake structure, with a lower resistance to air flow (Miller & Laudal,
1992). In addition, particle cohesion encourages agglomeration of particles, which reduces
the penetration of particles into the filter and encourages gravitational settling. Both of these
effects lower the long term pressure differentials, thus reducing the energy cost. Optimising
baghouse performance therefore requires finding a balance between different factors.
The sticky point relies on the properties at the particle surface, and does not require the
powder moisture content to equilibrate with the surrounding air conditions (Murti, Paterson,
Pearce, & Bronlund, 2009). Consequently, particles become sticky almost immediately when
exposed to humid conditions. Whether or not a particular particle adheres to a surface
depends on a range of variables, including the particle size, and impact velocity. Walmsley,
Walmsley, Atkins, Neale, and Sellers (2014) showed that smaller particles exhibited a lower
(T-Tg)crit, which may exacerbate the effect of stickiness on milk powder baghouses. As larger
particles tend to settle out in the bottom of the spray drier and do not reach the filter, the
mean particle size in the filter cake is generally lower than in the spray drier. While spray
driers and milk powder baghouses are generally operated just below the estimated sticky
point to minimise fouling, the combination of the smaller particle size at the filter surface and
the relatively long time for which particles remain in contact with the filter surface may mean
that sticky behaviour affects the filtration process at T-Tg levels lower than otherwise
expected. Murti et al. (2010) found that the velocity of particles impacting a surface affected
the adhesion, with high velocity resulting in a higher (T-Tg)crit. They concluded that high
velocities create greater inertial forces and reduce the time scale of the particle-particle and
particle-surface interactions. Interestingly, these authors found that the angle of impact
between a particle and a surface had no effect on the adhesion, which suggests that the time
scale of the impact is much more important than the inertial forces involved.
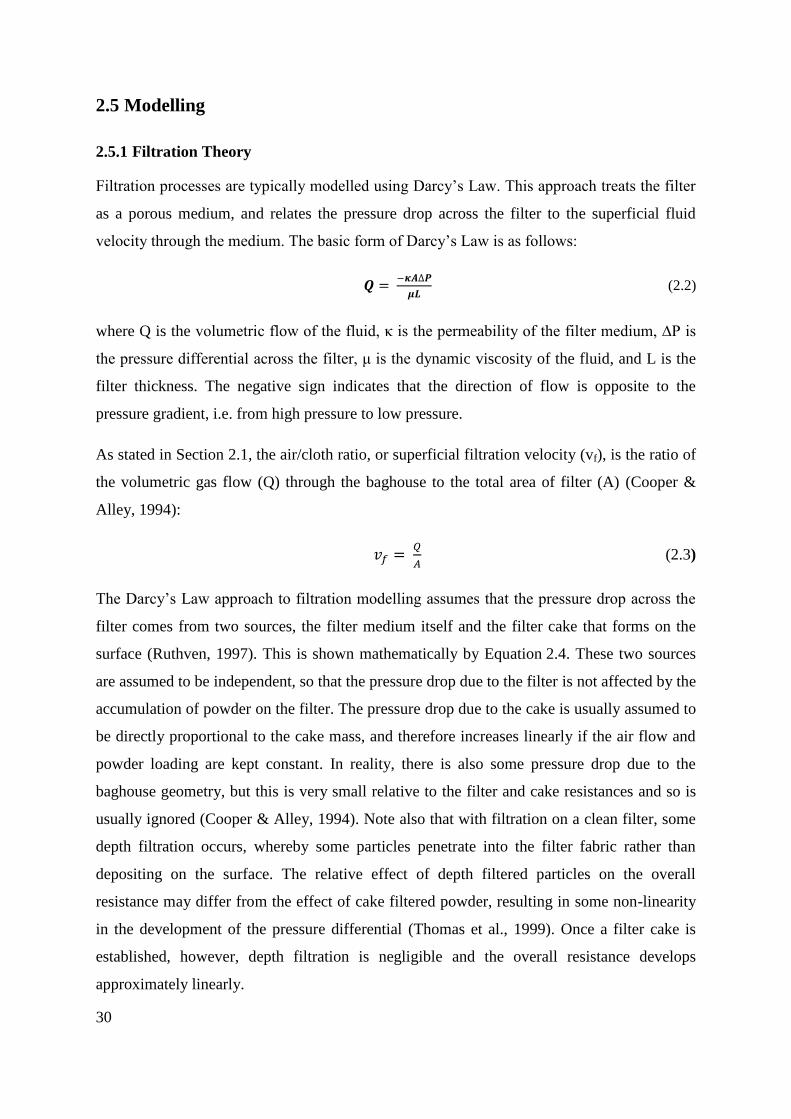
30
2.5 Modelling
2.5.1 Filtration Theory
Filtration processes are typically modelled using Darcy’s Law. This approach treats the filter
as a porous medium, and relates the pressure drop across the filter to the superficial fluid
velocity through the medium. The basic form of Darcy’s Law is as follows:
(2.2)
where Q is the volumetric flow of the fluid, κ is the permeability of the filter medium, ∆P is
the pressure differential across the filter, μ is the dynamic viscosity of the fluid, and L is the
filter thickness. The negative sign indicates that the direction of flow is opposite to the
pressure gradient, i.e. from high pressure to low pressure.
As stated in Section 2.1, the air/cloth ratio, or superficial filtration velocity (vf), is the ratio of
the volumetric gas flow (Q) through the baghouse to the total area of filter (A) (Cooper &
Alley, 1994):
(2.3)
The Darcy’s Law approach to filtration modelling assumes that the pressure drop across the
filter comes from two sources, the filter medium itself and the filter cake that forms on the
surface (Ruthven, 1997). This is shown mathematically by Equation 2.4. These two sources
are assumed to be independent, so that the pressure drop due to the filter is not affected by the
accumulation of powder on the filter. The pressure drop due to the cake is usually assumed to
be directly proportional to the cake mass, and therefore increases linearly if the air flow and
powder loading are kept constant. In reality, there is also some pressure drop due to the
baghouse geometry, but this is very small relative to the filter and cake resistances and so is
usually ignored (Cooper & Alley, 1994). Note also that with filtration on a clean filter, some
depth filtration occurs, whereby some particles penetrate into the filter fabric rather than
depositing on the surface. The relative effect of depth filtered particles on the overall
resistance may differ from the effect of cake filtered powder, resulting in some non-linearity
in the development of the pressure differential (Thomas et al., 1999). Once a filter cake is
established, however, depth filtration is negligible and the overall resistance develops
approximately linearly.
31
(2.4)
The pressure drop due to the filter is assumed to remain constant during filtration and can be
expressed using Darcy’s Law as follows (Cooper & Alley, 1994):
(2.5)
Once again, the negative sign indicates that the pressure gradient is opposite to the direction
of flow. As the filter and gas properties tend to remain relatively constant for any specific
process, this equation is often simplified by combining the fluid viscosity, filter permeability,
and filter thickness into a single resistance factor, Rf (Davis, 2000), as follows:
(2.6)
The same principle can be applied to the filter cake, defining the overall cake resistance, Rc.
Rc, however, is dependent on the cake thickness, and changes during filtration as the cake
builds up. The rate at which the cake builds up can be expressed in terms of the filtration
velocity and the inlet dust concentration, ci (Cooper & Alley, 1994). Incorporating this into
Darcy’s Law yields:
(2.7)
where α is the specific cake resistance or cake coefficient, kd is the proportion of inlet dust
that actually deposits on the filter (deposition ratio), and t is time. kd and α are specific to a
particular process, and depend on particle properties such as size, shape, and rigidity, surface
characteristics such as composition and surface energy, as well as aspects of baghouse design
such as filtration and elutriation velocities. It is also important to note the difference between
the overall cake resistance, Rc, which changes as the cake builds up, and the specific cake
resistance, α, which is related to the porosity of the filter cake and is independent of the cake
thickness.
Equations 2.6 and 2.7 can be substituted back into Equation 2.4 to give an expression for the
overall pressure drop as follows:
(2.8)
This is the working form of the filtration equation.
32
2.5.2 General Baghouse Modelling
Many authors have developed mathematical models of various aspects of baghouse
performance (Koehler & Leith, 1983; Leith & Ellenbecker, 1980; Li & Chambers, 1995; Lu
& Tsai, 1996). Modelling is an important design tool, as it allows aspects of baghouse
performance such as pressure differentials and pulsing effectiveness to be predicted much
more quickly and cheaply than by experiment. All models, however, make certain
simplifying assumptions which limit the application of the model to a small subset of real-
world applications.
Leith and Ellenbecker (1980) developed a model to calculate the equilibrium pressure
differentials in a pulse jet baghouse based on baghouse operating conditions and
characteristics of the filter material. This model could also account for unstable operation,
where the pressure differentials increase in an uncontrolled manner. Koehler and Leith (1983)
fitted this model to several different filter fabrics and determined that fabric surface
treatments result in large changes in the fitted parameters. The model provides a basis for a
criterion of effective cake removal, based on the momentum impulse imparted to the filter
cake during a pulse, and was reasonably accurate at predicting the overall pressure
differential for the baghouse and the onset of instability in the pressure differential. However,
the model did not account for local variations in airflow and filter cake properties within the
baghouse, as the areal density and porosity of the filter cake were modelled as single values
representing averages for the baghouse. In a large baghouse, it is likely that gravitational
settling of particles will produce a significant variation in both areal density and porosity of
the filter cake with height, and with distance from the inlet. Overall, the model is useful as a
design tool for predicting instability in the baghouse pressure differentials, but provides little
insight into the mechanisms that govern effective pulse cleaning. The principle of using the
momentum impulse as a measure of pulse effectiveness could be incorporated into a more
detailed model to predict local variations in cleaning effect.
Lu and Tsai (1996) used a numerical approach, based on thermodynamic descriptions of gas
flows, to model the effect of pulse pressure, air tank size, nozzle position, and nozzle
diameter on the pulse pressure impulse. The model predicted pressure changes in the pulse air
supply tank and blow tube upstream of the nozzle, as well as within the filter bag. The pulse
flow was predicted using a standard orifice discharge equation. The model also provided for
entrainment of air into the pulse jet, using expressions for a free circular jet, but did not
33
account for the resultant decrease in pressure in the clean air plenum. The model worked well
for the open-tube nozzle being modelled, but the treatment of the pulse jet as a free circular
jet would be difficult to generalise to the nozzles with flow guides that are used in modern
dairy baghouses. The pressure and velocity in the filter bag were calculated by numerical
integration of mass and momentum equations, similar to common CFD methods, with the
filter bag divided into control volumes in the vertical direction only. The model did not
resolve the velocity and pressure profiles throughout the bag, but was limited to predicting
the radial velocity and pressure at the bag surface. The major failing of the model lies in
simulating situations where the pulse nozzle is positioned close to the bag opening. In such
cases, the treatment of the pulse jet as a free circular jet may be inaccurate, as the jet extends
into the bag and thus may be influenced by the geometry of the bag opening. Furthermore,
some recirculation may occur in the flow at the top of the bag if the jet does not have
sufficient room to expand to the diameter of the bag; as the discretisation scheme uses only a
single value for the axial velocity at any height within the bag, recirculation will not be
captured by the model.
Li and Chambers (1995) used a numerical approach to model the patchy cleaning of filter
bags in a shaker baghouse. Both forward filtration and pulse cleaning were modelled. The
forward filtration model allowed for the air flux through the filter to vary at different points
on the bag surface, depending on the initial powder loading (i.e. resistance) at each point. The
powder loading in the air stream was assumed to be constant, so the deposition rate of
powder was taken to be proportional to the air flux at each point. This method failed to
account for gravitational settling of particles, which may produce significant variations in
both dust loading and mean particle size within a large baghouse. The cake removal model
was based on a mechanical shaker cleaning system, in which cleaning happens gradually as
the filter cake becomes fatigued by on-going shaking. The cleaning effect was therefore
estimated using a fatigue crack growth theory under repeated but low bag acceleration. This
is very different to the cleaning mechanism of pulse-jet systems, in which a high acceleration
is applied for a very short period of time, so that the filter cake is removed all at once. The
cleaning model used in this paper is therefore not applicable to the pulse-jet baghouses used
in the dairy industry.
34
2.5.3 Computational Fluid Dynamics
Complete analytical solutions to fluid flow problems are generally only obtainable for very
simple problems. CFD is a method of modelling fluid flows using discrete numerical
approximation. This allows for accurate solutions to complex problems where analytical
solutions cannot be obtained (Zikanov, 2010). CFD is a rapidly developing field, as advances
in computing power continually enable modelling of ever more complex flows. CFD allows
for high precision modelling with very few simplifying assumptions, allowing the model to
be readily applied to a wide range of situations. There are still difficulties involved with CFD,
the most notable of which is the need to validate the model with experimental results, as it is
easy to obtain a plausible but incorrect solution. Despite this, the relatively low cost of
simulations (compared to detailed experimental investigations) and the high degree of detail
that can be obtained make CFD a useful tool for investigating a wide range of fluid flow
problems.
CFD has seen extensive use in modelling engineering problems from a wide range of
industries. Within the food manufacturing industry, CFD has been extensively used to
simulate spray drying (Fletcher et al., 2006; Kuriakose & Anandharamakrishnan, 2010;
Langrish & Fletcher, 2001), and has also seen some use in modelling other processes such as
refrigeration and sterilisation (Norton & Sun, 2006). Despite this, very few attempts have
been made to apply CFD to baghouse design.
CFD has been applied to a range of filtration processes. Applications of CFD to filter systems
generally take one of two approaches. In the first approach, the filter is treated as a porous
volume, and meshed in the same way as a general fluid region. The flows in the porous
medium are calculated using Darcy’s Law, or by using a momentum sink to account for the
pressure drop due to the resistance of the filter. This porous-volume approach has been
successfully used to model a range of filter processes (Baléo & Subrenat, 2000; Hanspal,
Waghode, Nassehi, & Wakeman, 2009; Nassehi, 1998; Silalai & Roos, 2010). However,
meshing through the filter medium is computationally expensive, and predicting turbulent
flows in the porous medium requires coupling of Darcy’s Law with the Navier-Stokes
equations, which can be difficult. Several coupling approaches have been developed
(Nassehi, 1998; Urquiza, N'Dri, Garon, & Delfour, 2008), however these are limited to
particular applications, and generalised models are not currently available. In the second
approach, the filter surface is modelled with zero thickness, and the flow across the filter is
35
calculated in a single step using Darcy’s Law. The porous filter medium does not need to be
meshed, and the computational requirements are reduced, allowing results to be obtained
more rapidly. The loss of accuracy is generally negligible for thin filter media, and this
method has been successfully applied to membrane and fabric filtration systems (Lo, Hu,
Chen, & Pui, 2010; Wiley & Fletcher, 2002, 2003). The filter media in baghouses are
generally thin, and the flows within the filter media are not important in evaluating the
baghouse performance, so this second approach shows great promise in baghouse modelling.
2.6 Conclusions
Baghouses are an old and widely used technology, and there is a substantial body of work
describing the performance of baghouses in a range of applications. Nevertheless, several
questions remain about the specific application of baghouses to collecting spray dried milk
powders. In particular, it is not known whether changes in the cohesive and adhesive
properties of milk powder due to variations in temperature and humidity have any significant
effect on the performance of baghouses.
A range of mathematical modelling approaches have previously been used to predict
baghouse performance, with reasonable success. Recent advances in CFD modelling offer the
potential to integrate a wide range of performance aspects into a single model. CFD has been
successfully applied in recent years to a range of filtration processes, but very little work has
been done on pulse jet baghouses of the type used in the dairy industry. There are now
opportunities to adapt some of the techniques developed for other filtration processes, and
incorporate these techniques into simulations of pulse jet baghouses.
36
3. Filtration Investigation
3.1 Introduction
Baghouses in the dairy industry are used to filter milk powder from the air exiting spray
driers. Occasional problems are encountered during the production and handling of dairy
powders due to variations in the cohesive and adhesive properties of the powder. Sticky
powders cause increased fouling in spray driers and associated processing equipment, while
caking in hoppers and silos causes blockages and handling difficulties. While these problems
have been studied extensively, estimating the effect of stickiness on the performance of
baghouses still relies heavily on work from other industries, using non-dairy powders. Prior
research has demonstrated correlations between powder cohesion and filter cake porosity
(Miller & Laudal, 1992), and between humidity and cake adhesion (Morris & Allen, 1996).
The powders used in these previous studies (chalk, glass, PVC, carbon, and boiler flue dust)
were single phase particles composed of mineral or polymeric substances (with the possible
exception of boiler flue dust). The complex structure of milk powder particles and the range
of processes that may contribute to cohesion (explained in more detail below) suggest that a
wider range of factors may influence the performance of milk powder baghouses. Some
targeted research using dairy powders is therefore needed to enable more effective design of
baghouses for the dairy industry.
The temperature of the lactose glass transition, Tg, decreases with increasing water activity
(Thomsen et al., 2005), and so is highly dependent on changes in ambient humidity. Bonding
between particles is also time dependent and occurs more rapidly at conditions of higher
temperature and water activity (Paterson et al., 2005). At temperatures near the glass
transition, lactose bridging is very slow, and does not affect most stages in the manufacturing
process, as powder does not remain static for sufficient time. Some researchers have therefore
defined a sticky point, above which the adhesion of particles essentially becomes
instantaneous, resulting in a marked decrease in flowability and an increase in adhesion to
surfaces (Paterson et al., 2007). Above the sticky point, particle adhesion becomes important
even during manufacturing.
The particle sticky point is generally described in terms of the temperature offset from the
glass transition temperature, T−Tg (Bhandari, Datta, & Howes, 1997; Hennigs et al., 2001;
37
Paterson et al., 2005). The sticky point for a particular powder occurs at a critical temperature
offset, (T−Tg)crit, regardless of the specific temperature and humidity levels used (Paterson et
al., 2007). The value of (T−Tg)crit depends on powder composition, with some high-protein
powders having a critical temperature offset of up 90°C (Hogan & O’Callaghan, 2010). As
mentioned in Section 2.4.2, the sticky point depends on the method used to measure it, and it
is likely that sticky behaviour begins to influence baghouse performance at conditions below
the sticky point levels reported in the literature.
As mentioned in Section 2.4.2, the value of (T−Tg)crit depends on the velocity of the particles.
In a baghouse, the velocity of particles impacting the filter varies substantially throughout the
baghouse. High velocity air flows entering the baghouse are slowed and dissipated as they
pass further from the inlet. In addition, the air flowing around and between the filter bags
may create complex, turbulent flow patterns, with recirculation zones and oscillating flow
patterns, which create large variations in velocity even over short distances. The net flow
through the porous filter surface acts to draw particles onto the filter, likely increasing the
adhesion. While it is not possible to estimate the range of impact velocities within a
baghouse, some representative figures may be considered. The filtration velocity, vf,
representing the superficial velocity of air through the filter, gives an idea of baghouse
throughput, and it can be expected that increasing vf will also increase the particle impact
velocity and thus reduce the effect of particle stickiness. Similarly, the geometry of the
baghouse inlet, with baffles and flow guides to direct the inlet flow, can be expected to alter
the impact velocities near the inlet. However, while it may be desirable from a powder
deposition perspective to maintain high air velocities near the filter surface, this has other
associated costs, such as increased wear on the filter bags.
Another major contributor to the cohesion and flowability of milk powders is the presence of
fat. Milk contains a range of fats with melting temperatures ranging from -40°C to +40°C
(Kim et al., 2005b; Varnam & Sutherland, 1994). In spray dried dairy powders, fat tends to
accumulate on the surface of the particles (Kim et al., 2002; Nijdam & Langrish, 2006), so
even low levels of bulk fat can have significant effects on the particle interactions. Surface fat
content is strongly correlated with powder cohesiveness (Fitzpatrick, Barry, et al., 2007; Kim,
Chen, & Pearce, 2005a), as fats in a liquid state form liquid bridges between particles. The
flowability of high fat powders is dependent on temperature, due to the wide range of melting
38
points of dairy fats (Fitzpatrick et al., 2004). Dairy baghouses are typically operated at 70-
80°C, so the fats are entirely in a liquid state.
In this study, two different powders, a skim milk powder (SMP) and a high fat milk protein
concentrate (MPC42) were filtered from air using a polyester needle-felt filter, with the aim
of determining the effect of particle cohesion on the filtration process. The experiments
focused on the effects of temperature and humidity on the filter cake structure and filter
pressure differential. Most of the experiments described in this chapter were carried out using
a small bench scale filtration apparatus; however, several filtration runs were also carried out
on a pilot scale baghouse, with a 3 m long bag, to test the scalability of the results from the
bench scale apparatus.
3.2 Apparatus
3.2.1 Bench Scale Filtration Rig
A bench scale filter rig was constructed to allow filtration at a controlled temperature and
humidity. The apparatus was designed to maintain the filtration velocity and powder loading
of industrial baghouses, but over a much smaller area of filter. The apparatus was also
designed to allow control of humidity and temperature over a wide range, as these variables
are of particular interest with regards to the filtration process. A diagram of the entire
apparatus is shown in Figure 7.
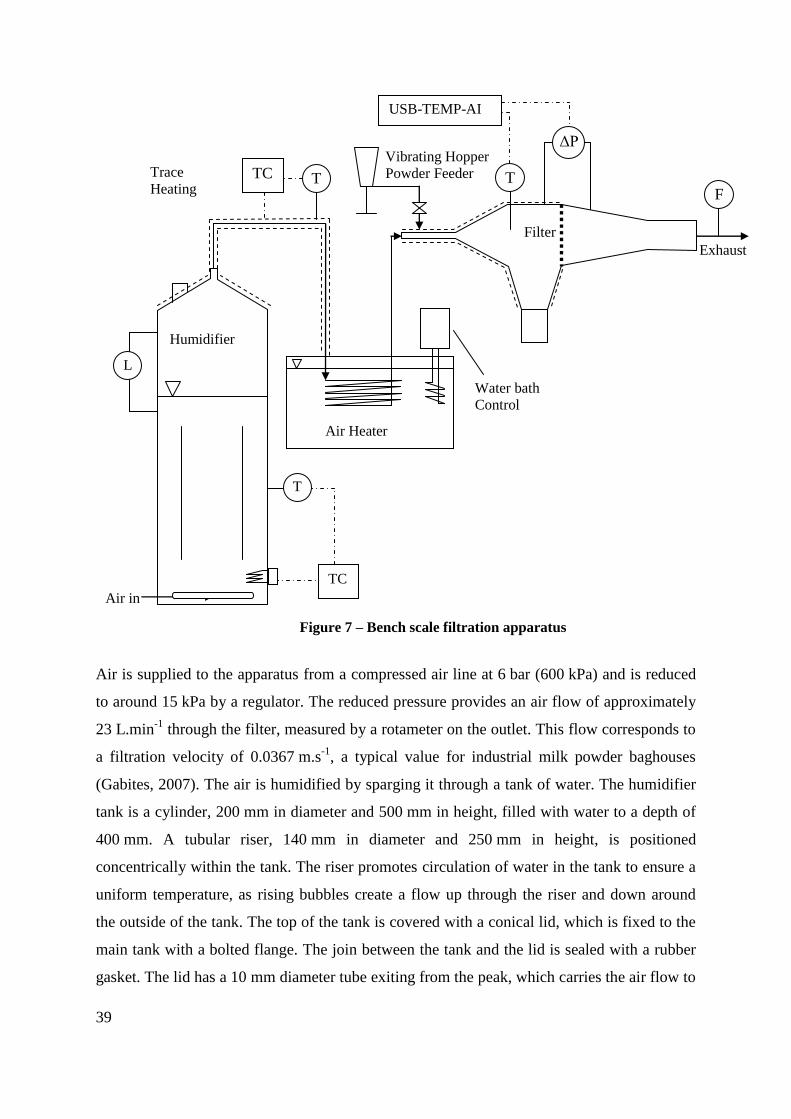
39
Air is supplied to the apparatus from a compressed air line at 6 bar (600 kPa) and is reduced
to around 15 kPa by a regulator. The reduced pressure provides an air flow of approximately
23 L.min-1
through the filter, measured by a rotameter on the outlet. This flow corresponds to
a filtration velocity of 0.0367 m.s-1
, a typical value for industrial milk powder baghouses
(Gabites, 2007). The air is humidified by sparging it through a tank of water. The humidifier
tank is a cylinder, 200 mm in diameter and 500 mm in height, filled with water to a depth of
400 mm. A tubular riser, 140 mm in diameter and 250 mm in height, is positioned
concentrically within the tank. The riser promotes circulation of water in the tank to ensure a
uniform temperature, as rising bubbles create a flow up through the riser and down around
the outside of the tank. The top of the tank is covered with a conical lid, which is fixed to the
main tank with a bolted flange. The join between the tank and the lid is sealed with a rubber
gasket. The lid has a 10 mm diameter tube exiting from the peak, which carries the air flow to
Figure 7 – Bench scale filtration apparatus
Air in
T
TC
Air Heater
Humidifier
T TC Trace
Heating
Water bath
Control
USB-TEMP-AI
L
Exhaust
T F
Vibrating Hopper
Powder Feeder
Filter
ΔP
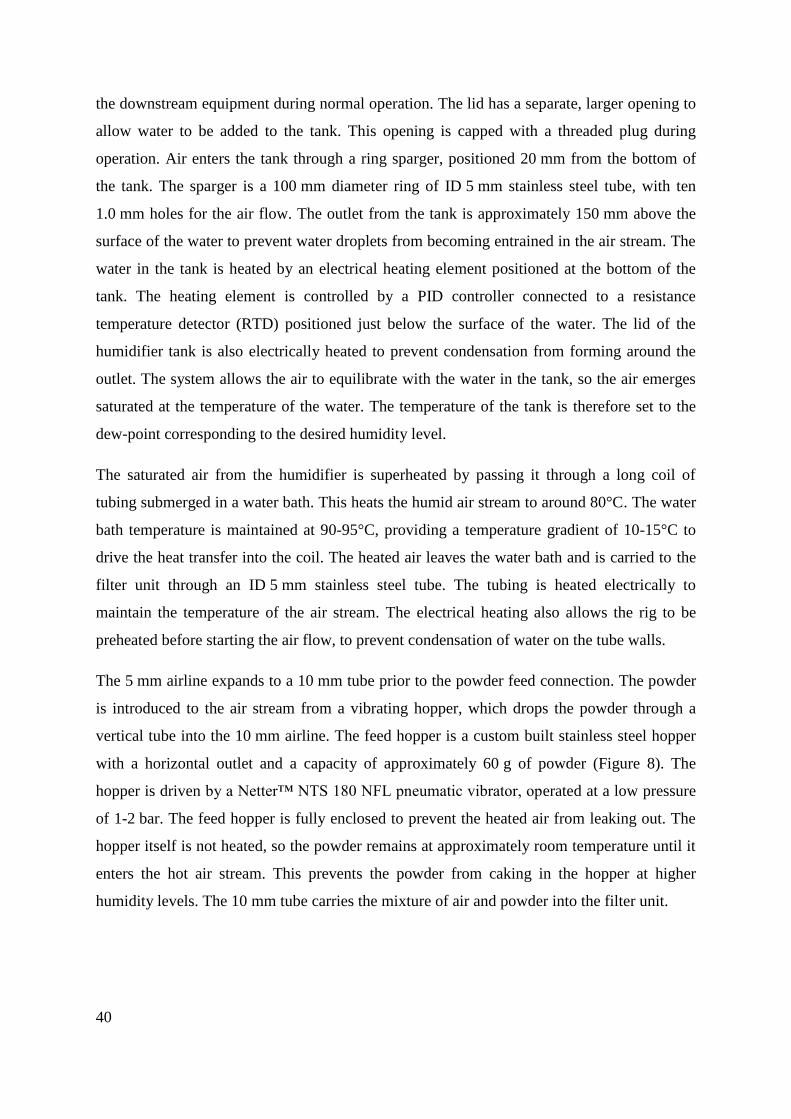
40
the downstream equipment during normal operation. The lid has a separate, larger opening to
allow water to be added to the tank. This opening is capped with a threaded plug during
operation. Air enters the tank through a ring sparger, positioned 20 mm from the bottom of
the tank. The sparger is a 100 mm diameter ring of ID 5 mm stainless steel tube, with ten
1.0 mm holes for the air flow. The outlet from the tank is approximately 150 mm above the
surface of the water to prevent water droplets from becoming entrained in the air stream. The
water in the tank is heated by an electrical heating element positioned at the bottom of the
tank. The heating element is controlled by a PID controller connected to a resistance
temperature detector (RTD) positioned just below the surface of the water. The lid of the
humidifier tank is also electrically heated to prevent condensation from forming around the
outlet. The system allows the air to equilibrate with the water in the tank, so the air emerges
saturated at the temperature of the water. The temperature of the tank is therefore set to the
dew-point corresponding to the desired humidity level.
The saturated air from the humidifier is superheated by passing it through a long coil of
tubing submerged in a water bath. This heats the humid air stream to around 80°C. The water
bath temperature is maintained at 90-95°C, providing a temperature gradient of 10-15°C to
drive the heat transfer into the coil. The heated air leaves the water bath and is carried to the
filter unit through an ID 5 mm stainless steel tube. The tubing is heated electrically to
maintain the temperature of the air stream. The electrical heating also allows the rig to be
preheated before starting the air flow, to prevent condensation of water on the tube walls.
The 5 mm airline expands to a 10 mm tube prior to the powder feed connection. The powder
is introduced to the air stream from a vibrating hopper, which drops the powder through a
vertical tube into the 10 mm airline. The feed hopper is a custom built stainless steel hopper
with a horizontal outlet and a capacity of approximately 60 g of powder (Figure 8). The
hopper is driven by a Netter™ NTS 180 NFL pneumatic vibrator, operated at a low pressure
of 1-2 bar. The feed hopper is fully enclosed to prevent the heated air from leaking out. The
hopper itself is not heated, so the powder remains at approximately room temperature until it
enters the hot air stream. This prevents the powder from caking in the hopper at higher
humidity levels. The 10 mm tube carries the mixture of air and powder into the filter unit.
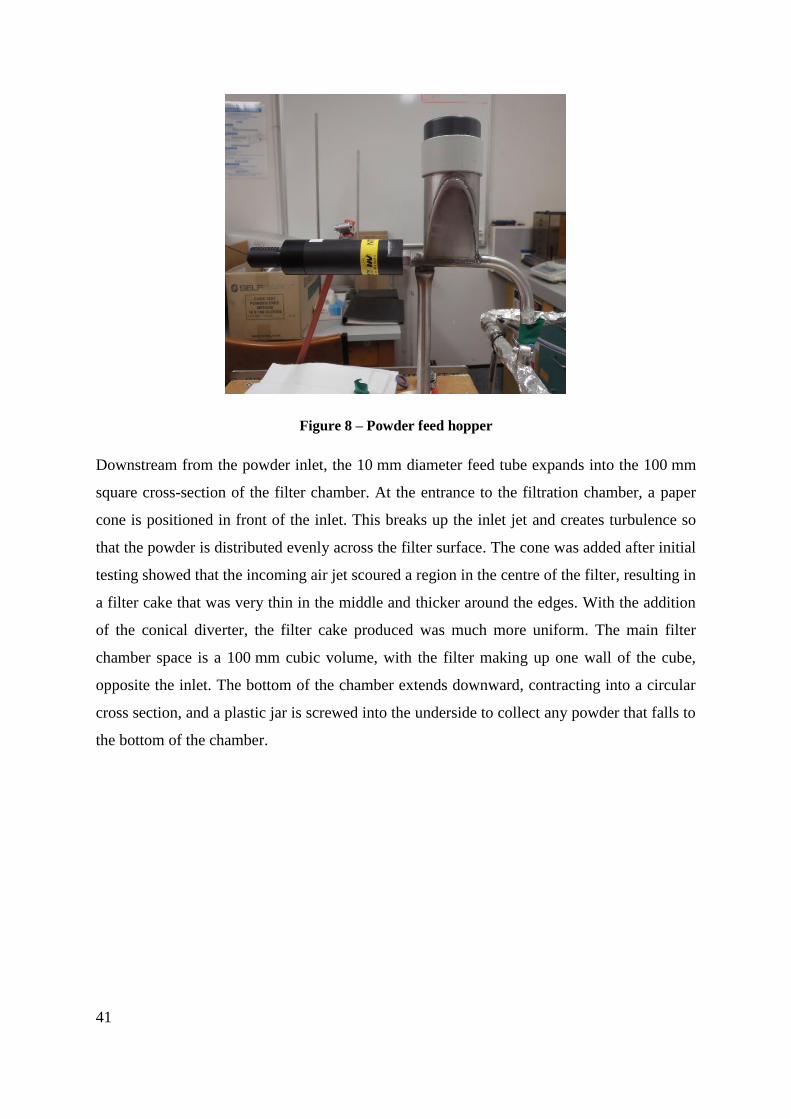
41
Figure 8 – Powder feed hopper
Downstream from the powder inlet, the 10 mm diameter feed tube expands into the 100 mm
square cross-section of the filter chamber. At the entrance to the filtration chamber, a paper
cone is positioned in front of the inlet. This breaks up the inlet jet and creates turbulence so
that the powder is distributed evenly across the filter surface. The cone was added after initial
testing showed that the incoming air jet scoured a region in the centre of the filter, resulting in
a filter cake that was very thin in the middle and thicker around the edges. With the addition
of the conical diverter, the filter cake produced was much more uniform. The main filter
chamber space is a 100 mm cubic volume, with the filter making up one wall of the cube,
opposite the inlet. The bottom of the chamber extends downward, contracting into a circular
cross section, and a plastic jar is screwed into the underside to collect any powder that falls to
the bottom of the chamber.
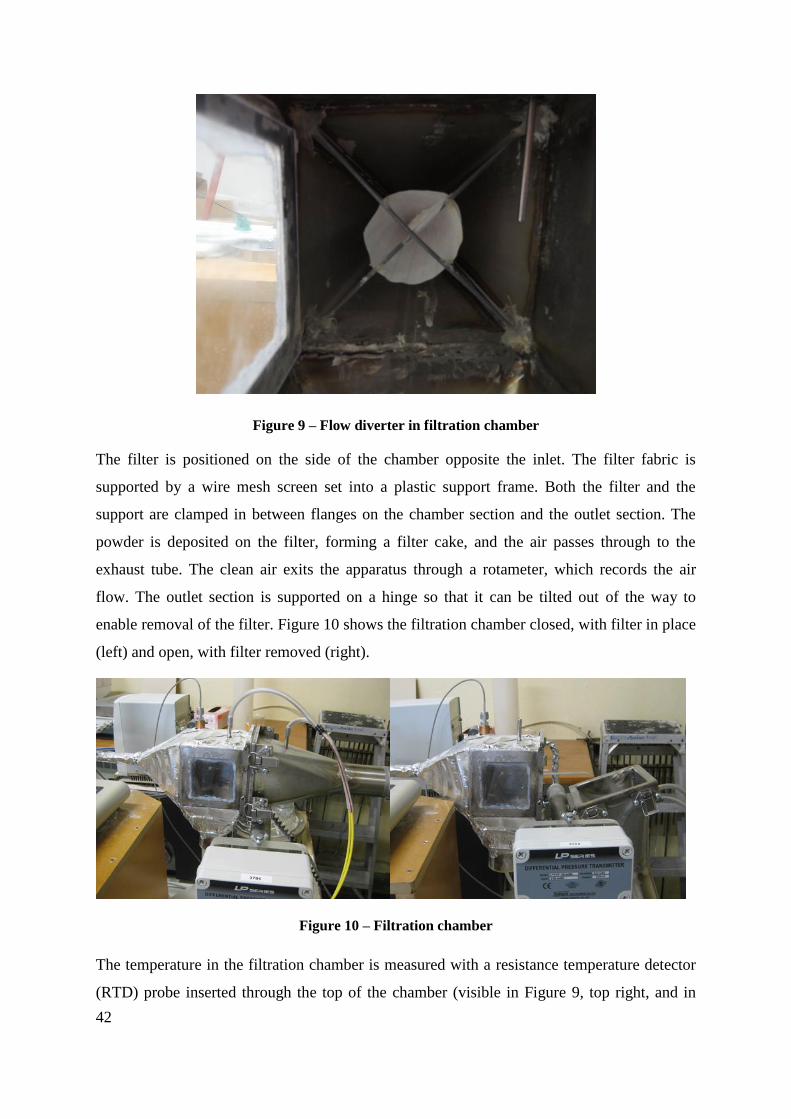
42
Figure 9 – Flow diverter in filtration chamber
The filter is positioned on the side of the chamber opposite the inlet. The filter fabric is
supported by a wire mesh screen set into a plastic support frame. Both the filter and the
support are clamped in between flanges on the chamber section and the outlet section. The
powder is deposited on the filter, forming a filter cake, and the air passes through to the
exhaust tube. The clean air exits the apparatus through a rotameter, which records the air
flow. The outlet section is supported on a hinge so that it can be tilted out of the way to
enable removal of the filter. Figure 10 shows the filtration chamber closed, with filter in place
(left) and open, with filter removed (right).
Figure 10 – Filtration chamber
The temperature in the filtration chamber is measured with a resistance temperature detector
(RTD) probe inserted through the top of the chamber (visible in Figure 9, top right, and in
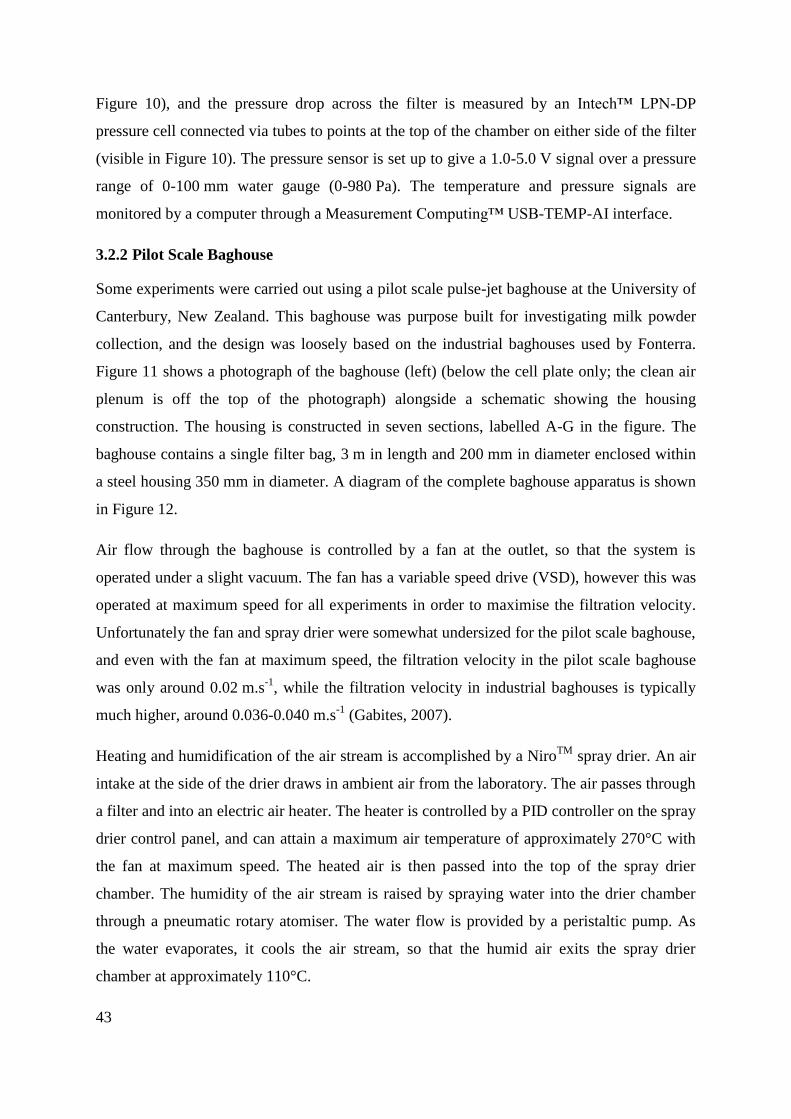
43
Figure 10), and the pressure drop across the filter is measured by an Intech™ LPN-DP
pressure cell connected via tubes to points at the top of the chamber on either side of the filter
(visible in Figure 10). The pressure sensor is set up to give a 1.0-5.0 V signal over a pressure
range of 0-100 mm water gauge (0-980 Pa). The temperature and pressure signals are
monitored by a computer through a Measurement Computing™ USB-TEMP-AI interface.
3.2.2 Pilot Scale Baghouse
Some experiments were carried out using a pilot scale pulse-jet baghouse at the University of
Canterbury, New Zealand. This baghouse was purpose built for investigating milk powder
collection, and the design was loosely based on the industrial baghouses used by Fonterra.
Figure 11 shows a photograph of the baghouse (left) (below the cell plate only; the clean air
plenum is off the top of the photograph) alongside a schematic showing the housing
construction. The housing is constructed in seven sections, labelled A-G in the figure. The
baghouse contains a single filter bag, 3 m in length and 200 mm in diameter enclosed within
a steel housing 350 mm in diameter. A diagram of the complete baghouse apparatus is shown
in Figure 12.
Air flow through the baghouse is controlled by a fan at the outlet, so that the system is
operated under a slight vacuum. The fan has a variable speed drive (VSD), however this was
operated at maximum speed for all experiments in order to maximise the filtration velocity.
Unfortunately the fan and spray drier were somewhat undersized for the pilot scale baghouse,
and even with the fan at maximum speed, the filtration velocity in the pilot scale baghouse
was only around 0.02 m.s-1
, while the filtration velocity in industrial baghouses is typically
much higher, around 0.036-0.040 m.s-1
(Gabites, 2007).
Heating and humidification of the air stream is accomplished by a NiroTM
spray drier. An air
intake at the side of the drier draws in ambient air from the laboratory. The air passes through
a filter and into an electric air heater. The heater is controlled by a PID controller on the spray
drier control panel, and can attain a maximum air temperature of approximately 270°C with
the fan at maximum speed. The heated air is then passed into the top of the spray drier
chamber. The humidity of the air stream is raised by spraying water into the drier chamber
through a pneumatic rotary atomiser. The water flow is provided by a peristaltic pump. As
the water evaporates, it cools the air stream, so that the humid air exits the spray drier
chamber at approximately 110°C.
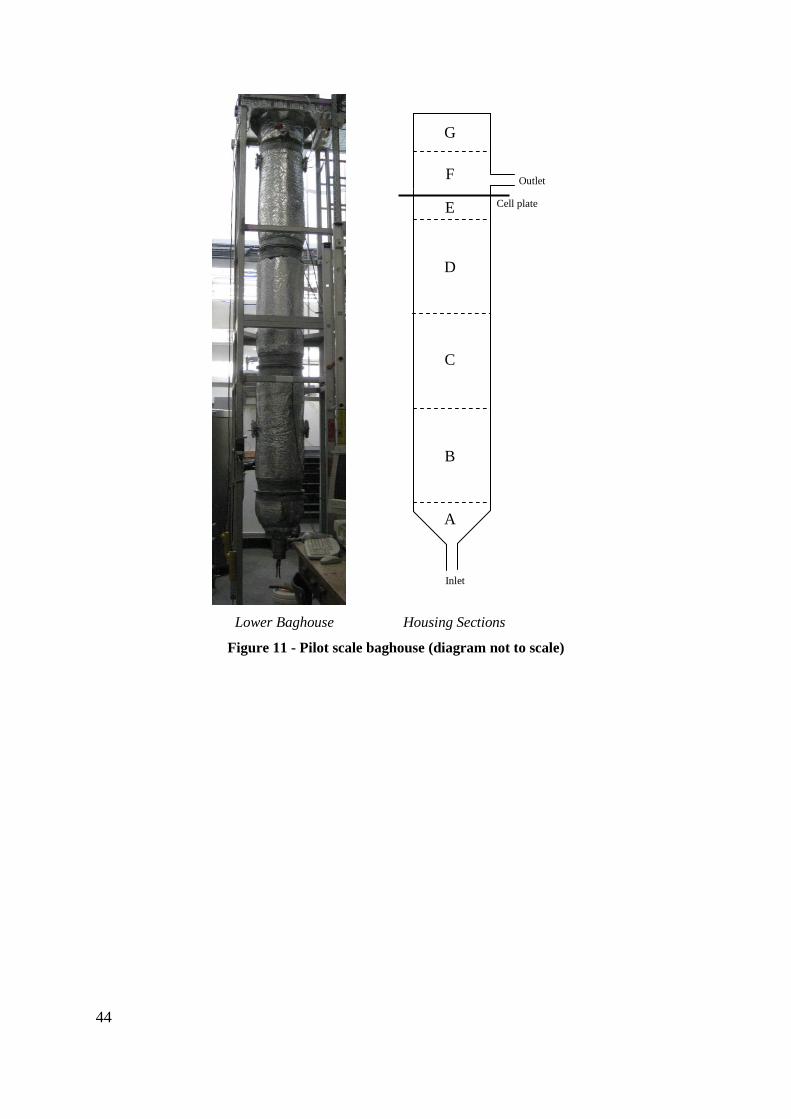
44
Lower Baghouse Housing Sections
Figure 11 - Pilot scale baghouse (diagram not to scale)
Outlet
Inlet
Cell plate
A
B
C
D
E
F
G
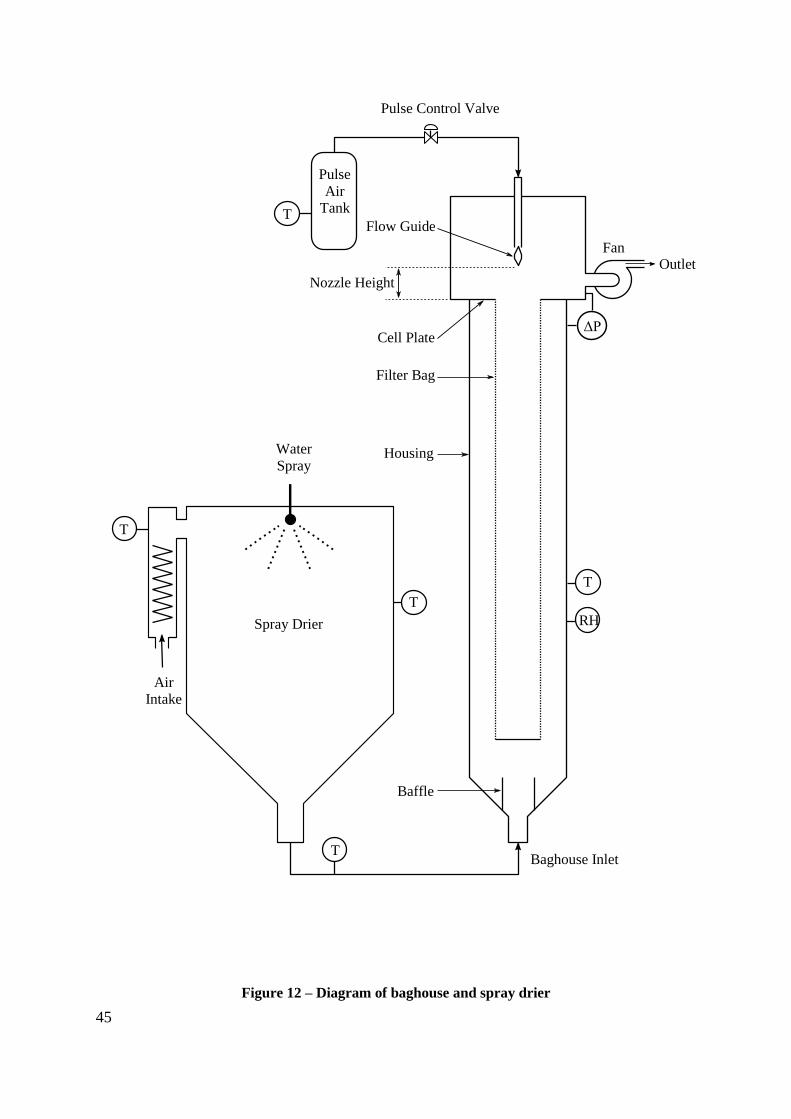
45
Figure 12 – Diagram of baghouse and spray drier
Pulse Control Valve
Pulse
Air
Tank
Flow Guide
Nozzle Height
Cell Plate
Outlet
Filter Bag
Housing
Baffle
Water
Spray
Air
Intake
Baghouse Inlet
Fan
Spray Drier
T
T
T
T
RH
ΔP
T
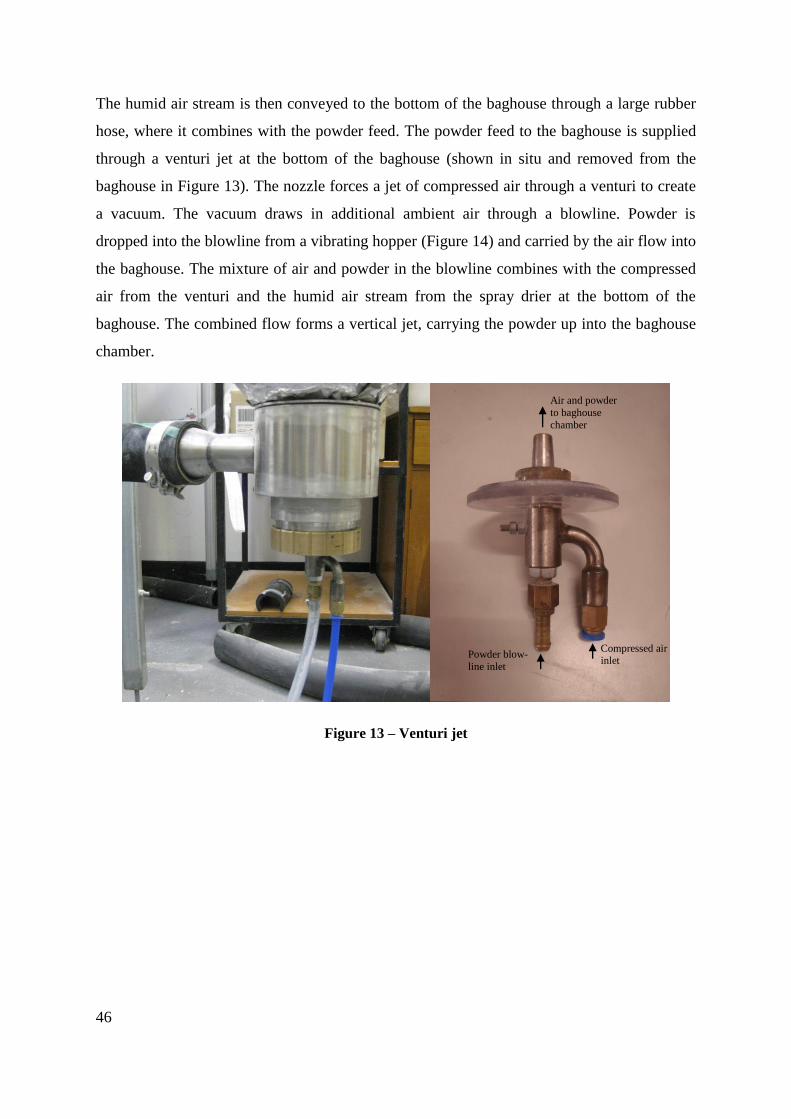
46
The humid air stream is then conveyed to the bottom of the baghouse through a large rubber
hose, where it combines with the powder feed. The powder feed to the baghouse is supplied
through a venturi jet at the bottom of the baghouse (shown in situ and removed from the
baghouse in Figure 13). The nozzle forces a jet of compressed air through a venturi to create
a vacuum. The vacuum draws in additional ambient air through a blowline. Powder is
dropped into the blowline from a vibrating hopper (Figure 14) and carried by the air flow into
the baghouse. The mixture of air and powder in the blowline combines with the compressed
air from the venturi and the humid air stream from the spray drier at the bottom of the
baghouse. The combined flow forms a vertical jet, carrying the powder up into the baghouse
chamber.
Figure 13 – Venturi jet
Powder blow-
line inlet
Compressed air inlet
Air and powder
to baghouse
chamber
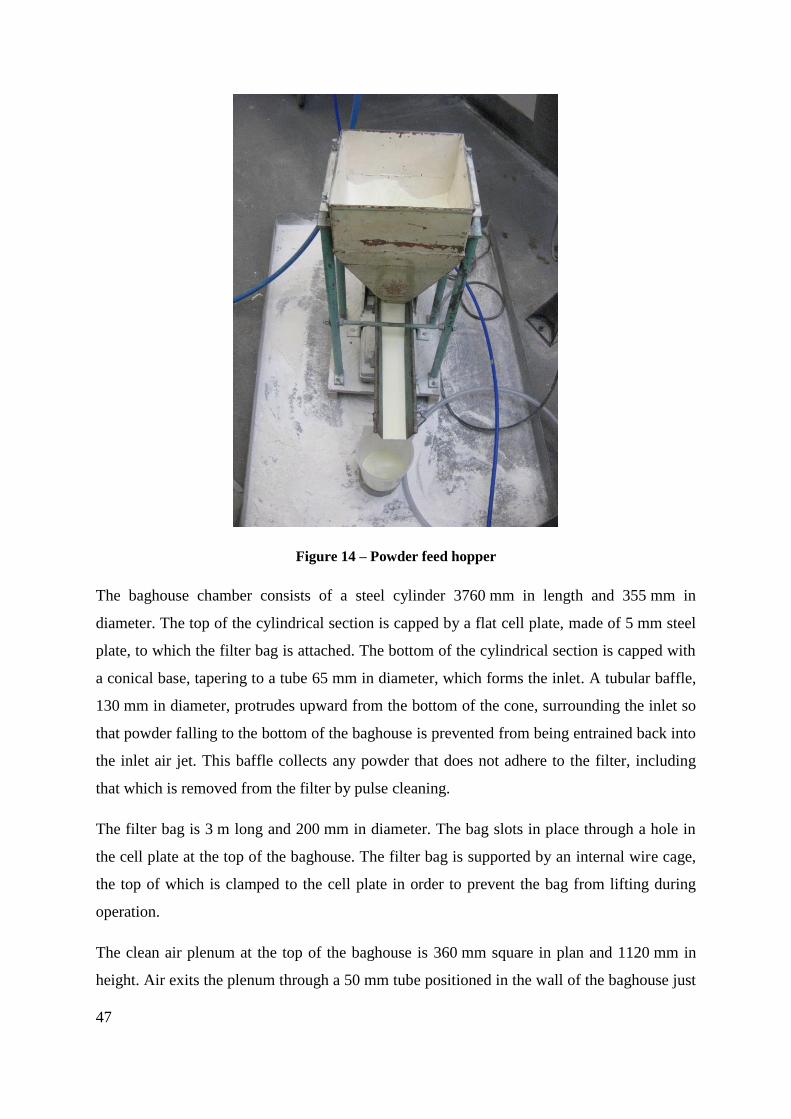
47
Figure 14 – Powder feed hopper
The baghouse chamber consists of a steel cylinder 3760 mm in length and 355 mm in
diameter. The top of the cylindrical section is capped by a flat cell plate, made of 5 mm steel
plate, to which the filter bag is attached. The bottom of the cylindrical section is capped with
a conical base, tapering to a tube 65 mm in diameter, which forms the inlet. A tubular baffle,
130 mm in diameter, protrudes upward from the bottom of the cone, surrounding the inlet so
that powder falling to the bottom of the baghouse is prevented from being entrained back into
the inlet air jet. This baffle collects any powder that does not adhere to the filter, including
that which is removed from the filter by pulse cleaning.
The filter bag is 3 m long and 200 mm in diameter. The bag slots in place through a hole in
the cell plate at the top of the baghouse. The filter bag is supported by an internal wire cage,
the top of which is clamped to the cell plate in order to prevent the bag from lifting during
operation.
The clean air plenum at the top of the baghouse is 360 mm square in plan and 1120 mm in
height. Air exits the plenum through a 50 mm tube positioned in the wall of the baghouse just
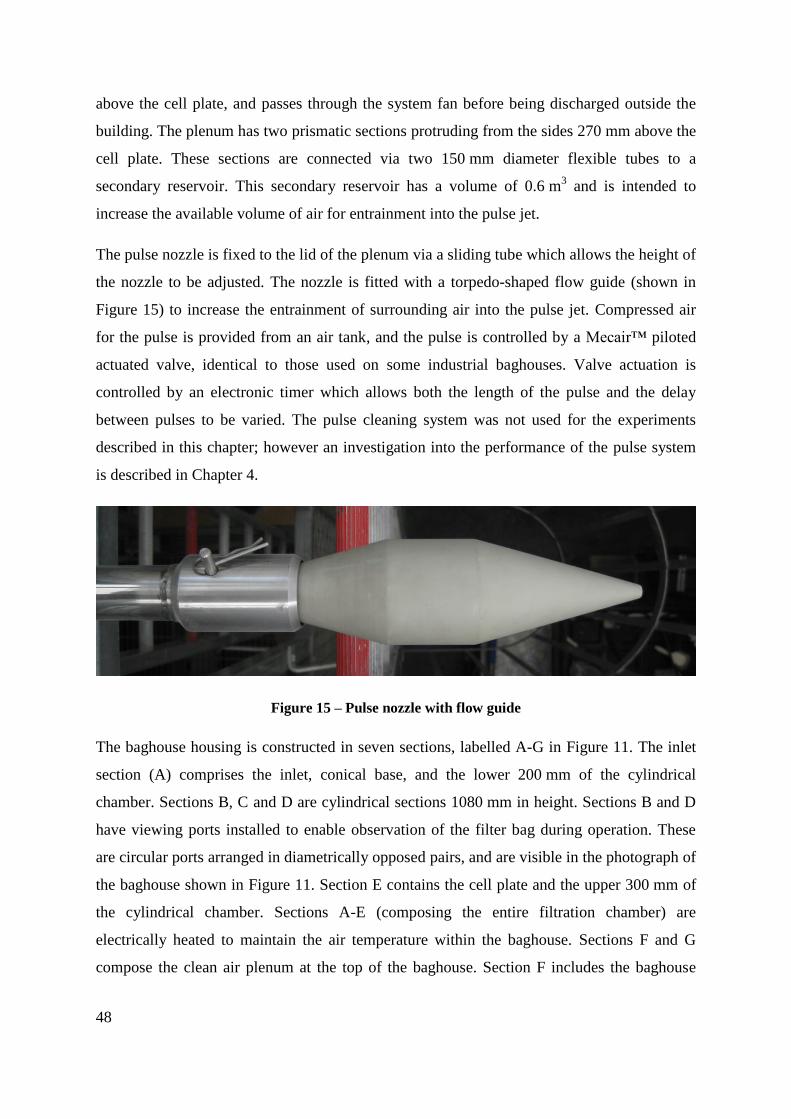
48
above the cell plate, and passes through the system fan before being discharged outside the
building. The plenum has two prismatic sections protruding from the sides 270 mm above the
cell plate. These sections are connected via two 150 mm diameter flexible tubes to a
secondary reservoir. This secondary reservoir has a volume of 0.6 m3 and is intended to
increase the available volume of air for entrainment into the pulse jet.
The pulse nozzle is fixed to the lid of the plenum via a sliding tube which allows the height of
the nozzle to be adjusted. The nozzle is fitted with a torpedo-shaped flow guide (shown in
Figure 15) to increase the entrainment of surrounding air into the pulse jet. Compressed air
for the pulse is provided from an air tank, and the pulse is controlled by a Mecair™ piloted
actuated valve, identical to those used on some industrial baghouses. Valve actuation is
controlled by an electronic timer which allows both the length of the pulse and the delay
between pulses to be varied. The pulse cleaning system was not used for the experiments
described in this chapter; however an investigation into the performance of the pulse system
is described in Chapter 4.
Figure 15 – Pulse nozzle with flow guide
The baghouse housing is constructed in seven sections, labelled A-G in Figure 11. The inlet
section (A) comprises the inlet, conical base, and the lower 200 mm of the cylindrical
chamber. Sections B, C and D are cylindrical sections 1080 mm in height. Sections B and D
have viewing ports installed to enable observation of the filter bag during operation. These
are circular ports arranged in diametrically opposed pairs, and are visible in the photograph of
the baghouse shown in Figure 11. Section E contains the cell plate and the upper 300 mm of
the cylindrical chamber. Sections A-E (composing the entire filtration chamber) are
electrically heated to maintain the air temperature within the baghouse. Sections F and G
compose the clean air plenum at the top of the baghouse. Section F includes the baghouse
49
outlet and the connections to the secondary reservoir. Section G includes the pulsing lance
and associated fittings.
The pressure differential across the filter bag is measured by an Intech™ LPN-DP pressure
cell, connected to measurement points above and below the cell plate. The air flow is
measured by a pitot tube at the outlet (downstream of the fan), with the pitot tube pressure
differential measured by another Intech™ LPN-DP pressure cell. The air temperature in the
outlet pipe is also measured with an RTD probe. These measurements are monitored by a
computer using an Advantech® PCL-789D PCI interface and Genie™ data-logging software.
Two Onset HOBO™ Pro v2 data-loggers are used to monitor the temperature and humidity
of the ambient air at the intake and of the humid air within the baghouse chamber.
3.3 Materials
3.3.1 Powders
In order to capture the effect of powder composition, two different powders, SMP and
MPC42, were used for experiments. These powders were both standard, non-agglomerated,
spray dried milk powders. SMP is a very common milk powder, with very low fat content
and high lactose content. SMP is generally considered a free-flowing powder, with good
transport properties and good chemical stability. Stickiness in SMP has been well studied
with regard to in-process fouling and caking during storage, so SMP provides a good
reference powder for these experiments. Stickiness in SMP is primarily due to the glass
transition of amorphous lactose, and is highly dependent on moisture content (Fitzpatrick et
al., 2004). MPC42 contains high levels of fat and protein, but relatively little lactose, and is
regarded as a cohesive powder with poor flowability. As fat tends to accumulate on the
particle surface in preference to lactose (Kim et al., 2002), the cohesive nature of this powder
is thought to be primarily due to liquid fat. MPC42 is also known to cause excessive blinding
in some baghouses in industry. The experiments with this powder aimed to characterize the
powder and identify the reason for the excessive blinding. A 25 kg bag of SMP and a 20 kg
bag of MPC42 powder were sourced from Fonterra’s stores. This provided sufficient quantity
for all experimental runs, ensuring that the powder composition was identical for all
experiments.
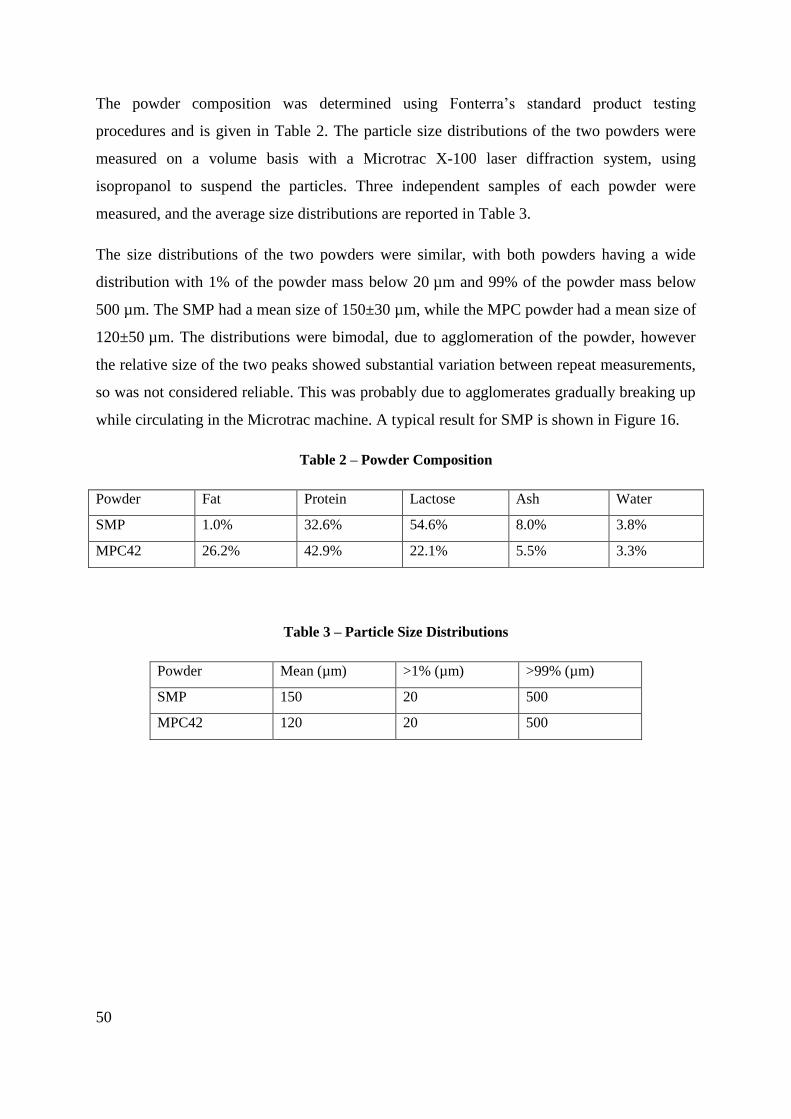
50
The powder composition was determined using Fonterra’s standard product testing
procedures and is given in Table 2. The particle size distributions of the two powders were
measured on a volume basis with a Microtrac X-100 laser diffraction system, using
isopropanol to suspend the particles. Three independent samples of each powder were
measured, and the average size distributions are reported in Table 3.
The size distributions of the two powders were similar, with both powders having a wide
distribution with 1% of the powder mass below 20 µm and 99% of the powder mass below
500 µm. The SMP had a mean size of 150±30 µm, while the MPC powder had a mean size of
120±50 µm. The distributions were bimodal, due to agglomeration of the powder, however
the relative size of the two peaks showed substantial variation between repeat measurements,
so was not considered reliable. This was probably due to agglomerates gradually breaking up
while circulating in the Microtrac machine. A typical result for SMP is shown in Figure 16.
Table 2 – Powder Composition
Powder Fat Protein Lactose Ash Water
SMP 1.0% 32.6% 54.6% 8.0% 3.8%
MPC42 26.2% 42.9% 22.1% 5.5% 3.3%
Table 3 – Particle Size Distributions
Powder Mean (µm) >1% (µm) >99% (µm)
SMP 150 20 500
MPC42 120 20 500
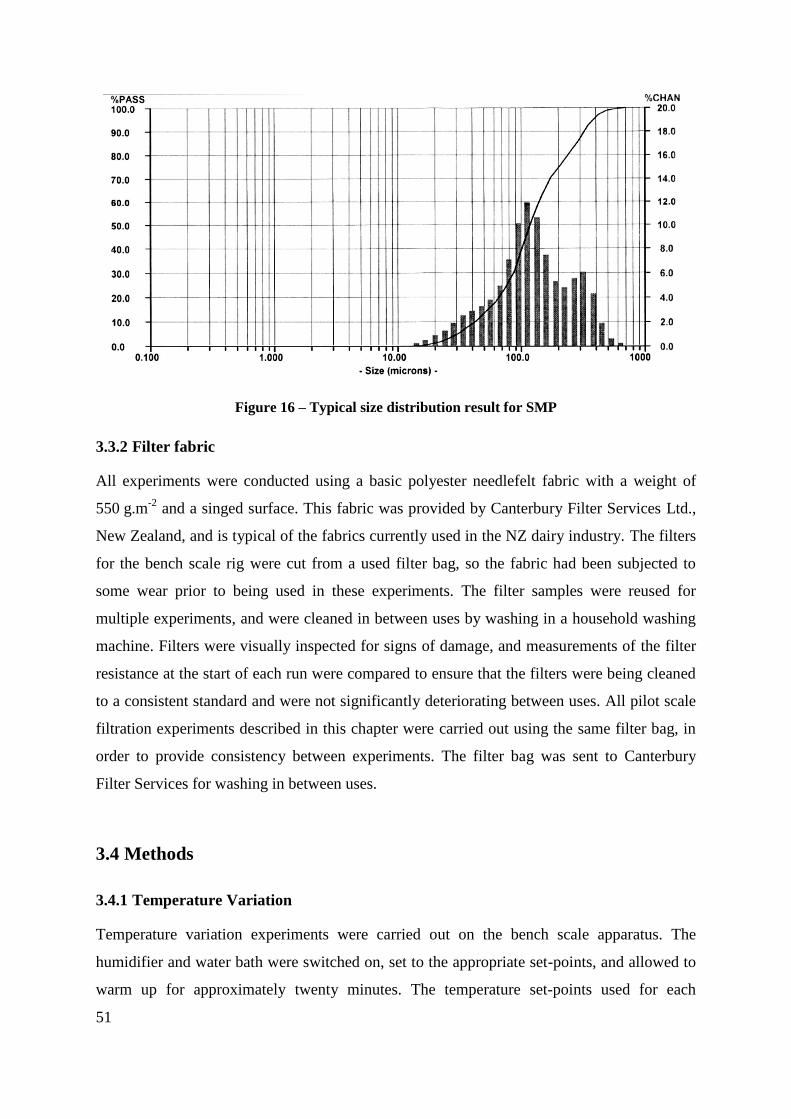
51
Figure 16 – Typical size distribution result for SMP
3.3.2 Filter fabric
All experiments were conducted using a basic polyester needlefelt fabric with a weight of
550 g.m-2
and a singed surface. This fabric was provided by Canterbury Filter Services Ltd.,
New Zealand, and is typical of the fabrics currently used in the NZ dairy industry. The filters
for the bench scale rig were cut from a used filter bag, so the fabric had been subjected to
some wear prior to being used in these experiments. The filter samples were reused for
multiple experiments, and were cleaned in between uses by washing in a household washing
machine. Filters were visually inspected for signs of damage, and measurements of the filter
resistance at the start of each run were compared to ensure that the filters were being cleaned
to a consistent standard and were not significantly deteriorating between uses. All pilot scale
filtration experiments described in this chapter were carried out using the same filter bag, in
order to provide consistency between experiments. The filter bag was sent to Canterbury
Filter Services for washing in between uses.
3.4 Methods
3.4.1 Temperature Variation
Temperature variation experiments were carried out on the bench scale apparatus. The
humidifier and water bath were switched on, set to the appropriate set-points, and allowed to
warm up for approximately twenty minutes. The temperature set-points used for each
52
condition are shown in Table 4. The temperature set-points used for the water bath were
obtained by trial and error, and were above the target temperatures to provide a temperature
gradient to drive the heating. Once the humidifier and water bath were within a few degrees
of the required temperature, the trace heating circuits for the humidifier lid, filtration chamber
and pipelines were switched on and set to the appropriate temperatures, again shown in Table
4. The humidifier lid and piping upstream of the water bath (Trace 1) were set 10°C above
the humidifier (saturation) temperature to prevent condensation in the tubes. The chamber
and piping downstream of the water bath (Trace 2) were set 2°C above the target temperature
(except for the 90°C condition), and again this was determined by trial and error in
combination with the water bath temperature. For the 90°C target temperature, the Trace 2
set-point was 5°C above the target temperature to provide additional heating, as the water
bath could not be heated above 100°C and was therefore unable to heat the air stream to the
required 90°C. Once all sections were at the correct temperature, the air flow was turned on at
the inlet and set to a flow of 23 L.min-1
as measured by the rotameter at the outlet. Once the
air flow was set, data logging was started, and the unit was left to stabilise for a period of
3 minutes. To prevent powder from caking in the hopper, the hopper was kept isolated from
the airflow during the warm-up period by placing a clamp on the section of flexible rubber
tube between the hopper and the blow-line. At the end of the warm up period, the clamp was
removed and the powder feed started. The feeder was run for four minutes, after which time
the powder feed was stopped and the isolation clamp replaced. The airflow was allowed to
run for a further 30 seconds to allow measurement of the final pressure drop, and then this too
was shut off. The filter was then carefully removed from the apparatus and weighed. Once
the filter had been removed, the filtration chamber was tapped to dislodge deposited powder,
dropping this into the collector. The collector was then removed and also weighed, to allow
determination of the total amount of powder fed into the system. A weighed clean filter was
then placed in the apparatus ready for the next run. At least six runs were carried out at each
condition to allow a statistical analysis of the results.
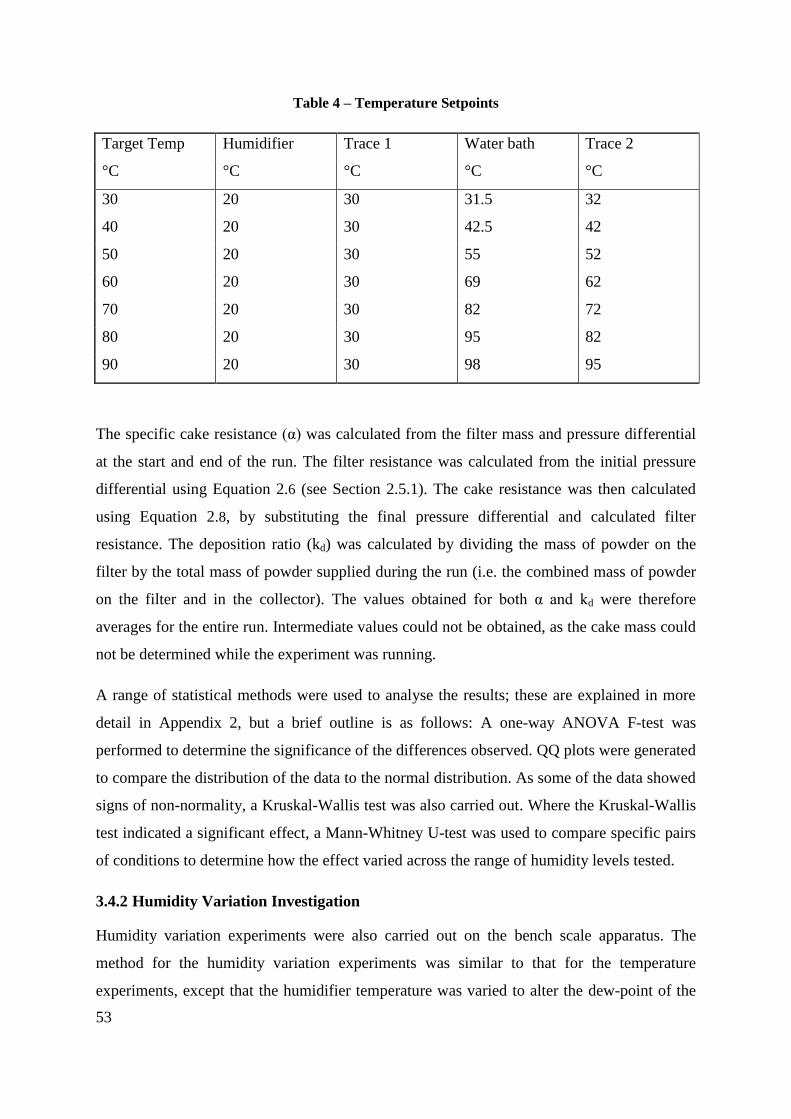
53
Table 4 – Temperature Setpoints
Target Temp Humidifier Trace 1 Water bath Trace 2
°C °C °C °C °C
30 20 30 31.5 32
40 20 30 42.5 42
50 20 30 55 52
60 20 30 69 62
70 20 30 82 72
80 20 30 95 82
90 20 30 98 95
The specific cake resistance (α) was calculated from the filter mass and pressure differential
at the start and end of the run. The filter resistance was calculated from the initial pressure
differential using Equation 2.6 (see Section 2.5.1). The cake resistance was then calculated
using Equation 2.8, by substituting the final pressure differential and calculated filter
resistance. The deposition ratio (kd) was calculated by dividing the mass of powder on the
filter by the total mass of powder supplied during the run (i.e. the combined mass of powder
on the filter and in the collector). The values obtained for both α and kd were therefore
averages for the entire run. Intermediate values could not be obtained, as the cake mass could
not be determined while the experiment was running.
A range of statistical methods were used to analyse the results; these are explained in more
detail in Appendix 2, but a brief outline is as follows: A one-way ANOVA F-test was
performed to determine the significance of the differences observed. QQ plots were generated
to compare the distribution of the data to the normal distribution. As some of the data showed
signs of non-normality, a Kruskal-Wallis test was also carried out. Where the Kruskal-Wallis
test indicated a significant effect, a Mann-Whitney U-test was used to compare specific pairs
of conditions to determine how the effect varied across the range of humidity levels tested.
3.4.2 Humidity Variation Investigation
Humidity variation experiments were also carried out on the bench scale apparatus. The
method for the humidity variation experiments was similar to that for the temperature
experiments, except that the humidifier temperature was varied to alter the dew-point of the
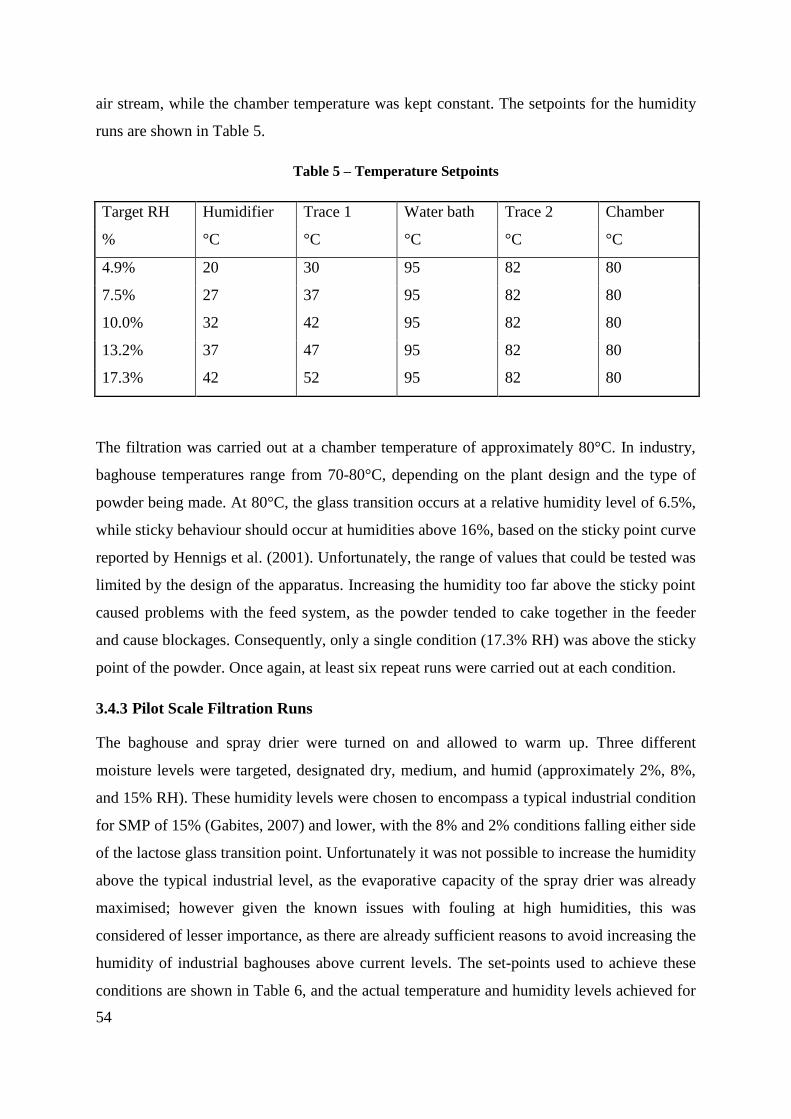
54
air stream, while the chamber temperature was kept constant. The setpoints for the humidity
runs are shown in Table 5.
Table 5 – Temperature Setpoints
Target RH Humidifier Trace 1 Water bath Trace 2 Chamber
% °C °C °C °C °C
4.9% 20 30 95 82 80
7.5% 27 37 95 82 80
10.0% 32 42 95 82 80
13.2% 37 47 95 82 80
17.3% 42 52 95 82 80
The filtration was carried out at a chamber temperature of approximately 80°C. In industry,
baghouse temperatures range from 70-80°C, depending on the plant design and the type of
powder being made. At 80°C, the glass transition occurs at a relative humidity level of 6.5%,
while sticky behaviour should occur at humidities above 16%, based on the sticky point curve
reported by Hennigs et al. (2001). Unfortunately, the range of values that could be tested was
limited by the design of the apparatus. Increasing the humidity too far above the sticky point
caused problems with the feed system, as the powder tended to cake together in the feeder
and cause blockages. Consequently, only a single condition (17.3% RH) was above the sticky
point of the powder. Once again, at least six repeat runs were carried out at each condition.
3.4.3 Pilot Scale Filtration Runs
The baghouse and spray drier were turned on and allowed to warm up. Three different
moisture levels were targeted, designated dry, medium, and humid (approximately 2%, 8%,
and 15% RH). These humidity levels were chosen to encompass a typical industrial condition
for SMP of 15% (Gabites, 2007) and lower, with the 8% and 2% conditions falling either side
of the lactose glass transition point. Unfortunately it was not possible to increase the humidity
above the typical industrial level, as the evaporative capacity of the spray drier was already
maximised; however given the known issues with fouling at high humidities, this was
considered of lesser importance, as there are already sufficient reasons to avoid increasing the
humidity of industrial baghouses above current levels. The set-points used to achieve these
conditions are shown in Table 6, and the actual temperature and humidity levels achieved for
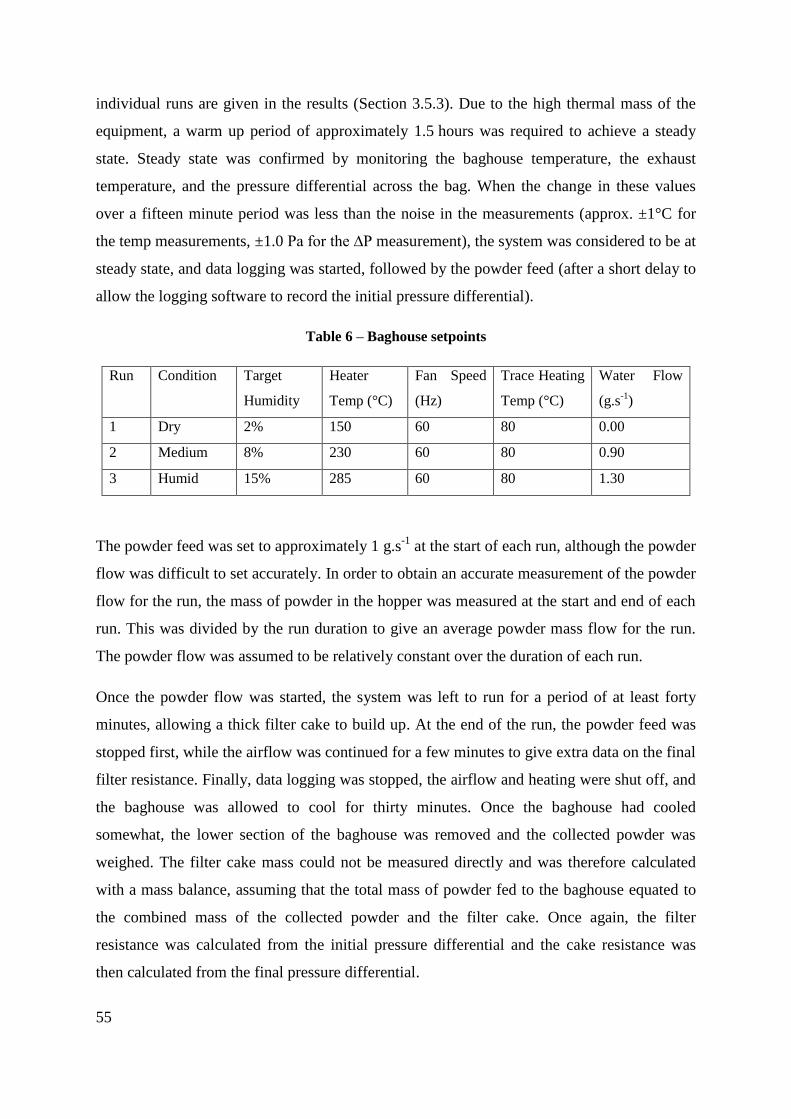
55
individual runs are given in the results (Section 3.5.3). Due to the high thermal mass of the
equipment, a warm up period of approximately 1.5 hours was required to achieve a steady
state. Steady state was confirmed by monitoring the baghouse temperature, the exhaust
temperature, and the pressure differential across the bag. When the change in these values
over a fifteen minute period was less than the noise in the measurements (approx. ±1°C for
the temp measurements, ±1.0 Pa for the ∆P measurement), the system was considered to be at
steady state, and data logging was started, followed by the powder feed (after a short delay to
allow the logging software to record the initial pressure differential).
Table 6 – Baghouse setpoints
Run Condition Target
Humidity
Heater
Temp (°C)
Fan Speed
(Hz)
Trace Heating
Temp (°C)
Water Flow
(g.s-1
)
1 Dry 2% 150 60 80 0.00
2 Medium 8% 230 60 80 0.90
3 Humid 15% 285 60 80 1.30
The powder feed was set to approximately 1 g.s-1
at the start of each run, although the powder
flow was difficult to set accurately. In order to obtain an accurate measurement of the powder
flow for the run, the mass of powder in the hopper was measured at the start and end of each
run. This was divided by the run duration to give an average powder mass flow for the run.
The powder flow was assumed to be relatively constant over the duration of each run.
Once the powder flow was started, the system was left to run for a period of at least forty
minutes, allowing a thick filter cake to build up. At the end of the run, the powder feed was
stopped first, while the airflow was continued for a few minutes to give extra data on the final
filter resistance. Finally, data logging was stopped, the airflow and heating were shut off, and
the baghouse was allowed to cool for thirty minutes. Once the baghouse had cooled
somewhat, the lower section of the baghouse was removed and the collected powder was
weighed. The filter cake mass could not be measured directly and was therefore calculated
with a mass balance, assuming that the total mass of powder fed to the baghouse equated to
the combined mass of the collected powder and the filter cake. Once again, the filter
resistance was calculated from the initial pressure differential and the cake resistance was
then calculated from the final pressure differential.
56
Three SMP runs were conducted at each condition (dry, medium, humid) to determine the
effect of humidity on the specific cake resistance, α, and the deposition ratio, kd. A single run
with MPC42 was also conducted to check whether α and kd were of similar magnitude to the
bench scale results, however the influence of humidity on MPC filtration was not investigated
at the pilot scale.
Measurements of α and kd from the SMP runs were fitted to linear mixed effects models
using the statistical software package R (R Core Team, 2013) to isolate the effects of the
different variables. Temperature, humidity, airflow, and powder flow were included as fixed
effects, and the round of experimentation was included as a random effect. The experiments
were conducted in three clusters of three runs each, with substantial delays between clusters –
each group was treated as a single round of experiments in the model to check for any
differences that may have arisen due to any unrecorded changes to the equipment or
procedures between clusters of experiments. A range of simpler models were then created by
removing terms from the initial model, and these were compared using the Akaike
information criterion (AIC) (see Appendix 2). Significance levels (p-values) for the effects of
all variables were estimated using the pvals.fnc function in the languageR package in R,
which uses a Markov Chain Monte Carlo (MCMC) sampling method to estimate the
p-values. As only a single MPC42 run was conducted on the pilot scale baghouse, the results
from this could not be statistically analysed. Results from the MPC42 run were used only for
direct comparison with the results from the bench scale experiments.
3.4.4 Particle Size Investigation
Two sets of experiments were carried out to determine the effects of particle size segregation
on the filtration process. Firstly, a pilot scale experiment was carried out to determine the
extent of segregation that occurs due to gravitational settling. Secondly, SMP powders with
different size distributions were filtered on the bench scale rig to determine the effect of
particle size on the filtration process.
For the pilot scale experiments, five small open jars were arranged at different heights within
the pilot scale baghouse. These were suspended from a string, at heights of 0.5 m, 1.2 m,
1.9 m, 2.6 m, and 3.3 m, as measured from the top of the baffle around the inlet, with the
open tops facing upward, so that powder would fall into the jars during filtration. A typical
filtration run (as described in Section 3.4.3) was carried out, and the size distribution of the
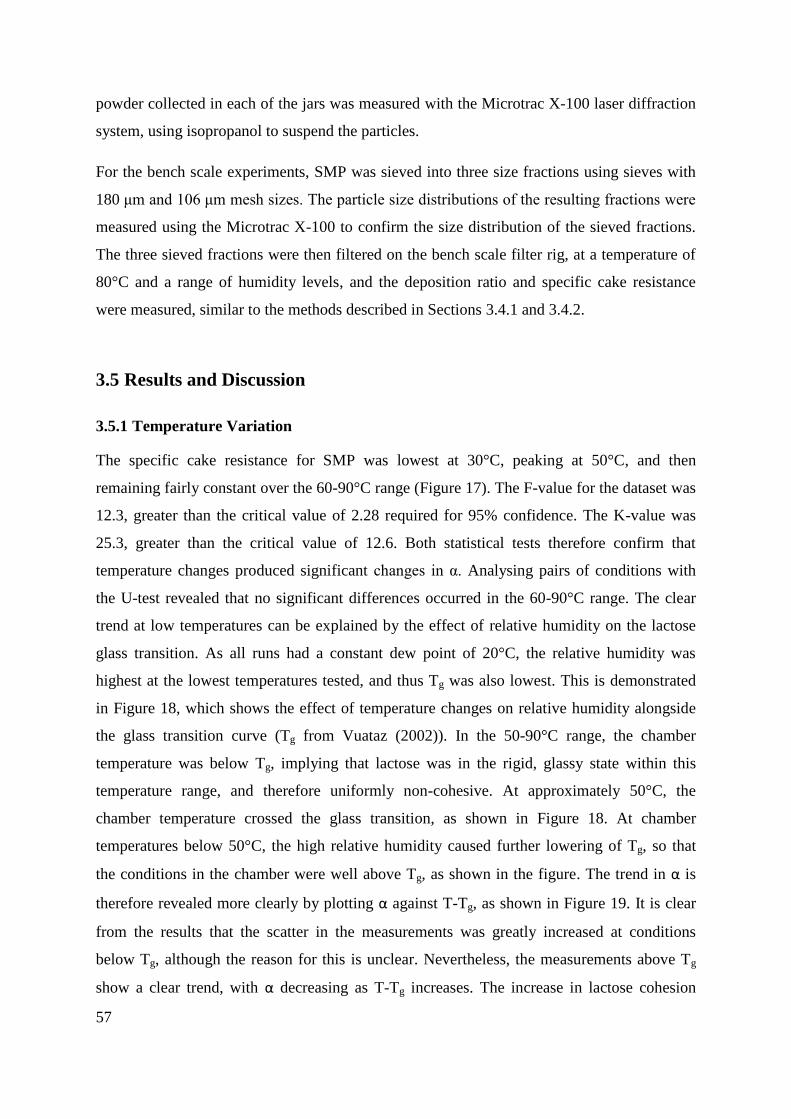
57
powder collected in each of the jars was measured with the Microtrac X-100 laser diffraction
system, using isopropanol to suspend the particles.
For the bench scale experiments, SMP was sieved into three size fractions using sieves with
180 μm and 106 μm mesh sizes. The particle size distributions of the resulting fractions were
measured using the Microtrac X-100 to confirm the size distribution of the sieved fractions.
The three sieved fractions were then filtered on the bench scale filter rig, at a temperature of
80°C and a range of humidity levels, and the deposition ratio and specific cake resistance
were measured, similar to the methods described in Sections 3.4.1 and 3.4.2.
3.5 Results and Discussion
3.5.1 Temperature Variation
The specific cake resistance for SMP was lowest at 30°C, peaking at 50°C, and then
remaining fairly constant over the 60-90°C range (Figure 17). The F-value for the dataset was
12.3, greater than the critical value of 2.28 required for 95% confidence. The K-value was
25.3, greater than the critical value of 12.6. Both statistical tests therefore confirm that
temperature changes produced significant changes in α. Analysing pairs of conditions with
the U-test revealed that no significant differences occurred in the 60-90°C range. The clear
trend at low temperatures can be explained by the effect of relative humidity on the lactose
glass transition. As all runs had a constant dew point of 20°C, the relative humidity was
highest at the lowest temperatures tested, and thus Tg was also lowest. This is demonstrated
in Figure 18, which shows the effect of temperature changes on relative humidity alongside
the glass transition curve (Tg from Vuataz (2002)). In the 50-90°C range, the chamber
temperature was below Tg, implying that lactose was in the rigid, glassy state within this
temperature range, and therefore uniformly non-cohesive. At approximately 50°C, the
chamber temperature crossed the glass transition, as shown in Figure 18. At chamber
temperatures below 50°C, the high relative humidity caused further lowering of Tg, so that
the conditions in the chamber were well above Tg, as shown in the figure. The trend in α is
therefore revealed more clearly by plotting α against T-Tg, as shown in Figure 19. It is clear
from the results that the scatter in the measurements was greatly increased at conditions
below Tg, although the reason for this is unclear. Nevertheless, the measurements above Tg
show a clear trend, with α decreasing as T-Tg increases. The increase in lactose cohesion
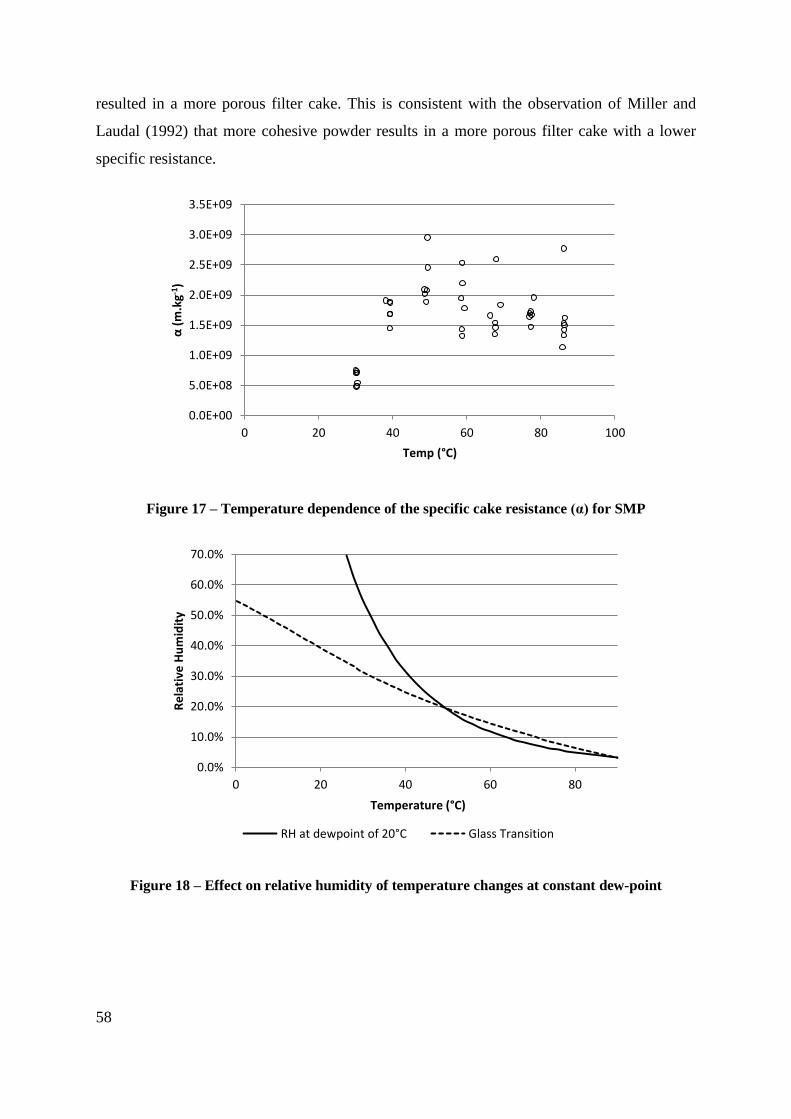
58
resulted in a more porous filter cake. This is consistent with the observation of Miller and
Laudal (1992) that more cohesive powder results in a more porous filter cake with a lower
specific resistance.
Figure 17 – Temperature dependence of the specific cake resistance (α) for SMP
Figure 18 – Effect on relative humidity of temperature changes at constant dew-point
0.0E+00
5.0E+08
1.0E+09
1.5E+09
2.0E+09
2.5E+09
3.0E+09
3.5E+09
0 20 40 60 80 100
α (
m.k
g-1)
Temp (°C)
0.0%
10.0%
20.0%
30.0%
40.0%
50.0%
60.0%
70.0%
0 20 40 60 80
Re
lati
ve H
um
idit
y
Temperature (°C)
RH at dewpoint of 20°C Glass Transition
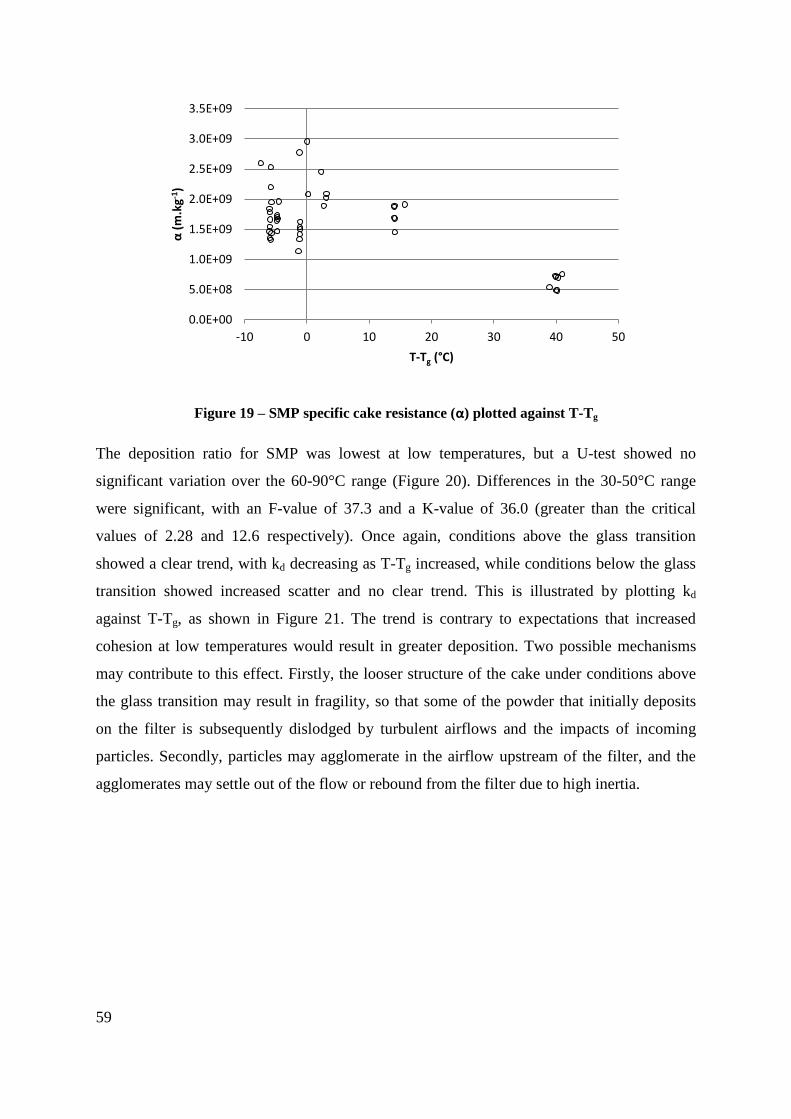
59
Figure 19 – SMP specific cake resistance (α) plotted against T-Tg
The deposition ratio for SMP was lowest at low temperatures, but a U-test showed no
significant variation over the 60-90°C range (Figure 20). Differences in the 30-50°C range
were significant, with an F-value of 37.3 and a K-value of 36.0 (greater than the critical
values of 2.28 and 12.6 respectively). Once again, conditions above the glass transition
showed a clear trend, with kd decreasing as T-Tg increased, while conditions below the glass
transition showed increased scatter and no clear trend. This is illustrated by plotting kd
against T-Tg, as shown in Figure 21. The trend is contrary to expectations that increased
cohesion at low temperatures would result in greater deposition. Two possible mechanisms
may contribute to this effect. Firstly, the looser structure of the cake under conditions above
the glass transition may result in fragility, so that some of the powder that initially deposits
on the filter is subsequently dislodged by turbulent airflows and the impacts of incoming
particles. Secondly, particles may agglomerate in the airflow upstream of the filter, and the
agglomerates may settle out of the flow or rebound from the filter due to high inertia.
0.0E+00
5.0E+08
1.0E+09
1.5E+09
2.0E+09
2.5E+09
3.0E+09
3.5E+09
-10 0 10 20 30 40 50
α (
m.k
g-1)
T-Tg (°C)
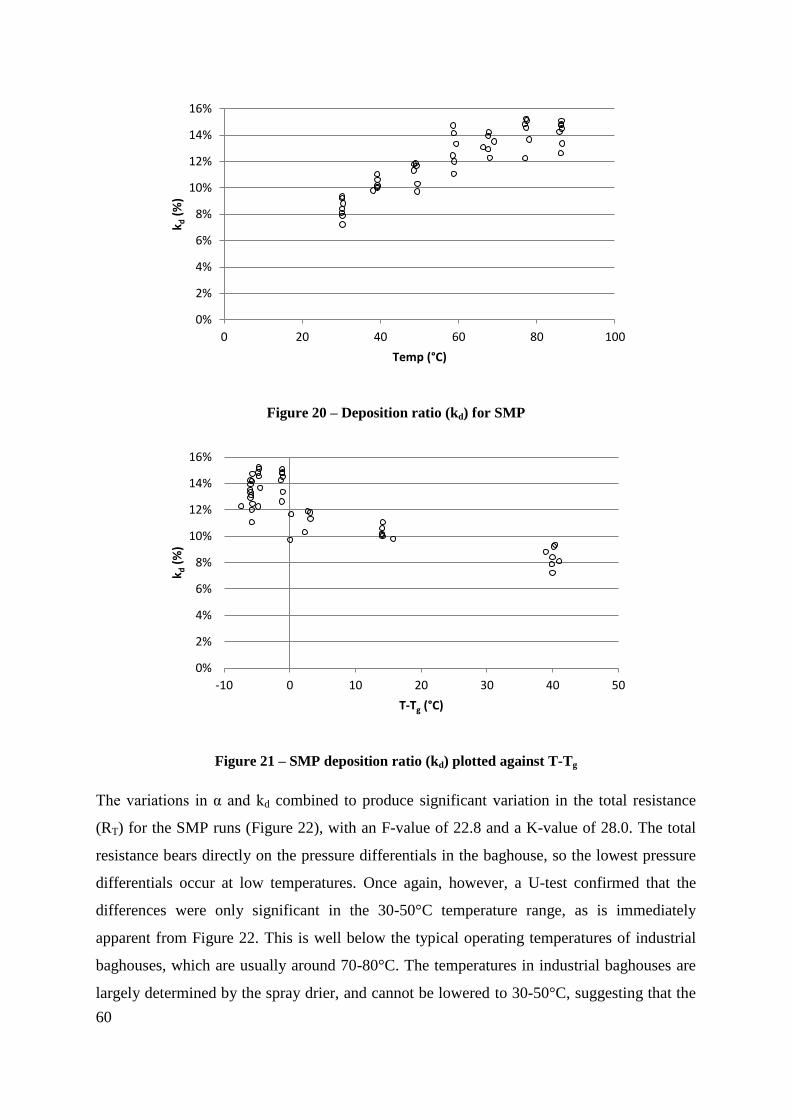
60
Figure 20 – Deposition ratio (kd) for SMP
Figure 21 – SMP deposition ratio (kd) plotted against T-Tg
The variations in α and kd combined to produce significant variation in the total resistance
(RT) for the SMP runs (Figure 22), with an F-value of 22.8 and a K-value of 28.0. The total
resistance bears directly on the pressure differentials in the baghouse, so the lowest pressure
differentials occur at low temperatures. Once again, however, a U-test confirmed that the
differences were only significant in the 30-50°C temperature range, as is immediately
apparent from Figure 22. This is well below the typical operating temperatures of industrial
baghouses, which are usually around 70-80°C. The temperatures in industrial baghouses are
largely determined by the spray drier, and cannot be lowered to 30-50°C, suggesting that the
0%
2%
4%
6%
8%
10%
12%
14%
16%
0 20 40 60 80 100
k d (
%)
Temp (°C)
0%
2%
4%
6%
8%
10%
12%
14%
16%
-10 0 10 20 30 40 50
k d (
%)
T-Tg (°C)
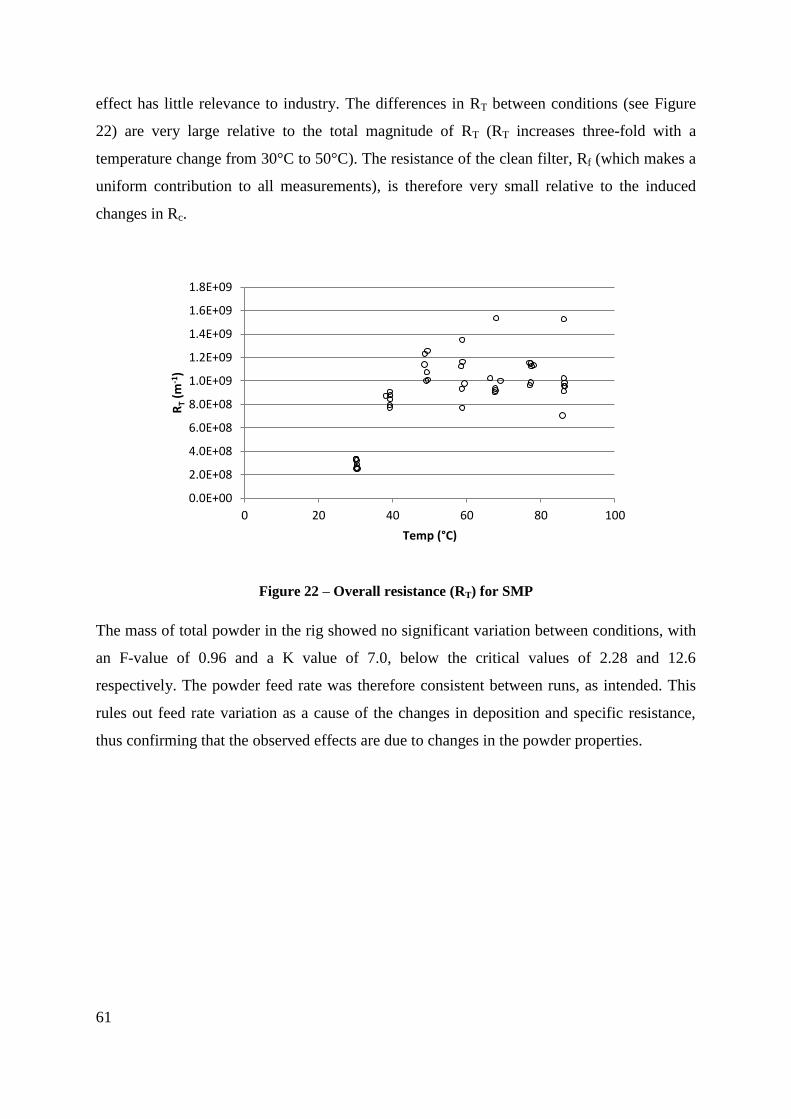
61
effect has little relevance to industry. The differences in RT between conditions (see Figure
22) are very large relative to the total magnitude of RT (RT increases three-fold with a
temperature change from 30°C to 50°C). The resistance of the clean filter, Rf (which makes a
uniform contribution to all measurements), is therefore very small relative to the induced
changes in Rc.
Figure 22 – Overall resistance (RT) for SMP
The mass of total powder in the rig showed no significant variation between conditions, with
an F-value of 0.96 and a K value of 7.0, below the critical values of 2.28 and 12.6
respectively. The powder feed rate was therefore consistent between runs, as intended. This
rules out feed rate variation as a cause of the changes in deposition and specific resistance,
thus confirming that the observed effects are due to changes in the powder properties.
0.0E+00
2.0E+08
4.0E+08
6.0E+08
8.0E+08
1.0E+09
1.2E+09
1.4E+09
1.6E+09
1.8E+09
0 20 40 60 80 100
RT (
m-1
)
Temp (°C)
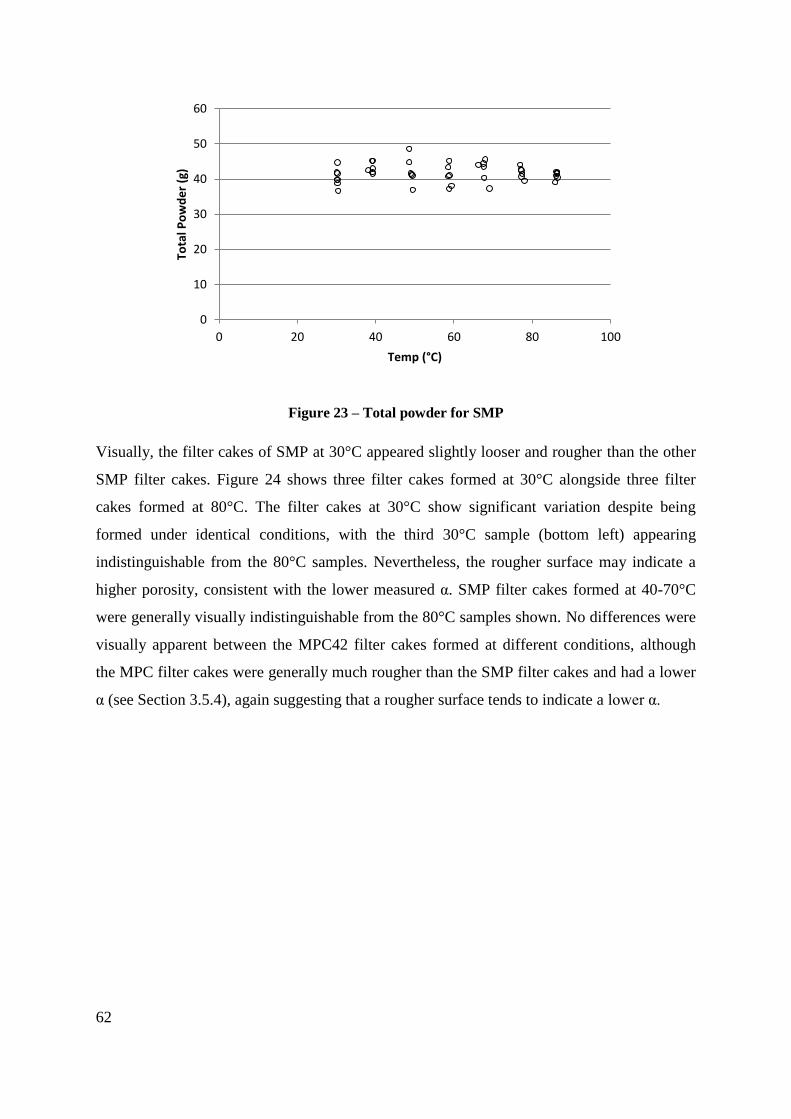
62
Figure 23 – Total powder for SMP
Visually, the filter cakes of SMP at 30°C appeared slightly looser and rougher than the other
SMP filter cakes. Figure 24 shows three filter cakes formed at 30°C alongside three filter
cakes formed at 80°C. The filter cakes at 30°C show significant variation despite being
formed under identical conditions, with the third 30°C sample (bottom left) appearing
indistinguishable from the 80°C samples. Nevertheless, the rougher surface may indicate a
higher porosity, consistent with the lower measured α. SMP filter cakes formed at 40-70°C
were generally visually indistinguishable from the 80°C samples shown. No differences were
visually apparent between the MPC42 filter cakes formed at different conditions, although
the MPC filter cakes were generally much rougher than the SMP filter cakes and had a lower
α (see Section 3.5.4), again suggesting that a rougher surface tends to indicate a lower α.
0
10
20
30
40
50
60
0 20 40 60 80 100
Tota
l Po
wd
er
(g)
Temp (°C)
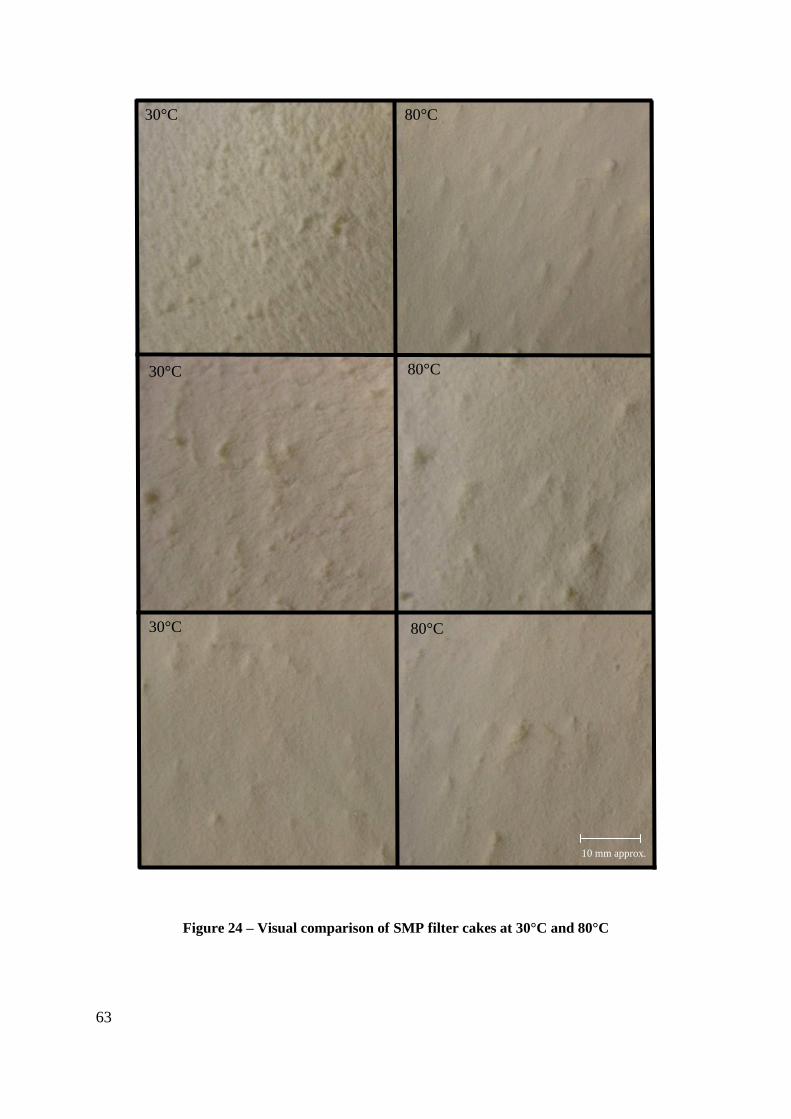
63
30°C
30°C
30°C
80°C
80°C
80°C
10 mm approx.
Figure 24 – Visual comparison of SMP filter cakes at 30°C and 80°C
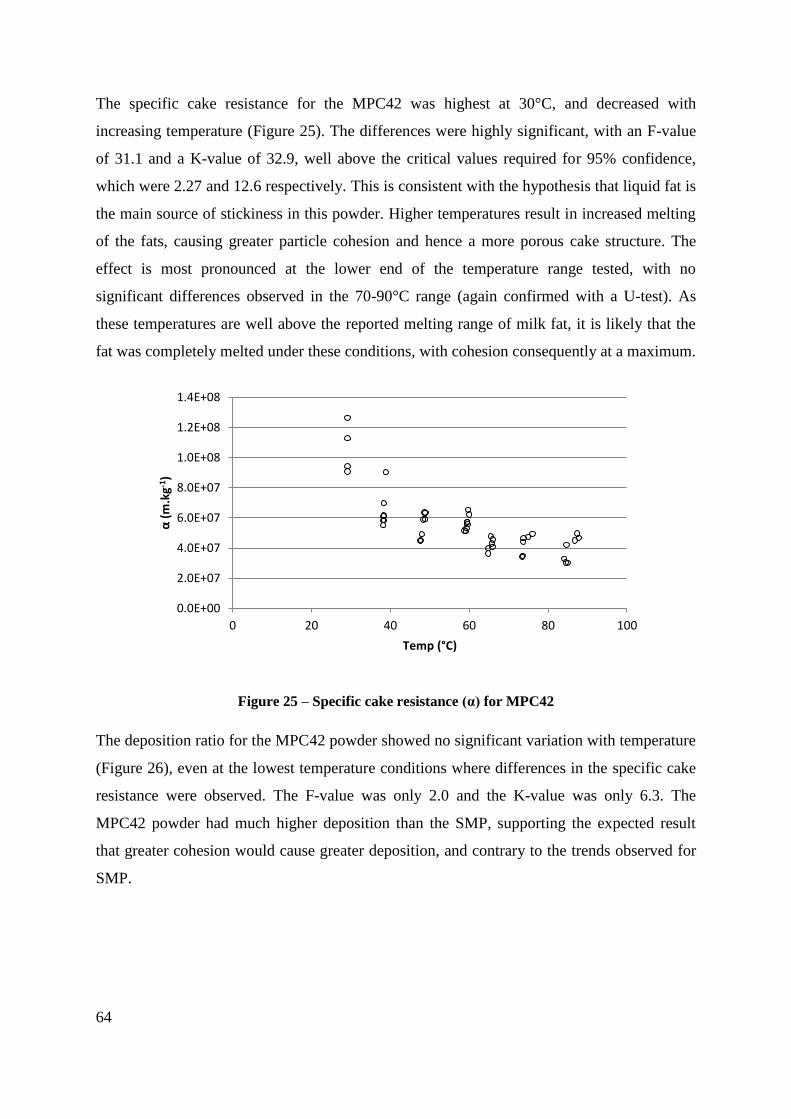
64
The specific cake resistance for the MPC42 was highest at 30°C, and decreased with
increasing temperature (Figure 25). The differences were highly significant, with an F-value
of 31.1 and a K-value of 32.9, well above the critical values required for 95% confidence,
which were 2.27 and 12.6 respectively. This is consistent with the hypothesis that liquid fat is
the main source of stickiness in this powder. Higher temperatures result in increased melting
of the fats, causing greater particle cohesion and hence a more porous cake structure. The
effect is most pronounced at the lower end of the temperature range tested, with no
significant differences observed in the 70-90°C range (again confirmed with a U-test). As
these temperatures are well above the reported melting range of milk fat, it is likely that the
fat was completely melted under these conditions, with cohesion consequently at a maximum.
Figure 25 – Specific cake resistance (α) for MPC42
The deposition ratio for the MPC42 powder showed no significant variation with temperature
(Figure 26), even at the lowest temperature conditions where differences in the specific cake
resistance were observed. The F-value was only 2.0 and the K-value was only 6.3. The
MPC42 powder had much higher deposition than the SMP, supporting the expected result
that greater cohesion would cause greater deposition, and contrary to the trends observed for
SMP.
0.0E+00
2.0E+07
4.0E+07
6.0E+07
8.0E+07
1.0E+08
1.2E+08
1.4E+08
0 20 40 60 80 100
α (
m.k
g-1)
Temp (°C)
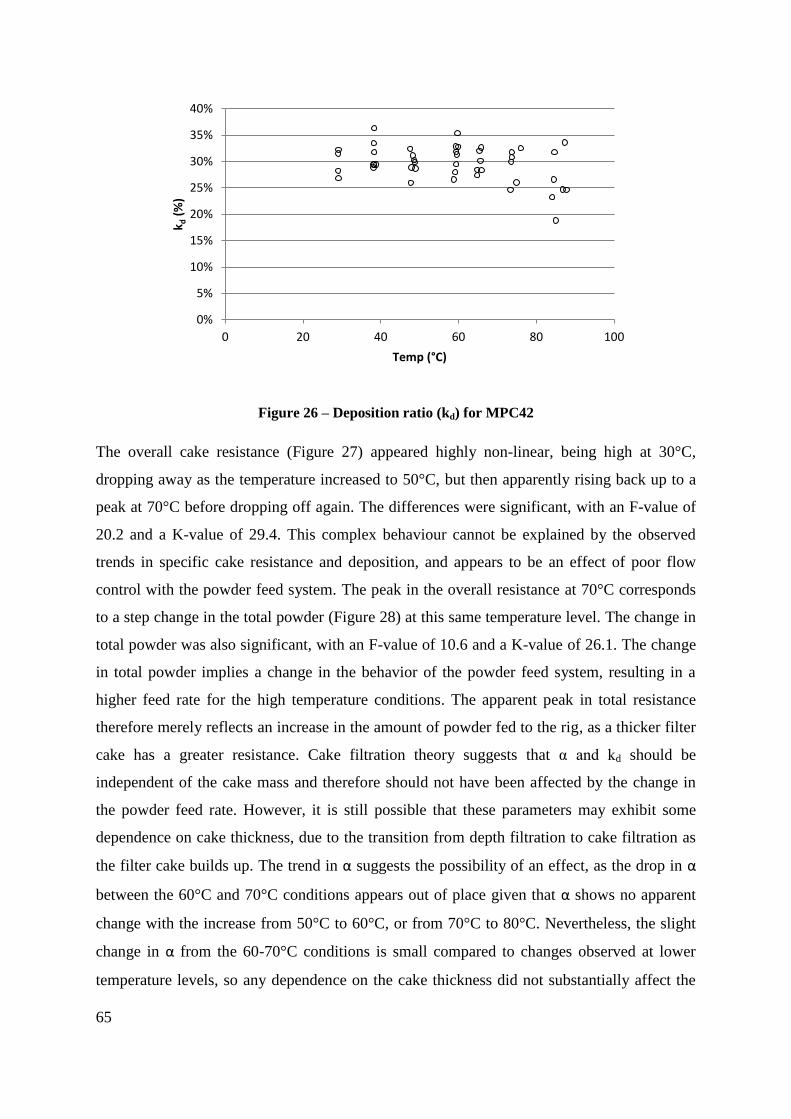
65
Figure 26 – Deposition ratio (kd) for MPC42
The overall cake resistance (Figure 27) appeared highly non-linear, being high at 30°C,
dropping away as the temperature increased to 50°C, but then apparently rising back up to a
peak at 70°C before dropping off again. The differences were significant, with an F-value of
20.2 and a K-value of 29.4. This complex behaviour cannot be explained by the observed
trends in specific cake resistance and deposition, and appears to be an effect of poor flow
control with the powder feed system. The peak in the overall resistance at 70°C corresponds
to a step change in the total powder (Figure 28) at this same temperature level. The change in
total powder was also significant, with an F-value of 10.6 and a K-value of 26.1. The change
in total powder implies a change in the behavior of the powder feed system, resulting in a
higher feed rate for the high temperature conditions. The apparent peak in total resistance
therefore merely reflects an increase in the amount of powder fed to the rig, as a thicker filter
cake has a greater resistance. Cake filtration theory suggests that α and kd should be
independent of the cake mass and therefore should not have been affected by the change in
the powder feed rate. However, it is still possible that these parameters may exhibit some
dependence on cake thickness, due to the transition from depth filtration to cake filtration as
the filter cake builds up. The trend in α suggests the possibility of an effect, as the drop in α
between the 60°C and 70°C conditions appears out of place given that α shows no apparent
change with the increase from 50°C to 60°C, or from 70°C to 80°C. Nevertheless, the slight
change in α from the 60-70°C conditions is small compared to changes observed at lower
temperature levels, so any dependence on the cake thickness did not substantially affect the
0%
5%
10%
15%
20%
25%
30%
35%
40%
0 20 40 60 80 100
k d (
%)
Temp (°C)
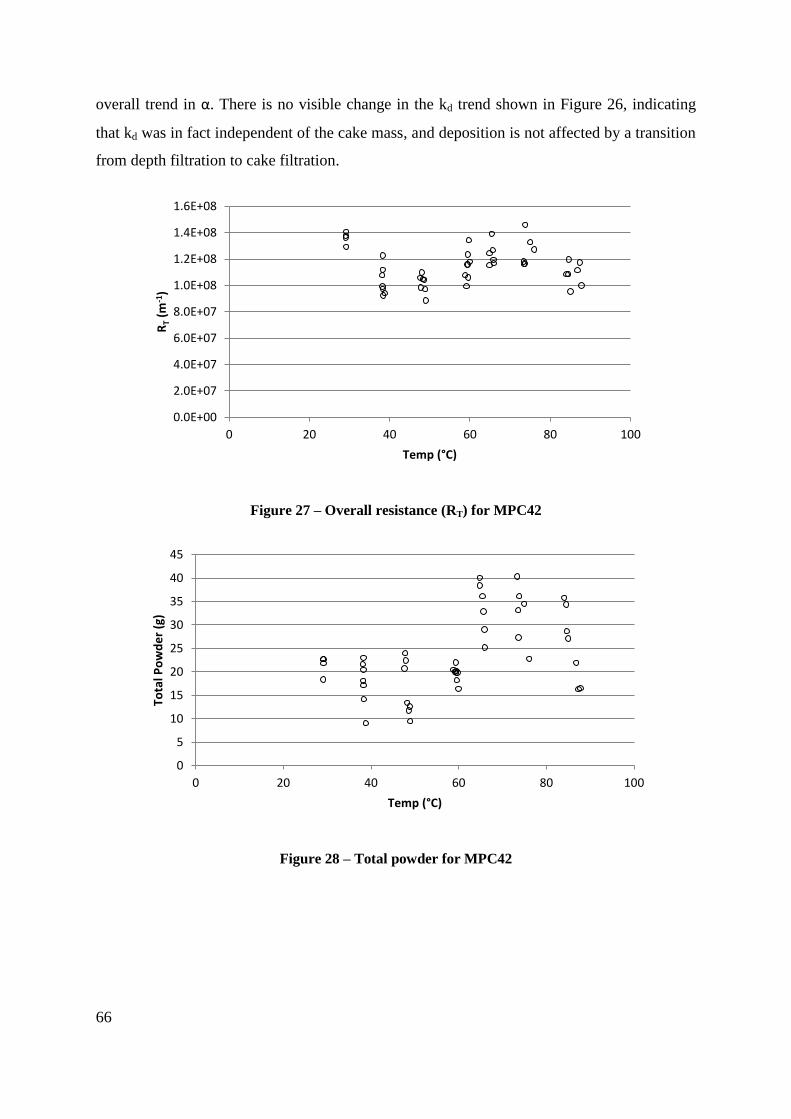
66
overall trend in α. There is no visible change in the kd trend shown in Figure 26, indicating
that kd was in fact independent of the cake mass, and deposition is not affected by a transition
from depth filtration to cake filtration.
Figure 27 – Overall resistance (RT) for MPC42
Figure 28 – Total powder for MPC42
0.0E+00
2.0E+07
4.0E+07
6.0E+07
8.0E+07
1.0E+08
1.2E+08
1.4E+08
1.6E+08
0 20 40 60 80 100
RT
(m-1
)
Temp (°C)
0
5
10
15
20
25
30
35
40
45
0 20 40 60 80 100
Tota
l Po
wd
er
(g)
Temp (°C)
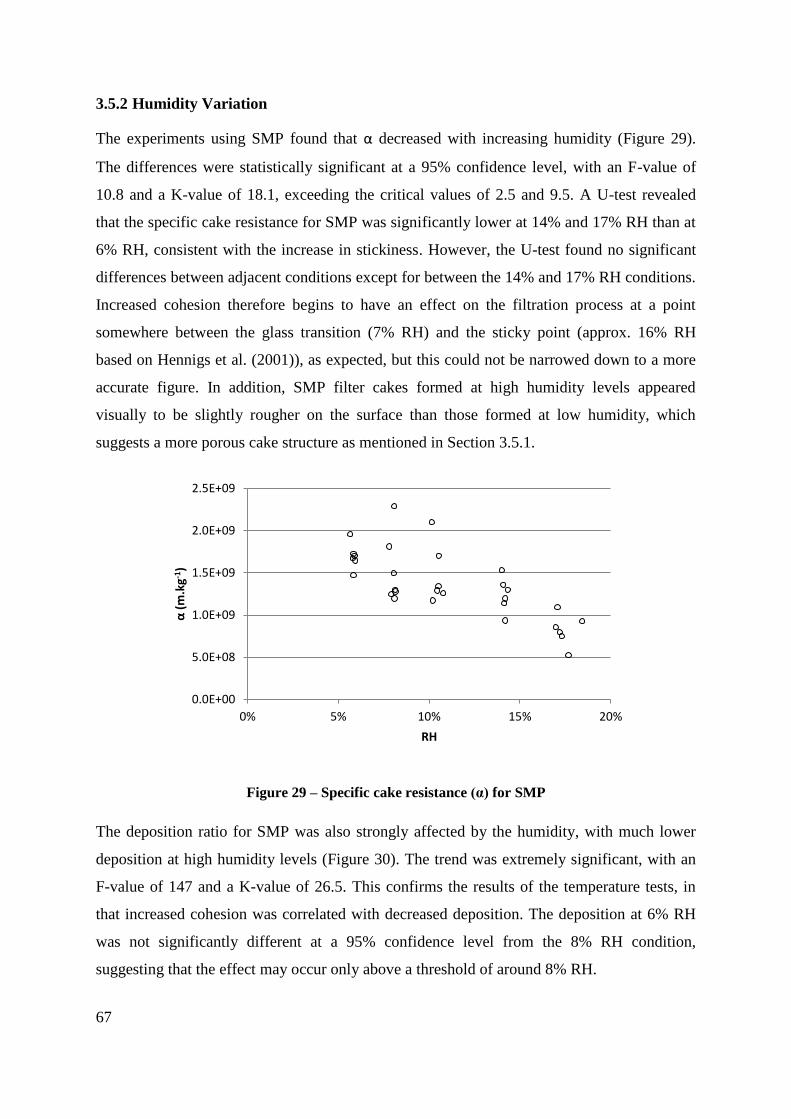
67
3.5.2 Humidity Variation
The experiments using SMP found that α decreased with increasing humidity (Figure 29).
The differences were statistically significant at a 95% confidence level, with an F-value of
10.8 and a K-value of 18.1, exceeding the critical values of 2.5 and 9.5. A U-test revealed
that the specific cake resistance for SMP was significantly lower at 14% and 17% RH than at
6% RH, consistent with the increase in stickiness. However, the U-test found no significant
differences between adjacent conditions except for between the 14% and 17% RH conditions.
Increased cohesion therefore begins to have an effect on the filtration process at a point
somewhere between the glass transition (7% RH) and the sticky point (approx. 16% RH
based on Hennigs et al. (2001)), as expected, but this could not be narrowed down to a more
accurate figure. In addition, SMP filter cakes formed at high humidity levels appeared
visually to be slightly rougher on the surface than those formed at low humidity, which
suggests a more porous cake structure as mentioned in Section 3.5.1.
Figure 29 – Specific cake resistance (α) for SMP
The deposition ratio for SMP was also strongly affected by the humidity, with much lower
deposition at high humidity levels (Figure 30). The trend was extremely significant, with an
F-value of 147 and a K-value of 26.5. This confirms the results of the temperature tests, in
that increased cohesion was correlated with decreased deposition. The deposition at 6% RH
was not significantly different at a 95% confidence level from the 8% RH condition,
suggesting that the effect may occur only above a threshold of around 8% RH.
0.0E+00
5.0E+08
1.0E+09
1.5E+09
2.0E+09
2.5E+09
0% 5% 10% 15% 20%
α (
m.k
g-1)
RH
68
Figure 30 – Deposition ratio (kd) for SMP
The reduction in deposition combined with the reduction in α to produce a strong reduction in
the overall resistance (Figure 31). The trend was again highly significant, with an F-value of
42 and a K-value of 24.2. This translates directly to a lower pressure differential across the
filter, and therefore indicates that high humidity is beneficial in terms of baghouse operation.
Figure 31 – Overall resistance (RT) for SMP
The total powder supplied (Figure 32) showed statistically significant variation, with an
F-value of 14.3 and a K-value of 19.5, due to poor flow control from the vibrating hopper.
Nevertheless, the variation in powder feed between conditions was relatively small, and the
0%
2%
4%
6%
8%
10%
12%
14%
16%
18%
0% 5% 10% 15% 20%
k d (
%)
RH
0.0E+00
2.0E+08
4.0E+08
6.0E+08
8.0E+08
1.0E+09
1.2E+09
1.4E+09
0% 5% 10% 15% 20%
RT (
m-1
)
RH
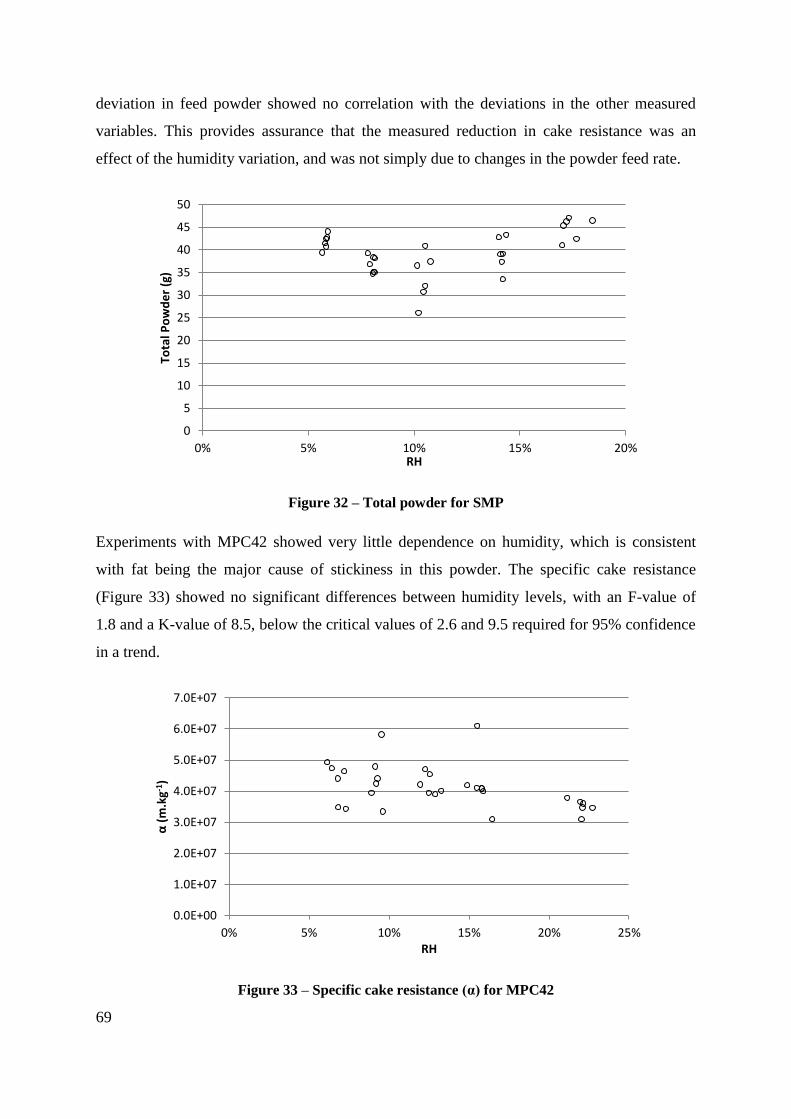
69
deviation in feed powder showed no correlation with the deviations in the other measured
variables. This provides assurance that the measured reduction in cake resistance was an
effect of the humidity variation, and was not simply due to changes in the powder feed rate.
Figure 32 – Total powder for SMP
Experiments with MPC42 showed very little dependence on humidity, which is consistent
with fat being the major cause of stickiness in this powder. The specific cake resistance
(Figure 33) showed no significant differences between humidity levels, with an F-value of
1.8 and a K-value of 8.5, below the critical values of 2.6 and 9.5 required for 95% confidence
in a trend.
Figure 33 – Specific cake resistance (α) for MPC42
0
5
10
15
20
25
30
35
40
45
50
0% 5% 10% 15% 20%
Tota
l Po
wd
er
(g)
RH
0.0E+00
1.0E+07
2.0E+07
3.0E+07
4.0E+07
5.0E+07
6.0E+07
7.0E+07
0% 5% 10% 15% 20% 25%
α (
m.k
g-1)
RH
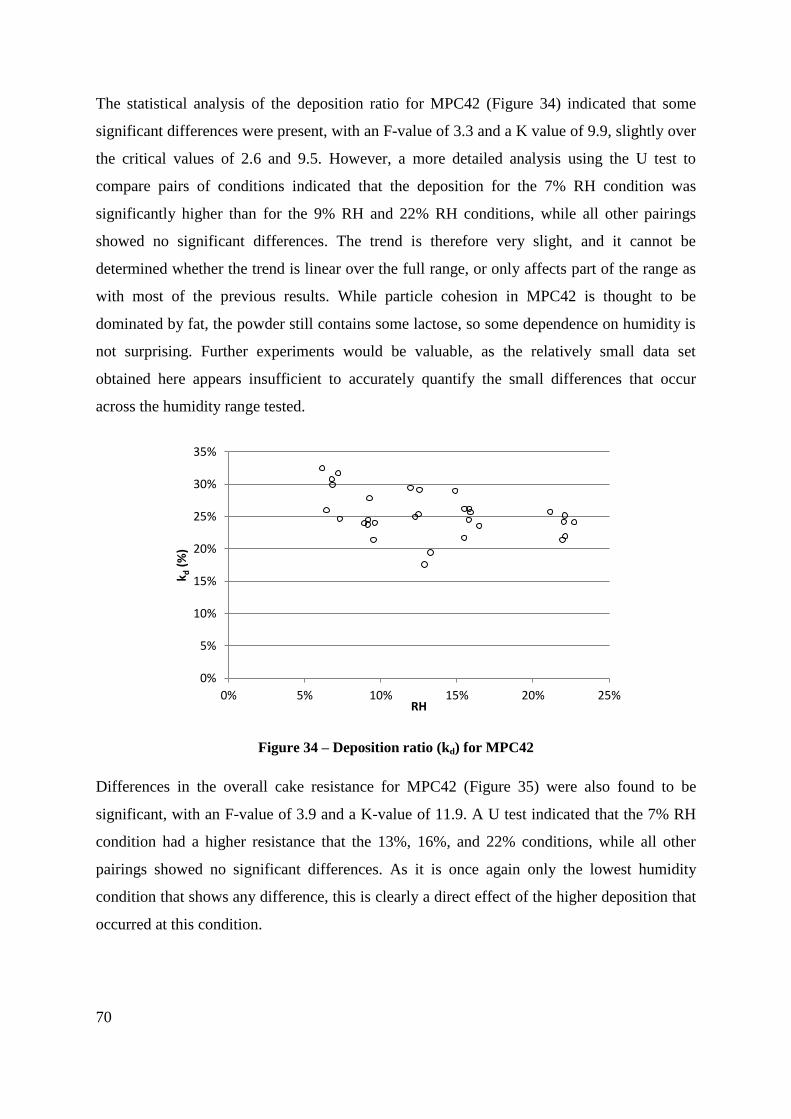
70
The statistical analysis of the deposition ratio for MPC42 (Figure 34) indicated that some
significant differences were present, with an F-value of 3.3 and a K value of 9.9, slightly over
the critical values of 2.6 and 9.5. However, a more detailed analysis using the U test to
compare pairs of conditions indicated that the deposition for the 7% RH condition was
significantly higher than for the 9% RH and 22% RH conditions, while all other pairings
showed no significant differences. The trend is therefore very slight, and it cannot be
determined whether the trend is linear over the full range, or only affects part of the range as
with most of the previous results. While particle cohesion in MPC42 is thought to be
dominated by fat, the powder still contains some lactose, so some dependence on humidity is
not surprising. Further experiments would be valuable, as the relatively small data set
obtained here appears insufficient to accurately quantify the small differences that occur
across the humidity range tested.
Figure 34 – Deposition ratio (kd) for MPC42
Differences in the overall cake resistance for MPC42 (Figure 35) were also found to be
significant, with an F-value of 3.9 and a K-value of 11.9. A U test indicated that the 7% RH
condition had a higher resistance that the 13%, 16%, and 22% conditions, while all other
pairings showed no significant differences. As it is once again only the lowest humidity
condition that shows any difference, this is clearly a direct effect of the higher deposition that
occurred at this condition.
0%
5%
10%
15%
20%
25%
30%
35%
0% 5% 10% 15% 20% 25%
k d (
%)
RH
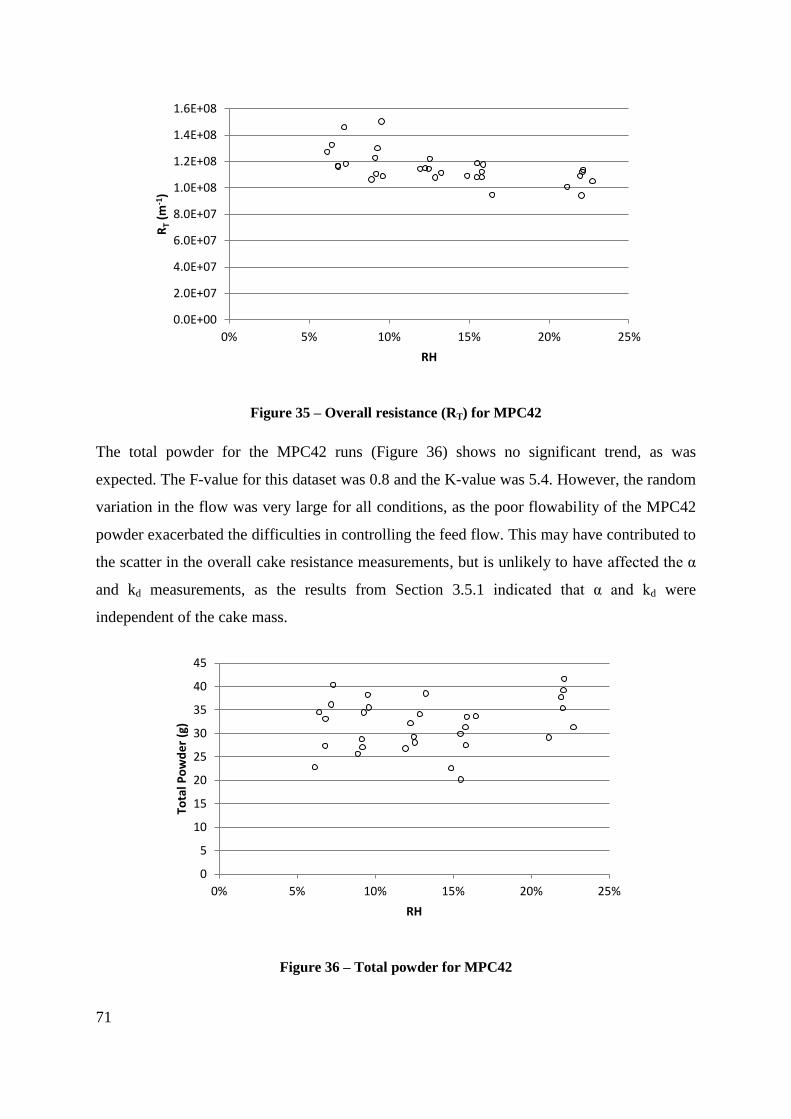
71
Figure 35 – Overall resistance (RT) for MPC42
The total powder for the MPC42 runs (Figure 36) shows no significant trend, as was
expected. The F-value for this dataset was 0.8 and the K-value was 5.4. However, the random
variation in the flow was very large for all conditions, as the poor flowability of the MPC42
powder exacerbated the difficulties in controlling the feed flow. This may have contributed to
the scatter in the overall cake resistance measurements, but is unlikely to have affected the α
and kd measurements, as the results from Section 3.5.1 indicated that α and kd were
independent of the cake mass.
Figure 36 – Total powder for MPC42
0.0E+00
2.0E+07
4.0E+07
6.0E+07
8.0E+07
1.0E+08
1.2E+08
1.4E+08
1.6E+08
0% 5% 10% 15% 20% 25%
RT
(m-1
)
RH
0
5
10
15
20
25
30
35
40
45
0% 5% 10% 15% 20% 25%
Tota
l Po
wd
er
(g)
RH
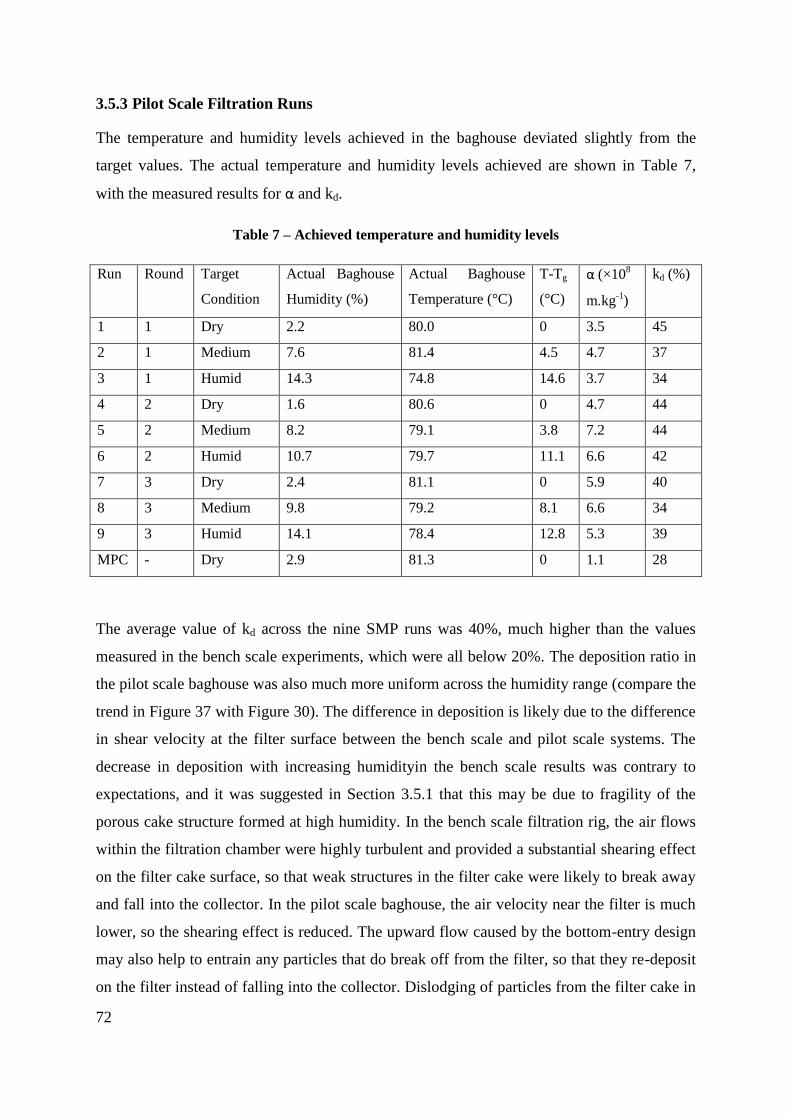
72
3.5.3 Pilot Scale Filtration Runs
The temperature and humidity levels achieved in the baghouse deviated slightly from the
target values. The actual temperature and humidity levels achieved are shown in Table 7,
with the measured results for α and kd.
Table 7 – Achieved temperature and humidity levels
Run Round Target
Condition
Actual Baghouse
Humidity (%)
Actual Baghouse
Temperature (°C)
T-Tg
(°C)
α (×108
m.kg-1
)
kd (%)
1 1 Dry 2.2 80.0 0 3.5 45
2 1 Medium 7.6 81.4 4.5 4.7 37
3 1 Humid 14.3 74.8 14.6 3.7 34
4 2 Dry 1.6 80.6 0 4.7 44
5 2 Medium 8.2 79.1 3.8 7.2 44
6 2 Humid 10.7 79.7 11.1 6.6 42
7 3 Dry 2.4 81.1 0 5.9 40
8 3 Medium 9.8 79.2 8.1 6.6 34
9 3 Humid 14.1 78.4 12.8 5.3 39
MPC - Dry 2.9 81.3 0 1.1 28
The average value of kd across the nine SMP runs was 40%, much higher than the values
measured in the bench scale experiments, which were all below 20%. The deposition ratio in
the pilot scale baghouse was also much more uniform across the humidity range (compare the
trend in Figure 37 with Figure 30). The difference in deposition is likely due to the difference
in shear velocity at the filter surface between the bench scale and pilot scale systems. The
decrease in deposition with increasing humidityin the bench scale results was contrary to
expectations, and it was suggested in Section 3.5.1 that this may be due to fragility of the
porous cake structure formed at high humidity. In the bench scale filtration rig, the air flows
within the filtration chamber were highly turbulent and provided a substantial shearing effect
on the filter cake surface, so that weak structures in the filter cake were likely to break away
and fall into the collector. In the pilot scale baghouse, the air velocity near the filter is much
lower, so the shearing effect is reduced. The upward flow caused by the bottom-entry design
may also help to entrain any particles that do break off from the filter, so that they re-deposit
on the filter instead of falling into the collector. Dislodging of particles from the filter cake in
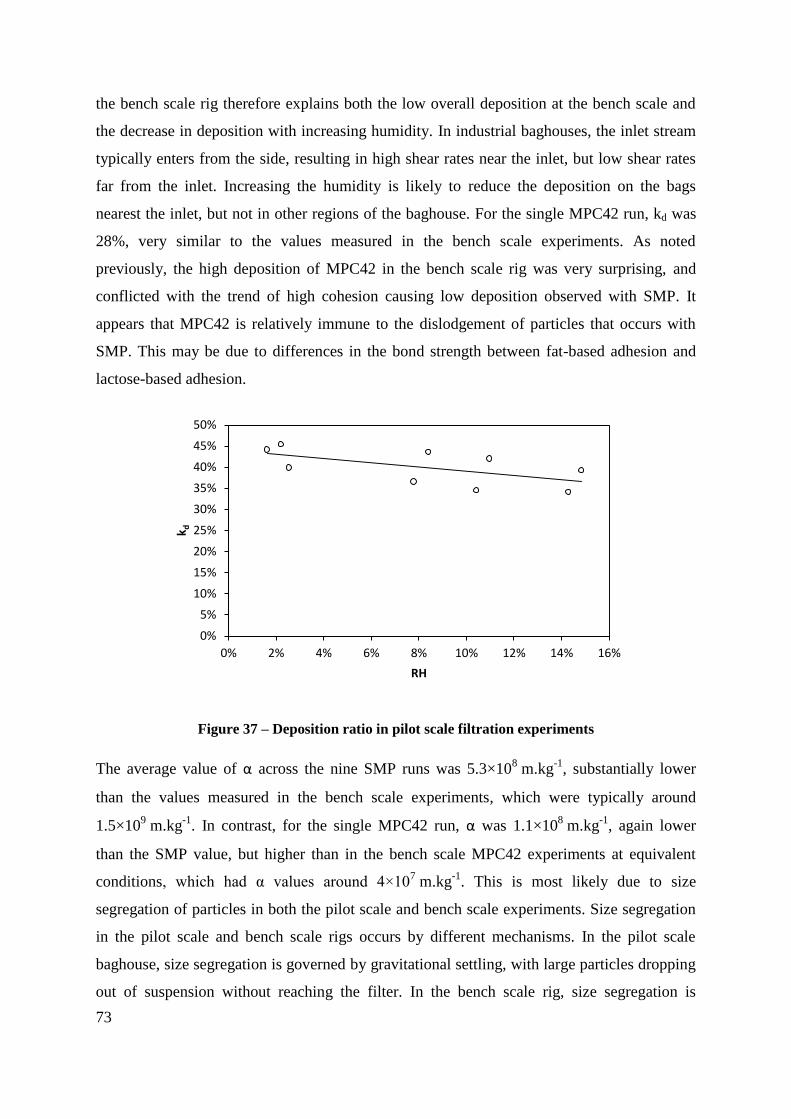
73
the bench scale rig therefore explains both the low overall deposition at the bench scale and
the decrease in deposition with increasing humidity. In industrial baghouses, the inlet stream
typically enters from the side, resulting in high shear rates near the inlet, but low shear rates
far from the inlet. Increasing the humidity is likely to reduce the deposition on the bags
nearest the inlet, but not in other regions of the baghouse. For the single MPC42 run, kd was
28%, very similar to the values measured in the bench scale experiments. As noted
previously, the high deposition of MPC42 in the bench scale rig was very surprising, and
conflicted with the trend of high cohesion causing low deposition observed with SMP. It
appears that MPC42 is relatively immune to the dislodgement of particles that occurs with
SMP. This may be due to differences in the bond strength between fat-based adhesion and
lactose-based adhesion.
Figure 37 – Deposition ratio in pilot scale filtration experiments
The average value of α across the nine SMP runs was 5.3×10⁸ m.kg
-1, substantially lower
than the values measured in the bench scale experiments, which were typically around
1.5×10⁹ m.kg
-1. In contrast, for the single MPC42 run, α was 1.1×10
8 m.kg
-1, again lower
than the SMP value, but higher than in the bench scale MPC42 experiments at equivalent
conditions, which had α values around 4×10⁷ m.kg
-1. This is most likely due to size
segregation of particles in both the pilot scale and bench scale experiments. Size segregation
in the pilot scale and bench scale rigs occurs by different mechanisms. In the pilot scale
baghouse, size segregation is governed by gravitational settling, with large particles dropping
out of suspension without reaching the filter. In the bench scale rig, size segregation is
0%
5%
10%
15%
20%
25%
30%
35%
40%
45%
50%
0% 2% 4% 6% 8% 10% 12% 14% 16%
k d
RH
74
governed by the balance between inertial forces and adhesive forces, as large particles with a
lot of momentum may rebound from the filter and fall into the collector. The bench scale
experiments with MPC42 showed much higher deposition than the equivalent SMP
experiments, suggesting that size segregation was much more significant for SMP in the
bench scale experiments. In contrast, gravitational settling in the pilot scale baghouse acts
similarly on both powders. This means that for SMP, the filter cake in the bench scale
experiments was composed of only the smallest particles, and therefore had a low porosity
and a high resistance relative to the pilot scale experiments. For the MPC42 powder, in the
bench scale experiments, particles of all sizes adhered to the filter, resulting in a cake with a
high porosity and low resistance. In the pilot scale baghouse, the effect of size segregation
was similar for both powders, so the filter cake permeability for MPC42 was closer to that of
SMP, although some difference persisted due to further differences in the cake structure.
Differences between the powders will be discussed in more detail in Section 3.5.4.
Another factor that may partially explain the lower resistance for SMP on the pilot scale
baghouse (but cannot explain the higher resistance for MPC42), is the difference in cake
thickness with height due to gravitational settling, as noted above. The filtration velocity in
the pilot scale baghouse is approximately half that of an industrial baghouse, due to the
limited capacity of the fan and air heater. Furthermore, the elutriation velocity (air velocity in
the clear space around the bag) is even further reduced, as the single bag design leaves a large
amount of clear space around the bag. The 3 m height of the filter bag is therefore sufficient
to allow substantial gravitational settling of the powder. This will be examined in more detail
in Section 3.5.5, but the important result is that only a very small fraction of the powder
reaches the upper regions of the bag, so that the filter cake is much thinner at the top of the
bag than at the bottom. The thin region at the top provides a path of low resistance for the
airflow, resulting in a lower overall pressure differential. In the bench scale rig, the small
height of the filter (only 0.1 m) means that very little settling occurs, and the filter cake is
very uniform over the filter surface. Note that gravitational settling is likely to be significant
in industrial baghouses, so the value of α from the pilot scale baghouse is probably more
representative of industry.
One further possible factor that may have contributed to the lower SMP resistance on the
pilot scale baghouse (but again cannot explain the higher resistance of the MPC42 powder) is
the error in the cake mass measurements on the pilot scale baghouse. The filter cake in the
75
pilot scale baghouse could not be measured directly, and was therefore calculated using a
mass balance. Powder deposition on the baghouse walls was not accounted for in the mass
balance, and while the amount of deposited powder appeared minimal, the total mass may
have been sufficient to affect the mass balance. The calculated cake mass would then be
higher than the actual cake mass, resulting in a lower calculated α. This risk was clearly
highlighted by the very first experiment, which showed a measured deposition ratio
substantially higher than in the following two runs (45% compared to 37% and 35%).
Following the first set of three filtration experiments, a significant amount of powder was
found in the recesses formed by the inspection ports. The baghouse had been cleaned of all
powder prior to the first experiment (dry condition), but was not properly cleaned between
runs. It appears that during the very first run, deposits of powder formed in the ports,
introducing error into the mass balance. For the following two runs, the ports were already
full of powder at the start of the run, so no further powder was deposited and the mass
balances were more accurate. The calculated deposition ratio for the first dry run was
consequently significantly higher than in the following medium and humid runs (2 and 3). To
minimise this source of error in later experiments, the inspection ports were manually cleared
of powder between runs, and the inside walls of the baghouse were inspected before and after
each run to check for fouling. No significant fouling was observed, however the walls were
typically found to be covered by a light dusting of powder.
To examine the trends in α and kd, the dataset was modelled in R using linear mixed effects
models. Powder flow was found to be important in the α model, but not in the kd model,
while airflow was found to be unimportant and was excluded from both models. The final
fitted models are shown below in Equations 3.1 and 3.2:
α 1 ((3 4
) 11 2 1
(72 5 )
σ
) (3.1)
1 ( 43 5
1 σ ) (3.2)
where is the mass flow of powder to the baghouse, is the water activity
(equivalent to relative humidity), and σ is the random variation between the three rounds of
experiments. In MCMC simulation of the models, σ had a mean size of 3.7×10⁷, and σ
had a mean size of 0.018.
76
The error terms on the coefficients in the above equations give upper and lower bounds for a
95% confidence interval based on MCMC sampling (pvals.fnc function in R). There is a 95%
chance that the true value of each coefficient is within the range indicated by the error terms.
Due to the small number of measurements, none of the model coefficients were statistically
significant, as indicated by the fact that the error terms are larger than the actual coefficients.
This means that the fitted model cannot be used as a predictive tool, as any predictions
obtained would probably be very inaccurate. Note that the non-significance of the model does
not mean that no trend is present – it simply means that more data would be required before
the trend could be confidently asserted. Unfortunately, experiments on the pilot scale
baghouse are very time-consuming, and it was not possible to obtain sufficient data.
Nevertheless, the model coefficients and some other observations obtained from the pilot
scale experiments were compared to the bench scale results to lend weight to the conclusions
obtained there and to test the scalability of the bench scale results.
In the α model (Equation 3.1), the effects of temperature and humidity were negative. This
means that increasing the temperature or humidity is more likely to decrease the specific cake
resistance than to increase it, but due to the large uncertainties there is nevertheless a
substantial probability (>20%) that such a change may actually increase α. Note also that the
temperature coefficients in both the above model equations represent the effects of
maintaining a constant water activity while changing temperature, which requires changing
the absolute water content of the air. Based on the conclusion from the bench scale
experiments that increasing T-Tg produces a decrease in α, temperature and humidity were
expected to have negative effects on α. The α model is therefore consistent with the bench
scale results, and suggests that the trends observed on the bench scale may be applicable to
larger baghouses. Powder flow was also found to affect α (and this effect was statistically
significant), with a higher powder feed rate causing a lower specific cake resistance.
In the kd model (Equation 3.2), the effect of temperature was virtually nil, while the effect of
humidity was again negative. The negative humidity coefficient is again consistent with the
prior conclusion that increasing T-Tg improved baghouse performance, although there is once
again a large uncertainty in the coefficient. The tiny temperature coefficient just indicates that
the pilot scale experiments were inadequate to detect any temperature effect – given the wide
confidence interval the actual temperature effect could be either negative or positive.
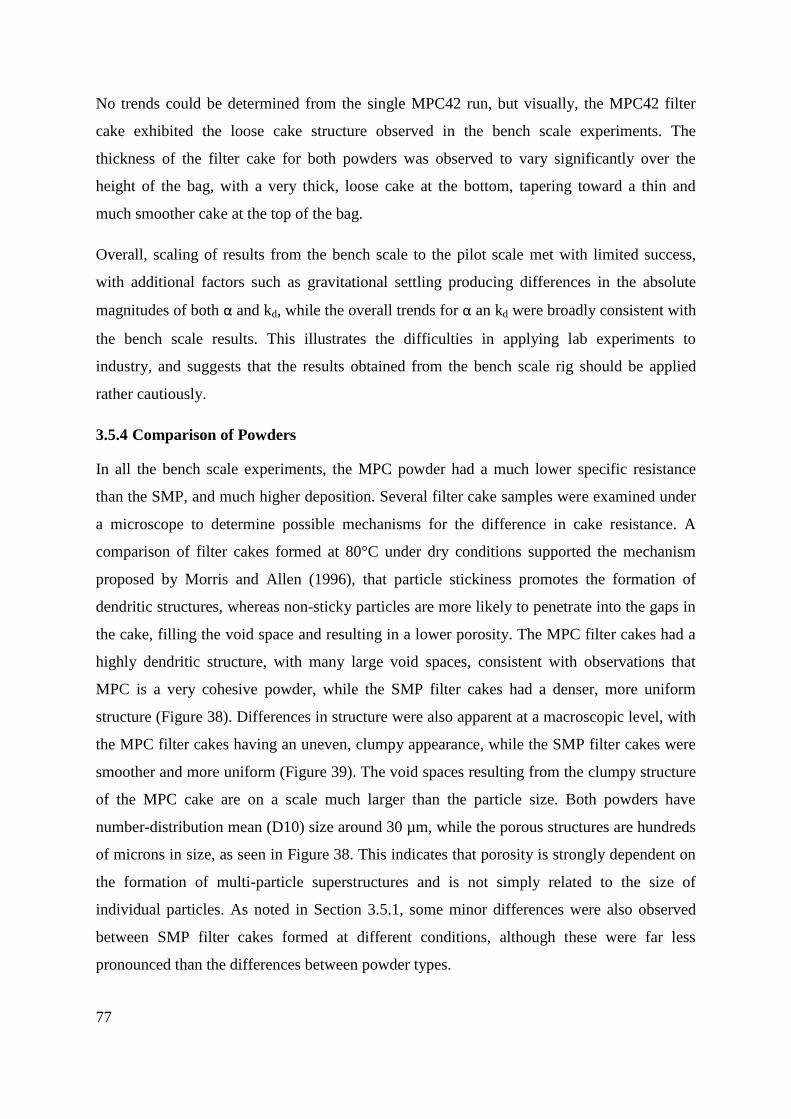
77
No trends could be determined from the single MPC42 run, but visually, the MPC42 filter
cake exhibited the loose cake structure observed in the bench scale experiments. The
thickness of the filter cake for both powders was observed to vary significantly over the
height of the bag, with a very thick, loose cake at the bottom, tapering toward a thin and
much smoother cake at the top of the bag.
Overall, scaling of results from the bench scale to the pilot scale met with limited success,
with additional factors such as gravitational settling producing differences in the absolute
magnitudes of both α and kd, while the overall trends for α an kd were broadly consistent with
the bench scale results. This illustrates the difficulties in applying lab experiments to
industry, and suggests that the results obtained from the bench scale rig should be applied
rather cautiously.
3.5.4 Comparison of Powders
In all the bench scale experiments, the MPC powder had a much lower specific resistance
than the SMP, and much higher deposition. Several filter cake samples were examined under
a microscope to determine possible mechanisms for the difference in cake resistance. A
comparison of filter cakes formed at 80°C under dry conditions supported the mechanism
proposed by Morris and Allen (1996), that particle stickiness promotes the formation of
dendritic structures, whereas non-sticky particles are more likely to penetrate into the gaps in
the cake, filling the void space and resulting in a lower porosity. The MPC filter cakes had a
highly dendritic structure, with many large void spaces, consistent with observations that
MPC is a very cohesive powder, while the SMP filter cakes had a denser, more uniform
structure (Figure 38). Differences in structure were also apparent at a macroscopic level, with
the MPC filter cakes having an uneven, clumpy appearance, while the SMP filter cakes were
smoother and more uniform (Figure 39). The void spaces resulting from the clumpy structure
of the MPC cake are on a scale much larger than the particle size. Both powders have
number-distribution mean (D10) size around 30 µm, while the porous structures are hundreds
of microns in size, as seen in Figure 38. This indicates that porosity is strongly dependent on
the formation of multi-particle superstructures and is not simply related to the size of
individual particles. As noted in Section 3.5.1, some minor differences were also observed
between SMP filter cakes formed at different conditions, although these were far less
pronounced than the differences between powder types.
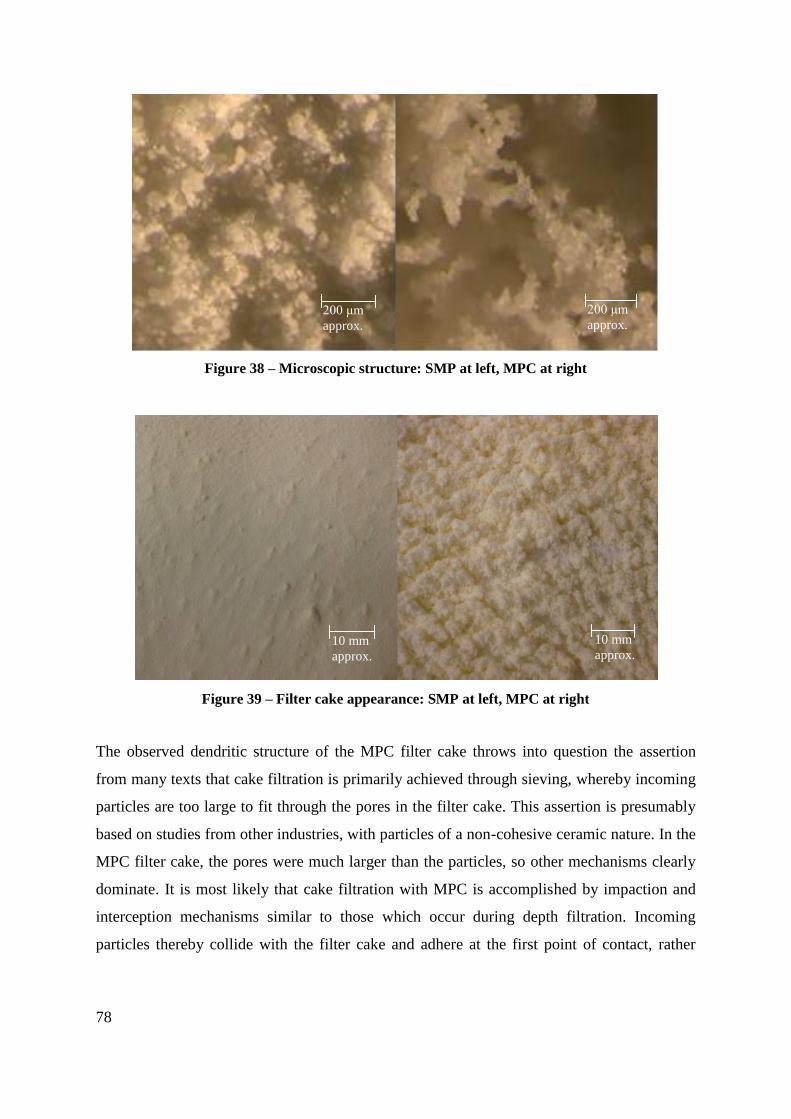
78
The observed dendritic structure of the MPC filter cake throws into question the assertion
from many texts that cake filtration is primarily achieved through sieving, whereby incoming
particles are too large to fit through the pores in the filter cake. This assertion is presumably
based on studies from other industries, with particles of a non-cohesive ceramic nature. In the
MPC filter cake, the pores were much larger than the particles, so other mechanisms clearly
dominate. It is most likely that cake filtration with MPC is accomplished by impaction and
interception mechanisms similar to those which occur during depth filtration. Incoming
particles thereby collide with the filter cake and adhere at the first point of contact, rather
10 mm
approx.
10 mm
approx.
Figure 39 – Filter cake appearance: SMP at left, MPC at right
10 mm
approx. 10 mm
approx.
Figure 38 – Microscopic structure: SMP at left, MPC at right
200 μm
approx. 200 μm
approx.
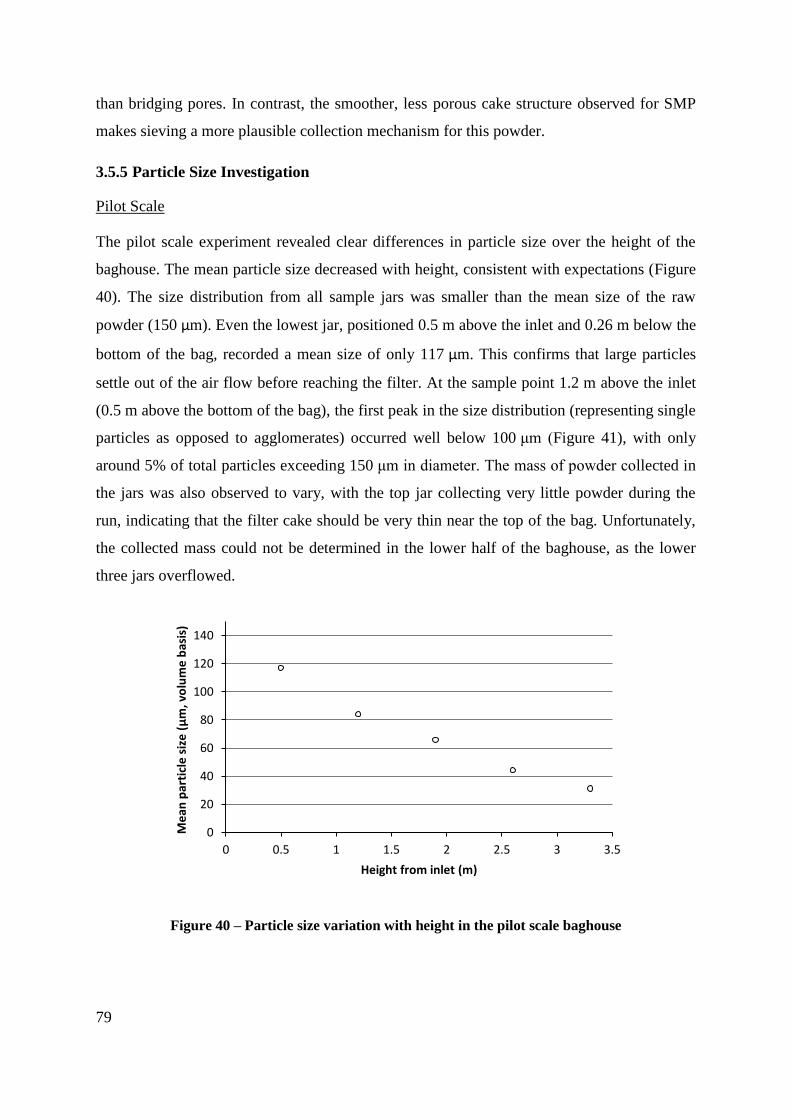
79
than bridging pores. In contrast, the smoother, less porous cake structure observed for SMP
makes sieving a more plausible collection mechanism for this powder.
3.5.5 Particle Size Investigation
Pilot Scale
The pilot scale experiment revealed clear differences in particle size over the height of the
baghouse. The mean particle size decreased with height, consistent with expectations (Figure
40). The size distribution from all sample jars was smaller than the mean size of the raw
powder (150 μm). Even the lowest jar, positioned 0.5 m above the inlet and 0.26 m below the
bottom of the bag, recorded a mean size of only 117 μm. This confirms that large particles
settle out of the air flow before reaching the filter. At the sample point 1.2 m above the inlet
(0.5 m above the bottom of the bag), the first peak in the size distribution (representing single
particles as opposed to agglomerates) occurred well below 100 μm (Figure 41), with only
around 5% of total particles exceeding 150 μm in diameter. The mass of powder collected in
the jars was also observed to vary, with the top jar collecting very little powder during the
run, indicating that the filter cake should be very thin near the top of the bag. Unfortunately,
the collected mass could not be determined in the lower half of the baghouse, as the lower
three jars overflowed.
Figure 40 – Particle size variation with height in the pilot scale baghouse
0
20
40
60
80
100
120
140
0 0.5 1 1.5 2 2.5 3 3.5
Me
an p
arti
cle
siz
e (
μm
, vo
lum
e b
asis
)
Height from inlet (m)
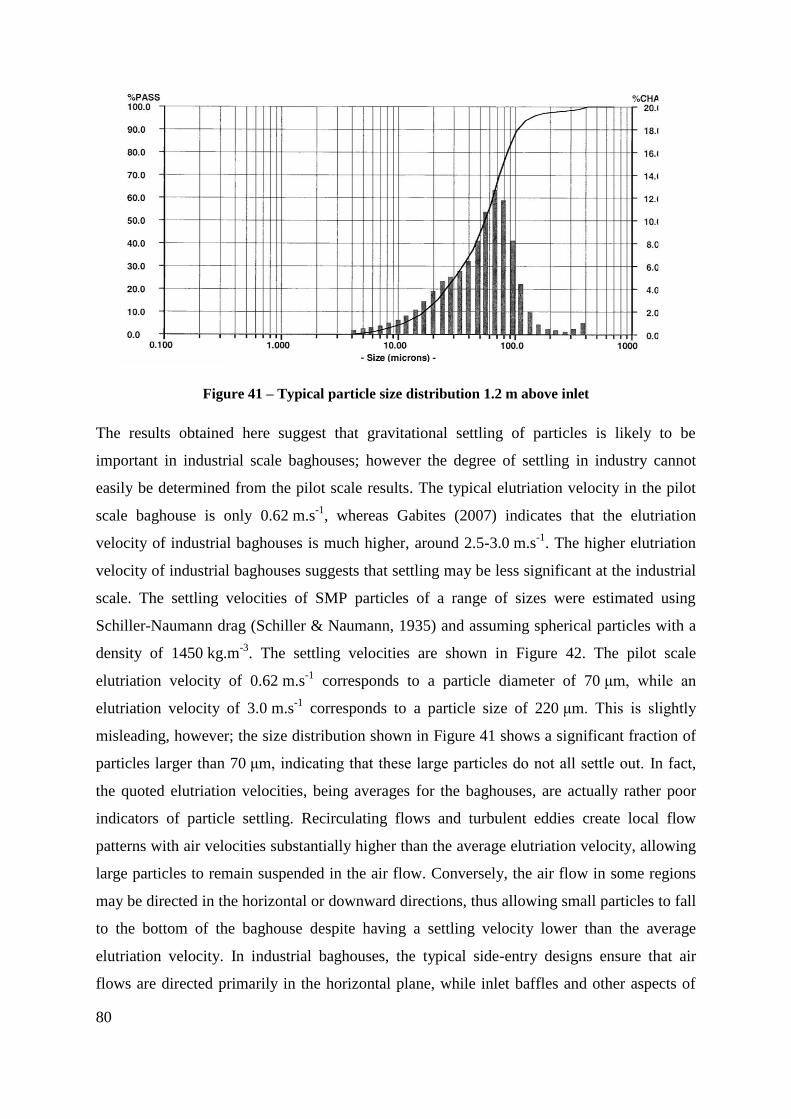
80
Figure 41 – Typical particle size distribution 1.2 m above inlet
The results obtained here suggest that gravitational settling of particles is likely to be
important in industrial scale baghouses; however the degree of settling in industry cannot
easily be determined from the pilot scale results. The typical elutriation velocity in the pilot
scale baghouse is only 0.62 m.s-1
, whereas Gabites (2007) indicates that the elutriation
velocity of industrial baghouses is much higher, around 2.5-3.0 m.s-1
. The higher elutriation
velocity of industrial baghouses suggests that settling may be less significant at the industrial
scale. The settling velocities of SMP particles of a range of sizes were estimated using
Schiller-Naumann drag (Schiller & Naumann, 1935) and assuming spherical particles with a
density of 1450 kg.m-3
. The settling velocities are shown in Figure 42. The pilot scale
elutriation velocity of 0.62 m.s-1
corresponds to a particle diameter of 70 μm, while an
elutriation velocity of 3.0 m.s-1
corresponds to a particle size of 220 μm. This is slightly
misleading, however; the size distribution shown in Figure 41 shows a significant fraction of
particles larger than 70 μm, indicating that these large particles do not all settle out. In fact,
the quoted elutriation velocities, being averages for the baghouses, are actually rather poor
indicators of particle settling. Recirculating flows and turbulent eddies create local flow
patterns with air velocities substantially higher than the average elutriation velocity, allowing
large particles to remain suspended in the air flow. Conversely, the air flow in some regions
may be directed in the horizontal or downward directions, thus allowing small particles to fall
to the bottom of the baghouse despite having a settling velocity lower than the average
elutriation velocity. In industrial baghouses, the typical side-entry designs ensure that air
flows are directed primarily in the horizontal plane, while inlet baffles and other aspects of
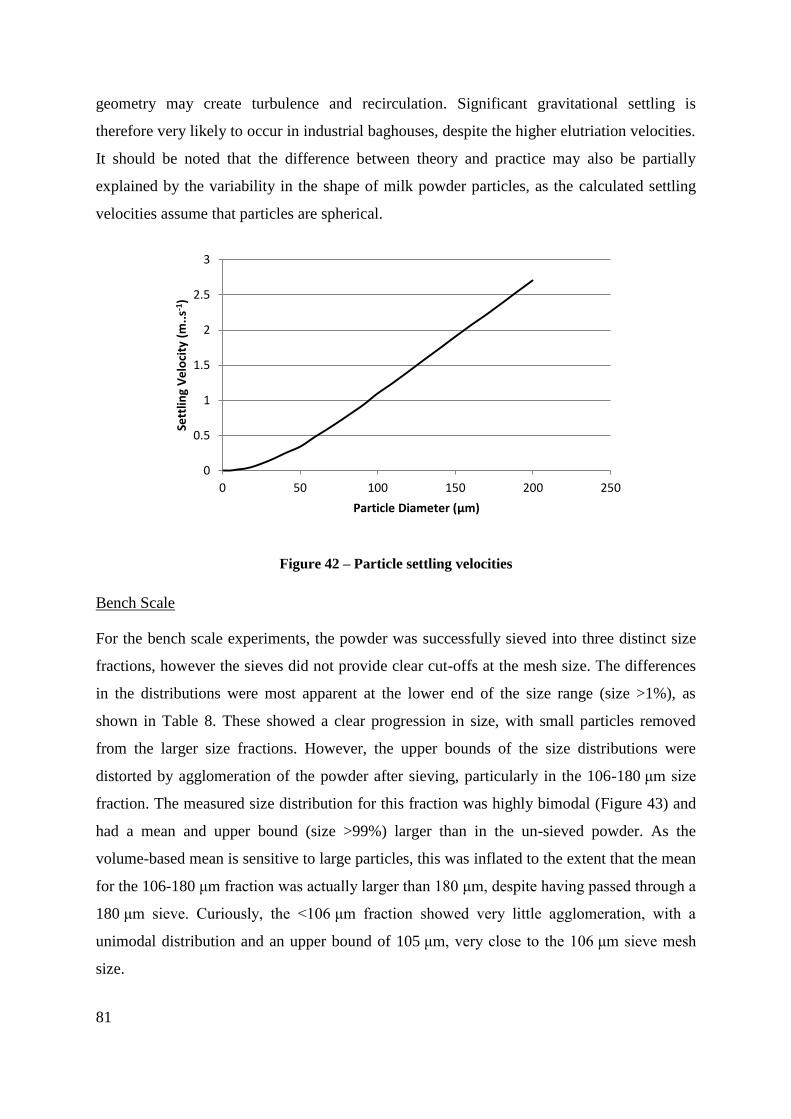
81
geometry may create turbulence and recirculation. Significant gravitational settling is
therefore very likely to occur in industrial baghouses, despite the higher elutriation velocities.
It should be noted that the difference between theory and practice may also be partially
explained by the variability in the shape of milk powder particles, as the calculated settling
velocities assume that particles are spherical.
Figure 42 – Particle settling velocities
Bench Scale
For the bench scale experiments, the powder was successfully sieved into three distinct size
fractions, however the sieves did not provide clear cut-offs at the mesh size. The differences
in the distributions were most apparent at the lower end of the size range (size >1%), as
shown in Table 8. These showed a clear progression in size, with small particles removed
from the larger size fractions. However, the upper bounds of the size distributions were
distorted by agglomeration of the powder after sieving, particularly in the 106-180 μm size
fraction. The measured size distribution for this fraction was highly bimodal (Figure 43) and
had a mean and upper bound (size >99%) larger than in the un-sieved powder. As the
volume-based mean is sensitive to large particles, this was inflated to the extent that the mean
for the 106-180 μm fraction was actually larger than 180 μm, despite having passed through a
180 μm sieve. Curiously, the <106 μm fraction showed very little agglomeration, with a
unimodal distribution and an upper bound of 105 μm, very close to the 106 μm sieve mesh
size.
0
0.5
1
1.5
2
2.5
3
0 50 100 150 200 250
Sett
ling
Ve
loci
ty (
m..
s-1)
Particle Diameter (μm)
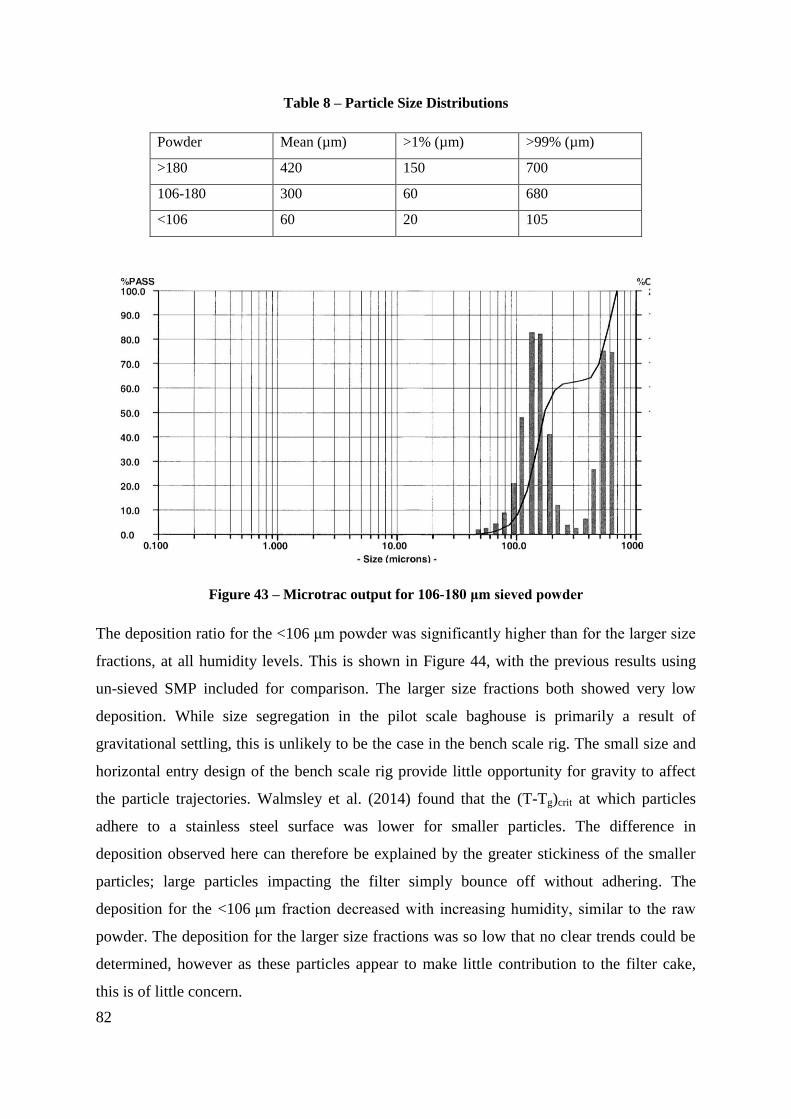
82
Table 8 – Particle Size Distributions
Powder Mean (µm) >1% (µm) >99% (µm)
>180 420 150 700
106-180 300 60 680
<106 60 20 105
Figure 43 – Microtrac output for 106-180 μm sieved powder
The deposition ratio for the <106 μm powder was significantly higher than for the larger size
fractions, at all humidity levels. This is shown in Figure 44, with the previous results using
un-sieved SMP included for comparison. The larger size fractions both showed very low
deposition. While size segregation in the pilot scale baghouse is primarily a result of
gravitational settling, this is unlikely to be the case in the bench scale rig. The small size and
horizontal entry design of the bench scale rig provide little opportunity for gravity to affect
the particle trajectories. Walmsley et al. (2014) found that the (T-Tg)crit at which particles
adhere to a stainless steel surface was lower for smaller particles. The difference in
deposition observed here can therefore be explained by the greater stickiness of the smaller
particles; large particles impacting the filter simply bounce off without adhering. The
deposition for the <106 μm fraction decreased with increasing humidity, similar to the raw
powder. The deposition for the larger size fractions was so low that no clear trends could be
determined, however as these particles appear to make little contribution to the filter cake,
this is of little concern.
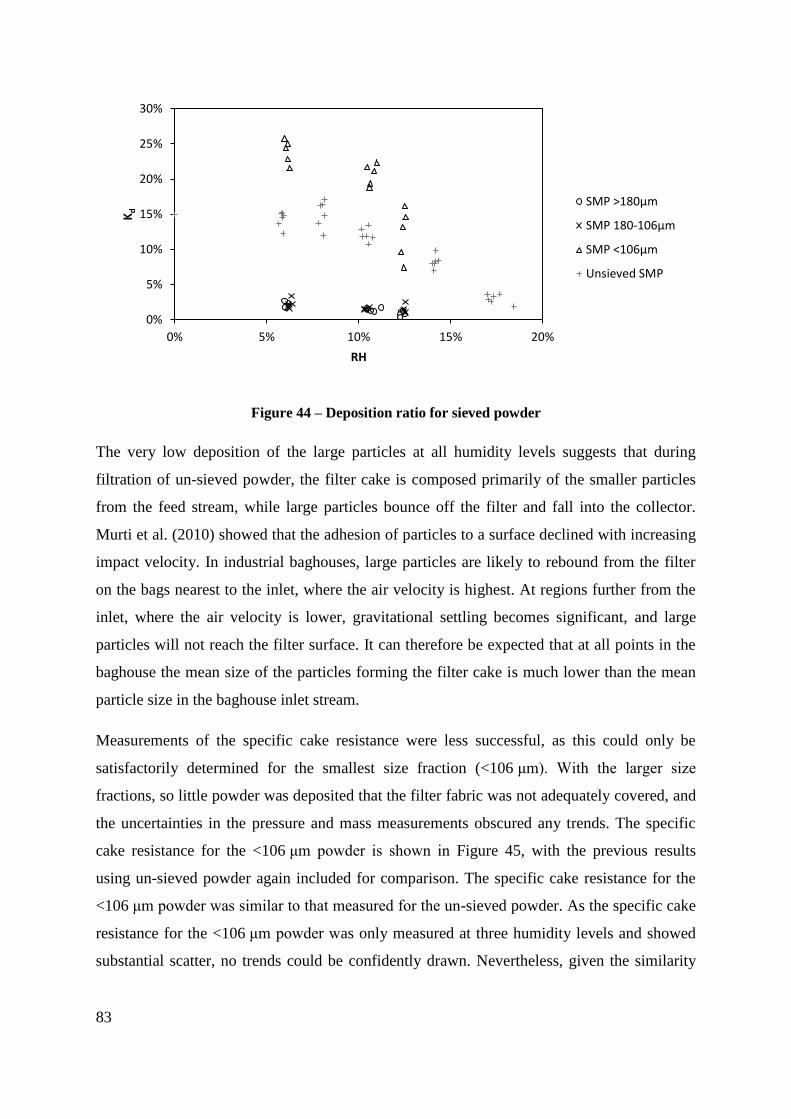
83
Figure 44 – Deposition ratio for sieved powder
The very low deposition of the large particles at all humidity levels suggests that during
filtration of un-sieved powder, the filter cake is composed primarily of the smaller particles
from the feed stream, while large particles bounce off the filter and fall into the collector.
Murti et al. (2010) showed that the adhesion of particles to a surface declined with increasing
impact velocity. In industrial baghouses, large particles are likely to rebound from the filter
on the bags nearest to the inlet, where the air velocity is highest. At regions further from the
inlet, where the air velocity is lower, gravitational settling becomes significant, and large
particles will not reach the filter surface. It can therefore be expected that at all points in the
baghouse the mean size of the particles forming the filter cake is much lower than the mean
particle size in the baghouse inlet stream.
Measurements of the specific cake resistance were less successful, as this could only be
satisfactorily determined for the smallest size fraction (<106 μm). With the larger size
fractions, so little powder was deposited that the filter fabric was not adequately covered, and
the uncertainties in the pressure and mass measurements obscured any trends. The specific
cake resistance for the <106 μm powder is shown in Figure 45, with the previous results
using un-sieved powder again included for comparison. The specific cake resistance for the
<106 μm powder was similar to that measured for the un-sieved powder. As the specific cake
resistance for the <106 μm powder was only measured at three humidity levels and showed
substantial scatter, no trends could be confidently drawn. Nevertheless, given the similarity
0%
5%
10%
15%
20%
25%
30%
0% 5% 10% 15% 20%
Kd
RH
SMP >180μm
SMP 180-106μm
SMP <106μm
Unsieved SMP
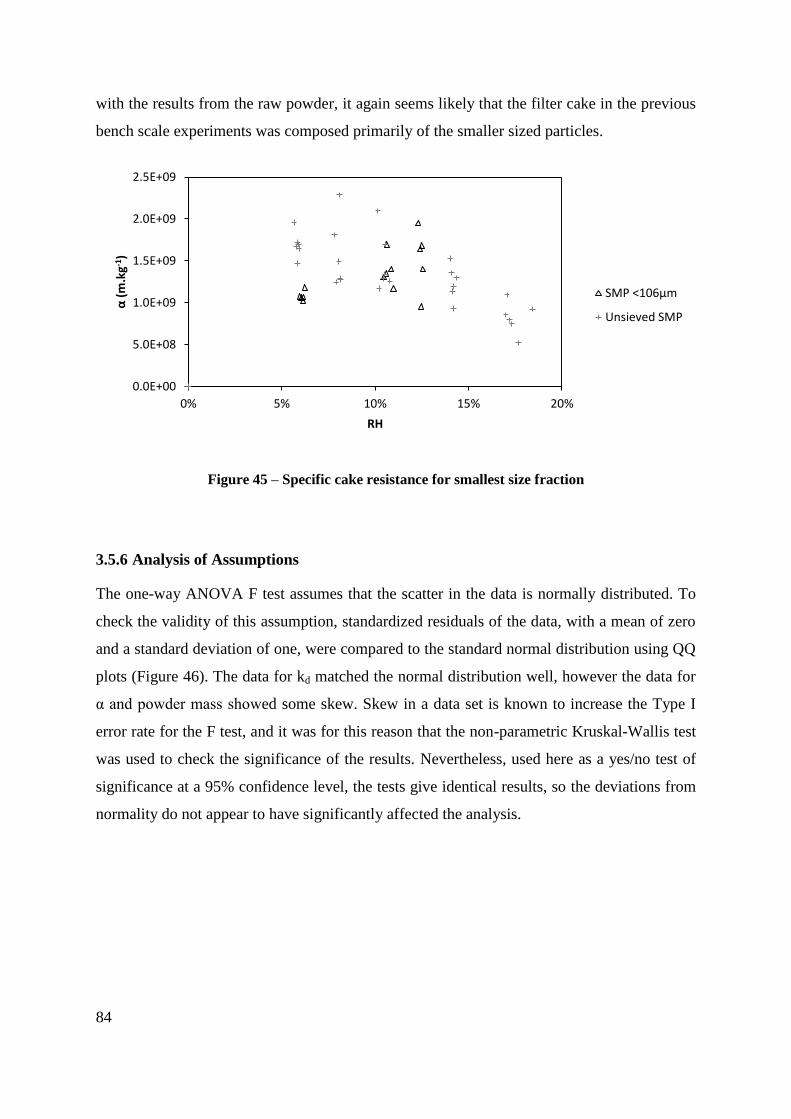
84
with the results from the raw powder, it again seems likely that the filter cake in the previous
bench scale experiments was composed primarily of the smaller sized particles.
Figure 45 – Specific cake resistance for smallest size fraction
3.5.6 Analysis of Assumptions
The one-way ANOVA F test assumes that the scatter in the data is normally distributed. To
check the validity of this assumption, standardized residuals of the data, with a mean of zero
and a standard deviation of one, were compared to the standard normal distribution using QQ
plots (Figure 46). The data for kd matched the normal distribution well, however the data for
α and powder mass showed some skew. Skew in a data set is known to increase the Type I
error rate for the F test, and it was for this reason that the non-parametric Kruskal-Wallis test
was used to check the significance of the results. Nevertheless, used here as a yes/no test of
significance at a 95% confidence level, the tests give identical results, so the deviations from
normality do not appear to have significantly affected the analysis.
0.0E+00
5.0E+08
1.0E+09
1.5E+09
2.0E+09
2.5E+09
0% 5% 10% 15% 20%
α (
m.k
g-1)
RH
SMP <106μm
Unsieved SMP
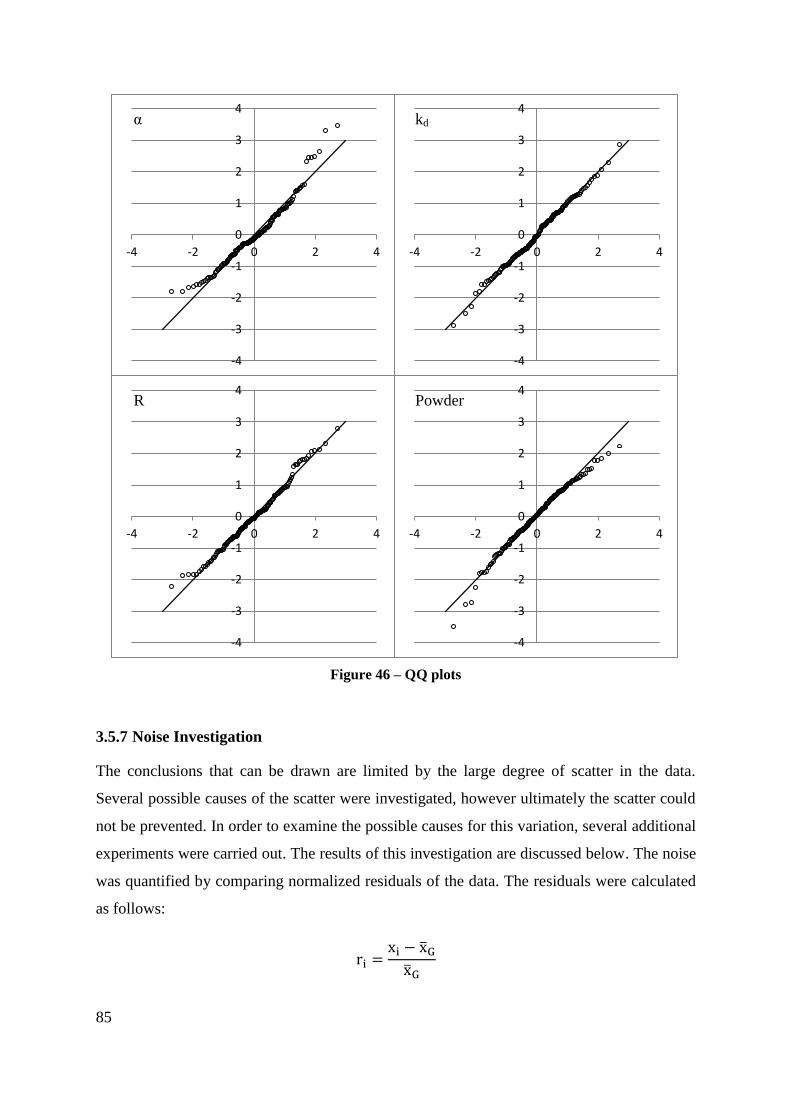
85
3.5.7 Noise Investigation
The conclusions that can be drawn are limited by the large degree of scatter in the data.
Several possible causes of the scatter were investigated, however ultimately the scatter could
not be prevented. In order to examine the possible causes for this variation, several additional
experiments were carried out. The results of this investigation are discussed below. The noise
was quantified by comparing normalized residuals of the data. The residuals were calculated
as follows:
x x
x
-4
-3
-2
-1
0
1
2
3
4
-4 -2 0 2 4
-4
-3
-2
-1
0
1
2
3
4
-4 -2 0 2 4
-4
-3
-2
-1
0
1
2
3
4
-4 -2 0 2 4
-4
-3
-2
-1
0
1
2
3
4
-4 -2 0 2 4
Figure 46 – QQ plots
α kd
R Powder
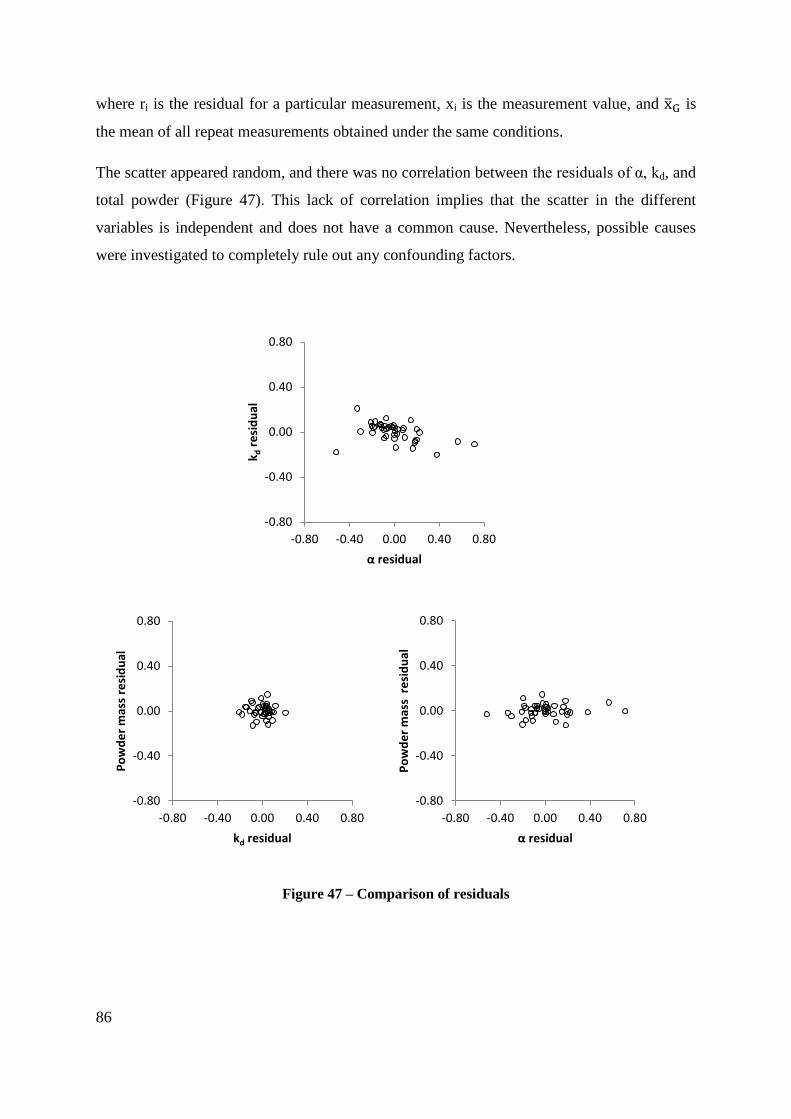
86
where ri is the residual for a particular measurement, xi is the measurement value, and x is
the mean of all repeat measurements obtained under the same conditions.
The scatter appeared random, and there was no correlation between the residuals of α, kd, and
total powder (Figure 47). This lack of correlation implies that the scatter in the different
variables is independent and does not have a common cause. Nevertheless, possible causes
were investigated to completely rule out any confounding factors.
Figure 47 – Comparison of residuals
-0.80
-0.40
0.00
0.40
0.80
-0.80 -0.40 0.00 0.40 0.80
k d r
esi
du
al
α residual
-0.80
-0.40
0.00
0.40
0.80
-0.80 -0.40 0.00 0.40 0.80
Po
wd
er
mas
s re
sid
ual
kd residual
-0.80
-0.40
0.00
0.40
0.80
-0.80 -0.40 0.00 0.40 0.80
Po
wd
er
mas
s r
esi
du
al
α residual
87
The first potential source of variation to be considered was the condition of the powder
supplied to the apparatus. The powder samples were all taken from a single 25 kg bag of
powder, and the powder composition was the same for all samples. This bag of powder was
kept in an air conditioned lab, and was tied shut in order to reduce exposure to ambient air;
however there was still a slight possibility of changes in powder temperature and moisture
content due to changes in the ambient conditions. In order to quantify the variation in
temperature and humidity in the lab, a data logger was placed in the lab for a period of two
weeks, monitoring the temperature and relative humidity. The temperature in the lab over this
period was very stable, showing a variation of only 1°C from a mean of 22.5°C. The
maximum rate of temperature change recorded was 0.11°C.hr-1
.
The relative humidity in the lab varied between 40% and 60%, with a maximum rate of
change of 1.4% per hour. The lactose glass transition at 22.5°C occurs at a relative humidity
level of 34%. The ambient conditions in the lab are therefore above the glass transition and
could potentially influence the properties of the powder. Given the low rate of change,
however, it is extremely unlikely that variations in the ambient humidity are the cause of the
variation within each group of data. Runs were conducted in rapid succession, with only
15-20 minutes from the start of one run until the start of the next. Within each set of repeats,
therefore, temperature variations were limited to less than 1°C, and humidity variations to
less than 4% RH. These changes are very small, and cannot account for the large degree of
scatter in the measurements.
As an additional check on the influence of ambient conditions, some additional experiments
were carried out using powder that was pre-conditioned in a desiccator over silica gel, to
standardize the powder moisture content. The standardized powder was then used in a series
of filtration experiments under dry conditions at 80°C. The noise in the resulting data was
similar to the noise from other conditions, confirming that the initial moisture content of the
powder was not a major source of noise in the data.
The condition of the apparatus at the start of each run was very consistent and therefore
cannot explain the scatter in the data. The temperatures of the humidifier, water bath, and
trace heating on the apparatus were controlled by automated PID controllers, with the
temperatures displayed on a control panel. All temperatures were maintained within ±0.5°C
of the set point for all runs. The air temperature in the chamber was monitored continuously,
and this varied by up to 3°C, a small deviation considering the minimal effect of the much
88
larger deliberate temperature changes tested in these experiments. The length of the warm-up
period was the same for all runs, to ensure that the initial temperature of the apparatus was
consistent. The residence time of the powder in the hopper was approximately the same for
all runs, and the rubber tube connecting the hopper to the air stream was also clamped shut
during warm up to prevent any flow of warm humid air into the hopper, as this could have
altered the powder moisture content. Variations in temperature throughout the apparatus
therefore cannot explain the large variation in α or kd.
The air stream was taken from a dehumidified and pressure regulated compressed air supply,
so the moisture content of the compressed air remained constant for all experiments. The air
pressure to the filter rig was controlled by a dedicated regulator at the inlet to the humidifier.
The temperature of the compressed air was determined by the ambient temperature in the lab,
and this was found to be very stable, as discussed above. In addition, as the final temperature
and humidity of the air were controlled by the apparatus, any variation in the supply that did
occur would be unlikely to influence the experiment.
The pressure of the compressed air to the rig was controlled by two regulators in parallel –
one for the main air stream and one for the vibrating hopper. Both of these were set manually
at the start of each run, allowing for some variation in pressure between runs. The pressure at
the main inlet was adjusted to give the correct air flow through the apparatus. Some variation
was therefore necessary to account for the variation in flow resistance between filter samples.
The pressure to the vibrating hopper was set to the same level (100 kPa) every time; however
the uncertainty in this is estimated at around 5 kPa. Some sensitivity checks showed that the
hopper mass flow was highly sensitive to changes in the air supply pressure, so the
uncertainty in the pressure is sufficient to explain the variation in the total powder mass both
between repeat tests at the same condition, and between conditions. However, as the residuals
for α and kd showed no correlation with powder mass, the variation in these variables cannot
be explained by the variation in the air pressure to the hopper.
The cake mass measurement was the least accurate of the measured variables, due to
breakage around the edges of the filter cake. The powder formed a ridge around the edge of
the filter, where it was supported by the walls of the chamber. When the filter was removed
from the apparatus, some of this powder around the edge broke away and fell into the
collector. The amount of powder involved was usually quite small, and in order to minimize
this effect, several results were discarded where the breakaway powder was deemed
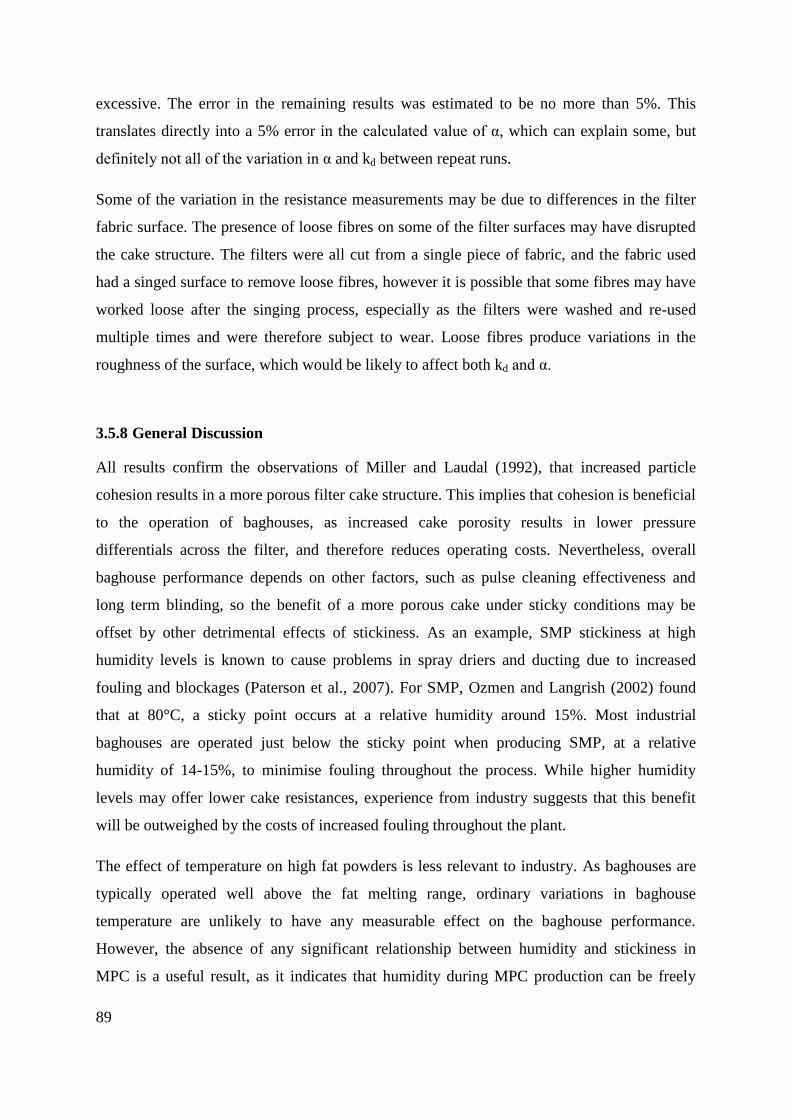
89
excessive. The error in the remaining results was estimated to be no more than 5%. This
translates directly into a 5% error in the calculated value of α, which can explain some, but
definitely not all of the variation in α and kd between repeat runs.
Some of the variation in the resistance measurements may be due to differences in the filter
fabric surface. The presence of loose fibres on some of the filter surfaces may have disrupted
the cake structure. The filters were all cut from a single piece of fabric, and the fabric used
had a singed surface to remove loose fibres, however it is possible that some fibres may have
worked loose after the singing process, especially as the filters were washed and re-used
multiple times and were therefore subject to wear. Loose fibres produce variations in the
roughness of the surface, which would be likely to affect both kd and α.
3.5.8 General Discussion
All results confirm the observations of Miller and Laudal (1992), that increased particle
cohesion results in a more porous filter cake structure. This implies that cohesion is beneficial
to the operation of baghouses, as increased cake porosity results in lower pressure
differentials across the filter, and therefore reduces operating costs. Nevertheless, overall
baghouse performance depends on other factors, such as pulse cleaning effectiveness and
long term blinding, so the benefit of a more porous cake under sticky conditions may be
offset by other detrimental effects of stickiness. As an example, SMP stickiness at high
humidity levels is known to cause problems in spray driers and ducting due to increased
fouling and blockages (Paterson et al., 2007). For SMP, Ozmen and Langrish (2002) found
that at 80°C, a sticky point occurs at a relative humidity around 15%. Most industrial
baghouses are operated just below the sticky point when producing SMP, at a relative
humidity of 14-15%, to minimise fouling throughout the process. While higher humidity
levels may offer lower cake resistances, experience from industry suggests that this benefit
will be outweighed by the costs of increased fouling throughout the plant.
The effect of temperature on high fat powders is less relevant to industry. As baghouses are
typically operated well above the fat melting range, ordinary variations in baghouse
temperature are unlikely to have any measurable effect on the baghouse performance.
However, the absence of any significant relationship between humidity and stickiness in
MPC is a useful result, as it indicates that humidity during MPC production can be freely
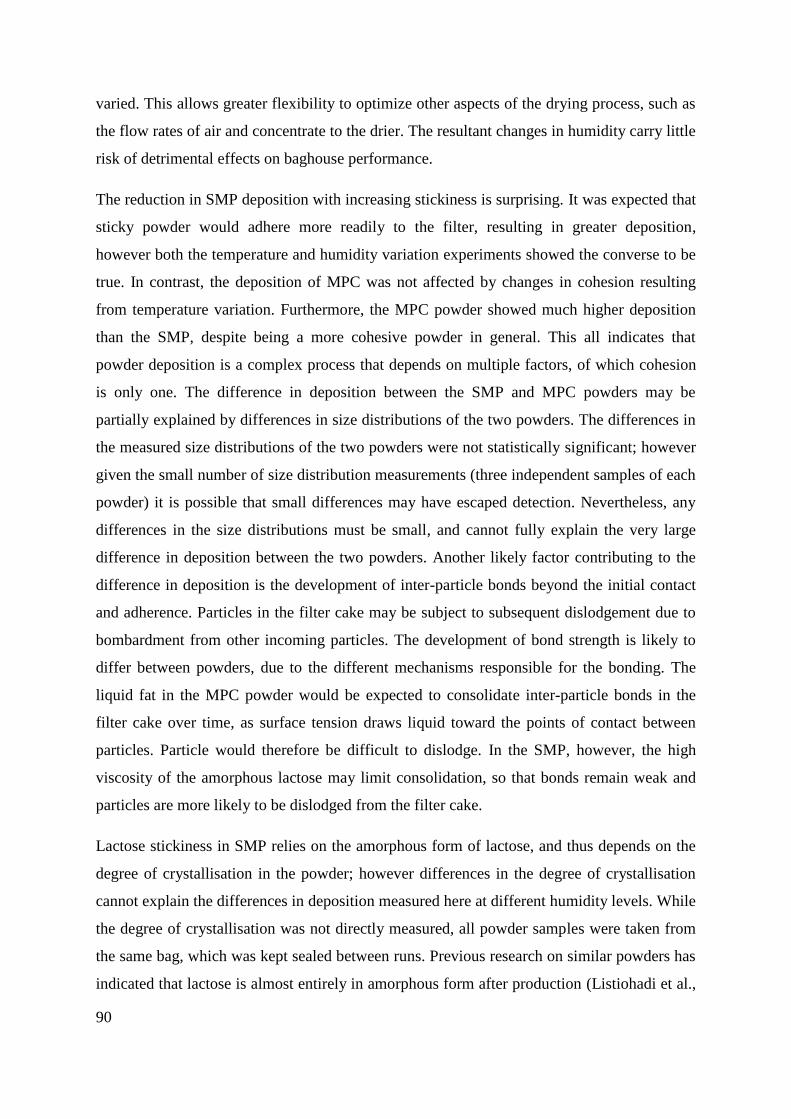
90
varied. This allows greater flexibility to optimize other aspects of the drying process, such as
the flow rates of air and concentrate to the drier. The resultant changes in humidity carry little
risk of detrimental effects on baghouse performance.
The reduction in SMP deposition with increasing stickiness is surprising. It was expected that
sticky powder would adhere more readily to the filter, resulting in greater deposition,
however both the temperature and humidity variation experiments showed the converse to be
true. In contrast, the deposition of MPC was not affected by changes in cohesion resulting
from temperature variation. Furthermore, the MPC powder showed much higher deposition
than the SMP, despite being a more cohesive powder in general. This all indicates that
powder deposition is a complex process that depends on multiple factors, of which cohesion
is only one. The difference in deposition between the SMP and MPC powders may be
partially explained by differences in size distributions of the two powders. The differences in
the measured size distributions of the two powders were not statistically significant; however
given the small number of size distribution measurements (three independent samples of each
powder) it is possible that small differences may have escaped detection. Nevertheless, any
differences in the size distributions must be small, and cannot fully explain the very large
difference in deposition between the two powders. Another likely factor contributing to the
difference in deposition is the development of inter-particle bonds beyond the initial contact
and adherence. Particles in the filter cake may be subject to subsequent dislodgement due to
bombardment from other incoming particles. The development of bond strength is likely to
differ between powders, due to the different mechanisms responsible for the bonding. The
liquid fat in the MPC powder would be expected to consolidate inter-particle bonds in the
filter cake over time, as surface tension draws liquid toward the points of contact between
particles. Particle would therefore be difficult to dislodge. In the SMP, however, the high
viscosity of the amorphous lactose may limit consolidation, so that bonds remain weak and
particles are more likely to be dislodged from the filter cake.
Lactose stickiness in SMP relies on the amorphous form of lactose, and thus depends on the
degree of crystallisation in the powder; however differences in the degree of crystallisation
cannot explain the differences in deposition measured here at different humidity levels. While
the degree of crystallisation was not directly measured, all powder samples were taken from
the same bag, which was kept sealed between runs. Previous research on similar powders has
indicated that lactose is almost entirely in amorphous form after production (Listiohadi et al.,
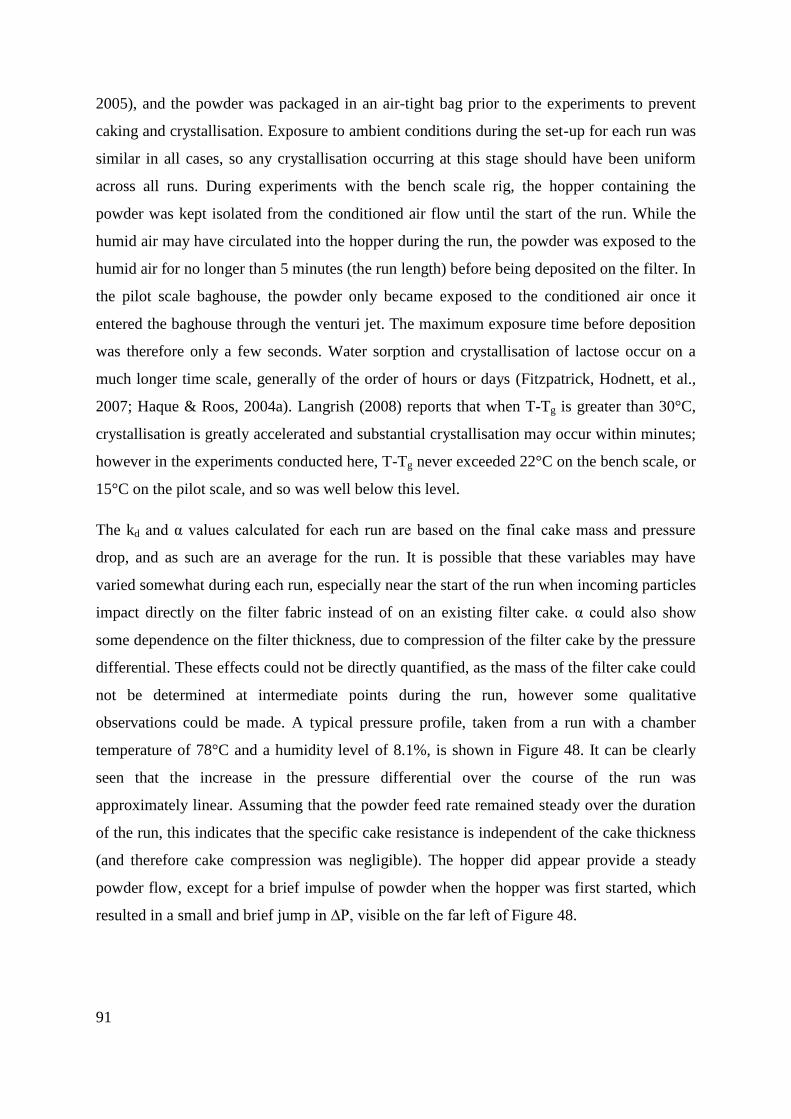
91
2005), and the powder was packaged in an air-tight bag prior to the experiments to prevent
caking and crystallisation. Exposure to ambient conditions during the set-up for each run was
similar in all cases, so any crystallisation occurring at this stage should have been uniform
across all runs. During experiments with the bench scale rig, the hopper containing the
powder was kept isolated from the conditioned air flow until the start of the run. While the
humid air may have circulated into the hopper during the run, the powder was exposed to the
humid air for no longer than 5 minutes (the run length) before being deposited on the filter. In
the pilot scale baghouse, the powder only became exposed to the conditioned air once it
entered the baghouse through the venturi jet. The maximum exposure time before deposition
was therefore only a few seconds. Water sorption and crystallisation of lactose occur on a
much longer time scale, generally of the order of hours or days (Fitzpatrick, Hodnett, et al.,
2007; Haque & Roos, 2004a). Langrish (2008) reports that when T-Tg is greater than 30°C,
crystallisation is greatly accelerated and substantial crystallisation may occur within minutes;
however in the experiments conducted here, T-Tg never exceeded 22°C on the bench scale, or
15°C on the pilot scale, and so was well below this level.
The kd and α values calculated for each run are based on the final cake mass and pressure
drop, and as such are an average for the run. It is possible that these variables may have
varied somewhat during each run, especially near the start of the run when incoming particles
impact directly on the filter fabric instead of on an existing filter cake. α could also show
some dependence on the filter thickness, due to compression of the filter cake by the pressure
differential. These effects could not be directly quantified, as the mass of the filter cake could
not be determined at intermediate points during the run, however some qualitative
observations could be made. A typical pressure profile, taken from a run with a chamber
temperature of 78°C and a humidity level of 8.1%, is shown in Figure 48. It can be clearly
seen that the increase in the pressure differential over the course of the run was
approximately linear. Assuming that the powder feed rate remained steady over the duration
of the run, this indicates that the specific cake resistance is independent of the cake thickness
(and therefore cake compression was negligible). The hopper did appear provide a steady
powder flow, except for a brief impulse of powder when the hopper was first started, which
resulted in a small and brief jump in ∆P, visible on the far left of Figure 48.
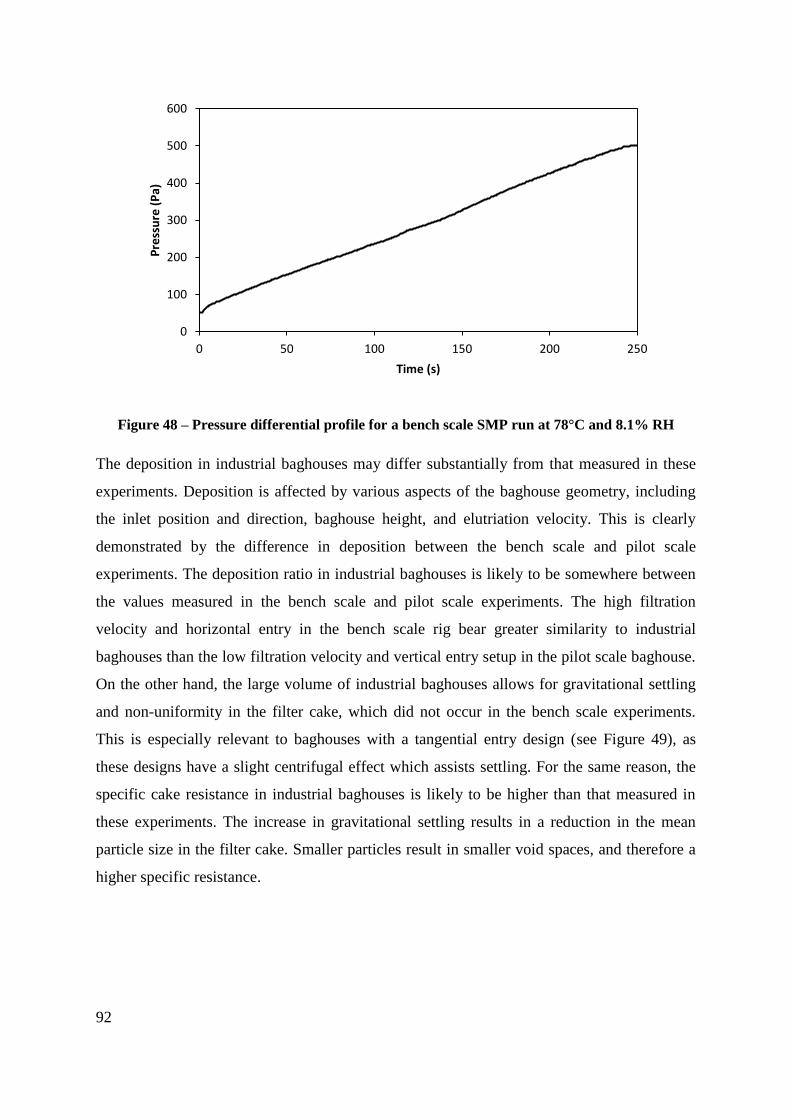
92
Figure 48 – Pressure differential profile for a bench scale SMP run at 78°C and 8.1% RH
The deposition in industrial baghouses may differ substantially from that measured in these
experiments. Deposition is affected by various aspects of the baghouse geometry, including
the inlet position and direction, baghouse height, and elutriation velocity. This is clearly
demonstrated by the difference in deposition between the bench scale and pilot scale
experiments. The deposition ratio in industrial baghouses is likely to be somewhere between
the values measured in the bench scale and pilot scale experiments. The high filtration
velocity and horizontal entry in the bench scale rig bear greater similarity to industrial
baghouses than the low filtration velocity and vertical entry setup in the pilot scale baghouse.
On the other hand, the large volume of industrial baghouses allows for gravitational settling
and non-uniformity in the filter cake, which did not occur in the bench scale experiments.
This is especially relevant to baghouses with a tangential entry design (see Figure 49), as
these designs have a slight centrifugal effect which assists settling. For the same reason, the
specific cake resistance in industrial baghouses is likely to be higher than that measured in
these experiments. The increase in gravitational settling results in a reduction in the mean
particle size in the filter cake. Smaller particles result in smaller void spaces, and therefore a
higher specific resistance.
0
100
200
300
400
500
600
0 50 100 150 200 250
Pre
ssu
re (
Pa)
Time (s)
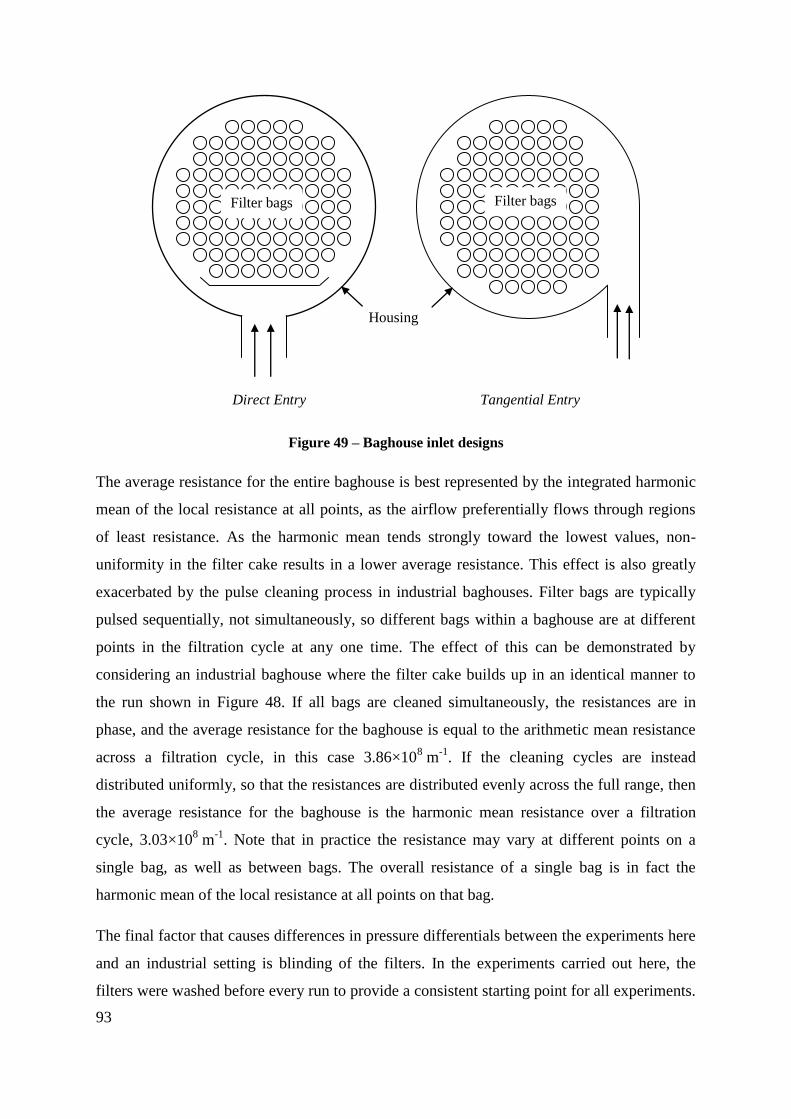
93
Figure 49 – Baghouse inlet designs
The average resistance for the entire baghouse is best represented by the integrated harmonic
mean of the local resistance at all points, as the airflow preferentially flows through regions
of least resistance. As the harmonic mean tends strongly toward the lowest values, non-
uniformity in the filter cake results in a lower average resistance. This effect is also greatly
exacerbated by the pulse cleaning process in industrial baghouses. Filter bags are typically
pulsed sequentially, not simultaneously, so different bags within a baghouse are at different
points in the filtration cycle at any one time. The effect of this can be demonstrated by
considering an industrial baghouse where the filter cake builds up in an identical manner to
the run shown in Figure 48. If all bags are cleaned simultaneously, the resistances are in
phase, and the average resistance for the baghouse is equal to the arithmetic mean resistance
across a filtration cycle, in this case 3.86×10⁸ m
-1. If the cleaning cycles are instead
distributed uniformly, so that the resistances are distributed evenly across the full range, then
the average resistance for the baghouse is the harmonic mean resistance over a filtration
cycle, 3.03×10⁸ m
-1. Note that in practice the resistance may vary at different points on a
single bag, as well as between bags. The overall resistance of a single bag is in fact the
harmonic mean of the local resistance at all points on that bag.
The final factor that causes differences in pressure differentials between the experiments here
and an industrial setting is blinding of the filters. In the experiments carried out here, the
filters were washed before every run to provide a consistent starting point for all experiments.
Direct Entry Tangential Entry
Filter bags Filter bags
Housing
94
In industry, such thorough cleaning is rare (pulse cleaning does not completely remove all
powder), and gradual blinding of the filters results in high resistances. This means that the
overall pressure differentials in industrial baghouses are higher than in the experiments
reported here. Industrial baghouses are typically operated with pressure differentials around
100 mm H2O gauge (approx. 1000 Pa) for SMP production, and slightly lower for MPC
production, with a maximum of 180 mm H2O gauge (approx. 1800 Pa) (Gabites, 2007).
3.6 Conclusions
Increased powder stickiness leads to a lower specific cake resistance and a lower cake mass,
due to the adhesion of incoming particles to the cake surface and the resultant formation of
loose-packed dendritic structures. The loose structure results in lower pressure differentials,
despite an increase in cake thickness. Highly cohesive powders like MPC42 therefore tend to
have lower pressure differentials than less cohesive powders like SMP.
Stickiness in SMP is caused primarily by the presence of hygroscopic amorphous lactose.
The temperature offset from the lactose glass transition, T-Tg, is the best indicator of
stickiness in SMP and the associated effects. Stickiness in MPC42 is caused primarily by the
melting of fats. MPC42 is therefore stickier at higher temperatures, although the effect is
negligible above 40°C, as most of the fats are fully melted by this point.
For SMP, the porous cake structure formed at high humidity levels is weak, and particles are
easily dislodged if exposed to high shear velocities. This suggests that in industrial
baghouses, the deposition on the bags nearest the inlet (where shear rates are highest) may be
lowered at elevated humidity levels. For MPC42, the deposition is not significantly affected
by either temperature or humidity.
Significant size segregation of particles occurs in both the bench scale filter rig and the pilot
scale baghouse, with smaller particles preferentially depositing on the filter. In the pilot scale
baghouse, the particle size continues to decrease with increasing height, due to gravitational
settling. Similar size segregation is thought to occur in large industrial baghouses.
A paper based on the results in this chapter was published in the Journal of Medical and
Bioengineering. The published paper is included in Appendix 3.
95
4. Pulse Cleaning Optimisation
4.1 Introduction
In the previous chapter it was demonstrated that the operating temperature and humidity of a
baghouse can affect the structure of the filter cake and the rate at which powder deposits on
the filter, thus affecting the pressure differentials in the baghouse. However, the cake
formation process only gives a partial insight into baghouse pressure differentials. Equally
important in the long term is the ability of the pulse cleaning system to periodically remove
the filter cake to reduce the resistance to airflow.
A cleaning pulse removes the filter cake through a combination of fabric acceleration,
deformation, and reversed air flow (Davis, 2000). Deformation of the filter cake as the bag
expands causes the filter cake to crack, thus weakening the structure of the cake. The rapid
expansion of the filter bag also throws the powder outward. When the bag reaches full
expansion, tension in the fabric causes a rapid deceleration of the filter material. The inertia
of the filter cake thus creates a separation force, throwing the powder off the bag. Finally, the
pulse increases the pressure in the bag, causing a brief reversal of the airflow. The reversed
flow helps to dislodge particles from the filter, and also helps to carry dislodged particles
away from the filter.
There are two major effects that contribute to the residual resistance of a filter bag following
a pulse. The first effect is incomplete cake removal. If the pulse is insufficient to overcome
the adhesion force between the filter cake and the filter fabric, then a substantial amount of
powder may remain on the bag after a pulse. This can lead to uncontrolled rising of the
pressure differentials and should be avoided. The second effect is the blinding of the filter
fabric. Blinding occurs during the depth filtration stage at the start of the filtration cycle,
when particles penetrate into the fabric instead of collecting on the surface. These particles
become trapped within the fabric and may be difficult to remove (Weigert & Ripperger,
1997). Blinding causes a gradual increase in the pressure differentials over many pulse
cycles.
Effective pulse cleaning in a pulse jet baghouse is essential in controlling the pressure
differentials. Pulse jet systems have many different designs, and are also relatively easy to
modify retrospectively. A good understanding of pulse effectiveness therefore offers potential
96
improvements in the performance of both new and existing baghouses. There is a significant
body of work on pulse effectiveness from other industries, and this is frequently applied to
dairy baghouses; however, the differences in requirements of the dairy industry compared to
other common baghouse applications like boiler flue gas treatment, dictate several differences
in baghouses design that may reduce the relevance of previous work. Differences in
requirements include the focus on the quality of the collected powder, and the perishable
nature of milk powder, as well as the effects of the unique adhesive properties of milk
powder as discussed in the previous chapter. In some industries, it may not be necessary for
the pulse to fully remove the filter cake in a baghouse. Patchy cleaning may be acceptable, as
long as sufficient powder is removed to maintain the pressure differentials within a suitable
range. In dairy baghouses, however, any powder deposits remaining on the bag can harbour
micro-organisms, or slowly degrade over time, and later contaminate the product stream.
Effective cleaning of the entire bag surface is therefore particularly important.
As mentioned in Section 2.4.2, Murti et al. (2010) showed powder stickiness at high humidity
levels causes particles to readily adhere to a range of surfaces. It is therefore likely that high
humidity levels in a baghouse will cause the filter cake to adhere more strongly to the filter
bag. This may reduce the effectiveness of pulse cleaning and lead to higher pressure
differentials. The results from the previous chapter indicate that adhesion forces in milk
powder can affect the filtration process at T-Tg levels much lower than typical sticky point
values reported in the literature. The relatively long time that particles remain in contact with
the filter (typically up to 5 minutes), allows time for the particles to bond strongly to the filter
surface, so it is likely that pulsing performance is also affected at relatively low T-Tg levels.
Bakke (1974) conducted a study using magnesium silicate and talc dusts and reported that
increases in the pulse duration offered benefits up to a point, but that over-cleaning of the
filter bag resulted in increased depth filtration and thus an increase in blinding in the long
term. A longer pulse also consumes extra compressed air, so an excessive pulse duration
carries an economic cost. As mentioned previously, dairy baghouses operate fairly
continuously for several months over the peak production season. A CIP cycle entails a
significant interruption to production and is generally avoided. High pressure differentials
due to excessive blinding may therefore persist for weeks or months until production slows,
adding to the fan energy costs of the baghouse.
97
A series of studies by Lu and Tsai (1996, 1998, 1999, 2003) investigated the effects of
several pulse parameters in a boiler flue dust baghouse. They found that increased pulse tank
pressure gave a greater bag overpressure (pressure difference between the inside and outside
of the bag) during a pulse and thus more effective cleaning, although beyond a certain point
the cleaning improvement became very small (once the pulse is sufficient to completely
remove the filter cake, additional cleaning force has little effect). They also found that
increasing the nozzle diameter improved bag overpressure up to an optimum diameter. Above
the optimum, the pressure in the compressed air reservoir dropped too rapidly, so that the
pulse was effectively cut short, reducing the cleaning effect. The optimum diameter is
therefore highly dependent on the size and design of the compressed air supply system, so
may differ substantially between baghouses. These authors also used a numerical model to
investigate the effect of changing the nozzle height above the bag opening, and found that the
optimum distance was dependent on the nozzle diameter. They reported an optimum height
of 0.6 m using a nozzle diameter of 30 mm and a bag diameter of 130 mm.
Suh et al. (2011) also reported that the distance between the pulse nozzle and venturi (at the
top of the filter bag) influenced the pulse effectiveness in a steel mill baghouse. The baghouse
used in this study had a bag diameter of 140 mm and a venturi throat diameter of 65 mm.
This is very different to typical dairy baghouse designs, which generally have a larger bag
diameter and no venturi, so the optimum distance of 0.11 m above the bag opening reported
in that study cannot be directly applied to dairy baghouses. The optimum distance is larger
for large bag diameters, as the pulse jet expands with distance from the nozzle and may be
partially occluded by a narrow bag opening (Lu & Tsai, 1996). The very low position of the
optimum reported by Suh et al. (2011) is likely due to the 65 mm venturi throat providing a
smaller opening that the 130 mm open bag top modelled by Lu and Tsai (1996). Industrial
milk powder baghouses generally have a larger bag diameter of around 200 mm, with no
venturi, so the optimum nozzle height may be even greater than the 0.6 m reported by Lu and
Tsai (1996). Nozzle positions in industry range from approximately 0.2 m to 0.7 m above the
bag opening, with the most recent designs using a distance of 0.7 m. In addition, nozzle types
vary from simple tubes to specially designed flow guides. As Lu and Tsai (1996) found that
the optimum nozzle height depended on the nozzle diameter, it is likely that the different
nozzle types may have different optimum positions.
98
Pulse pressure is known to affect the pulse effectiveness in a range of different baghouse
designs. In addition to the work by Lu & Tsai mentioned above, Suh et al. (2010)
investigated the effect of pulse pressure in a coke dust baghouse, finding that higher pulse
pressure resulted in more effective pulse cleaning, while Lo, Chen, et al. (2010) found a
similar effect in a pleated cartridge dust collector. It is highly likely that this is also the case
for dairy baghouses; however there have been no specific studies with milk powder to
confirm this.
In this study, SMP was filtered in a pilot scale pulse-jet baghouse. The effects of variations in
the baghouse humidity, pulse air pressure, pulse lance position, and pulse duration on the
pressure differentials were investigated, with the aim of providing guidelines for improving
baghouse performance in the dairy industry.
4.2 Materials and Methods
The pulsing experiments described in this chapter were carried out on the pilot scale
baghouse described in Section 3.2.2. The effects of pulse tank pressure, pulse nozzle height,
pulse duration, and baghouse humidity on the filter pressure differential were investigated.
Each variable was investigated separately, in a targeted set of experiments, with all other
variables held constant.
To ensure consistency between runs, a single filter bag was used for all the experiments in
this chapter. The filter bag was supplied by Canterbury Filter Services Ltd, New Zealand, and
was constructed from a 550 g.m-2
polyester needlefelt fabric with a singed surface, typical of
the fabrics currently used in the NZ dairy industry.
All runs were carried out using skim milk powder (SMP). As SMP is the most common
powder worldwide, research on SMP has more direct economic benefits than research with
other, less common powders. Furthermore, as the filtration study outlined in Chapter 3 found
the SMP filter cake structure and deposition rate were affected by changes in humidity, it was
considered likely that the pulse cleaning process would also be affected. The powder was
once again provided by Fonterra and was the same product used in Chapter 3. While several
bags of powder were required, the powder composition and particle size distribution were

99
measured for each bag, and all were identical within experimental error to the SMP
description given in Section 3.3.1.
The baghouse was warmed up according to the procedure outlined in Section 3.4.3. While the
baghouse was warming up, the feed hopper was started and run into a jar, to allow the
powder flow to stabilise. Once the baghouse was approximately at steady state, the powder
feed to the baghouse was started by connecting the blowline to the vibrating hopper, and then
the pulse system was started. The baghouse was then run for around 45-60 minutes while
measurements were taken. At the end of each run, the powder flow and pulse system were
shut off, then the baghouse was shut down according to the procedure described in Section
3.4.3.
Powder flow was set to approximately 1 g.s-1
for all runs, although this could not be
controlled with great accuracy and there was some variation between runs. An accurate
measure of the powder flow was calculated for each run by weighing the powder in the
hopper at the start and end of the run and dividing by the duration of the run. While this only
gave an average flow, and it was not possible to measure the powder flow at intermediate
points during the run, the hopper was tested in isolation and found to provide steady flow
after around a 5 min warm up period. The hopper was therefore warmed up before each run
by feeding powder into a jar, and the powder flow was then assumed to remain constant
during each run.
The compressed air for the pulse was supplied from a reservoir just upstream of the pulse
valve, as shown in Figure 50. The pressure in the reservoir drops during the pulse, so the tank
pressure (PT) was defined as the pressure at the start of the pulse, as this could easily be set
using a regulator on the 6.5 bar air supply line that was used to fill the pulse reservoir.
The pulse nozzle consisted of a torpedo shaped flow diverter positioned centrally within a
40 mm tube (refer to Figure 15). The nozzle height (hn) was defined as the vertical distance
between the bottom of the diverter and the top of the filter bag, as shown in Figure 50.
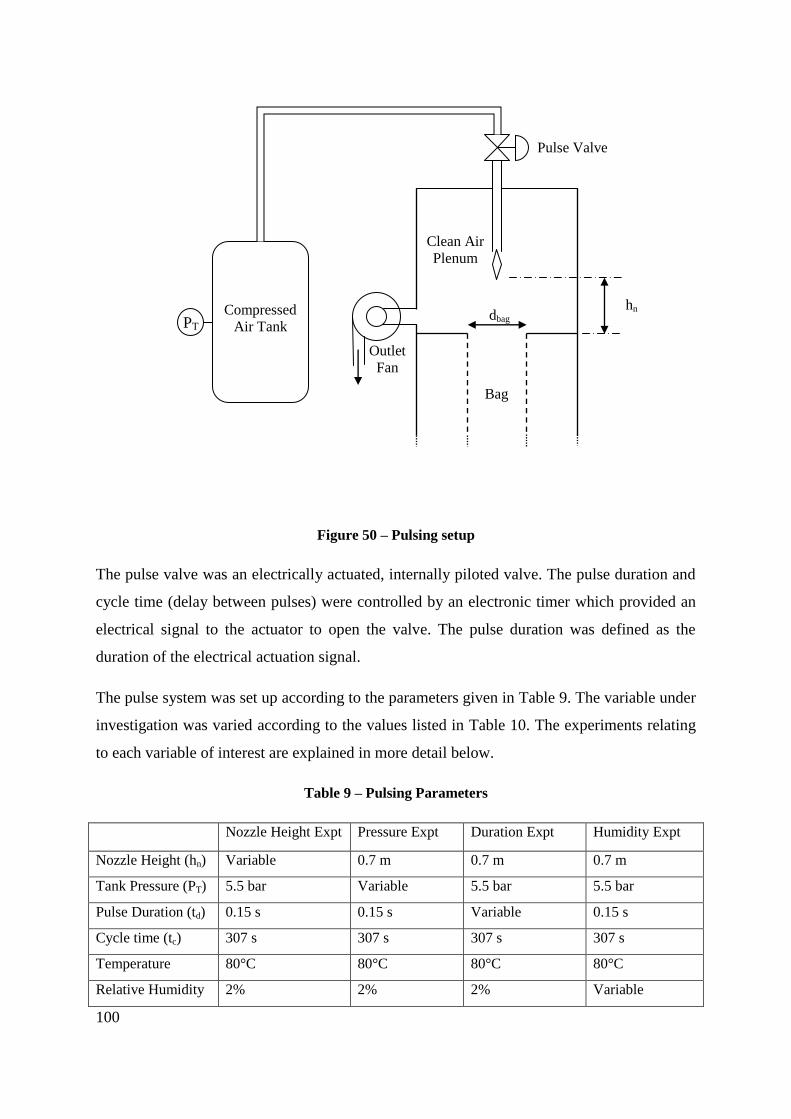
100
Figure 50 – Pulsing setup
The pulse valve was an electrically actuated, internally piloted valve. The pulse duration and
cycle time (delay between pulses) were controlled by an electronic timer which provided an
electrical signal to the actuator to open the valve. The pulse duration was defined as the
duration of the electrical actuation signal.
The pulse system was set up according to the parameters given in Table 9. The variable under
investigation was varied according to the values listed in Table 10. The experiments relating
to each variable of interest are explained in more detail below.
Table 9 – Pulsing Parameters
Nozzle Height Expt Pressure Expt Duration Expt Humidity Expt
Nozzle Height (hn) Variable 0.7 m 0.7 m 0.7 m
Tank Pressure (PT) 5.5 bar Variable 5.5 bar 5.5 bar
Pulse Duration (td) 0.15 s 0.15 s Variable 0.15 s
Cycle time (tc) 307 s 307 s 307 s 307 s
Temperature 80°C 80°C 80°C 80°C
Relative Humidity 2% 2% 2% Variable
PT Compressed
Air Tank
Pulse Valve
hn dbag
Clean Air
Plenum
Bag
Outlet
Fan
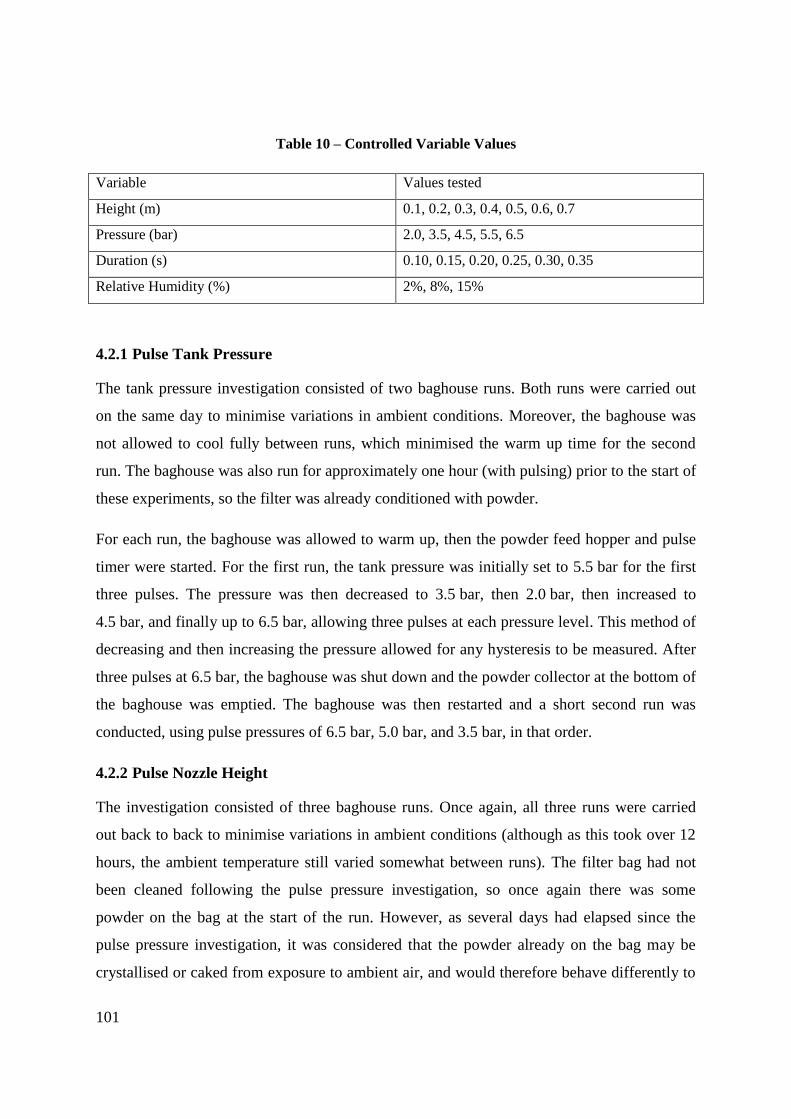
101
Table 10 – Controlled Variable Values
Variable Values tested
Height (m) 0.1, 0.2, 0.3, 0.4, 0.5, 0.6, 0.7
Pressure (bar) 2.0, 3.5, 4.5, 5.5, 6.5
Duration (s) 0.10, 0.15, 0.20, 0.25, 0.30, 0.35
Relative Humidity (%) 2%, 8%, 15%
4.2.1 Pulse Tank Pressure
The tank pressure investigation consisted of two baghouse runs. Both runs were carried out
on the same day to minimise variations in ambient conditions. Moreover, the baghouse was
not allowed to cool fully between runs, which minimised the warm up time for the second
run. The baghouse was also run for approximately one hour (with pulsing) prior to the start of
these experiments, so the filter was already conditioned with powder.
For each run, the baghouse was allowed to warm up, then the powder feed hopper and pulse
timer were started. For the first run, the tank pressure was initially set to 5.5 bar for the first
three pulses. The pressure was then decreased to 3.5 bar, then 2.0 bar, then increased to
4.5 bar, and finally up to 6.5 bar, allowing three pulses at each pressure level. This method of
decreasing and then increasing the pressure allowed for any hysteresis to be measured. After
three pulses at 6.5 bar, the baghouse was shut down and the powder collector at the bottom of
the baghouse was emptied. The baghouse was then restarted and a short second run was
conducted, using pulse pressures of 6.5 bar, 5.0 bar, and 3.5 bar, in that order.
4.2.2 Pulse Nozzle Height
The investigation consisted of three baghouse runs. Once again, all three runs were carried
out back to back to minimise variations in ambient conditions (although as this took over 12
hours, the ambient temperature still varied somewhat between runs). The filter bag had not
been cleaned following the pulse pressure investigation, so once again there was some
powder on the bag at the start of the run. However, as several days had elapsed since the
pulse pressure investigation, it was considered that the powder already on the bag may be
crystallised or caked from exposure to ambient air, and would therefore behave differently to
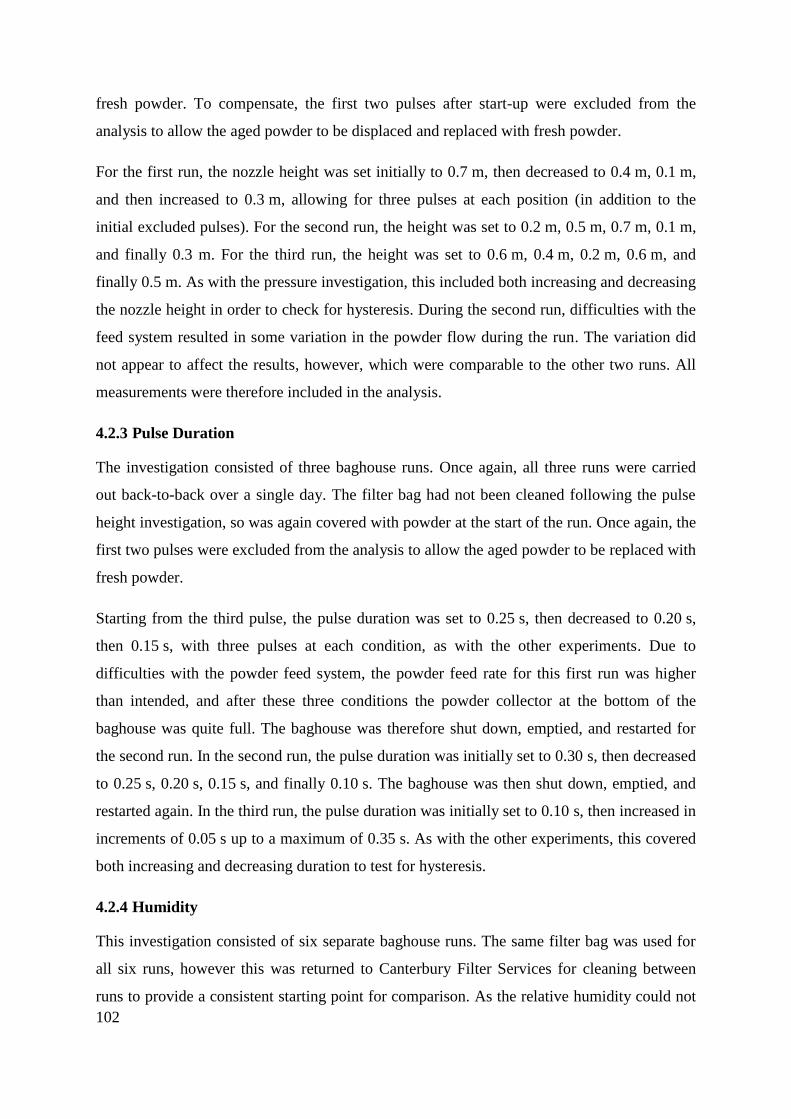
102
fresh powder. To compensate, the first two pulses after start-up were excluded from the
analysis to allow the aged powder to be displaced and replaced with fresh powder.
For the first run, the nozzle height was set initially to 0.7 m, then decreased to 0.4 m, 0.1 m,
and then increased to 0.3 m, allowing for three pulses at each position (in addition to the
initial excluded pulses). For the second run, the height was set to 0.2 m, 0.5 m, 0.7 m, 0.1 m,
and finally 0.3 m. For the third run, the height was set to 0.6 m, 0.4 m, 0.2 m, 0.6 m, and
finally 0.5 m. As with the pressure investigation, this included both increasing and decreasing
the nozzle height in order to check for hysteresis. During the second run, difficulties with the
feed system resulted in some variation in the powder flow during the run. The variation did
not appear to affect the results, however, which were comparable to the other two runs. All
measurements were therefore included in the analysis.
4.2.3 Pulse Duration
The investigation consisted of three baghouse runs. Once again, all three runs were carried
out back-to-back over a single day. The filter bag had not been cleaned following the pulse
height investigation, so was again covered with powder at the start of the run. Once again, the
first two pulses were excluded from the analysis to allow the aged powder to be replaced with
fresh powder.
Starting from the third pulse, the pulse duration was set to 0.25 s, then decreased to 0.20 s,
then 0.15 s, with three pulses at each condition, as with the other experiments. Due to
difficulties with the powder feed system, the powder feed rate for this first run was higher
than intended, and after these three conditions the powder collector at the bottom of the
baghouse was quite full. The baghouse was therefore shut down, emptied, and restarted for
the second run. In the second run, the pulse duration was initially set to 0.30 s, then decreased
to 0.25 s, 0.20 s, 0.15 s, and finally 0.10 s. The baghouse was then shut down, emptied, and
restarted again. In the third run, the pulse duration was initially set to 0.10 s, then increased in
increments of 0.05 s up to a maximum of 0.35 s. As with the other experiments, this covered
both increasing and decreasing duration to test for hysteresis.
4.2.4 Humidity
This investigation consisted of six separate baghouse runs. The same filter bag was used for
all six runs, however this was returned to Canterbury Filter Services for cleaning between
runs to provide a consistent starting point for comparison. As the relative humidity could not
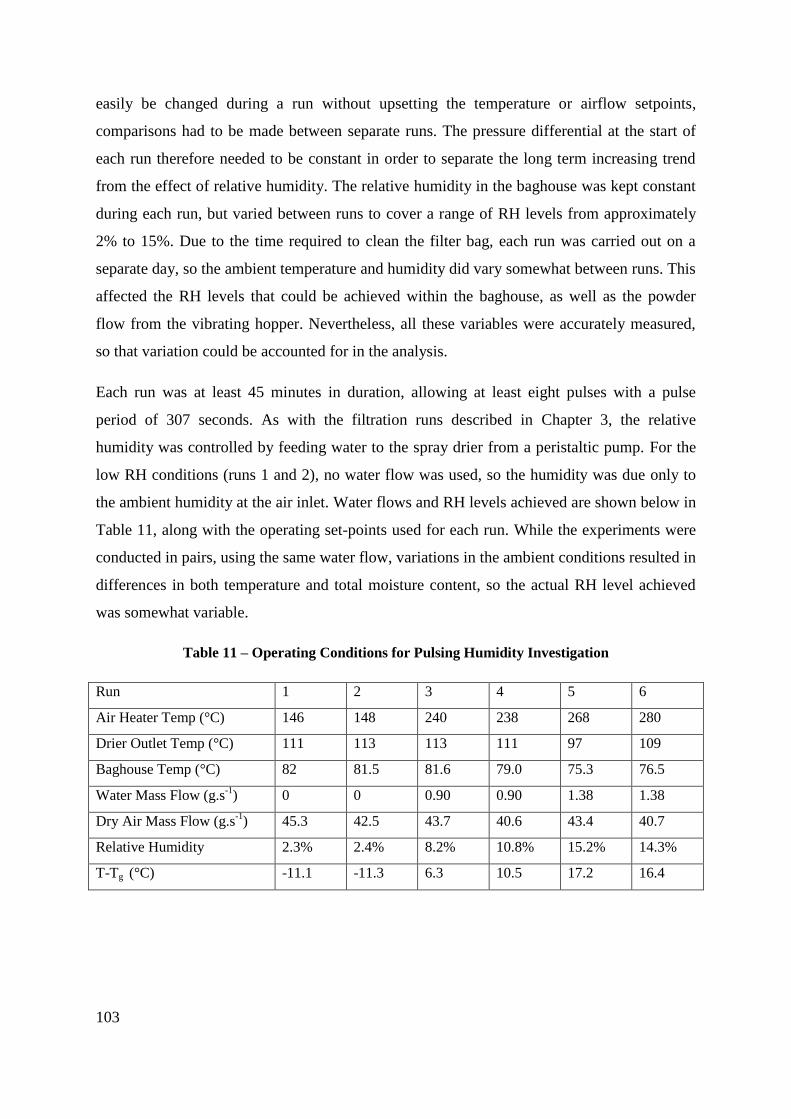
103
easily be changed during a run without upsetting the temperature or airflow setpoints,
comparisons had to be made between separate runs. The pressure differential at the start of
each run therefore needed to be constant in order to separate the long term increasing trend
from the effect of relative humidity. The relative humidity in the baghouse was kept constant
during each run, but varied between runs to cover a range of RH levels from approximately
2% to 15%. Due to the time required to clean the filter bag, each run was carried out on a
separate day, so the ambient temperature and humidity did vary somewhat between runs. This
affected the RH levels that could be achieved within the baghouse, as well as the powder
flow from the vibrating hopper. Nevertheless, all these variables were accurately measured,
so that variation could be accounted for in the analysis.
Each run was at least 45 minutes in duration, allowing at least eight pulses with a pulse
period of 307 seconds. As with the filtration runs described in Chapter 3, the relative
humidity was controlled by feeding water to the spray drier from a peristaltic pump. For the
low RH conditions (runs 1 and 2), no water flow was used, so the humidity was due only to
the ambient humidity at the air inlet. Water flows and RH levels achieved are shown below in
Table 11, along with the operating set-points used for each run. While the experiments were
conducted in pairs, using the same water flow, variations in the ambient conditions resulted in
differences in both temperature and total moisture content, so the actual RH level achieved
was somewhat variable.
Table 11 – Operating Conditions for Pulsing Humidity Investigation
Run 1 2 3 4 5 6
Air Heater Temp (°C) 146 148 240 238 268 280
Drier Outlet Temp (°C) 111 113 113 111 97 109
Baghouse Temp (°C) 82 81.5 81.6 79.0 75.3 76.5
Water Mass Flow (g.s-1
) 0 0 0.90 0.90 1.38 1.38
Dry Air Mass Flow (g.s-1
) 45.3 42.5 43.7 40.6 43.4 40.7
Relative Humidity 2.3% 2.4% 8.2% 10.8% 15.2% 14.3%
T-Tg (°C) -11.1 -11.3 6.3 10.5 17.2 16.4
104
4.2.5 Analysis
The pulse effectiveness was determined by measuring the residual pressure differential across
the filter after a pulse. This was found to be a better measure of pulse effectiveness than the
ΔP reduction over a pulse, as it only relies on a single measurement. To clarify the difference
between these alternative measures of performance, Figure 51 shows a typical pressure trend
with the residual ∆P and ∆P reduction indicated. The ∆P reduction is calculated by
subtracting the residual ∆P from the initial ∆P immediately prior to the pulse. In addition to
the improved accuracy, the residual pressure differential is more directly related to the
operating cost of a baghouse, as the ΔP reduction does not measure the absolute pressure in
the baghouse, which is what determines the fan energy requirements. However, the pressure
differentials after a pulse do tend to fluctuate as forward flow resumes and some of the
removed powder is entrained and re-deposited on the bag. In addition, the turbulent flow in
the aftermath of a pulse may have caused local pressure fluctuations in the region of the
sensor, resulting in readings that did not accurately represent the average pressure differential
across the bag. Figure 52 shows a close up of the pressure change over a single pulse, with
the re-deposition period highlighted, demonstrating the rapid increase in the pressure
differential in the first few seconds after the pulse. The data logging software recorded the
pressure differential at 2 s intervals, and the first measurement after a pulse was found to be a
poor indicator of the pulse effectiveness, with poor repeatability between pulses under the
same conditions. To correct for this, the third measurement after the pulse was used,
corresponding to around 6 s after the pulse. This showed much better repeatability between
pulses under identical conditions.
105
Figure 51 – Typical pressure differentials for pulsing run
Figure 52 – Re-deposition of powder after a pulse
20
30
40
50
60
70
80
0 5 10 15 20 25 30
ΔP
(P
a)
Time (min)
40
45
50
55
60
65
70
75
80
22 23 24 25 26 27 28
ΔP
(P
a)
Time (min)
Pulses
∆P reduction
Residual ∆P
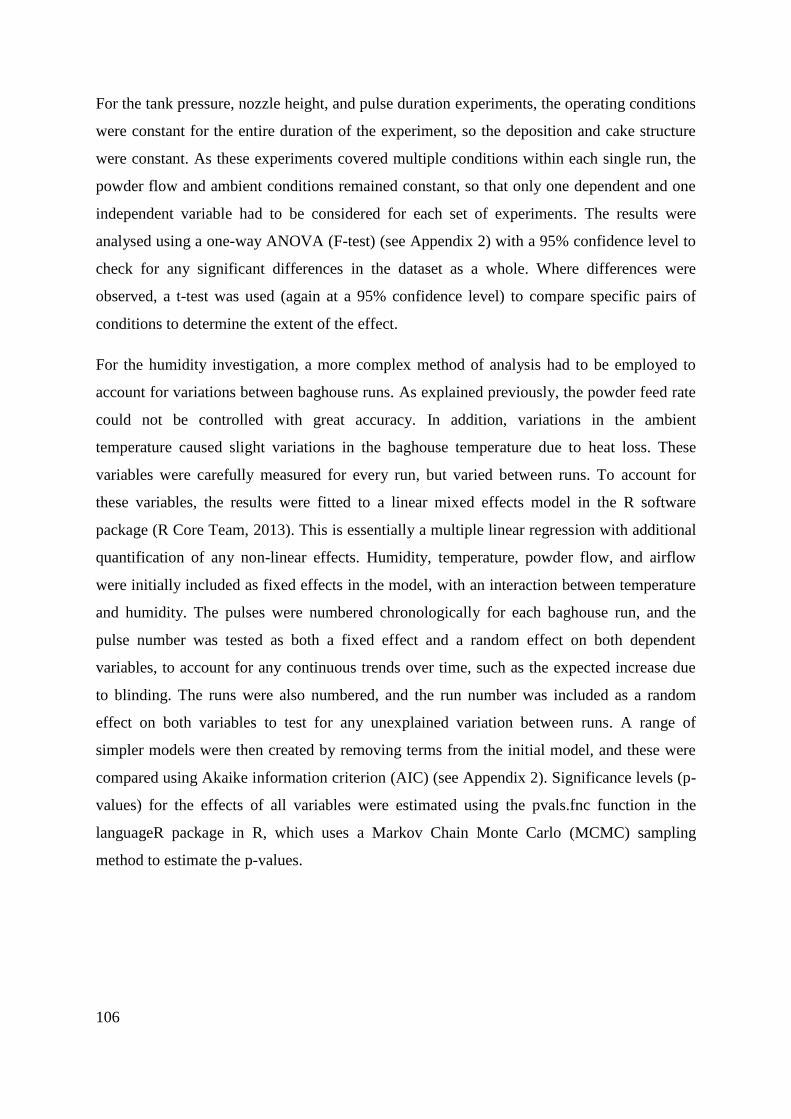
106
For the tank pressure, nozzle height, and pulse duration experiments, the operating conditions
were constant for the entire duration of the experiment, so the deposition and cake structure
were constant. As these experiments covered multiple conditions within each single run, the
powder flow and ambient conditions remained constant, so that only one dependent and one
independent variable had to be considered for each set of experiments. The results were
analysed using a one-way ANOVA (F-test) (see Appendix 2) with a 95% confidence level to
check for any significant differences in the dataset as a whole. Where differences were
observed, a t-test was used (again at a 95% confidence level) to compare specific pairs of
conditions to determine the extent of the effect.
For the humidity investigation, a more complex method of analysis had to be employed to
account for variations between baghouse runs. As explained previously, the powder feed rate
could not be controlled with great accuracy. In addition, variations in the ambient
temperature caused slight variations in the baghouse temperature due to heat loss. These
variables were carefully measured for every run, but varied between runs. To account for
these variables, the results were fitted to a linear mixed effects model in the R software
package (R Core Team, 2013). This is essentially a multiple linear regression with additional
quantification of any non-linear effects. Humidity, temperature, powder flow, and airflow
were initially included as fixed effects in the model, with an interaction between temperature
and humidity. The pulses were numbered chronologically for each baghouse run, and the
pulse number was tested as both a fixed effect and a random effect on both dependent
variables, to account for any continuous trends over time, such as the expected increase due
to blinding. The runs were also numbered, and the run number was included as a random
effect on both variables to test for any unexplained variation between runs. A range of
simpler models were then created by removing terms from the initial model, and these were
compared using Akaike information criterion (AIC) (see Appendix 2). Significance levels (p-
values) for the effects of all variables were estimated using the pvals.fnc function in the
languageR package in R, which uses a Markov Chain Monte Carlo (MCMC) sampling
method to estimate the p-values.
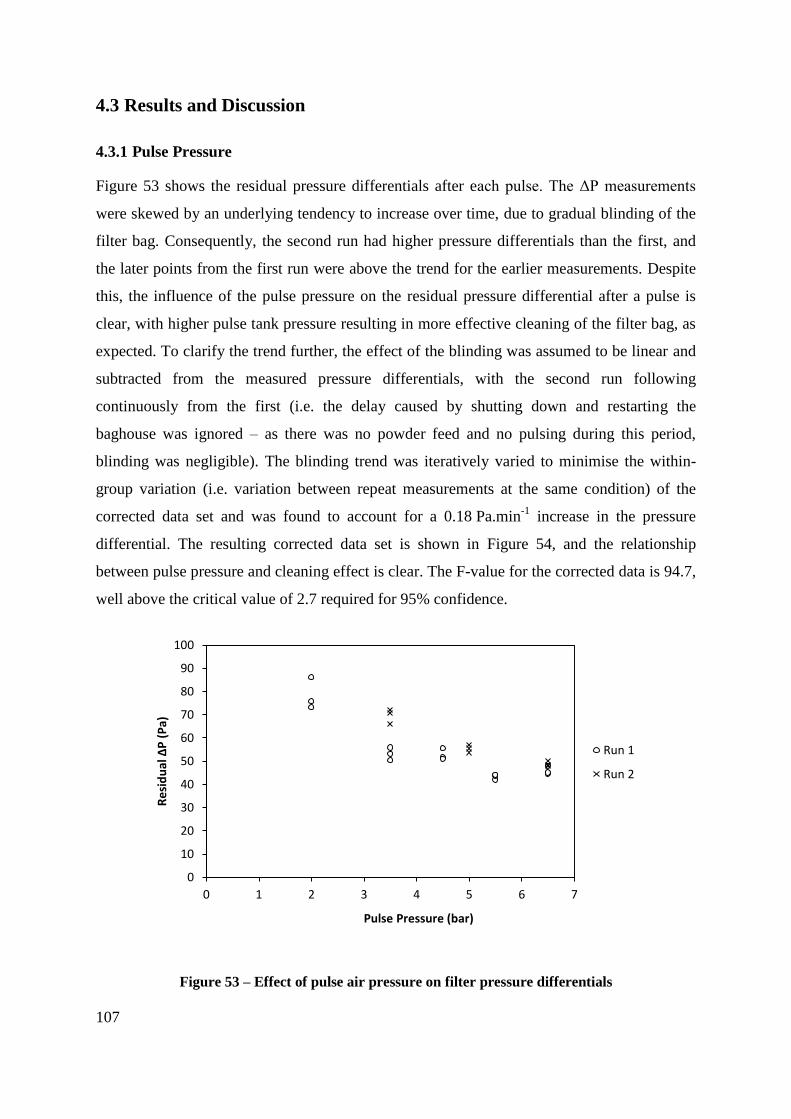
107
4.3 Results and Discussion
4.3.1 Pulse Pressure
Figure 53 shows the residual pressure differentials after each pulse. The ΔP measurements
were skewed by an underlying tendency to increase over time, due to gradual blinding of the
filter bag. Consequently, the second run had higher pressure differentials than the first, and
the later points from the first run were above the trend for the earlier measurements. Despite
this, the influence of the pulse pressure on the residual pressure differential after a pulse is
clear, with higher pulse tank pressure resulting in more effective cleaning of the filter bag, as
expected. To clarify the trend further, the effect of the blinding was assumed to be linear and
subtracted from the measured pressure differentials, with the second run following
continuously from the first (i.e. the delay caused by shutting down and restarting the
baghouse was ignored – as there was no powder feed and no pulsing during this period,
blinding was negligible). The blinding trend was iteratively varied to minimise the within-
group variation (i.e. variation between repeat measurements at the same condition) of the
corrected data set and was found to account for a 0.18 Pa.min-1
increase in the pressure
differential. The resulting corrected data set is shown in Figure 54, and the relationship
between pulse pressure and cleaning effect is clear. The F-value for the corrected data is 94.7,
well above the critical value of 2.7 required for 95% confidence.
Figure 53 – Effect of pulse air pressure on filter pressure differentials
0
10
20
30
40
50
60
70
80
90
100
0 1 2 3 4 5 6 7
Re
sid
ual
ΔP
(P
a)
Pulse Pressure (bar)
Run 1
Run 2
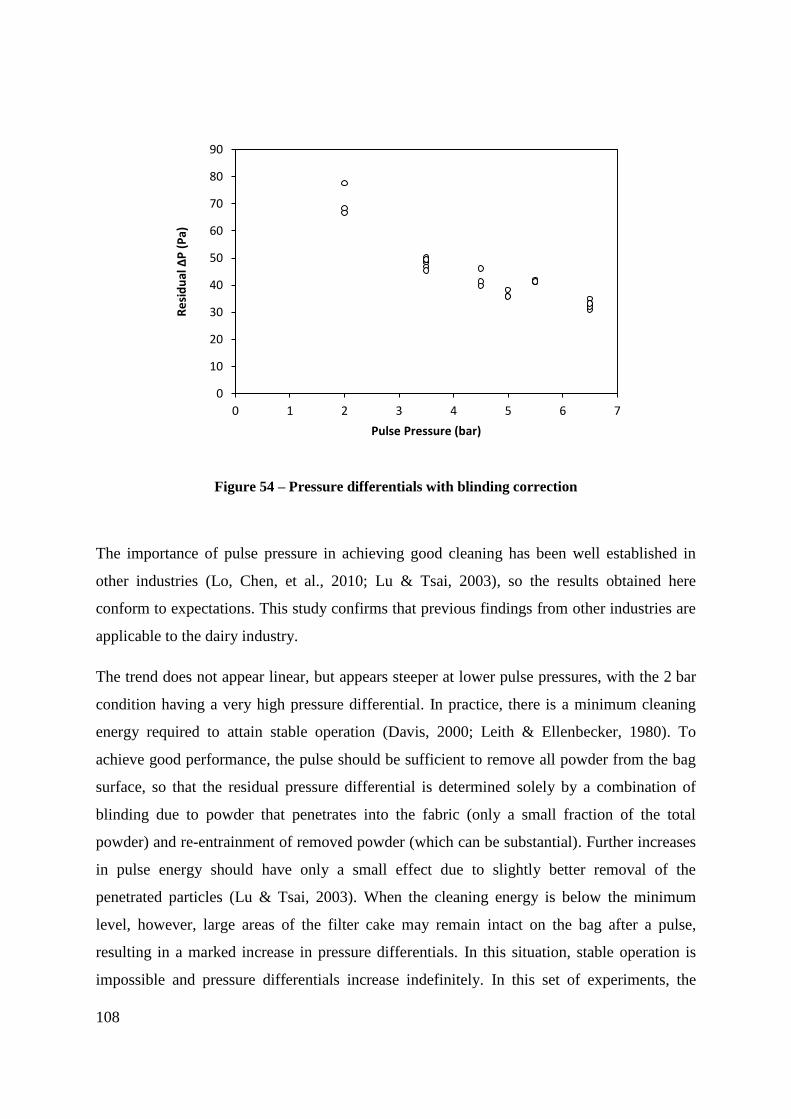
108
Figure 54 – Pressure differentials with blinding correction
The importance of pulse pressure in achieving good cleaning has been well established in
other industries (Lo, Chen, et al., 2010; Lu & Tsai, 2003), so the results obtained here
conform to expectations. This study confirms that previous findings from other industries are
applicable to the dairy industry.
The trend does not appear linear, but appears steeper at lower pulse pressures, with the 2 bar
condition having a very high pressure differential. In practice, there is a minimum cleaning
energy required to attain stable operation (Davis, 2000; Leith & Ellenbecker, 1980). To
achieve good performance, the pulse should be sufficient to remove all powder from the bag
surface, so that the residual pressure differential is determined solely by a combination of
blinding due to powder that penetrates into the fabric (only a small fraction of the total
powder) and re-entrainment of removed powder (which can be substantial). Further increases
in pulse energy should have only a small effect due to slightly better removal of the
penetrated particles (Lu & Tsai, 2003). When the cleaning energy is below the minimum
level, however, large areas of the filter cake may remain intact on the bag after a pulse,
resulting in a marked increase in pressure differentials. In this situation, stable operation is
impossible and pressure differentials increase indefinitely. In this set of experiments, the
0
10
20
30
40
50
60
70
80
90
0 1 2 3 4 5 6 7
Re
sid
ual
ΔP
(P
a)
Pulse Pressure (bar)
109
three pulses at the 2 bar condition exhibited a strong increasing trend, much greater than the
blinding effect (Figure 55), which indicates that 2 bar is below the minimum pulse pressure
required for stable operation. Note however that the minimum cleaning energy for other
baghouses may differ from the level measured here, due to differences in bag volume and
powder loading. In particular, the filter bags used in industrial baghouses are typically much
longer than the filter bag used here, and would therefore require a more powerful pulse to
achieve adequate cleaning along the full length of the bag.
Figure 55 – Increasing pressure differentials at 2 bar pulse pressure
If the 2 bar pulse pressure had been maintained for longer, the pressure differentials would
have increased still further. The ΔP measurements at this condition are therefore not an
accurate representation of the long term pressure differentials that would occur with a 2 bar
pulse pressure. For unsteady operation, the reduction in pressure differential over a pulse is
actually a better measurement of the pulse effectiveness than the residual pressure; however
as the other conditions all appeared to be at a pseudo-steady state, the residual pressure was
considered a better measure for the complete data set. The justification for this is explained in
more detail in Section 4.3.5. The 4.5 bar pulses were able to reduce the pressure differentials
from the high values reached after the 2 bar pulses back to a level similar to the conditions
prior to the 2 bar pulses, confirming that the residual pressure is relatively independent of the
pressure differential prior to the pulse. The residual pressures measured for the 3.5-6.5 bar
0
20
40
60
80
100
120
10 20 30 40 50 60 70
ΔP
(P
a)
Time (min)
2 bar 4.5 bar 3.5 bar
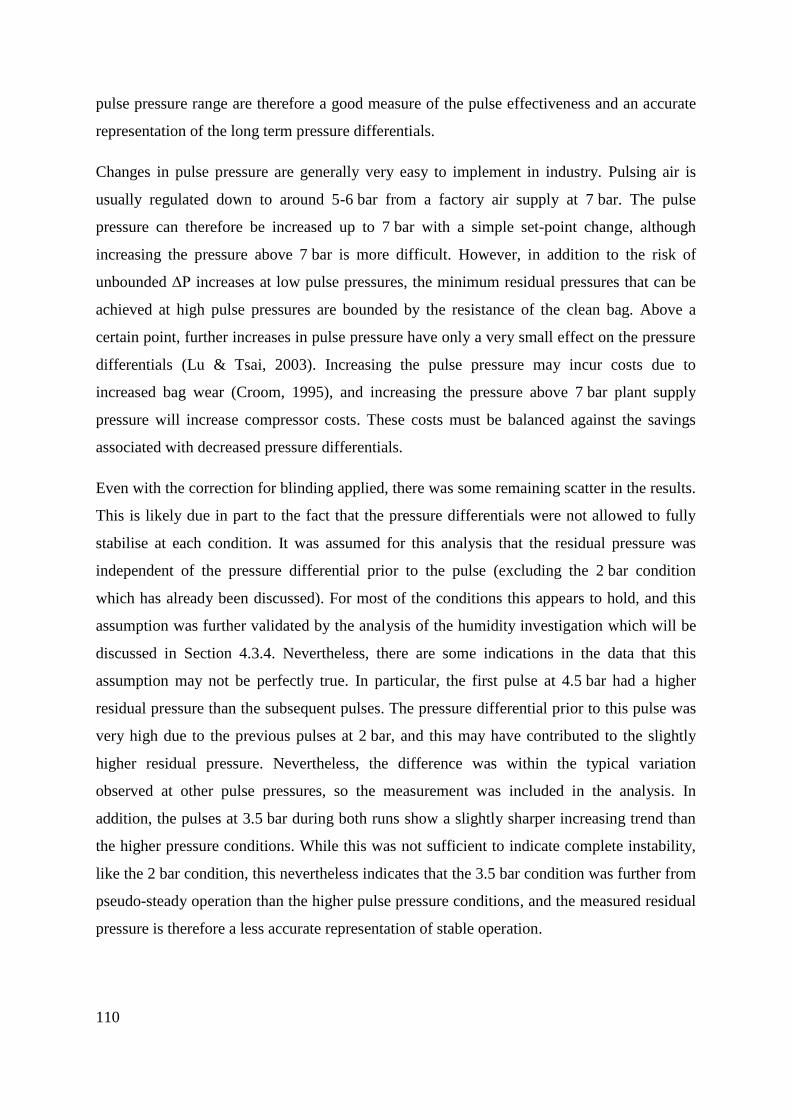
110
pulse pressure range are therefore a good measure of the pulse effectiveness and an accurate
representation of the long term pressure differentials.
Changes in pulse pressure are generally very easy to implement in industry. Pulsing air is
usually regulated down to around 5-6 bar from a factory air supply at 7 bar. The pulse
pressure can therefore be increased up to 7 bar with a simple set-point change, although
increasing the pressure above 7 bar is more difficult. However, in addition to the risk of
unbounded ΔP increases at low pulse pressures, the minimum residual pressures that can be
achieved at high pulse pressures are bounded by the resistance of the clean bag. Above a
certain point, further increases in pulse pressure have only a very small effect on the pressure
differentials (Lu & Tsai, 2003). Increasing the pulse pressure may incur costs due to
increased bag wear (Croom, 1995), and increasing the pressure above 7 bar plant supply
pressure will increase compressor costs. These costs must be balanced against the savings
associated with decreased pressure differentials.
Even with the correction for blinding applied, there was some remaining scatter in the results.
This is likely due in part to the fact that the pressure differentials were not allowed to fully
stabilise at each condition. It was assumed for this analysis that the residual pressure was
independent of the pressure differential prior to the pulse (excluding the 2 bar condition
which has already been discussed). For most of the conditions this appears to hold, and this
assumption was further validated by the analysis of the humidity investigation which will be
discussed in Section 4.3.4. Nevertheless, there are some indications in the data that this
assumption may not be perfectly true. In particular, the first pulse at 4.5 bar had a higher
residual pressure than the subsequent pulses. The pressure differential prior to this pulse was
very high due to the previous pulses at 2 bar, and this may have contributed to the slightly
higher residual pressure. Nevertheless, the difference was within the typical variation
observed at other pulse pressures, so the measurement was included in the analysis. In
addition, the pulses at 3.5 bar during both runs show a slightly sharper increasing trend than
the higher pressure conditions. While this was not sufficient to indicate complete instability,
like the 2 bar condition, this nevertheless indicates that the 3.5 bar condition was further from
pseudo-steady operation than the higher pulse pressure conditions, and the measured residual
pressure is therefore a less accurate representation of stable operation.
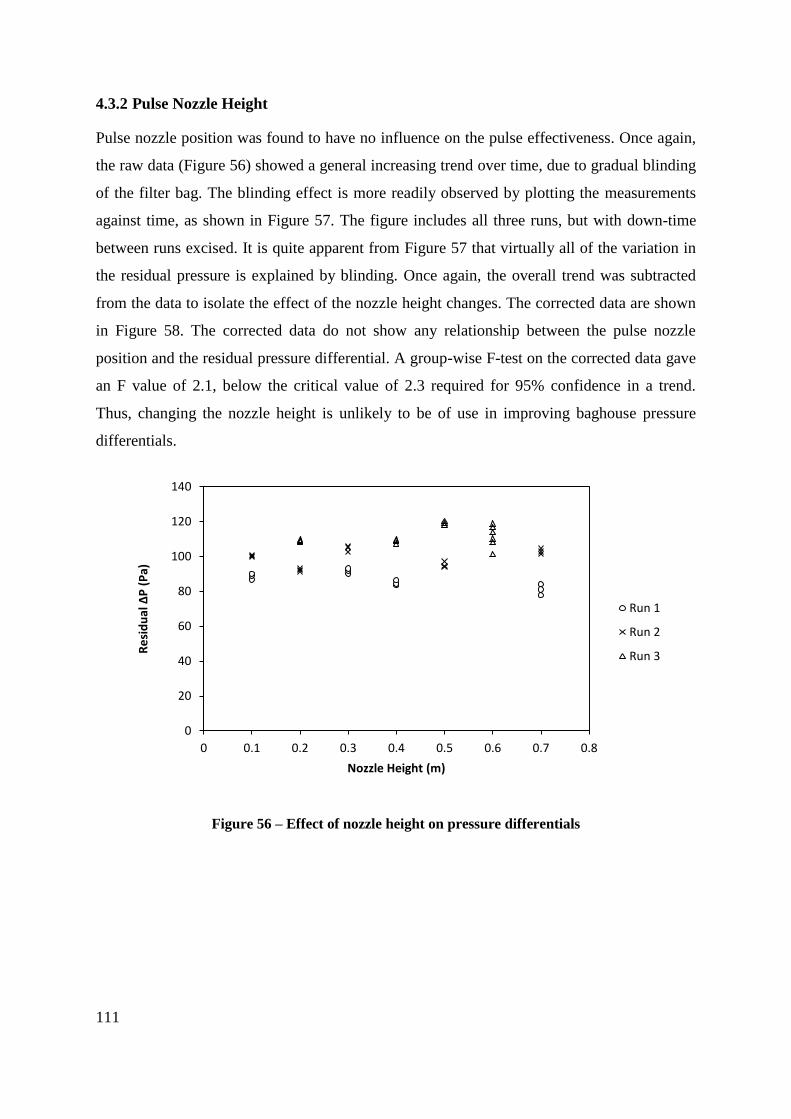
111
4.3.2 Pulse Nozzle Height
Pulse nozzle position was found to have no influence on the pulse effectiveness. Once again,
the raw data (Figure 56) showed a general increasing trend over time, due to gradual blinding
of the filter bag. The blinding effect is more readily observed by plotting the measurements
against time, as shown in Figure 57. The figure includes all three runs, but with down-time
between runs excised. It is quite apparent from Figure 57 that virtually all of the variation in
the residual pressure is explained by blinding. Once again, the overall trend was subtracted
from the data to isolate the effect of the nozzle height changes. The corrected data are shown
in Figure 58. The corrected data do not show any relationship between the pulse nozzle
position and the residual pressure differential. A group-wise F-test on the corrected data gave
an F value of 2.1, below the critical value of 2.3 required for 95% confidence in a trend.
Thus, changing the nozzle height is unlikely to be of use in improving baghouse pressure
differentials.
Figure 56 – Effect of nozzle height on pressure differentials
0
20
40
60
80
100
120
140
0 0.1 0.2 0.3 0.4 0.5 0.6 0.7 0.8
Re
sid
ual
ΔP
(P
a)
Nozzle Height (m)
Run 1
Run 2
Run 3
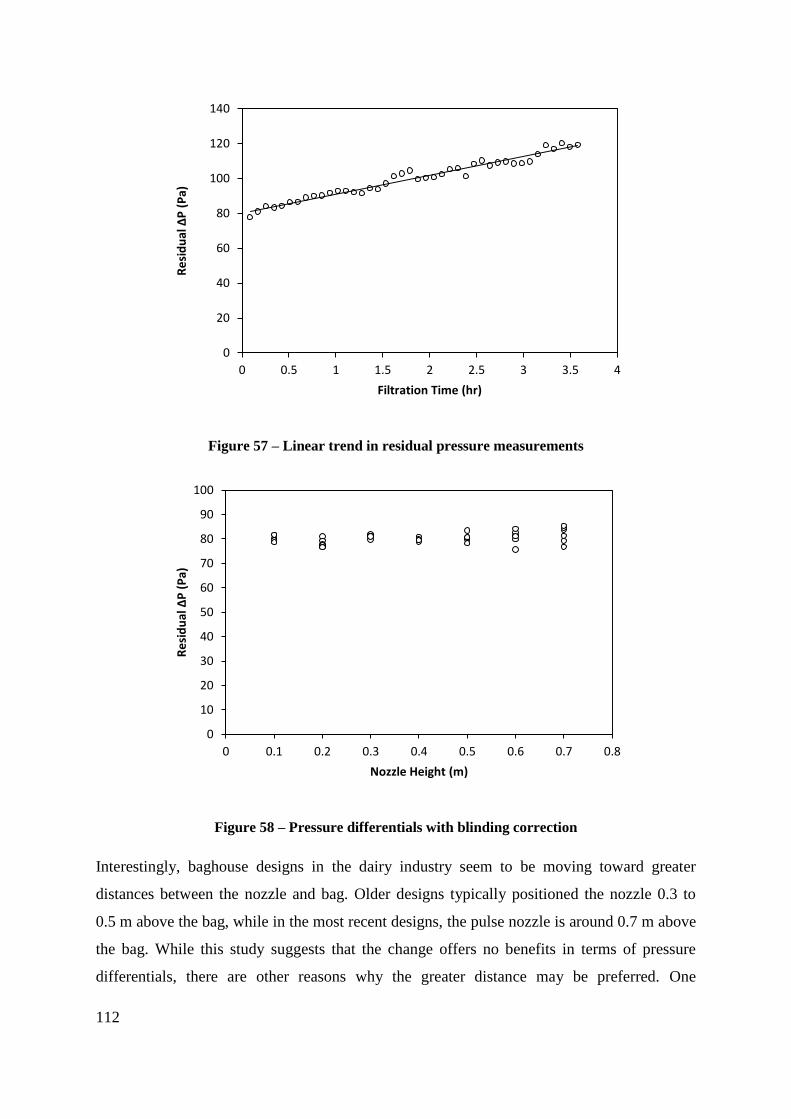
112
Figure 57 – Linear trend in residual pressure measurements
Figure 58 – Pressure differentials with blinding correction
Interestingly, baghouse designs in the dairy industry seem to be moving toward greater
distances between the nozzle and bag. Older designs typically positioned the nozzle 0.3 to
0.5 m above the bag, while in the most recent designs, the pulse nozzle is around 0.7 m above
the bag. While this study suggests that the change offers no benefits in terms of pressure
differentials, there are other reasons why the greater distance may be preferred. One
0
20
40
60
80
100
120
140
0 0.5 1 1.5 2 2.5 3 3.5 4
Re
sid
ual
ΔP
(P
a)
Filtration Time (hr)
0
10
20
30
40
50
60
70
80
90
100
0 0.1 0.2 0.3 0.4 0.5 0.6 0.7 0.8
Re
sid
ual
ΔP
(P
a)
Nozzle Height (m)
113
consideration is the uniformity of the cleaning effect. It has been suggested that if the nozzle
is positioned too close to the bag, the high velocity of the air jet creates a low pressure zone at
the top of the bag due to the Bernoulli effect, resulting in poor cleaning just below the cell
plate (Gabites, 2007; Winchester, 2010). Powder that remains on the filter for long periods
degrades over time and can contaminate the product. A further consideration is that high
shear rates and pressure gradients near the nozzle may cause excessive wear and tear on the
filter bag at low nozzle positions.
The absence of a clear effect conflicts with the results of Suh et al. (2011) and Lu and Tsai
(1996), who both reported that pulse nozzle position did affect the pulse performance.
Nevertheless, both of these previous studies were severely limited in their approach; Suh et
al. (2011) used a baghouse with a venturi at the top of the bag. The 65 mm venturi throat
provided a very small opening, and the optimum distance of 0.11 m was at the lower end of
the positions tested, with only one lower position (0.05 m) tested. The reduction in
performance at higher positions was most likely due to the air jet being partially occluded by
the narrow opening, and not due to entrainment of air into the pulse. Reported half-jet
expansion angles for free circular jets range from 7-20° (Horn & Thring, 1956), indicating
that the 65 mm venturi throat used by Suh et al. (2011) begins to partially occlude the air jet
at nozzle distances of 0.08-0.2 m. In contrast, the experimental and CFD results to be
discussed in Chapters 5 and 6 of this thesis will show that in the pilot scale baghouse used
here, air jet occlusion does not occur at nozzle heights below 0.7 m. Lu and Tsai (1996)
reported that the nozzle height affected the entrainment of secondary air into the pulse, and
thus the overpressure developed in the bag. These authors, however, only measured the
pressure developed in the bag during the pulse, and did not measure the subsequent effect on
pressure differentials during forward filtration. Provided the pulse overpressure is sufficient
to remove most of the powder on the bag, changes in pulse overpressure will have a limited
effect on the pressure differentials, as there is little room for improvement. It is likely that the
pulse overpressure developed in the pilot scale experiments reported here was sufficient in all
cases to fully remove the filter cake, so that no noticeable differences were observed in the
forward pressure differentials.
Another important consideration is the size of the clean air plenum. As mentioned above, Lu
and Tsai (1996) attributed the effect of nozzle height to differences in the entrainment of
secondary air into the cleaning pulse. The clean air plenum in a typical industrial baghouse is
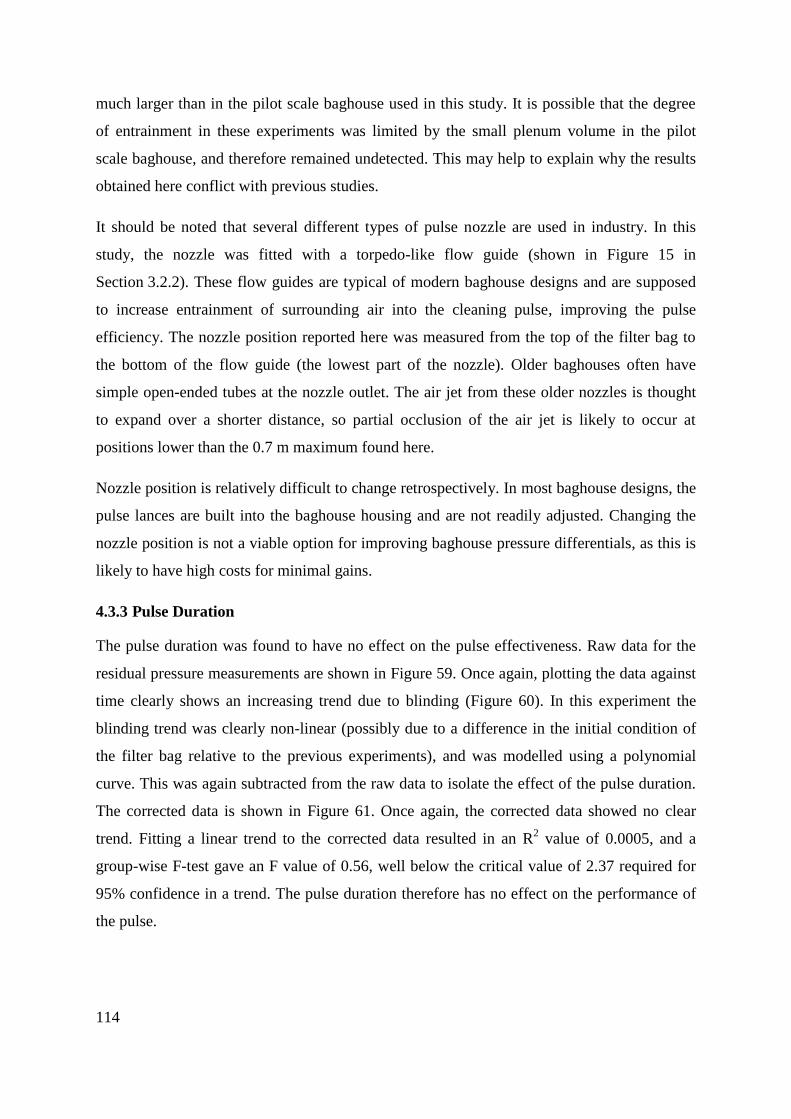
114
much larger than in the pilot scale baghouse used in this study. It is possible that the degree
of entrainment in these experiments was limited by the small plenum volume in the pilot
scale baghouse, and therefore remained undetected. This may help to explain why the results
obtained here conflict with previous studies.
It should be noted that several different types of pulse nozzle are used in industry. In this
study, the nozzle was fitted with a torpedo-like flow guide (shown in Figure 15 in
Section 3.2.2). These flow guides are typical of modern baghouse designs and are supposed
to increase entrainment of surrounding air into the cleaning pulse, improving the pulse
efficiency. The nozzle position reported here was measured from the top of the filter bag to
the bottom of the flow guide (the lowest part of the nozzle). Older baghouses often have
simple open-ended tubes at the nozzle outlet. The air jet from these older nozzles is thought
to expand over a shorter distance, so partial occlusion of the air jet is likely to occur at
positions lower than the 0.7 m maximum found here.
Nozzle position is relatively difficult to change retrospectively. In most baghouse designs, the
pulse lances are built into the baghouse housing and are not readily adjusted. Changing the
nozzle position is not a viable option for improving baghouse pressure differentials, as this is
likely to have high costs for minimal gains.
4.3.3 Pulse Duration
The pulse duration was found to have no effect on the pulse effectiveness. Raw data for the
residual pressure measurements are shown in Figure 59. Once again, plotting the data against
time clearly shows an increasing trend due to blinding (Figure 60). In this experiment the
blinding trend was clearly non-linear (possibly due to a difference in the initial condition of
the filter bag relative to the previous experiments), and was modelled using a polynomial
curve. This was again subtracted from the raw data to isolate the effect of the pulse duration.
The corrected data is shown in Figure 61. Once again, the corrected data showed no clear
trend. Fitting a linear trend to the corrected data resulted in an R2 value of 0.0005, and a
group-wise F-test gave an F value of 0.56, well below the critical value of 2.37 required for
95% confidence in a trend. The pulse duration therefore has no effect on the performance of
the pulse.
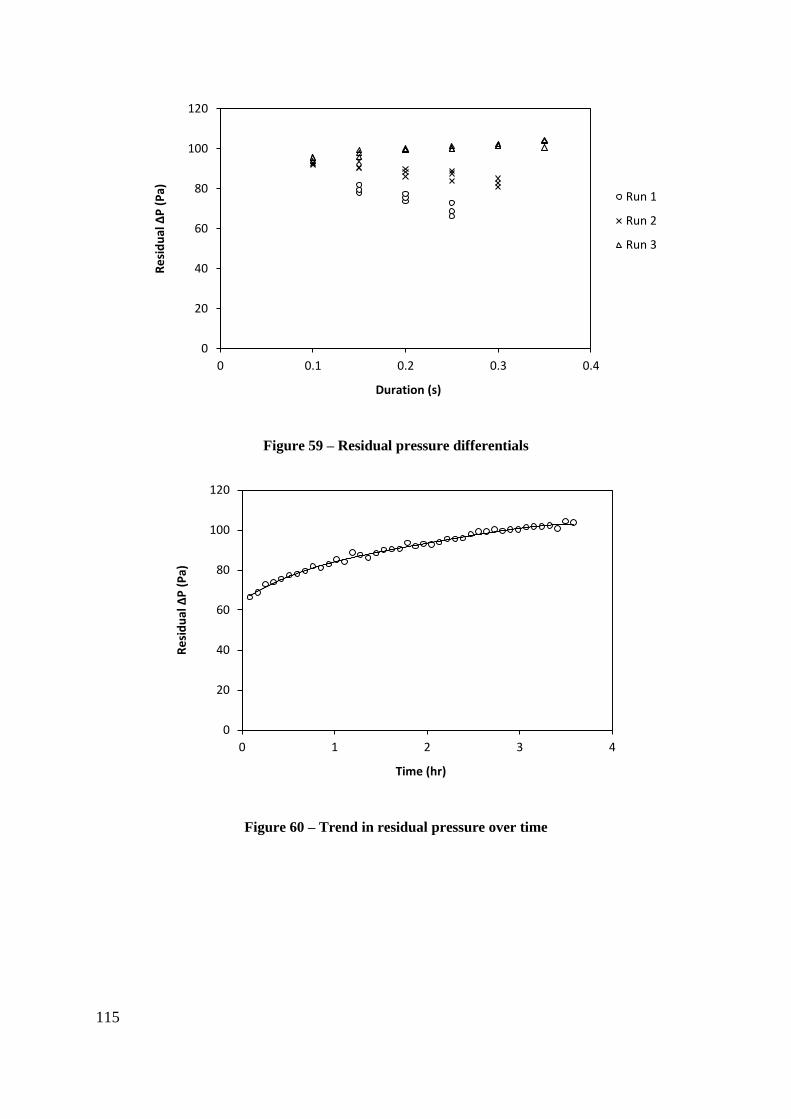
115
Figure 59 – Residual pressure differentials
Figure 60 – Trend in residual pressure over time
0
20
40
60
80
100
120
0 0.1 0.2 0.3 0.4
Re
sid
ual
ΔP
(P
a)
Duration (s)
Run 1
Run 2
Run 3
0
20
40
60
80
100
120
0 1 2 3 4
Re
sid
ual
ΔP
(P
a)
Time (hr)
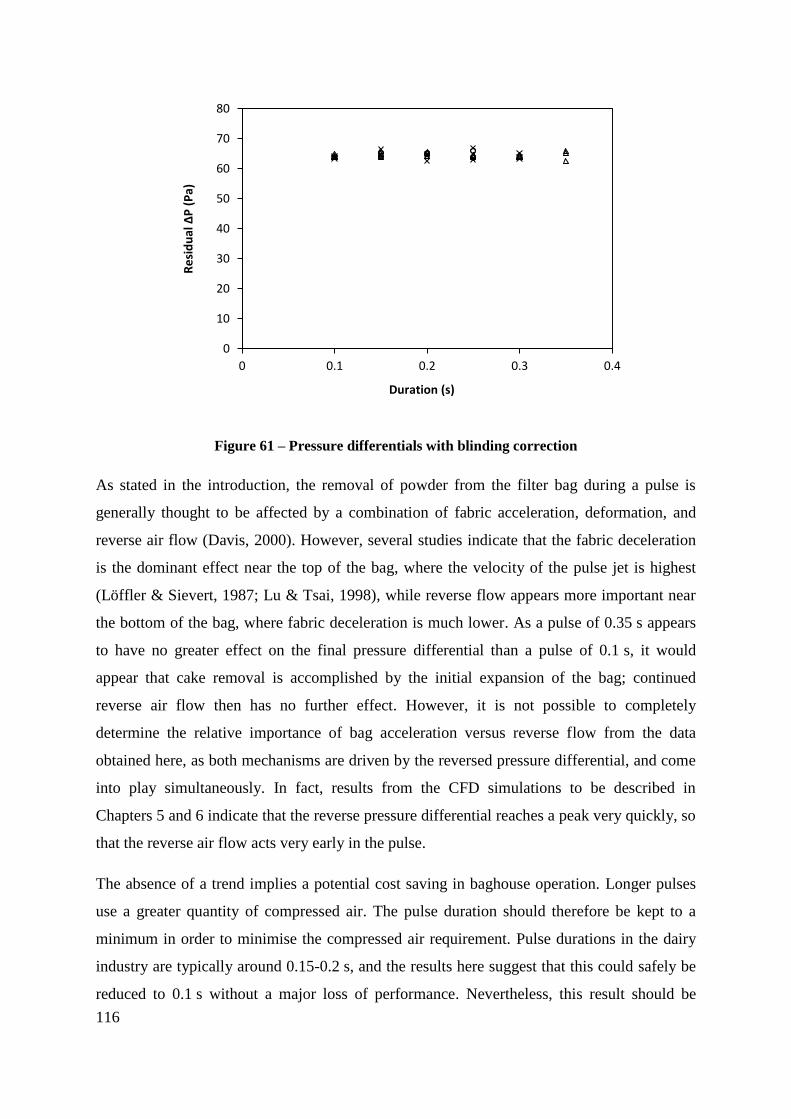
116
Figure 61 – Pressure differentials with blinding correction
As stated in the introduction, the removal of powder from the filter bag during a pulse is
generally thought to be affected by a combination of fabric acceleration, deformation, and
reverse air flow (Davis, 2000). However, several studies indicate that the fabric deceleration
is the dominant effect near the top of the bag, where the velocity of the pulse jet is highest
(Löffler & Sievert, 1987; Lu & Tsai, 1998), while reverse flow appears more important near
the bottom of the bag, where fabric deceleration is much lower. As a pulse of 0.35 s appears
to have no greater effect on the final pressure differential than a pulse of 0.1 s, it would
appear that cake removal is accomplished by the initial expansion of the bag; continued
reverse air flow then has no further effect. However, it is not possible to completely
determine the relative importance of bag acceleration versus reverse flow from the data
obtained here, as both mechanisms are driven by the reversed pressure differential, and come
into play simultaneously. In fact, results from the CFD simulations to be described in
Chapters 5 and 6 indicate that the reverse pressure differential reaches a peak very quickly, so
that the reverse air flow acts very early in the pulse.
The absence of a trend implies a potential cost saving in baghouse operation. Longer pulses
use a greater quantity of compressed air. The pulse duration should therefore be kept to a
minimum in order to minimise the compressed air requirement. Pulse durations in the dairy
industry are typically around 0.15-0.2 s, and the results here suggest that this could safely be
reduced to 0.1 s without a major loss of performance. Nevertheless, this result should be
0
10
20
30
40
50
60
70
80
0 0.1 0.2 0.3 0.4
Re
sid
ual
ΔP
(P
a)
Duration (s)
117
approached with caution, as there are several complications that may restrict the application
of this result to industrial baghouses, as outlined below.
In practice, the minimum duration attainable depends on the actuation speed of the valve
(Croom, 1995). If the control signal to the valve is too brief, the valve may not open fully,
and the pulse will be ineffective. Similarly, some valves are slow to close, so that the duration
of the actual pulse is longer than the duration of the control signal. Appropriate valve
selection is therefore essential to achieve effective pulsing with minimal air consumption.
Bag acceleration measurements (to be described in Section 5.7) indicated that the pulse valve
on the pilot scale baghouse opens quite rapidly, but is slightly slower to close, with the actual
pulse lasting approximately 0.1 s longer than the duration of the pulse control signal (note
again that the pulse durations quoted in the methods refer to the signal duration, not the
airflow duration). This valve is identical to those used in some industrial baghouses; however
some older baghouses may still use different valves.
While this study found no difference in effectiveness between pulses of different durations, it
is generally accepted that there is a minimum pulse duration below which performance will
be reduced. Bakke (1974) found that performance was reduced at durations below 0.1 s for a
baghouse with bags of 2.4 m in length and 114 mm in diameter. As the pilot scale baghouse
used in these studies had a larger bag, with a 3 m length and a 200 mm diameter, it was
expected that an effect would be observed at durations above 0.1 s, however this was clearly
not the case. It should be noted that the duration reported by Bakke (1974) also refers to the
duration of the electrical signal, and not the actual air flow through the nozzle. As the
opening and closing times may differ between valves, the comparison with the results
obtained here is only tentative. For the pilot scale baghouse used in this study, the minimum
pulse duration is clearly below 0.1 s. However, it still remains unclear how this result should
be best applied to industry, as the lack of the expected effect at durations above 0.1 s suggests
that the minimum duration cannot simply be scaled in proportion to bag size. In order to
achieve a significant level of bag deceleration and reverse flow, the volume of air introduced
by the pulse must be sufficient to inflate the bag. The filter bags used in typical industrial
baghouses are larger than the filter bag used here, so the volume of air required to inflate the
bag is also larger. In addition, energy dissipation as the pulse moves down the filter bag is of
greater concern in longer industrial filter bags. The minimum duration of the pulse will likely
be longer for an industrial baghouse than for the pilot scale baghouse used in this study;
118
however, as this study failed to find the minimum duration for the pilot scale baghouse, the
minimum duration for an industrial baghouse cannot be estimated, and some further research
is warranted.
Bakke (1974) also reported that at high pulse durations, over-cleaning of the filter bag
resulted in increased blinding. This could not be confirmed here; while an overall blinding
trend was observed, too few measurements were obtained for differences in the blinding rate
at different pulse durations to be adequately resolved.
The pulse duration is generally very easy to change in existing baghouses. The duration is
usually controlled by an electronic signal from the PLC, so changing it is simply a matter of
changing the set-point in the software. However, the results obtained here indicate that
changes in pulse duration will not have any effect on the pressure differentials. Some existing
baghouses may nevertheless be able to save on compressed air by reducing the pulse
duration.
4.3.4 Humidity
The residual pressure differentials were lowest at high humidity levels. In addition, the
residual pressure was dependent on temperature, with increasing temperature having both a
direct increasing effect on the pressure differentials and an interaction with humidity, so that
humidity changes had the greatest effect on pressure differentials at low temperatures. Pulse
number was found to have an approximately linear effect, so the best model fit was achieved
by treating this as a fixed effect rather than a random effect. Airflow, powder flow, and run
number were found to have no significant effect and were removed from the model. Note that
the lack of any detectable effect of airflow is simply due to the airflow being very similar for
all runs, as was intended. As this left no random effects in the model, residual pressure could
be modelled using multiple linear regression (lm function in R) instead of a mixed model.
The final fitted model is given below in Equation 4.1. Error terms represent 95% confidence
intervals for the coefficients based on the standard error. The p-values for all coefficients
(probability the effect is null) were all below 10-5
, so these effects were all highly significant.
574 17 278 5 6 62 2 1 2 23 22 33 4 13
(4.1)
119
where ΔPresid is the residual pressure differential in Pa, aw is the water activity (aw =
RH÷100%), T is the temperature in °C, and Npulse is the pulse number (each pulse
corresponding to 307 seconds of filtration time).
Water activity had a net negative effect on residual pressure, meaning that the best pulse
performance (lowest pressure differentials) was achieved at high humidity levels. This
complements the findings from Chapter 3 that high humidity causes lower filter cake
resistance and lower powder deposition rates. The combination of these effects means that
humidity has a net beneficial effect on baghouse pressure differentials, at least for SMP
filtration within the range of 2%-15% RH. As explained previously, the major effect of
increasing humidity is the softening of amorphous lactose, which increases particle cohesion.
The increased cohesion causes a reduction in filter cake resistance, as particles tend to collect
at the cake surface instead of penetrating into the cake and filling the void spaces. This also
improves the collection efficiency and reduces blinding, as fewer particles pass through the
filter cake. The improvement in pulsing effectiveness with increasing humidity is likely a
direct result of the more cohesive and porous nature of the filter cake. Davies (1973) reports
that the dendritic structures formed by cohesive particles are more easily dislodged from the
filter than individual particles due to the greater drag forces on aggregates and the variable
contact area between particles along the chain. The higher porosity means that fewer particles
are in direct contact with the filter fabric and thus the bond between the filter cake and the
filter bag is actually weaker.
Temperature also had a net negative effect on residual pressure, meaning that the best pulse
performance (lowest pressure differentials) was obtained at high temperatures. This is most
probably due to the influence of temperature on the lactose glass transition. Other authors
have found that milk powder stickiness depends on the temperature offset from the glass
transition, T-Tg. Raising the temperature while maintaining a constant relative humidity level
(note that this requires an increase in the absolute humidity) increases particle cohesion, with
a consequent improvement in pulse effectiveness as explained above.
The temperature effect may also have been partially due to an increase in fat-dependent
adhesion at higher temperatures, in keeping with the effect observed for MPC42 in Chapter 3.
While SMP only contains low levels of fat, this is concentrated at the particle surface (Kim et
al., 2002; Nijdam & Langrish, 2006) and may therefore have an influence on particle
interactions. However, the temperatures used in this investigation were all well above the
120
typical melting range of milk fat, so the fat should have been liquid for all conditions. Any
differences in fat-dependent cohesion would likely have been small, leaving lactose as the
obvious primary cause of the temperature dependence.
The positive interaction between temperature and relative humidity means that the effect of
humidity is greatest at low temperatures, while temperature has the greatest effect at low
humidity levels. Note that this interaction is separate to the causal relationship between
temperature and relative humidity, which is discussed below. Essentially, the less cohesive
the powder is, the more sensitive it is to changes that increase cohesion. This may be due to
the powder failing to equilibrate with the air at the higher humidity levels, so that the water
activity (and therefore T-Tg) in the powder was overestimated. Alternatively, this may well
be a real effect, and the powder cohesion tapers off as it approaches a maximum level. The
interaction term was similar in magnitude to the individual temperature and humidity terms,
indicating that the underlying effects are highly dependent on the actual conditions in the
baghouse. The model is only a local approximation within a limited temperature and
humidity range, and should not be used to extrapolate beyond this range. As with the
filtration experiments in section 3.5.3, these experiments were designed to focus on humidity,
not temperature, and so covered only a narrow range of temperatures. It was nevertheless
considered important to include temperature in the model, due to the close relationship
between temperature and relative humidity.
Relative humidity and temperature are also linked by a direct causal relationship, and are
difficult to change independently. In industry, the mass fraction of water to air is generally
determined in the spray drier, and remains constant throughout downstream processes. Some
cooling of the gas stream usually occurs between the drier and the baghouse; while this
lowers the temperature of the air stream, it also lowers the saturation vapour pressure, thus
increasing the relative humidity. Similarly, increasing the moisture content by increasing the
evaporation rate in the spray drier causes evaporative cooling. Consequently, the individual
effects of temperature and humidity cannot be applied independently to an industrial setting.
Examining the combined effect reveals that the humidity effect is dominant at typical RH
levels, so that increasing the temperature without adding water vapour will actually increase
the pressure differential due to the reduction in RH. This is again consistent with the results
obtained in Chapter 3, which found that increasing the temperature did indeed increase the
pressure differentials, albeit in the absence of pulsing. It was postulated in that chapter that
121
the positive effect was likely due to the changes in relative humidity associated with the
temperature change. The results obtained here support that conclusion, implying that the
increase in relative humidity associated with a decrease in temperature will produce a
decrease in the baghouse pressure differentials through a combination of increasing pulse
effectiveness, increasing filter cake porosity, and decreasing powder deposition rate. High
relative humidity is therefore beneficial to baghouse operation, whether this in achieved
through increasing the absolute moisture content of the air or reducing the temperature
(reducing the saturation humidity).
The pulse number was found to have an approximately linear effect on the residual pressure
differentials, indicating that the blinding effect was relatively constant. The residual pressures
would be expected to increase rapidly at the start of a run but level off over time as the
baghouse approaches steady state. The relatively good fit of the linear model implies that the
run duration was well short of the time required to reach steady state, so that the pressure
differentials continued to rise steadily for the entire run. Nevertheless, the linearity of this
effect helped to simplify the model and enable more accurate estimation of the other effects.
For comparison with the bench scale results in Chapter 3, the pressure differential before
each pulse was also modelled in R in the same way as the residual pressure. This gave an
indication of the overall cake resistance, although it was not possible to separate the effects of
cake porosity and deposition, as the mass of the filter cake prior to each pulse could not be
measured. The bench scale results indicated that the overall cake resistance should be lowest
at high humidity levels. The pressure differential prior to each pulse was found to be lower at
high humidity levels (negatively correlated with humidity), as expected. Unfortunately it was
not possible to accurately quantify the decrease in the cake resistance for a direct comparison
with previous results, but this result nevertheless confirms that the improvement in the
pressure differentials after a pulse persists over the entire filtration cycle.
It is important to note that the powder feed rate did not have a significant effect on the
residual pressure differentials. The residual pressure differential after a pulse is therefore
independent of the amount of powder on the bag prior to the pulse. This is important for
several reasons. Firstly, it indicates that the cleaning pulse is effective over the entire surface
of the bag. If any large areas of the filter cake remained intact following a pulse, then the
contribution of those areas to the overall pressure differential ought to depend on the filter
cake mass prior to the pulse. Secondly, the result accords with assertions from the literature
122
that cake filtration is the dominant mechanism for particle collection once a filter cake has
formed (Davis, 2000; Mycock et al., 1995). Powder remaining on the filter after a pulse is
generally a combination of depth-filtered powder (particles adhered directly to the filter
fibres) and powder that is re-deposited back onto the filter due to entrainment following the
pulse. Depth filtered powder is difficult to remove from the filter and is likely to remain on
the filter bag after the pulse. The consistent residual pressure implies that the degree of depth
filtration was similar for every filtration period, despite differences in the mass of the filter
cake. More interestingly, the degree of re-entrainment also appeared to be independent of the
cake mass, most likely because there is very little re-entrainment in general. The low re-
entrainment may be specific to the pilot scale baghouse used in the study. The elutriation
velocity in the pilot scale baghouse is much lower than in industrial baghouses, which is
likely to reduce the degree of re-entrainment. Furthermore, in an industrial baghouse,
particles removed during a pulse may be deposited on adjacent filter bags, rather than re-
depositing on the same filter bag. The extent of such re-deposition that typically occurs in
dairy baghouses is unknown; however as the pilot scale baghouse has only a single bag, this
cannot occur. It is also likely that the filter cake breaks away in large agglomerates, rather
than individual particles. Such agglomerates would be less prone to re-deposition, thus
limiting the amount of re-entrainment. This effect would also apply to industrial baghouses,
and is likely to be of particular significance to dairy baghouses due to the cohesive nature of
dairy powders.
It is surprising that airflow had no significant effect on the pressure differentials, as theory
indicates that this should have had an effect. This is most likely due to the limited variation in
airflow between runs. The fan setting was kept constant for all runs, so the total differences in
airflow were very small. It is therefore probable that the resulting differences in the pressure
differential were simply too small to be detected in the analysis.
Run number was found to have no significant effect on either the residual pressure or the
pressure reduction. All variation between runs is therefore adequately explained by the
variation in the measured parameters. This means that the results were repeatable and all
potential sources of variation between runs were anticipated and accounted for.
Humidity and temperature both have clear effects on the pulse effectiveness, with best
performance occurring at conditions close to the powder sticky point. In industry, SMP
baghouses are usually operated just below the powder sticky point to minimise fouling. These
123
results indicate that operating close to the sticky point offers low pressure differentials. There
is therefore no advantage to be gained by decreasing the baghouse humidity below current
levels. It should also be noted these parameters are highly dependent on the upstream spray
drying process, and any changes will have widespread effects on the entire production
process. These results may therefore be valuable in predicting the effect on the baghouse
performance when other aspects of the process dictate a change in temperature or humidity.
4.3.5 General Discussion
The increasing trend due to blinding was approximately linear during the pulse design
experiments. In industrial baghouses, this type of blinding effect typically only occurs for a
short period following the replacement of filter bags. After a short time, the filter bags
approach a maximum resistance and the blinding effect tails off. Ideally, pressure
differentials should be compared under stable operation, but unfortunately this was not
possible. The design of the pilot scale baghouse limits the run length to approximately an
hour. As the blinding effect was approximately linear over the course of this experiment, the
1 hour duration is clearly well short of the time required to reach stable operation.
It is clear that the best way to improve the effectiveness of pulse cleaning is to increase the
compressed air pressure. This is generally very easy to do, as compressed air systems are
usually overdesigned and can cope with a small increase in pressure without any mechanical
modifications. In contrast, the nozzle position and pulse duration seem to have no discernable
effect on the pressure differentials after a pulse, and should therefore be maintained at levels
that satisfy other criteria such as uniformity of the cleaning effect and minimising
compressed air use.
The residual pressure was found to be a better measure of pulse effectiveness than the
pressure reduction, for several reasons. As the pressure reduction depends on the pressure
differential before the pulse, it is influenced by the previous pulse. For the pulse design
experiments, the first pulse after each change would have to be excluded from the analysis, as
this pulse would be influenced by the previous condition. In contrast, the residual pressure
was found to be fairly independent of the initial pressure differential, and is therefore not
influenced to any great extent by the previous pulse. All pulses could therefore be included in
the analysis. The residual pressure was also independent of the powder flow rate, as
explained in Section 4.3.4. This removed a potential source of error in the pulse pressure,
124
height, and duration experiments, and eliminated a variable from the model in the humidity
experiments. Secondly, under pseudo-steady operation, the pressure reduction over a pulse is
necessarily equal to the increase in pressure between pulses. Poor pulse effectiveness results
in higher pressure differentials for the entire filtration cycle, but the reduction in ΔP over the
pulse is not necessarily increased. The exception occurs during unsteady operation (either due
to system instability, or simply before the system has had time to reach an approximately
pseudo-steady state), as was observed in the pulse pressure investigation at 2 bar pulse
pressure. In this situation, the pulse removes less powder than deposits on the filter between
pulses. Consequently, the residual pressure continues to increase over time, at a rate
proportional to the powder feed rate. The pressure reduction in this case is no longer equal to
the pressure increase between pulses, and offers a reasonable measure of the proportion of the
filter cake removed by the pulse. In summary, the residual pressure is a better measure of
pulse effectiveness during pseudo-steady operation, while the pressure reduction is a better
measure of pulse effectiveness during unsteady operation. As the pressure differentials were
pseudo-steady for most of the experiments described here, residual pressure was used as the
preferred measure of pulse effectiveness. In general, it is better to compare performance
under pseudo-steady operation, as this is the usual state of industrial baghouses.
The baghouse temperature and powder flow proved very difficult to control, resulting in
significant variations between baghouse runs. Both of these parameters were highly
dependent on the weather conditions on the day. While the baghouse is contained in a
laboratory, the lab is thoroughly ventilated with air taken from outside the building, so the
temperature and humidity within the lab vary considerably depending on the weather outside.
The temperature of the lab was found to affect both the temperature and humidity levels that
could be achieved during a run. While the baghouse itself was electrically heated, several
pieces of equipment including piping between the spray drier and baghouse were not, and
heat loss from these sections made it difficult to accurately specify the temperature. In
addition, the maximum humidity level that could be achieved was limited by the capacity of
the air heater on the spray drier. The maximum evaporation rate was limited by the
temperature of the inlet air, so that the highest humidity levels could only be attained on
warm days. In practice, a balance had to be struck between evaporation rate and temperature.
For the humidity investigation, it was important to cover as wide a range of relative humidity
levels as possible, so for the highest humidity conditions the baghouse temperature was
125
reduced slightly. For the pulse design experiments, multiple conditions were tested within a
single baghouse run, to keep conditions as constant as possible.
4.4 Conclusions
The effectiveness of pulse cleaning in SMP baghouses increases with increasing relative
humidity, at least up to 15% RH. In conjunction with the results of Chapter 3, this indicates
that baghouse pressure differentials decrease with increasing humidity due to a combination
of increasing pulse effectiveness, increasing filter cake porosity, and decreasing powder
deposition rate. High relative humidity is therefore beneficial to baghouse operation.
The most effective way to improve the effectiveness of pulse cleaning in an existing
baghouse is to increase the pressure of the compressed air supply to the pulse system.
Furthermore, the pulse pressure must be maintained above a minimum level to achieve stable
operation. This minimum pressure depends on the baghouse design, but for the baghouse
setup used in this study it was somewhere between 2.0 and 3.5 bar.
The distance between the pulse nozzle and the top of the bag had no influence on the
baghouse pressure differentials. Nevertheless, other aspects of baghouse performance such as
fouling or bag wear may be influenced by the nozzle position, so these should be considered
when designing a baghouse.
The duration of the cleaning pulse has very little influence on the effectiveness of the pulse.
The pulse should therefore be kept short to minimise compressed air consumption. It is
nevertheless likely that there is a minimum duration for optimum cleaning, which may vary
between baghouses depending on bag dimensions and valve selection. The minimum duration
that can be achieved in practice is expected to depend in particular on the opening and closing
speed of the valve. For the baghouse used in this study, the optimum duration was below
0.1 seconds.
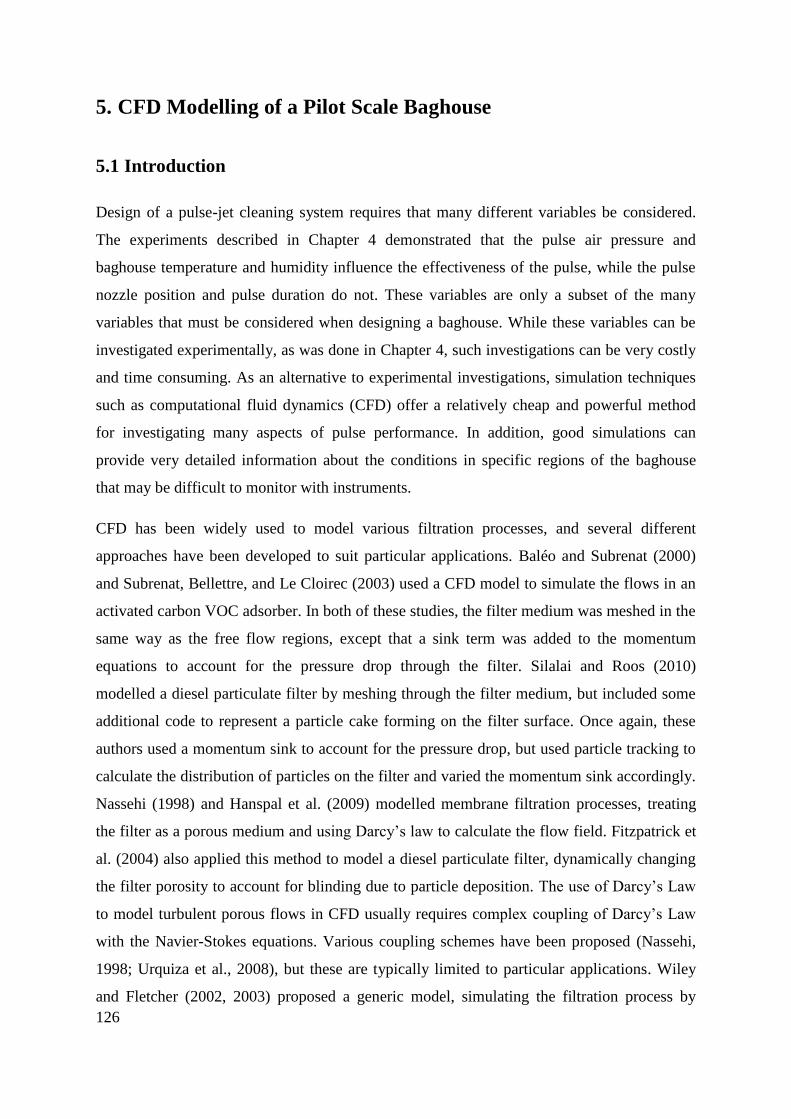
126
5. CFD Modelling of a Pilot Scale Baghouse
5.1 Introduction
Design of a pulse-jet cleaning system requires that many different variables be considered.
The experiments described in Chapter 4 demonstrated that the pulse air pressure and
baghouse temperature and humidity influence the effectiveness of the pulse, while the pulse
nozzle position and pulse duration do not. These variables are only a subset of the many
variables that must be considered when designing a baghouse. While these variables can be
investigated experimentally, as was done in Chapter 4, such investigations can be very costly
and time consuming. As an alternative to experimental investigations, simulation techniques
such as computational fluid dynamics (CFD) offer a relatively cheap and powerful method
for investigating many aspects of pulse performance. In addition, good simulations can
provide very detailed information about the conditions in specific regions of the baghouse
that may be difficult to monitor with instruments.
CFD has been widely used to model various filtration processes, and several different
approaches have been developed to suit particular applications. Baléo and Subrenat (2000)
and Subrenat, Bellettre, and Le Cloirec (2003) used a CFD model to simulate the flows in an
activated carbon VOC adsorber. In both of these studies, the filter medium was meshed in the
same way as the free flow regions, except that a sink term was added to the momentum
equations to account for the pressure drop through the filter. Silalai and Roos (2010)
modelled a diesel particulate filter by meshing through the filter medium, but included some
additional code to represent a particle cake forming on the filter surface. Once again, these
authors used a momentum sink to account for the pressure drop, but used particle tracking to
calculate the distribution of particles on the filter and varied the momentum sink accordingly.
Nassehi (1998) and Hanspal et al. (2009) modelled membrane filtration processes, treating
the filter as a porous medium and using Darcy’s law to calculate the flow field. Fitzpatrick et
al. (2004) also applied this method to model a diesel particulate filter, dynamically changing
the filter porosity to account for blinding due to particle deposition. The use of Darcy’s Law
to model turbulent porous flows in CFD usually requires complex coupling of Darcy’s Law
with the Navier-Stokes equations. Various coupling schemes have been proposed (Nassehi,
1998; Urquiza et al., 2008), but these are typically limited to particular applications. Wiley
and Fletcher (2002, 2003) proposed a generic model, simulating the filtration process by
127
selectively moving components across the filter by means of a sink term on the upstream side
and a corresponding source on the downstream side. This model assumes the flow in the filter
medium to be normal to the filter surface, and uses Darcy’s Law to calculate the flow through
the filter in a single calculation step, eliminating the need to mesh through the depth of the
filter. The model allows for selective transfer of different fluid components, and can therefore
account for different rejection coefficients of different species.
A few previous studies have successfully applied CFD techniques to baghouse filters. Lo, Hu,
et al. (2010) used a CFD model to simulate a pulse in a pleated cartridge dust collector. Their
approach was very similar to the method proposed in this chapter, and is a good
demonstration of the value of CFD for baghouse modelling. These authors used the FLUENT
porous jump model, in which the flows through the filter were calculated using Darcy’s Law,
and the internal volume of the filter was not meshed. These authors found that their model
gave reasonably accurate predictions of the overpressure developing within the filter
cartridge, and that the average static pressure on the fabric surface was a better predictor of
cleaning effectiveness than the bag overpressure. Lu and Tsai (1996) developed a 2-D
numerical model using a finite difference method to predict the pressure developed inside a
filter bag during a pulse. The boundary conditions used to represent the pulse flow calculated
the airflow at each timestep, accounting for the loss of pressure in the pulse air reservoir and
blow tube. They achieved good agreement with experimental measurements, and successfully
applied the model to predict the effect of changes in nozzle diameter and position on the
pressure impulse experienced by the bag.
In order to predict the effectiveness of pulse cleaning, it is essential to understand the
mechanisms of cake removal. Lu and Tsai (1998) measured the peak bag overpressure and
fabric acceleration during a pulse, and demonstrated a correlation between these and the pulse
cleaning effect, measured by the residual pressure differential after the pulse. They also
showed that the fabric acceleration decreased rapidly with distance from the top of the bag,
while the peak overpressure appeared to plateau, being very similar at the bottom and middle
of the bag. Löffler and Sievert (1987) also measured the bag overpressure and fabric
deceleration, with similar results. The peak overpressure was high at the top of the bag,
decreased toward the middle, but increased again toward the bottom of the bag as the air flow
approached the closed end. The peak bag deceleration, in contrast, decreased steadily along
the full length of the bag.
128
In this study, the pilot scale pulse-jet baghouse at the University of Canterbury was modelled
using a CFD approach to simulate the forces and flow conditions that occur in the baghouse
during pulse cleaning. The commercially available CFD software package ANSYS CFX™,
was used to create and solve the fluid flows in the free areas of the baghouse, while some
additional user routines, coded in FORTRAN, were used to simulate the flows through the
filter fabric in the same manner as Wiley and Fletcher (2002, 2003), by adding source and
sink terms on either side of the filter surface. In order to relate this to the actual cleaning
effect of the pulse, pressure profiles from the CFD simulations were used to predict the
acceleration of the filter medium, and these predictions were compared with experimental
measurements.
5.2 Geometry and Mesh Creation
The CFD model developed in this chapter was based on the pilot scale baghouse described in
Section 3.2.2. The geometry was simplified to reduce the model to a 2-D simulation, to
minimise computational requirements and allow fine mesh resolution. The simplifications
that were made to the geometry are explained and justified below, and a diagram of the final
geometry is shown in Figure 63.
The inlet geometry of the baghouse was simplified to a vertical tube carrying the powder into
the bottom of the baghouse. The spray drier and pipework upstream of the baghouse were
omitted from the model, as this upstream equipment merely provides the air feed stream and
is not relevant to the filtration or pulse cleaning processes. The separate streams for the
humid air flow and the compressed air jet were treated as a single inlet, omitting the mixing
apparatus (shown in Figure 13). The baffle that surrounds the inlet to catch collected powder
was modelled as a surface with zero thickness to avoid the need to resolve the thickness in
the mesh (Figure 63).
The baghouse clean air plenum and outlet geometry were also greatly simplified in the
model. The outlet fan and piping were omitted, as once again these were considered
unimportant to the airflows within the baghouse. The clean air plenum was modelled as a
simple cylinder, with the outlet flow exiting vertically from the top of the baghouse (Figure
63), instead of at the side as occurs in the actual baghouse (see Figure 11). The attached air
reservoir was omitted from the model, however the plenum height was extended to 3 metres
129
(Figure 63) to provide additional volume for entrainment in the pulse jet, and to provide
greater separation between the outlet and the pulse inlet, so that the flow at the outlet would
be fully developed and not influenced by high velocities at the pulse inlet. The pulse nozzle
was modelled as a simple open tube, omitting the complex flow diverter that is used in the
actual baghouse.
The baghouse chamber was modelled as a smooth cylinder, with the viewing ports and joins
between sections (see Figure 11) omitted for simplicity. As these features are relatively small
and positioned in areas with low pressure and velocity gradients (far from the pulse jet and
main inlet), they were considered unlikely to have any major effect on the pressure gradients
within the baghouse.
The bag was modelled as a 2-D (zero-thickness) surface to simplify the meshing process. As
the filter fabric was only around 2 mm thick, a very fine mesh would be required to
accurately resolve through the thickness of the fabric. Treating the filter as a 2-D interface
removed the need to mesh through the filter medium and allowed for a fairly uniform coarser
mesh sizing in the vicinity of the filter surface. The bag was assumed to be a perfect cylinder
and the movement of the filter fabric during a pulse was neglected, as this is relatively
difficult to implement. Note that the mass and energy flux across the filter was accomplished
with custom user routines creating sources and sinks on either side of the filter surface. The
user routines (written in Fortran) were provided by Professor David Fletcher, at the
University of Sydney. These routines will be explained in more detail in Section 5.3.
With the above simplifications applied, the baghouse model was rotationally symmetrical
about the vertical axis. It was therefore possible to model the baghouse as a thin 1° wedge
(Figure 62) with symmetry boundary conditions on both sides, instead of modelling the entire
baghouse volume. This simplified the problem to a 2-D simulation, greatly reducing the
required number of mesh cells and saving on computational requirements.
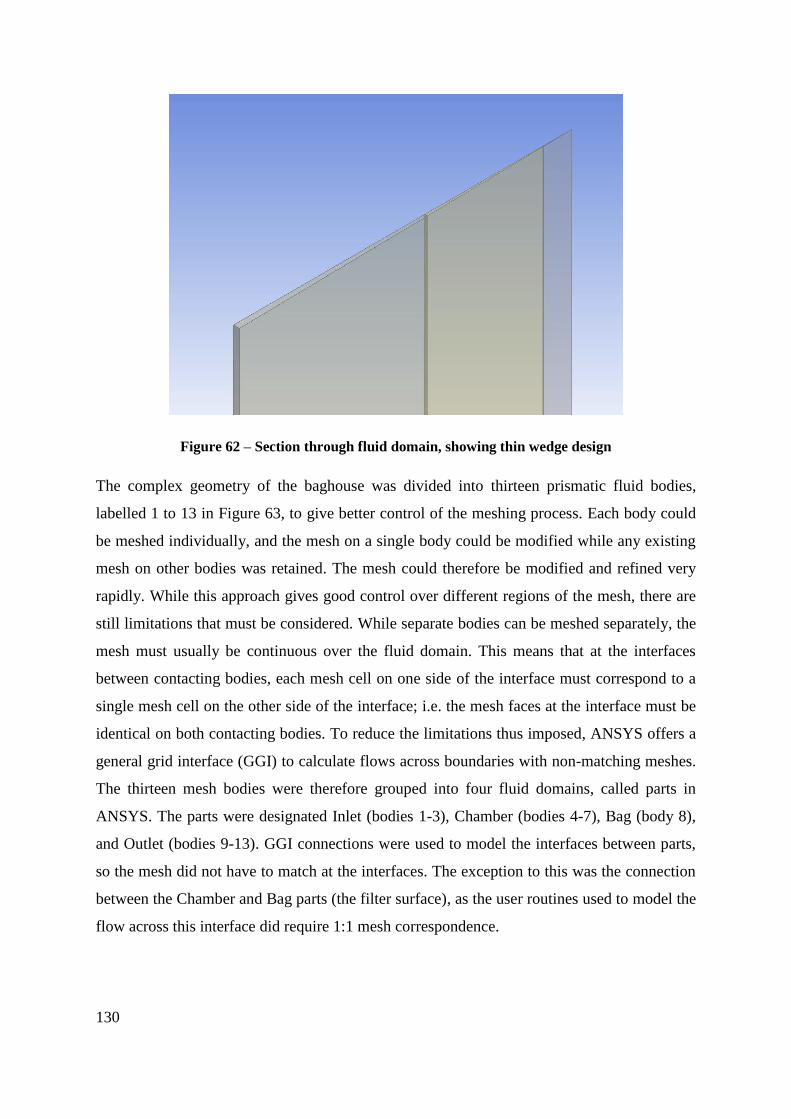
130
Figure 62 – Section through fluid domain, showing thin wedge design
The complex geometry of the baghouse was divided into thirteen prismatic fluid bodies,
labelled 1 to 13 in Figure 63, to give better control of the meshing process. Each body could
be meshed individually, and the mesh on a single body could be modified while any existing
mesh on other bodies was retained. The mesh could therefore be modified and refined very
rapidly. While this approach gives good control over different regions of the mesh, there are
still limitations that must be considered. While separate bodies can be meshed separately, the
mesh must usually be continuous over the fluid domain. This means that at the interfaces
between contacting bodies, each mesh cell on one side of the interface must correspond to a
single mesh cell on the other side of the interface; i.e. the mesh faces at the interface must be
identical on both contacting bodies. To reduce the limitations thus imposed, ANSYS offers a
general grid interface (GGI) to calculate flows across boundaries with non-matching meshes.
The thirteen mesh bodies were therefore grouped into four fluid domains, called parts in
ANSYS. The parts were designated Inlet (bodies 1-3), Chamber (bodies 4-7), Bag (body 8),
and Outlet (bodies 9-13). GGI connections were used to model the interfaces between parts,
so the mesh did not have to match at the interfaces. The exception to this was the connection
between the Chamber and Bag parts (the filter surface), as the user routines used to model the
flow across this interface did require 1:1 mesh correspondence.
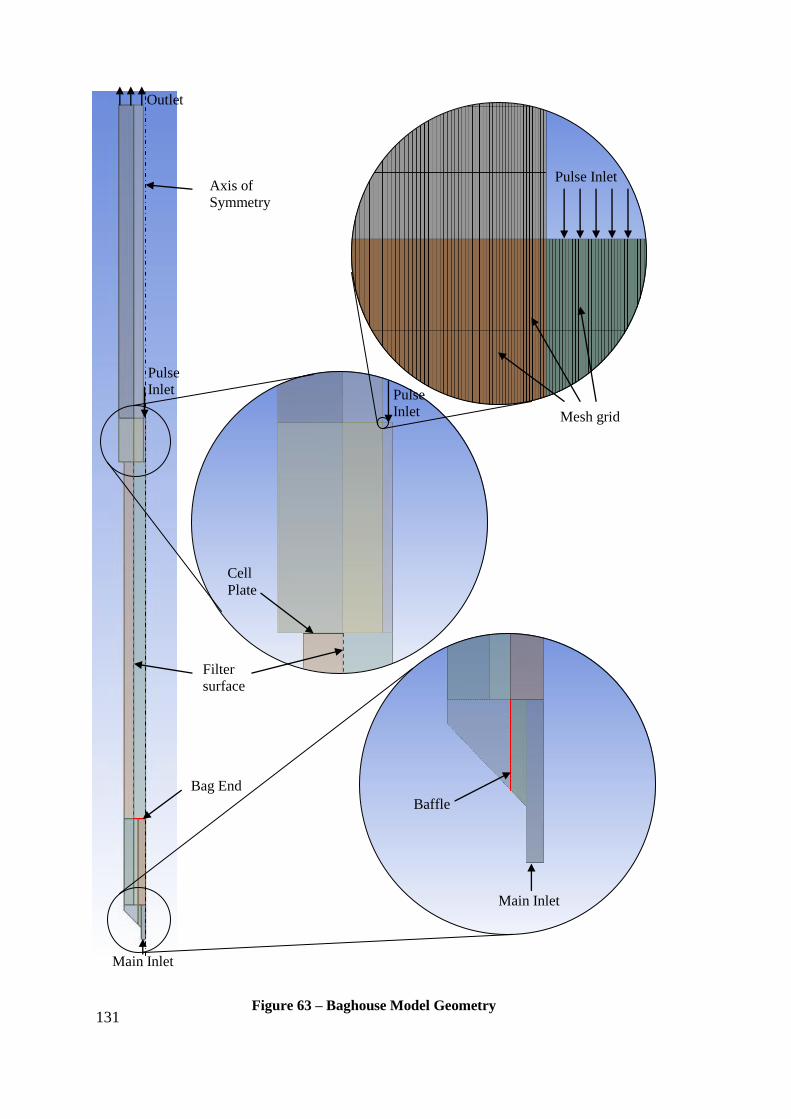
131
Figure 63 – Baghouse Model Geometry
1 2
3
4 5 6 7 8
9 10 11
12 13
Main Inlet
Pulse
Inlet
Pulse Inlet
Outlet
Baffle
Filter
surface
Pulse
Inlet
Main Inlet
Cell
Plate
Bag End
Axis of
Symmetry
Mesh grid
132
With the mesh divided into simple prismatic bodies, the mesh could be generated using a
sweep method. This was much quicker than the standard patch conforming tetrahedral
method available in ANSYS. The result was a very uniform hexahedral mesh, a single layer
of cells deep. Initial mesh sizings were chosen to be longer in the vertical direction than in the
horizontal direction throughout most of the domain (Figure 63), as the velocity gradients
were expected to be greater in the horizontal direction (actual velocities being greater in the
vertical direction). A mesh dependence study was carried out and the mesh was refined to
obtain solutions that were independent of the mesh. This is explained in detail in Section 5.5.
5.3 Porous Filter Model
Mass and energy transfer across the filter surface was modelled using a custom porous filter
model in the form of a set of Fortran user routines that could be linked into ANSYS CFX.
The filter model was developed by Professor David Fletcher, at the University of Sydney, for
the purpose of modelling membrane filtration processes. The filter model has been described
in previous publications (Wiley & Fletcher, 2003), and a description of the relevant features
is given below.
The filter was modelled as a curved surface with zero thickness. The surface was set up in
ANSYS CFX as a wall boundary with zero slip, as the filter model accomplished the mass
and energy transfer across the filter using sources and sinks on either side of the filter.
ANSYS CFX was therefore only required to solve the flows in the open regions of the
baghouse, and not within the porous medium of the filter fabric. This is a common approach
for filtration processes, as the complex flow patterns within the filter medium do not usually
need to be known; only the resultant effects on the bulk flow (such as pressure drop across
the filter and velocity boundary layers at the filter surface) are relevant to filter performance.
Treating the filter in this way also removes the need to mesh through the filter fabric, and
reduces the computational requirements of the simulation.
As explained in the mesh description, the mesh faces on either side of the filter surface were
identical, so that cells on either side of the filter were paired. The model iterated through each
pair of mesh cells and calculated the mass flux between the cells using a modified form of
Darcy’s Law. Recalling from Section 2.5.1, the basic form of Darcy’s Law is:
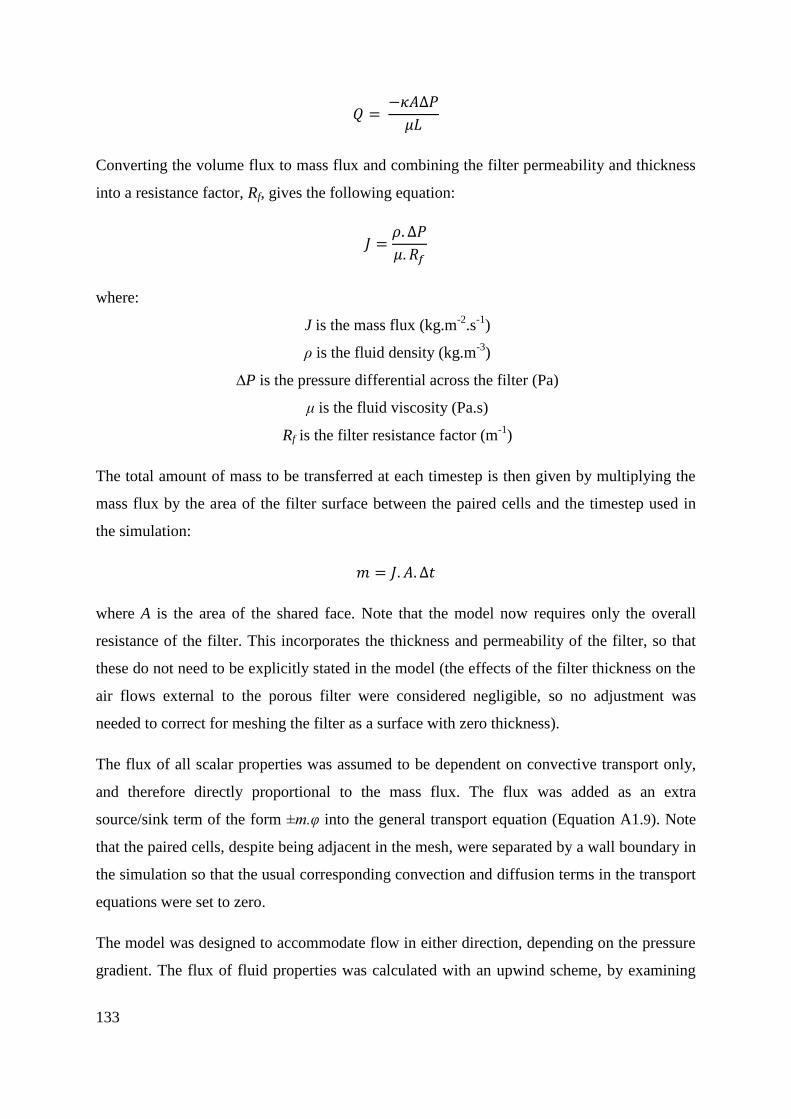
133
Converting the volume flux to mass flux and combining the filter permeability and thickness
into a resistance factor, Rf, gives the following equation:
where:
J is the mass flux (kg.m-2
.s-1
)
ρ is the fluid density (kg.m-3
)
∆P is the pressure differential across the filter (Pa)
μ is the fluid viscosity (Pa.s)
Rf is the filter resistance factor (m-1
)
The total amount of mass to be transferred at each timestep is then given by multiplying the
mass flux by the area of the filter surface between the paired cells and the timestep used in
the simulation:
where A is the area of the shared face. Note that the model now requires only the overall
resistance of the filter. This incorporates the thickness and permeability of the filter, so that
these do not need to be explicitly stated in the model (the effects of the filter thickness on the
air flows external to the porous filter were considered negligible, so no adjustment was
needed to correct for meshing the filter as a surface with zero thickness).
The flux of all scalar properties was assumed to be dependent on convective transport only,
and therefore directly proportional to the mass flux. The flux was added as an extra
source/sink term of the form ±m.φ into the general transport equation (Equation A1.9). Note
that the paired cells, despite being adjacent in the mesh, were separated by a wall boundary in
the simulation so that the usual corresponding convection and diffusion terms in the transport
equations were set to zero.
The model was designed to accommodate flow in either direction, depending on the pressure
gradient. The flux of fluid properties was calculated with an upwind scheme, by examining
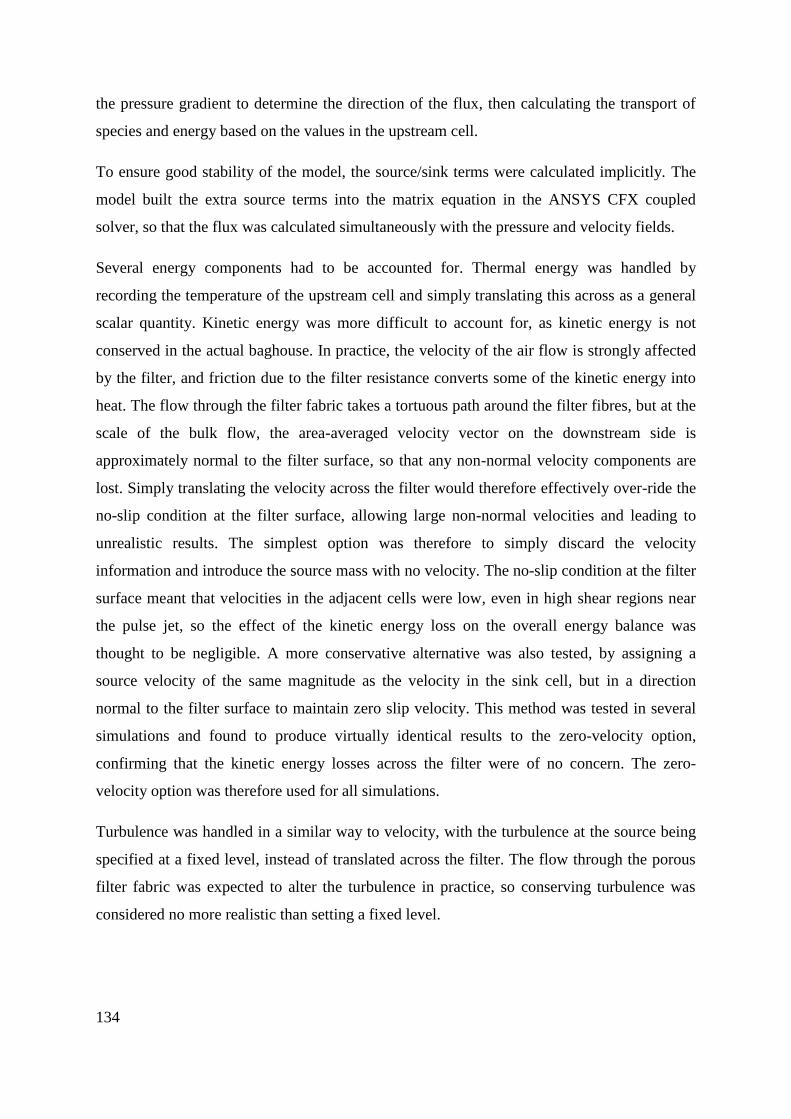
134
the pressure gradient to determine the direction of the flux, then calculating the transport of
species and energy based on the values in the upstream cell.
To ensure good stability of the model, the source/sink terms were calculated implicitly. The
model built the extra source terms into the matrix equation in the ANSYS CFX coupled
solver, so that the flux was calculated simultaneously with the pressure and velocity fields.
Several energy components had to be accounted for. Thermal energy was handled by
recording the temperature of the upstream cell and simply translating this across as a general
scalar quantity. Kinetic energy was more difficult to account for, as kinetic energy is not
conserved in the actual baghouse. In practice, the velocity of the air flow is strongly affected
by the filter, and friction due to the filter resistance converts some of the kinetic energy into
heat. The flow through the filter fabric takes a tortuous path around the filter fibres, but at the
scale of the bulk flow, the area-averaged velocity vector on the downstream side is
approximately normal to the filter surface, so that any non-normal velocity components are
lost. Simply translating the velocity across the filter would therefore effectively over-ride the
no-slip condition at the filter surface, allowing large non-normal velocities and leading to
unrealistic results. The simplest option was therefore to simply discard the velocity
information and introduce the source mass with no velocity. The no-slip condition at the filter
surface meant that velocities in the adjacent cells were low, even in high shear regions near
the pulse jet, so the effect of the kinetic energy loss on the overall energy balance was
thought to be negligible. A more conservative alternative was also tested, by assigning a
source velocity of the same magnitude as the velocity in the sink cell, but in a direction
normal to the filter surface to maintain zero slip velocity. This method was tested in several
simulations and found to produce virtually identical results to the zero-velocity option,
confirming that the kinetic energy losses across the filter were of no concern. The zero-
velocity option was therefore used for all simulations.
Turbulence was handled in a similar way to velocity, with the turbulence at the source being
specified at a fixed level, instead of translated across the filter. The flow through the porous
filter fabric was expected to alter the turbulence in practice, so conserving turbulence was
considered no more realistic than setting a fixed level.
135
5.4 Boundary Conditions
The outlet flow was assumed to be independent of the pressure in the baghouse and was
modelled using a fixed velocity boundary condition. This assumption is not exactly true of
the actual system, but was considered a reasonable approximation. The outlet flow in the pilot
scale baghouse is controlled by a centrifugal fan. The flow through such fans generally does
show some dependence on the upstream pressure. However, airflow measurements obtained
during the experiments described in the previous two chapters indicated that the fan curve
was rather flat, so that the flow did not vary greatly with changes in the baghouse pressure.
The pressure in the clean air plenum also varied relatively little compared with other regions
of the baghouse, and remained below ambient throughout the pulse. The low pressure was
due to Bernoulli’s effect, which caused entrainment of air from the plenum into the high-
velocity pulse jet, rather than an outflow of air from the jet into the plenum. The outlet flow
was therefore thought to remain reasonably constant throughout the pulse. The area of the
outlet surface in the model was substantially larger than the area of the 50 mm outlet pipe in
the actual baghouse. The velocity at the outlet was set to 0.3 m.s-1
, giving a filtration velocity
at the filter surface of 0.022 m.s-1
, similar to that in the actual baghouse.
The pulse inlet flow was also assumed to be independent of the baghouse pressure and was
modelled using a specified velocity boundary condition. Due to the high pressure of the pulse
air supply (6 bar), the pulse flow in practice is choked at the pulsing valve. As choked flow is
not affected by small changes in downstream pressure, the assumption of constant velocity is
very reasonable. For transient pulsing simulations, the pulse flow was varied over time using
linear interpolation of a set of specified values. Typically this involved a linear ramp up to a
maximum of 340 m.s-1
(approximately the speed of sound), a period of constant flow, and a
linear ramp back down to zero, as shown in Figure 64. The temperature of the pulse inlet
flow was set to 25°C, as the compressed air in the actual baghouse is supplied at ambient
temperature. Note that for some later simulations, the pulse inlet boundary was also modelled
using a total pressure boundary, as this proved to give better predictions of some aspects of
pulse performance. The pressure profile used for the boundary condition was similar to the
velocity profile, ramping up the total pressure from zero to 5 bar (the pulse pressure used in
validation experiments) over the same 0.02 s time interval. This is discussed in more detail in
Section 5.7.
136
Figure 64 – Pulse velocity profile
The main baghouse inlet was modelled using an opening boundary condition with a specified
pressure. This allowed flow in both directions, with a velocity dependent on the baghouse
pressure. The temperature for incoming flow was set to 78°C, a typical value for the real
baghouse. In the real baghouse, the fan at the outlet lowers the pressure in the baghouse and
spray drier, so that air is drawn in through the spray drier inlet. During a pulse, the injected
pulse air briefly raises the baghouse pressure, causing the inlet flow to reduce or even
reverse. The reversal of flow allowed the extra air introduced by the pulse to exit the
baghouse, and was therefore essential to include in the model. In the real baghouse, the flow
at the inlet is further complicated by the compressed air jet which introduces powder to the
baghouse. During forward flow, the cold dry compressed air jet enters at the bottom of the
baghouse and mixes with the hot humid air stream. As the compressed air inlet is essentially
within the baghouse chamber, rather than upstream, there is a possibility of incomplete
mixing of the two air streams, creating temperature and humidity gradients within the
baghouse chamber. This possibility was ignored in the model, and the single inlet was
assumed to have uniform temperature and composition. In addition, as the compressed air
comes from a high pressure source, it does not depend on the baghouse pressure. The
compressed air jet therefore continues to flow into the baghouse even when the baghouse is
pressurised during a pulse and the humid inlet stream is reversed. The jet therefore creates
significant recirculation and high velocity gradients around the inlet during a pulse, which
was also not accounted for in the model. This effect is localised, however, and is reasonably
0
50
100
150
200
250
300
350
400
0 0.05 0.1 0.15 0.2 0.25
Pu
lse
In
let
Ve
loci
ty (
m.s
-1)
Time (s)
137
distant from the filter surface, so was expected to have minimal influence on the effectiveness
of the pulse.
As the simulation was restricted to a thin slice of the baghouse, both sliced faces were
modelled with symmetry boundary conditions. Symmetry requires that the mass and energy
fluxes across the boundary are zero, and that flow properties such as velocity and pressure
have zero gradient at the boundary.
All internal baghouse surfaces were modelled as non-slip walls, including the filter surface.
While the filter model allowed mass transfer across the filter, the velocity at the filter surface
was fixed at zero. As stated previously, in the actual baghouse, the non-normal velocity
components at the filter surface (averaged over a sufficient area) are zero, and the normal
velocity component (flux through the filter) was accounted for in the simulations by the
porous filter model.
The connections between the Inlet and Chamber regions and between the Bag and Outlet
regions were modelled using GGI connections, to account for the discontinuities in the mesh
(as mentioned in Section 5.2). Note that the contact point between the Chamber and Outlet
regions was a wall (this is the cell plate – see Figure 63), and therefore did not require a GGI
connection.
5.5 Mesh Dependence Study
A mesh dependence study was carried out to ensure that the solutions obtained from the
model were independent of the mesh used. This was done by setting up multiple simulations
with identical boundary conditions and model parameters, but different meshes. Mesh sizing
parameters were systematically reduced at key locations in the mesh until differences
between solutions with different meshes were small enough to be considered negligible.
Mesh dependence checks were carried out for both steady state isothermal simulations, with
the pulse inlet flow set to zero, and transient simulations with pulsing included and energy
transport modelled using the total energy equation (A1.3) (as the high velocities of the pulse
jet introduced significant kinetic energy components). Turbulence was modelled using the
SST model (see “Turbulence” in Appendix 2, Equations A1.16, A1.17, A1.20 and A1.22) with
first order numerics. Upwind differencing (Equation A1.26) and a first order transient scheme
138
were used to ensure good stability. A second order transient scheme was trialled, but found to
produce very similar results to the first order scheme in most cases, and stability problems in
certain cases. As the final solution was mesh-independent, gradients were estimated
sufficiently accurately with the first order method.
The main inlet and outlet boundary conditions were as described in the previous section, with
a velocity of 0.3 m.s-1
at the baghouse outlet and a constant pressure (1 atm) at the inlet
opening. For transient simulations, the pulse inlet flow followed the profile shown in Figure
64, with a total pulse duration of 0.18 s, encompassing a linear ramping up of flow over
0.02 s to a peak velocity of 340 m.s-1
, followed by a period of constant pulse flow lasting
0.14 s, and finally a linear ramp back down to zero flow over 0.02 s. The transient
simulations were extended to cover a total duration of 0.25 s, to allow the aftermath of the
pulse to be observed.
Steady state simulations used a physical timescale of 0.001 seconds, and were run until the
RMS residuals (see Equation A1.35) converged to less than 1.0×10⁻⁵
. A boundary
conservation target of 1% was also applied, although in all cases this was achieved well
before the residual targets were met. The steady state runs were initialised with a zero
velocity field and a temperature of 78°C (noting that the simulations were isothermal, so heat
transfer was not modelled). The transient simulations used a timestep of 0.0002 seconds, and
once again the residual targets were set to 1.0×10⁻⁵
. The transient simulations were initialised
using the results from the steady state simulations. The air and water vapour were treated as
ideal gases to allow for compressibility effects.
The final mesh selected for the simulations had 164900 elements and 1163024 nodes. Several
further refined meshes were tested to ensure that the selected mesh was adequate. Refined
meshes were produced by halving the mesh sizing on specific bodies within the model, as
outlined in Table 12. This was faster than refining the entire mesh in a single simulation, as
the various refined simulations could be run simultaneously on different processor cores. The
computer used to run the simulations was a 64-bit desktop system with an Intel Core i7-3770
3.4 GHz processor and 8 GB of RAM, running Microsoft® Windows 7 Enterprise (SP1). As
the filter model add-in did not support parallel processing, a single simulation with a highly
refined mesh would have used only a single processor core and would therefore have required
a long time to solve. As it was, each simulation took around 30-40 hours to solve. Ultimately,
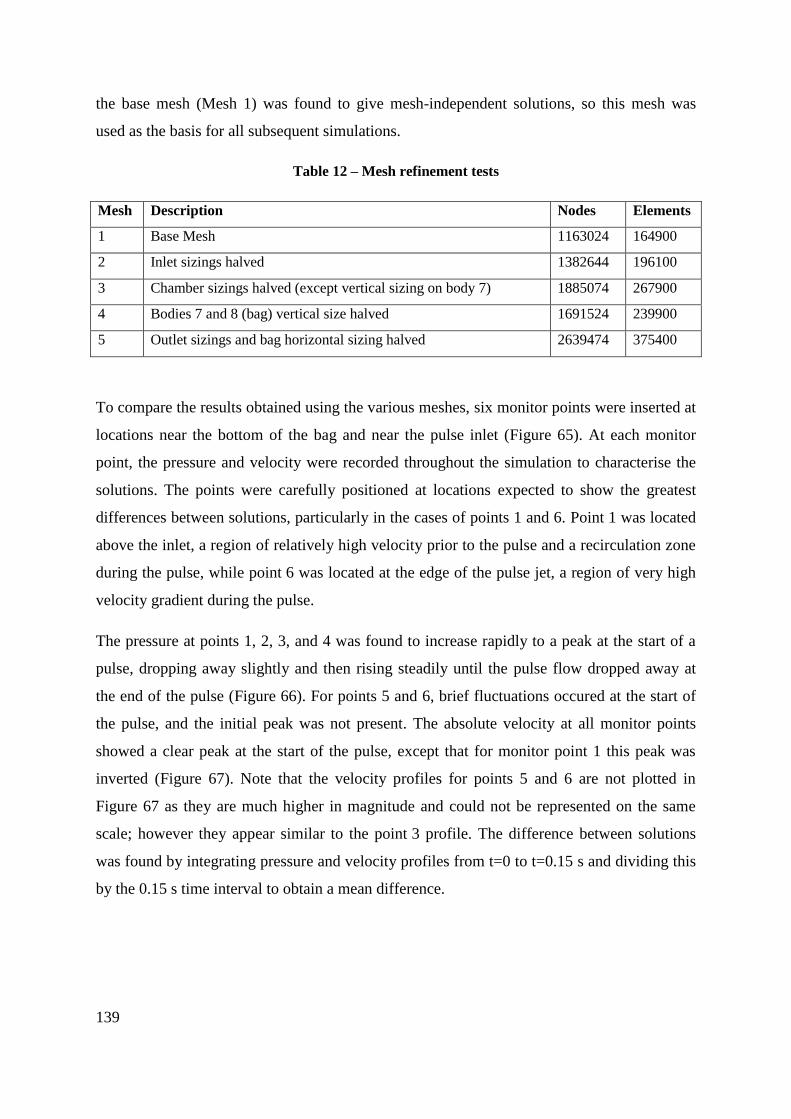
139
the base mesh (Mesh 1) was found to give mesh-independent solutions, so this mesh was
used as the basis for all subsequent simulations.
Table 12 – Mesh refinement tests
Mesh Description Nodes Elements
1 Base Mesh 1163024 164900
2 Inlet sizings halved 1382644 196100
3 Chamber sizings halved (except vertical sizing on body 7) 1885074 267900
4 Bodies 7 and 8 (bag) vertical size halved 1691524 239900
5 Outlet sizings and bag horizontal sizing halved 2639474 375400
To compare the results obtained using the various meshes, six monitor points were inserted at
locations near the bottom of the bag and near the pulse inlet (Figure 65). At each monitor
point, the pressure and velocity were recorded throughout the simulation to characterise the
solutions. The points were carefully positioned at locations expected to show the greatest
differences between solutions, particularly in the cases of points 1 and 6. Point 1 was located
above the inlet, a region of relatively high velocity prior to the pulse and a recirculation zone
during the pulse, while point 6 was located at the edge of the pulse jet, a region of very high
velocity gradient during the pulse.
The pressure at points 1, 2, 3, and 4 was found to increase rapidly to a peak at the start of a
pulse, dropping away slightly and then rising steadily until the pulse flow dropped away at
the end of the pulse (Figure 66). For points 5 and 6, brief fluctuations occured at the start of
the pulse, and the initial peak was not present. The absolute velocity at all monitor points
showed a clear peak at the start of the pulse, except that for monitor point 1 this peak was
inverted (Figure 67). Note that the velocity profiles for points 5 and 6 are not plotted in
Figure 67 as they are much higher in magnitude and could not be represented on the same
scale; however they appear similar to the point 3 profile. The difference between solutions
was found by integrating pressure and velocity profiles from t=0 to t=0.15 s and dividing this
by the 0.15 s time interval to obtain a mean difference.
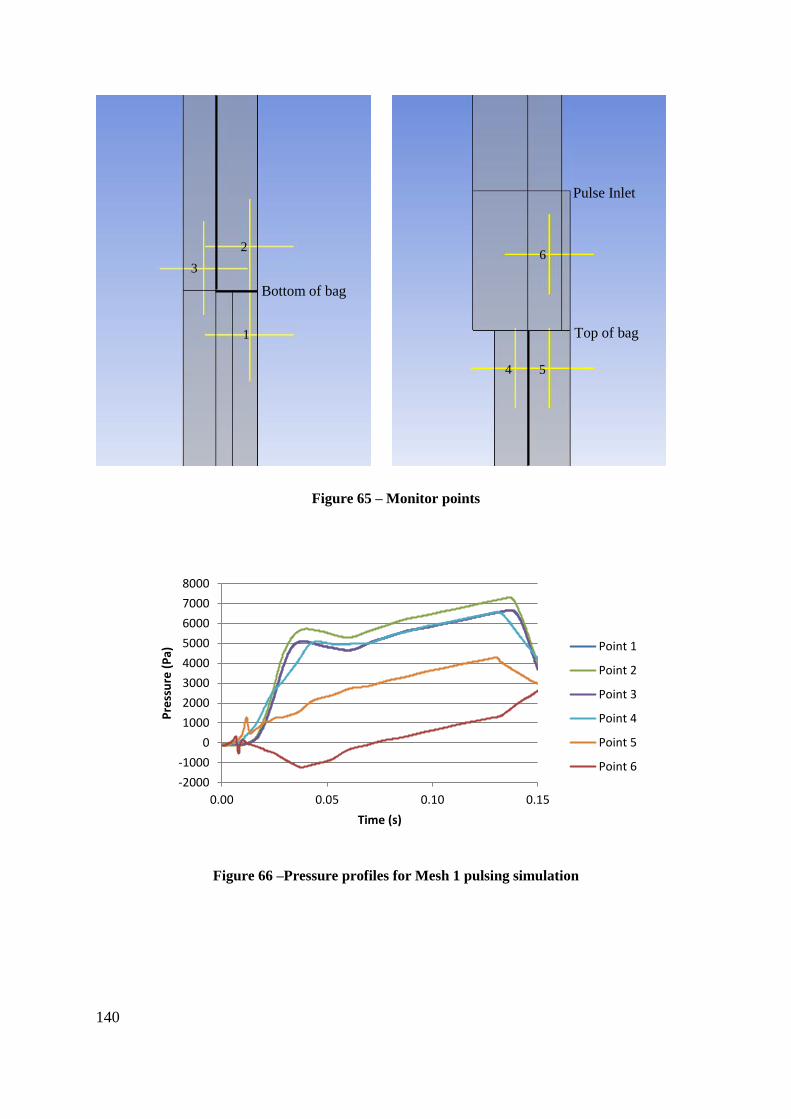
140
Figure 65 – Monitor points
Figure 66 –Pressure profiles for Mesh 1 pulsing simulation
-2000
-1000
0
1000
2000
3000
4000
5000
6000
7000
8000
0.00 0.05 0.10 0.15
Pre
ssu
re (
Pa)
Time (s)
Point 1
Point 2
Point 3
Point 4
Point 5
Point 6
1
3
2
Bottom of bag
4 5
6
Top of bag
Pulse Inlet
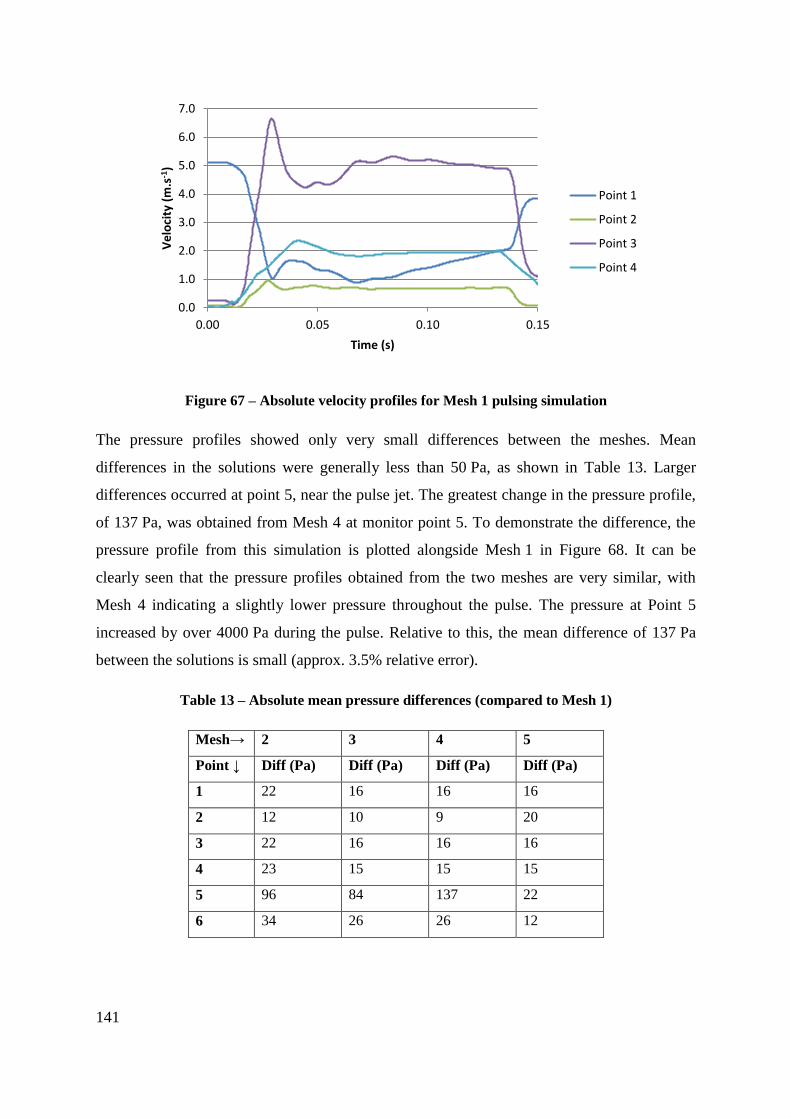
141
Figure 67 – Absolute velocity profiles for Mesh 1 pulsing simulation
The pressure profiles showed only very small differences between the meshes. Mean
differences in the solutions were generally less than 50 Pa, as shown in Table 13. Larger
differences occurred at point 5, near the pulse jet. The greatest change in the pressure profile,
of 137 Pa, was obtained from Mesh 4 at monitor point 5. To demonstrate the difference, the
pressure profile from this simulation is plotted alongside Mesh 1 in Figure 68. It can be
clearly seen that the pressure profiles obtained from the two meshes are very similar, with
Mesh 4 indicating a slightly lower pressure throughout the pulse. The pressure at Point 5
increased by over 4000 Pa during the pulse. Relative to this, the mean difference of 137 Pa
between the solutions is small (approx. 3.5% relative error).
Table 13 – Absolute mean pressure differences (compared to Mesh 1)
Mesh→ 2 3 4 5
Point ↓ Diff (Pa) Diff (Pa) Diff (Pa) Diff (Pa)
1 22 16 16 16
2 12 10 9 20
3 22 16 16 16
4 23 15 15 15
5 96 84 137 22
6 34 26 26 12
0.0
1.0
2.0
3.0
4.0
5.0
6.0
7.0
0.00 0.05 0.10 0.15
Ve
loci
ty (
m.s
-1)
Time (s)
Point 1
Point 2
Point 3
Point 4
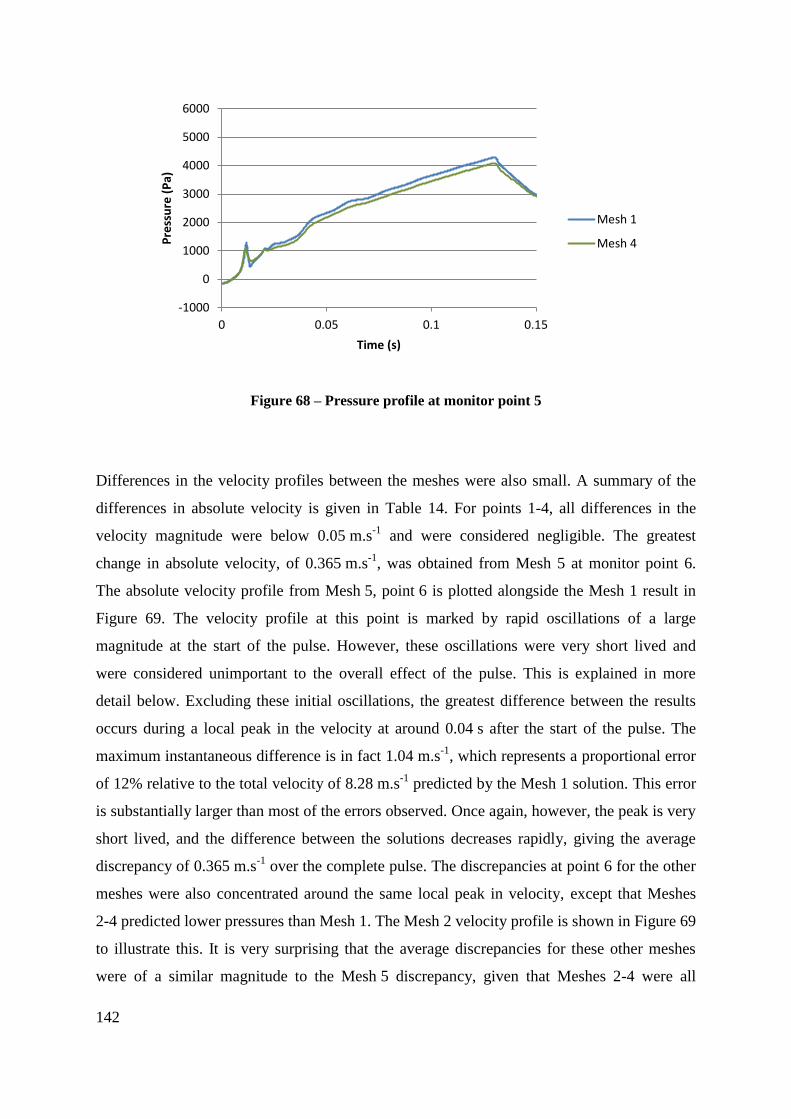
142
Figure 68 – Pressure profile at monitor point 5
Differences in the velocity profiles between the meshes were also small. A summary of the
differences in absolute velocity is given in Table 14. For points 1-4, all differences in the
velocity magnitude were below 0.05 m.s-1
and were considered negligible. The greatest
change in absolute velocity, of 0.365 m.s-1
, was obtained from Mesh 5 at monitor point 6.
The absolute velocity profile from Mesh 5, point 6 is plotted alongside the Mesh 1 result in
Figure 69. The velocity profile at this point is marked by rapid oscillations of a large
magnitude at the start of the pulse. However, these oscillations were very short lived and
were considered unimportant to the overall effect of the pulse. This is explained in more
detail below. Excluding these initial oscillations, the greatest difference between the results
occurs during a local peak in the velocity at around 0.04 s after the start of the pulse. The
maximum instantaneous difference is in fact 1.04 m.s-1
, which represents a proportional error
of 12% relative to the total velocity of 8.28 m.s-1
predicted by the Mesh 1 solution. This error
is substantially larger than most of the errors observed. Once again, however, the peak is very
short lived, and the difference between the solutions decreases rapidly, giving the average
discrepancy of 0.365 m.s-1
over the complete pulse. The discrepancies at point 6 for the other
meshes were also concentrated around the same local peak in velocity, except that Meshes
2-4 predicted lower pressures than Mesh 1. The Mesh 2 velocity profile is shown in Figure 69
to illustrate this. It is very surprising that the average discrepancies for these other meshes
were of a similar magnitude to the Mesh 5 discrepancy, given that Meshes 2-4 were all
-1000
0
1000
2000
3000
4000
5000
6000
0 0.05 0.1 0.15
Pre
ssu
re (
Pa)
Time (s)
Mesh 1
Mesh 4
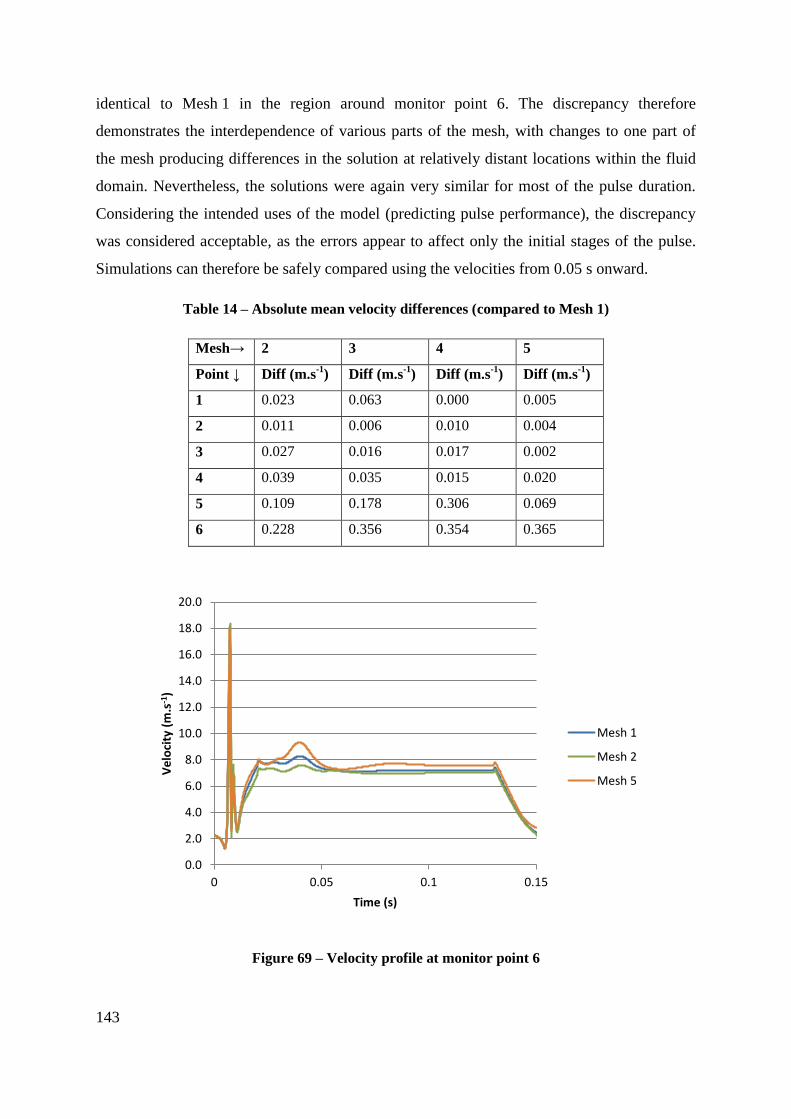
143
identical to Mesh 1 in the region around monitor point 6. The discrepancy therefore
demonstrates the interdependence of various parts of the mesh, with changes to one part of
the mesh producing differences in the solution at relatively distant locations within the fluid
domain. Nevertheless, the solutions were again very similar for most of the pulse duration.
Considering the intended uses of the model (predicting pulse performance), the discrepancy
was considered acceptable, as the errors appear to affect only the initial stages of the pulse.
Simulations can therefore be safely compared using the velocities from 0.05 s onward.
Table 14 – Absolute mean velocity differences (compared to Mesh 1)
Mesh→ 2 3 4 5
Point ↓ Diff (m.s-1
) Diff (m.s-1
) Diff (m.s-1
) Diff (m.s-1
)
1 0.023 0.063 0.000 0.005
2 0.011 0.006 0.010 0.004
3 0.027 0.016 0.017 0.002
4 0.039 0.035 0.015 0.020
5 0.109 0.178 0.306 0.069
6 0.228 0.356 0.354 0.365
Figure 69 – Velocity profile at monitor point 6
0.0
2.0
4.0
6.0
8.0
10.0
12.0
14.0
16.0
18.0
20.0
0 0.05 0.1 0.15
Ve
loci
ty (
m.s
-1)
Time (s)
Mesh 1
Mesh 2
Mesh 5
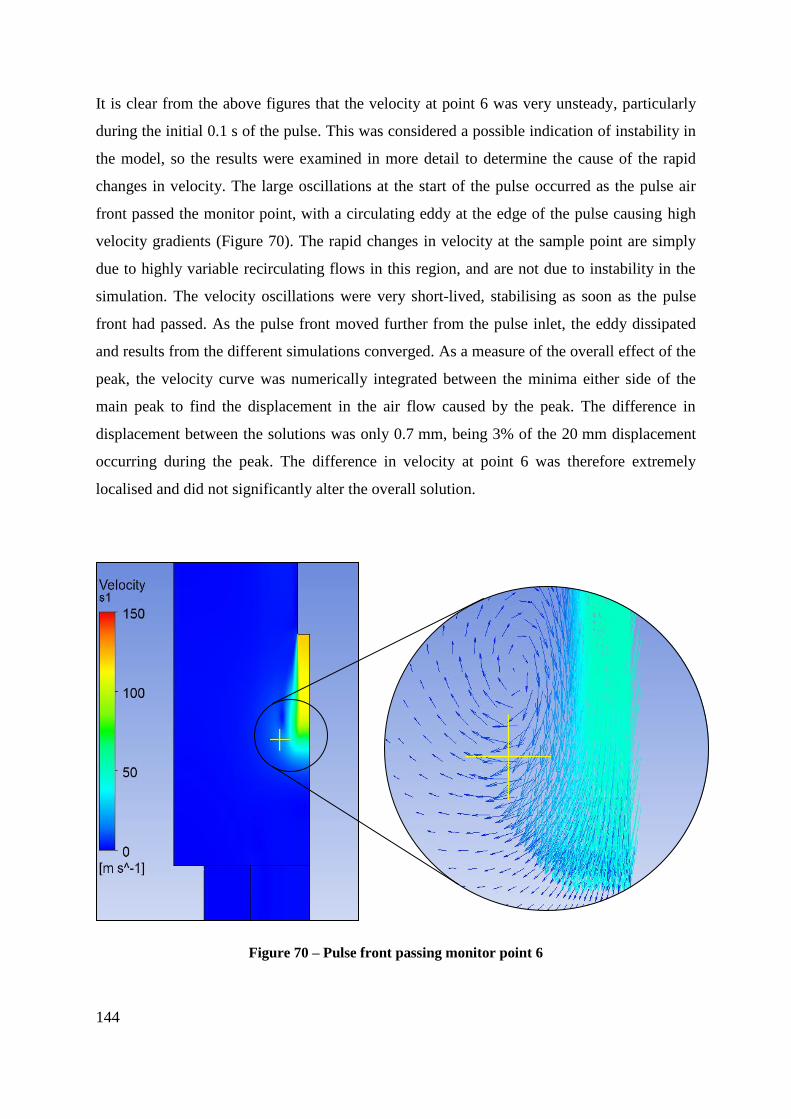
144
It is clear from the above figures that the velocity at point 6 was very unsteady, particularly
during the initial 0.1 s of the pulse. This was considered a possible indication of instability in
the model, so the results were examined in more detail to determine the cause of the rapid
changes in velocity. The large oscillations at the start of the pulse occurred as the pulse air
front passed the monitor point, with a circulating eddy at the edge of the pulse causing high
velocity gradients (Figure 70). The rapid changes in velocity at the sample point are simply
due to highly variable recirculating flows in this region, and are not due to instability in the
simulation. The velocity oscillations were very short-lived, stabilising as soon as the pulse
front had passed. As the pulse front moved further from the pulse inlet, the eddy dissipated
and results from the different simulations converged. As a measure of the overall effect of the
peak, the velocity curve was numerically integrated between the minima either side of the
main peak to find the displacement in the air flow caused by the peak. The difference in
displacement between the solutions was only 0.7 mm, being 3% of the 20 mm displacement
occurring during the peak. The difference in velocity at point 6 was therefore extremely
localised and did not significantly alter the overall solution.
Figure 70 – Pulse front passing monitor point 6
145
In the latter part of the simulations, starting during the ramping down of the pulse flow, the
simulations began to show signs of instability in the heat transfer calculations, with the
iterations within each timestep failing to converge satisfactorily. The pressure and velocity at
the monitor points showed oscillatory behaviour and did not appear realistic. Neither mesh
nor timestep improvements were able to overcome this problem. It was concluded therefore
that the model cannot be used to predict the air flows during the ramping down of the pulse
flow or in the aftermath of the pulse. The absence of a pulse duration effect in the
experimental results of Chapter 4 suggests that the filter cake is mostly removed in the initial
0.1 s of the pulse, so this latter part of the simulation was considered of little importance in
predicting the pulse performance. The model did converge properly during the ramp up and
constant flow periods of the pulse, so the model was considered suitable for predicting the
pulse effectiveness.
5.6 Timestep
In addition to mesh dependence, it is also important to check timestep dependence in all CFD
simulations. Different timesteps were therefore investigated in order to find a timestep that
properly resolved the dynamics of the pulse. This was done in a similar manner to the mesh
dependence study, by running several simulations with an identical mesh and the same
boundary conditions, and only the timestep changed. As stated in the previous section,
Mesh 1 from the mesh dependence study was used for all simulations, as this was known to
give mesh-independent solutions. The boundary conditions, turbulence and fluid models, and
convergence criteria were also the same as in the mesh dependence study. Results were once
again compared by analysing the pressure and velocity profiles at the same six monitor
points.
A timestep of 100 µs was found to be adequate. Table 15 shows the differences obtained by
halving the timestep to 50 µs. The two solutions were virtually identical, with no significant
differences in either pressure or velocity at any of the six monitor points. As examples, the
pressure profiles from point 5 are shown in Figure 71, and the velocity profiles from point 6
are shown in Figure 72. All other results were equally similar. This may suggest that a
timestep even larger than 100 µs would suffice; however, increasing the timestep much above
this limit was found to cause instability in the model, so that converged solutions could not be
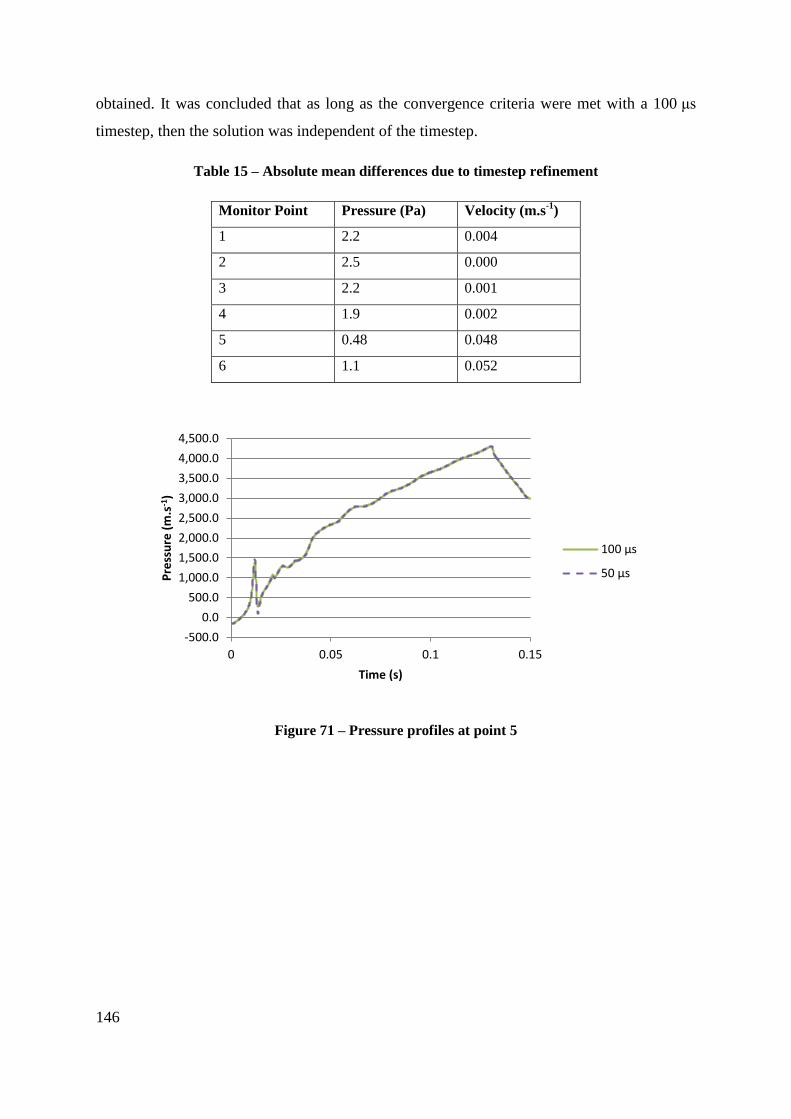
146
obtained. It was concluded that as long as the convergence criteria were met with a 100 μs
timestep, then the solution was independent of the timestep.
Table 15 – Absolute mean differences due to timestep refinement
Monitor Point Pressure (Pa) Velocity (m.s-1
)
1 2.2 0.004
2 2.5 0.000
3 2.2 0.001
4 1.9 0.002
5 0.48 0.048
6 1.1 0.052
Figure 71 – Pressure profiles at point 5
-500.0
0.0
500.0
1,000.0
1,500.0
2,000.0
2,500.0
3,000.0
3,500.0
4,000.0
4,500.0
0 0.05 0.1 0.15
Pre
ssu
re (
m.s
-1)
Time (s)
100 µs
50 µs
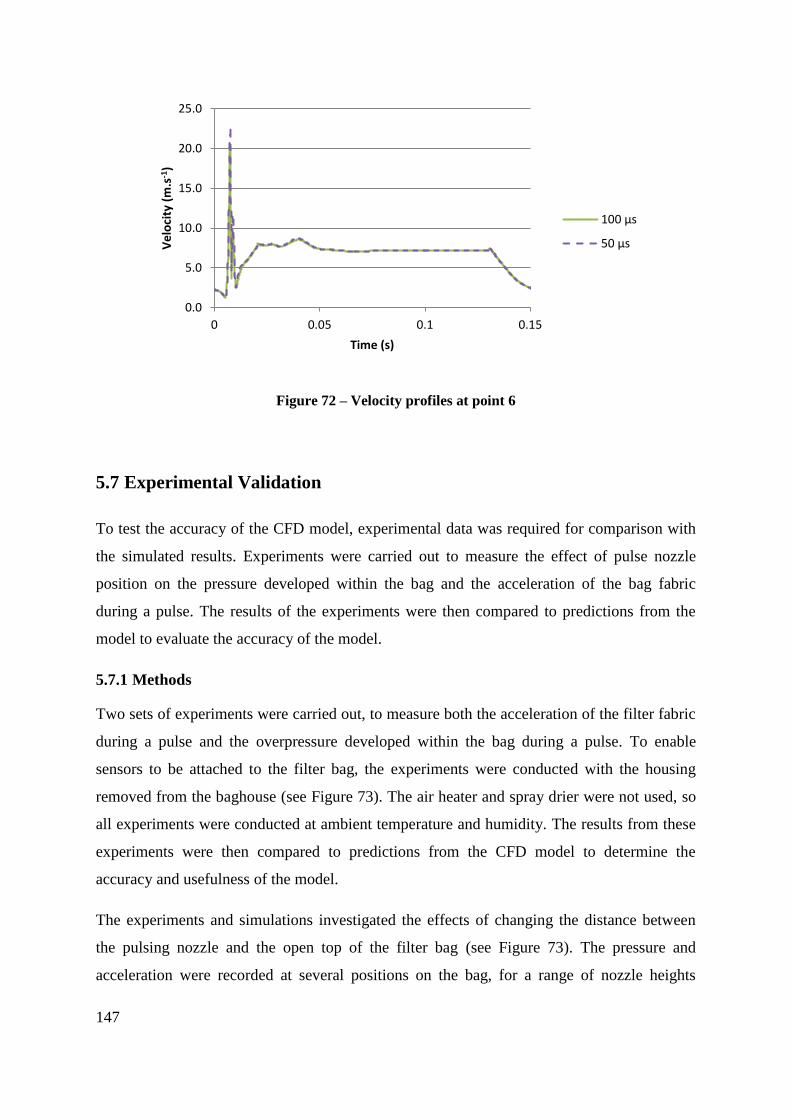
147
Figure 72 – Velocity profiles at point 6
5.7 Experimental Validation
To test the accuracy of the CFD model, experimental data was required for comparison with
the simulated results. Experiments were carried out to measure the effect of pulse nozzle
position on the pressure developed within the bag and the acceleration of the bag fabric
during a pulse. The results of the experiments were then compared to predictions from the
model to evaluate the accuracy of the model.
5.7.1 Methods
Two sets of experiments were carried out, to measure both the acceleration of the filter fabric
during a pulse and the overpressure developed within the bag during a pulse. To enable
sensors to be attached to the filter bag, the experiments were conducted with the housing
removed from the baghouse (see Figure 73). The air heater and spray drier were not used, so
all experiments were conducted at ambient temperature and humidity. The results from these
experiments were then compared to predictions from the CFD model to determine the
accuracy and usefulness of the model.
The experiments and simulations investigated the effects of changing the distance between
the pulsing nozzle and the open top of the filter bag (see Figure 73). The pressure and
acceleration were recorded at several positions on the bag, for a range of nozzle heights
0.0
5.0
10.0
15.0
20.0
25.0
0 0.05 0.1 0.15
Ve
loci
ty (
m.s
-1)
Time (s)
100 µs
50 µs
148
varying from 0.1 to 0.7 m above the top of the bag in 0.1 m increments. The pulse air
pressure was set to 5 bar gauge, and the pulse duration was set to 0.2 s. While the results in
Chapter 4 found that the nozzle position did not affect the overall baghouse pressure
differentials, previous work has indicated that nozzle position does affect the overpressure
and acceleration developed in the filter bag during a pulse (Lu & Tsai, 1996). Concerns in the
dairy industry about fouling beneath the cell plate mean that low pressure differentials are not
sufficient to indicate good baghouse design. In addition to providing validation for the CFD
model, these experiments were intended to reproduce the results of Lu and Tsai (1996),
confirming that the prior result does apply to the baghouse used here, so that the model could
then be used to further investigate the effect of nozzle position at different points on the bag
surface.
Acceleration measurements
The bag acceleration was measured at four sample points distributed along the length of the
bag. The sample points were numbered 1-4 according to their position on the bag, as shown
in Figure 73. The distance from each point to the cell plate is given in Table 16. The
acceleration was measured using a lightweight piezoelectric accelerometer (ICP® model
352B10 from PCB Piezotronics). This was attached to the surface of the bag using a soft wax
adhesive (Figure 74). Only one accelerometer was available, so this was moved between the
sample points to obtain a complete set of measurements. The accelerometer output was
filtered using a signal conditioner (ICP®
model 482B11 from PCB Piezotronics) and recorded
with an oscilloscope. The electrical signal from the pulse controller was connected to the
second input channel on the oscilloscope and used to trigger data collection. For each pulse,
1 s of data was recorded at a sample rate of 2.5 kHz.
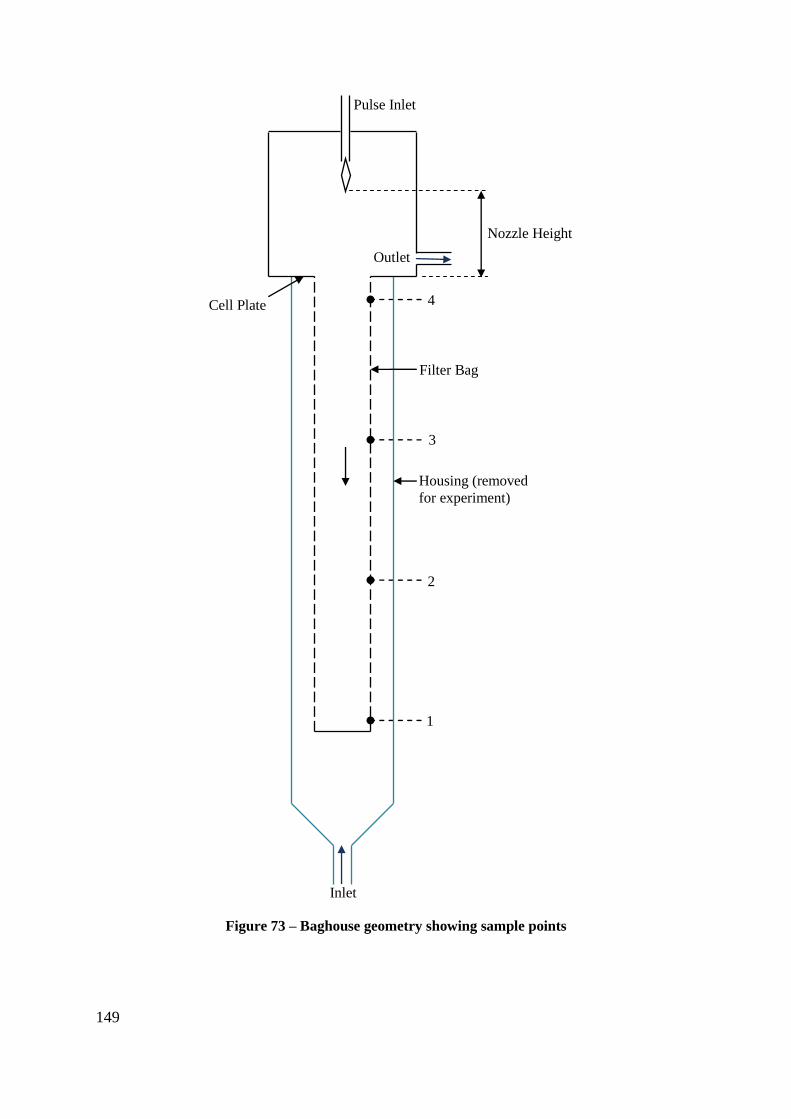
149
Figure 73 – Baghouse geometry showing sample points
Nozzle Height
4
3
2
1
Outlet
Inlet
Filter Bag
Housing (removed
for experiment)
Cell Plate
Pulse Inlet
150
Table 16 – Sensor Positions (distance in metres from the cell plate)
Position Accelerometer Pressure Sensor
1 2.885 2.915
2 1.935 1.935
3 0.985 0.985
4 0.170 0.285
Figure 74 – Accelerometer mounted on filter bag
The measurements were conducted with the baghouse fan running to cause the bag to
collapse onto the support cage between pulses. The pulse was triggered manually, and as
mentioned above, the oscilloscope was triggered by the pulse controller so that data
collection was synchronised with the pulse. The pulse control signal was also recorded by the
oscilloscope, so that the timing of the bag movement could be measured relative to the pulse
signal (for both the start and end of the pulse). This was repeated seven times at the same
nozzle height to give sufficient data for a statistical analysis. After seven repeats, the nozzle
height was adjusted and another seven repeats were conducted at the new nozzle height. Once
this had been carried out for the full range of nozzle heights (0.1-0.7 m in 0.1 m increments),
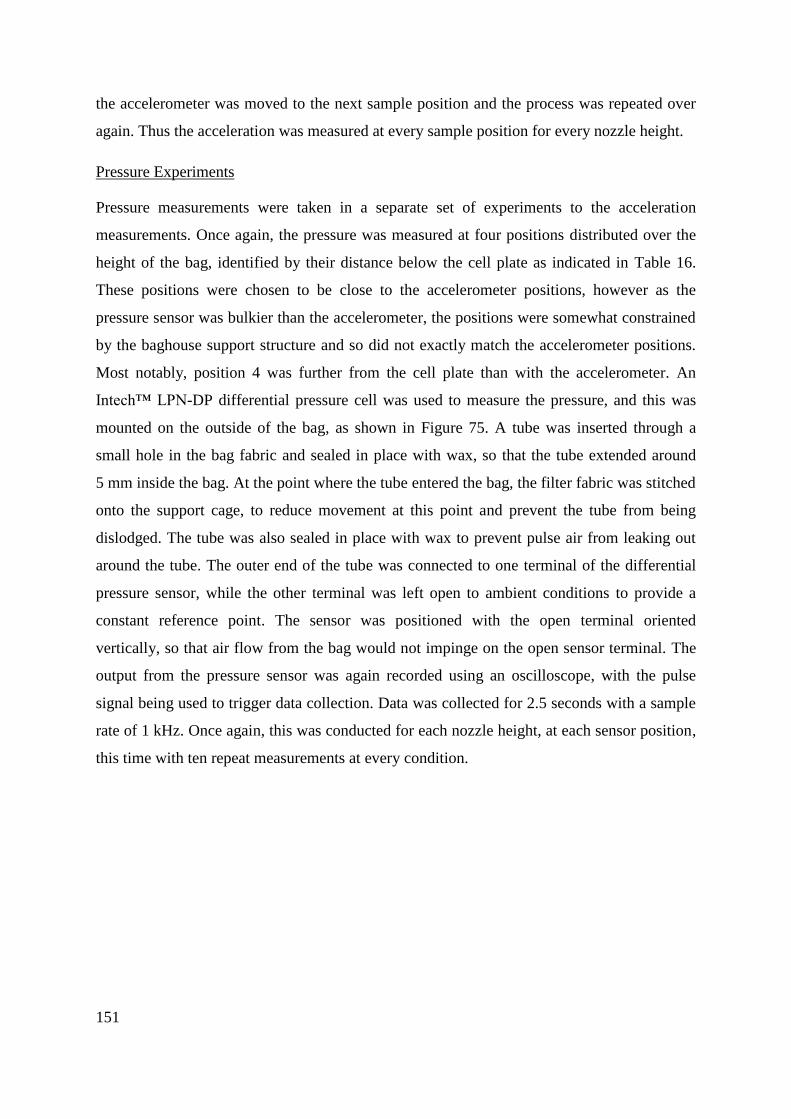
151
the accelerometer was moved to the next sample position and the process was repeated over
again. Thus the acceleration was measured at every sample position for every nozzle height.
Pressure Experiments
Pressure measurements were taken in a separate set of experiments to the acceleration
measurements. Once again, the pressure was measured at four positions distributed over the
height of the bag, identified by their distance below the cell plate as indicated in Table 16.
These positions were chosen to be close to the accelerometer positions, however as the
pressure sensor was bulkier than the accelerometer, the positions were somewhat constrained
by the baghouse support structure and so did not exactly match the accelerometer positions.
Most notably, position 4 was further from the cell plate than with the accelerometer. An
Intech™ LPN-DP differential pressure cell was used to measure the pressure, and this was
mounted on the outside of the bag, as shown in Figure 75. A tube was inserted through a
small hole in the bag fabric and sealed in place with wax, so that the tube extended around
5 mm inside the bag. At the point where the tube entered the bag, the filter fabric was stitched
onto the support cage, to reduce movement at this point and prevent the tube from being
dislodged. The tube was also sealed in place with wax to prevent pulse air from leaking out
around the tube. The outer end of the tube was connected to one terminal of the differential
pressure sensor, while the other terminal was left open to ambient conditions to provide a
constant reference point. The sensor was positioned with the open terminal oriented
vertically, so that air flow from the bag would not impinge on the open sensor terminal. The
output from the pressure sensor was again recorded using an oscilloscope, with the pulse
signal being used to trigger data collection. Data was collected for 2.5 seconds with a sample
rate of 1 kHz. Once again, this was conducted for each nozzle height, at each sensor position,
this time with ten repeat measurements at every condition.
152
Figure 75 – Pressure sensor mounted beside filter bag
Simulations
Seven baghouse meshes were created, with the nozzle position ranging from 0.1-0.7 m above
the top of the bag in 0.1 m increments, to correspond to the experiments. The number of mesh
cells between the nozzle and the bag was adjusted to maintain a similar element size in this
region across all the meshes, but throughout the rest of the fluid domain the meshes were
identical.
Simulations were set up in ANSYS CFX, with the same boundary conditions being used in
all cases. As in the previous simulations, turbulence was modelled using the SST model with
first order numerics, and the transient scheme was first order with upwind differencing.
Compressibility effects were modelled using the ideal gas law. The boundary conditions were
the same as in the mesh dependence study with one notable exception: the pulse inlet
boundary was changed to a total pressure boundary instead of a fixed velocity boundary.
Upon close examination of the results from the mesh dependence run, it was discovered that
the velocity boundary condition underestimated the pressure at the nozzle, which resulted in a
low mass flow of air through the nozzle. The boundary condition was therefore changed to a
153
total pressure boundary, with a ramp up from zero to a maximum of 5 bar total pressure
(similar to the reservoir pressure in the actual baghouse) over the initial 0.02 seconds of
simulation time (the same duration as the ramp up of velocity in the mesh dependence
simulations). The total pressure boundary produced a higher air density at the nozzle, and
thus a more realistic mass flow.
Monitor points were inserted on either side of the filter fabric (i.e. inside and outside the filter
bag) at positions corresponding to the experimental measurement points given in Table 16.
These monitor points recorded the local pressure and fluid velocity at every timestep
throughout the simulation.
Predicted pressures were compared directly with the experimental results, while acceleration
was estimated from the reverse pressure differential across the bag using Newton’s second
law on a per area basis. The mass per unit area of the filter fabric was taken to be the
manufacturers stated weight of 550 g.m-2
, and the effects of friction were ignored. Both
pressure and acceleration were then compared to the experimental results.
5.7.2 Results
Acceleration Experiments
The accelerometer results at sample Points 1-3 showed a peak in acceleration at the start of
the pulse, with continued oscillations of lower amplitude persisting for the duration of the
pulse, and a small negative peak at the end of the pulse. This is apparent in a typical
acceleration profile from Point 2, shown in Figure 76. The initial peak occurred as the bag
expanded at the start of the pulse, and showed a positive acceleration as the fabric moved
outward, followed by a negative acceleration as the bag stretched taut and ceased expanding.
The bag then remained inflated through the middle period of the pulse while smaller
oscillations continued. The negative peak at the end of the pulse marked the collapse of the
bag back onto the support cage, and was smaller than the initial peak as the collapse occurred
more slowly than the initial expansion. The shaded grey area in Figure 76 indicates the
duration of the pulse control signal. It can clearly be seen that the acceleration begins
approximately 0.04 s after the control signal and continues for a longer duration. The
extended duration indicates that the pulse valve is somewhat slow to close, allowing air flow
to continue for at least 0.1 s longer than the 0.2 s duration programmed into the pulse
controller.
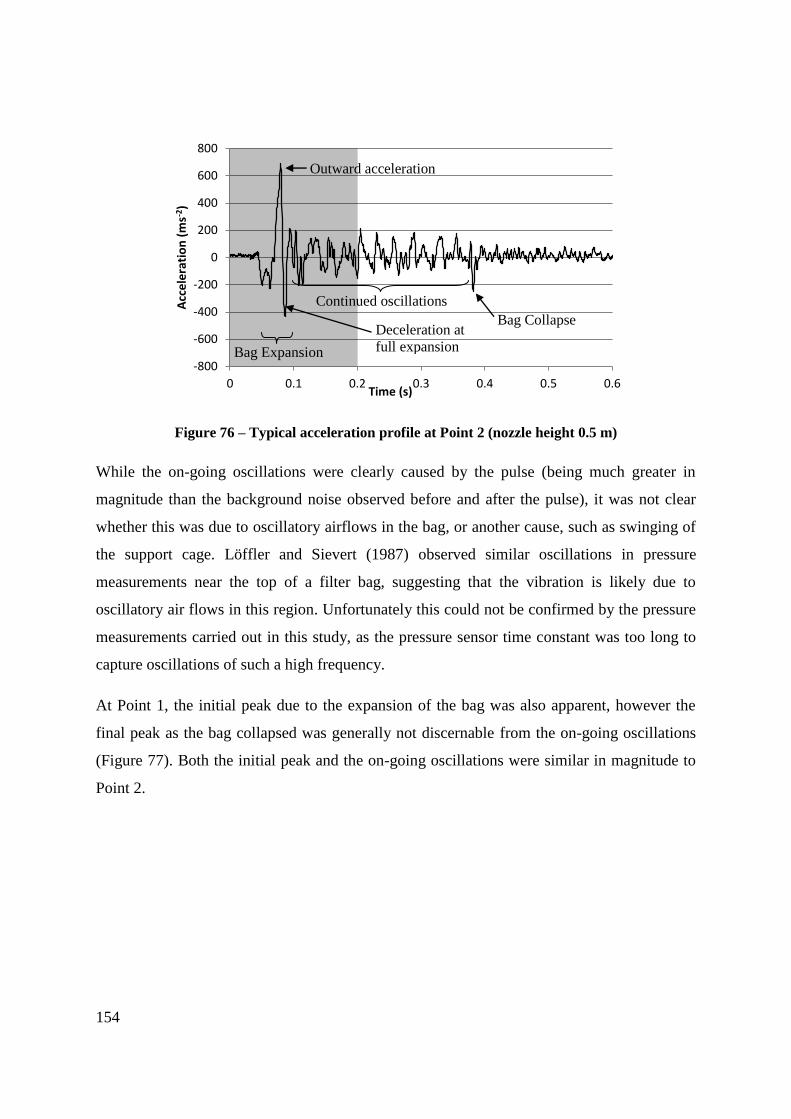
154
Figure 76 – Typical acceleration profile at Point 2 (nozzle height 0.5 m)
While the on-going oscillations were clearly caused by the pulse (being much greater in
magnitude than the background noise observed before and after the pulse), it was not clear
whether this was due to oscillatory airflows in the bag, or another cause, such as swinging of
the support cage. Löffler and Sievert (1987) observed similar oscillations in pressure
measurements near the top of a filter bag, suggesting that the vibration is likely due to
oscillatory air flows in this region. Unfortunately this could not be confirmed by the pressure
measurements carried out in this study, as the pressure sensor time constant was too long to
capture oscillations of such a high frequency.
At Point 1, the initial peak due to the expansion of the bag was also apparent, however the
final peak as the bag collapsed was generally not discernable from the on-going oscillations
(Figure 77). Both the initial peak and the on-going oscillations were similar in magnitude to
Point 2.
-800
-600
-400
-200
0
200
400
600
800
0 0.1 0.2 0.3 0.4 0.5 0.6
Acc
ele
rati
on
(m
s-2)
Time (s)
Bag Collapse
Bag Expansion
Outward acceleration
Deceleration at
full expansion
Continued oscillations
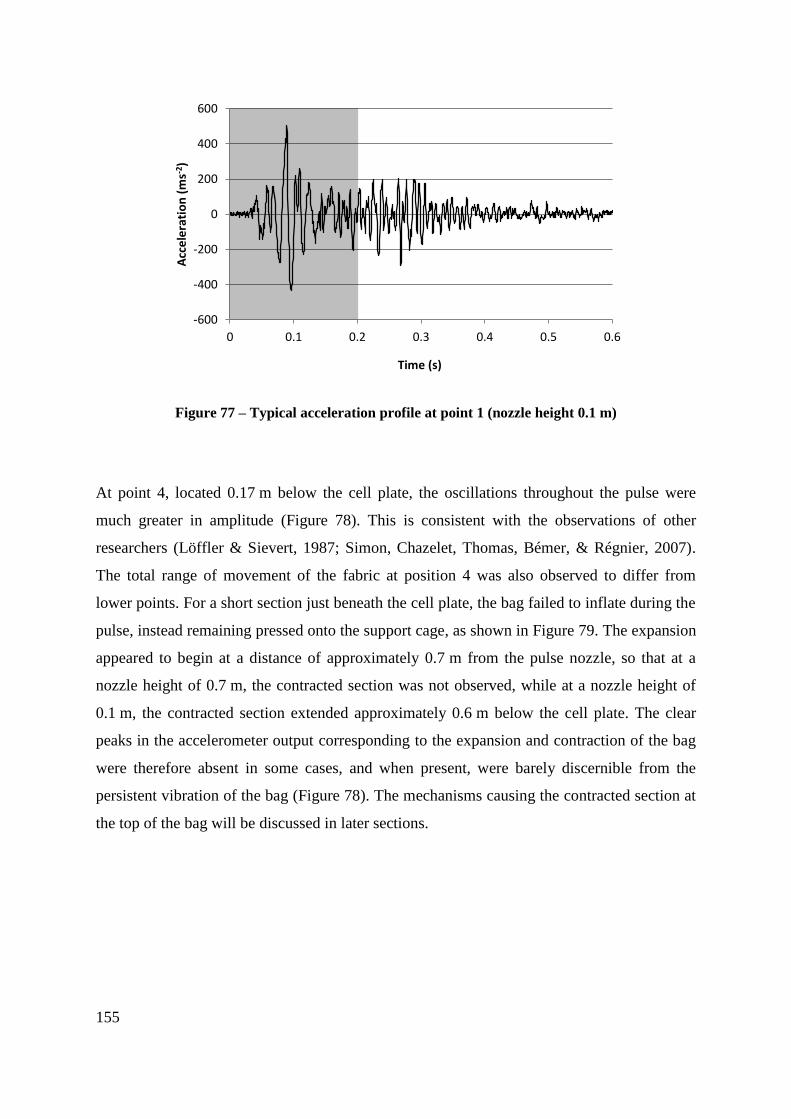
155
Figure 77 – Typical acceleration profile at point 1 (nozzle height 0.1 m)
At point 4, located 0.17 m below the cell plate, the oscillations throughout the pulse were
much greater in amplitude (Figure 78). This is consistent with the observations of other
researchers (Löffler & Sievert, 1987; Simon, Chazelet, Thomas, Bémer, & Régnier, 2007).
The total range of movement of the fabric at position 4 was also observed to differ from
lower points. For a short section just beneath the cell plate, the bag failed to inflate during the
pulse, instead remaining pressed onto the support cage, as shown in Figure 79. The expansion
appeared to begin at a distance of approximately 0.7 m from the pulse nozzle, so that at a
nozzle height of 0.7 m, the contracted section was not observed, while at a nozzle height of
0.1 m, the contracted section extended approximately 0.6 m below the cell plate. The clear
peaks in the accelerometer output corresponding to the expansion and contraction of the bag
were therefore absent in some cases, and when present, were barely discernible from the
persistent vibration of the bag (Figure 78). The mechanisms causing the contracted section at
the top of the bag will be discussed in later sections.
-600
-400
-200
0
200
400
600
0 0.1 0.2 0.3 0.4 0.5 0.6
Acc
ele
rati
on
(m
s-2)
Time (s)
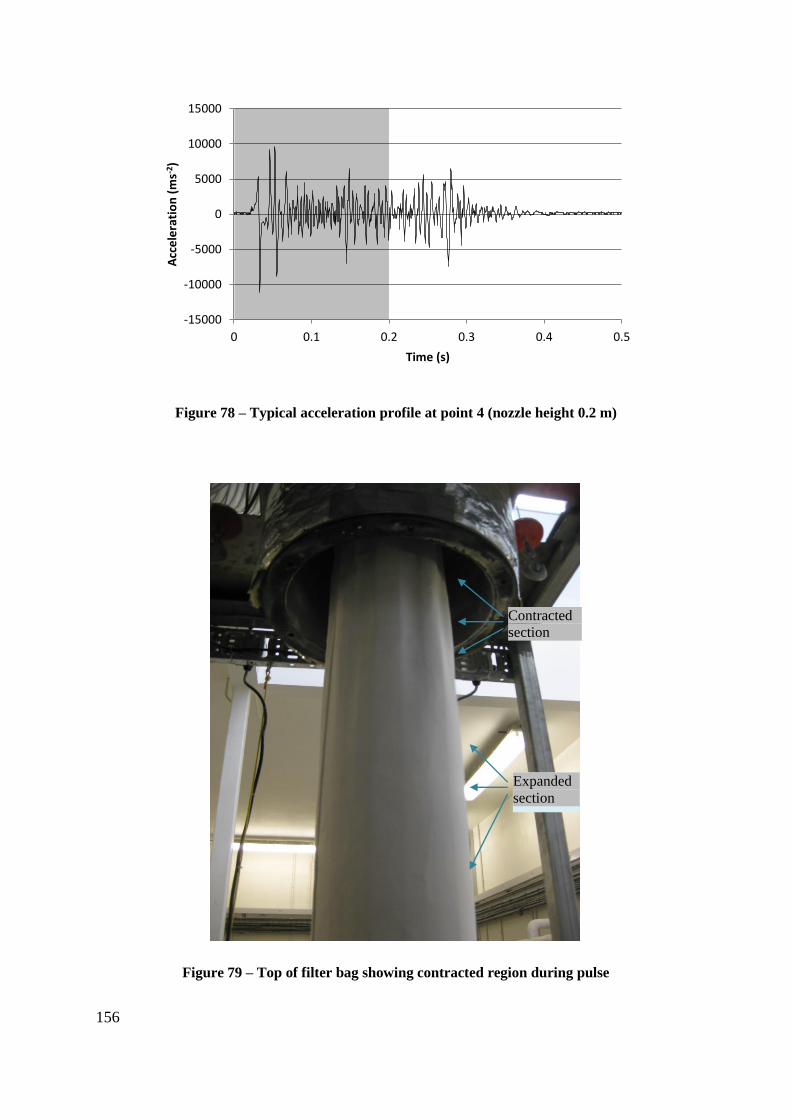
156
Figure 78 – Typical acceleration profile at point 4 (nozzle height 0.2 m)
Figure 79 – Top of filter bag showing contracted region during pulse
-15000
-10000
-5000
0
5000
10000
15000
0 0.1 0.2 0.3 0.4 0.5
Acc
ele
rati
on
(m
s-2)
Time (s)
Contracted
section
Expanded
section
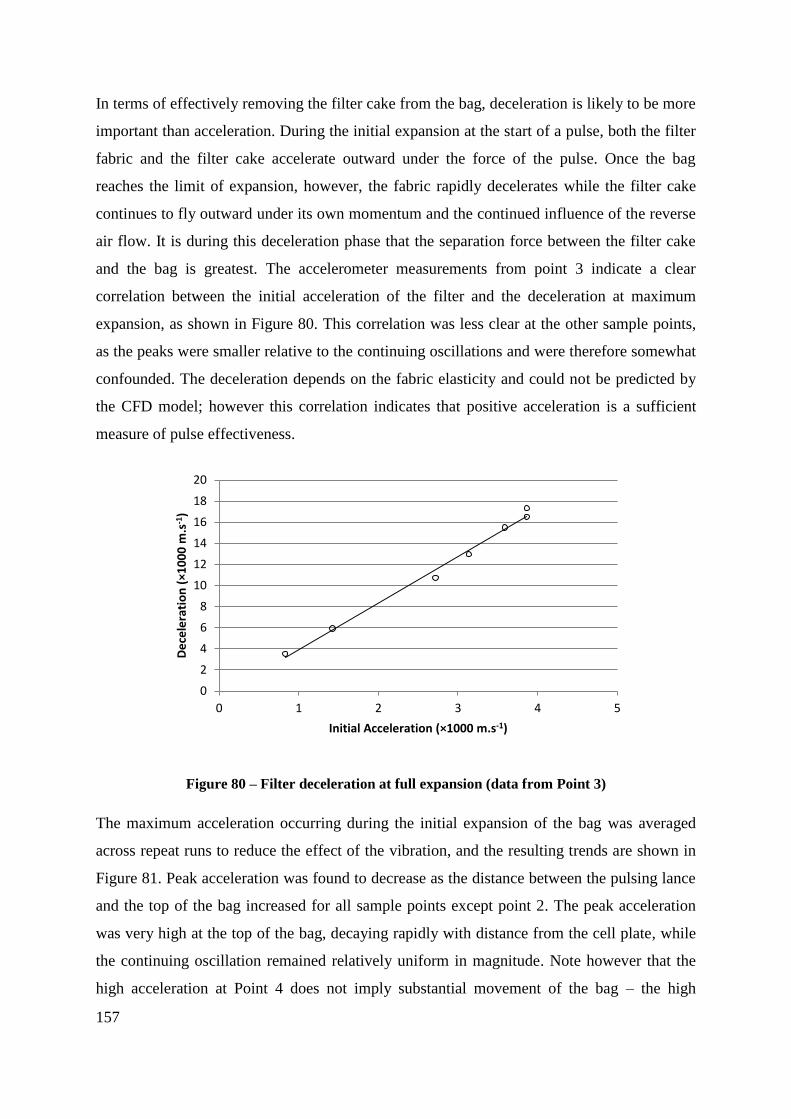
157
In terms of effectively removing the filter cake from the bag, deceleration is likely to be more
important than acceleration. During the initial expansion at the start of a pulse, both the filter
fabric and the filter cake accelerate outward under the force of the pulse. Once the bag
reaches the limit of expansion, however, the fabric rapidly decelerates while the filter cake
continues to fly outward under its own momentum and the continued influence of the reverse
air flow. It is during this deceleration phase that the separation force between the filter cake
and the bag is greatest. The accelerometer measurements from point 3 indicate a clear
correlation between the initial acceleration of the filter and the deceleration at maximum
expansion, as shown in Figure 80. This correlation was less clear at the other sample points,
as the peaks were smaller relative to the continuing oscillations and were therefore somewhat
confounded. The deceleration depends on the fabric elasticity and could not be predicted by
the CFD model; however this correlation indicates that positive acceleration is a sufficient
measure of pulse effectiveness.
Figure 80 – Filter deceleration at full expansion (data from Point 3)
The maximum acceleration occurring during the initial expansion of the bag was averaged
across repeat runs to reduce the effect of the vibration, and the resulting trends are shown in
Figure 81. Peak acceleration was found to decrease as the distance between the pulsing lance
and the top of the bag increased for all sample points except point 2. The peak acceleration
was very high at the top of the bag, decaying rapidly with distance from the cell plate, while
the continuing oscillation remained relatively uniform in magnitude. Note however that the
high acceleration at Point 4 does not imply substantial movement of the bag – the high
0
2
4
6
8
10
12
14
16
18
20
0 1 2 3 4 5
De
cele
rati
on
(×1
00
0 m
.s-1
)
Initial Acceleration (×1000 m.s-1)
158
frequency oscillations gave a high acceleration even when the bag did not properly expand. A
similar drop in acceleration with distance was also reported by Löffler and Sievert (1987) and
Lu and Tsai (1998).
Figure 81 – Effect of nozzle height on peak acceleration
For points 1-3, the timing of the acceleration peaks showed a clear progression (Figure 82).,
with point 3 (0.985 m below the cell plate) recording peak accelerations 40-50 ms after the
trigger signal, while point 1 (2.885 m below the cell plate) recorded peak accelerations 90-
100 ms after the trigger signal This allows the average velocity of the pressure front to be
calculated at 38 m.s-1
through the bag. There was also a noticeable effect of lance position on
the timing of the acceleration peak, with the peak occurring approximately 10 ms later at the
highest lance position (0.7 m) than at the lowest lance position (0.1 m), as can be seen in
Figure 82. The average front velocity can be calculated to be around 60 m.s-1
in the 0.6 m
immediately below the lance. This velocity is higher than the front velocity in the bag,
implying that the incoming air pulse slows down rapidly as it gets further from the lance. The
rapid slowing of the pulse front is unsurprising, as the high shear rates near the pulse inlet
would be expected to create friction and turbulence, rapidly dissipating the energy of the jet.
At point 4, just below the cell plate, the frequent absence of a clear initial peak in acceleration
(as described above) made it impossible to accurately time the arrival of the pulse.
0
2000
4000
6000
8000
10000
12000
0 0.2 0.4 0.6 0.8
Pe
ak A
cce
lera
tio
n (
ms-2
)
Nozzle Height (m)
Point 1
Point 2
Point 3
Point 4
159
Figure 82 – Pulse progression down the bag
Figure 81 shows that lower nozzle positions resulted in greater bag acceleration, which
suggests that the pulse should be most effective at removing the filter cake at lower nozzle
positions. It is interesting to note that the experimental results from Section 4.3.2 found no
significant link between the nozzle position and the overall cake removal effectiveness, as
measured by the pressure differential after the pulse. The most likely explanation for this is
that, provided the acceleration reaches a certain threshold, the filter cake is completely
removed, so that further increases in fabric acceleration do not affect the cake removal. A
possible alternative may be indicated by the lack of expansion at the top of the bag at low
lance positions. This suggests that the pulse will be less effective at cleaning this top section
of the bag at low lance positions. The differences in acceleration at Points 1 and 2 were small,
suggesting that the major improvements in cleaning effectiveness will be concentrated in the
vicinity of Point 3. In the filtration experiments, as the nozzle position was lowered, any
improvement in cake removal around point 3 may have been offset by poorer cake removal at
the top of the bag (around Point 4), so that the overall improvement was negligible.
The pulse appeared surprisingly weak compared to observations of pulsing in industrial
baghouses. The pulse appeared barely sufficient to inflate the bag, and the decay in the peak
acceleration with distance is of some concern, considering that industrial milk powder
baghouses use much longer bags than the pilot scale baghouse used for this experiment. The
pulse system in the pilot scale baghouse is identical to the pulse systems used with 6 m long
bags in industry, so it is surprising that the pulse seems so ineffective on the 3 m long bag.
0
20
40
60
80
100
120
0 1 2 3 4
Pu
lse
sta
rt t
ime
(m
s)
Distance from cell plate (m)
0.7 m nozzle
0.4 m nozzle
0.1 m nozzle
160
One key difference that may explain this is the size of the clean air plenum. In industrial
baghouses, the clean air plenums are much larger, allowing a greater capacity for entrainment
into the pulse. It is thought that in industrial baghouses, the total volume of air entering the
bag during a pulse is actually much greater than the volume of air injected through the
nozzle, due to entrainment of the surrounding air (Hesketh, 1996). In the pilot scale
baghouse, the clean air plenum is small, so the capacity for entrainment is limited. To
partially counter this effect, the plenum on the pilot scale baghouse is connected via two large
tubes to a separate air reservoir, although this is still much smaller than the plenum in an
industrial baghouse. In an attempt to measure the limitations of this, the tubes connecting to
the reservoir were disconnected and left open to atmosphere during a pulse. This produced a
noticeable increase in bag movement during the pulse, and a significant intake of air was
observed through the open tube connections, confirming that entrainment is critical to
achieving good pulse performance. Unfortunately, the increase in the bag acceleration caused
by disconnecting the tubes could not be reliably quantified, as the greater acceleration
exceeded the linear range of the accelerometer.
Pressure Measurements
The experimental pressure measurements for positions 1-3 showed a rapid increase in
pressure, peaking approximately 0.4 seconds after the start of the trigger signal, and then
decaying (Figure 83). At the top of the bag, however, the high velocity of the inlet jet created
a low pressure zone, so that at low nozzle positions the pressure at point 4 actually decreased
during a pulse (Figure 84). This explains the failure of the bag to inflate in this region as
observed in the acceleration experiments. Negative pressure at the sensor was only recorded
for pulse heights of 0.4 m and below. As the measurement point was 0.29 m below the cell
plate, it can be deduced that the low pressure region extends for 0.7 m from the nozzle,
consistent with the observations taken during the acceleration experiments. The low pressure
zone is due to Bernoulli’s principle. The pulse air enters the baghouse at very high velocity,
resulting in low pressure. Lu and Tsai (1998) and Ellenbecker and Leith (1979) have reported
similar effects in baghouses with venturis at the top of the bags, so this is a known
phenomenon. There has been some concern in the dairy industry about poor cleaning at the
top of the bag (Winchester, 2010), and the low pressure in this region suggests a likely cause
of such problems. The fabric movement at the top of the bag is also restricted by the
attachment to the cell plate, making it even more important to achieve sufficient pulse
161
overpressure in this region. On the other hand, this region is only a very small fraction of the
total bag area, so even complete blinding of the bag in this region will only have a limited
effect on the pressure differentials. As the pulse air gets further from the nozzle, it slows
down, and the kinetic energy is converted to pressure, resulting in the high pressure in the
lower regions of the bag.
Figure 83 –Typical pressure profile at position 1 (0.6 m nozzle height)
Figure 84 – Pressure profile at position 4 for 0.2 m nozzle height
The time constant of the pressure sensor was relatively slow, so that the fine detail of the
pulse profile was not captured and that the peak pressure was severely underestimated.
0
100
200
300
400
500
600
700
800
900
0 0.5 1 1.5 2 2.5
Pre
ssu
re (
Pa)
Time (s)
-600
-500
-400
-300
-200
-100
0
100
0 0.5 1 1.5 2 2.5
Pre
ssu
re (
Pa)
Time (s)
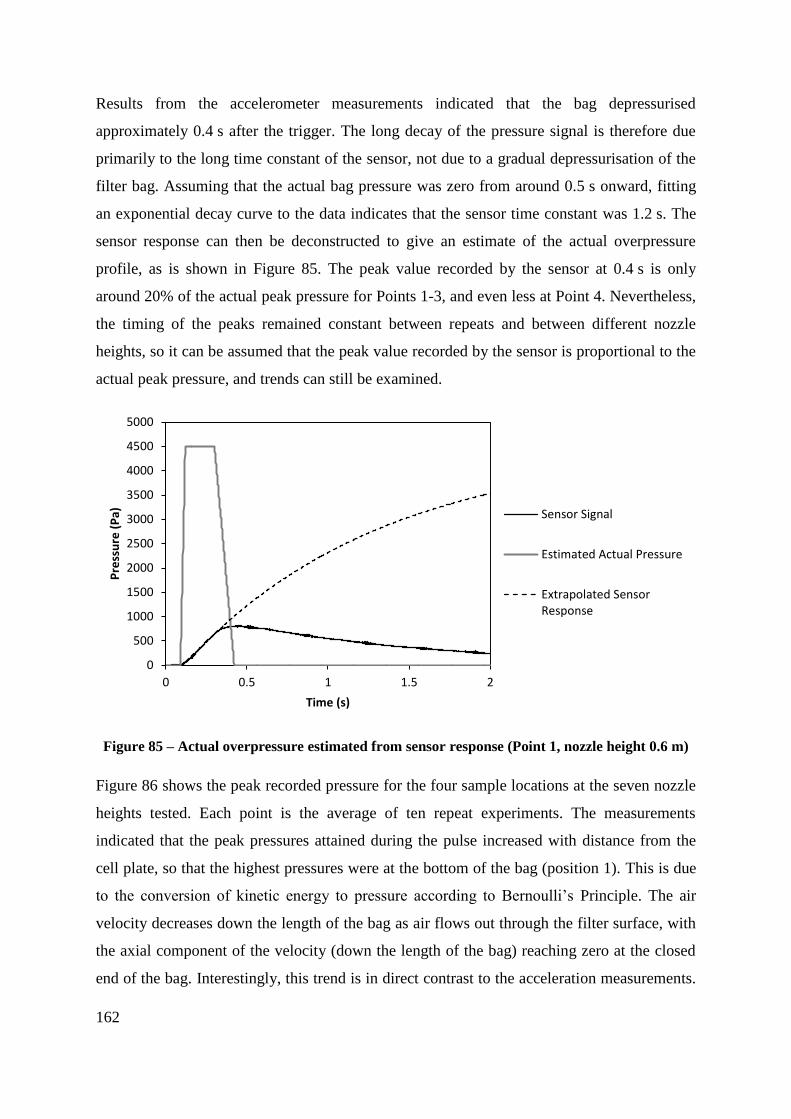
162
Results from the accelerometer measurements indicated that the bag depressurised
approximately 0.4 s after the trigger. The long decay of the pressure signal is therefore due
primarily to the long time constant of the sensor, not due to a gradual depressurisation of the
filter bag. Assuming that the actual bag pressure was zero from around 0.5 s onward, fitting
an exponential decay curve to the data indicates that the sensor time constant was 1.2 s. The
sensor response can then be deconstructed to give an estimate of the actual overpressure
profile, as is shown in Figure 85. The peak value recorded by the sensor at 0.4 s is only
around 20% of the actual peak pressure for Points 1-3, and even less at Point 4. Nevertheless,
the timing of the peaks remained constant between repeats and between different nozzle
heights, so it can be assumed that the peak value recorded by the sensor is proportional to the
actual peak pressure, and trends can still be examined.
Figure 85 – Actual overpressure estimated from sensor response (Point 1, nozzle height 0.6 m)
Figure 86 shows the peak recorded pressure for the four sample locations at the seven nozzle
heights tested. Each point is the average of ten repeat experiments. The measurements
indicated that the peak pressures attained during the pulse increased with distance from the
cell plate, so that the highest pressures were at the bottom of the bag (position 1). This is due
to the conversion of kinetic energy to pressure according to Bernoulli’s Principle. The air
velocity decreases down the length of the bag as air flows out through the filter surface, with
the axial component of the velocity (down the length of the bag) reaching zero at the closed
end of the bag. Interestingly, this trend is in direct contrast to the acceleration measurements.
0
500
1000
1500
2000
2500
3000
3500
4000
4500
5000
0 0.5 1 1.5 2
Pre
ssu
re (
Pa)
Time (s)
Sensor Signal
Estimated Actual Pressure
Extrapolated SensorResponse
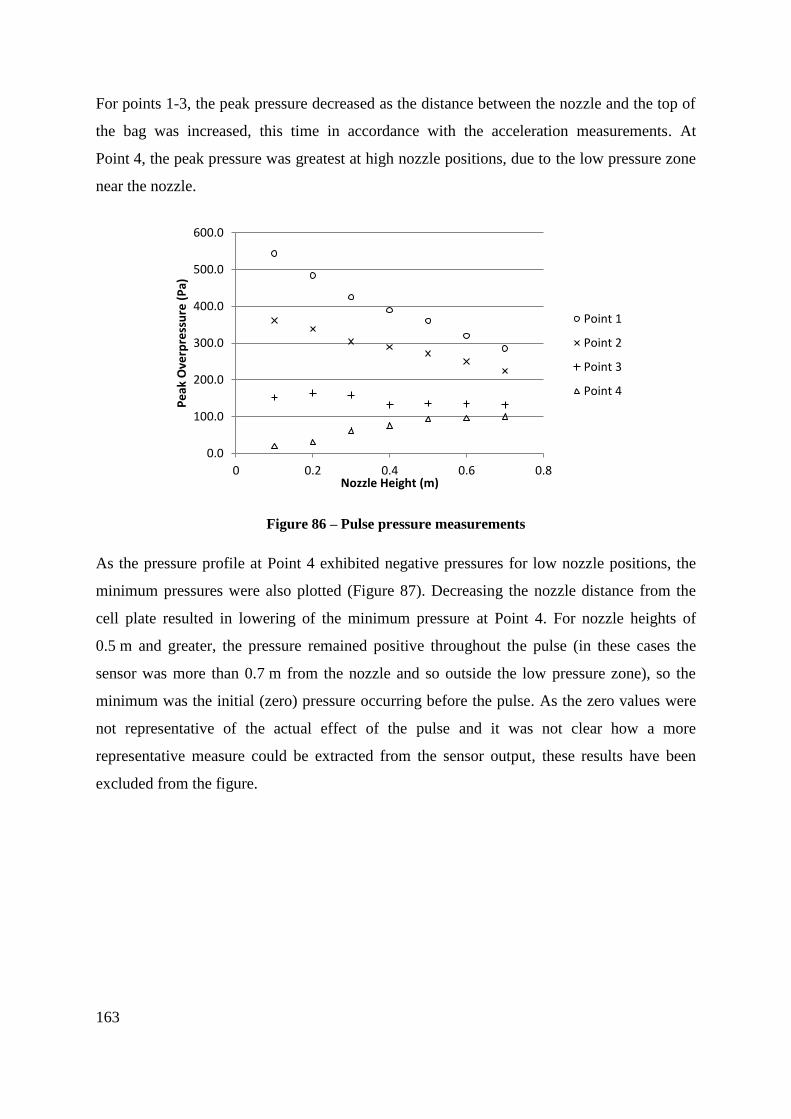
163
For points 1-3, the peak pressure decreased as the distance between the nozzle and the top of
the bag was increased, this time in accordance with the acceleration measurements. At
Point 4, the peak pressure was greatest at high nozzle positions, due to the low pressure zone
near the nozzle.
Figure 86 – Pulse pressure measurements
As the pressure profile at Point 4 exhibited negative pressures for low nozzle positions, the
minimum pressures were also plotted (Figure 87). Decreasing the nozzle distance from the
cell plate resulted in lowering of the minimum pressure at Point 4. For nozzle heights of
0.5 m and greater, the pressure remained positive throughout the pulse (in these cases the
sensor was more than 0.7 m from the nozzle and so outside the low pressure zone), so the
minimum was the initial (zero) pressure occurring before the pulse. As the zero values were
not representative of the actual effect of the pulse and it was not clear how a more
representative measure could be extracted from the sensor output, these results have been
excluded from the figure.
0.0
100.0
200.0
300.0
400.0
500.0
600.0
0 0.2 0.4 0.6 0.8
Pe
ak O
verp
ress
ure
(P
a)
Nozzle Height (m)
Point 1
Point 2
Point 3
Point 4
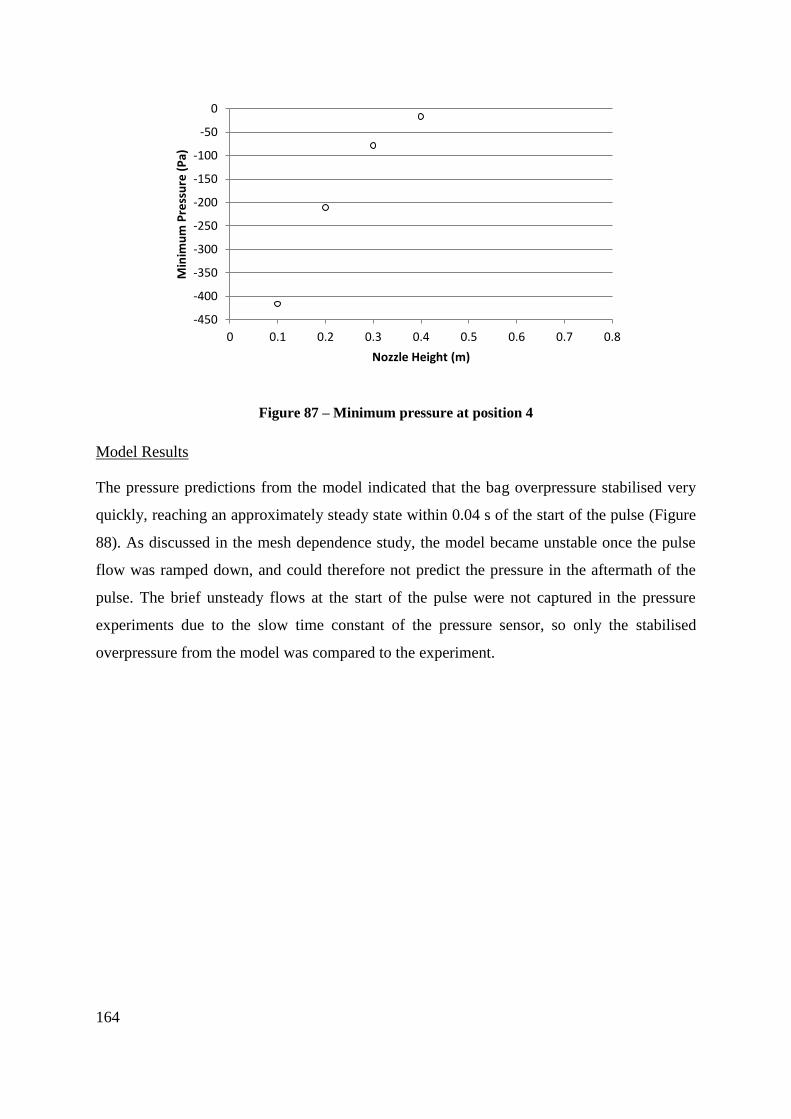
164
Figure 87 – Minimum pressure at position 4
Model Results
The pressure predictions from the model indicated that the bag overpressure stabilised very
quickly, reaching an approximately steady state within 0.04 s of the start of the pulse (Figure
88). As discussed in the mesh dependence study, the model became unstable once the pulse
flow was ramped down, and could therefore not predict the pressure in the aftermath of the
pulse. The brief unsteady flows at the start of the pulse were not captured in the pressure
experiments due to the slow time constant of the pressure sensor, so only the stabilised
overpressure from the model was compared to the experiment.
-450
-400
-350
-300
-250
-200
-150
-100
-50
0
0 0.1 0.2 0.3 0.4 0.5 0.6 0.7 0.8
Min
imu
m P
ress
ure
(P
a)
Nozzle Height (m)
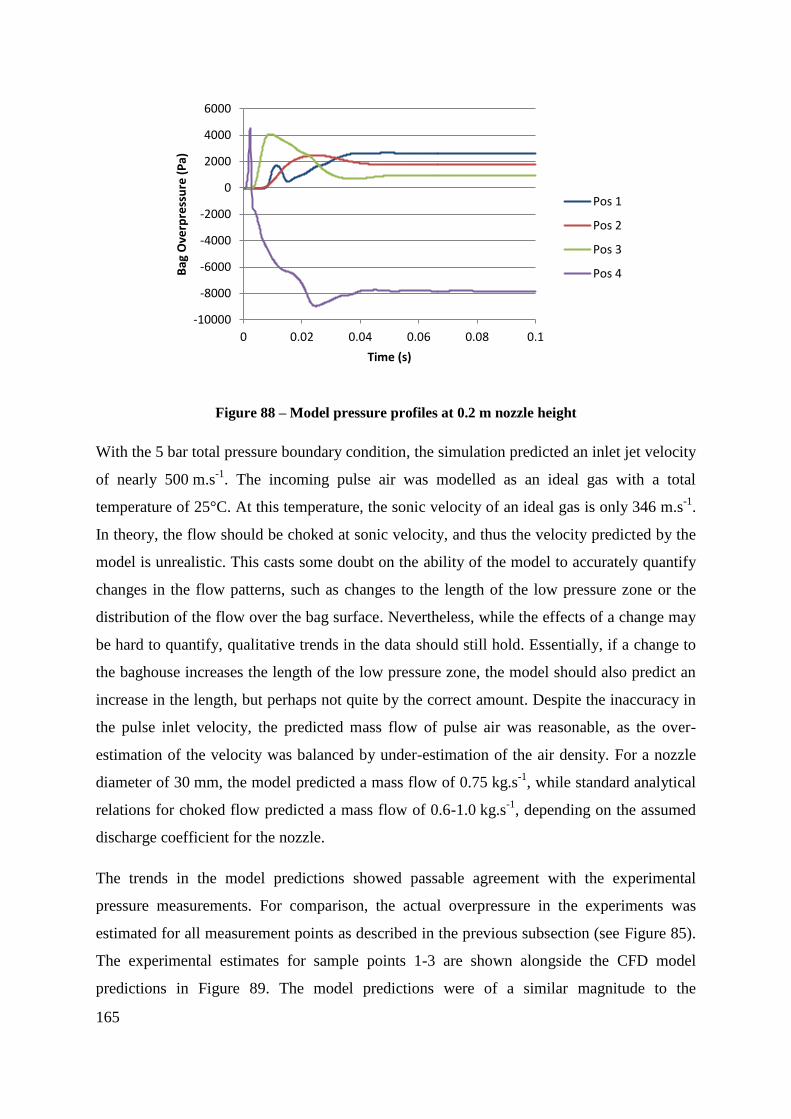
165
Figure 88 – Model pressure profiles at 0.2 m nozzle height
With the 5 bar total pressure boundary condition, the simulation predicted an inlet jet velocity
of nearly 500 m.s-1
. The incoming pulse air was modelled as an ideal gas with a total
temperature of 25°C. At this temperature, the sonic velocity of an ideal gas is only 346 m.s-1
.
In theory, the flow should be choked at sonic velocity, and thus the velocity predicted by the
model is unrealistic. This casts some doubt on the ability of the model to accurately quantify
changes in the flow patterns, such as changes to the length of the low pressure zone or the
distribution of the flow over the bag surface. Nevertheless, while the effects of a change may
be hard to quantify, qualitative trends in the data should still hold. Essentially, if a change to
the baghouse increases the length of the low pressure zone, the model should also predict an
increase in the length, but perhaps not quite by the correct amount. Despite the inaccuracy in
the pulse inlet velocity, the predicted mass flow of pulse air was reasonable, as the over-
estimation of the velocity was balanced by under-estimation of the air density. For a nozzle
diameter of 30 mm, the model predicted a mass flow of 0.75 kg.s-1
, while standard analytical
relations for choked flow predicted a mass flow of 0.6-1.0 kg.s-1
, depending on the assumed
discharge coefficient for the nozzle.
The trends in the model predictions showed passable agreement with the experimental
pressure measurements. For comparison, the actual overpressure in the experiments was
estimated for all measurement points as described in the previous subsection (see Figure 85).
The experimental estimates for sample points 1-3 are shown alongside the CFD model
predictions in Figure 89. The model predictions were of a similar magnitude to the
-10000
-8000
-6000
-4000
-2000
0
2000
4000
6000
0 0.02 0.04 0.06 0.08 0.1
Bag
Ove
rpre
ssu
re (
Pa)
Time (s)
Pos 1
Pos 2
Pos 3
Pos 4
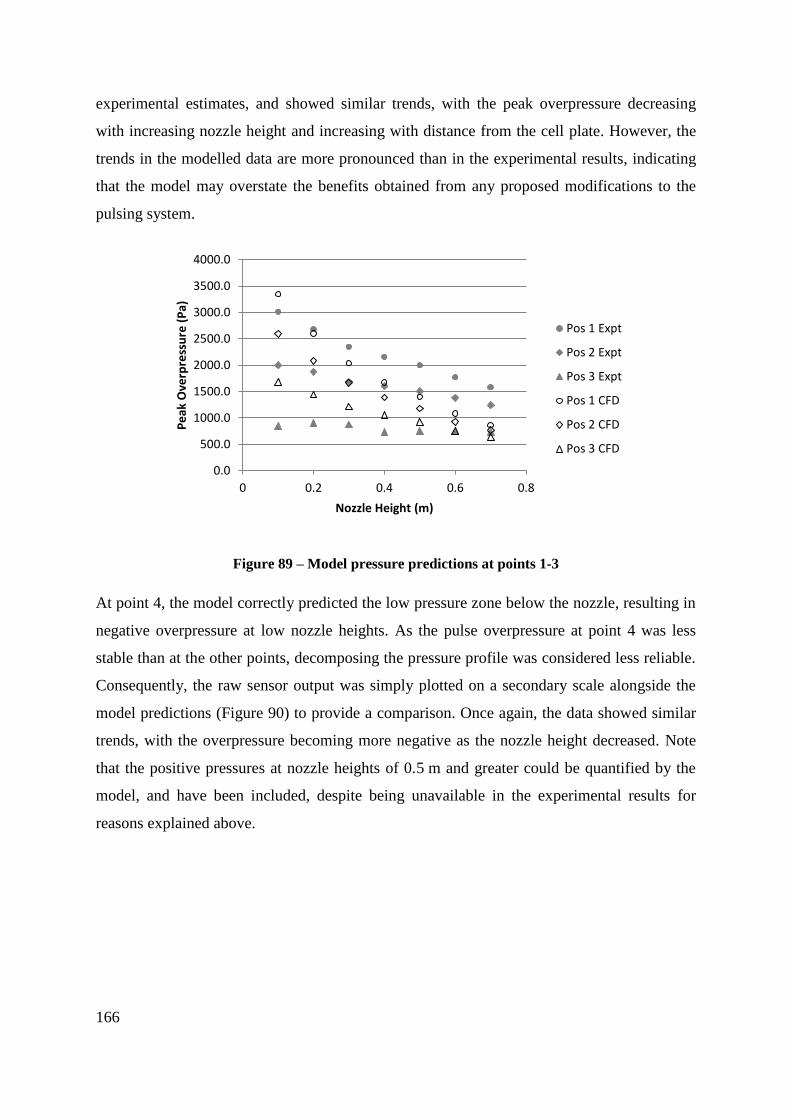
166
experimental estimates, and showed similar trends, with the peak overpressure decreasing
with increasing nozzle height and increasing with distance from the cell plate. However, the
trends in the modelled data are more pronounced than in the experimental results, indicating
that the model may overstate the benefits obtained from any proposed modifications to the
pulsing system.
Figure 89 – Model pressure predictions at points 1-3
At point 4, the model correctly predicted the low pressure zone below the nozzle, resulting in
negative overpressure at low nozzle heights. As the pulse overpressure at point 4 was less
stable than at the other points, decomposing the pressure profile was considered less reliable.
Consequently, the raw sensor output was simply plotted on a secondary scale alongside the
model predictions (Figure 90) to provide a comparison. Once again, the data showed similar
trends, with the overpressure becoming more negative as the nozzle height decreased. Note
that the positive pressures at nozzle heights of 0.5 m and greater could be quantified by the
model, and have been included, despite being unavailable in the experimental results for
reasons explained above.
0.0
500.0
1000.0
1500.0
2000.0
2500.0
3000.0
3500.0
4000.0
0 0.2 0.4 0.6 0.8
Pe
ak O
verp
ress
ure
(P
a)
Nozzle Height (m)
Pos 1 Expt
Pos 2 Expt
Pos 3 Expt
Pos 1 CFD
Pos 2 CFD
Pos 3 CFD
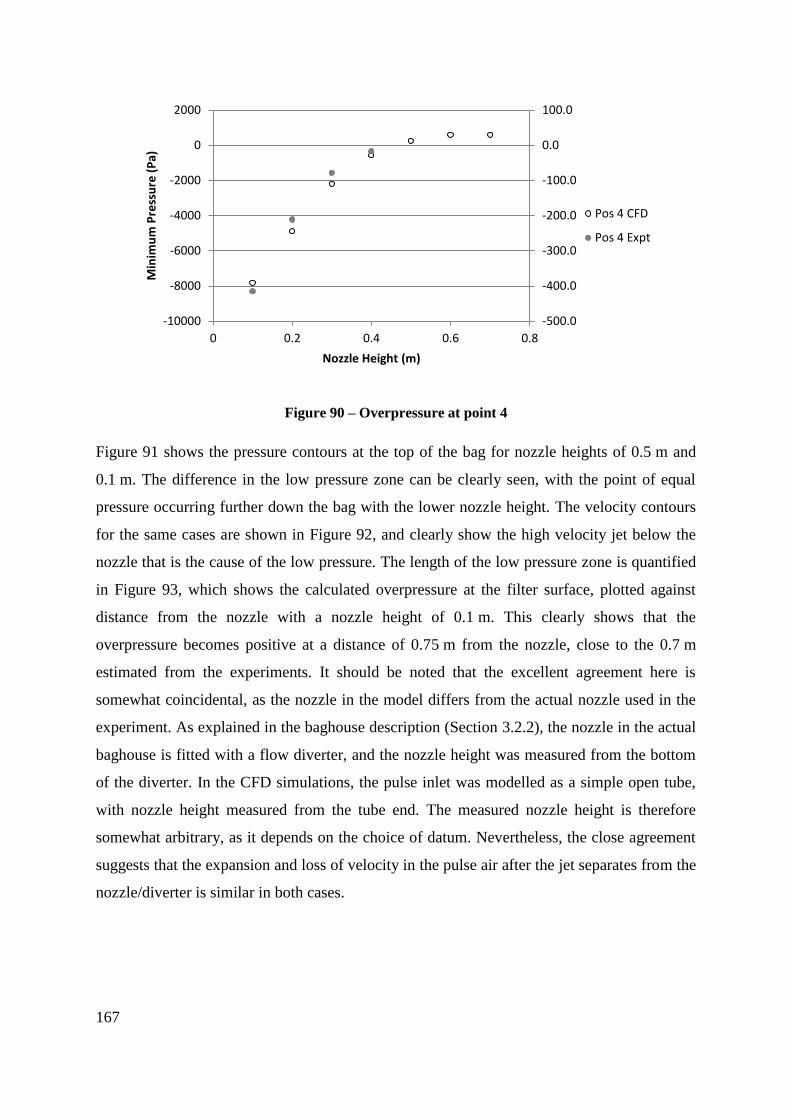
167
Figure 90 – Overpressure at point 4
Figure 91 shows the pressure contours at the top of the bag for nozzle heights of 0.5 m and
0.1 m. The difference in the low pressure zone can be clearly seen, with the point of equal
pressure occurring further down the bag with the lower nozzle height. The velocity contours
for the same cases are shown in Figure 92, and clearly show the high velocity jet below the
nozzle that is the cause of the low pressure. The length of the low pressure zone is quantified
in Figure 93, which shows the calculated overpressure at the filter surface, plotted against
distance from the nozzle with a nozzle height of 0.1 m. This clearly shows that the
overpressure becomes positive at a distance of 0.75 m from the nozzle, close to the 0.7 m
estimated from the experiments. It should be noted that the excellent agreement here is
somewhat coincidental, as the nozzle in the model differs from the actual nozzle used in the
experiment. As explained in the baghouse description (Section 3.2.2), the nozzle in the actual
baghouse is fitted with a flow diverter, and the nozzle height was measured from the bottom
of the diverter. In the CFD simulations, the pulse inlet was modelled as a simple open tube,
with nozzle height measured from the tube end. The measured nozzle height is therefore
somewhat arbitrary, as it depends on the choice of datum. Nevertheless, the close agreement
suggests that the expansion and loss of velocity in the pulse air after the jet separates from the
nozzle/diverter is similar in both cases.
-500.0
-400.0
-300.0
-200.0
-100.0
0.0
100.0
-10000
-8000
-6000
-4000
-2000
0
2000
0 0.2 0.4 0.6 0.8
Min
imu
m P
ress
ure
(P
a)
Nozzle Height (m)
Pos 4 CFD
Pos 4 Expt
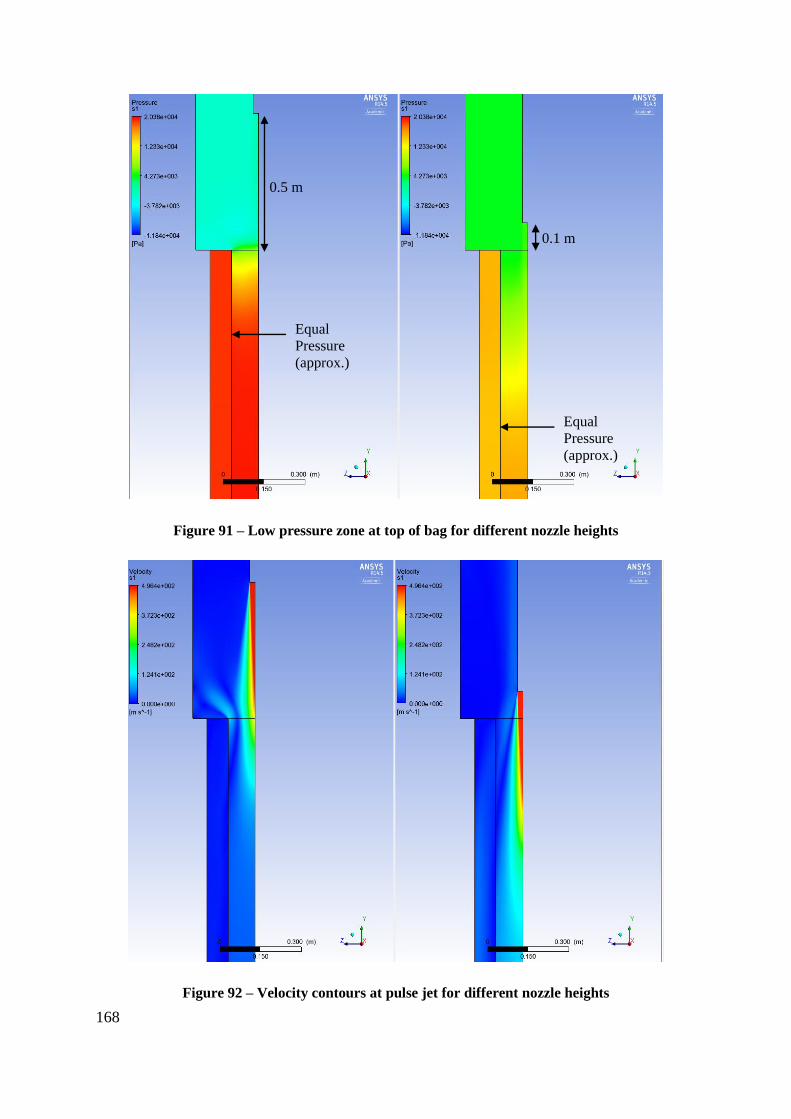
168
Figure 91 – Low pressure zone at top of bag for different nozzle heights
Figure 92 – Velocity contours at pulse jet for different nozzle heights
Equal
Pressure
(approx.)
Equal
Pressure
(approx.)
0.5 m
0.1 m
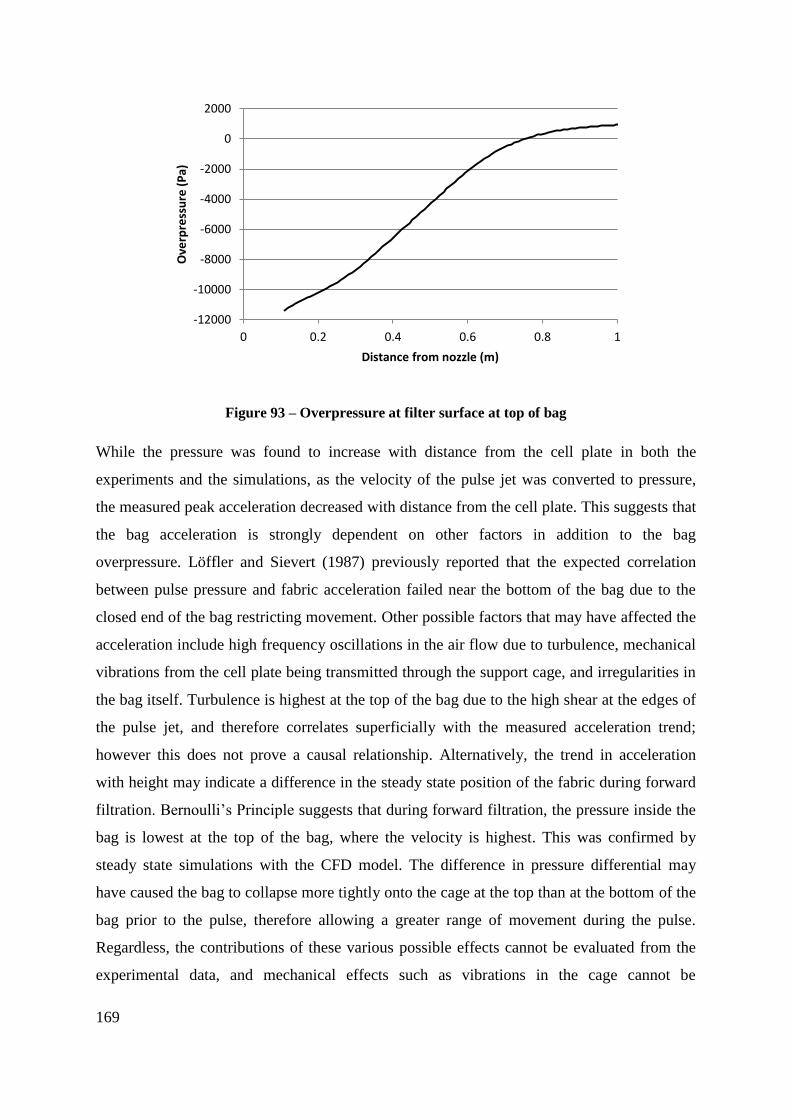
169
Figure 93 – Overpressure at filter surface at top of bag
While the pressure was found to increase with distance from the cell plate in both the
experiments and the simulations, as the velocity of the pulse jet was converted to pressure,
the measured peak acceleration decreased with distance from the cell plate. This suggests that
the bag acceleration is strongly dependent on other factors in addition to the bag
overpressure. Löffler and Sievert (1987) previously reported that the expected correlation
between pulse pressure and fabric acceleration failed near the bottom of the bag due to the
closed end of the bag restricting movement. Other possible factors that may have affected the
acceleration include high frequency oscillations in the air flow due to turbulence, mechanical
vibrations from the cell plate being transmitted through the support cage, and irregularities in
the bag itself. Turbulence is highest at the top of the bag due to the high shear at the edges of
the pulse jet, and therefore correlates superficially with the measured acceleration trend;
however this does not prove a causal relationship. Alternatively, the trend in acceleration
with height may indicate a difference in the steady state position of the fabric during forward
filtration. Bernoulli’s Principle suggests that during forward filtration, the pressure inside the
bag is lowest at the top of the bag, where the velocity is highest. This was confirmed by
steady state simulations with the CFD model. The difference in pressure differential may
have caused the bag to collapse more tightly onto the cage at the top than at the bottom of the
bag prior to the pulse, therefore allowing a greater range of movement during the pulse.
Regardless, the contributions of these various possible effects cannot be evaluated from the
experimental data, and mechanical effects such as vibrations in the cage cannot be
-12000
-10000
-8000
-6000
-4000
-2000
0
2000
0 0.2 0.4 0.6 0.8 1
Ove
rpre
ssu
re (
Pa)
Distance from nozzle (m)
170
incorporated into the model. It appears therefore that the model is not suitable for predicting
the acceleration of the filter bag during a pulse. Nevertheless, the trends in the acceleration
confirmed that lowering the pulse nozzle improved the cleaning effect in the middle and
lower regions of the bag.
5.8 Conclusions
The CFD model accurately predicts trends in the overpressure developed during a pulse.
Overpressure has been previously shown to be a useful measure of pulse effectiveness, so the
CFD model can therefore predict differences in performance between different baghouse
configurations. The pressure profiles predicted by the model appear reasonable throughout
the bag, with the low pressure zone near the nozzle and the increase in overpressure with
increasing distance from the nozzle being correctly predicted. The magnitude of the pressure
predictions was not conclusively validated by experiment, due to the slow response of the
available sensor. However, estimates of the pressure obtained by extrapolating the pressure
sensor output indicate that the pressures predicted by the model are reasonable. Further
experiments with a faster pressure sensor would be useful to confirm the accuracy of the
model. It was not possible to accurately predict the movement (acceleration) of the filter
fabric in the pilot scale baghouse, due to complications such as mechanical vibrations in the
support cage which could not be incorporated into the model.
171
6. Baghouse Simulations
6.1 Introduction
In the previous chapter a CFD model was developed to simulate the pilot scale baghouse at
the University of Canterbury. The model was validated against experimental data and found
to produce reasonable estimates of the effect of pulse system changes on the overpressure that
develops within the filter bag during a pulse. The model can now be used to investigate the
effects of a range of possible changes to the baghouse, in order to find the optimum
performance that can be achieved. The experiments in Chapters 3 and 4 investigated the
effects of various operating parameters on the overall pressure differentials in the baghouse.
With the CFD model, it is possible to look in more detail at specific regions within the
baghouse, and examine the effects of non-uniformity in the deposition and removal of
powder on the filter surface.
The filter cake in a baghouse may form unevenly, resulting in differences in cake thickness
and porosity over the bag surface. Löffler and Sievert (1987) noted that in their pilot scale
baghouse, the filter cake was thicker at the bottom of the bag than at the top. They attributed
this to the location of the inlet, which was below the bag, similar to the pilot scale baghouse
at the University of Canterbury. In contrast, Ellenbecker and Leith (1979) used a baghouse
with an entry near the top of the bags, and found the powder distribution to be fairly uniform,
although after repeated pulsing a short region of high cake density remained near the top of
the bag where pulsing was ineffective. It should be noted that both of these studies used dusts
with particle sizes much smaller than typical milk powders. Ellenbecker and Leith (1979)
used fly ash with a reported number-median size of 0.3 μm, while Löffler and Sievert (1987)
used limestone powder with a reported size of <10 μm. In contrast, the milk powders studied
in this thesis have a number-average particle size around 30 μm. Gravitational settling is
therefore expected to be much more significant in dairy baghouses.
As noted in Chapter 4, a short section at the top of the filter bag may fail to inflate during the
pulse. This has been observed by other researchers, and is thought to result in poor cleaning
near the top of the bag, particularly in systems where a venturi is used at the top of the bag
(Ellenbecker & Leith, 1979; Löffler & Sievert, 1987). Poor cleaning near the top of filter
bags has also been noted in the dairy industry (Gabites, 2007), and is a cause of concern, as
172
milk powder deposits in a baghouse can become degraded over time due to Maillard
browning and other chemical processes, or can migrate through the filter to cause dust
emissions in the outlet stream. Degraded deposits can then break away and contaminate the
product stream, reducing the overall product quality (Winchester, 2010). It was observed in
Section 5.7.2 that the length of the non-inflating region is dependent on the distance between
the pulse nozzle and the top of the filter bag.
In order to achieve stable pressure differentials in the long term, a minimum cleaning
effectiveness must be maintained; otherwise the pressure differentials increase without limit
(Bakke, 1974). This was demonstrated in Section 4.3.1, with unstable pressure differentials
occurring in the pilot scale baghouse when the pulse tank pressure was reduced to 2 bar.
Several authors have used various measures of pressure developed inside the bag during a
pulse to predict the cleaning effect of the pulse (Leith & Ellenbecker, 1980; Lu & Tsai,
1998). Cake removal is commonly understood to be accomplished through a combination of
fabric acceleration and reversed air flow (Löffler & Sievert, 1987; Lu & Tsai, 1998; Simon et
al., 2007). Both of these mechanisms depend on pressurisation of the bag during the pulse, so
the pressure provides a good single measure of pulse effectiveness.
In this study, the CFD model described in the previous chapter was used to simulate the air
flows in the pilot scale baghouse during forward filtration and during a cleaning pulse. In
forward filtration, particle trajectories were calculated to predict the mass distribution of the
filter cake. For pulsing simulations, the influences of the nozzle height and diameter, the
pulse air pressure, and the resistance of the filter on the effectiveness of pulse cleaning at
various positions on the bag were examined. The minimum pressure required to achieve
stable operation was estimated and used to evaluate the pulse performance at various levels of
the above parameters.
6.2 Methods
The starting point for the simulations carried out in this chapter was the CFD model
described in Chapter 5. The model was used to simulate forward flow and predict the powder
deposition patterns, and was also adapted to simulate a range of possible changes to the
pulsing setup to determine the effect of these changes on the pulse effectiveness.
173
Firstly, steady state isothermal simulations with no pulse flow were conducted to find the
flow field for forward filtration and provide initial conditions for the transient simulations.
The pulse inlet flow was set to zero for these simulations. The physical timescale for the
steady state simulations was set to 0.001 seconds, and convergence was determined by
residual targets of 1.0×10⁻⁵
and boundary conservation targets of 1%. Secondly, a range of
transient simulations were conducted, some modelling forward filtration to determine particle
trajectories, and some modelling a pulse to determine the effects of changes to pulse
parameters. The parameters investigated were the pulse pressure, pulse nozzle height, and
pulse nozzle diameter. These transient simulations are described below under the relevant
subheadings. Convergence was again determined by a residual target of 1.0×10⁻⁵
. For the
particle tracking simulations the time-step was set to 0.005 seconds, while for the pulsing
simulations the time-step was set to 0.0001 seconds. This was shown in Chapter 5 to
accurately resolve the pulse, providing stable, time-step independent solutions.
As in the previous chapter, the baghouse outlet was modelled with a fixed velocity boundary
condition. The flow direction was set normal to the boundary, and the velocity was set to
0.3 m.s-1
. This provided a filtration velocity of approximately 0.022 m.s-1
, which is similar to
the filtration velocity achieved in the pilot scale experiments described in Chapters 3 and 4,
although somewhat lower than the filtration velocity used in typical industrial baghouses.
Once again the baghouse inlet was modelled using an opening boundary condition with a
fixed pressure (set to the reference pressure of 1 atm). The opening boundary condition
allowed for flow in either direction, and allowed the software to calculate the inlet flow to
balance the fixed outlet and pulse inlet boundaries.
For the pulsing simulations, the pulse inlet boundary condition was modelled using a total
pressure boundary condition. The total pressure was ramped up linearly from zero to a
maximum value (5 bar gauge for the nozzle height and diameter and filter resistance
simulations, variable for the pulse pressure simulations) over the first 0.02 s of the
simulation, then held constant for the remainder of the simulation (an additional 0.08 s,
giving a total duration of 0.1 s). As mentioned in Chapter 5, ramping down the pulse flow at
the end of the pulse caused instability in the model, so the ramping down phase was not
simulated in this chapter. For the forward filtration simulations (steady state and particle
tracking), the pulse inlet flow was simply set to zero.
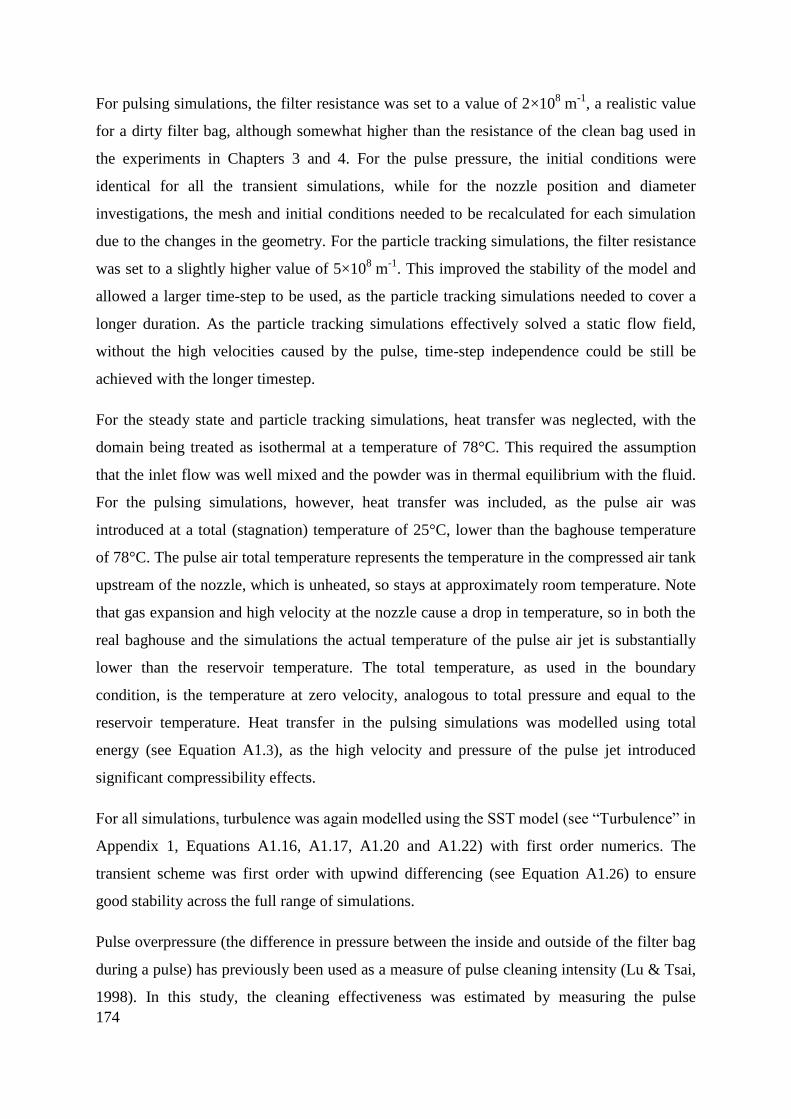
174
For pulsing simulations, the filter resistance was set to a value of 2×10⁸ m
-1, a realistic value
for a dirty filter bag, although somewhat higher than the resistance of the clean bag used in
the experiments in Chapters 3 and 4. For the pulse pressure, the initial conditions were
identical for all the transient simulations, while for the nozzle position and diameter
investigations, the mesh and initial conditions needed to be recalculated for each simulation
due to the changes in the geometry. For the particle tracking simulations, the filter resistance
was set to a slightly higher value of 5×10⁸ m
-1. This improved the stability of the model and
allowed a larger time-step to be used, as the particle tracking simulations needed to cover a
longer duration. As the particle tracking simulations effectively solved a static flow field,
without the high velocities caused by the pulse, time-step independence could be still be
achieved with the longer timestep.
For the steady state and particle tracking simulations, heat transfer was neglected, with the
domain being treated as isothermal at a temperature of 78°C. This required the assumption
that the inlet flow was well mixed and the powder was in thermal equilibrium with the fluid.
For the pulsing simulations, however, heat transfer was included, as the pulse air was
introduced at a total (stagnation) temperature of 25°C, lower than the baghouse temperature
of 78°C. The pulse air total temperature represents the temperature in the compressed air tank
upstream of the nozzle, which is unheated, so stays at approximately room temperature. Note
that gas expansion and high velocity at the nozzle cause a drop in temperature, so in both the
real baghouse and the simulations the actual temperature of the pulse air jet is substantially
lower than the reservoir temperature. The total temperature, as used in the boundary
condition, is the temperature at zero velocity, analogous to total pressure and equal to the
reservoir temperature. Heat transfer in the pulsing simulations was modelled using total
energy (see Equation A1.3), as the high velocity and pressure of the pulse jet introduced
significant compressibility effects.
For all simulations, turbulence was again modelled using the SST model (see “Turbulence” in
Appendix 1, Equations A1.16, A1.17, A1.20 and A1.22) with first order numerics. The
transient scheme was first order with upwind differencing (see Equation A1.26) to ensure
good stability across the full range of simulations.
Pulse overpressure (the difference in pressure between the inside and outside of the filter bag
during a pulse) has previously been used as a measure of pulse cleaning intensity (Lu & Tsai,
1998). In this study, the cleaning effectiveness was estimated by measuring the pulse
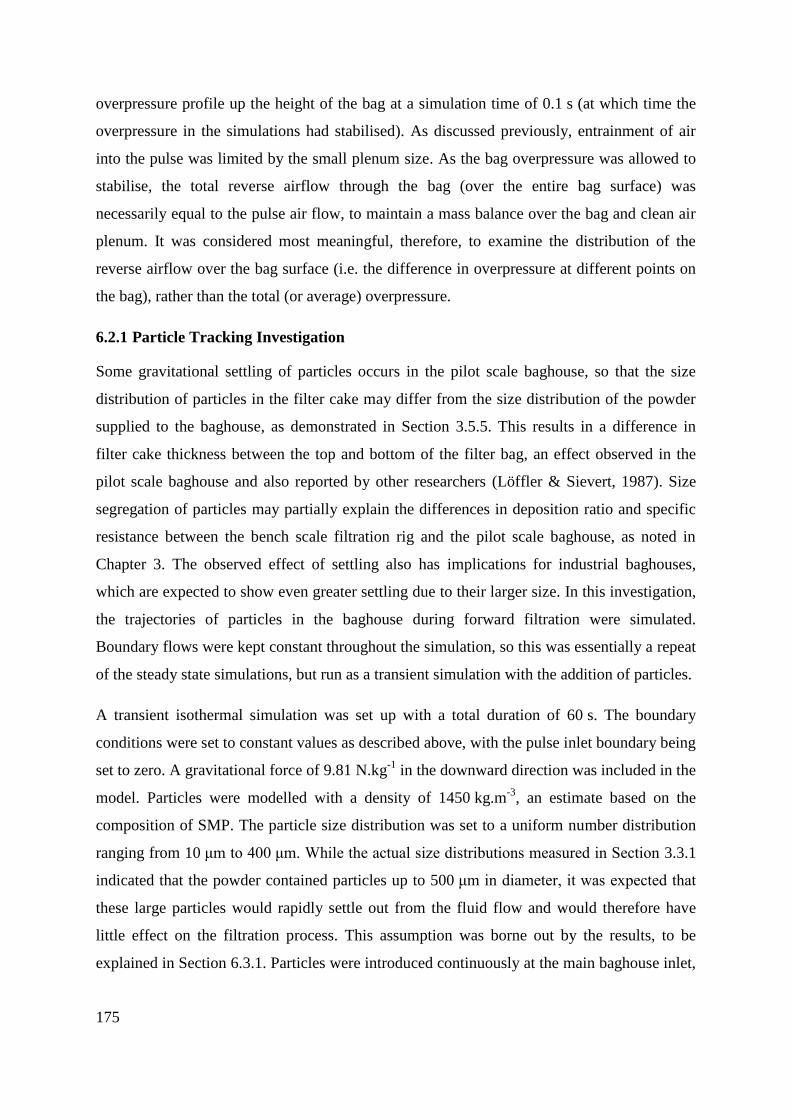
175
overpressure profile up the height of the bag at a simulation time of 0.1 s (at which time the
overpressure in the simulations had stabilised). As discussed previously, entrainment of air
into the pulse was limited by the small plenum size. As the bag overpressure was allowed to
stabilise, the total reverse airflow through the bag (over the entire bag surface) was
necessarily equal to the pulse air flow, to maintain a mass balance over the bag and clean air
plenum. It was considered most meaningful, therefore, to examine the distribution of the
reverse airflow over the bag surface (i.e. the difference in overpressure at different points on
the bag), rather than the total (or average) overpressure.
6.2.1 Particle Tracking Investigation
Some gravitational settling of particles occurs in the pilot scale baghouse, so that the size
distribution of particles in the filter cake may differ from the size distribution of the powder
supplied to the baghouse, as demonstrated in Section 3.5.5. This results in a difference in
filter cake thickness between the top and bottom of the filter bag, an effect observed in the
pilot scale baghouse and also reported by other researchers (Löffler & Sievert, 1987). Size
segregation of particles may partially explain the differences in deposition ratio and specific
resistance between the bench scale filtration rig and the pilot scale baghouse, as noted in
Chapter 3. The observed effect of settling also has implications for industrial baghouses,
which are expected to show even greater settling due to their larger size. In this investigation,
the trajectories of particles in the baghouse during forward filtration were simulated.
Boundary flows were kept constant throughout the simulation, so this was essentially a repeat
of the steady state simulations, but run as a transient simulation with the addition of particles.
A transient isothermal simulation was set up with a total duration of 60 s. The boundary
conditions were set to constant values as described above, with the pulse inlet boundary being
set to zero. A gravitational force of 9.81 N.kg-1
in the downward direction was included in the
model. Particles were modelled with a density of 1450 kg.m-3
, an estimate based on the
composition of SMP. The particle size distribution was set to a uniform number distribution
ranging from 10 μm to 400 μm. While the actual size distributions measured in Section 3.3.1
indicated that the powder contained particles up to 500 μm in diameter, it was expected that
these large particles would rapidly settle out from the fluid flow and would therefore have
little effect on the filtration process. This assumption was borne out by the results, to be
explained in Section 6.3.1. Particles were introduced continuously at the main baghouse inlet,
176
with a total mass flow of 1.0 g.s-1
. The flow profile was assumed to be independent of the
presence of particles, so the particles were only one-way coupled to the flow.
6.2.2 Pulse Pressure
The pulse pressure is relatively easy to change in existing baghouses, and is known to have
an effect on the pulse effectiveness. In fact, increasing the compressed air supply pressure is a
common way of dealing with high pressure differentials in industrial baghouses. This is
usually done with a heuristic approach, as the actual gain in performance can be difficult to
quantify. The simulations conducted here aimed to quantify the effect of pulse pressure on
the pilot scale baghouse, and thus provide a more detailed understanding of baghouse
performance.
In these simulations, the pulse inlet was modelled using a total pressure boundary condition.
The total pressure was varied from 1 bar gauge (100000 Pa) to 7 bar gauge (700000 Pa) in
1 bar increments. The mesh and initial conditions were the same for all simulations, and the
other boundary conditions were as described above.
6.2.3 Pulse Nozzle Height
The model was used to investigate the effect of raising or lowering the pulsing lance. While
the nozzle height did not appear to have an effect on the overall pressure differentials in the
experiments described in Section 4.3.2, it was thought that the simulation may provide more
detailed information about localised effects of the pulse, including the low pressure zone
occurring at the top of the bag. Some simulations at a range of nozzle heights were already
carried out for the model validation, described in Section 5.7. Those results were included in
this analysis, with the addition of some further simulations. The new simulations re-used the
meshes from the validation simulations, to ensure that the results were comparable. As
explained in Section 5.7, these had nozzle heights ranging from 0.1 to 0.7 m in 0.1 m
increments, but were identical throughout most of the fluid domain.
The pulse inlet was again modelled using a total pressure boundary condition. The total
pressure was ramped up to a peak value of 5 bar (relative pressure). This was chosen to
represent the typical pulse pressure in the actual baghouse, which is usually between 5 and
6 bar gauge.
177
6.2.4 Pulse Nozzle Diameter
Various types of nozzle are used in industrial baghouses. The size and shape of these can
vary significantly, which affects the mass flow of air that can be attained by the pulse jet. A
smaller nozzle results in a lower volume of air, all else being equal. In this set of simulations,
the diameter of the pulse inlet was changed to vary the effective inlet area. A series of meshes
were created, with nozzle diameters varying from 0.02 m to 0.06 m in 0.01 m increments,
with the nozzle height set at 0.5 m. As with the previous simulations, the nozzle was
modelled as a simple open tube, omitting the flow diverter used in the actual baghouse. The
number of mesh faces across the pulse inlet boundary was adjusted to maintain the mesh cell
size in this region, while the mesh throughout the lower regions of the baghouse was identical
to previous simulations. The pulse inlet boundary was modelled using a total pressure
boundary condition, again set to 5 bar gauge for all runs.
6.2.5 Filter resistance
The overall filter resistance in a baghouse is subject to both short and long term changes. In
the short term, the deposition of powder during every filtration cycle increases the cake
resistance. The cake resistance can be much larger than the resistance of the clean bag, so the
total resistance may change by an order of magnitude. The change is cyclic, as the filter cake
is regularly removed by the pulse. In the longer term, gradual blinding of the filter causes a
continual, non-cyclic increase in the resistance, as blinding is generally not remedied by the
pulse.
All previous pulsing simulations used a filter resistance of 7.0×10⁷, based on the resistance of
a clean bag measured in Chapter 3. The filter resistance in an industrial baghouse is expected
to be higher than this value for most of a production season, due to the cumulative effects of
blinding. This is likely to have an effect on both the magnitude and distribution of the pulse
overpressure. Firstly, the filtration equation (Equation 2.8) shows that for an equivalent pulse
mass flow, a higher average pressure differential over the bag surface can be expected. The
resulting increase in pressure in the bag may also alter the distribution of the reverse flow
over the bag surface.
In this study, simulations were run with bag resistances of 7.0×10⁷, 1.0×10
8, 2.0×10
8, and
5.0×10⁸. The problem setup was otherwise the same as the base simulation, with a pulse
pressure ramped up to 5 bar, a nozzle diameter of 0.04 m, and a nozzle height of 0.5 m.
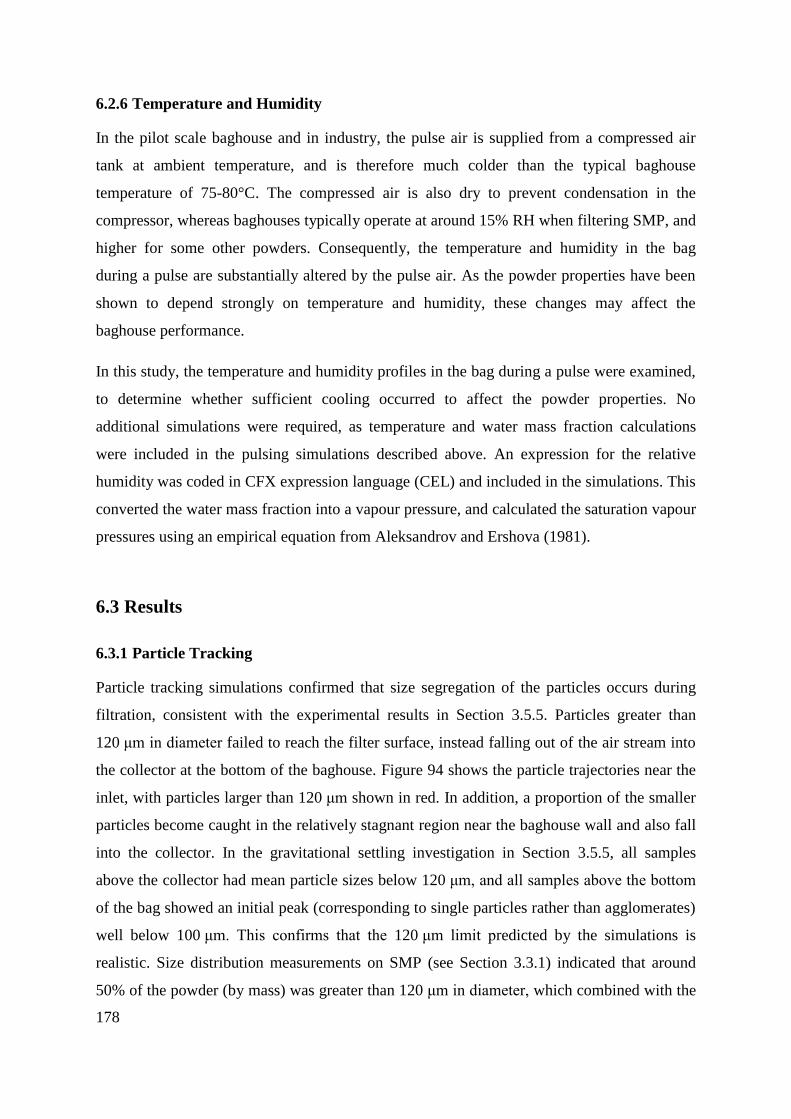
178
6.2.6 Temperature and Humidity
In the pilot scale baghouse and in industry, the pulse air is supplied from a compressed air
tank at ambient temperature, and is therefore much colder than the typical baghouse
temperature of 75-80°C. The compressed air is also dry to prevent condensation in the
compressor, whereas baghouses typically operate at around 15% RH when filtering SMP, and
higher for some other powders. Consequently, the temperature and humidity in the bag
during a pulse are substantially altered by the pulse air. As the powder properties have been
shown to depend strongly on temperature and humidity, these changes may affect the
baghouse performance.
In this study, the temperature and humidity profiles in the bag during a pulse were examined,
to determine whether sufficient cooling occurred to affect the powder properties. No
additional simulations were required, as temperature and water mass fraction calculations
were included in the pulsing simulations described above. An expression for the relative
humidity was coded in CFX expression language (CEL) and included in the simulations. This
converted the water mass fraction into a vapour pressure, and calculated the saturation vapour
pressures using an empirical equation from Aleksandrov and Ershova (1981).
6.3 Results
6.3.1 Particle Tracking
Particle tracking simulations confirmed that size segregation of the particles occurs during
filtration, consistent with the experimental results in Section 3.5.5. Particles greater than
120 μm in diameter failed to reach the filter surface, instead falling out of the air stream into
the collector at the bottom of the baghouse. Figure 94 shows the particle trajectories near the
inlet, with particles larger than 120 μm shown in red. In addition, a proportion of the smaller
particles become caught in the relatively stagnant region near the baghouse wall and also fall
into the collector. In the gravitational settling investigation in Section 3.5.5, all samples
above the collector had mean particle sizes below 120 μm, and all samples above the bottom
of the bag showed an initial peak (corresponding to single particles rather than agglomerates)
well below 100 μm. This confirms that the 120 μm limit predicted by the simulations is
realistic. Size distribution measurements on SMP (see Section 3.3.1) indicated that around
50% of the powder (by mass) was greater than 120 μm in diameter, which combined with the
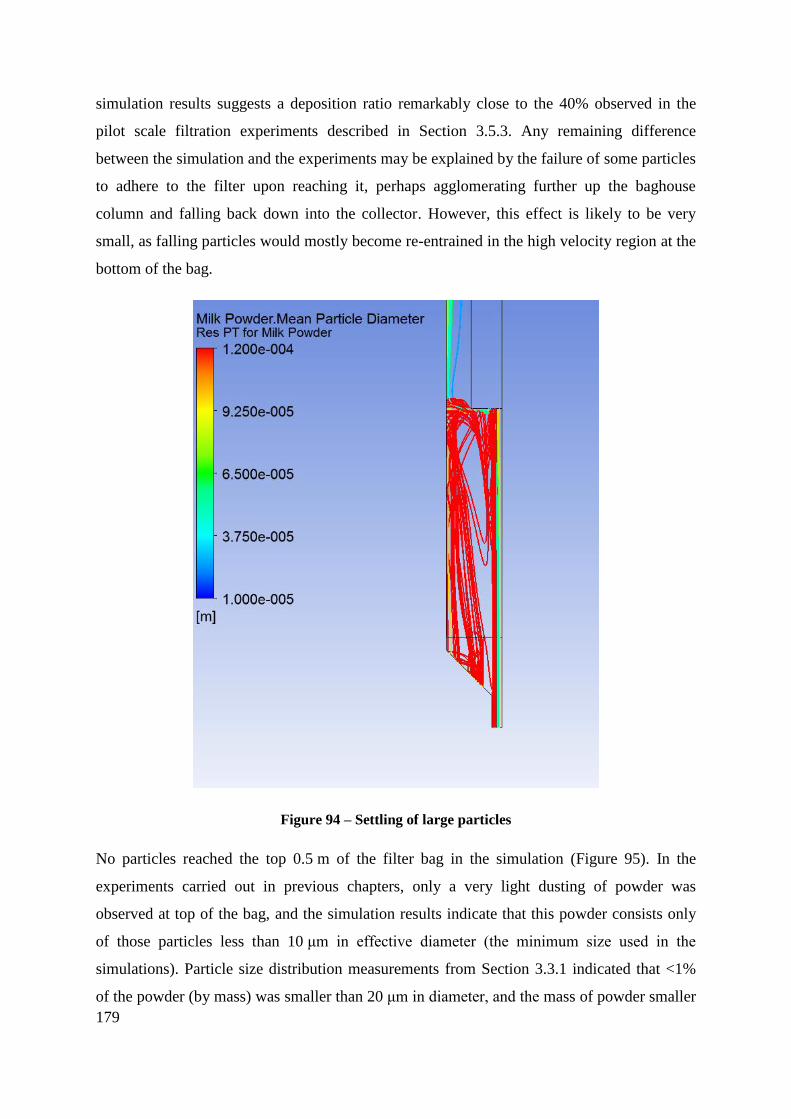
179
simulation results suggests a deposition ratio remarkably close to the 40% observed in the
pilot scale filtration experiments described in Section 3.5.3. Any remaining difference
between the simulation and the experiments may be explained by the failure of some particles
to adhere to the filter upon reaching it, perhaps agglomerating further up the baghouse
column and falling back down into the collector. However, this effect is likely to be very
small, as falling particles would mostly become re-entrained in the high velocity region at the
bottom of the bag.
Figure 94 – Settling of large particles
No particles reached the top 0.5 m of the filter bag in the simulation (Figure 95). In the
experiments carried out in previous chapters, only a very light dusting of powder was
observed at top of the bag, and the simulation results indicate that this powder consists only
of those particles less than 10 μm in effective diameter (the minimum size used in the
simulations). Particle size distribution measurements from Section 3.3.1 indicated that <1%
of the powder (by mass) was smaller than 20 μm in diameter, and the mass of powder smaller
180
than 10 μm was negligible, although it is possible that these very small particles simply
became agglomerated during the particle size measurements and were therefore not detected.
In the experiments in Chapter 4, it was noted that a low pressure zone occurred at the top of
the bag, where the bag failed to inflate during a pulse, especially at low nozzle positions. The
low pressure zone was considered a potential operational problem, due to poor cleaning and
accumulation of powder in this region. The particle trajectories predicted by the model
indicate that this is not a problem in the pilot scale baghouse, as virtually no powder deposits
near the top of the bag. This helps to explain why the experimental investigation into pulse
nozzle height (Section 4.3.2) found no significant effect on the pressure differentials
remaining after the pulse. It should be noted however that the elutriation velocity (air velocity
in the filtration chamber) in the pilot scale baghouse is much lower than in industrial
baghouses, as explained in Section 3.5.5. In addition, industrial baghouses must operate
continuously for weeks at a time, and over such a long period, even a tiny amount of
deposition at the top of the bags may accumulate sufficiently to have a significant effect. The
low pressure zone at the top of the bag therefore cannot be ruled out as a potential source of
operational problems in industrial baghouses.
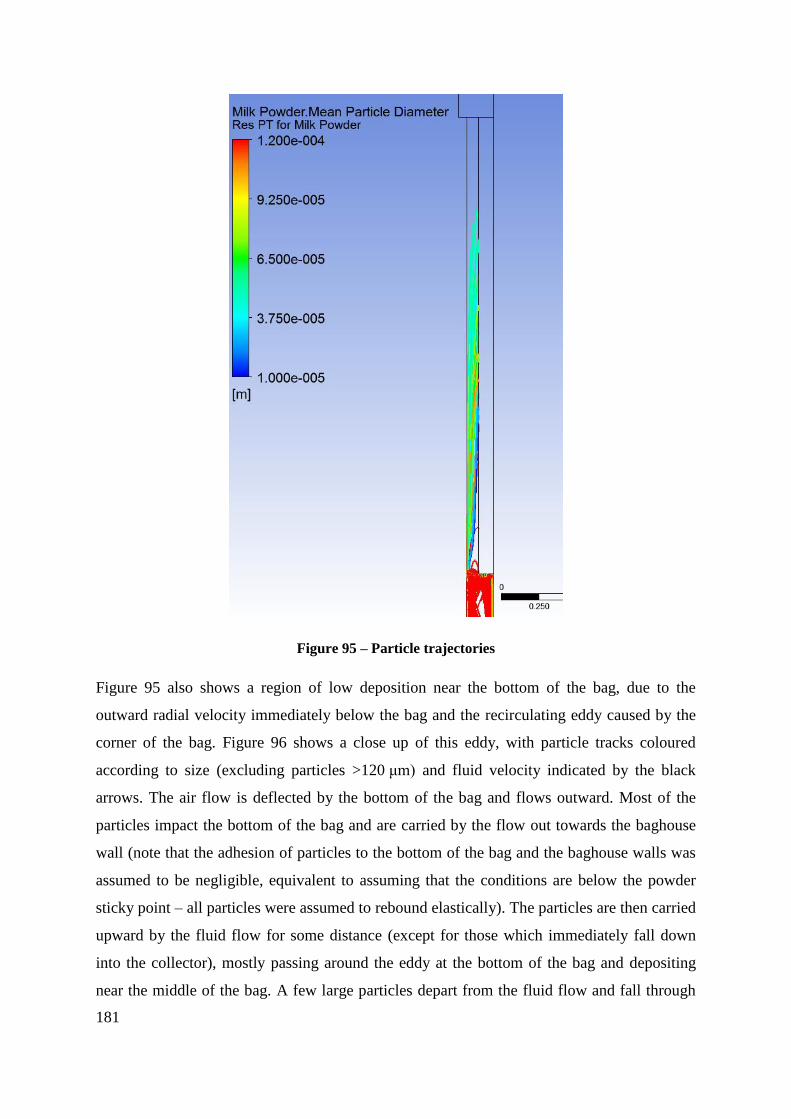
181
Figure 95 – Particle trajectories
Figure 95 also shows a region of low deposition near the bottom of the bag, due to the
outward radial velocity immediately below the bag and the recirculating eddy caused by the
corner of the bag. Figure 96 shows a close up of this eddy, with particle tracks coloured
according to size (excluding particles >120 μm) and fluid velocity indicated by the black
arrows. The air flow is deflected by the bottom of the bag and flows outward. Most of the
particles impact the bottom of the bag and are carried by the flow out towards the baghouse
wall (note that the adhesion of particles to the bottom of the bag and the baghouse walls was
assumed to be negligible, equivalent to assuming that the conditions are below the powder
sticky point – all particles were assumed to rebound elastically). The particles are then carried
upward by the fluid flow for some distance (except for those which immediately fall down
into the collector), mostly passing around the eddy at the bottom of the bag and depositing
near the middle of the bag. A few large particles depart from the fluid flow and fall through
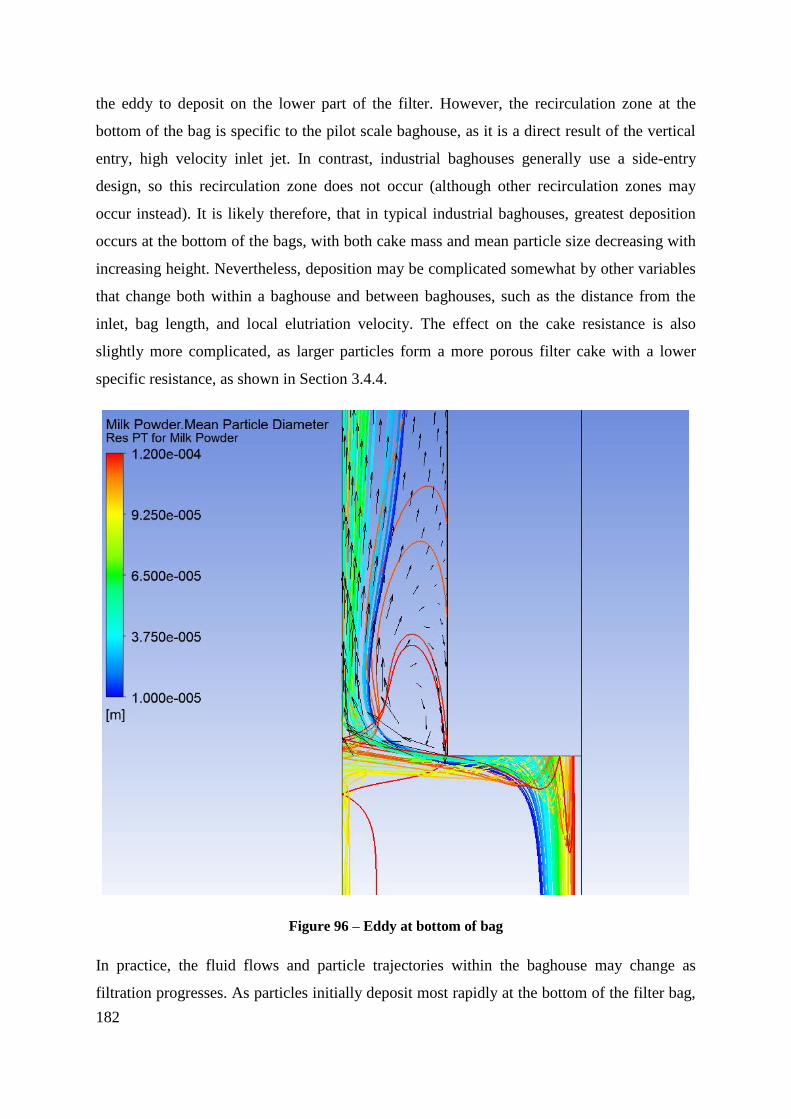
182
the eddy to deposit on the lower part of the filter. However, the recirculation zone at the
bottom of the bag is specific to the pilot scale baghouse, as it is a direct result of the vertical
entry, high velocity inlet jet. In contrast, industrial baghouses generally use a side-entry
design, so this recirculation zone does not occur (although other recirculation zones may
occur instead). It is likely therefore, that in typical industrial baghouses, greatest deposition
occurs at the bottom of the bags, with both cake mass and mean particle size decreasing with
increasing height. Nevertheless, deposition may be complicated somewhat by other variables
that change both within a baghouse and between baghouses, such as the distance from the
inlet, bag length, and local elutriation velocity. The effect on the cake resistance is also
slightly more complicated, as larger particles form a more porous filter cake with a lower
specific resistance, as shown in Section 3.4.4.
Figure 96 – Eddy at bottom of bag
In practice, the fluid flows and particle trajectories within the baghouse may change as
filtration progresses. As particles initially deposit most rapidly at the bottom of the filter bag,
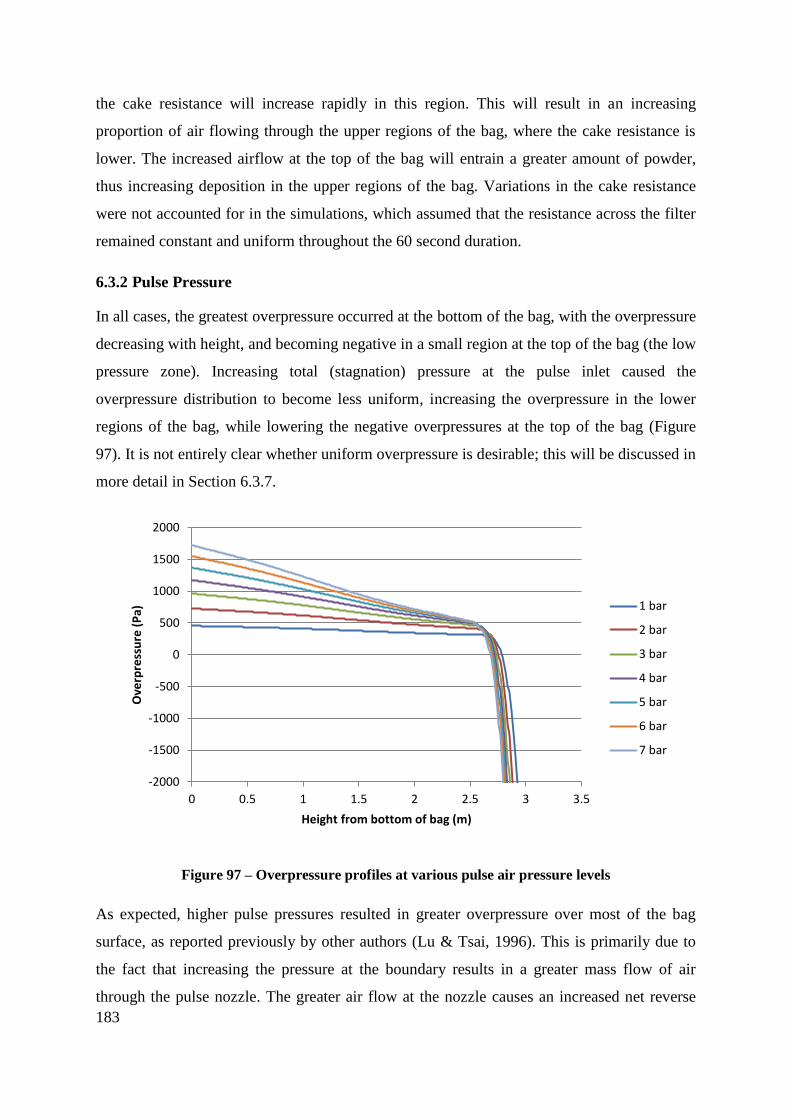
183
the cake resistance will increase rapidly in this region. This will result in an increasing
proportion of air flowing through the upper regions of the bag, where the cake resistance is
lower. The increased airflow at the top of the bag will entrain a greater amount of powder,
thus increasing deposition in the upper regions of the bag. Variations in the cake resistance
were not accounted for in the simulations, which assumed that the resistance across the filter
remained constant and uniform throughout the 60 second duration.
6.3.2 Pulse Pressure
In all cases, the greatest overpressure occurred at the bottom of the bag, with the overpressure
decreasing with height, and becoming negative in a small region at the top of the bag (the low
pressure zone). Increasing total (stagnation) pressure at the pulse inlet caused the
overpressure distribution to become less uniform, increasing the overpressure in the lower
regions of the bag, while lowering the negative overpressures at the top of the bag (Figure
97). It is not entirely clear whether uniform overpressure is desirable; this will be discussed in
more detail in Section 6.3.7.
Figure 97 – Overpressure profiles at various pulse air pressure levels
As expected, higher pulse pressures resulted in greater overpressure over most of the bag
surface, as reported previously by other authors (Lu & Tsai, 1996). This is primarily due to
the fact that increasing the pressure at the boundary results in a greater mass flow of air
through the pulse nozzle. The greater air flow at the nozzle causes an increased net reverse
-2000
-1500
-1000
-500
0
500
1000
1500
2000
0 0.5 1 1.5 2 2.5 3 3.5
Ove
rpre
ssu
re (
Pa)
Height from bottom of bag (m)
1 bar
2 bar
3 bar
4 bar
5 bar
6 bar
7 bar
184
flow of air through the filter (from the clean side to the dirty side) and a higher average
overpressure according to the filtration equation (Equation 2.8). Normalising the overpressure
by dividing by the total mass flow of the pulse (to separate the effect of flow distribution
from the effect of total mass flow) still left a small increase in overpressure over most of the
bag surface, balanced by a very large decrease in overpressure over a small area at the top of
the bag (the low pressure zone). If powder deposition in the low pressure zone is negligible,
as suggested by the particle tracking simulations, then optimum cleaning effectiveness will be
achieved with a high pulse pressure. It should be noted that this contrasts with the results of
Lu and Tsai (1996), who found that the greatest improvements in cleaning effect occurred in
the upper regions of the filter bag. This is most likely due to the many differences in
geometry between the pilot scale baghouse modelled here and the baghouse used in that
study, which had a much longer bag among other differences. Those authors also do not
report on the low pressure zone at the top of the bag – their reported pressure measurements
are all taken further than 0.9 m from the nozzle.
The length of the low pressure zone at the top of the bag was measured downward from the
top of the bag to the point where the overpressure first became positive (the point where the
overpressure profile crosses zero in Figure 97). Increasing the pulse pressure resulted in a
slight increase in the length of the low pressure zone. This can be seen in Figure 97, but is
shown more clearly in Figure 98. The effect was small, with a variation in the length of only
0.1 m over the full 6 bar pressure range. As discussed in Section 4.3.2, the low pressure zone
may contribute to fouling in industrial baghouses (despite this apparently not occurring in the
pilot scale baghouse), in which case the optimum nozzle height may depend on the pressure
of the pulse air. In industry, increasing the pulse pressure is used as a short term solution to
overcome excessive blinding (until a longer term solution can be implemented). The
associated increase in the length of the low pressure zone may increase fouling at the top of
the bag, which carries an increased risk of product degradation. However, the effect is small
enough that it is probably inconsequential; a typical change would be to increase the pulse
pressure from 6 bar to 7 bar - in this case the low pressure zone would increase in length by
only 0.02 m. This is a very small difference relative to a typical bag length of around 5 m,
and it is therefore very unlikely that any noticeable increase in fouling would be observed.
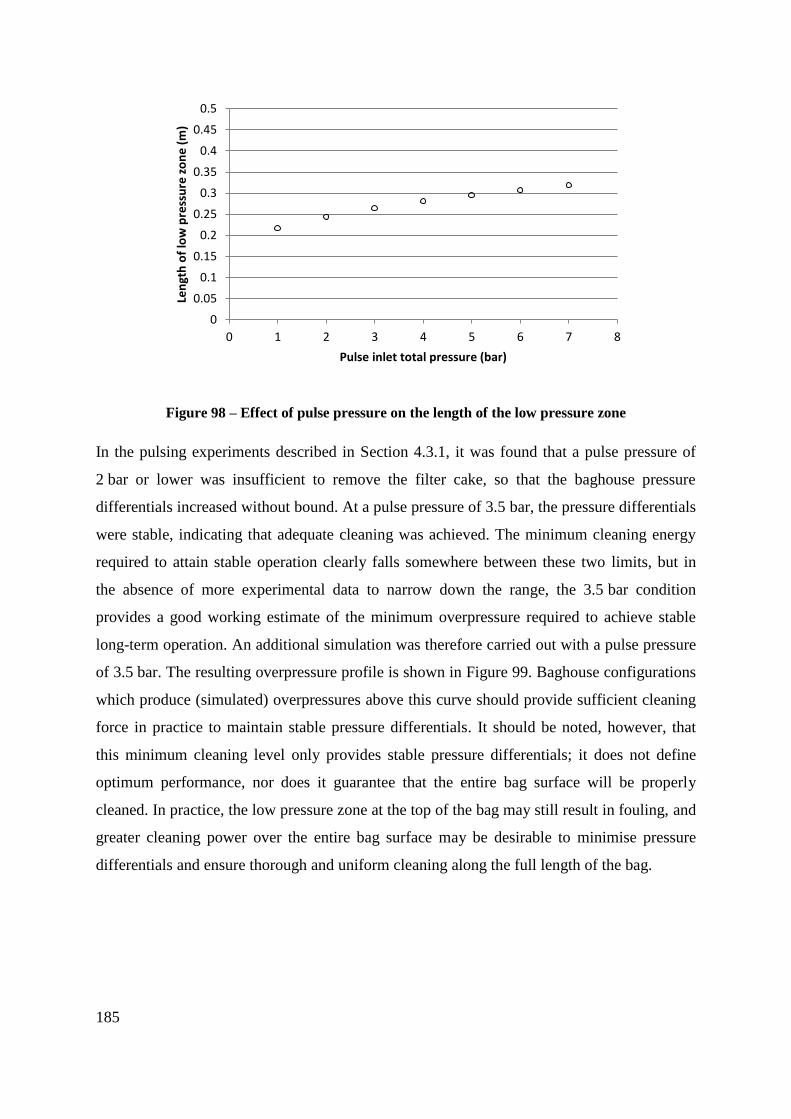
185
Figure 98 – Effect of pulse pressure on the length of the low pressure zone
In the pulsing experiments described in Section 4.3.1, it was found that a pulse pressure of
2 bar or lower was insufficient to remove the filter cake, so that the baghouse pressure
differentials increased without bound. At a pulse pressure of 3.5 bar, the pressure differentials
were stable, indicating that adequate cleaning was achieved. The minimum cleaning energy
required to attain stable operation clearly falls somewhere between these two limits, but in
the absence of more experimental data to narrow down the range, the 3.5 bar condition
provides a good working estimate of the minimum overpressure required to achieve stable
long-term operation. An additional simulation was therefore carried out with a pulse pressure
of 3.5 bar. The resulting overpressure profile is shown in Figure 99. Baghouse configurations
which produce (simulated) overpressures above this curve should provide sufficient cleaning
force in practice to maintain stable pressure differentials. It should be noted, however, that
this minimum cleaning level only provides stable pressure differentials; it does not define
optimum performance, nor does it guarantee that the entire bag surface will be properly
cleaned. In practice, the low pressure zone at the top of the bag may still result in fouling, and
greater cleaning power over the entire bag surface may be desirable to minimise pressure
differentials and ensure thorough and uniform cleaning along the full length of the bag.
0
0.05
0.1
0.15
0.2
0.25
0.3
0.35
0.4
0.45
0.5
0 1 2 3 4 5 6 7 8
Len
gth
of
low
pre
ssu
re z
on
e (
m)
Pulse inlet total pressure (bar)
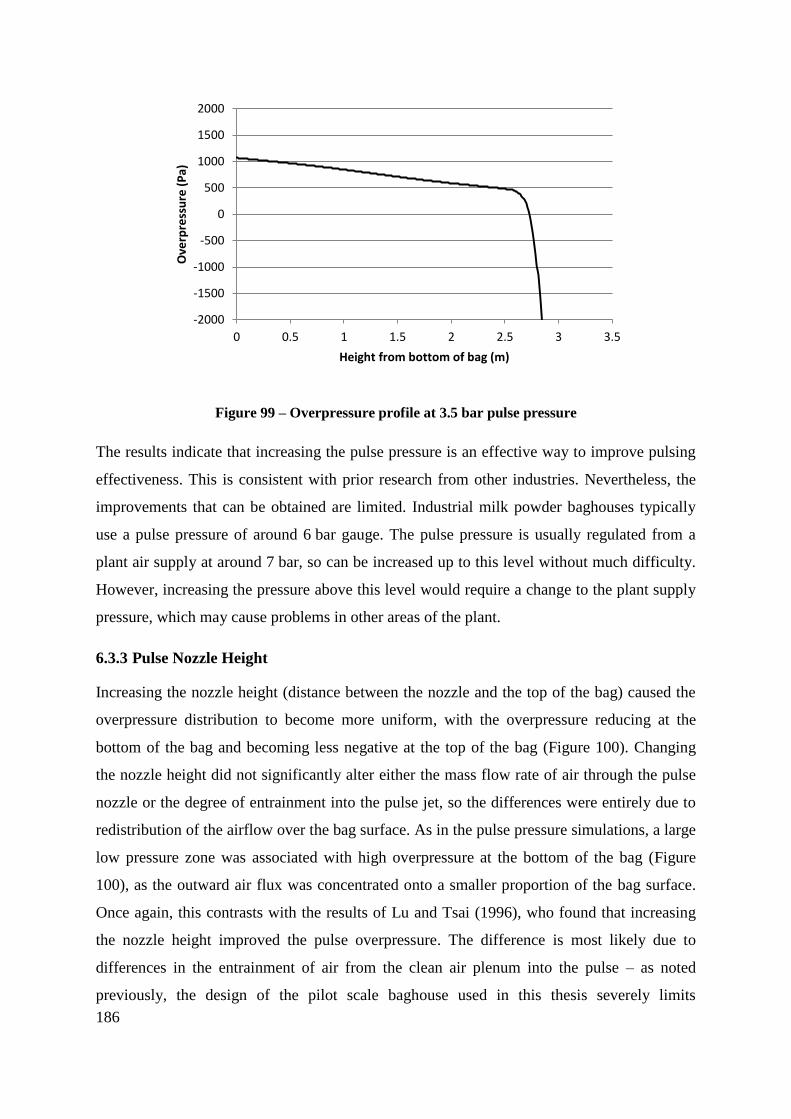
186
Figure 99 – Overpressure profile at 3.5 bar pulse pressure
The results indicate that increasing the pulse pressure is an effective way to improve pulsing
effectiveness. This is consistent with prior research from other industries. Nevertheless, the
improvements that can be obtained are limited. Industrial milk powder baghouses typically
use a pulse pressure of around 6 bar gauge. The pulse pressure is usually regulated from a
plant air supply at around 7 bar, so can be increased up to this level without much difficulty.
However, increasing the pressure above this level would require a change to the plant supply
pressure, which may cause problems in other areas of the plant.
6.3.3 Pulse Nozzle Height
Increasing the nozzle height (distance between the nozzle and the top of the bag) caused the
overpressure distribution to become more uniform, with the overpressure reducing at the
bottom of the bag and becoming less negative at the top of the bag (Figure 100). Changing
the nozzle height did not significantly alter either the mass flow rate of air through the pulse
nozzle or the degree of entrainment into the pulse jet, so the differences were entirely due to
redistribution of the airflow over the bag surface. As in the pulse pressure simulations, a large
low pressure zone was associated with high overpressure at the bottom of the bag (Figure
100), as the outward air flux was concentrated onto a smaller proportion of the bag surface.
Once again, this contrasts with the results of Lu and Tsai (1996), who found that increasing
the nozzle height improved the pulse overpressure. The difference is most likely due to
differences in the entrainment of air from the clean air plenum into the pulse – as noted
previously, the design of the pilot scale baghouse used in this thesis severely limits
-2000
-1500
-1000
-500
0
500
1000
1500
2000
0 0.5 1 1.5 2 2.5 3 3.5
Ove
rpre
ssu
re (
Pa)
Height from bottom of bag (m)

187
entrainment, while in most other baghouses, entrainment plays an important role in the pulse.
This will be discussed further in Section 6.3.7.
Figure 100 – Overpressure profiles at various nozzle heights
Unsurprisingly, the length of the low pressure zone (measured from the top of the bag as in
Section 6.3.2) decreased with increasing nozzle height (Figure 101). The effect on the bag
was very large, with the low pressure zone reaching 0.65 m at a nozzle height of 0.1 m. In
Section 6.3.1 it was estimated that powder deposition during forward filtration is close to zero
within around 0.5 m of the cell plate. At low nozzle positions the low pressure zone extends
below this region, suggesting that accumulation of powder may become a problem. Raising
the nozzle height to 0.7 m was insufficient to completely eliminate the low pressure zone,
reducing the length to 0.15 m. This reflects the increase in length of the high-velocity jet as
the nozzle height increases. Extrapolating from Figure 101 suggests that a nozzle height of
0.9 m may be sufficient to eliminate the low pressure zone.
-4000
-3000
-2000
-1000
0
1000
2000
3000
4000
0 1 2 3 4
Ove
rpre
ssu
re (
Pa)
Height from bottom of bag (m)
0.1 m
0.2 m
0.3 m
0.4 m
0.5 m
0.6 m
0.7 m
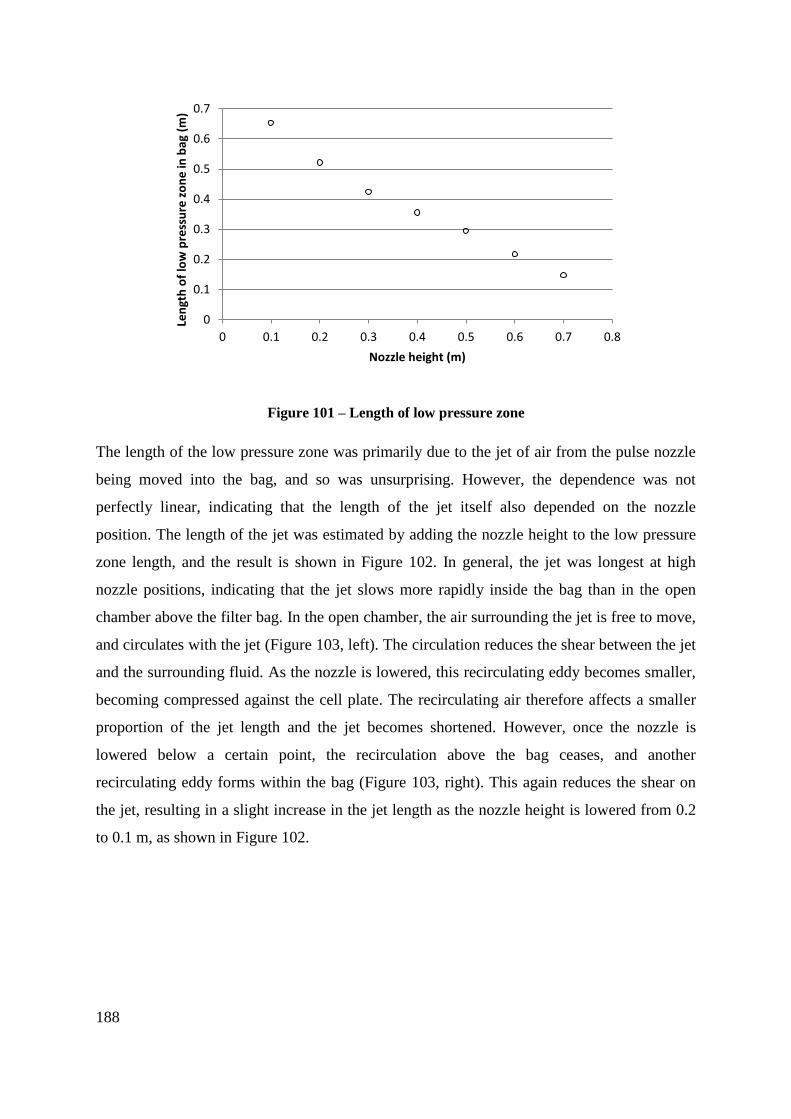
188
Figure 101 – Length of low pressure zone
The length of the low pressure zone was primarily due to the jet of air from the pulse nozzle
being moved into the bag, and so was unsurprising. However, the dependence was not
perfectly linear, indicating that the length of the jet itself also depended on the nozzle
position. The length of the jet was estimated by adding the nozzle height to the low pressure
zone length, and the result is shown in Figure 102. In general, the jet was longest at high
nozzle positions, indicating that the jet slows more rapidly inside the bag than in the open
chamber above the filter bag. In the open chamber, the air surrounding the jet is free to move,
and circulates with the jet (Figure 103, left). The circulation reduces the shear between the jet
and the surrounding fluid. As the nozzle is lowered, this recirculating eddy becomes smaller,
becoming compressed against the cell plate. The recirculating air therefore affects a smaller
proportion of the jet length and the jet becomes shortened. However, once the nozzle is
lowered below a certain point, the recirculation above the bag ceases, and another
recirculating eddy forms within the bag (Figure 103, right). This again reduces the shear on
the jet, resulting in a slight increase in the jet length as the nozzle height is lowered from 0.2
to 0.1 m, as shown in Figure 102.
0
0.1
0.2
0.3
0.4
0.5
0.6
0.7
0 0.1 0.2 0.3 0.4 0.5 0.6 0.7 0.8
Len
gth
of
low
pre
ssu
re z
on
e in
bag
(m
)
Nozzle height (m)
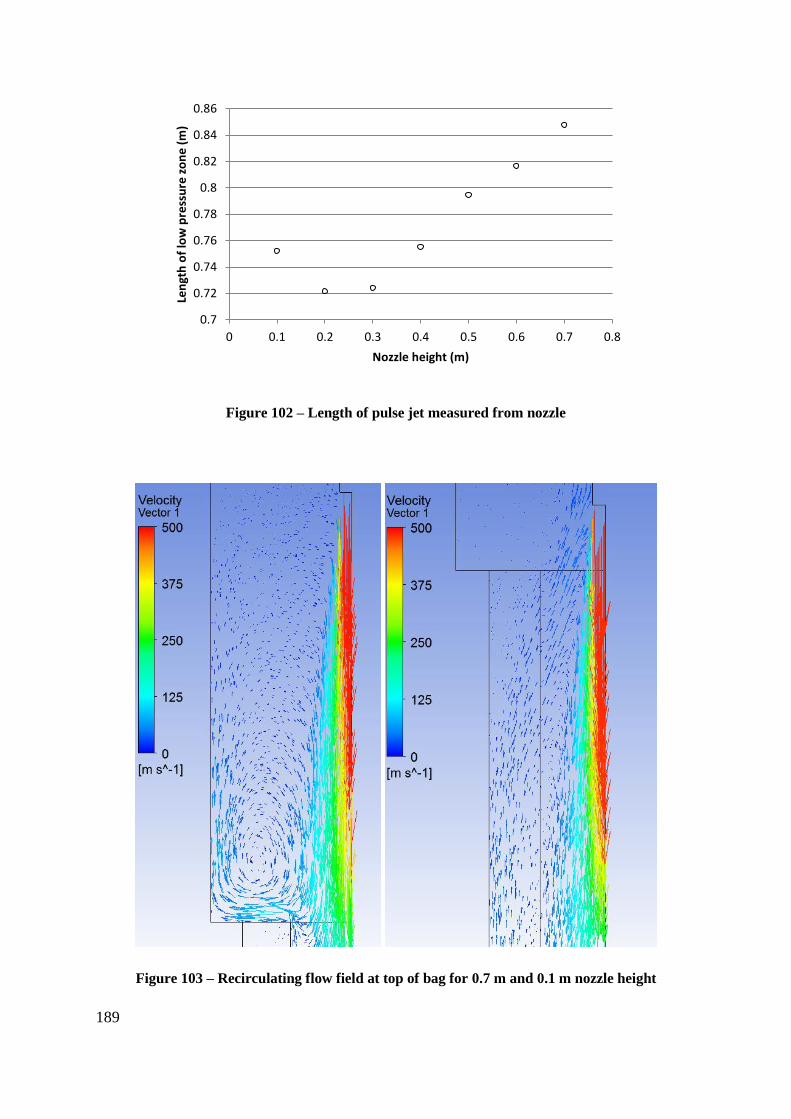
189
Figure 102 – Length of pulse jet measured from nozzle
Figure 103 – Recirculating flow field at top of bag for 0.7 m and 0.1 m nozzle height
0.7
0.72
0.74
0.76
0.78
0.8
0.82
0.84
0.86
0 0.1 0.2 0.3 0.4 0.5 0.6 0.7 0.8
Len
gth
of
low
pre
ssu
re z
on
e (
m)
Nozzle height (m)
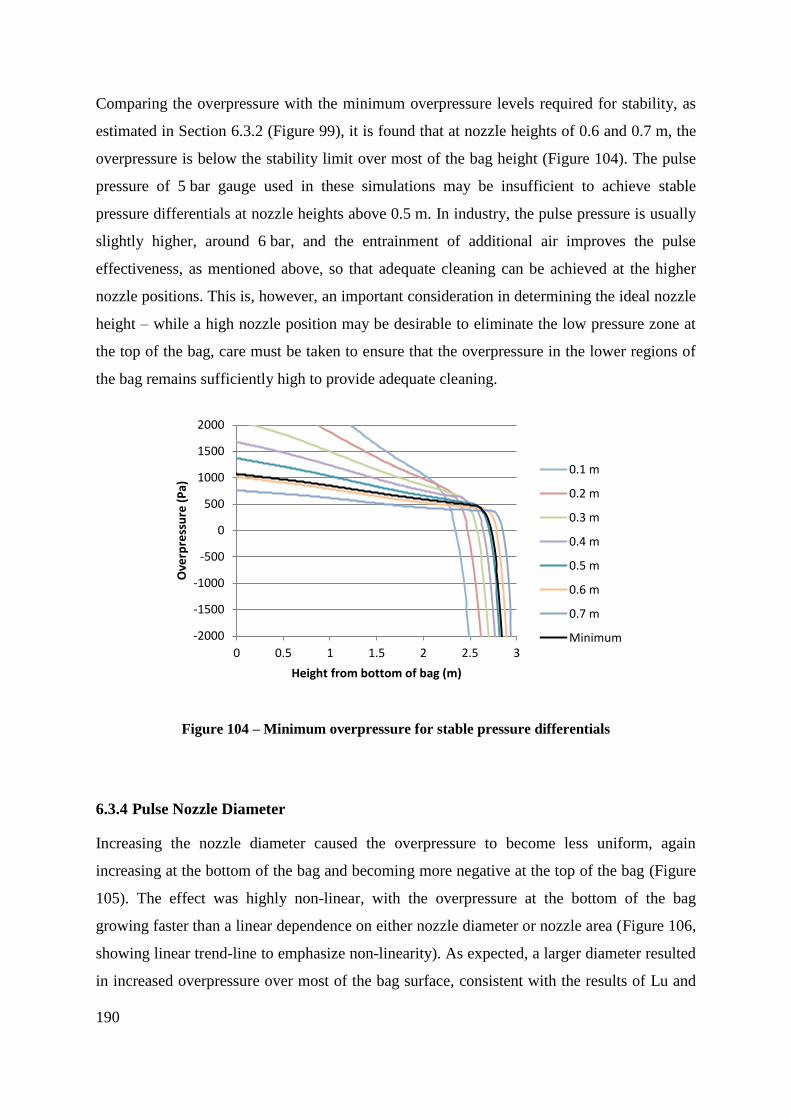
190
Comparing the overpressure with the minimum overpressure levels required for stability, as
estimated in Section 6.3.2 (Figure 99), it is found that at nozzle heights of 0.6 and 0.7 m, the
overpressure is below the stability limit over most of the bag height (Figure 104). The pulse
pressure of 5 bar gauge used in these simulations may be insufficient to achieve stable
pressure differentials at nozzle heights above 0.5 m. In industry, the pulse pressure is usually
slightly higher, around 6 bar, and the entrainment of additional air improves the pulse
effectiveness, as mentioned above, so that adequate cleaning can be achieved at the higher
nozzle positions. This is, however, an important consideration in determining the ideal nozzle
height – while a high nozzle position may be desirable to eliminate the low pressure zone at
the top of the bag, care must be taken to ensure that the overpressure in the lower regions of
the bag remains sufficiently high to provide adequate cleaning.
Figure 104 – Minimum overpressure for stable pressure differentials
6.3.4 Pulse Nozzle Diameter
Increasing the nozzle diameter caused the overpressure to become less uniform, again
increasing at the bottom of the bag and becoming more negative at the top of the bag (Figure
105). The effect was highly non-linear, with the overpressure at the bottom of the bag
growing faster than a linear dependence on either nozzle diameter or nozzle area (Figure 106,
showing linear trend-line to emphasize non-linearity). As expected, a larger diameter resulted
in increased overpressure over most of the bag surface, consistent with the results of Lu and
-2000
-1500
-1000
-500
0
500
1000
1500
2000
0 0.5 1 1.5 2 2.5 3
Ove
rpre
ssu
re (
Pa)
Height from bottom of bag (m)
0.1 m
0.2 m
0.3 m
0.4 m
0.5 m
0.6 m
0.7 m
Minimum
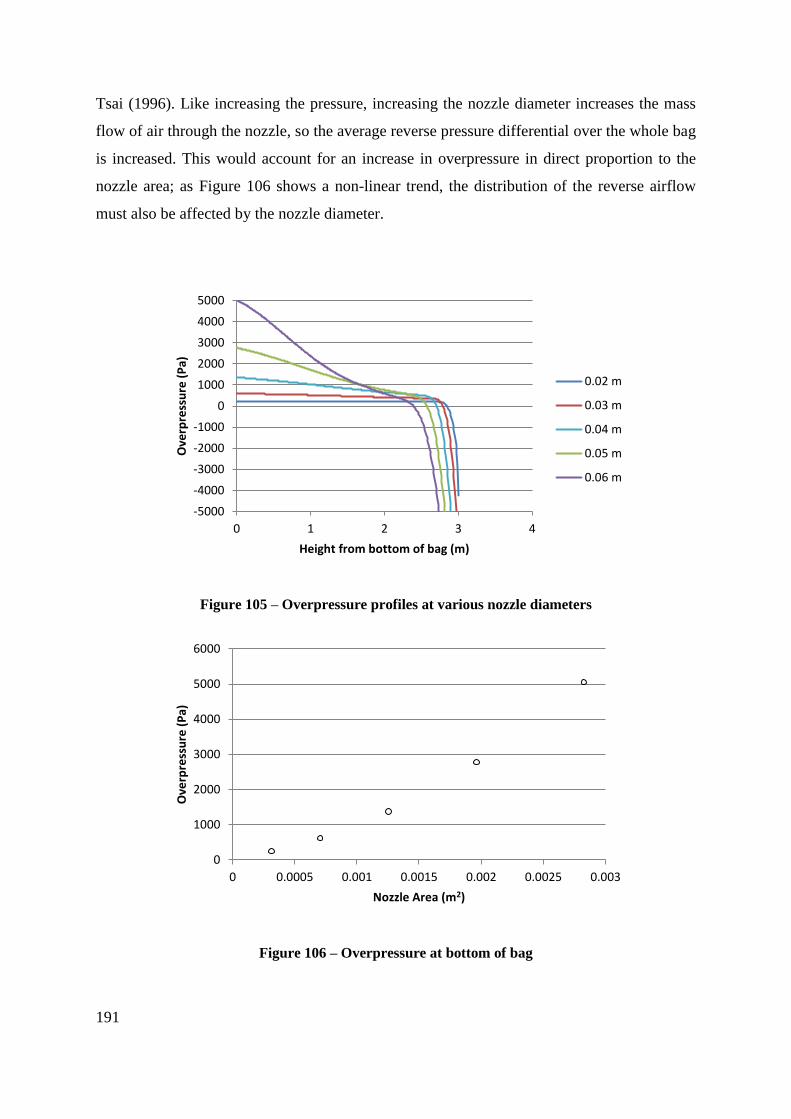
191
Tsai (1996). Like increasing the pressure, increasing the nozzle diameter increases the mass
flow of air through the nozzle, so the average reverse pressure differential over the whole bag
is increased. This would account for an increase in overpressure in direct proportion to the
nozzle area; as Figure 106 shows a non-linear trend, the distribution of the reverse airflow
must also be affected by the nozzle diameter.
Figure 105 – Overpressure profiles at various nozzle diameters
Figure 106 – Overpressure at bottom of bag
-5000
-4000
-3000
-2000
-1000
0
1000
2000
3000
4000
5000
0 1 2 3 4
Ove
rpre
ssu
re (
Pa)
Height from bottom of bag (m)
0.02 m
0.03 m
0.04 m
0.05 m
0.06 m
0
1000
2000
3000
4000
5000
6000
0 0.0005 0.001 0.0015 0.002 0.0025 0.003
Ove
rpre
ssu
re (
Pa)
Nozzle Area (m2)
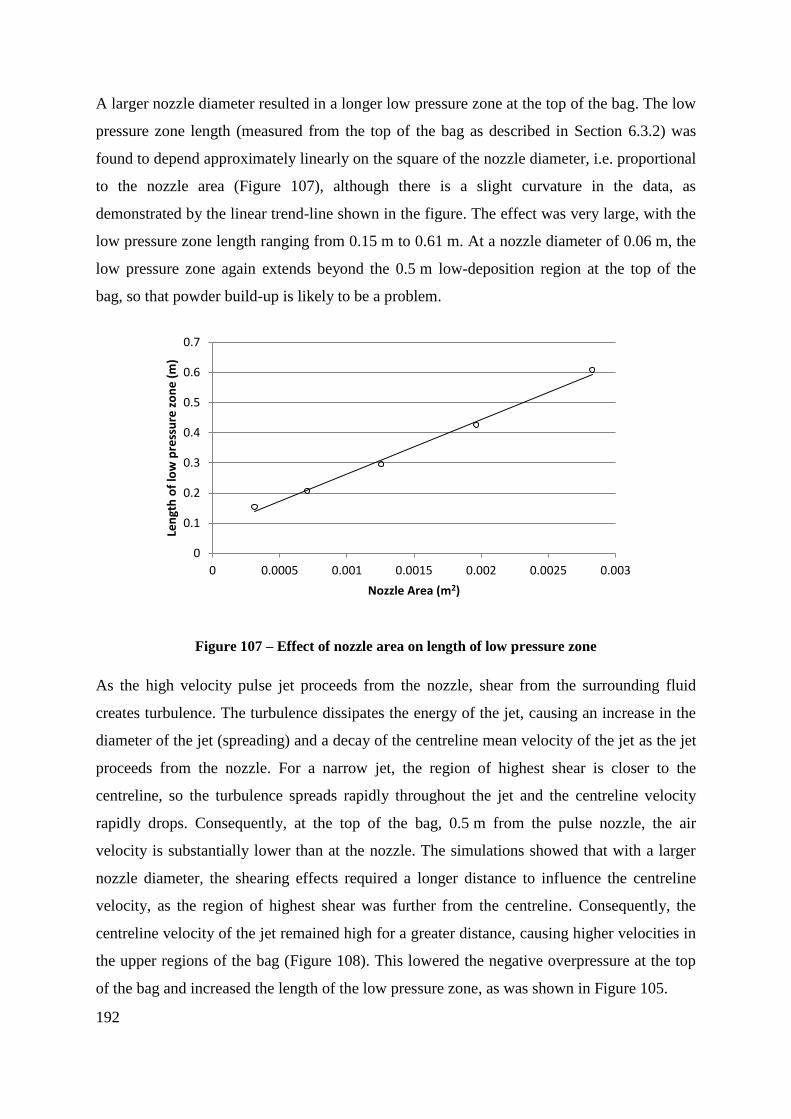
192
A larger nozzle diameter resulted in a longer low pressure zone at the top of the bag. The low
pressure zone length (measured from the top of the bag as described in Section 6.3.2) was
found to depend approximately linearly on the square of the nozzle diameter, i.e. proportional
to the nozzle area (Figure 107), although there is a slight curvature in the data, as
demonstrated by the linear trend-line shown in the figure. The effect was very large, with the
low pressure zone length ranging from 0.15 m to 0.61 m. At a nozzle diameter of 0.06 m, the
low pressure zone again extends beyond the 0.5 m low-deposition region at the top of the
bag, so that powder build-up is likely to be a problem.
Figure 107 – Effect of nozzle area on length of low pressure zone
As the high velocity pulse jet proceeds from the nozzle, shear from the surrounding fluid
creates turbulence. The turbulence dissipates the energy of the jet, causing an increase in the
diameter of the jet (spreading) and a decay of the centreline mean velocity of the jet as the jet
proceeds from the nozzle. For a narrow jet, the region of highest shear is closer to the
centreline, so the turbulence spreads rapidly throughout the jet and the centreline velocity
rapidly drops. Consequently, at the top of the bag, 0.5 m from the pulse nozzle, the air
velocity is substantially lower than at the nozzle. The simulations showed that with a larger
nozzle diameter, the shearing effects required a longer distance to influence the centreline
velocity, as the region of highest shear was further from the centreline. Consequently, the
centreline velocity of the jet remained high for a greater distance, causing higher velocities in
the upper regions of the bag (Figure 108). This lowered the negative overpressure at the top
of the bag and increased the length of the low pressure zone, as was shown in Figure 105.
0
0.1
0.2
0.3
0.4
0.5
0.6
0.7
0 0.0005 0.001 0.0015 0.002 0.0025 0.003
Len
gth
of
low
pre
ssu
re z
on
e (
m)
Nozzle Area (m2)
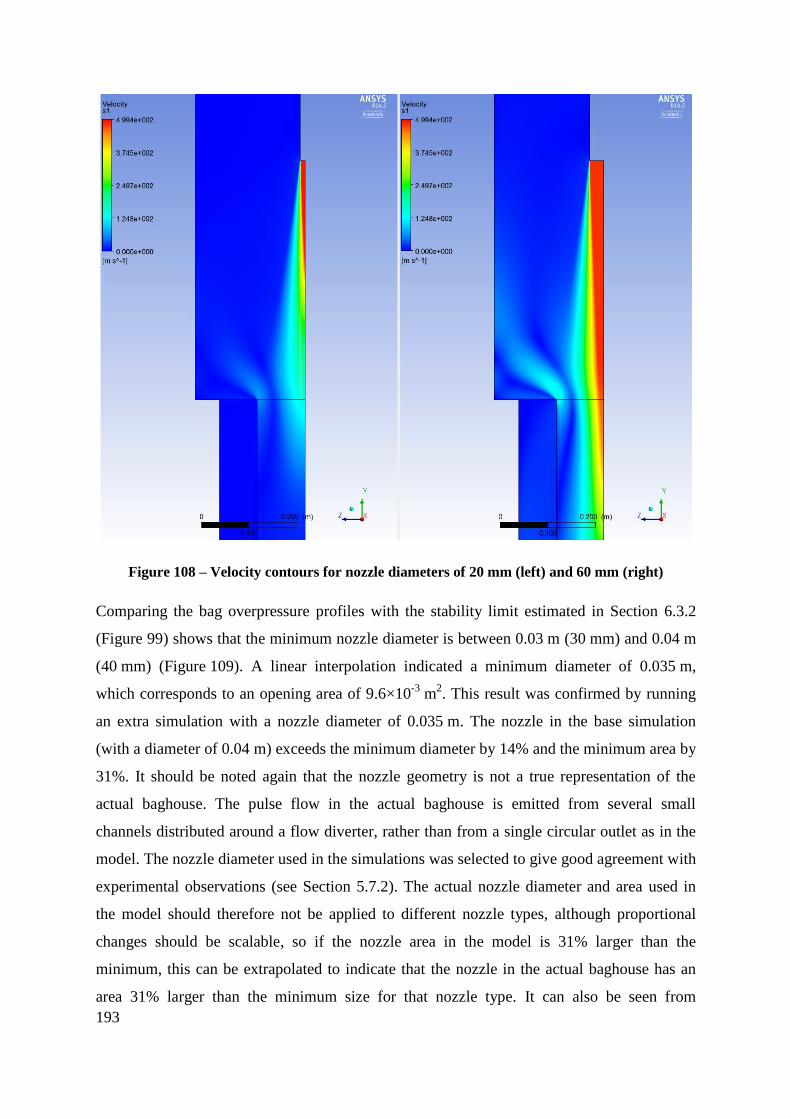
193
Figure 108 – Velocity contours for nozzle diameters of 20 mm (left) and 60 mm (right)
Comparing the bag overpressure profiles with the stability limit estimated in Section 6.3.2
(Figure 99) shows that the minimum nozzle diameter is between 0.03 m (30 mm) and 0.04 m
(40 mm) (Figure 109). A linear interpolation indicated a minimum diameter of 0.035 m,
which corresponds to an opening area of 9.6×10⁻³
m2. This result was confirmed by running
an extra simulation with a nozzle diameter of 0.035 m. The nozzle in the base simulation
(with a diameter of 0.04 m) exceeds the minimum diameter by 14% and the minimum area by
31%. It should be noted again that the nozzle geometry is not a true representation of the
actual baghouse. The pulse flow in the actual baghouse is emitted from several small
channels distributed around a flow diverter, rather than from a single circular outlet as in the
model. The nozzle diameter used in the simulations was selected to give good agreement with
experimental observations (see Section 5.7.2). The actual nozzle diameter and area used in
the model should therefore not be applied to different nozzle types, although proportional
changes should be scalable, so if the nozzle area in the model is 31% larger than the
minimum, this can be extrapolated to indicate that the nozzle in the actual baghouse has an
area 31% larger than the minimum size for that nozzle type. It can also be seen from
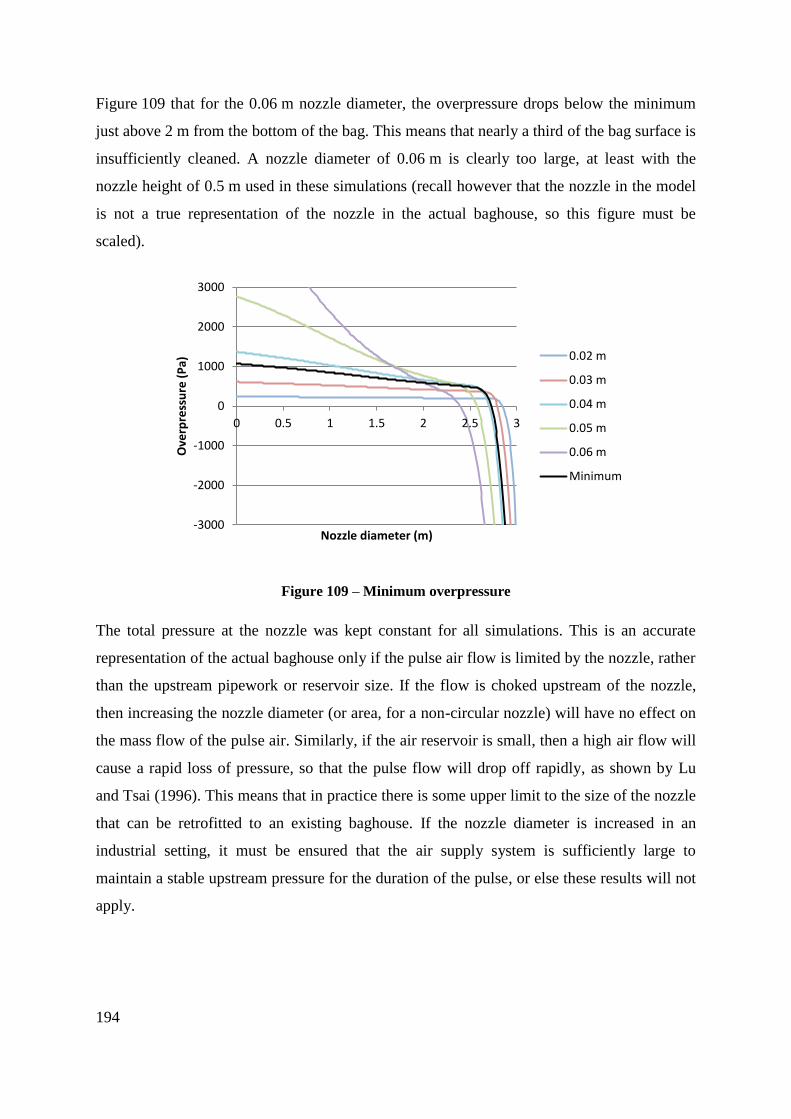
194
Figure 109 that for the 0.06 m nozzle diameter, the overpressure drops below the minimum
just above 2 m from the bottom of the bag. This means that nearly a third of the bag surface is
insufficiently cleaned. A nozzle diameter of 0.06 m is clearly too large, at least with the
nozzle height of 0.5 m used in these simulations (recall however that the nozzle in the model
is not a true representation of the nozzle in the actual baghouse, so this figure must be
scaled).
Figure 109 – Minimum overpressure
The total pressure at the nozzle was kept constant for all simulations. This is an accurate
representation of the actual baghouse only if the pulse air flow is limited by the nozzle, rather
than the upstream pipework or reservoir size. If the flow is choked upstream of the nozzle,
then increasing the nozzle diameter (or area, for a non-circular nozzle) will have no effect on
the mass flow of the pulse air. Similarly, if the air reservoir is small, then a high air flow will
cause a rapid loss of pressure, so that the pulse flow will drop off rapidly, as shown by Lu
and Tsai (1996). This means that in practice there is some upper limit to the size of the nozzle
that can be retrofitted to an existing baghouse. If the nozzle diameter is increased in an
industrial setting, it must be ensured that the air supply system is sufficiently large to
maintain a stable upstream pressure for the duration of the pulse, or else these results will not
apply.
-3000
-2000
-1000
0
1000
2000
3000
0 0.5 1 1.5 2 2.5 3
Ove
rpre
ssu
re (
Pa)
Nozzle diameter (m)
0.02 m
0.03 m
0.04 m
0.05 m
0.06 m
Minimum
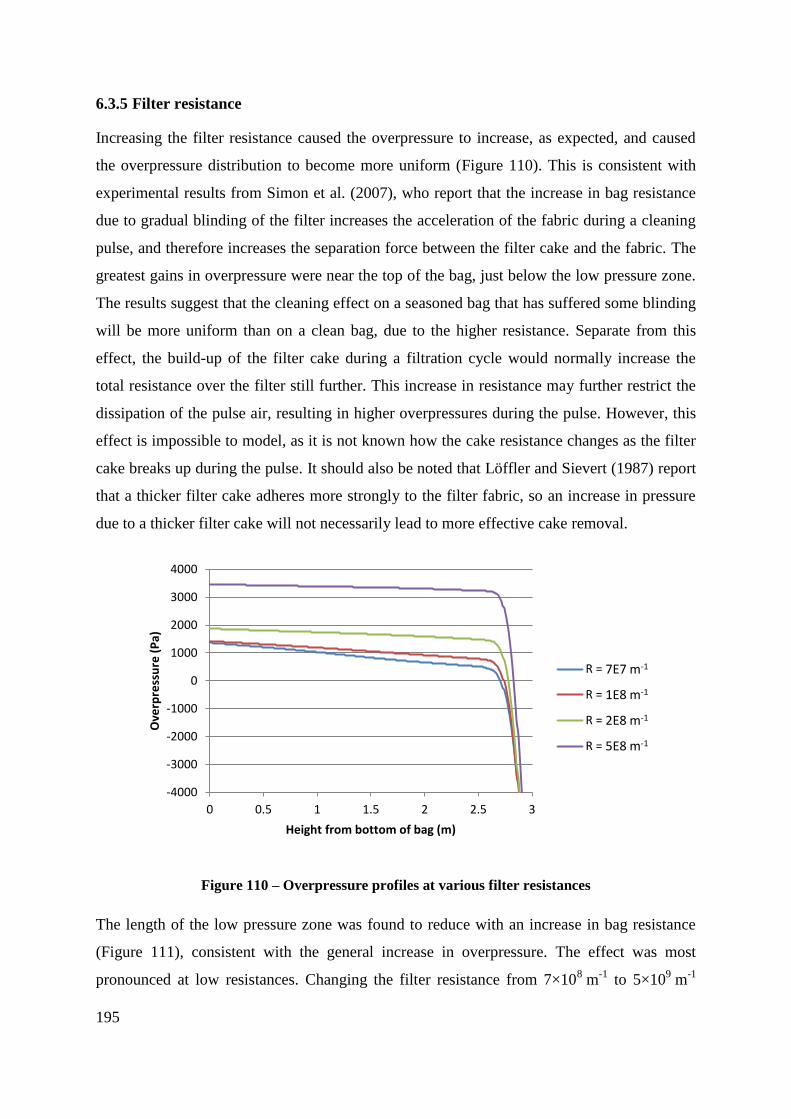
195
6.3.5 Filter resistance
Increasing the filter resistance caused the overpressure to increase, as expected, and caused
the overpressure distribution to become more uniform (Figure 110). This is consistent with
experimental results from Simon et al. (2007), who report that the increase in bag resistance
due to gradual blinding of the filter increases the acceleration of the fabric during a cleaning
pulse, and therefore increases the separation force between the filter cake and the fabric. The
greatest gains in overpressure were near the top of the bag, just below the low pressure zone.
The results suggest that the cleaning effect on a seasoned bag that has suffered some blinding
will be more uniform than on a clean bag, due to the higher resistance. Separate from this
effect, the build-up of the filter cake during a filtration cycle would normally increase the
total resistance over the filter still further. This increase in resistance may further restrict the
dissipation of the pulse air, resulting in higher overpressures during the pulse. However, this
effect is impossible to model, as it is not known how the cake resistance changes as the filter
cake breaks up during the pulse. It should also be noted that Löffler and Sievert (1987) report
that a thicker filter cake adheres more strongly to the filter fabric, so an increase in pressure
due to a thicker filter cake will not necessarily lead to more effective cake removal.
Figure 110 – Overpressure profiles at various filter resistances
The length of the low pressure zone was found to reduce with an increase in bag resistance
(Figure 111), consistent with the general increase in overpressure. The effect was most
pronounced at low resistances. Changing the filter resistance from 7×10⁸ m
-1 to 5×10
9 m
-1
-4000
-3000
-2000
-1000
0
1000
2000
3000
4000
0 0.5 1 1.5 2 2.5 3
Ove
rpre
ssu
re (
Pa)
Height from bottom of bag (m)
R = 7E7 m-1
R = 1E8 m-1
R = 2E8 m-1
R = 5E8 m-1
7E7 m-1
1E8 m-1
2E8 m-1
5E8 m-1
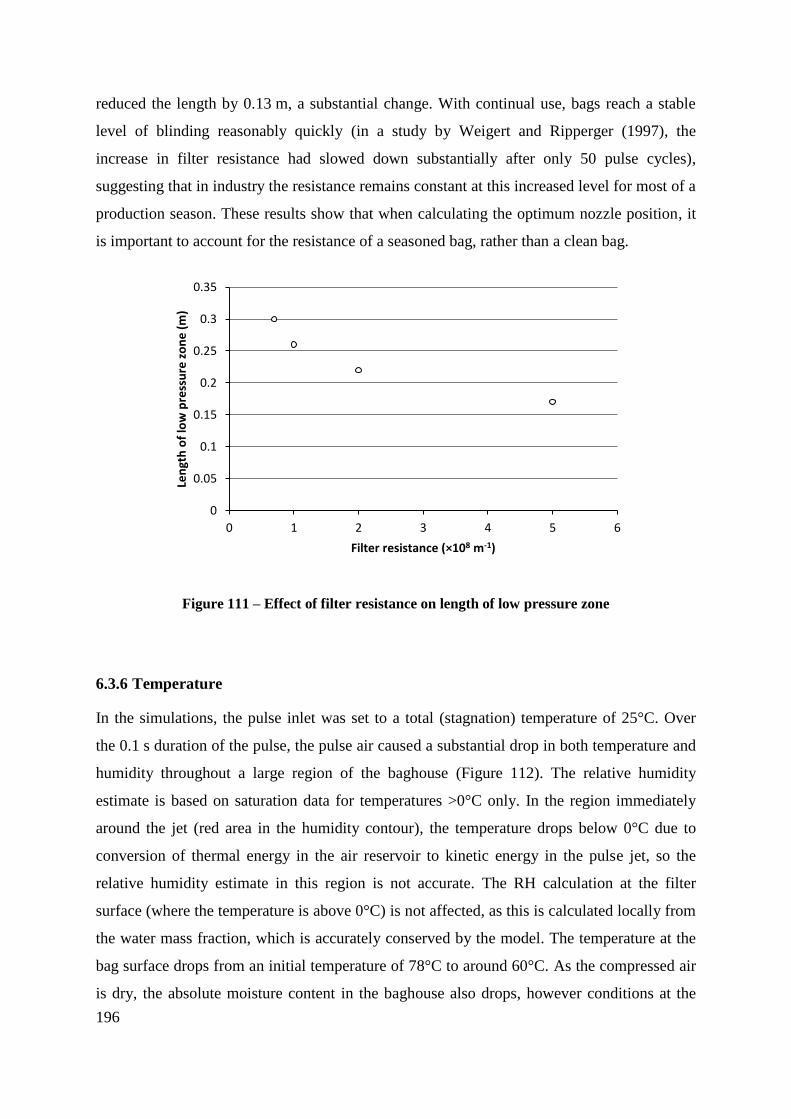
196
reduced the length by 0.13 m, a substantial change. With continual use, bags reach a stable
level of blinding reasonably quickly (in a study by Weigert and Ripperger (1997), the
increase in filter resistance had slowed down substantially after only 50 pulse cycles),
suggesting that in industry the resistance remains constant at this increased level for most of a
production season. These results show that when calculating the optimum nozzle position, it
is important to account for the resistance of a seasoned bag, rather than a clean bag.
Figure 111 – Effect of filter resistance on length of low pressure zone
6.3.6 Temperature
In the simulations, the pulse inlet was set to a total (stagnation) temperature of 25°C. Over
the 0.1 s duration of the pulse, the pulse air caused a substantial drop in both temperature and
humidity throughout a large region of the baghouse (Figure 112). The relative humidity
estimate is based on saturation data for temperatures >0°C only. In the region immediately
around the jet (red area in the humidity contour), the temperature drops below 0°C due to
conversion of thermal energy in the air reservoir to kinetic energy in the pulse jet, so the
relative humidity estimate in this region is not accurate. The RH calculation at the filter
surface (where the temperature is above 0°C) is not affected, as this is calculated locally from
the water mass fraction, which is accurately conserved by the model. The temperature at the
bag surface drops from an initial temperature of 78°C to around 60°C. As the compressed air
is dry, the absolute moisture content in the baghouse also drops, however conditions at the
0
0.05
0.1
0.15
0.2
0.25
0.3
0.35
0 1 2 3 4 5 6
Len
gth
of
low
pre
ssu
re z
on
e (
m)
Filter resistance (×108 m-1)
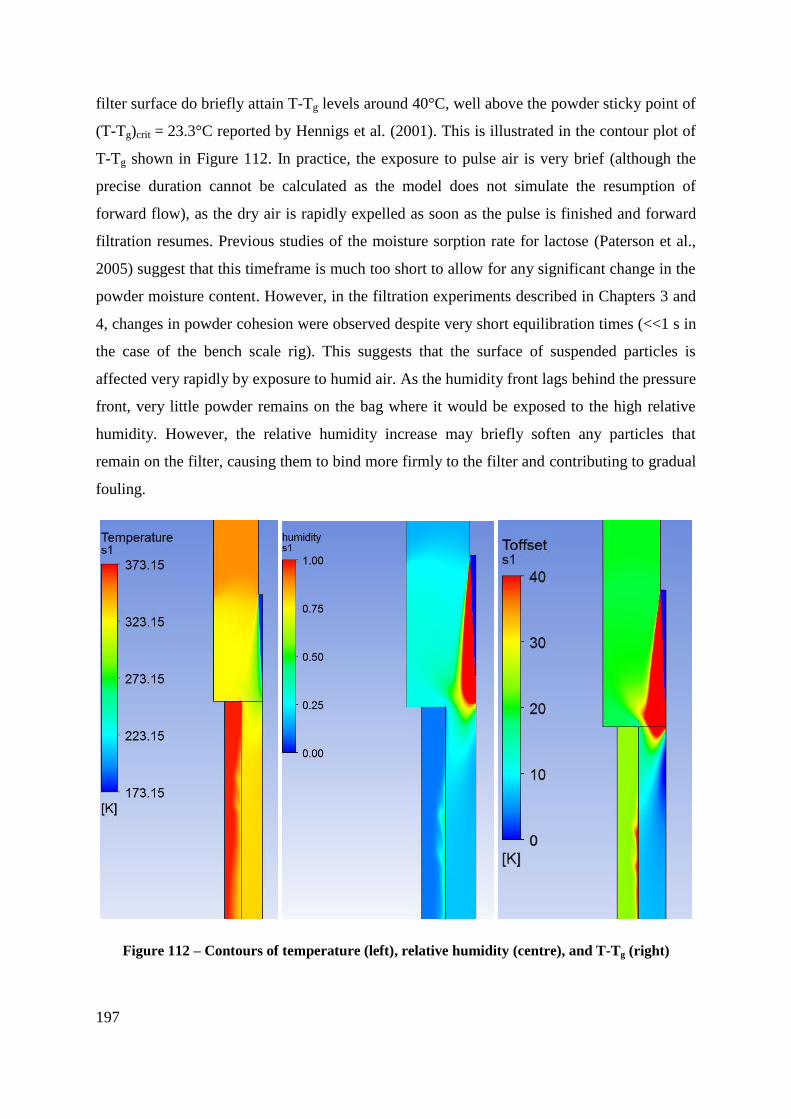
197
filter surface do briefly attain T-Tg levels around 40°C, well above the powder sticky point of
(T-Tg)crit = 23.3°C reported by Hennigs et al. (2001). This is illustrated in the contour plot of
T-Tg shown in Figure 112. In practice, the exposure to pulse air is very brief (although the
precise duration cannot be calculated as the model does not simulate the resumption of
forward flow), as the dry air is rapidly expelled as soon as the pulse is finished and forward
filtration resumes. Previous studies of the moisture sorption rate for lactose (Paterson et al.,
2005) suggest that this timeframe is much too short to allow for any significant change in the
powder moisture content. However, in the filtration experiments described in Chapters 3 and
4, changes in powder cohesion were observed despite very short equilibration times (<<1 s in
the case of the bench scale rig). This suggests that the surface of suspended particles is
affected very rapidly by exposure to humid air. As the humidity front lags behind the pressure
front, very little powder remains on the bag where it would be exposed to the high relative
humidity. However, the relative humidity increase may briefly soften any particles that
remain on the filter, causing them to bind more firmly to the filter and contributing to gradual
fouling.
Figure 112 – Contours of temperature (left), relative humidity (centre), and T-Tg (right)
198
6.3.7 General Discussion
In general, increasing the mass flow of air through the pulse nozzle increases the induced
overpressure in the bag, and therefore improves the pulse effectiveness. However, beyond the
immediate effect on the baghouse, increasing the mass flow of compressed air requires a
larger, more powerful compressor, which entails both an increased capital cost and increased
running costs. Finding the most cost-effective configuration is therefore a balance between
increased capital and compressed air costs on the one hand, and increased fan costs due to
high pressure differentials on the other.
It is not entirely clear whether a uniform overpressure distribution offers the best
performance. Bakke (1974) reported that over-cleaning of the filter bag promotes depth
filtration over cake filtration (as ideal cleaning leaves a small amount of powder on the bag so
that the filter cake rapidly re-forms). This results in increased penetration of particles through
the filter, which can lead to increased blinding and high outlet emissions. Lu and Tsai (1998)
observed a critical cleaning effect, beyond which increasing the pulse overpressure made
very little difference to the residual pressure differential after the pulse. Excessive pulse
energy also increases wear on the bag, which carries associated costs. Optimum performance
is therefore a balance between having sufficient overpressure to remove most of the powder
and maintain stable pressure differentials, while avoiding over-cleaning and minimising wear.
The non-uniform overpressure profile that results from a high pulse pressure makes it
difficult to achieve optimum cleaning over the entire bag surface – the bag may be over-
cleaned at the bottom, but under-cleaned at the top. On the other hand, the particle tracking
simulations in Section 6.3.1 indicate that the filter cake thickness decreases with height due to
gravitational settling of particles. Löffler and Sievert (1987) report that a thicker cake adheres
more strongly to the bag, so the optimum overpressure may actually vary with height. It may
therefore be advantageous to have the cleaning effect of the pulse concentrated toward the
bottom of the bag, as this is where the powder cake is thickest.
In industrial baghouses, entrainment of surrounding air into the pulse jet is thought to be
significant, so that the air flow entering the top of the bag is substantially larger than the air
flow injected by the pulse. This was not the case in the simulations, where the net airflow into
the open top of the bag was around 20-30% lower than the pulse air volume. The lack of
entrainment is due to the geometry of the pilot scale baghouse, and is not a problem with the
model. The amount of air available for entrainment in the simulations and in the pilot scale
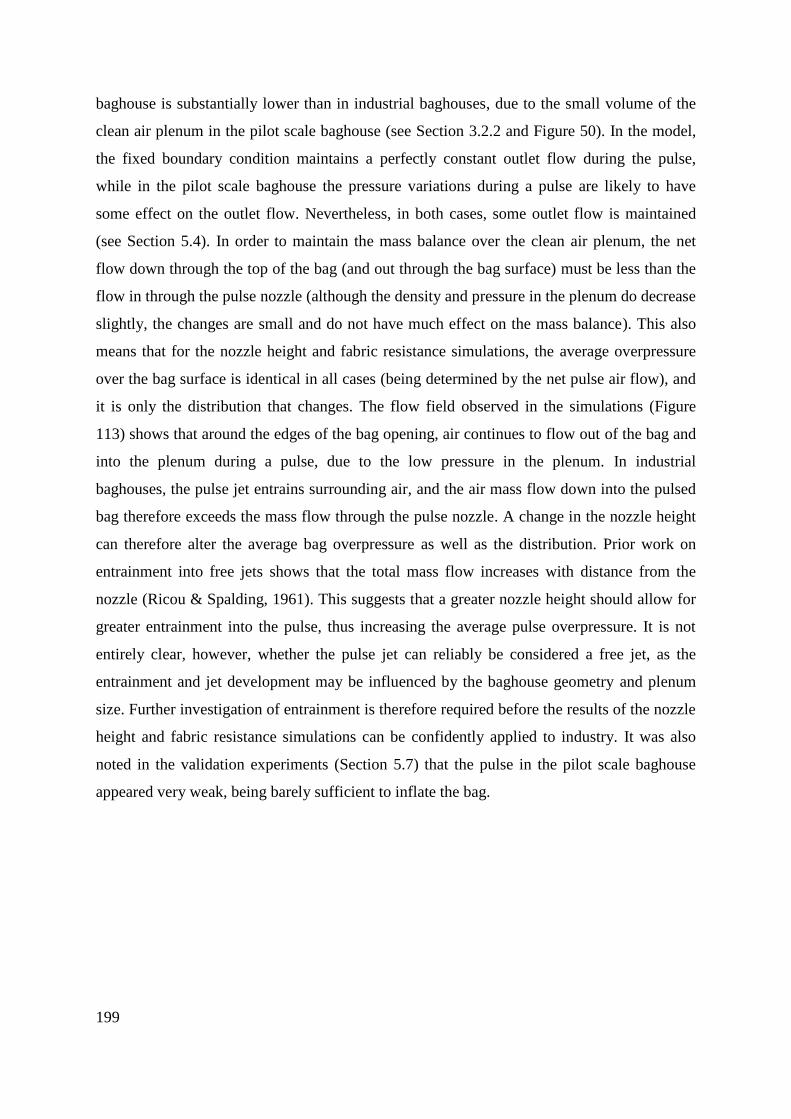
199
baghouse is substantially lower than in industrial baghouses, due to the small volume of the
clean air plenum in the pilot scale baghouse (see Section 3.2.2 and Figure 50). In the model,
the fixed boundary condition maintains a perfectly constant outlet flow during the pulse,
while in the pilot scale baghouse the pressure variations during a pulse are likely to have
some effect on the outlet flow. Nevertheless, in both cases, some outlet flow is maintained
(see Section 5.4). In order to maintain the mass balance over the clean air plenum, the net
flow down through the top of the bag (and out through the bag surface) must be less than the
flow in through the pulse nozzle (although the density and pressure in the plenum do decrease
slightly, the changes are small and do not have much effect on the mass balance). This also
means that for the nozzle height and fabric resistance simulations, the average overpressure
over the bag surface is identical in all cases (being determined by the net pulse air flow), and
it is only the distribution that changes. The flow field observed in the simulations (Figure
113) shows that around the edges of the bag opening, air continues to flow out of the bag and
into the plenum during a pulse, due to the low pressure in the plenum. In industrial
baghouses, the pulse jet entrains surrounding air, and the air mass flow down into the pulsed
bag therefore exceeds the mass flow through the pulse nozzle. A change in the nozzle height
can therefore alter the average bag overpressure as well as the distribution. Prior work on
entrainment into free jets shows that the total mass flow increases with distance from the
nozzle (Ricou & Spalding, 1961). This suggests that a greater nozzle height should allow for
greater entrainment into the pulse, thus increasing the average pulse overpressure. It is not
entirely clear, however, whether the pulse jet can reliably be considered a free jet, as the
entrainment and jet development may be influenced by the baghouse geometry and plenum
size. Further investigation of entrainment is therefore required before the results of the nozzle
height and fabric resistance simulations can be confidently applied to industry. It was also
noted in the validation experiments (Section 5.7) that the pulse in the pilot scale baghouse
appeared very weak, being barely sufficient to inflate the bag.
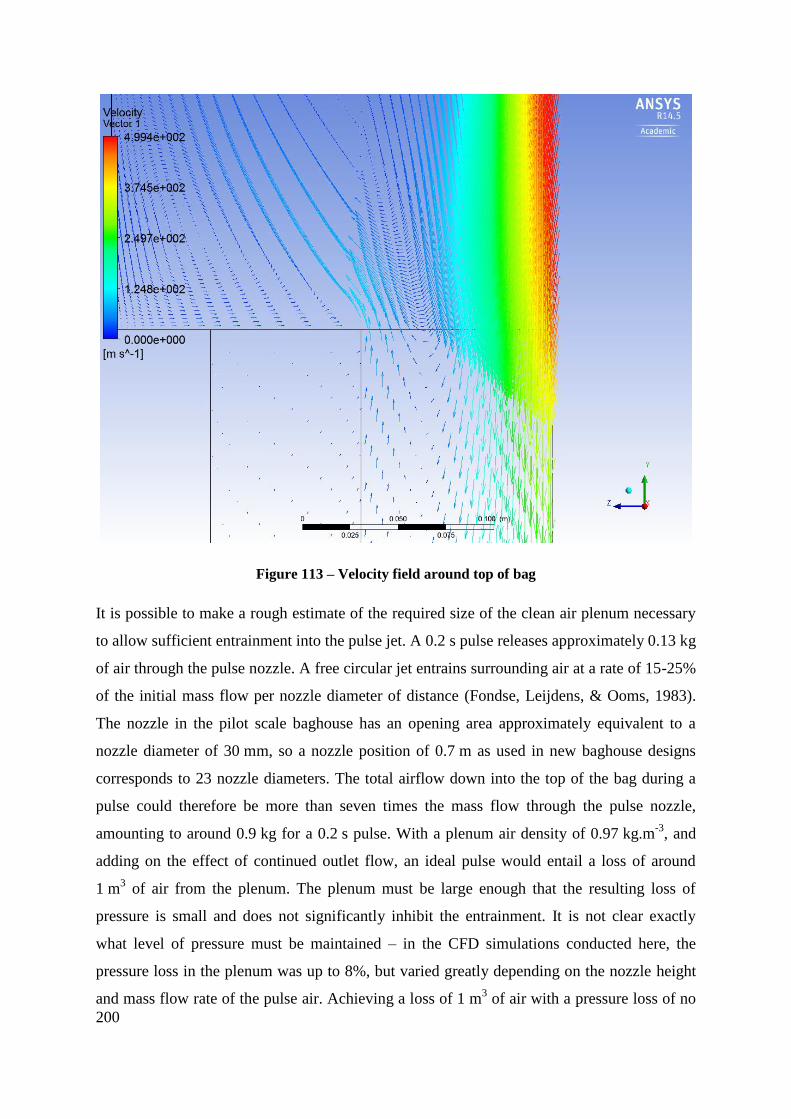
200
Figure 113 – Velocity field around top of bag
It is possible to make a rough estimate of the required size of the clean air plenum necessary
to allow sufficient entrainment into the pulse jet. A 0.2 s pulse releases approximately 0.13 kg
of air through the pulse nozzle. A free circular jet entrains surrounding air at a rate of 15-25%
of the initial mass flow per nozzle diameter of distance (Fondse, Leijdens, & Ooms, 1983).
The nozzle in the pilot scale baghouse has an opening area approximately equivalent to a
nozzle diameter of 30 mm, so a nozzle position of 0.7 m as used in new baghouse designs
corresponds to 23 nozzle diameters. The total airflow down into the top of the bag during a
pulse could therefore be more than seven times the mass flow through the pulse nozzle,
amounting to around 0.9 kg for a 0.2 s pulse. With a plenum air density of 0.97 kg.m-3
, and
adding on the effect of continued outlet flow, an ideal pulse would entail a loss of around
1 m3 of air from the plenum. The plenum must be large enough that the resulting loss of
pressure is small and does not significantly inhibit the entrainment. It is not clear exactly
what level of pressure must be maintained – in the CFD simulations conducted here, the
pressure loss in the plenum was up to 8%, but varied greatly depending on the nozzle height
and mass flow rate of the pulse air. Achieving a loss of 1 m3 of air with a pressure loss of no
201
more than 8% requires a plenum volume of 13 m3. The clean air plenum on the pilot scale
baghouse, with a total volume of around 1 m3, was clearly much too small, and severely
limited the entrainment. However, this estimate of the required volume is based on the single-
bag design of the pilot scale baghouse, and applying this to a baghouse with multiple bags is
more complicated. In large industrial baghouses, usually only a few bags are pulsed at a time,
while forward filtration flow is maintained through the remaining bags. The pressure in the
clean air plenum may therefore be partially sustained by a brief increase in forward filtration
flow through the remaining filter bags. This suggests that the required plenum volume may
be lower than the 13 m3 stated above. It should be also be noted that the estimated volume is
on a per bag basis – if two bags are pulsed simultaneously, the plenum must be twice as large
as if only one bag is pulsed.
The difference in entrainment explains how the same pulse system in an industrial baghouse
can achieve adequate cleaning of a much longer bag. This also indicates an important
consideration in scaling of baghouse designs – if entrainment is essential to good pulse
performance, then pulse systems in small baghouses (with few bags), or where a large
proportion of the bags are pulsed simultaneously, may perform poorly.
The model does not include the effects of bag expansion. The model assumes that the bag is
in an expanded (cylindrical) state for the entire duration of the pulse, while in reality, the bag
is pressed onto the support cage at the start of the pulse, and begins to expand when the
pressure differential reverses. The interior volume therefore increases rapidly at the start of
the pulse, attenuating the overpressure. This effect is very short-lived, however, as the bag
becomes pressurised along the full length after only 0.01 s, and immediately begins to
expand. The accelerometer measurements described in Section 5.7.2 indicate that the
expansion takes around 0.02 s, so that full expansion is reached around 0.03 s after the start
of the pulse. For the remaining duration of the pulse the bag is in the fully expanded state,
and therefore matches the model geometry. The overpressure at 0.1 s, as used for comparison
in these simulations, is therefore well within the period where the geometry is accurately
represented.
202
6.4 Conclusions
Gravitational settling of particles in the pilot scale baghouse produces a significant variation
in both filter cake thickness and particle size distribution over the height of the filter bag.
Milk powder particles greater than 120 μm in diameter readily settle out of the flow and
therefore contribute little to the pressure differentials in a baghouse. The effects of poor
cleaning near the top of filter bags may be mitigated by the very low proportion of powder
that reaches the top of filter bags. Nevertheless, the long run times typical of industrial
baghouses may still allow for substantial deposition of powder around the top of the filter
bags.
The overall cleaning effect of the pulse is improved by increasing the mass flow of the pulse
air. This can be achieved in several ways, including increasing the compressed air supply
pressure, increasing the pulse nozzle diameter or changing the nozzle type. However,
increased compressed air use does increase the operating cost of the baghouse.
The distribution of the pulse overpressure over the surface of the bag also affects the
performance of the pulse. Uniform overpressure can be achieved by using a low nozzle
pressure, a high nozzle position, or a nozzle with a small opening area. The cleaning effect
also becomes more uniform as the filter resistance increases, which happens naturally over
time in industrial baghouses due to blinding. Perfectly uniform overpressure may not give
optimum cleaning however, as the filter cake thickness and particle size distribution are
known to vary over the height of the bag.
The introduction of cold air during a pulse causes an increase in the relative humidity in the
baghouse. This may raise conditions above the powder sticky point. The change is very short-
lived, but may nevertheless increase the adhesion of particles to the filter bag surface and
contribute to long-term blinding.
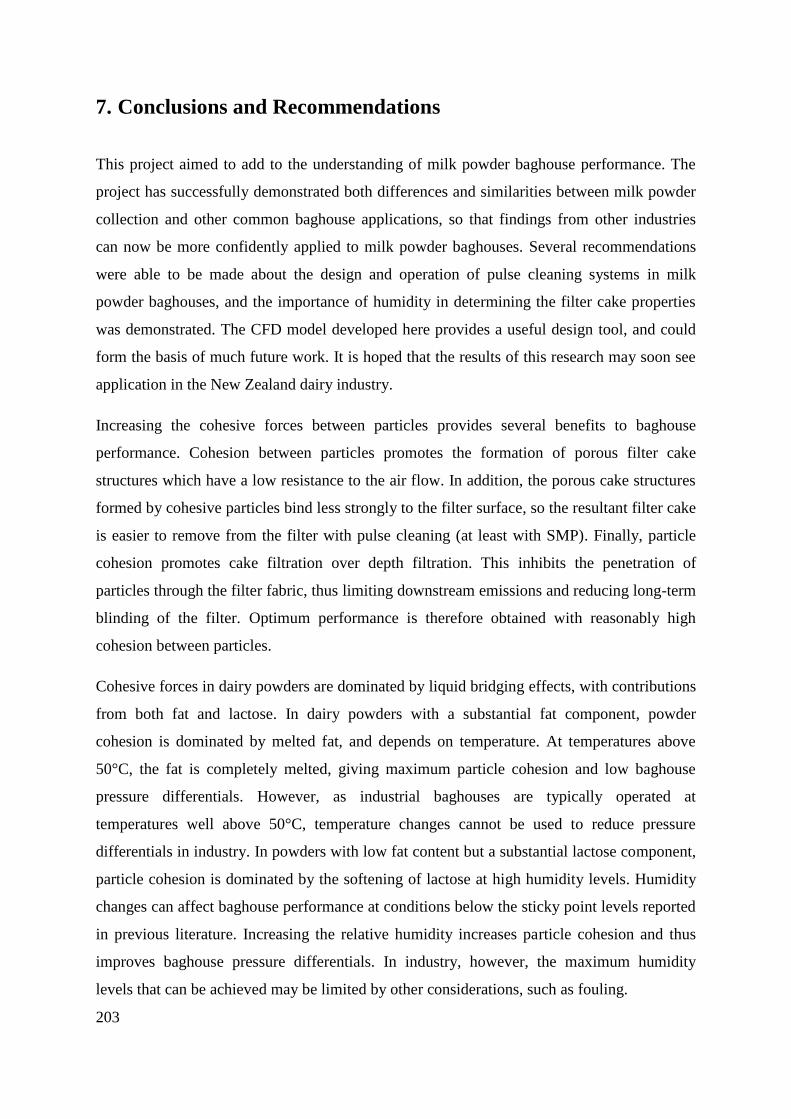
203
7. Conclusions and Recommendations
This project aimed to add to the understanding of milk powder baghouse performance. The
project has successfully demonstrated both differences and similarities between milk powder
collection and other common baghouse applications, so that findings from other industries
can now be more confidently applied to milk powder baghouses. Several recommendations
were able to be made about the design and operation of pulse cleaning systems in milk
powder baghouses, and the importance of humidity in determining the filter cake properties
was demonstrated. The CFD model developed here provides a useful design tool, and could
form the basis of much future work. It is hoped that the results of this research may soon see
application in the New Zealand dairy industry.
Increasing the cohesive forces between particles provides several benefits to baghouse
performance. Cohesion between particles promotes the formation of porous filter cake
structures which have a low resistance to the air flow. In addition, the porous cake structures
formed by cohesive particles bind less strongly to the filter surface, so the resultant filter cake
is easier to remove from the filter with pulse cleaning (at least with SMP). Finally, particle
cohesion promotes cake filtration over depth filtration. This inhibits the penetration of
particles through the filter fabric, thus limiting downstream emissions and reducing long-term
blinding of the filter. Optimum performance is therefore obtained with reasonably high
cohesion between particles.
Cohesive forces in dairy powders are dominated by liquid bridging effects, with contributions
from both fat and lactose. In dairy powders with a substantial fat component, powder
cohesion is dominated by melted fat, and depends on temperature. At temperatures above
50°C, the fat is completely melted, giving maximum particle cohesion and low baghouse
pressure differentials. However, as industrial baghouses are typically operated at
temperatures well above 50°C, temperature changes cannot be used to reduce pressure
differentials in industry. In powders with low fat content but a substantial lactose component,
particle cohesion is dominated by the softening of lactose at high humidity levels. Humidity
changes can affect baghouse performance at conditions below the sticky point levels reported
in previous literature. Increasing the relative humidity increases particle cohesion and thus
improves baghouse pressure differentials. In industry, however, the maximum humidity
levels that can be achieved may be limited by other considerations, such as fouling.
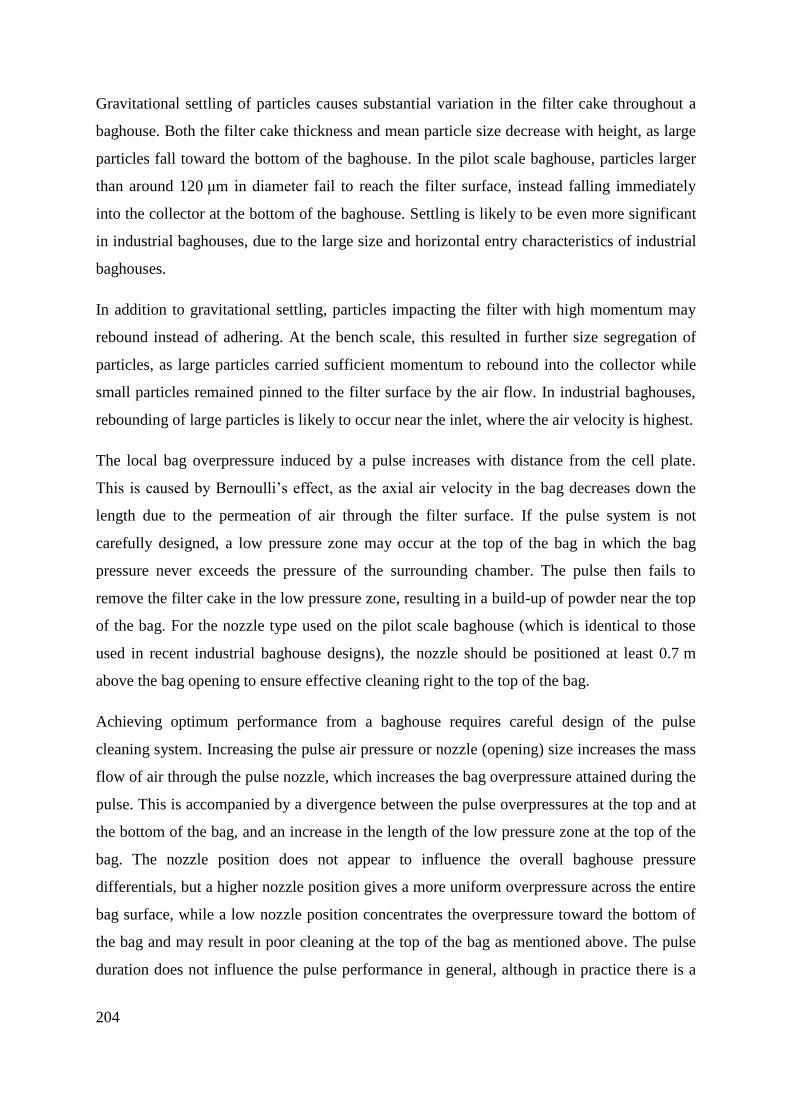
204
Gravitational settling of particles causes substantial variation in the filter cake throughout a
baghouse. Both the filter cake thickness and mean particle size decrease with height, as large
particles fall toward the bottom of the baghouse. In the pilot scale baghouse, particles larger
than around 120 μm in diameter fail to reach the filter surface, instead falling immediately
into the collector at the bottom of the baghouse. Settling is likely to be even more significant
in industrial baghouses, due to the large size and horizontal entry characteristics of industrial
baghouses.
In addition to gravitational settling, particles impacting the filter with high momentum may
rebound instead of adhering. At the bench scale, this resulted in further size segregation of
particles, as large particles carried sufficient momentum to rebound into the collector while
small particles remained pinned to the filter surface by the air flow. In industrial baghouses,
rebounding of large particles is likely to occur near the inlet, where the air velocity is highest.
The local bag overpressure induced by a pulse increases with distance from the cell plate.
This is caused by Bernoulli’s effect, as the axial air velocity in the bag decreases down the
length due to the permeation of air through the filter surface. If the pulse system is not
carefully designed, a low pressure zone may occur at the top of the bag in which the bag
pressure never exceeds the pressure of the surrounding chamber. The pulse then fails to
remove the filter cake in the low pressure zone, resulting in a build-up of powder near the top
of the bag. For the nozzle type used on the pilot scale baghouse (which is identical to those
used in recent industrial baghouse designs), the nozzle should be positioned at least 0.7 m
above the bag opening to ensure effective cleaning right to the top of the bag.
Achieving optimum performance from a baghouse requires careful design of the pulse
cleaning system. Increasing the pulse air pressure or nozzle (opening) size increases the mass
flow of air through the pulse nozzle, which increases the bag overpressure attained during the
pulse. This is accompanied by a divergence between the pulse overpressures at the top and at
the bottom of the bag, and an increase in the length of the low pressure zone at the top of the
bag. The nozzle position does not appear to influence the overall baghouse pressure
differentials, but a higher nozzle position gives a more uniform overpressure across the entire
bag surface, while a low nozzle position concentrates the overpressure toward the bottom of
the bag and may result in poor cleaning at the top of the bag as mentioned above. The pulse
duration does not influence the pulse performance in general, although in practice there is a
205
minimum pulse duration that is determined by the mechanical limitations of the pulsing
valve.
Due to the small size of the clean air plenum on the pilot scale baghouse, both the
experiments on the pilot scale baghouse and the CFD simulations showed very little
entrainment of air from the clean air plenum into the pulse. Such entrainment is thought to
have an important effect on the pulse performance in industrial baghouses. Further research is
therefore warranted to quantify this entrainment, particularly with regard to various nozzle
types.
The method of using Darcy’s Law to model the filter fabric within a CFD model met with
some success, and shows significant potential for further baghouse modelling. As the
simulations carried out in this thesis were limited to the pilot scale baghouse, there is a clear
opportunity for the CFD model to be extended to improve the understanding of industrial
baghouses. This could include simulating pulse entrainment in baghouses with larger clean
air plenums, or simulating the interstitial airflows (and consequent effect on gravitational
settling of particles) in baghouses containing many filter bags.
7.1 Recommendations for Industry
Baghouse pressure differentials are reduced by maximising the cohesive forces between
particles. For low fat powders like SMP, this can be achieved by raising the humidity level.
The optimum humidity level for SMP is probably just below the particle sticky-point
measured using the particle gun method (as this method most closely represents the situation
in spray driers and baghouses, with particles suspended in moving air flows). For high-fat
powders, particle cohesion is not sensitive to either humidity or temperature within the
typical temperature range of 70-80°C. The humidity and temperature can therefore be varied
substantially to meet other operational requirements when producing high-fat powders.
Given the importance of gravitational settling in milk powder baghouses, new baghouses
should use tangential entry designs instead of direct entry designs (refer back to Figure 49).
The tangential entry creates a slight centrifugal effect, much like a cyclone, and enhances
gravitational settling. This should reduce the deposition of powder onto the filter bags and
allow for the pulsing frequency to be reduced.

206
Reports of fouling beneath the cell plate in some industrial baghouses indicate that the pulse
nozzles in these baghouses are positioned too close to the tops of the bags. The nozzles in
these baghouses should be raised to eliminate the low pressure zone at the top of the bag and
thereby reduce fouling.
Pulse cleaning systems should be programmed to pulse-clean the bags either individually or
in small groups, as pulsing too many bags at once may depressurise the clean air plenum and
reduce entrainment into the pulse-jet. In addition, the pulses should be timed to avoid any
extended periods with no pulsing i.e. once all the bags have been pulsed, the pulsing cycle
should immediately start over. This minimises the variation in the baghouse pressure
differentials, and thus minimises the long term fan energy requirements.
The single-step Darcy’s Law approach tested here is suitable for baghouse modelling, and
could be used in future CFD work. This approach simplifies the meshing, and reduces the
computational requirements, allowing solutions to be obtained more rapidly than with
traditional approaches.
207
8. References
3M Ltd. (2005). Ceramic Textiles and Composites [Brochure]. St. Paul, MN: Author.
Akaike, H. (2011). Akaike's Information Criterion. In M. Lovric (Ed.), International Encyclopedia of
Statistical Science (Vol. 1). Berlin: Springer.
Aleksandrov, A. A., & Ershova, Z. A. (1981). Saturation Curve Equations for Normal and Heavy
Water. Inzhenerno-Fizicheskii Zhurnal, 40(5), 894-897.
ANSYS CFX 14.5 (Version 14.5) [Software]. (2012). Canonsburg, PA: ANSYS Inc.
ANSYS Inc. (2010). ANSYS CFX Technical Specifications [Brochure]. Canonsburg, PA: Author.
Armitage, P., & Berry, G. (1994). Statistical Method in Medical Research 3.
Bakke, E. (1974). Optimizing Filtration Parameters. Journal of the Air Pollution Control Association,
24(12), 1150-1154. doi: 10.1080/00022470.1974.10470027
Baléo, J.-N., & Subrenat, P. L. C. A. (2000). Numerical simulation of flows in air treatment devices
using activated carbon cloths filters. Chemical Engineering Science, 55(10), 1807-1816. doi:
10.1016/S0009-2509(99)00441-8
Bansal, B., Habib, B., Rebmann, H., & Chen, X. D. (2009). Effect of Seasonal Variation in Milk
Composition on Dairy Fouling. Paper presented at the International Conference on Heat
Exchanger Fouling and Cleaning VIII, Schladming, Austria.
Barnett, T. (2000). Improving the performance of fabric filter dry dust collection equipment.
Filtration & Separation, 37(2), 28-32. doi: 10.1016/S0015-1882(00)88321-4
Belba, V. H., Grubb, W. T., & Chang, R. (1992). The Potential of Pulse-Jet Baghouses for Utility
Boilers. Part 1: A Worldwide Survey of Users. Journal of the Air & Waste Management
Association, 42(2), 209-217. doi: 10.1080/10473289.1992.10466984
Bhandari, B. R., Datta, N., & Howes, T. (1997). Problems Associated With Spray Drying Of Sugar-
Rich Foods. Drying Technology, 15(2), 671-684. doi: 10.1080/07373939708917253
Binnig, J., Meyer, J., & Kasper, G. (2009). Origin and mechanisms of dust emission from pulse-jet
cleaned filter media. Powder Technology, 189(1), 108-114.
Boonyai, P., Bhandari, B., & Howes, T. (2004). Stickiness measurement techniques for food powders:
a review. Powder Technology, 145(1), 34-46.
Boussinesq, J. (1877). Essai sur la théorie des eaux courantes. Mémoires présentés par divers savants
à l'Académie des Sciences 23(1), 1-680.
Bronlund, J. E., & Paterson, A. H. J. (2004). Moisture sorption isotherms for crystalline, amorphous
and predominantly crystalline lactose powders. International Dairy Journal, 14, 247-254.
Bustard, C. J., Cushing, K. M., & Chang, R. L. (1992). The Potential of Pulse-Jet Baghouses for
Utility Boilers. Part 2: Performance of Pulse-Jet Fabric Filter Pilot Plants. Journal of the Air
& Waste Management Association, 42(9), 1240-1249. doi: 10.1080/10473289.1992.10467072
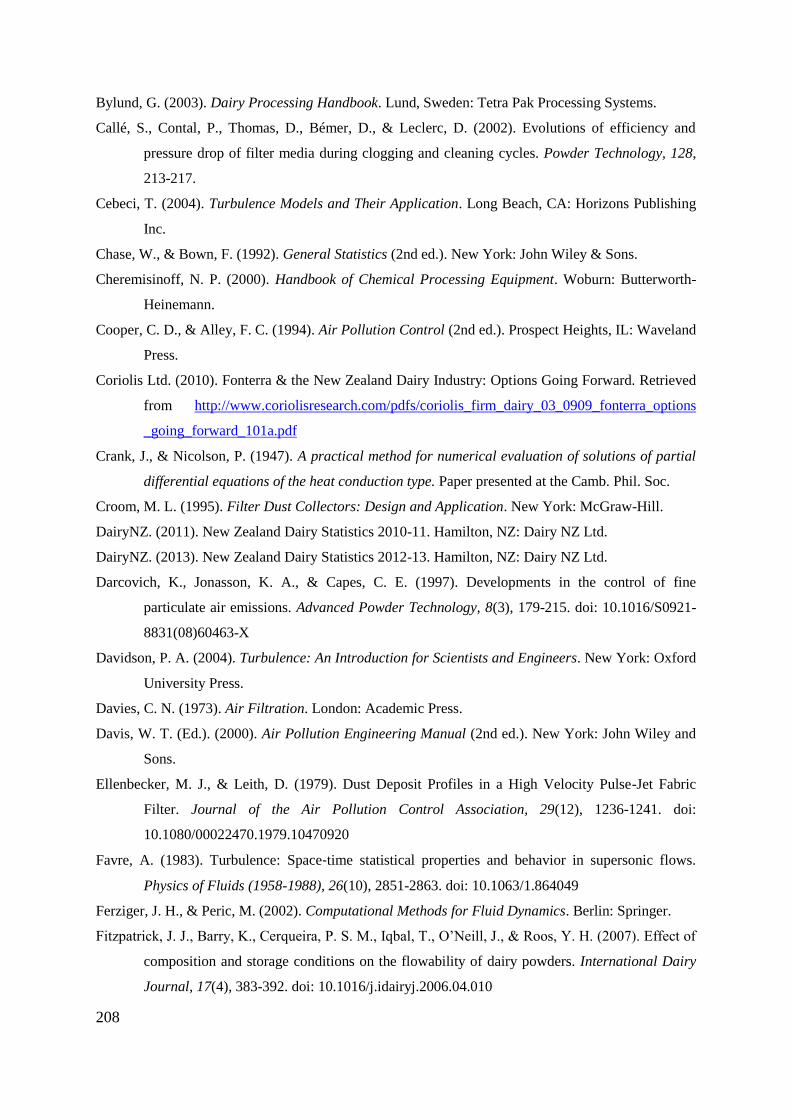
208
Bylund, G. (2003). Dairy Processing Handbook. Lund, Sweden: Tetra Pak Processing Systems.
Callé, S., Contal, P., Thomas, D., Bémer, D., & Leclerc, D. (2002). Evolutions of efficiency and
pressure drop of filter media during clogging and cleaning cycles. Powder Technology, 128,
213-217.
Cebeci, T. (2004). Turbulence Models and Their Application. Long Beach, CA: Horizons Publishing
Inc.
Chase, W., & Bown, F. (1992). General Statistics (2nd ed.). New York: John Wiley & Sons.
Cheremisinoff, N. P. (2000). Handbook of Chemical Processing Equipment. Woburn: Butterworth-
Heinemann.
Cooper, C. D., & Alley, F. C. (1994). Air Pollution Control (2nd ed.). Prospect Heights, IL: Waveland
Press.
Coriolis Ltd. (2010). Fonterra & the New Zealand Dairy Industry: Options Going Forward. Retrieved
from http://www.coriolisresearch.com/pdfs/coriolis_firm_dairy_03_0909_fonterra_options
_going_forward_101a.pdf
Crank, J., & Nicolson, P. (1947). A practical method for numerical evaluation of solutions of partial
differential equations of the heat conduction type. Paper presented at the Camb. Phil. Soc.
Croom, M. L. (1995). Filter Dust Collectors: Design and Application. New York: McGraw-Hill.
DairyNZ. (2011). New Zealand Dairy Statistics 2010-11. Hamilton, NZ: Dairy NZ Ltd.
DairyNZ. (2013). New Zealand Dairy Statistics 2012-13. Hamilton, NZ: Dairy NZ Ltd.
Darcovich, K., Jonasson, K. A., & Capes, C. E. (1997). Developments in the control of fine
particulate air emissions. Advanced Powder Technology, 8(3), 179-215. doi: 10.1016/S0921-
8831(08)60463-X
Davidson, P. A. (2004). Turbulence: An Introduction for Scientists and Engineers. New York: Oxford
University Press.
Davies, C. N. (1973). Air Filtration. London: Academic Press.
Davis, W. T. (Ed.). (2000). Air Pollution Engineering Manual (2nd ed.). New York: John Wiley and
Sons.
Ellenbecker, M. J., & Leith, D. (1979). Dust Deposit Profiles in a High Velocity Pulse-Jet Fabric
Filter. Journal of the Air Pollution Control Association, 29(12), 1236-1241. doi:
10.1080/00022470.1979.10470920
Favre, A. (1983). Turbulence: Space‐time statistical properties and behavior in supersonic flows.
Physics of Fluids (1958-1988), 26(10), 2851-2863. doi: 10.1063/1.864049
Ferziger, J. H., & Peric, M. (2002). Computational Methods for Fluid Dynamics. Berlin: Springer.
Fitzpatrick, J. J., Barry, K., Cerqueira, P. S. M., Iqbal, T., O’Neill, J., & Roos, Y. H. (2007). Effect of
composition and storage conditions on the flowability of dairy powders. International Dairy
Journal, 17(4), 383-392. doi: 10.1016/j.idairyj.2006.04.010
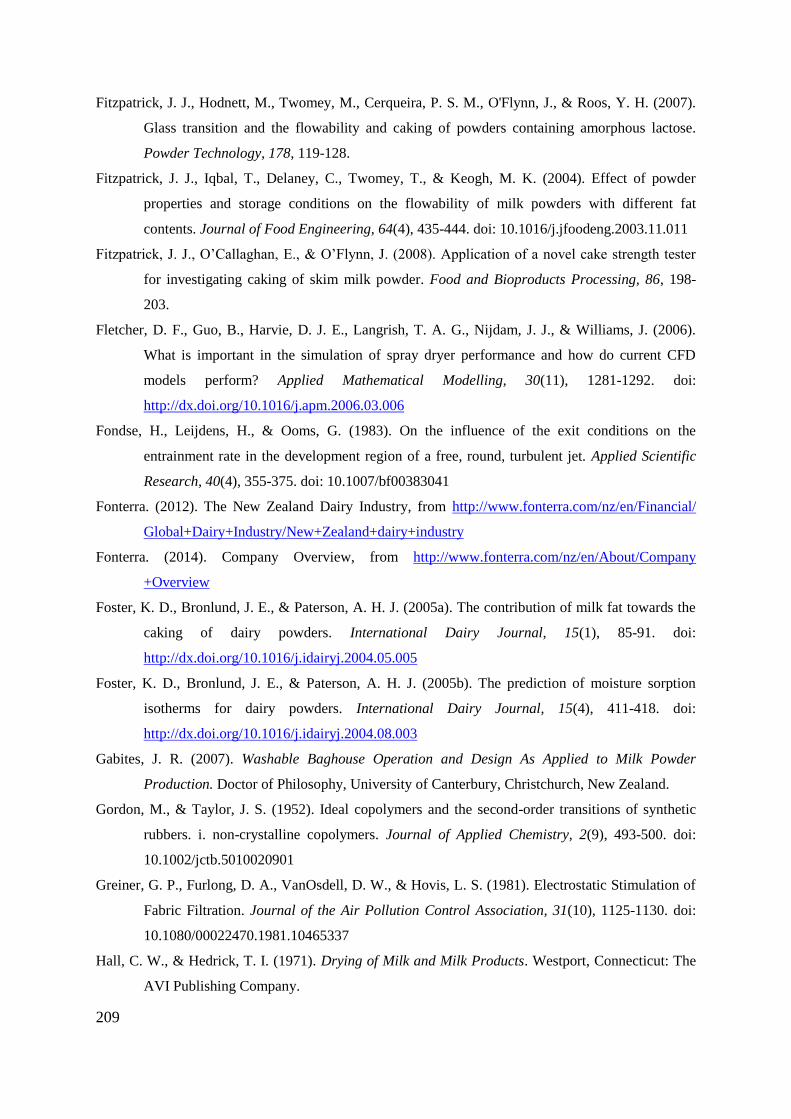
209
Fitzpatrick, J. J., Hodnett, M., Twomey, M., Cerqueira, P. S. M., O'Flynn, J., & Roos, Y. H. (2007).
Glass transition and the flowability and caking of powders containing amorphous lactose.
Powder Technology, 178, 119-128.
Fitzpatrick, J. J., Iqbal, T., Delaney, C., Twomey, T., & Keogh, M. K. (2004). Effect of powder
properties and storage conditions on the flowability of milk powders with different fat
contents. Journal of Food Engineering, 64(4), 435-444. doi: 10.1016/j.jfoodeng.2003.11.011
Fitzpatrick, J. J., O’Callaghan, E., & O’Flynn, J. (2008). Application of a novel cake strength tester
for investigating caking of skim milk powder. Food and Bioproducts Processing, 86, 198-
203.
Fletcher, D. F., Guo, B., Harvie, D. J. E., Langrish, T. A. G., Nijdam, J. J., & Williams, J. (2006).
What is important in the simulation of spray dryer performance and how do current CFD
models perform? Applied Mathematical Modelling, 30(11), 1281-1292. doi:
http://dx.doi.org/10.1016/j.apm.2006.03.006
Fondse, H., Leijdens, H., & Ooms, G. (1983). On the influence of the exit conditions on the
entrainment rate in the development region of a free, round, turbulent jet. Applied Scientific
Research, 40(4), 355-375. doi: 10.1007/bf00383041
Fonterra. (2012). The New Zealand Dairy Industry, from http://www.fonterra.com/nz/en/Financial/
Global+Dairy+Industry/New+Zealand+dairy+industry
Fonterra. (2014). Company Overview, from http://www.fonterra.com/nz/en/About/Company
+Overview
Foster, K. D., Bronlund, J. E., & Paterson, A. H. J. (2005a). The contribution of milk fat towards the
caking of dairy powders. International Dairy Journal, 15(1), 85-91. doi:
http://dx.doi.org/10.1016/j.idairyj.2004.05.005
Foster, K. D., Bronlund, J. E., & Paterson, A. H. J. (2005b). The prediction of moisture sorption
isotherms for dairy powders. International Dairy Journal, 15(4), 411-418. doi:
http://dx.doi.org/10.1016/j.idairyj.2004.08.003
Gabites, J. R. (2007). Washable Baghouse Operation and Design As Applied to Milk Powder
Production. Doctor of Philosophy, University of Canterbury, Christchurch, New Zealand.
Gordon, M., & Taylor, J. S. (1952). Ideal copolymers and the second-order transitions of synthetic
rubbers. i. non-crystalline copolymers. Journal of Applied Chemistry, 2(9), 493-500. doi:
10.1002/jctb.5010020901
Greiner, G. P., Furlong, D. A., VanOsdell, D. W., & Hovis, L. S. (1981). Electrostatic Stimulation of
Fabric Filtration. Journal of the Air Pollution Control Association, 31(10), 1125-1130. doi:
10.1080/00022470.1981.10465337
Hall, C. W., & Hedrick, T. I. (1971). Drying of Milk and Milk Products. Westport, Connecticut: The
AVI Publishing Company.
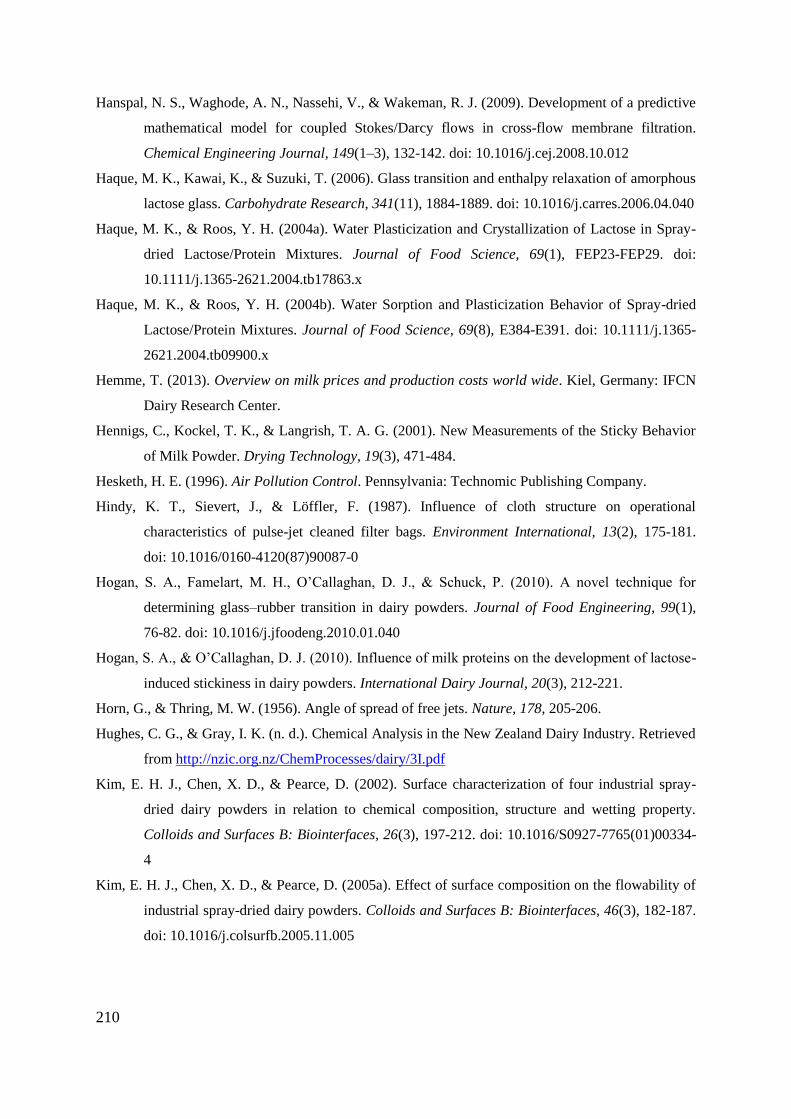
210
Hanspal, N. S., Waghode, A. N., Nassehi, V., & Wakeman, R. J. (2009). Development of a predictive
mathematical model for coupled Stokes/Darcy flows in cross-flow membrane filtration.
Chemical Engineering Journal, 149(1–3), 132-142. doi: 10.1016/j.cej.2008.10.012
Haque, M. K., Kawai, K., & Suzuki, T. (2006). Glass transition and enthalpy relaxation of amorphous
lactose glass. Carbohydrate Research, 341(11), 1884-1889. doi: 10.1016/j.carres.2006.04.040
Haque, M. K., & Roos, Y. H. (2004a). Water Plasticization and Crystallization of Lactose in Spray-
dried Lactose/Protein Mixtures. Journal of Food Science, 69(1), FEP23-FEP29. doi:
10.1111/j.1365-2621.2004.tb17863.x
Haque, M. K., & Roos, Y. H. (2004b). Water Sorption and Plasticization Behavior of Spray-dried
Lactose/Protein Mixtures. Journal of Food Science, 69(8), E384-E391. doi: 10.1111/j.1365-
2621.2004.tb09900.x
Hemme, T. (2013). Overview on milk prices and production costs world wide. Kiel, Germany: IFCN
Dairy Research Center.
Hennigs, C., Kockel, T. K., & Langrish, T. A. G. (2001). New Measurements of the Sticky Behavior
of Milk Powder. Drying Technology, 19(3), 471-484.
Hesketh, H. E. (1996). Air Pollution Control. Pennsylvania: Technomic Publishing Company.
Hindy, K. T., Sievert, J., & Löffler, F. (1987). Influence of cloth structure on operational
characteristics of pulse-jet cleaned filter bags. Environment International, 13(2), 175-181.
doi: 10.1016/0160-4120(87)90087-0
Hogan, S. A., Famelart, M. H., O’Callaghan, D. J., & Schuck, P. (2010). A novel technique for
determining glass–rubber transition in dairy powders. Journal of Food Engineering, 99(1),
76-82. doi: 10.1016/j.jfoodeng.2010.01.040
Hogan, S. A., & O’Callaghan, D. J. (2010). Influence of milk proteins on the development of lactose-
induced stickiness in dairy powders. International Dairy Journal, 20(3), 212-221.
Horn, G., & Thring, M. W. (1956). Angle of spread of free jets. Nature, 178, 205-206.
Hughes, C. G., & Gray, I. K. (n. d.). Chemical Analysis in the New Zealand Dairy Industry. Retrieved
from http://nzic.org.nz/ChemProcesses/dairy/3I.pdf
Kim, E. H. J., Chen, X. D., & Pearce, D. (2002). Surface characterization of four industrial spray-
dried dairy powders in relation to chemical composition, structure and wetting property.
Colloids and Surfaces B: Biointerfaces, 26(3), 197-212. doi: 10.1016/S0927-7765(01)00334-
4
Kim, E. H. J., Chen, X. D., & Pearce, D. (2005a). Effect of surface composition on the flowability of
industrial spray-dried dairy powders. Colloids and Surfaces B: Biointerfaces, 46(3), 182-187.
doi: 10.1016/j.colsurfb.2005.11.005
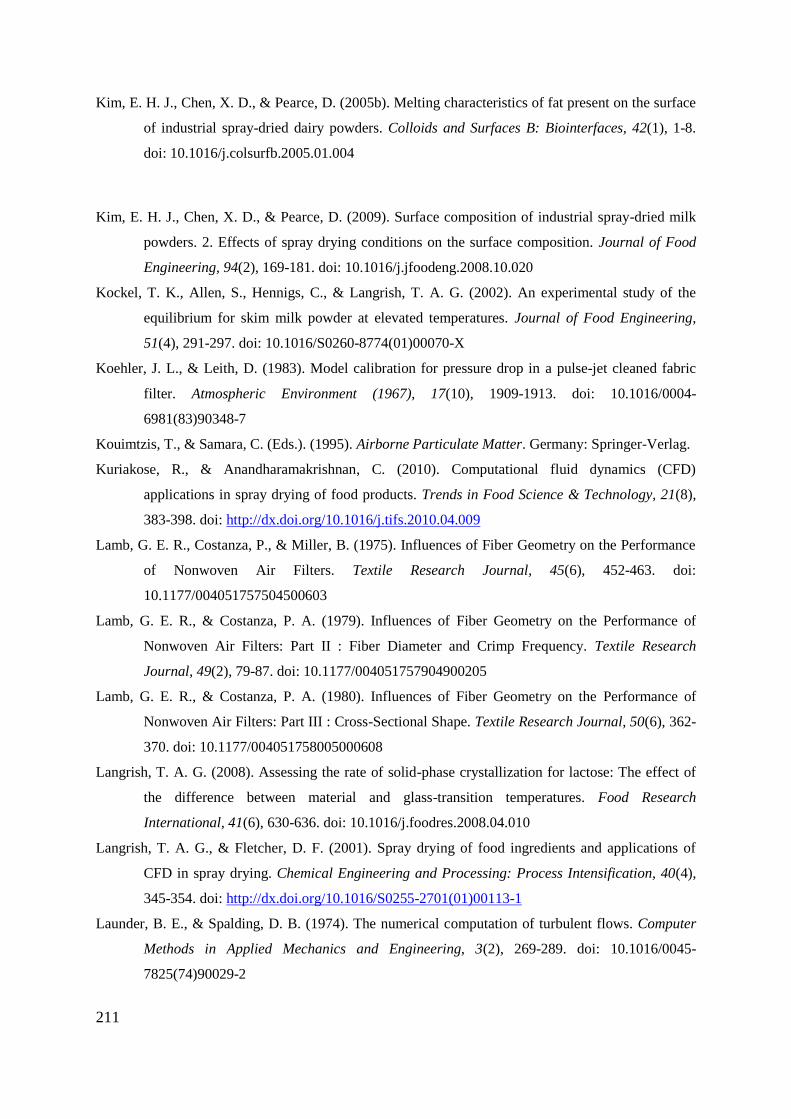
211
Kim, E. H. J., Chen, X. D., & Pearce, D. (2005b). Melting characteristics of fat present on the surface
of industrial spray-dried dairy powders. Colloids and Surfaces B: Biointerfaces, 42(1), 1-8.
doi: 10.1016/j.colsurfb.2005.01.004
Kim, E. H. J., Chen, X. D., & Pearce, D. (2009). Surface composition of industrial spray-dried milk
powders. 2. Effects of spray drying conditions on the surface composition. Journal of Food
Engineering, 94(2), 169-181. doi: 10.1016/j.jfoodeng.2008.10.020
Kockel, T. K., Allen, S., Hennigs, C., & Langrish, T. A. G. (2002). An experimental study of the
equilibrium for skim milk powder at elevated temperatures. Journal of Food Engineering,
51(4), 291-297. doi: 10.1016/S0260-8774(01)00070-X
Koehler, J. L., & Leith, D. (1983). Model calibration for pressure drop in a pulse-jet cleaned fabric
filter. Atmospheric Environment (1967), 17(10), 1909-1913. doi: 10.1016/0004-
6981(83)90348-7
Kouimtzis, T., & Samara, C. (Eds.). (1995). Airborne Particulate Matter. Germany: Springer-Verlag.
Kuriakose, R., & Anandharamakrishnan, C. (2010). Computational fluid dynamics (CFD)
applications in spray drying of food products. Trends in Food Science & Technology, 21(8),
383-398. doi: http://dx.doi.org/10.1016/j.tifs.2010.04.009
Lamb, G. E. R., Costanza, P., & Miller, B. (1975). Influences of Fiber Geometry on the Performance
of Nonwoven Air Filters. Textile Research Journal, 45(6), 452-463. doi:
10.1177/004051757504500603
Lamb, G. E. R., & Costanza, P. A. (1979). Influences of Fiber Geometry on the Performance of
Nonwoven Air Filters: Part II : Fiber Diameter and Crimp Frequency. Textile Research
Journal, 49(2), 79-87. doi: 10.1177/004051757904900205
Lamb, G. E. R., & Costanza, P. A. (1980). Influences of Fiber Geometry on the Performance of
Nonwoven Air Filters: Part III : Cross-Sectional Shape. Textile Research Journal, 50(6), 362-
370. doi: 10.1177/004051758005000608
Langrish, T. A. G. (2008). Assessing the rate of solid-phase crystallization for lactose: The effect of
the difference between material and glass-transition temperatures. Food Research
International, 41(6), 630-636. doi: 10.1016/j.foodres.2008.04.010
Langrish, T. A. G., & Fletcher, D. F. (2001). Spray drying of food ingredients and applications of
CFD in spray drying. Chemical Engineering and Processing: Process Intensification, 40(4),
345-354. doi: http://dx.doi.org/10.1016/S0255-2701(01)00113-1
Launder, B. E., & Spalding, D. B. (1974). The numerical computation of turbulent flows. Computer
Methods in Applied Mechanics and Engineering, 3(2), 269-289. doi: 10.1016/0045-
7825(74)90029-2
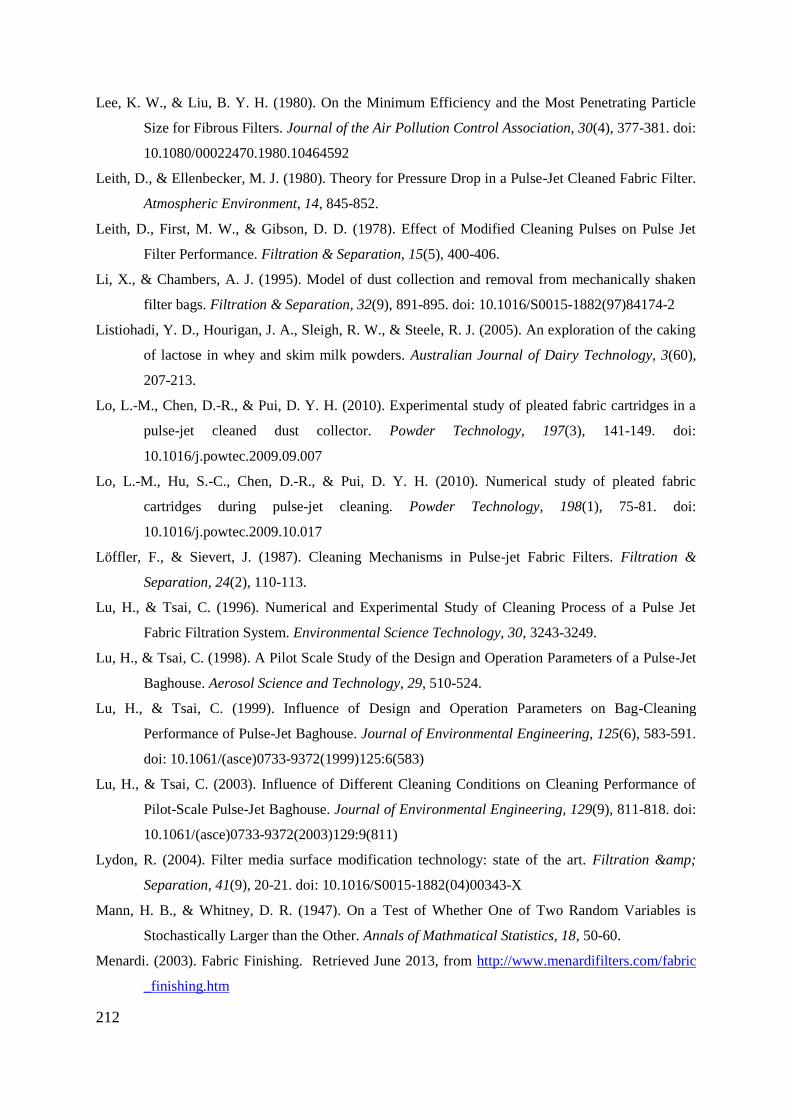
212
Lee, K. W., & Liu, B. Y. H. (1980). On the Minimum Efficiency and the Most Penetrating Particle
Size for Fibrous Filters. Journal of the Air Pollution Control Association, 30(4), 377-381. doi:
10.1080/00022470.1980.10464592
Leith, D., & Ellenbecker, M. J. (1980). Theory for Pressure Drop in a Pulse-Jet Cleaned Fabric Filter.
Atmospheric Environment, 14, 845-852.
Leith, D., First, M. W., & Gibson, D. D. (1978). Effect of Modified Cleaning Pulses on Pulse Jet
Filter Performance. Filtration & Separation, 15(5), 400-406.
Li, X., & Chambers, A. J. (1995). Model of dust collection and removal from mechanically shaken
filter bags. Filtration & Separation, 32(9), 891-895. doi: 10.1016/S0015-1882(97)84174-2
Listiohadi, Y. D., Hourigan, J. A., Sleigh, R. W., & Steele, R. J. (2005). An exploration of the caking
of lactose in whey and skim milk powders. Australian Journal of Dairy Technology, 3(60),
207-213.
Lo, L.-M., Chen, D.-R., & Pui, D. Y. H. (2010). Experimental study of pleated fabric cartridges in a
pulse-jet cleaned dust collector. Powder Technology, 197(3), 141-149. doi:
10.1016/j.powtec.2009.09.007
Lo, L.-M., Hu, S.-C., Chen, D.-R., & Pui, D. Y. H. (2010). Numerical study of pleated fabric
cartridges during pulse-jet cleaning. Powder Technology, 198(1), 75-81. doi:
10.1016/j.powtec.2009.10.017
Löffler, F., & Sievert, J. (1987). Cleaning Mechanisms in Pulse-jet Fabric Filters. Filtration &
Separation, 24(2), 110-113.
Lu, H., & Tsai, C. (1996). Numerical and Experimental Study of Cleaning Process of a Pulse Jet
Fabric Filtration System. Environmental Science Technology, 30, 3243-3249.
Lu, H., & Tsai, C. (1998). A Pilot Scale Study of the Design and Operation Parameters of a Pulse-Jet
Baghouse. Aerosol Science and Technology, 29, 510-524.
Lu, H., & Tsai, C. (1999). Influence of Design and Operation Parameters on Bag-Cleaning
Performance of Pulse-Jet Baghouse. Journal of Environmental Engineering, 125(6), 583-591.
doi: 10.1061/(asce)0733-9372(1999)125:6(583)
Lu, H., & Tsai, C. (2003). Influence of Different Cleaning Conditions on Cleaning Performance of
Pilot-Scale Pulse-Jet Baghouse. Journal of Environmental Engineering, 129(9), 811-818. doi:
10.1061/(asce)0733-9372(2003)129:9(811)
Lydon, R. (2004). Filter media surface modification technology: state of the art. Filtration &
Separation, 41(9), 20-21. doi: 10.1016/S0015-1882(04)00343-X
Mann, H. B., & Whitney, D. R. (1947). On a Test of Whether One of Two Random Variables is
Stochastically Larger than the Other. Annals of Mathmatical Statistics, 18, 50-60.
Menardi. (2003). Fabric Finishing. Retrieved June 2013, from http://www.menardifilters.com/fabric
_finishing.htm
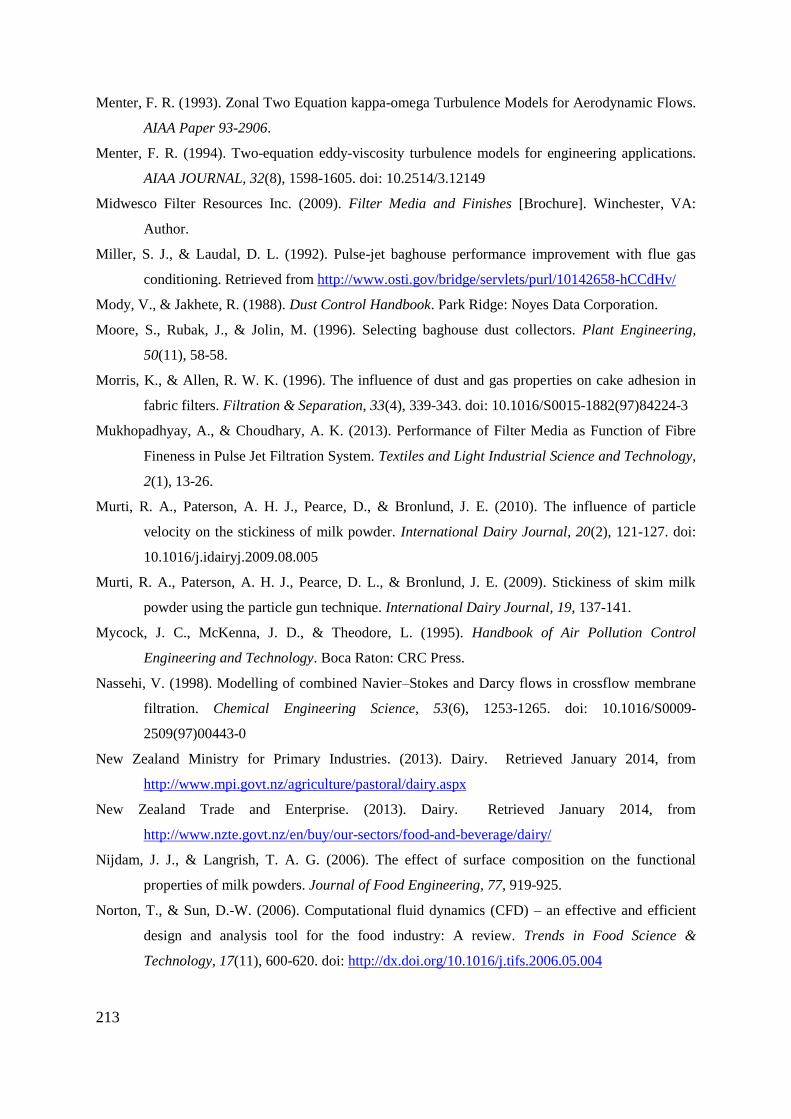
213
Menter, F. R. (1993). Zonal Two Equation kappa-omega Turbulence Models for Aerodynamic Flows.
AIAA Paper 93-2906.
Menter, F. R. (1994). Two-equation eddy-viscosity turbulence models for engineering applications.
AIAA JOURNAL, 32(8), 1598-1605. doi: 10.2514/3.12149
Midwesco Filter Resources Inc. (2009). Filter Media and Finishes [Brochure]. Winchester, VA:
Author.
Miller, S. J., & Laudal, D. L. (1992). Pulse-jet baghouse performance improvement with flue gas
conditioning. Retrieved from http://www.osti.gov/bridge/servlets/purl/10142658-hCCdHv/
Mody, V., & Jakhete, R. (1988). Dust Control Handbook. Park Ridge: Noyes Data Corporation.
Moore, S., Rubak, J., & Jolin, M. (1996). Selecting baghouse dust collectors. Plant Engineering,
50(11), 58-58.
Morris, K., & Allen, R. W. K. (1996). The influence of dust and gas properties on cake adhesion in
fabric filters. Filtration & Separation, 33(4), 339-343. doi: 10.1016/S0015-1882(97)84224-3
Mukhopadhyay, A., & Choudhary, A. K. (2013). Performance of Filter Media as Function of Fibre
Fineness in Pulse Jet Filtration System. Textiles and Light Industrial Science and Technology,
2(1), 13-26.
Murti, R. A., Paterson, A. H. J., Pearce, D., & Bronlund, J. E. (2010). The influence of particle
velocity on the stickiness of milk powder. International Dairy Journal, 20(2), 121-127. doi:
10.1016/j.idairyj.2009.08.005
Murti, R. A., Paterson, A. H. J., Pearce, D. L., & Bronlund, J. E. (2009). Stickiness of skim milk
powder using the particle gun technique. International Dairy Journal, 19, 137-141.
Mycock, J. C., McKenna, J. D., & Theodore, L. (1995). Handbook of Air Pollution Control
Engineering and Technology. Boca Raton: CRC Press.
Nassehi, V. (1998). Modelling of combined Navier–Stokes and Darcy flows in crossflow membrane
filtration. Chemical Engineering Science, 53(6), 1253-1265. doi: 10.1016/S0009-
2509(97)00443-0
New Zealand Ministry for Primary Industries. (2013). Dairy. Retrieved January 2014, from
http://www.mpi.govt.nz/agriculture/pastoral/dairy.aspx
New Zealand Trade and Enterprise. (2013). Dairy. Retrieved January 2014, from
http://www.nzte.govt.nz/en/buy/our-sectors/food-and-beverage/dairy/
Nijdam, J. J., & Langrish, T. A. G. (2006). The effect of surface composition on the functional
properties of milk powders. Journal of Food Engineering, 77, 919-925.
Norton, T., & Sun, D.-W. (2006). Computational fluid dynamics (CFD) – an effective and efficient
design and analysis tool for the food industry: A review. Trends in Food Science &
Technology, 17(11), 600-620. doi: http://dx.doi.org/10.1016/j.tifs.2006.05.004
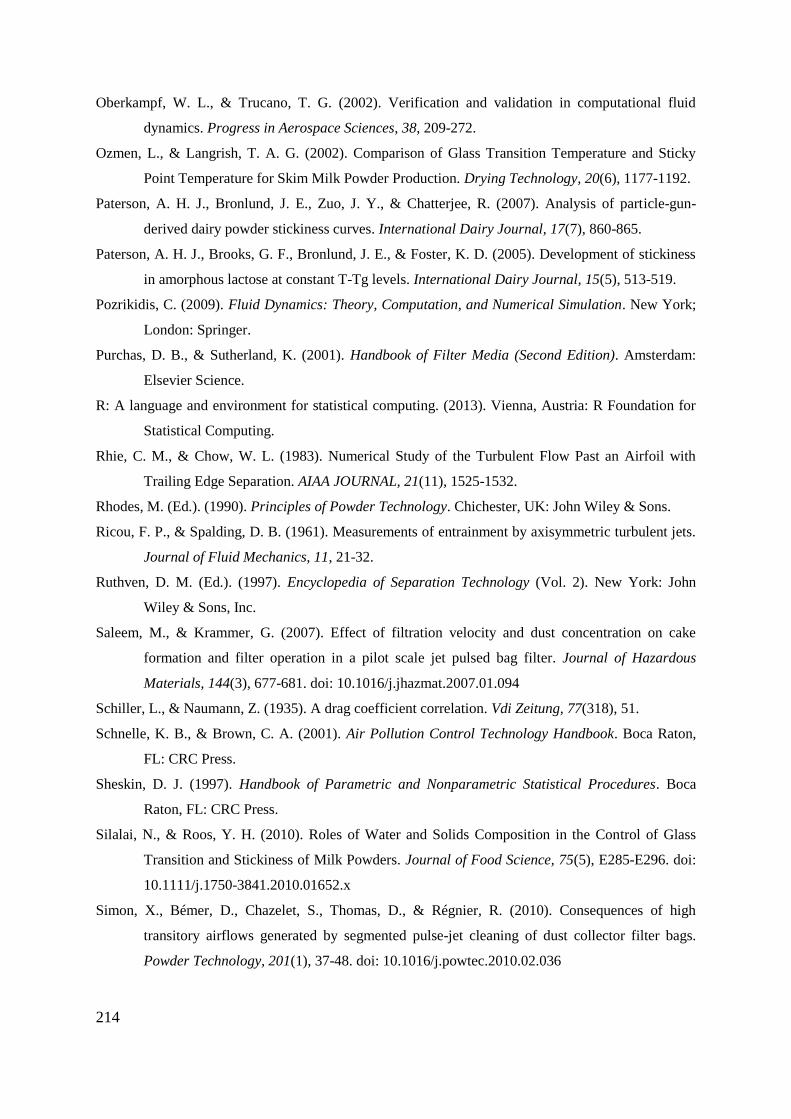
214
Oberkampf, W. L., & Trucano, T. G. (2002). Verification and validation in computational fluid
dynamics. Progress in Aerospace Sciences, 38, 209-272.
Ozmen, L., & Langrish, T. A. G. (2002). Comparison of Glass Transition Temperature and Sticky
Point Temperature for Skim Milk Powder Production. Drying Technology, 20(6), 1177-1192.
Paterson, A. H. J., Bronlund, J. E., Zuo, J. Y., & Chatterjee, R. (2007). Analysis of particle-gun-
derived dairy powder stickiness curves. International Dairy Journal, 17(7), 860-865.
Paterson, A. H. J., Brooks, G. F., Bronlund, J. E., & Foster, K. D. (2005). Development of stickiness
in amorphous lactose at constant T-Tg levels. International Dairy Journal, 15(5), 513-519.
Pozrikidis, C. (2009). Fluid Dynamics: Theory, Computation, and Numerical Simulation. New York;
London: Springer.
Purchas, D. B., & Sutherland, K. (2001). Handbook of Filter Media (Second Edition). Amsterdam:
Elsevier Science.
R: A language and environment for statistical computing. (2013). Vienna, Austria: R Foundation for
Statistical Computing.
Rhie, C. M., & Chow, W. L. (1983). Numerical Study of the Turbulent Flow Past an Airfoil with
Trailing Edge Separation. AIAA JOURNAL, 21(11), 1525-1532.
Rhodes, M. (Ed.). (1990). Principles of Powder Technology. Chichester, UK: John Wiley & Sons.
Ricou, F. P., & Spalding, D. B. (1961). Measurements of entrainment by axisymmetric turbulent jets.
Journal of Fluid Mechanics, 11, 21-32.
Ruthven, D. M. (Ed.). (1997). Encyclopedia of Separation Technology (Vol. 2). New York: John
Wiley & Sons, Inc.
Saleem, M., & Krammer, G. (2007). Effect of filtration velocity and dust concentration on cake
formation and filter operation in a pilot scale jet pulsed bag filter. Journal of Hazardous
Materials, 144(3), 677-681. doi: 10.1016/j.jhazmat.2007.01.094
Schiller, L., & Naumann, Z. (1935). A drag coefficient correlation. Vdi Zeitung, 77(318), 51.
Schnelle, K. B., & Brown, C. A. (2001). Air Pollution Control Technology Handbook. Boca Raton,
FL: CRC Press.
Sheskin, D. J. (1997). Handbook of Parametric and Nonparametric Statistical Procedures. Boca
Raton, FL: CRC Press.
Silalai, N., & Roos, Y. H. (2010). Roles of Water and Solids Composition in the Control of Glass
Transition and Stickiness of Milk Powders. Journal of Food Science, 75(5), E285-E296. doi:
10.1111/j.1750-3841.2010.01652.x
Simon, X., Bémer, D., Chazelet, S., Thomas, D., & Régnier, R. (2010). Consequences of high
transitory airflows generated by segmented pulse-jet cleaning of dust collector filter bags.
Powder Technology, 201(1), 37-48. doi: 10.1016/j.powtec.2010.02.036
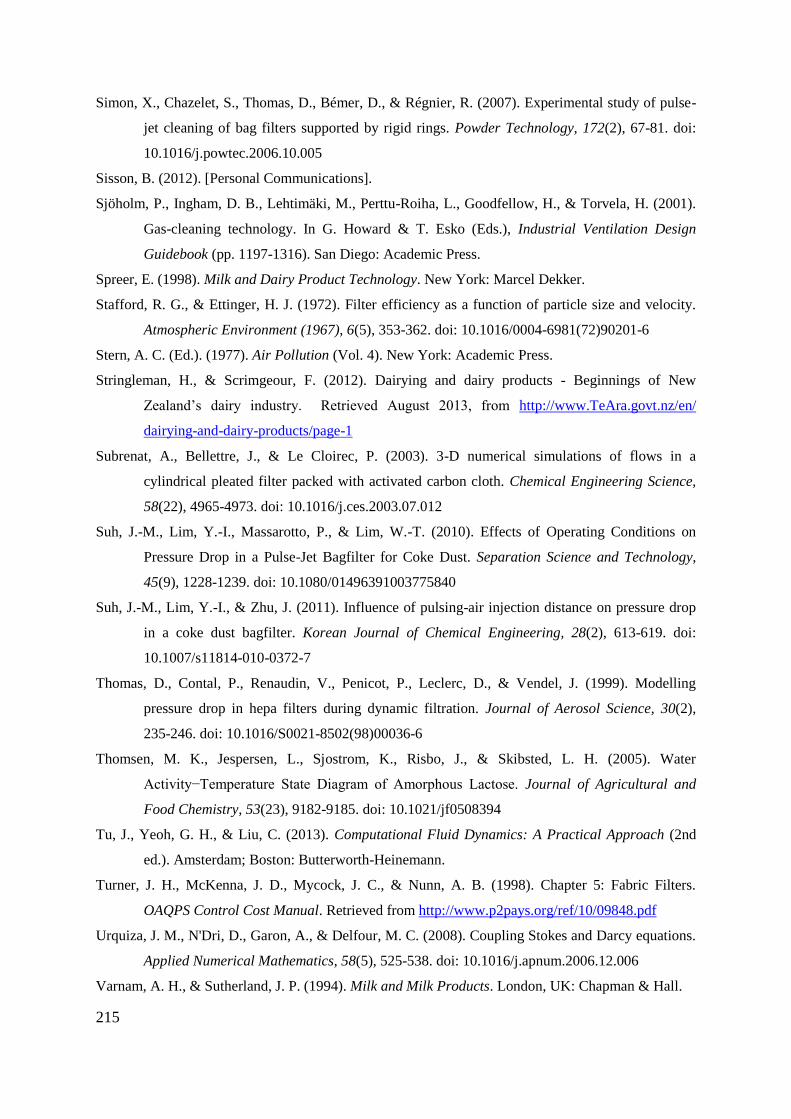
215
Simon, X., Chazelet, S., Thomas, D., Bémer, D., & Régnier, R. (2007). Experimental study of pulse-
jet cleaning of bag filters supported by rigid rings. Powder Technology, 172(2), 67-81. doi:
10.1016/j.powtec.2006.10.005
Sisson, B. (2012). [Personal Communications].
Sjöholm, P., Ingham, D. B., Lehtimäki, M., Perttu-Roiha, L., Goodfellow, H., & Torvela, H. (2001).
Gas-cleaning technology. In G. Howard & T. Esko (Eds.), Industrial Ventilation Design
Guidebook (pp. 1197-1316). San Diego: Academic Press.
Spreer, E. (1998). Milk and Dairy Product Technology. New York: Marcel Dekker.
Stafford, R. G., & Ettinger, H. J. (1972). Filter efficiency as a function of particle size and velocity.
Atmospheric Environment (1967), 6(5), 353-362. doi: 10.1016/0004-6981(72)90201-6
Stern, A. C. (Ed.). (1977). Air Pollution (Vol. 4). New York: Academic Press.
Stringleman, H., & Scrimgeour, F. (2012). Dairying and dairy products - Beginnings of New
Zealand’s dairy industry. Retrieved August 2013, from http://www.TeAra.govt.nz/en/
dairying-and-dairy-products/page-1
Subrenat, A., Bellettre, J., & Le Cloirec, P. (2003). 3-D numerical simulations of flows in a
cylindrical pleated filter packed with activated carbon cloth. Chemical Engineering Science,
58(22), 4965-4973. doi: 10.1016/j.ces.2003.07.012
Suh, J.-M., Lim, Y.-I., Massarotto, P., & Lim, W.-T. (2010). Effects of Operating Conditions on
Pressure Drop in a Pulse-Jet Bagfilter for Coke Dust. Separation Science and Technology,
45(9), 1228-1239. doi: 10.1080/01496391003775840
Suh, J.-M., Lim, Y.-I., & Zhu, J. (2011). Influence of pulsing-air injection distance on pressure drop
in a coke dust bagfilter. Korean Journal of Chemical Engineering, 28(2), 613-619. doi:
10.1007/s11814-010-0372-7
Thomas, D., Contal, P., Renaudin, V., Penicot, P., Leclerc, D., & Vendel, J. (1999). Modelling
pressure drop in hepa filters during dynamic filtration. Journal of Aerosol Science, 30(2),
235-246. doi: 10.1016/S0021-8502(98)00036-6
Thomsen, M. K., Jespersen, L., Sjostrom, K., Risbo, J., & Skibsted, L. H. (2005). Water
Activity−Temperature State Diagram of Amorphous Lactose. Journal of Agricultural and
Food Chemistry, 53(23), 9182-9185. doi: 10.1021/jf0508394
Tu, J., Yeoh, G. H., & Liu, C. (2013). Computational Fluid Dynamics: A Practical Approach (2nd
ed.). Amsterdam; Boston: Butterworth-Heinemann.
Turner, J. H., McKenna, J. D., Mycock, J. C., & Nunn, A. B. (1998). Chapter 5: Fabric Filters.
OAQPS Control Cost Manual. Retrieved from http://www.p2pays.org/ref/10/09848.pdf
Urquiza, J. M., N'Dri, D., Garon, A., & Delfour, M. C. (2008). Coupling Stokes and Darcy equations.
Applied Numerical Mathematics, 58(5), 525-538. doi: 10.1016/j.apnum.2006.12.006
Varnam, A. H., & Sutherland, J. P. (1994). Milk and Milk Products. London, UK: Chapman & Hall.
216
Versteeg, H. K., & Malalasekera, W. (2007). An Introduction to Computational Fluid Dynamics: The
Finite Volume Method (2nd ed.). Harlow, England: Pearson Education Ltd.
Vuataz, G. (2002). The phase diagram of milk: a new tool for optimising the drying process. Lait,
82(4), 485-500.
Walmsley, T. G., Walmsley, M. R. W., Atkins, M. J., Neale, J. R., & Sellers, C. M. (2014). An
experimentally validated criterion for skim milk powder deposition on stainless steel surfaces.
Journal of Food Engineering, 127(0), 111-119. doi: 10.1016/j.jfoodeng.2013.11.025
Weigert, T., & Ripperger, S. (1997). Effect of filter fabric blinding on cake filtration. Filtration
& Separation, 34(5), 507-510. doi: 10.1016/S0015-1882(97)84764-7
Weisstein, E. W. (n. d.). Quantile-Quantile plot. MathWorld--A Wolfram Web Resource. Retrieved
January 2014, from http://mathworld.wolfram.com/Quantile-QuantilePlot.html
Wesseling, P. (2001). Principles of Computational Fluid Dynamics. Berlin: Springer.
Wilcox, D. C. (1988). Reassessment of the scale-determining equation for advanced turbulence
models. AIAA JOURNAL, 26(11), 1299-1310. doi: 10.2514/3.10041
Wiley, D. E., & Fletcher, D. F. (2002). Computational fluid dynamics modelling of flow and
permeation for pressure-driven membrane processes. Desalination, 145(1–3), 183-186. doi:
10.1016/S0011-9164(02)00406-X
Wiley, D. E., & Fletcher, D. F. (2003). Techniques for computational fluid dynamics modelling of
flow in membrane channels. Journal of Membrane Science, 211(1), 127-137. doi:
10.1016/S0376-7388(02)00412-X
Winchester, J. (2010). [Personal Communications].
Zikanov, O. (2010). Essential Computational Fluid Dynamics. Hoboken, New Jersey: John Wiley and
Sons, Inc.
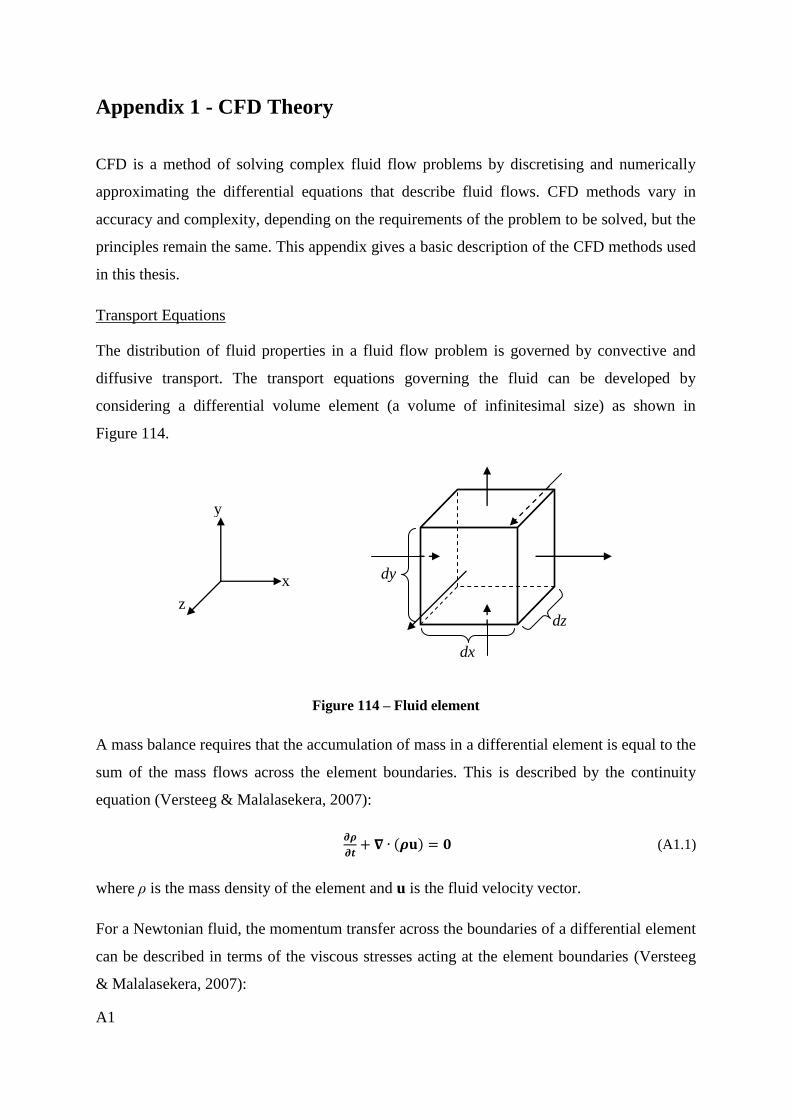
A1
Appendix 1 - CFD Theory
CFD is a method of solving complex fluid flow problems by discretising and numerically
approximating the differential equations that describe fluid flows. CFD methods vary in
accuracy and complexity, depending on the requirements of the problem to be solved, but the
principles remain the same. This appendix gives a basic description of the CFD methods used
in this thesis.
Transport Equations
The distribution of fluid properties in a fluid flow problem is governed by convective and
diffusive transport. The transport equations governing the fluid can be developed by
considering a differential volume element (a volume of infinitesimal size) as shown in
Figure 114.
Figure 114 – Fluid element
A mass balance requires that the accumulation of mass in a differential element is equal to the
sum of the mass flows across the element boundaries. This is described by the continuity
equation (Versteeg & Malalasekera, 2007):
(A1.1)
where ρ is the mass density of the element and u is the fluid velocity vector.
For a Newtonian fluid, the momentum transfer across the boundaries of a differential element
can be described in terms of the viscous stresses acting at the element boundaries (Versteeg
& Malalasekera, 2007):
x
y
z
dx
dy
dz
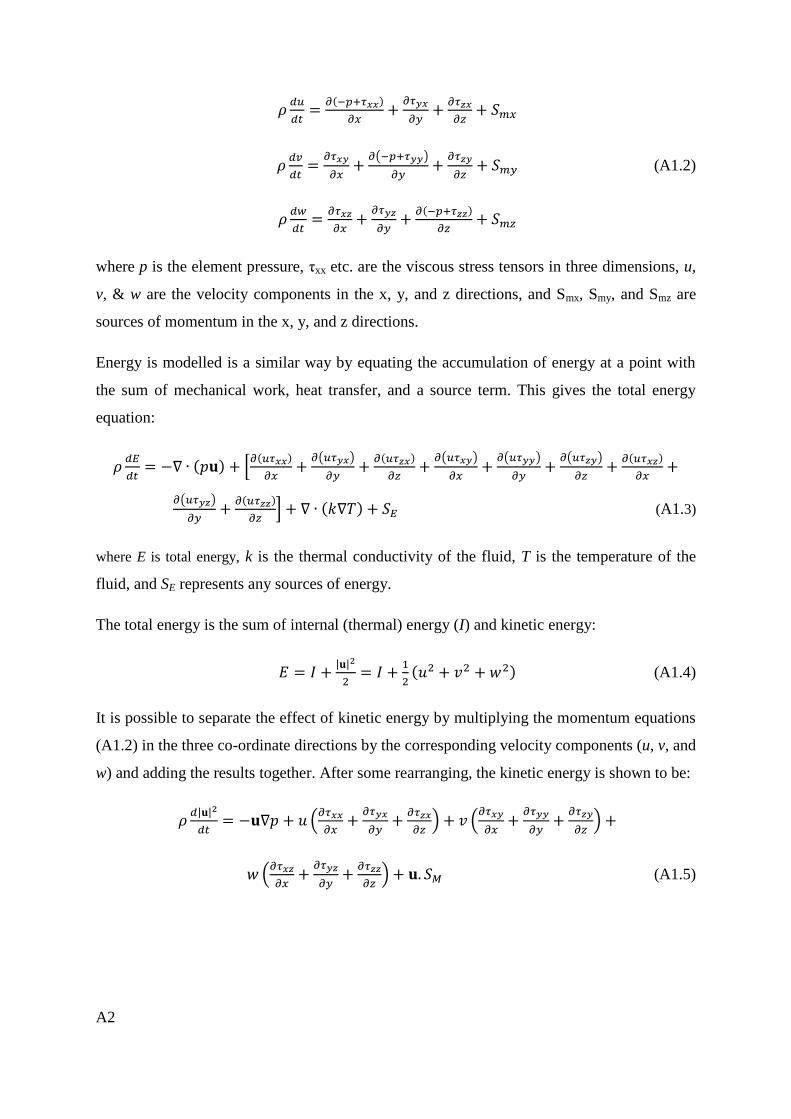
A2
( )
(A1.2)
where p is the element pressure, τxx etc. are the viscous stress tensors in three dimensions, u,
v, & w are the velocity components in the x, y, and z directions, and Smx, Smy, and Smz are
sources of momentum in the x, y, and z directions.
Energy is modelled is a similar way by equating the accumulation of energy at a point with
the sum of mechanical work, heat transfer, and a source term. This gives the total energy
equation:
*
( )
( )
( )
( )
( )
+ (A1.3)
where E is total energy, k is the thermal conductivity of the fluid, T is the temperature of the
fluid, and SE represents any sources of energy.
The total energy is the sum of internal (thermal) energy (I) and kinetic energy:
| |
(A1.4)
It is possible to separate the effect of kinetic energy by multiplying the momentum equations
(A1.2) in the three co-ordinate directions by the corresponding velocity components (u, v, and
w) and adding the results together. After some rearranging, the kinetic energy is shown to be:
| |
(
) (
)
(
) (A1.5)
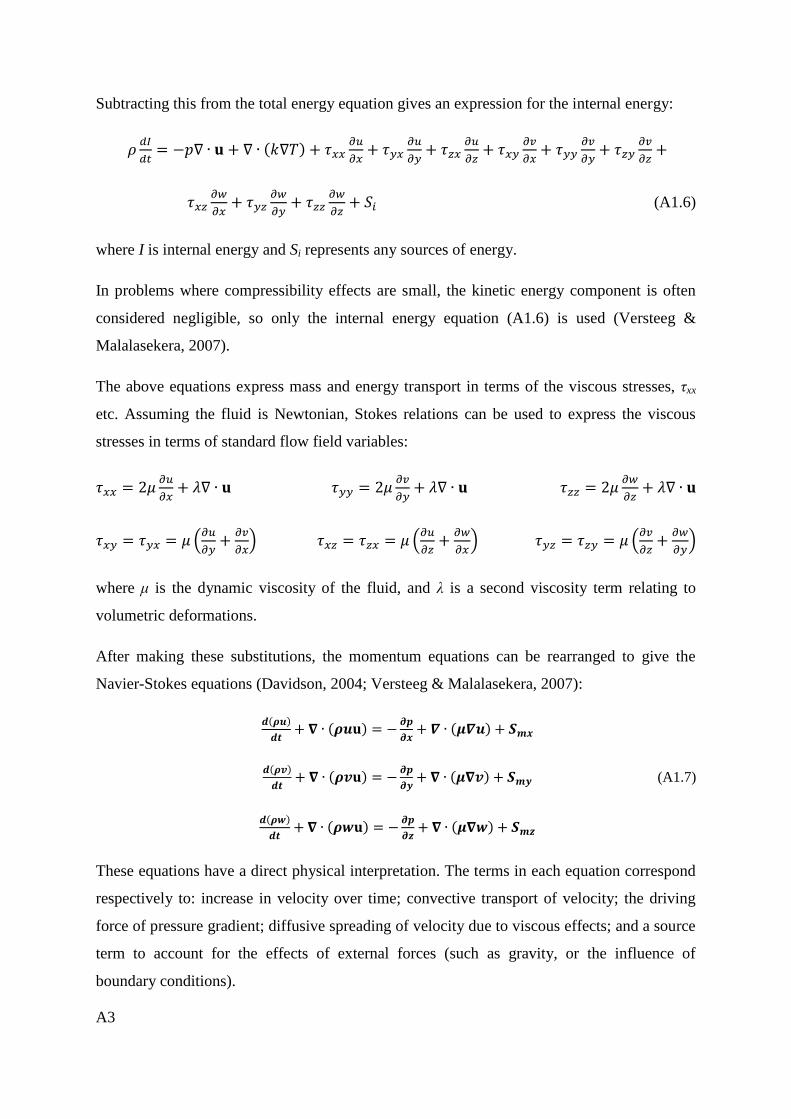
A3
Subtracting this from the total energy equation gives an expression for the internal energy:
(A1.6)
where I is internal energy and Si represents any sources of energy.
In problems where compressibility effects are small, the kinetic energy component is often
considered negligible, so only the internal energy equation (A1.6) is used (Versteeg &
Malalasekera, 2007).
The above equations express mass and energy transport in terms of the viscous stresses, τxx
etc. Assuming the fluid is Newtonian, Stokes relations can be used to express the viscous
stresses in terms of standard flow field variables:
2
2
2
(
) (
) (
)
where μ is the dynamic viscosity of the fluid, and λ is a second viscosity term relating to
volumetric deformations.
After making these substitutions, the momentum equations can be rearranged to give the
Navier-Stokes equations (Davidson, 2004; Versteeg & Malalasekera, 2007):
(A1.7)
These equations have a direct physical interpretation. The terms in each equation correspond
respectively to: increase in velocity over time; convective transport of velocity; the driving
force of pressure gradient; diffusive spreading of velocity due to viscous effects; and a source
term to account for the effects of external forces (such as gravity, or the influence of
boundary conditions).
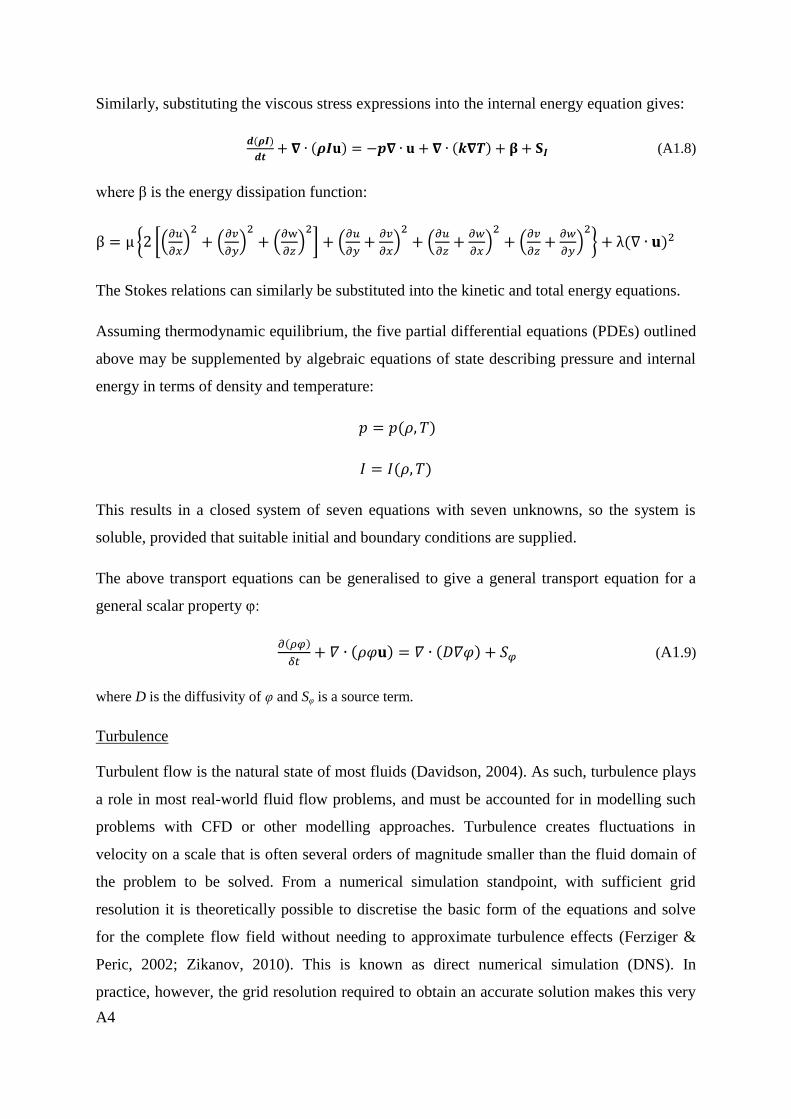
A4
Similarly, substituting the viscous stress expressions into the internal energy equation gives:
(A1.8)
where β is the energy dissipation function:
β μ {2 [(
)
(
)
(
)
] (
)
(
)
(
)
} λ
The Stokes relations can similarly be substituted into the kinetic and total energy equations.
Assuming thermodynamic equilibrium, the five partial differential equations (PDEs) outlined
above may be supplemented by algebraic equations of state describing pressure and internal
energy in terms of density and temperature:
,
,
This results in a closed system of seven equations with seven unknowns, so the system is
soluble, provided that suitable initial and boundary conditions are supplied.
The above transport equations can be generalised to give a general transport equation for a
general scalar property υ:
(A1.9)
where D is the diffusivity of φ and Sφ is a source term.
Turbulence
Turbulent flow is the natural state of most fluids (Davidson, 2004). As such, turbulence plays
a role in most real-world fluid flow problems, and must be accounted for in modelling such
problems with CFD or other modelling approaches. Turbulence creates fluctuations in
velocity on a scale that is often several orders of magnitude smaller than the fluid domain of
the problem to be solved. From a numerical simulation standpoint, with sufficient grid
resolution it is theoretically possible to discretise the basic form of the equations and solve
for the complete flow field without needing to approximate turbulence effects (Ferziger &
Peric, 2002; Zikanov, 2010). This is known as direct numerical simulation (DNS). In
practice, however, the grid resolution required to obtain an accurate solution makes this very
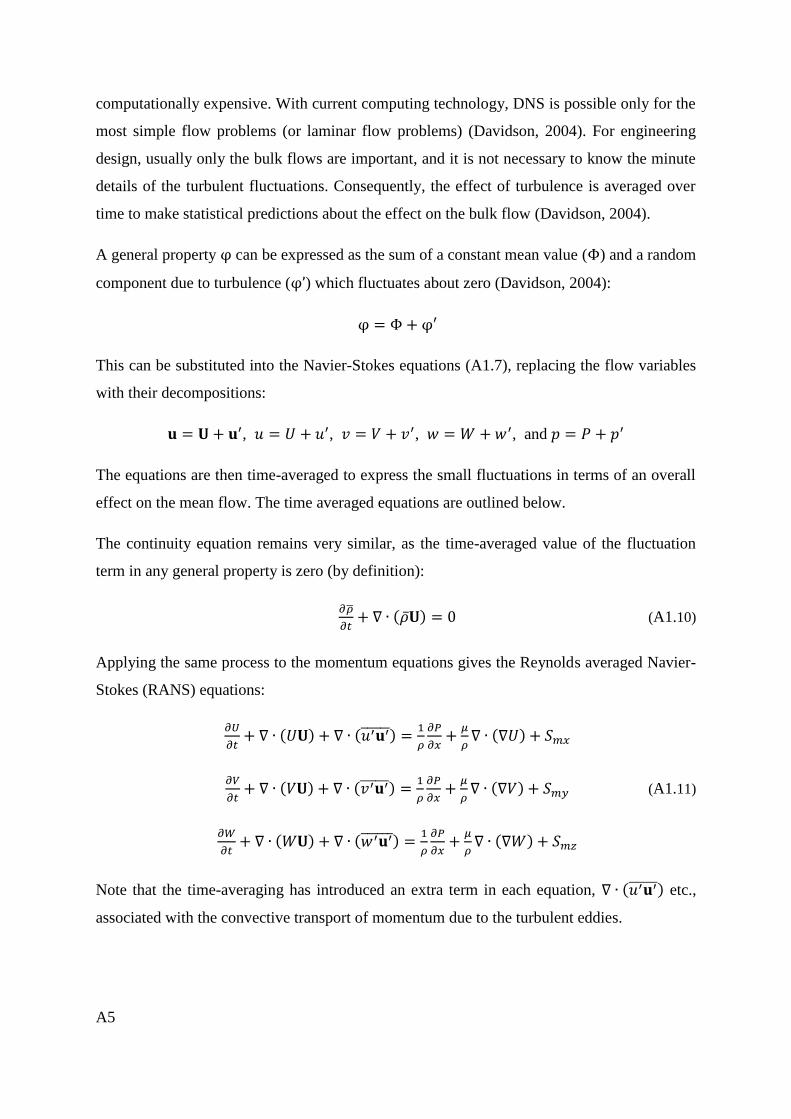
A5
computationally expensive. With current computing technology, DNS is possible only for the
most simple flow problems (or laminar flow problems) (Davidson, 2004). For engineering
design, usually only the bulk flows are important, and it is not necessary to know the minute
details of the turbulent fluctuations. Consequently, the effect of turbulence is averaged over
time to make statistical predictions about the effect on the bulk flow (Davidson, 2004).
A general property φ can be expressed as the sum of a constant mean value (Φ) and a random
component due to turbulence (φ’) which fluctuates about zero (Davidson, 2004):
φ Φ φ
This can be substituted into the Navier-Stokes equations (A1.7), replacing the flow variables
with their decompositions:
, , , , and
The equations are then time-averaged to express the small fluctuations in terms of an overall
effect on the mean flow. The time averaged equations are outlined below.
The continuity equation remains very similar, as the time-averaged value of the fluctuation
term in any general property is zero (by definition):
(A1.10)
Applying the same process to the momentum equations gives the Reynolds averaged Navier-
Stokes (RANS) equations:
(A1.11)
Note that the time-averaging has introduced an extra term in each equation, etc.,
associated with the convective transport of momentum due to the turbulent eddies.
A6
The above form of the Navier-Stokes equations assumes that the fluid density remains
constant. In cases where compressibility effects become significant, Favre (density-weighted)
averaging (Favre, 1983) is used. The Favre average is defined as follows:
where is the Favre (density-weighted) average of the velocity component U. Applying this
to the momentum equations yields the following:
( )
( ) ( ) (A1.12)
This form of the equation accounts for variations in the mean density, , but ignores the
turbulent fluctuation component of the density (ρ’), assuming that this has a negligible effect
on the solution. Note that the extra momentum term has been placed on the right hand side of
the equation, as per convention, as they are essentially additional turbulent stresses affecting
the mean velocity components.
Finally, the general transport equation for a scalar variable becomes:
( )
( Φ ) ( Φ) ( ) (A1.13)
The basic RANS equations (A1.11) introduce an additional six unknowns, in the form of the
Reynolds Stresses , , , , , and . In addition, the
general scalar transport equation (A1.13) contains the unknown products , , and
. In order to solve the system of equations, it is necessary to develop turbulence models
to predict these unknown products. Various models have been proposed, the most common of
which are the k-ε model and the Reynolds Stress model.
An expression for the kinetic energy carried by the mean flow, K, can be developed by
multiplying the Reynolds-averaged momentum equations by the respective mean velocity
components U, V and W, and summing the results. This is analogous to the derivation of
Equation A1.5, and gives the following expression:
( 2
) 2
(A1.14)
A7
where S is the mean component of the local deformation rate, s, and the i and j subscripts
denote tensors in the three co-ordinate directions:
[
] and [ ]
An expression for the instantaneous turbulent kinetic energy, k’, can be developed by
multiplying the component velocity fluctuations u’, v’ and w’ by the corresponding
instantaneous Navier-Stokes equations (A1.7) and summing the results, then similarly
multiplying u’ etc. by the corresponding Reynolds equations (A1.11) and summing the
results, then subtracting the two resulting summed equations. After substantial algebra, the
following expression is obtained:
( )
( 2
) 2
(A1.15)
where s’ is the fluctuating component of the turbulent stress.
Note that the final terms in Equations A1.14 and A1.15 are opposite in sign but otherwise
identical. These terms relate to the conversion of mean flow kinetic energy into turbulence
energy, thus producing a loss of mean flow energy and a gain of turbulence energy.
Turbulence kinetic energy is dissipated by the smallest eddies, which do work against the
viscous stresses (Versteeg & Malalasekera, 2007). This is expressed by the 2
term
in the k equation. Dividing this term by the density gives the turbulence energy dissipation
per unit mass, ε:
2
The standard k-ε turbulence model (Launder & Spalding, 1974) has two transport equations
for k and ε as follows:
(
) 2 (A1.16)
(
)
2
(A1.17)
where the eddy viscosity, μt, is specified by:
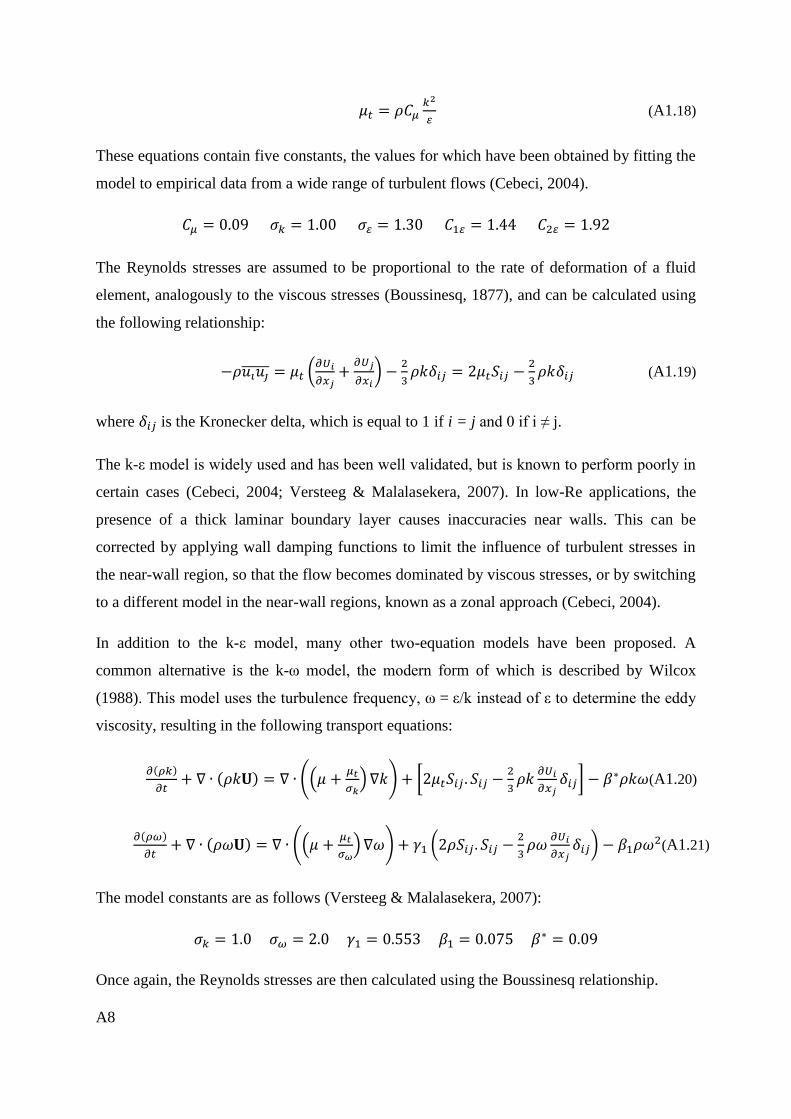
A8
(A1.18)
These equations contain five constants, the values for which have been obtained by fitting the
model to empirical data from a wide range of turbulent flows (Cebeci, 2004).
9 1 1 3 1 44 1 92
The Reynolds stresses are assumed to be proportional to the rate of deformation of a fluid
element, analogously to the viscous stresses (Boussinesq, 1877), and can be calculated using
the following relationship:
(
)
2
(A1.19)
where is the Kronecker delta, which is equal to 1 if i = j and 0 if i ≠ j.
The k-ε model is widely used and has been well validated, but is known to perform poorly in
certain cases (Cebeci, 2004; Versteeg & Malalasekera, 2007). In low-Re applications, the
presence of a thick laminar boundary layer causes inaccuracies near walls. This can be
corrected by applying wall damping functions to limit the influence of turbulent stresses in
the near-wall region, so that the flow becomes dominated by viscous stresses, or by switching
to a different model in the near-wall regions, known as a zonal approach (Cebeci, 2004).
In addition to the k-ε model, many other two-equation models have been proposed. A
common alternative is the k-ω model, the modern form of which is described by Wilcox
(1988). This model uses the turbulence frequency, ω = ε/k instead of ε to determine the eddy
viscosity, resulting in the following transport equations:
((
) ) [2
] (A1.20)
((
) ) (2
)
(A1.21)
The model constants are as follows (Versteeg & Malalasekera, 2007):
1 2 553 75 9
Once again, the Reynolds stresses are then calculated using the Boussinesq relationship.
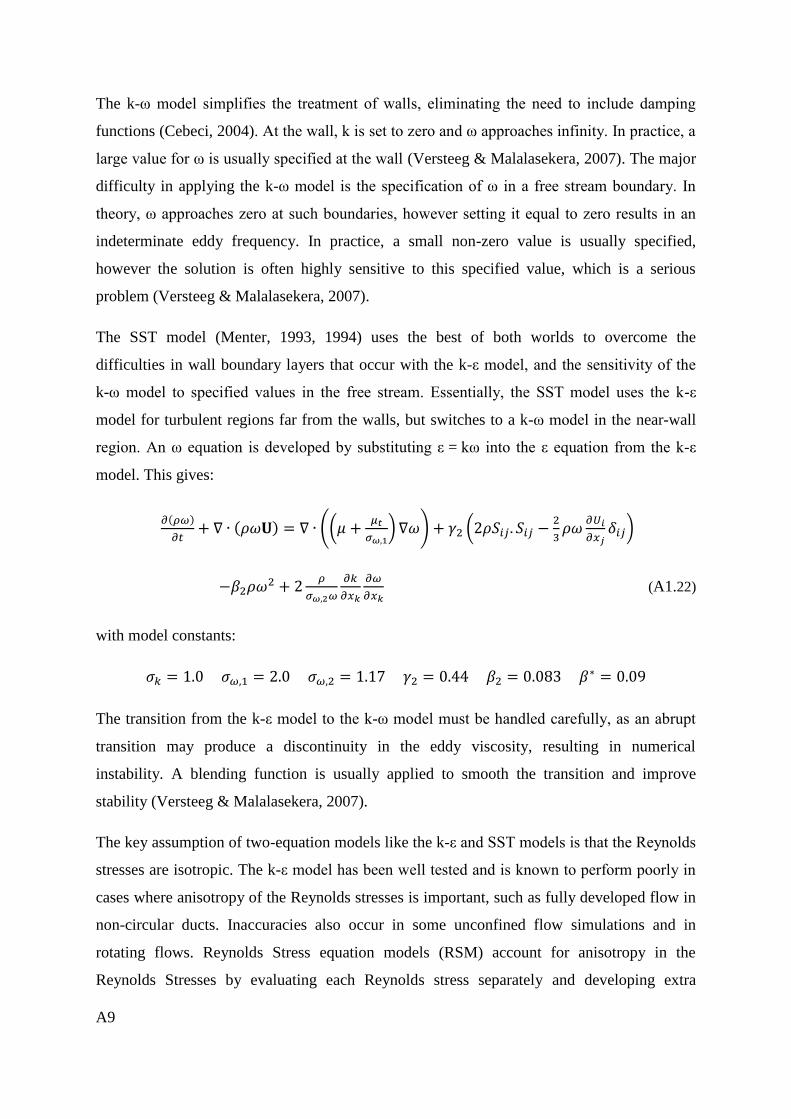
A9
The k-ω model simplifies the treatment of walls, eliminating the need to include damping
functions (Cebeci, 2004). At the wall, k is set to zero and ω approaches infinity. In practice, a
large value for ω is usually specified at the wall (Versteeg & Malalasekera, 2007). The major
difficulty in applying the k-ω model is the specification of ω in a free stream boundary. In
theory, ω approaches zero at such boundaries, however setting it equal to zero results in an
indeterminate eddy frequency. In practice, a small non-zero value is usually specified,
however the solution is often highly sensitive to this specified value, which is a serious
problem (Versteeg & Malalasekera, 2007).
The SST model (Menter, 1993, 1994) uses the best of both worlds to overcome the
difficulties in wall boundary layers that occur with the k-ε model, and the sensitivity of the
k-ω model to specified values in the free stream. Essentially, the SST model uses the k-ε
model for turbulent regions far from the walls, but switches to a k-ω model in the near-wall
region. An ω equation is developed by substituting ε = kω into the ε equation from the k-ε
model. This gives:
((
, ) ) (2
)
2
,
(A1.22)
with model constants:
1 , 2 , 1 17 44 83 9
The transition from the k-ε model to the k-ω model must be handled carefully, as an abrupt
transition may produce a discontinuity in the eddy viscosity, resulting in numerical
instability. A blending function is usually applied to smooth the transition and improve
stability (Versteeg & Malalasekera, 2007).
The key assumption of two-equation models like the k-ε and SST models is that the Reynolds
stresses are isotropic. The k-ε model has been well tested and is known to perform poorly in
cases where anisotropy of the Reynolds stresses is important, such as fully developed flow in
non-circular ducts. Inaccuracies also occur in some unconfined flow simulations and in
rotating flows. Reynolds Stress equation models (RSM) account for anisotropy in the
Reynolds Stresses by evaluating each Reynolds stress separately and developing extra
A10
transport equations to describe the transport of Reynolds stresses. These models are described
in the literature (Versteeg & Malalasekera, 2007), but will not be explained here.
Boundary Conditions
The transport equations described above provide a general description of fluid flows that can
be applied to a wide range of problems. However, the defining aspect that differentiates one
problem from another is the initial and boundary conditions specific to that problem.
Initial conditions are primarily of importance in transient simulations. For steady-state
simulations, the final, converged solution should be independent of the initial state of the
system, so the system is often initialised with zero velocity or another simple arrangement.
However, specifying an initial state that is somewhat similar to the expected steady state
solution will result in more rapid convergence to a solution (Tu, Yeoh, & Liu, 2013). In
transient simulations, the solution is highly dependent on the initial conditions. The complete
initial state of the system must be specified, including the velocity field, temperature and
pressure distributions, and fluid density. If the initial state is simple (for example a stagnant
fluid at uniform pressure and temperature), then may be possible to express the initial states
of the various flow variables as either constants or simple algebraic equations. In more
complex situations, the initial conditions may be provided by the results of a previous
simulation.
While different problems have different boundary conditions, there are several important
types of boundary conditions, and generalisations can be made about boundary conditions of
the same type. Common types include inlets, outlets, walls, constant pressure openings, and
symmetry. In general, the conditions imposed at boundaries can be grouped as Dirichlet
conditions, where the value of a variable is fixed at the boundary, and Neumann conditions,
where the gradient (derivative) of a variable is fixed at the boundary (Zikanov, 2010).
For a fixed flow inlet boundary, the values of all flow variables are determined by the
incoming fluid and are therefore fixed (Dirichlet conditions). Note that the pressure field
throughout the domain is calculated in relative terms (velocity is coupled to the pressure
gradient, not the absolute pressure), so it is necessary to specify a reference pressure at some
position in the domain. It is common practice to specify the reference pressure at a node on
an inlet boundary and allow the rest of the pressure field to be calculated as part of the
solution (Versteeg & Malalasekera, 2007).
A11
For an outlet boundary condition, the fluid properties of the exiting flow depend on the
conditions within the domain. If the outlet is positioned far from any disturbances (such as
inlets), it can be assumed that the flow is fully developed, so the gradients of all variables are
set to zero in the direction normal to the outlet surface (Neumann conditions) (Zikanov,
2010).
For a wall boundary condition, a no-slip condition is usually imposed, meaning that the fluid
velocity is set to zero at the wall (Zikanov, 2010). Heat transfer can be modelled either by
fixing the temperature of the wall (Dirichlet condition) or by fixing the heat flux through the
wall (Neumann condition). The treatment of other properties depends on the thickness of the
laminar boundary layer at the wall, and also on the turbulence model used. Suitable
expressions are available in the literature (Versteeg & Malalasekera, 2007).
For a constant pressure opening, the pressure is fixed at the boundary. The direction of flow
is calculated as part of the solution. If the flow is found to be into the domain, then other
variables must be assigned values, as with a fixed flow inlet boundary. If the flow is found to
be out of the domain, then the gradients of scalar properties are set to zero, as with an outlet
(Versteeg & Malalasekera, 2007).
For symmetry boundary conditions, the fluid velocity in the direction normal to the boundary
is set to zero. The gradients of scalar quantities in the direction normal to the boundary are
also set to zero, so there is no driving gradient for diffusive or convective transport across the
boundary (Versteeg & Malalasekera, 2007).
Discretisation
The equations listed above still describe continuous variation in the bulk fluid properties. The
integrated form of these equations, in combination with boundary conditions, describes the
exact solution to the fluid flow problem in question (aside from the approximation of the
turbulence effects). However, integrating these equations is often impossible for complex
problems, so they are solved numerically, using an iterative approach to obtain an
approximate solution. This involves discretising the differential equations using a Taylor
series expansion to approximate local values of the differential terms at fixed points in the
domain. The differential equations are thus converted into a series of algebraic equations
which can be more easily solved by iterative methods (Ferziger & Peric, 2002). The
discretisation process is described below.
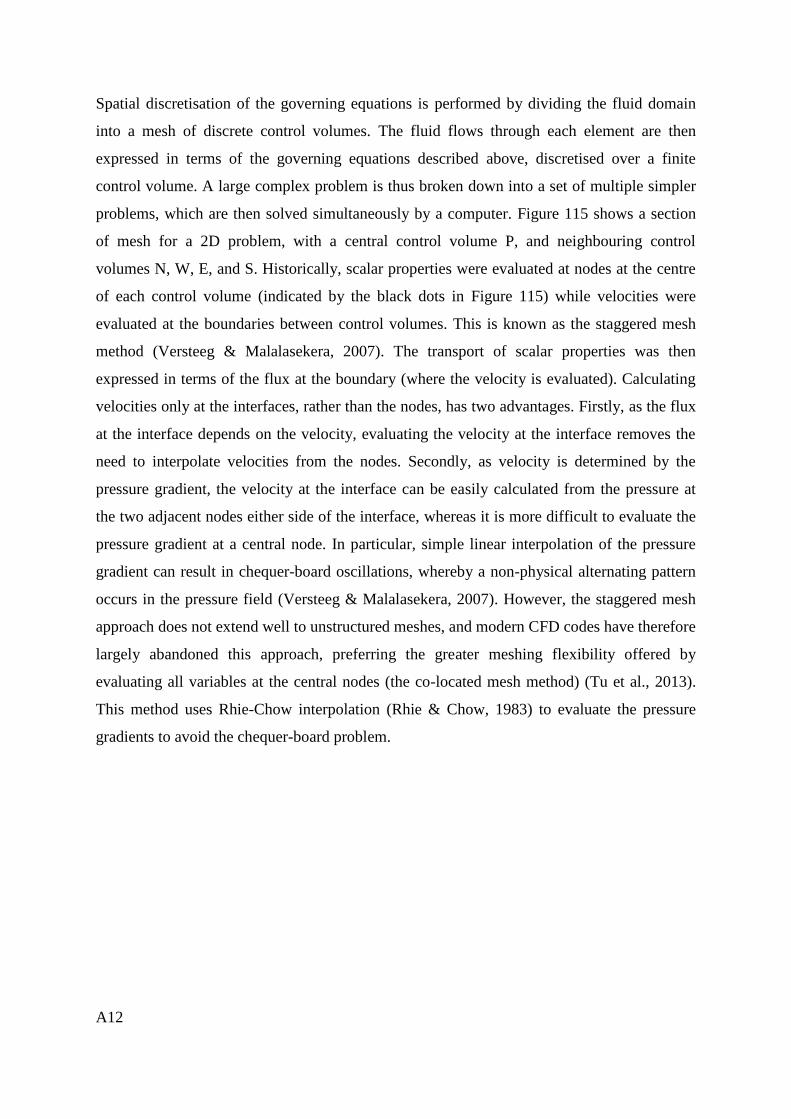
A12
Spatial discretisation of the governing equations is performed by dividing the fluid domain
into a mesh of discrete control volumes. The fluid flows through each element are then
expressed in terms of the governing equations described above, discretised over a finite
control volume. A large complex problem is thus broken down into a set of multiple simpler
problems, which are then solved simultaneously by a computer. Figure 115 shows a section
of mesh for a 2D problem, with a central control volume P, and neighbouring control
volumes N, W, E, and S. Historically, scalar properties were evaluated at nodes at the centre
of each control volume (indicated by the black dots in Figure 115) while velocities were
evaluated at the boundaries between control volumes. This is known as the staggered mesh
method (Versteeg & Malalasekera, 2007). The transport of scalar properties was then
expressed in terms of the flux at the boundary (where the velocity is evaluated). Calculating
velocities only at the interfaces, rather than the nodes, has two advantages. Firstly, as the flux
at the interface depends on the velocity, evaluating the velocity at the interface removes the
need to interpolate velocities from the nodes. Secondly, as velocity is determined by the
pressure gradient, the velocity at the interface can be easily calculated from the pressure at
the two adjacent nodes either side of the interface, whereas it is more difficult to evaluate the
pressure gradient at a central node. In particular, simple linear interpolation of the pressure
gradient can result in chequer-board oscillations, whereby a non-physical alternating pattern
occurs in the pressure field (Versteeg & Malalasekera, 2007). However, the staggered mesh
approach does not extend well to unstructured meshes, and modern CFD codes have therefore
largely abandoned this approach, preferring the greater meshing flexibility offered by
evaluating all variables at the central nodes (the co-located mesh method) (Tu et al., 2013).
This method uses Rhie-Chow interpolation (Rhie & Chow, 1983) to evaluate the pressure
gradients to avoid the chequer-board problem.
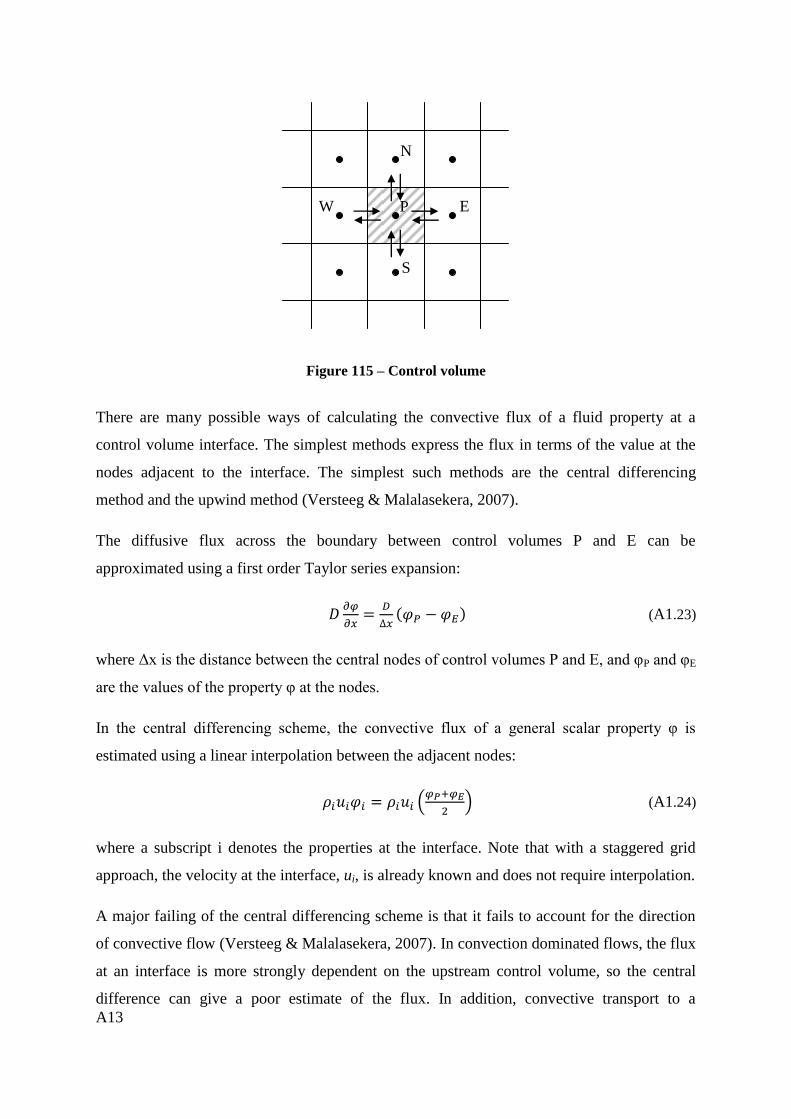
A13
There are many possible ways of calculating the convective flux of a fluid property at a
control volume interface. The simplest methods express the flux in terms of the value at the
nodes adjacent to the interface. The simplest such methods are the central differencing
method and the upwind method (Versteeg & Malalasekera, 2007).
The diffusive flux across the boundary between control volumes P and E can be
approximated using a first order Taylor series expansion:
(A1.23)
where Δx is the distance between the central nodes of control volumes P and E, and υP and υE
are the values of the property υ at the nodes.
In the central differencing scheme, the convective flux of a general scalar property υ is
estimated using a linear interpolation between the adjacent nodes:
(
) (A1.24)
where a subscript i denotes the properties at the interface. Note that with a staggered grid
approach, the velocity at the interface, ui, is already known and does not require interpolation.
A major failing of the central differencing scheme is that it fails to account for the direction
of convective flow (Versteeg & Malalasekera, 2007). In convection dominated flows, the flux
at an interface is more strongly dependent on the upstream control volume, so the central
difference can give a poor estimate of the flux. In addition, convective transport to a
Figure 115 – Control volume
N
S
E W P
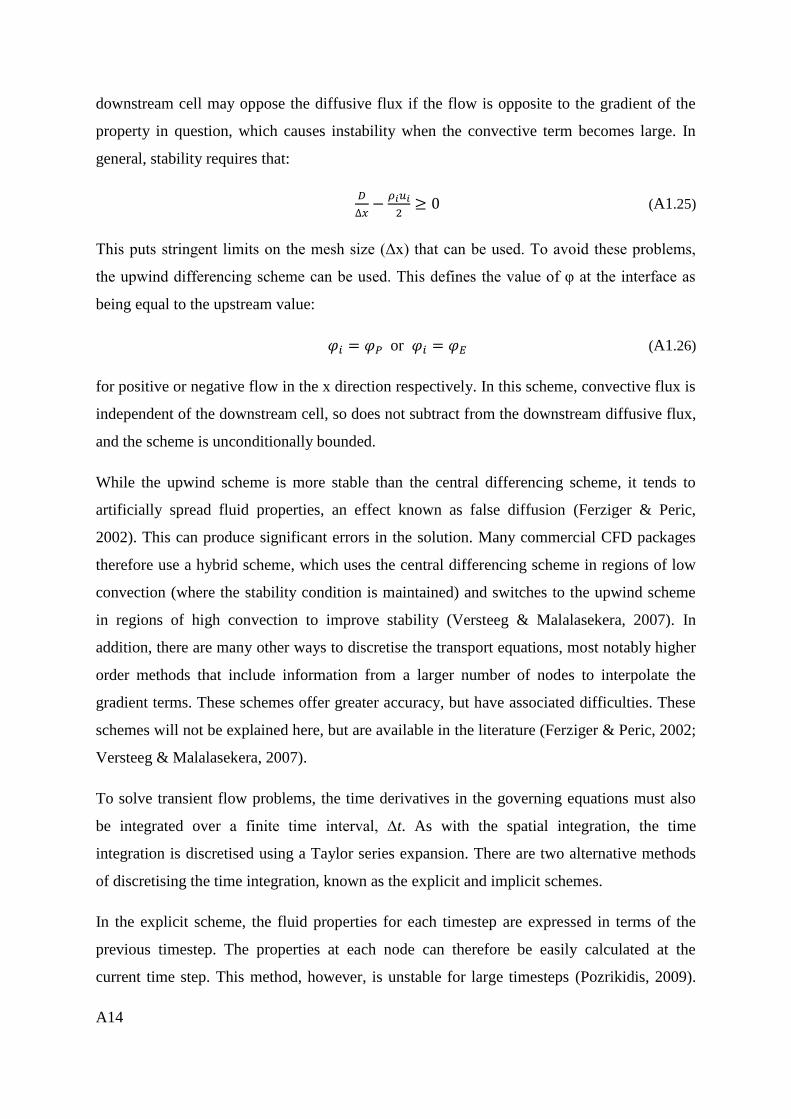
A14
downstream cell may oppose the diffusive flux if the flow is opposite to the gradient of the
property in question, which causes instability when the convective term becomes large. In
general, stability requires that:
(A1.25)
This puts stringent limits on the mesh size (Δx) that can be used. To avoid these problems,
the upwind differencing scheme can be used. This defines the value of υ at the interface as
being equal to the upstream value:
or (A1.26)
for positive or negative flow in the x direction respectively. In this scheme, convective flux is
independent of the downstream cell, so does not subtract from the downstream diffusive flux,
and the scheme is unconditionally bounded.
While the upwind scheme is more stable than the central differencing scheme, it tends to
artificially spread fluid properties, an effect known as false diffusion (Ferziger & Peric,
2002). This can produce significant errors in the solution. Many commercial CFD packages
therefore use a hybrid scheme, which uses the central differencing scheme in regions of low
convection (where the stability condition is maintained) and switches to the upwind scheme
in regions of high convection to improve stability (Versteeg & Malalasekera, 2007). In
addition, there are many other ways to discretise the transport equations, most notably higher
order methods that include information from a larger number of nodes to interpolate the
gradient terms. These schemes offer greater accuracy, but have associated difficulties. These
schemes will not be explained here, but are available in the literature (Ferziger & Peric, 2002;
Versteeg & Malalasekera, 2007).
To solve transient flow problems, the time derivatives in the governing equations must also
be integrated over a finite time interval, ∆t. As with the spatial integration, the time
integration is discretised using a Taylor series expansion. There are two alternative methods
of discretising the time integration, known as the explicit and implicit schemes.
In the explicit scheme, the fluid properties for each timestep are expressed in terms of the
previous timestep. The properties at each node can therefore be easily calculated at the
current time step. This method, however, is unstable for large timesteps (Pozrikidis, 2009).
A15
Furthermore, the maximum timestep is limited by the spatial resolution, such that improving
the resolution requires that the timestep be reduced proportionally to the square of the spatial
resolution (Ferziger & Peric, 2002). Improvements in spatial accuracy are therefore
computationally expensive.
In the implicit scheme, the fluid properties for each timestep are expressed in terms of the
adjacent nodes at the same timestep. Consequently, for each timestep, all nodes must be
solved simultaneously (Pozrikidis, 2009). The implicit scheme is stable for any sized timestep
and is therefore the default method in all commercially available CFD packages (Versteeg &
Malalasekera, 2007).
It is also possible to combine the explicit and implicit schemes, so that the current timestep is
calculated from some weighted average of the previous and current timestep. An example of
this is the Crank-Nicolson scheme (Crank & Nicolson, 1947), which takes a linear average of
the current and previous timesteps, analogous to central differencing in the spatial
discretisation.
The final discretised form of the general transport equation is therefore:
∑ ∑ (
) (A1.27)
where VP is the volume of the mesh cell, i is a count variable designating the cell faces, ni is a
vector normal to the cell face, and Ai is the area of the cell face. For steady-state problems,
the transient term is set to zero.
Solution Algorithms
The discretisation of the differential equations results in a system of linear algebraic
equations. There are two major groups of solution methods for systems of linear algebraic
equations. Direct (non-iterative) methods involve performing a fixed number of operations on
the system to eliminate variables and yield an exact solution to the system (Versteeg &
Malalasekera, 2007). A common example of a direct method is Gaussian elimination. In
contrast, indirect (iterative) methods repeatedly apply a relatively simple algorithm to an
approximate solution to obtain successively better approximations of the solution (Ferziger &
Peric, 2002). Common examples of iterative methods are the Jacobi method and the Gauss-
Seidel method.
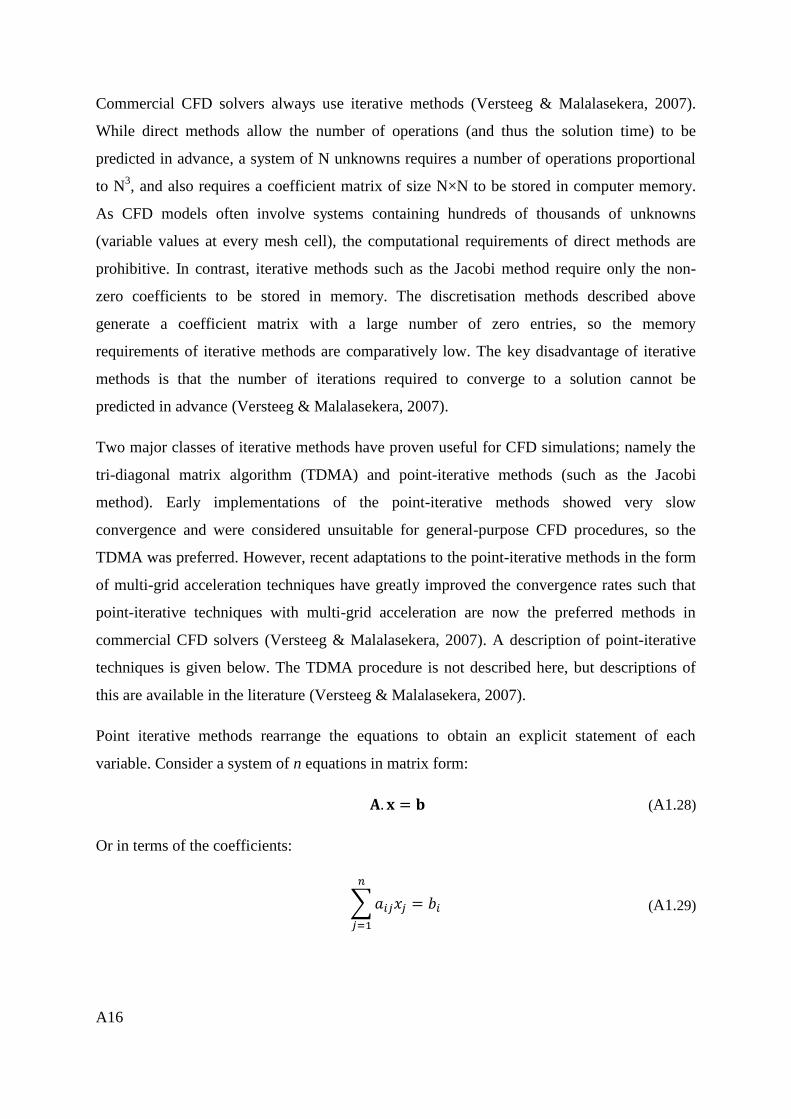
A16
Commercial CFD solvers always use iterative methods (Versteeg & Malalasekera, 2007).
While direct methods allow the number of operations (and thus the solution time) to be
predicted in advance, a system of N unknowns requires a number of operations proportional
to N3, and also requires a coefficient matrix of size N×N to be stored in computer memory.
As CFD models often involve systems containing hundreds of thousands of unknowns
(variable values at every mesh cell), the computational requirements of direct methods are
prohibitive. In contrast, iterative methods such as the Jacobi method require only the non-
zero coefficients to be stored in memory. The discretisation methods described above
generate a coefficient matrix with a large number of zero entries, so the memory
requirements of iterative methods are comparatively low. The key disadvantage of iterative
methods is that the number of iterations required to converge to a solution cannot be
predicted in advance (Versteeg & Malalasekera, 2007).
Two major classes of iterative methods have proven useful for CFD simulations; namely the
tri-diagonal matrix algorithm (TDMA) and point-iterative methods (such as the Jacobi
method). Early implementations of the point-iterative methods showed very slow
convergence and were considered unsuitable for general-purpose CFD procedures, so the
TDMA was preferred. However, recent adaptations to the point-iterative methods in the form
of multi-grid acceleration techniques have greatly improved the convergence rates such that
point-iterative techniques with multi-grid acceleration are now the preferred methods in
commercial CFD solvers (Versteeg & Malalasekera, 2007). A description of point-iterative
techniques is given below. The TDMA procedure is not described here, but descriptions of
this are available in the literature (Versteeg & Malalasekera, 2007).
Point iterative methods rearrange the equations to obtain an explicit statement of each
variable. Consider a system of n equations in matrix form:
(A1.28)
Or in terms of the coefficients:
∑
(A1.29)
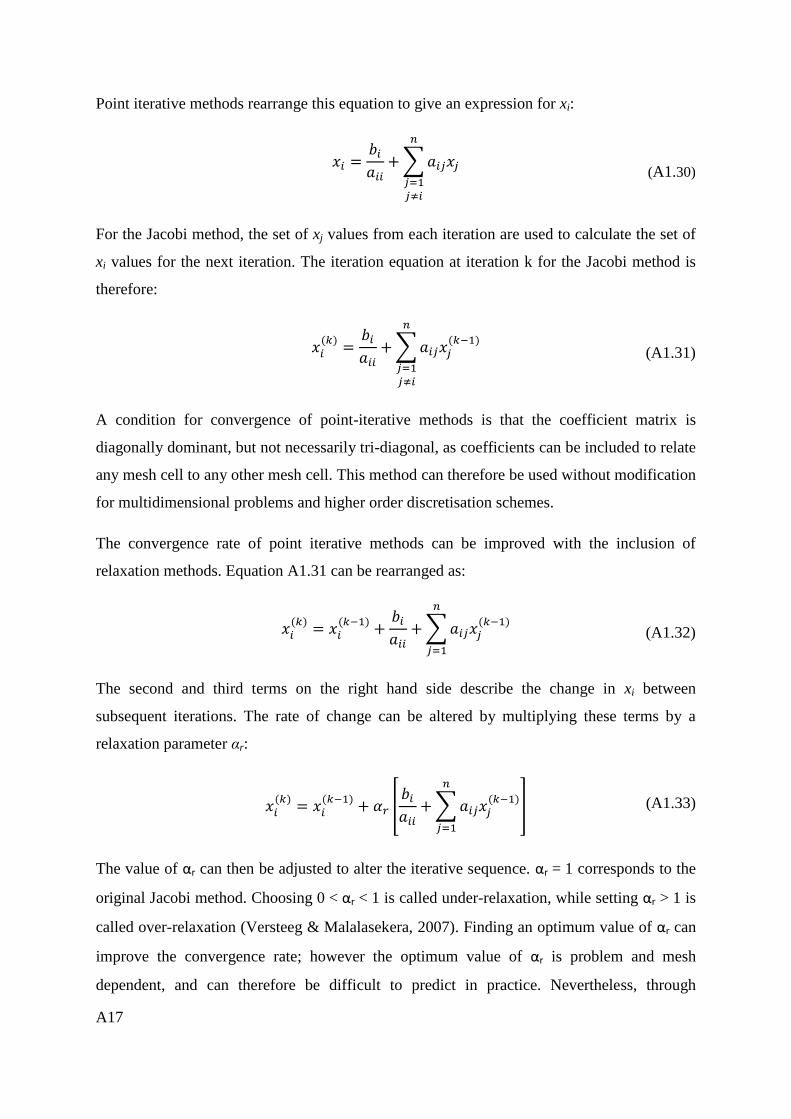
A17
Point iterative methods rearrange this equation to give an expression for xi:
∑
For the Jacobi method, the set of xj values from each iteration are used to calculate the set of
xi values for the next iteration. The iteration equation at iteration k for the Jacobi method is
therefore:
∑
A condition for convergence of point-iterative methods is that the coefficient matrix is
diagonally dominant, but not necessarily tri-diagonal, as coefficients can be included to relate
any mesh cell to any other mesh cell. This method can therefore be used without modification
for multidimensional problems and higher order discretisation schemes.
The convergence rate of point iterative methods can be improved with the inclusion of
relaxation methods. Equation A1.31 can be rearranged as:
∑
The second and third terms on the right hand side describe the change in xi between
subsequent iterations. The rate of change can be altered by multiplying these terms by a
relaxation parameter αr:
[
∑
]
The value of αr can then be adjusted to alter the iterative sequence. αr = 1 corresponds to the
original Jacobi method. Choosing 0 < αr < 1 is called under-relaxation, while setting αr > 1 is
called over-relaxation (Versteeg & Malalasekera, 2007). Finding an optimum value of αr can
improve the convergence rate; however the optimum value of αr is problem and mesh
dependent, and can therefore be difficult to predict in practice. Nevertheless, through
(A1.31)
(A1.30)
(A1.32)
(A1.33)
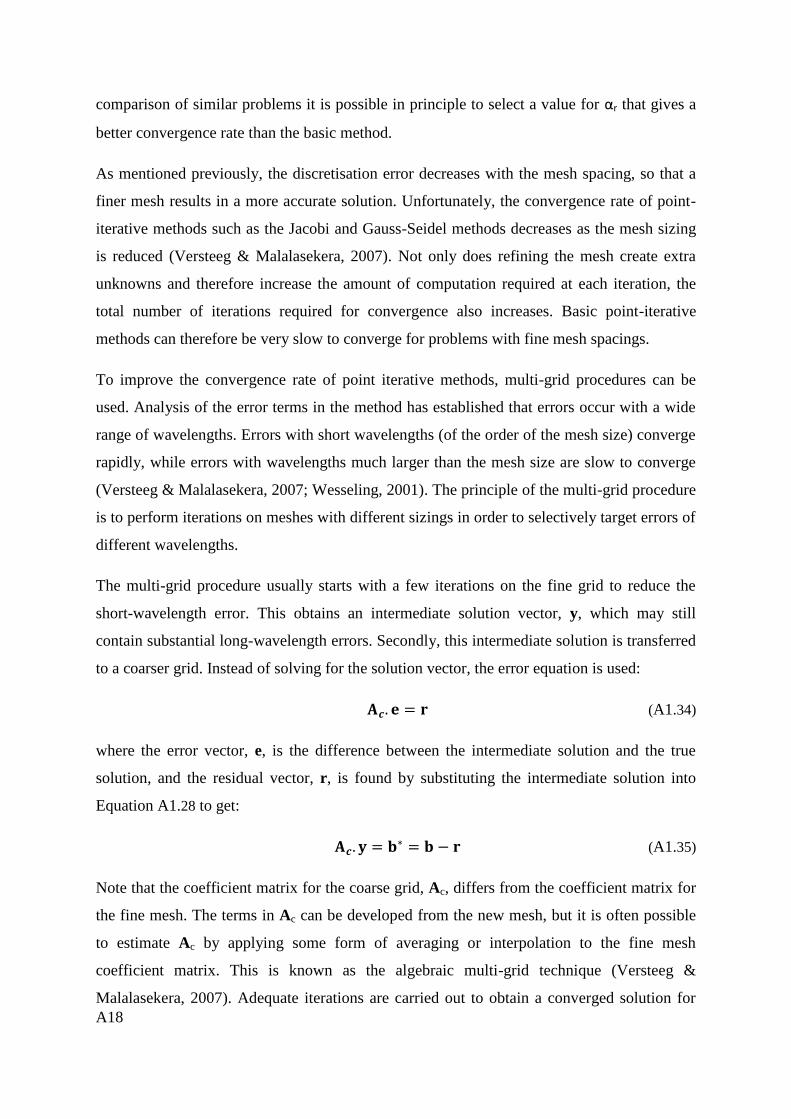
A18
comparison of similar problems it is possible in principle to select a value for αr that gives a
better convergence rate than the basic method.
As mentioned previously, the discretisation error decreases with the mesh spacing, so that a
finer mesh results in a more accurate solution. Unfortunately, the convergence rate of point-
iterative methods such as the Jacobi and Gauss-Seidel methods decreases as the mesh sizing
is reduced (Versteeg & Malalasekera, 2007). Not only does refining the mesh create extra
unknowns and therefore increase the amount of computation required at each iteration, the
total number of iterations required for convergence also increases. Basic point-iterative
methods can therefore be very slow to converge for problems with fine mesh spacings.
To improve the convergence rate of point iterative methods, multi-grid procedures can be
used. Analysis of the error terms in the method has established that errors occur with a wide
range of wavelengths. Errors with short wavelengths (of the order of the mesh size) converge
rapidly, while errors with wavelengths much larger than the mesh size are slow to converge
(Versteeg & Malalasekera, 2007; Wesseling, 2001). The principle of the multi-grid procedure
is to perform iterations on meshes with different sizings in order to selectively target errors of
different wavelengths.
The multi-grid procedure usually starts with a few iterations on the fine grid to reduce the
short-wavelength error. This obtains an intermediate solution vector, y, which may still
contain substantial long-wavelength errors. Secondly, this intermediate solution is transferred
to a coarser grid. Instead of solving for the solution vector, the error equation is used:
(A1.34)
where the error vector, e, is the difference between the intermediate solution and the true
solution, and the residual vector, r, is found by substituting the intermediate solution into
Equation A1.28 to get:
(A1.35)
Note that the coefficient matrix for the coarse grid, Ac, differs from the coefficient matrix for
the fine mesh. The terms in Ac can be developed from the new mesh, but it is often possible
to estimate Ac by applying some form of averaging or interpolation to the fine mesh
coefficient matrix. This is known as the algebraic multi-grid technique (Versteeg &
Malalasekera, 2007). Adequate iterations are carried out to obtain a converged solution for
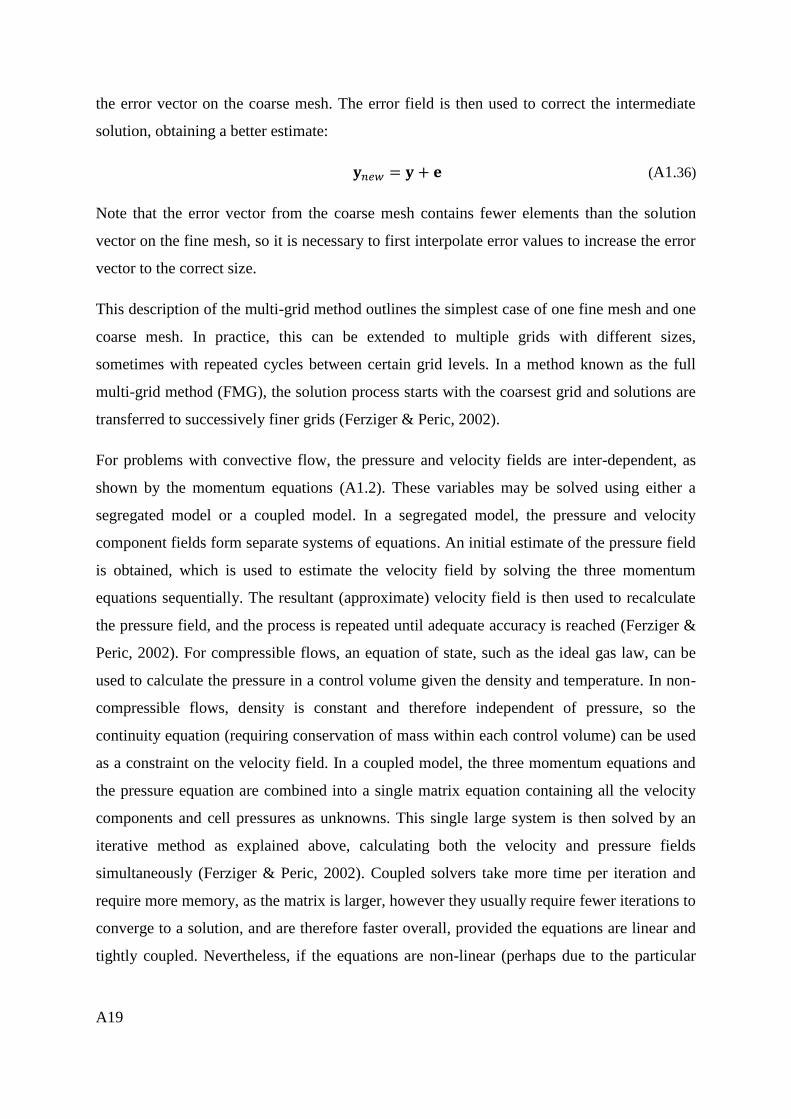
A19
the error vector on the coarse mesh. The error field is then used to correct the intermediate
solution, obtaining a better estimate:
(A1.36)
Note that the error vector from the coarse mesh contains fewer elements than the solution
vector on the fine mesh, so it is necessary to first interpolate error values to increase the error
vector to the correct size.
This description of the multi-grid method outlines the simplest case of one fine mesh and one
coarse mesh. In practice, this can be extended to multiple grids with different sizes,
sometimes with repeated cycles between certain grid levels. In a method known as the full
multi-grid method (FMG), the solution process starts with the coarsest grid and solutions are
transferred to successively finer grids (Ferziger & Peric, 2002).
For problems with convective flow, the pressure and velocity fields are inter-dependent, as
shown by the momentum equations (A1.2). These variables may be solved using either a
segregated model or a coupled model. In a segregated model, the pressure and velocity
component fields form separate systems of equations. An initial estimate of the pressure field
is obtained, which is used to estimate the velocity field by solving the three momentum
equations sequentially. The resultant (approximate) velocity field is then used to recalculate
the pressure field, and the process is repeated until adequate accuracy is reached (Ferziger &
Peric, 2002). For compressible flows, an equation of state, such as the ideal gas law, can be
used to calculate the pressure in a control volume given the density and temperature. In non-
compressible flows, density is constant and therefore independent of pressure, so the
continuity equation (requiring conservation of mass within each control volume) can be used
as a constraint on the velocity field. In a coupled model, the three momentum equations and
the pressure equation are combined into a single matrix equation containing all the velocity
components and cell pressures as unknowns. This single large system is then solved by an
iterative method as explained above, calculating both the velocity and pressure fields
simultaneously (Ferziger & Peric, 2002). Coupled solvers take more time per iteration and
require more memory, as the matrix is larger, however they usually require fewer iterations to
converge to a solution, and are therefore faster overall, provided the equations are linear and
tightly coupled. Nevertheless, if the equations are non-linear (perhaps due to the particular
A20
discretisation process used), a sequential solver may offer better performance (Ferziger &
Peric, 2002).
Mesh and Timestep Dependence
The accuracy of the results from a CFD simulation is highly dependent on the mesh sizing
and timestep used. The mesh sizing must be sufficiently small to resolve the flow patterns of
interest, while the timestep must be sufficiently short to capture rapid dynamics in the fluid
flow. If the mesh size and timestep are poorly chosen, discretisation errors can accumulate
and make the solution very inaccurate. Convergence of the model to a solution does not
guarantee that the solution is an accurate representation of the fluid flow being modelled.
The standard method of finding adequate mesh and timestep resolution is to run a series of
simulations of the same problem, progressively reducing the mesh size and/or timestep. The
results should asymptotically approach the analytical solution, so a mesh size can be chosen
where the differences observed in subsequent solutions are deemed small enough to be
negligible. The degree of accuracy deemed acceptable is open to interpretation, but a good
indication is the accuracy with which the relevant properties of the fluid flow could be
measured in an experiment. This ensures that the simulation results should agree with
experimental results to within the expected experimental error. Care should also be taken not
to over-interpret the solution – fluctuations in the solution that occur on a timescale similar to
the timestep are more likely to be calculation errors than actual physical effects. The only
way to be sure of this is to reduce the timestep and re-solve the simulation to get a more
accurate solution.
Validation by Experiment
As a final check on the accuracy of the solution, some predictions of the CFD model should
be compared with experimental results. This is an easily overlooked aspect of CFD
modelling, but it is crucially important in order to ensure that the model results are accurate.
Even when a solution is independent of the mesh and timestep, and appears physically
reasonable, it can still be inaccurate. Discrepancies can arise through inaccuracies in the
physical sub-models used in the simulation (e.g. equations of state or turbulence models),
through invalid assumptions (e.g. assumed values of boundary conditions or
oversimplification of the problem geometry) or through simple user error. The many
assumptions and approximations used in the development of a model mean that the solution
A21
obtained is never an exact solution to a real world problem, so it is essential to have some
real-world results in order to quantify the discrepancy. The required level of accuracy
depends on the intended applications of the model, and is somewhat open to interpretation,
but guidelines for validation are available in the literature (Oberkampf & Trucano, 2002).
Once a model has been validated by a particular experiment, a confidence level can be
estimated for simulations of similar problems (Oberkampf & Trucano, 2002). It should be
noted that the model can only be considered validated in cases for which experimental data is
available; a model as a whole can never be considered perfectly validated, and care must be
taken not to push the model too far beyond the validated conditions (Oberkampf & Trucano,
2002).
ANSYS CFX Software
The CFD work described in this thesis was carried out using ANSYS CFX 14.5. CFX is a
commercially available, general purpose CFD package. CFX is integrated into the ANSYS
Workbench platform and is built to a modular design, with separate programs handling the
geometry and mesh creation, problem specification, solving, and post-processing. CFX uses
an element-based finite volume method, with a co-located velocity grid, so the control
volumes are identical for all transport equations. The transient discretisation scheme is fully
implicit, and the linear solver uses a point iterative solution method with algebraic multi-grid
acceleration (ANSYS Inc., 2010).
A22
Appendix 2 - Statistics
A range of statistical methods are used in this thesis to analyse the results of experimental
work. The primary methods are explained below.
Student’s t-test
The t-test is a statistical hypothesis test that can be used to determine whether two sets of data
are significantly different from each other. The test statistic, t, follows a t distribution. In the
most general form, when neither the sample size nor the variance of the two samples is the
same, t is defined by Equation A2.1 (Armitage & Berry, 1994). The calculated t value is then
compared to a critical value at the desired confidence level, which can be looked up in tables
or calculated using inbuilt functions in many common software packages. The t-test assumes
that the data follow a normal distribution, and may give misleading results if this is not the
case.
√
(A2.1)
where and are the sample means of the two groups being compared, s1 and s2 are the
sample standard deviations, and n1 and n2 are the samples sizes (number of measurements in
each group)
F-test
The ANOVA F-test is an extension of the Student’s t-test to multiple variables. The F-test
assumes the data to be normally distributed, and is prone to Type I errors (falsely rejecting a
null hypothesis) if the data is non-normal. The test compares the variance within groups of
repeat measurements to the variance between the means of the groups, to determine whether
there is a significant difference in the means. Typically, the groups represent sets of duplicate
measurements, where each group represents a specific condition being measured. The test
statistic F is defined by Equation A2.2 (Chase & Bown, 1992), and has an F-distribution,
which can be looked up in tables or evaluated using inbuilt functions in many common
software packages (such as Microsoft®
Excel). A critical F-value is calculated from the F-
distribution at the desired p-value and the degrees of freedom defined by the dataset. If the F-
value calculated from the data exceeds this critical F-value, then differences between groups

A23
are significant. Note that a significant result only indicates that at least two of the groups are
different – some of the groups may not show differences. A direct comparison of groups
using the t-test or another method of analysis is often carried out to determine whether
specific groups are different (Sheskin, 1997).
∑
∑ ( )
(A2.2)
where N is the total number of measurements in the dataset, K is the number of groups, ni is
the number of measurements in the ith
group, is the mean of all measurements in the ith
group, is the overall mean, and xij is the jth
measurement in the ith
group.
Mann-Whitney U-test
The Mann-Whitney U-test (Mann & Whitney, 1947) is a non-parametric (distribution
independent) alternative to the Student’s t-test for determining whether two sets of
measurements show significant differences. To perform a U-test, the data the data are ranked
in order of size (irrespective of group), and a calculation is performed on the ranks, rather
than on the actual measurements. The test statistic is calculated for each group according to
Equation A2.3, and the maximum U value (from the two groups being tested) is compared to
a critical value which can be looked up in tables.
(∑ )
(A2.3)
where ∑ is the sum of the ranks of all measurements in the group, and ni is the number of
measurements in the group.
Kruskal-Wallis test
The Kruskal-Wallis test is a non-parametric alternative to the F-test, and is essentially an
extension of the U-test to multiple groups of data. The data are once again ranked, and a
calculation is performed on the ranks rather than the individual measurements (Sheskin,
1997). The calculation resembles the F-test, and is shown in A2.4. Finally, the p-value is
approximated by the probability , where
is the value of the chi-squared
distribution at K-1 (Sheskin, 1997). The Kruskal-Wallis test does not require the data to be
normally distributed, so avoids the errors that may occur with the F-test if this assumption is
not valid.
A24
1 ∑
∑ ( )
(A2.4)
where is the average rank in the ith group, is the overall average rank, and is the rank
of an individual measurement (relative to the whole dataset).
QQ plots
QQ plots are a graphical method used to analyse the distribution of data. The data is
compared to a particular distribution, and the QQ plot produces a straight line with a slope of
1 if the data matches that distribution (Weisstein). To compare data to the standard normal
(Z) distribution using a QQ plot, the procedure is as follows: Firstly, the data must be
converted to standardised Z-values in the same way as the normal distribution:
(A2.5)
where x is the individual measurement, is the mean, and σ is the standard deviation. The
standardised data are then sorted from smallest to largest. A standard normal distribution is
then used to produce a dataset with the same number of points as the experimental dataset.
This is done by dividing the normal distribution curve into segments of equal probability –
for example, if the dataset contains 50 points, then the Z values are evaluated at 2%
probability increments, offset by 1% (so that the shaded area in Figure 116 equals 1%, 3%,
5% etc. - the offset is necessary because the Z value is undefined at probabilities of 0% and
100%). The resulting points are then plotted 1:1 against the normalised data (with
standardised measurements on one axis against generated data on the other axis). If this
produces a straight line, then the data are normally distributed.
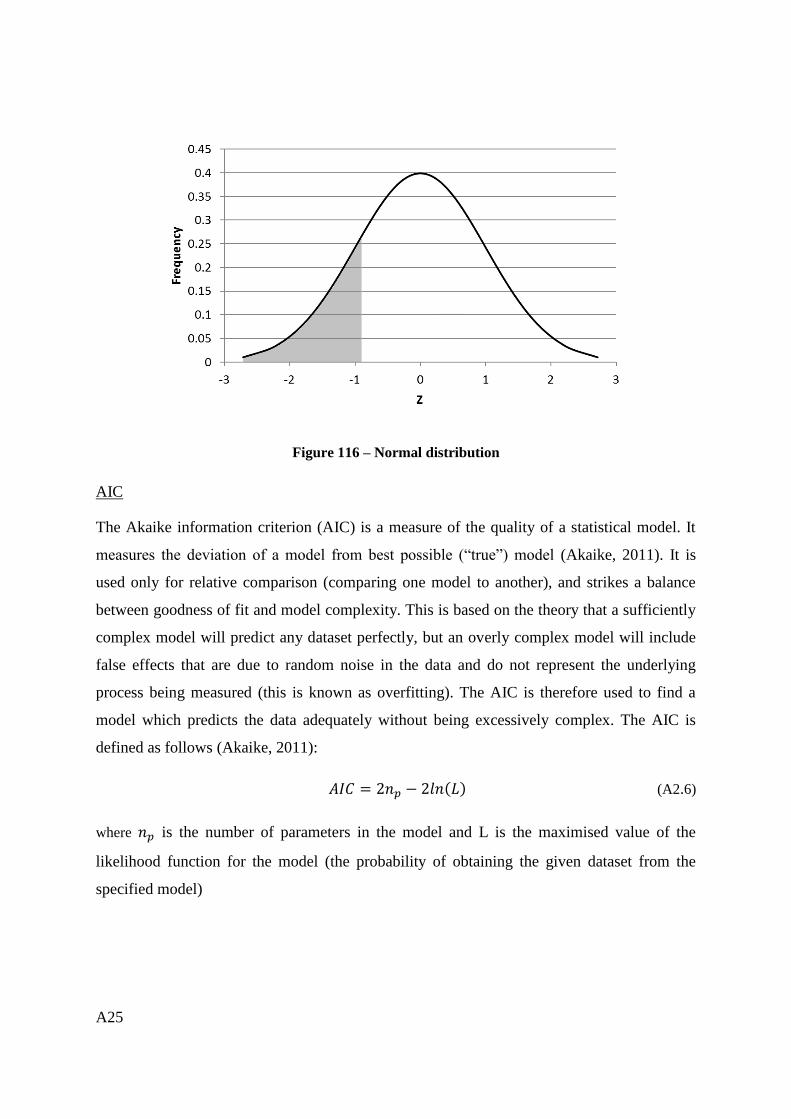
A25
Figure 116 – Normal distribution
AIC
The Akaike information criterion (AIC) is a measure of the quality of a statistical model. It
measures the deviation of a model from best possible (“true”) model (Akaike, 2011). It is
used only for relative comparison (comparing one model to another), and strikes a balance
between goodness of fit and model complexity. This is based on the theory that a sufficiently
complex model will predict any dataset perfectly, but an overly complex model will include
false effects that are due to random noise in the data and do not represent the underlying
process being measured (this is known as overfitting). The AIC is therefore used to find a
model which predicts the data adequately without being excessively complex. The AIC is
defined as follows (Akaike, 2011):
2 2 (A2.6)
where is the number of parameters in the model and L is the maximised value of the
likelihood function for the model (the probability of obtaining the given dataset from the
specified model)

A26
Appendix 3 – Publications
The following paper was presented at the International Conference on Biotechnology and
Food Engineering (2013), and published in the Journal of Medical and Bioengineering, Vol.
2, No. 3, pp. 157-162, September 2013.
Effects of Humidity and Temperature on the
Performance of Milk Powder Baghouses
James O. Litchwark1, James Winchester
2 and Justin J. Nijdam
1
1University of Canterbury, Christchurch, New Zealand
Email: [email protected], [email protected] 2Fonterra Research and Development Centre, Palmerston North, New Zealand.
Email: [email protected]
Abstract—A bench scale filtration apparatus was used to
investigate the influence of powder composition, and tem-
perature and humidity of the carrier gas on the structure of
the filter cake formed in milk powder baghouses. Two types
of powder, a skim milk powder (SMP) and a high fat milk
protein concentrate (MPC) were filtered from air using a
polyester filter, at a range of temperatures and humidity
levels. The filter cake mass and pressure drop were meas-
ured and used to calculate the cake permeability, and the
filter cake structure was examined using a microscope. In-
creased stickiness of particles resulted in the appearance of
dendritic structures in the filter cake and hence an increase
in porosity and reduction in cake resistance. Cake resistance
in SMP was lowest at the highest relative humidity tested,
indicating that cohesion in SMP was primarily due to the
glass transition of amorphous lactose. The cake resistance in
MPC was lowest at the highest temperatures tested, but was
not affected by relative humidity, indicating that cohesion in
this powder was primarily due to melted fat. In general, the
MPC formed a more permeable filter cake and exhibited
much higher deposition onto the filter than the SMP. The
deposition rate of SMP powder decreased at higher relative
humidity. The cause of this effect could not be determined,
however likely explanations are increased agglomeration
and gravitational settling of stickier powder prior to reach-
ing the filter, or the breakage of fragile dendritic structures
formed by sticky powder. The deposition rate of MPC was
not affected by either temperature or humidity.
Keywords—Baghouse, Milk Powder, Filtration, Stickiness,
Cake
I. INTRODUCTION
Occasional problems are encountered during the pro-
duction and handling of dairy powders due to variations
in the cohesive and adhesive properties of the powder.
Sticky powders cause increased fouling in spray driers
and associated processing equipment, while caking in
hoppers and silos causes blockages and handling difficul-
ties. While these problems have been studied extensively,
the effect of stickiness on the performance of baghouses
has been largely neglected. Research on other powders
has demonstrated correlations between powder cohesion
and filter cake porosity [1], and between humidity and
cake adhesion [2]. The powders used in these studies
were very different to dairy powders, so some targeted
research is needed to enable more accurate prediction of
dairy baghouse performance.
Most dairy powders contain amorphous lactose, which
is highly hygroscopic. In the presence of sufficient mois-
ture and temperature, the lactose undergoes a glass transi-
tion, and behaves as a highly viscous liquid. This allows
lactose bridges to form between particles, causing strong
bonding. This is a major cause of caking during storage,
especially in low fat powders such as skim milk powder
(SMP). The temperature of the glass transition, Tg, de-
creases with increasing water activity [3], and so is highly
dependent on changes in ambient humidity. The caking
process is also time dependent, and occurs more rapidly
at conditions of higher temperature and moisture [4]. In
addition, some researchers have defined a sticky point,
above which the adhesion of particles essentially be-
comes instantaneous, resulting in a marked decrease in
flowability and an increase in adhesion to surfaces [5].
Stickiness due to lactose is generally described in
terms of the temperature offset from the glass transition,
T−Tg, [4, 6, 7]. The sticky point for a particular powder
occurs at a critical temperature offset, (T−Tg)crit, regard-
less of the specific temperature and humidity levels used
[5]. The value of (T−Tg)crit depends on powder composi-
tion, with some high-protein powders having a critical
temperature offset of up 90°C [8]. Measurements of
(T−Tg)crit also depend on the method used, due to differ-
ent shearing and inertial forces produced by different
methods. As an example, reported values for SMP range
from 23.3°C using a stirrer method [7] to 37.9°C using a
particle bombardment method [5].
Another major contributor to the cohesion and flowa-
bility of milk powders is the presence of fat. Milk con-
tains a range of fats with melting temperatures ranging
from -40°C to +40°C [9]. In spray dried dairy powders,
fat tends to accumulate on the surface of the particles [10,
11], so even low levels of bulk fat can have significant
effects on the particle interactions. Surface fat content is
strongly correlated with powder cohesiveness [12, 13], as
fats in a liquid state form liquid bridges between parti-
cles. The flowability of high fat powders is dependent on
temperature, due to the wide range of melting points of
dairy fats [14]. Dairy baghouses are typically operated at
70-80°C, so the fat exists in a liquid state.
In this study, two different powders, a skim milk pow-
der (SMP) and a high fat milk protein concentrate (MPC)
were filtered from air using a polyester needle-felt filter,
at a range of temperatures and humidity levels. SMP is a
very common milk powder, with very low fat content and
high lactose content. SMP is generally considered a free-
flowing powder, with good transport properties and good
chemical stability. Stickiness in SMP has been well stud-
ied with regard to in-process fouling and caking during
storage, so SMP provides a good reference powder for
these experiments. Stickiness in SMP is primarily due to
the glass transition of amorphous lactose, and is highly
dependent on moisture content [14]. MPC contains high
levels of fat and protein but relatively little lactose and is
regarded as a cohesive powder, with poor flowability. As
fat tends to accumulate on the particle surface in prefer-
ence to lactose [11], the cohesive nature of this powder is
thought to be primarily due to liquid fat. This powder is
also known to cause excessive blinding in some baghous-
es in industry. The effects of temperature and humidity
on the filtration process were studied to determine the
optimum operating conditions for industrial baghouses.
II. MATERIALS AND METHODS
A. Powders
The powders used in these experiments were provided
by Fonterra Ltd, New Zealand. A detailed compositional
analysis of these powders is shown in Table 1. The parti-
cle size distributions of the two powders were measured
with a Microtrac X-100 laser diffraction system, using
isopropanol to suspend the particles.
Powder Fat Protein Lactose Ash Water
SMP 1.0% 32.6% 54.6% 8.0% 3.8%
MPC 26.2% 42.9% 22.1% 5.5% 3.3%
B. Filter Fabric
All experiments were conducted using a basic polyes-
ter needle-felt fabric with a singed surface. This fabric
was provided by Canterbury Filter Services, New Zea-
land, and is typical of the fabrics currently used in the NZ
dairy industry. The filters were cut from a used filter bag,
so the fabric had been subjected to some wear prior to
being used in these experiments.
In order to reduce costs, the filter samples were reused
for multiple experiments. The filters were cleaned in be-
tween uses by washing in a household washing machine.
Filters were visually inspected for signs of damage, and
measurements of the filter resistance at the start of each
run were compared to ensure that the filters were cleaned
to a consistent standard and were not significantly deteri-
orating between uses.
C. Methods
A bench scale filter rig was constructed to allow filtra-
tion at a controlled temperature and humidity. The appa-
ratus was designed to maintain a filtration velocity of 2.2
ms-1
, typical of industrial baghouses, but over a filter area
of only 0.01 m2. The apparatus was designed to allow
control of humidity and temperature over a wide range.
This was done by bubbling the air stream through a water
tank at the required dewpoint, then heating the humid air
stream to the desired temperature. Powder was introduced
to the heated, humidified air stream with a small vibrating
hopper upstream of the filter. Powder not adhering to the
filter was collected in a jar at the bottom of the filtration
chamber. The pressure drop across the filter was meas-
ured using an Intech™ LPN-DP pressure sensor, and the
mass of powder on the filter and in the collector jar were
weighed using a laboratory balance.
Two sets of experiments were carried out. The first set
of experiments investigated the effect of temperature on
the filtration process. The temperature of the air stream
was varied in approximate 10°C increments from 30°C to
90°C, while the dewpoint was maintained at 20°C. A
second set of experiments investigated the effect of hu-
midity on the filtration process. This time, the moisture
level was varied by adjusting the dewpoint between 20°C
and 42°C, while the temperature was maintained at 80°C.
Both powders were tested at each set of conditions, to
allow a direct comparison between the powders.
The average specific cake resistance and deposition ra-
tio for each run were determined from the filtration equa-
tion (1), using the pressure drop and cake mass measure-
ments at the start and end of the run.
(1)
∆Ptotal is the total pressure drop across the filter, ∆Pfilter is
the pressure drop due to the filter medium (pressure drop
at the start of the run), kd is the deposition ratio (propor-
tion of powder which adheres to the filter), is the spe-
cific cake resistance, ci is the powder concentration in the
inlet air stream (determined from the measured powder
and air flows), vf is the filtration velocity, and t is time.
A Kruskal-Wallis (K-W) test was carried out to com-
pare the differences in specific cake resistance or filter
deposition between operating conditions with the scatter
within sets of repeats. This was used in preference to an
ANOVA F test as the scatter appeared non-normal in
distribution. Where the K-W test indicated significant
differences, a Mann-Whitney U test was used to directly
compare pairs of conditions, to determine whether the
effect occurred over the entire temperature or humidity
range tested. A 95% confidence level was used for both
tests.
Filter cake samples were examined under a microscope
to observe the cake structure and determine possible
mechanisms for the differences.
III. RESULTS AND DISCUSSION
A. Comparison Between Powders
The MPC powder had a much lower resistance than the
SMP, and much higher deposition under equivalent con-
ditions. Several filter cake samples were examined under
a microscope to determine possible mechanisms for the
difference in cake resistance. A comparison of filter cakes
formed at 80°C under dry conditions supported the mech-
anism proposed by Morris and Allen [2], that particle
stickiness promotes the formation of dendritic structures,
TABLE 1 – POWDER COMPOSITION
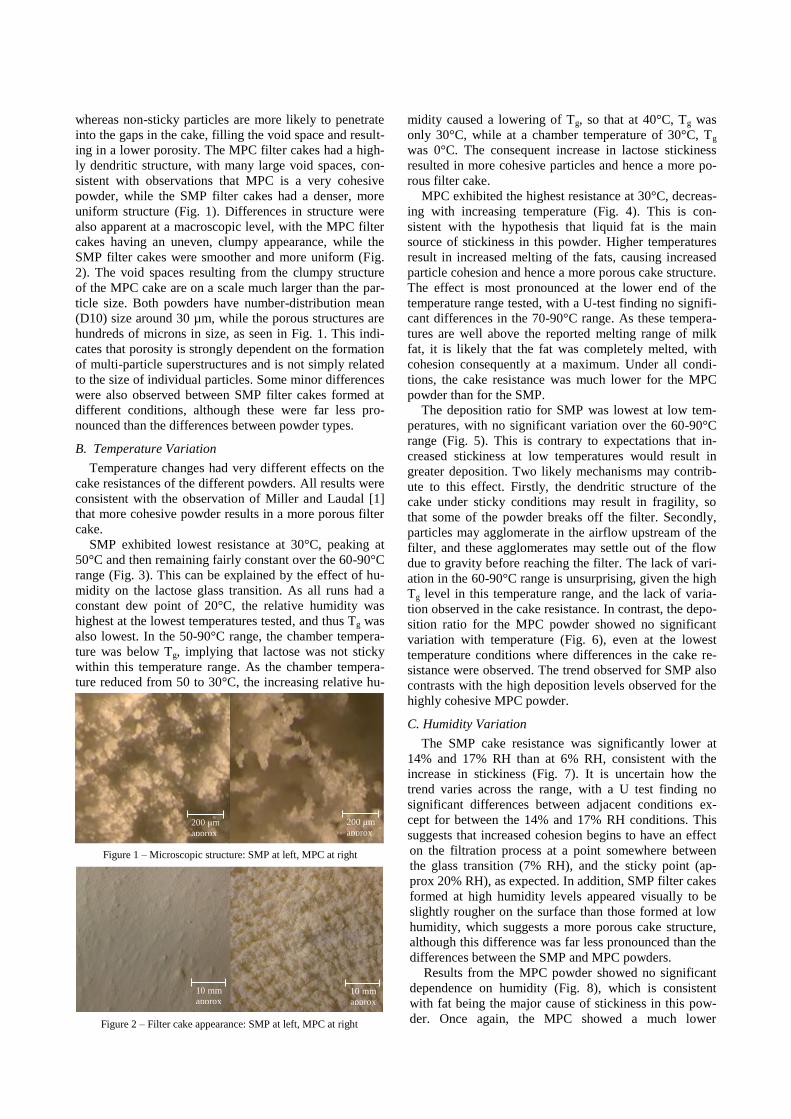
whereas non-sticky particles are more likely to penetrate
into the gaps in the cake, filling the void space and result-
ing in a lower porosity. The MPC filter cakes had a high-
ly dendritic structure, with many large void spaces, con-
sistent with observations that MPC is a very cohesive
powder, while the SMP filter cakes had a denser, more
uniform structure (Fig. 1). Differences in structure were
also apparent at a macroscopic level, with the MPC filter
cakes having an uneven, clumpy appearance, while the
SMP filter cakes were smoother and more uniform (Fig.
2). The void spaces resulting from the clumpy structure
of the MPC cake are on a scale much larger than the par-
ticle size. Both powders have number-distribution mean
(D10) size around 30 µm, while the porous structures are
hundreds of microns in size, as seen in Fig. 1. This indi-
cates that porosity is strongly dependent on the formation
of multi-particle superstructures and is not simply related
to the size of individual particles. Some minor differences
were also observed between SMP filter cakes formed at
different conditions, although these were far less pro-
nounced than the differences between powder types.
B. Temperature Variation
Temperature changes had very different effects on the
cake resistances of the different powders. All results were
consistent with the observation of Miller and Laudal [1]
that more cohesive powder results in a more porous filter
cake.
SMP exhibited lowest resistance at 30°C, peaking at
50°C and then remaining fairly constant over the 60-90°C
range (Fig. 3). This can be explained by the effect of hu-
midity on the lactose glass transition. As all runs had a
constant dew point of 20°C, the relative humidity was
highest at the lowest temperatures tested, and thus Tg was
also lowest. In the 50-90°C range, the chamber tempera-
ture was below Tg, implying that lactose was not sticky
within this temperature range. As the chamber tempera-
ture reduced from 50 to 30°C, the increasing relative hu-
midity caused a lowering of Tg, so that at 40°C, Tg was
only 30°C, while at a chamber temperature of 30°C, Tg
was 0°C. The consequent increase in lactose stickiness
resulted in more cohesive particles and hence a more po-
rous filter cake.
MPC exhibited the highest resistance at 30°C, decreas-
ing with increasing temperature (Fig. 4). This is con-
sistent with the hypothesis that liquid fat is the main
source of stickiness in this powder. Higher temperatures
result in increased melting of the fats, causing increased
particle cohesion and hence a more porous cake structure.
The effect is most pronounced at the lower end of the
temperature range tested, with a U-test finding no signifi-
cant differences in the 70-90°C range. As these tempera-
tures are well above the reported melting range of milk
fat, it is likely that the fat was completely melted, with
cohesion consequently at a maximum. Under all condi-
tions, the cake resistance was much lower for the MPC
powder than for the SMP.
The deposition ratio for SMP was lowest at low tem-
peratures, with no significant variation over the 60-90°C
range (Fig. 5). This is contrary to expectations that in-
creased stickiness at low temperatures would result in
greater deposition. Two likely mechanisms may contrib-
ute to this effect. Firstly, the dendritic structure of the
cake under sticky conditions may result in fragility, so
that some of the powder breaks off the filter. Secondly,
particles may agglomerate in the airflow upstream of the
filter, and these agglomerates may settle out of the flow
due to gravity before reaching the filter. The lack of vari-
ation in the 60-90°C range is unsurprising, given the high
Tg level in this temperature range, and the lack of varia-
tion observed in the cake resistance. In contrast, the depo-
sition ratio for the MPC powder showed no significant
variation with temperature (Fig. 6), even at the lowest
temperature conditions where differences in the cake re-
sistance were observed. The trend observed for SMP also
contrasts with the high deposition levels observed for the
highly cohesive MPC powder.
C. Humidity Variation
The SMP cake resistance was significantly lower at
14% and 17% RH than at 6% RH, consistent with the
increase in stickiness (Fig. 7). It is uncertain how the
trend varies across the range, with a U test finding no
significant differences between adjacent conditions ex-
cept for between the 14% and 17% RH conditions. This
suggests that increased cohesion begins to have an effect
on the filtration process at a point somewhere between
the glass transition (7% RH), and the sticky point (ap-
prox 20% RH), as expected. In addition, SMP filter cakes
formed at high humidity levels appeared visually to be
slightly rougher on the surface than those formed at low
humidity, which suggests a more porous cake structure,
although this difference was far less pronounced than the
differences between the SMP and MPC powders.
Results from the MPC powder showed no significant
dependence on humidity (Fig. 8), which is consistent
with fat being the major cause of stickiness in this pow-
der. Once again, the MPC showed a much lower Figure 2 – Filter cake appearance: SMP at left, MPC at right
10 mm
approx
10 mm
approx
Figure 1 – Microscopic structure: SMP at left, MPC at right
200 μm
approx 200 μm
approx
resistance than the SMP under all conditions tested. The
deposition ratio for SMP was also strongly affected by
the humidity, with much lower deposition at high humidi-
ty levels (Fig. 9). This confirms the results of the temper-
ature tests, in that increased cohesion was correlated with
decreased deposition. The deposition at 6% RH was not
significantly different at a 95% confidence level from the
8% RH condition, suggesting that the effect only occurs
above a threshold of 8% RH. The MPC deposition
showed no clear dependence on humidity (Fig. 10), alt-
hough once again the deposition was much higher for
MPC than for SMP.
The exact sticky point for the filtration process investi-
gated in this work is uncertain, but is likely to be close to
that measured by the particle bombardment method used
by Paterson et al [5], due to the similarity with this meth-
od. The T−Tg levels tested here (up to 30°C) are below
the critical level of 37°C reported in that study. Higher
humidity levels could not be tested as the stickiness of the
powder above 17% RH caused the powder feed system to
block. It was therefore not possible to determine whether
any turning points in the cake resistance or deposition
trends occur at the sticky point.
D. General Discussion
All results confirm the observations of Miller and
Laudal [1], that increased particle cohesion results in a
more porous filter cake structure. This implies that cohe-
sion is beneficial to the operation of baghouses, as in-
creased cake porosity results in lower pressure differen-
tials across the filter, and therefore reduces operating
costs. The dependence of SMP cake resistance on hu-
midity was expected, due to the effect of humidity on
glass transition.
The effect of temperature on SMP appears to be solely
due to the associated change in relative humidity, con-
firming expectations that lactose is the primary cause of
stickiness in SMP. Similarly, the dependence of MPC
cake resistance on temperature, but not humidity, con-
firms expectations that fat is the primary cause of cohe-
sion in this powder. However, as industrial baghouses are
usually operated at temperatures well above the fat melt-
ing range, ordinary variations in baghouse temperature
are unlikely to have any measurable effect on the
baghouse performance. Increases in humidity may offer
slight improvements in baghouse performance with SMP;
however the flow on effects on other aspects of pro-
cessing may negate any benefits obtained.
It appears that powder cohesion is not sufficient as a
universal predictor of powder deposition. Deposition in
SMP was negatively correlated with cohesion; however
the highly cohesive MPC powder showed much higher
deposition. In addition, the deposition of MPC was not
affected by changes in cohesion due to temperature varia-
tion. This difference in behaviour is most likely due to
differences in the filter cake strength between the two
powders. Particles adhering to the filter cake may be sub-
ject to subsequent dislodgement due to bombardment
from other incoming particles. The liquid fat in the MPC
powder would be expected to reinforce liquid bridges,
Figure 3 - Effect of temperature on SMP filter cake
Figure 4 - Effect of temperature on MPC filter cake
Figure 5 – Effect of temperature on SMP deposition
Figure 6 – Effect of temperature on MPC deposition
consolidating inter-particle bonds in the filter cake. In the
SMP, however, the high viscosity of the amorphous lac-
tose should limit consolidation, so that bonds remain
weak, and particles are more likely to be dislodged from
the filter cake.
The conclusions that can be drawn are limited by the
large degree of scatter in the data. Several possible causes
of the scatter were investigated, however ultimately the
scatter could not be prevented. Variation in the tempera-
ture and moisture content of the powder supplied to the
rig was found to have a minimal effect, ruling this out as
a cause of the scatter. The vibrating hopper was extreme-
ly sensitive to changes in compressed air pressure, result-
ing in variation in the powder feed rate, however this
showed no correlation with the variation in the resistance
or deposition. The filter cake frequently suffered slight
damage during removal from the apparatus, resulting in
some variation in the cake mass measurement. This can
account for some, but not all, of the scatter in the data.
Nevertheless, analysis with the Kruskal-Wallis statistical
test confirms that conclusions can confidently be drawn,
despite the scatter.
IV. CONCLUSIONS
More cohesive milk powders form more porous filter
cakes during collection in baghouses. The primary mech-
anism for this is that sticky powders form dendritic struc-
tures, impeding the penetration of particles into the void
spaces in the filter cake. In low fat powders, stickiness is
mainly due to the lactose glass transition, and is conse-
quently highly dependent on relative humidity. In pow-
ders with a high fat content, stickiness is primarily due to
liquid fat, and depends on temperature, with stickiness
reducing markedly at temperatures below 40°C, the upper
end of the melting temperature range of milk fats.
The proportion of powder depositing on the filter var-
ies greatly between powders and conditions. For SMP,
the deposition is reduced by increased relative humidity.
In MPC powder, the deposition is not affected by either
temperature or humidity. The deposition for MPC is gen-
erally much higher than for SMP, however the lower spe-
cific cake resistance results in a lower overall pressure
drop for MPC.
ACKNOWLEDGEMENTS
The authors would like to thank the New Zealand Min-
istry of Business, Innovation and Employment for provid-
ing financial support, and Fonterra Ltd for providing
some additional financial support, and for providing the
milk powders used in the study.
REFERENCES
[1] Miller, S.J. and D.L. Laudal, "Pulse-jet baghouse
performance improvement with flue gas conditioning",
1992.
[2] Morris, K. and R.W.K. Allen, "The influence of dust and
gas properties on cake adhesion in fabric filters".
Filtration & Separation. 33(4): p. 339-343, 1996.
Figure 7 – Effect of humidity on SMP filter cake at 80°C
Figure 8 – Effect of humidity on MPC filter cake at 80°C
Figure 9 – Effect of humidity on SMP deposition at 80°C
Figure 10 – Effect of humidity on MPC deposition at 80°C
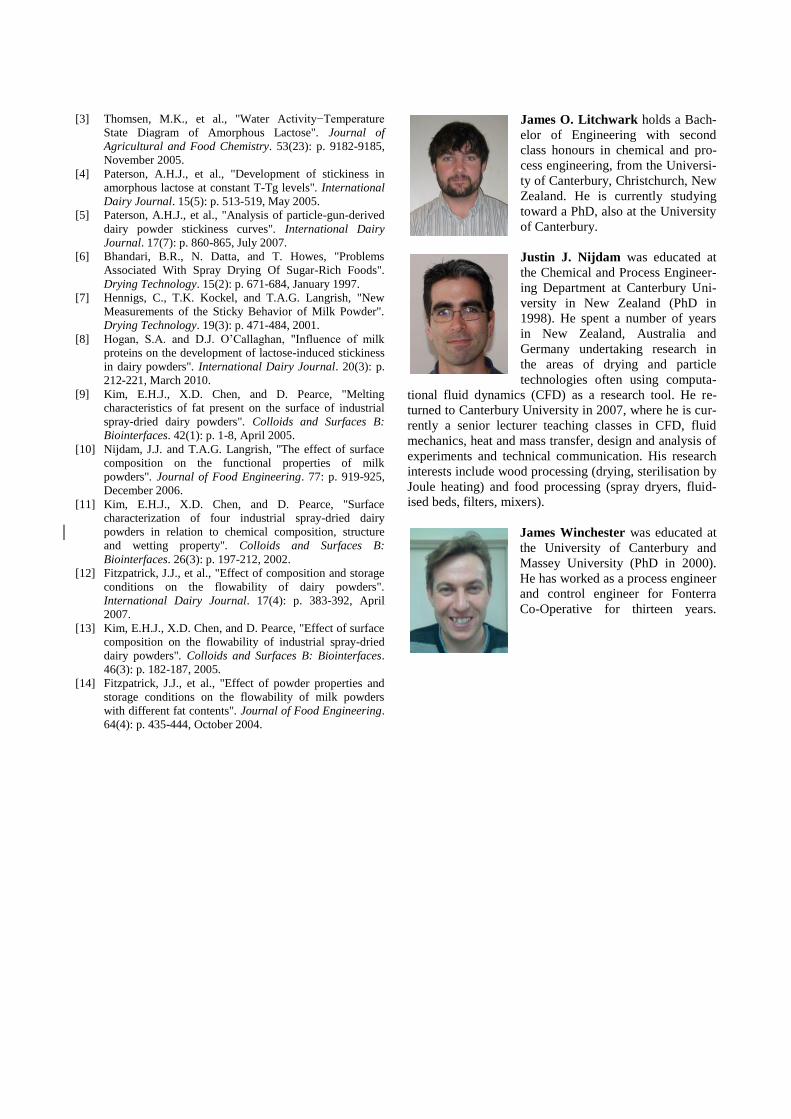
[3] Thomsen, M.K., et al., "Water Activity−Temperature
State Diagram of Amorphous Lactose". Journal of
Agricultural and Food Chemistry. 53(23): p. 9182-9185,
November 2005.
[4] Paterson, A.H.J., et al., "Development of stickiness in
amorphous lactose at constant T-Tg levels". International
Dairy Journal. 15(5): p. 513-519, May 2005.
[5] Paterson, A.H.J., et al., "Analysis of particle-gun-derived
dairy powder stickiness curves". International Dairy
Journal. 17(7): p. 860-865, July 2007.
[6] Bhandari, B.R., N. Datta, and T. Howes, "Problems
Associated With Spray Drying Of Sugar-Rich Foods".
Drying Technology. 15(2): p. 671-684, January 1997.
[7] Hennigs, C., T.K. Kockel, and T.A.G. Langrish, "New
Measurements of the Sticky Behavior of Milk Powder".
Drying Technology. 19(3): p. 471-484, 2001.
[8] Hogan, S.A. and D.J. O’Callaghan, "Influence of milk
proteins on the development of lactose-induced stickiness
in dairy powders". International Dairy Journal. 20(3): p.
212-221, March 2010.
[9] Kim, E.H.J., X.D. Chen, and D. Pearce, "Melting
characteristics of fat present on the surface of industrial
spray-dried dairy powders". Colloids and Surfaces B:
Biointerfaces. 42(1): p. 1-8, April 2005.
[10] Nijdam, J.J. and T.A.G. Langrish, "The effect of surface
composition on the functional properties of milk
powders". Journal of Food Engineering. 77: p. 919-925,
December 2006.
[11] Kim, E.H.J., X.D. Chen, and D. Pearce, "Surface
characterization of four industrial spray-dried dairy
powders in relation to chemical composition, structure
and wetting property". Colloids and Surfaces B:
Biointerfaces. 26(3): p. 197-212, 2002.
[12] Fitzpatrick, J.J., et al., "Effect of composition and storage
conditions on the flowability of dairy powders".
International Dairy Journal. 17(4): p. 383-392, April
2007.
[13] Kim, E.H.J., X.D. Chen, and D. Pearce, "Effect of surface
composition on the flowability of industrial spray-dried
dairy powders". Colloids and Surfaces B: Biointerfaces.
46(3): p. 182-187, 2005.
[14] Fitzpatrick, J.J., et al., "Effect of powder properties and
storage conditions on the flowability of milk powders
with different fat contents". Journal of Food Engineering.
64(4): p. 435-444, October 2004.
James O. Litchwark holds a Bach-
elor of Engineering with second
class honours in chemical and pro-
cess engineering, from the Universi-
ty of Canterbury, Christchurch, New
Zealand. He is currently studying
toward a PhD, also at the University
of Canterbury.
Justin J. Nijdam was educated at
the Chemical and Process Engineer-
ing Department at Canterbury Uni-
versity in New Zealand (PhD in
1998). He spent a number of years
in New Zealand, Australia and
Germany undertaking research in
the areas of drying and particle
technologies often using computa-
tional fluid dynamics (CFD) as a research tool. He re-
turned to Canterbury University in 2007, where he is cur-
rently a senior lecturer teaching classes in CFD, fluid
mechanics, heat and mass transfer, design and analysis of
experiments and technical communication. His research
interests include wood processing (drying, sterilisation by
Joule heating) and food processing (spray dryers, fluid-
ised beds, filters, mixers).
James Winchester was educated at
the University of Canterbury and
Massey University (PhD in 2000).
He has worked as a process engineer
and control engineer for Fonterra
Co-Operative for thirteen years.