balance in an unpredictable environment€¦ · foundation of our balance sheet strength. further,...
TRANSCRIPT

Balance in an Unpredictable Environment
2011Annual Report

100
120
140
160
180
200
220
240
260
280
300
320
340
360
380
400
420
12/2
011
9/2
011
6/2
011
3/2
011
12/2
010
9/2
010
6/2
010
3/2
010
12/2
00
99
/20
09
6/2
00
93
/20
09
12/2
00
89
/20
08
6/2
00
83
/20
08
12/2
007
9/2
007
6/2
007
3/2
007
12/2
00
69
/20
06
6/2
00
63
/20
06
12/2
00
59
/20
05
6/2
00
53
/20
05
12/2
00
49
/20
04
6/2
00
43
/20
04
12/2
00
39
/20
03
6/2
00
33
/20
03
12/2
00
29
/20
02
6/2
00
23
/20
02
12/2
001
9/2
001
6/2
001
3/2
001
12/2
00
09
/20
00
6/2
00
03
/20
00
12/1
99
99
/19
99
6/1
99
93
/19
99
12/1
99
89
/19
98
6/1
99
83
/19
98
12/1
997
9/1
997
6/1
997
3/1
997
12/1
99
69
/19
96
6/1
99
63
/19
96
12/1
99
59
/19
95
6/1
99
53
/19
95
12/1
99
49
/19
94
6/1
99
43
/19
94
12/1
99
311
/19
93
finAnciAl highlights(expressed in millions of U.S. dollars, except per share data)
* Source: Bloomberg
The Company’s Annual Report contains measures such as operating (loss) earnings, operating (loss) earnings per share and operating return on e quity that are considered non-GAAP measures. In addition, the basis of calculation of these non-GAAP measures was redefined effective January 1, 2011, and the comparatives have been recast to reflect the current presentation. See also Key Financial Measures – Comment on Non-GAAP Measures in Item 7 of Part II of the Company’s Annual Report on Form 10-K/A for the year ended December 31, 2011.
Compound Annual ReturnPrice: 6.2%Dividend:* 2.6%total: 8.8%
Comparative Performance Graph PartnerRe Share Price S&P 500
for the years ended December 31, 2007 2008 2009 2010 2011
$ 3,757 $ 3,989 $ 3,949 $ 4,705 $ 4,486 net premiums written
4,211 3,980 5,418 5,861 5,352 total revenues
718 47 1,537 853 (520) net income (loss)
841 433 931 492 (642)Operating earnings (loss) available to common shareholders
1,227 1,159 1,099 1,227 574 Operating cash flow
Per common share:
$ 14.61 $ 7.79 $ 14.57 $ 6.29 $ (9.50) Diluted operating earnings (loss) per share
11.87 0.22 23.51 10.46 (8.40) Diluted net income (loss) per share
1.72 1.84 1.88 2.05 2.35 Dividend per share
26.1% 11.5% 22.3% 7.4% (10.1)%
Operating return on beginning diluted book value per common share and common share equivalents outstanding
21.2% 0.3% 37.4% 12.4% (9.0)%
Return on beginning diluted book value per common share and common share equivalents outstanding calculated with net income (loss) available to common shareholders
non-life ratios:
50.8 % 63.9 % 52.7 % 65.9 % 96.7 % loss ratio
22.9 23.3 21.9 21.3 21.3 Acquisition ratio
6.7 6.9 7.2 7.8 7.4 Other operating expense ratio
80.4 % 94.1 % 81.8 % 95.0 % 125.4 % combined ratio
At December 31, 2007 2008 2009 2010 2011
$ 11,572 $ 11,724 $ 18,165 $ 18,181 $ 17,898 total investments and cash and cash equivalents (including funds held–directly managed)
16,149 16,279 23,733 23,364 22,855 total assets
8,773 8,943 12,427 12,417 12,919 non-life & life reserves
4,322 4,199 7,646 7,207 6,468 total shareholders’ equity
67.96 63.95 84.51 93.77 84.82 Diluted book value per common share and common share equivalents
5,192 4,899 7,959 8,020 7,281 total capital
4,477 4,023 6,165 5,623 4,194 Market capitalization

2011Annual Report

TABLE OF CONTENTS
LETTER FROM THE CHAIRMAN 3 Jean-Paul Montupet
LETTER FROM THE CEO 4 Costas Miranthis
OUR ORGANIZATION AT A GLANCE 7
BALANCE IN AN UNPREDICTABLE ENVIRONMENT 8 Q&A with Costas Miranthis, President and CEO
FORM 10-K/A 17
PARTNERRE ORGANIZATION 227

LETTER FROM THE CHAIRMAN
To Our Shareholders:
2011 marked a challenging year for the industry and for PartnerRe with an unusually high frequency and severity of natural disasters. We are in the risk business and we expect that in such a year profitability will be challenged. Despite a tough year, the new management team worked well together and PartnerRe has demonstrated, once again, its resilience in the face of extreme events.
In such a tumultuous year, it would have been easy to allow short-term challenges to distract from long-term vision. Although the Company faced substantial losses early in the year, Costas and his executive team took the opportunity to reflect on how to do things better and sometimes differently. They also took the time to review our long-term strategy in the context of the broader industry and economic trends and identified initiatives that I am sure will project our past success into the future.
As we enter 2012, managing risk and volatility remains a central focus to ensure value creation for our shareholders. We continuously work to evolve the Company’s risk framework and analysis to better manage risks. The Board also continues to spend time refining the governance process in response to increasing reinsurance regulatory change.
I would like to take this opportunity to acknowledge the contribution of Jürgen Zech, who is due to retire in May of this year. He has served as a Director since August 2002, providing valuable insight and guidance over the years. I know the Board joins me in thanking Jürgen and wishing him all the best in his future endeavors.
I look forward to serving my third year as PartnerRe’s Chairman and I speak on behalf of the entire Board when I say that PartnerRe is well prepared to further build on its solid track record.
Thank you for your continued support.
Jean-Paul MontupetChairman of the Board
3

When I assumed the role of CEO in January 2011 I knew that there would be some challenges ahead, but I did not expect that in my first quarter the reinsurance industry would experience what turned out to be a record loss quarter. Significant and unusual catastrophe losses continued to occur for the rest of the year, but for PartnerRe the events of the first quarter, particularly the earthquakes in Japan and New Zealand, shaped our 2011 performance. Our annual performance was disappointing. An operating loss of $642 million and a net loss of $520 million are not results we expect to deliver to our shareholders too often.
As a major international reinsurer, we expect to absorb losses when large but low frequency catastrophes occur. Timing was also a significant factor in PartnerRe’s losses. The Japanese Tohoku earthquake occurred three weeks before the first Japanese renewal of the combined portfolio following the Paris Re acquisition, by our current team. Despite the fact that our exposure in affected zones was within our risk appetite limits, it was higher than we would normally carry within a balanced catastrophe portfolio. As a result, our share of the overall reinsured loss was high.
Timing aside, with experiences like last year’s, our first reaction is to look at the impact on our annual financial results. However, I believe it is more important to assess the impact on the Company’s financial strength and standing with clients, the effect on our performance in a longer term context, and, of course, what lessons are to be learned.
Our deep capital resources have enabled us to absorb claims and pay them promptly. Our reputation for financial strength, security and reliability is not challenged. Our balance sheet at $7.3 billion of total capital remains very strong and we continue to have an appetite for catastrophe business in all parts of the world. Our approach remains technical and reflects our current understanding of risk. Our communications with our clients are timely and
LETTER FROM THE CEO
transparent; repeatedly they tell us that they value and respect our behavior.
Further, as painful as the 2011 loss is, it does not destroy a very good track record over the medium to longer term. True, our performance can be a little lumpy but there is no question about our ability to deliver value over the long term. We’ve grown our dividend-adjusted book value per share at a very attractive rate over any five-year period since our foundation. We remain committed to long-term growth in both our economic book value per share and dividends, a measure that we use internally to define success.
We always look to learn from loss events. Damaging earthquakes do not happen very frequently. The data available to our scientists and modelers, when they do happen, improves our understanding of the risk and enables us to improve the calibration of our models. We can learn more about physical parameters of the risk and the damage they can cause to structures, but we also learn a lot about our own customers and their response to the events. These lessons are increasingly reflected in our pricing of the risk and our risk selection.
From a broader perspective, we are satisfied with the way our risk management systems performed. Given the type of events, the losses were within our contemplated scenarios and within our maximum risk appetite. But we also realize that we can improve on the communication of our risk appetite and risk tolerances as well as on our risk positions at any point in time – and we will.
While most of the attention during the year focused on catastrophe losses, PartnerRe is a diversified reinsurer. Our diversification has improved progressively over time, and we will continue to pursue a diversified strategy. I would like to acknowledge the good performance from those parts of our business that were not impacted by catastrophes. In 2011, our diversification and our
To Our Shareholders:
4

1994 1995 1996 1997 1998 1999 2000 2001 2002 2003 2004 2005 2006 2007 2008 2009 2010 20111993
SHAREHOLDER VALUE CREATION n Cumulative Dividend
n Book Value Per Share
$20
$0
$40
$60
$80
$120
$100
financial conservatism mitigated the effect of the catastrophes. We continue to see strong favorable prior year reserve development – a testament to our conservative reserving policy which is a foundation of our balance sheet strength. Further, our diversified product line has allowed us to rapidly deploy capital to take advantage of a limited number of new opportunities.
Later in this report, I discuss my views of current reinsurance market dynamics and how the pricing environment may change. I believe we are in an improving market but quite some way from a hard market. I expect positive change to be gradual, but I also hope it will be more sustained. In the current low interest rate environment, the main catalyst for improvement will have to come from underwriting margins. Our technical orientation, as well as our diversification by product and geography, positions us well to make the most of these markets.
Costas MiranthisPresident and CEO, PartnerRe Ltd.
Finally, I would like to thank my executive team and the teams they lead for their support and hard work during the year, under very difficult circumstances. I have known most of my management team for some time, as they have all been a key part of PartnerRe’s historic success. Over the last year, I have watched them grow in their new roles and manage the tremendous talent that we have in this organization. While we will continue to evolve our skill-sets to remain an exceptional underwriter and manager of risk, our people have been and will remain the key ingredient of our continued success.
5

Marvin Pestcoe CEO PartnerRe Capital Markets Group
Emmanuel Clarke CEO PartnerRe Global
Tad Walker CEO PartnerRe North America
Bill Babcock EVP and CFOPartnerRe Ltd.
EXECUTIVE TEAM
6

Costas MiranthisPresident and CEO PartnerRe Ltd.
Standard Lines• Property• Casualty• Regional• Structured Risk
Specialty Lines• Specialty Casualty• Space• Surety and Fidelity• New Products
Managed Programs• Program Business• Agriculture• RRGs/Captives/Pools• Terrorism• U.S. Auto
Canada• Auto• Property• Casualty• Multiline (All classes)• Specialty Casualty
Tad WalkerCEO PartnerRe North America
North America
Global P&C• Latin America, Caribbean,
Africa, Middle East, Turkey, Cyprus, Greece and Israel
• Asia-Pacific, India• U.K., Ireland, France, Benelux
and Southern Europe• Northern, Central and
Eastern Europe, Russia and CIS countries
Global Specialty• Agriculture• Aviation/Space• Credit/Surety• Energy Onshore (Treaty)• Engineering (Treaty)• Marine/Energy Offshore
(Treaty)• Specialty Casualty• Special Risks (Treaty)
Facultative• Property• Energy On and Offshore• Engineering• Sports, Leisure, Entertainment
Catastrophe• Worldwide
Emmanuel ClarkeCEO PartnerRe Global
Global
Life• France, Benelux, Southern
Europe, Middle East, Canada and Latin America
• Northern, Central and Eastern Europe, Israel and Asia
• U.K. and Ireland• Longevity
Fixed Income• U.S. Treasury• European Governments• U.S. Credit• European Credit• U.S. Mortgage-backed
Securities• Asset-backed Securities
Capital Assets• Equities• Insurance-linked Securities• Principal Finance • Strategic Investments
Marvin PestcoeCEO PartnerRe Capital Markets Group
Life and Capital Markets
• Accounting and Reporting• Capital, Treasury and
Currency Management• Taxation• Investor Relations
Bill BabcockEVP and CFO PartnerRe Ltd.
Finance
Actuarial • Audit • Communications • HR • IT • Legal • Risk Management
OUR ORGANIZATION AT A GLANCE
7

Q&A withCostas MiranthisPresident and CEO
Balance in an Unpredictable Environment

BALANCE IN AN UNPREDICTABLE ENVIRONMENT
2011 will be remembered for the extreme natural catastrophes endured around the world, and for their human, financial and economic toll. At the same time, the struggling global economy continued to stagnate, as the future of the Eurozone remained in question and the U.S. economic recovery weakened. In the following pages, Costas reflects on what the year’s events mean for the industry and how PartnerRe is finding balance in an otherwise unpredictable environment.
9

Total Capital ($ billions)
TODAY, OUR CAPITAL POSITION IS ONE OF THE STRONGEST IN OUR HISTORY.
9
8
7
6
5
4
3
2
1
0
19941993 1995 1996 201120102009200820072006200520042003200220012000199919981997
2011 has been called the worst year ever for catastrophic losses – earthquakes, tornadoes, and floods to name a few. What do you believe the industry has learned from such a tumultuous year?
The devastating scenes of human suffering caused by the 2011 events will be with us for a very long time. Of course, those of us in the insurance and reinsurance industry will also remember 2011 for the record insured losses caused and the extraordinary frequency of catastrophic events.
If there are any lessons to be learned, they will not be found in the statistics but rather in the nature of the losses. We witnessed several unprecedented events in unexpected locations: the Christchurch earthquakes in New Zealand
occurred on a “blind” or unknown fault; although the fault lines in Japan were well mapped, the magnitude of the Tohoku earthquake and scale of the ensuing tsunami were beyond predictions by most scientists; we saw historic tornado outbreaks in the Midwest; and the floods in Thailand – the worst in 50 years – exposed an accumulation of risk that was underappreciated by our industry prior to the event.
So perhaps the lesson for everybody is that we should be more humble about our understanding of risk. Our industry can and will provide coverage for catastrophic risks, however large they may potentially be. But our valuation of risk must include an allowance for risks that lie outside the predictive range of our best models.
BALANCE IN AN UNPREDICTABLE ENVIRONMENT
10

Does the 2011 loss experience fundamentally change the dynamics of the reinsurance market?
At a macro level, the dynamics of the reinsurance business are driven by supply and demand. There has been a modest decline in the capitalization of the reinsurance industry over the course of the year, but overall this is marginal. On the demand side, the extreme nature of the 2011 events, as well as the revisions in widely used catastrophe models will, over time, generate some additional demand for risk transfer. However, economic growth in most developed markets is likely to remain challenged for some time and this dampens demand for our products. So it is unlikely that we will see a very broad market turn driven by a sudden demand/supply imbalance.
Changes are more likely to be driven by two other factors. First, partly as a result of the lessons learned from loss events and partly as a result of model revisions, changes in the evaluation of risk will be increasingly reflected in market pricing. Second, while there may be ample capital, it will only be committed at the right price. Reinsurers must, over the medium term, deliver appropriate returns to shareholders. This argues for gradual – while less spectacular – market improvement, which to the extent it can be sustained is not necessarily a bad thing.
The year was also characterized by continued economic turmoil. What impact will the broader environment have on the industry?
We are clearly in uncharted waters. Many scenarios are possible, including radical ones, and anything that prompts an abrupt downturn in economic activity will impact all players – insurers and reinsurers. Clearly an orderly resolution of the current crisis in Europe is in everybody’s interest. Nobody wants to see a sharp economic contraction in Europe or in any part of the world. But I am afraid that a lot more will need to be done to address longer term challenges of structural imbalances in the world economy.
In the meantime, like most financial institutions, reinsurers look to invest a significant proportion of their assets in high-quality, low-risk assets, however our notion of what is a low-risk asset may have to change radically. This, coupled with the prospect of a sustained low interest rate environment, presents significant operational challenges. In this difficult environment, diversification is as important a risk-mitigant for assets as for liabilities.
When talking about industry threats, I would have to add the potentially destabilizing effect of regulatory changes to the list. Good regulation
11

is always welcome, but regulation that is not relevant can be damaging. We support the drive for increased professionalism in our industry and the desire to improve relevance by focusing on risk and transparency. But we are worried about a potential increase in the complexity of regulation, which may dilute its relevance, and add to the already significant cost of compliance.
Interest rates remain at their lowest level in decades. What do the prospects of a continued low interest rate environment mean for the insurance industry?
A low interest rate environment changes the way we view price adequacy. A significant part of a reinsurer’s return – particularly for longer tail lines – comes from the ability to invest premiums profitably before paying claims. To the extent that the income from this investment activity is lower, we will have to compensate with higher margins in premiums. Premiums relative to the expected loss cost will have to increase to maintain adequate returns for bearing risk. If those returns are not present, you are likely to see more companies returning capital to shareholders. Of course, if governments suppress interest rates for a prolonged period of time, we may have to reevaluate what adequate return means. However, whatever happens, there is no avoiding the fact that for a reinsurer with a prudent investment portfolio the key to value creation will be underwriting excellence.
Turning specifically to PartnerRe, what do the lessons from 2011 mean to you?
Of course we have learned a lot about the damage resulting from large events, particularly earthquakes. Our models will be calibrated to reflect this knowledge. In addition, the fact that the combination of the particular events was an extreme tail scenario, has refocused our attention on such scenarios. The extent to which certain tail events can be diversified is something we continuously evaluate and it affects the way we assess and price risk. Our ability to diversify risk is central to the way we create value. Our focus on the diversification of our earnings stream, as well as our capital base, will be unrelenting.
The events of 2011 led to a substantial loss for PartnerRe. How comfortable are you with the Company’s capital position today?
The catastrophes of 2011 were a serious test for the organization, no doubt, but at no time did they endanger our financial stability. We have taken the losses and met our obligations – we will pay a substantial amount toward rebuilding Japan and New Zealand – and we continued to provide coverage in the aftermath. All losses were within our disclosed risk appetite, within limits that were set against a balance sheet that was built to support losses of this magnitude. We finished the year in a strong capital position and went on to write a solid January 1, 2012 renewal.
BALANCE IN AN UNPREDICTABLE ENVIRONMENT
12

n Life
n Specialty Property
n Specialty Casualty
n Marine
n Energy
n Engineering
n Credit/Surety
n Aviation/Space
n Agriculture
n Multiline and Other
n Motor
n Property
n Casualty
n Catastrophe
Net Premiums Written ($ billions)
OUR FOCUS ON THE DIVERSIFICATION OF OUR EARNINGS STREAM, AS WELL AS OUR CAPITAL BASE, WILL BE UNRELENTING.
5.0
4.5
4.0
3.5
3.0
2.5
2.0
1.5
1.0
0.5
0
19941993 1995 1996 201120102009200820072006200520042003200220012000199919981997
Today, our capital position with $6.5 billion of shareholders’ equity and $7.3 billion of total capital, is one of the strongest in our history. We have ample capital to take advantage of market opportunities as they arise. We remain committed to our principles for financial strength:
we maintain strong capitalization at all times, relative to both regulatory and our own internal requirements; we are diligent in our approach to managing our balance sheet; and we are disciplined in our reserving policies.
13

Still, the impact on PartnerRe's capital and its earnings demonstrates PartnerRe’s exposure to volatility. Have you changed how you think about risk and volatility as a result?
Risk is what we do; it’s our business. We must understand and evaluate risk and we must be willing to accept risk. If we don’t, we won’t be in business. But we are also in the business of creating value. Just understanding risk and having a risk appetite is not enough. We must be able to assume our clients’ volatility at a fair price and transform it into returns, with lower volatility.
Volatility in our own results is not something we seek but rather something we are prepared to accept if it implies superior risk-adjusted results over the longer term. We seek to manage volatility principally through diversification. But we also manage risk over time to improve our overall return. At times when our reward for bearing risk deteriorates we will be less willing to assume risk and volatility. Over the course of 2011, we took steps to improve the balance and diversification in our portfolio, both at a macro level, meaning broad business mix, and more importantly, at a micro level meaning individual risk selection.
We are also open to all options for managing risk provided that, over the longer term, they will improve the risk-adjusted returns on capital deployed. Our teams already use such tools. Finally, our decision on how much capital we are
willing to deploy in any given year will continue to reflect our desire to optimize capital deployment over time.
So should we expect to see any changes in the way PartnerRe approaches the market?
There are certain fundamental strengths at PartnerRe that will not change. A strong balance sheet supported by prudent reserving practices, conservative financial policies that reinforce our capital strength and talented reinsurance professionals are all part of PartnerRe’s stand-out profile. We have a very strong quantitative and analytic bias in this organization. We’re good at evaluating risk – and the market can continue to expect expertise in this area. We have a reputation for transparency and fair dealing with all of our partners. We are willing to listen to our clients, to understand their needs and we are prepared to build relationships for the longer term.
But we must not confuse the willingness to form long-term relationships or consistency of approach with automatic renewal of prior contracts. There will be times when market conditions and our understanding of risk differ substantially. In such situations, we may be less willing to assume particular risks. Our clients know as well as we do that we have to earn an adequate return, or we cannot provide the continuity they desire. There must always be a balance between the needs of our clients and our commitment to our shareholders.
BALANCE IN AN UNPREDICTABLE ENVIRONMENT
14

TorontoMontréal
Greenwich
Zurich
Singapore
Hong Kong
TokyoWashington D.C.
Bermuda
Miami
Mexico City
Santiago
DublinParis
SeoulBeijing
São Paulo
¢ Premium by Region
l Client Distribution by City
n Office Locations
OUR GEOGRAPHIC REACH AND OUR PRODUCT DIVERSIFICATION HAVE PLAYED A BIG PART IN OUR SUCCESS.
What will a successful PartnerRe look like several years from now?
We will continue to build on the strengths that have enabled us to deliver value to our shareholders and valuable products to our clients. Our long-term record of value creation speaks for itself. While our business model will always have some short-term volatility, over the
reinsurance cycle we have delivered value to our shareholders.
Our geographic reach, our product diversification and our financial conservatism have played a big part in our success. But ultimately it comes down to people. We are proud of the risk evaluation, risk management and other technical skills we have in
15

NOTE: This table shows the percentage of gross Non-life underwriting risk capital deployed at January 1 and does not include capital to support other risks, such as reserving risk resulting from prior underwriting activity and asset risk. A new method for calculating underwriting risk capital deployed was implemented for 2012, and prior year numbers were recalculated to the current basis. The percentages shown here are not necessarily indicative of full year trends.
2010
2011
2012
0% 20% 40% 60% 80% 100%
WE TOOK STEPS TO IMPROVE THE BALANCE AND DIVERSIFICATION IN OUR PORTFOLIO.
Percentage of gross Non-life underwriting risk capital deployed at January 1 renewals
n Catastrophe n Property n Specialty Lines n Casualty n Motor
this Company. Our people have always been and will continue to be one of PartnerRe’s strengths.
As we continue to evolve, we may add or expand lines of business and we may modify our approach to specific segments. Our organizational structure may evolve to serve client needs and we may identify additional skill-sets that we need to acquire. But there will also be some constants. Our business will remain focused on risk assumption and risk management. We will differentiate ourselves in our clients’ eyes by our technical capabilities, by our understanding of their risks and by our fair and transparent approach, as well as our financial strength.
Diversification will be key to our success. It will remain an effective tool for managing risk. In addition, our access to a variety of risks through a number of products and channels provides us with strategic options. Most importantly, we will deliver superior returns to our shareholders – whatever the environment we find ourselves in. That means that over the longer term we will deliver superior growth in our book value per share plus dividends.
BALANCE IN AN UNPREDICTABLE ENVIRONMENT
16

UNITED STATESSECURITIES AND EXCHANGE COMMISSION
Washington, D.C. 20549
FORM 10-K/A(Amendment No. 1)
È ANNUAL REPORT PURSUANT TO SECTION 13 OR 15(d) OF THE SECURITIES EXCHANGEACT OF 1934
For the fiscal year ended December 31, 2011OR
‘ TRANSITION REPORT PURSUANT TO SECTION 13 OR 15(d) OF THE SECURITIES EXCHANGEACT OF 1934
For the transition period from toCommission file number 1-14536
PartnerRe Ltd.(Exact name of registrant as specified in its charter)
Bermuda Not Applicable(State or other jurisdiction of
incorporation or organization)(I.R.S. Employer
Identification No.)
90 Pitts Bay Road, Pembroke, Bermuda HM 08(Address of principal executive offices) (Zip Code)
(441) 292-0888(Registrant’s telephone number, including area code)
Securities registered pursuant to Section 12(b) of the Act:Title of each class Name of each exchange on which registered
Common Shares, $1.00 par value New York Stock Exchange, NYSE Euronext Paris,Bermuda Stock Exchange
6.75% Series C Cumulative Preferred Shares,$1.00 par value
New York Stock Exchange
6.50% Series D Cumulative Preferred Shares,$1.00 par value
New York Stock Exchange
7.25% Series E Cumulative Preferred Shares,$1.00 par value
New York Stock Exchange
Securities registered pursuant to Section 12(g) of the Act: None
Indicate by check mark if the registrant is a well-known seasoned issuer, as defined in Rule 405 of the Securities Act. Yes È No ‘
Indicate by check mark if the registrant is not required to file reports pursuant to Section 13 or Section 15(d) of the Act. Yes ‘ No È
Indicate by check mark whether the registrant (1) has filed all reports required to be filed by Section 13 or 15(d) of the Securities Exchange Act of1934 during the preceding 12 months (or for such shorter period that the registrant was required to file such reports), and (2) has been subject to such filingrequirements for the past 90 days. Yes È No ‘
Indicate by check mark whether the registrant has submitted electronically and posted on its corporate Web site, if any, every Interactive Data Filerequired to be submitted and posted pursuant to Rule 405 of Regulation S-T during the preceding 12 months (or for such shorter period that the registrantwas required to submit and post such files). Yes È No ‘
Indicate by check mark if disclosure of delinquent filers pursuant to Item 405 of Regulation S-K is not contained herein, and will not be contained, tothe best of registrant’s knowledge, in definitive proxy or information statements incorporated by reference in Part III of this Form 10-K or any amendmentto this Form 10-K. È
Indicate by check mark whether the registrant is a large accelerated filer, an accelerated filer, a non-accelerated filer, or a smaller reporting company.See the definitions of “large accelerated filer,” “accelerated filer” and “smaller reporting company” in Rule 12b-2 of the Exchange Act.
Large accelerated filer È Accelerated filer ‘
Non-accelerated filer ‘ Smaller reporting company ‘
Indicate by check mark whether the registrant is a shell company (as defined in Rule 12b-2 of the Act.) Yes ‘ No È
The aggregate market value of the voting stock held by non-affiliates of the registrant as of most recently completed second fiscal quarter (June 30,2011) was $4,654,659,330 based on the closing sales price of the registrant’s common shares of $68.85 on that date.
The number of the registrant’s common shares (par value $1.00 per share) outstanding, net of treasury shares, as of February 17, 2012 was65,392,803.
Documents Incorporated by Reference:
DocumentPart(s) Into Which
Incorporated
Portions of the registrant’s definitive proxy statement to be filed with the Securities and Exchange Commission pursuant toRegulation 14A under the Securities Exchange Act of 1934, as amended, relating to the registrant’s Annual General Meeting ofShareholders scheduled to be held May 16, 2012 are incorporated by reference into Part II and Part III of this report. With theexception of the portions of the Proxy Statement specifically incorporated herein by reference, the Proxy Statement is not deemed tobe filed as part of this report.


EXPLANATORY NOTE
This Amendment No. 1 on Form 10-K/A to PartnerRe Ltd.’s Annual Report on Form 10-K for the yearended December 31, 2011 (Form 10-K), originally filed with the Securities and Exchange Commission onFebruary 24, 2012, is being filed to revise the tables that present the development of gross, retroceded and netreserves for unpaid losses and loss expenses for the Company’s Non-life business, which were presented inBusiness – Reserves in Item 1 of Part I of the Form 10-K. The revised tables correct certain data previouslypresented in those tables related to:
(i) the gross, retroceded and net reserves for unpaid losses and loss expenses as of December 31, 2010 and2009 that were re-estimated one year later and two years later, including the impact of foreign exchange;and
(ii) the amount of net paid losses related to the net reserves for unpaid losses and loss expenses as of December31, 2009 through one year later and two years later, and the reconciliation of net paid losses related to prioryears, including and excluding Guaranteed Reserves.
In accordance with the rules of the Securities and Exchange Commission, this Amendment No. 1 sets forththe complete text of Form 10-K as amended to correct these tables.
Except as described above, no changes have been made to the Form 10-K, including the Company’sconsolidated financial statements. This Amendment No. 1 does not reflect subsequent events occurring afterFebruary 24, 2012, the original filing date of the Form 10-K, or modify or update in any way disclosures made inthe Form 10-K.

[THIS PAGE INTENTIONALLY LEFT BLANK]

TABLE OF CONTENTS
Page
PART I
Item 1. Business . . . . . . . . . . . . . . . . . . . . . . . . . . . . . . . . . . . . . . . . . . . . . . . . . . . . . . . . . . . . . . . . . . . . . 2Item 1A. Risk Factors . . . . . . . . . . . . . . . . . . . . . . . . . . . . . . . . . . . . . . . . . . . . . . . . . . . . . . . . . . . . . . . . . . 30Item 1B. Unresolved Staff Comments . . . . . . . . . . . . . . . . . . . . . . . . . . . . . . . . . . . . . . . . . . . . . . . . . . . . . 45Item 2. Properties . . . . . . . . . . . . . . . . . . . . . . . . . . . . . . . . . . . . . . . . . . . . . . . . . . . . . . . . . . . . . . . . . . . . 45Item 3. Legal Proceedings . . . . . . . . . . . . . . . . . . . . . . . . . . . . . . . . . . . . . . . . . . . . . . . . . . . . . . . . . . . . . 45Item 4. Mine Safety Disclosures . . . . . . . . . . . . . . . . . . . . . . . . . . . . . . . . . . . . . . . . . . . . . . . . . . . . . . . . 45
PART II
Item 5. Market for Registrant’s Common Equity, Related Stockholder Matters and Issuer Purchases ofEquity Securities . . . . . . . . . . . . . . . . . . . . . . . . . . . . . . . . . . . . . . . . . . . . . . . . . . . . . . . . . . . . . . 46
Item 6. Selected Financial Data . . . . . . . . . . . . . . . . . . . . . . . . . . . . . . . . . . . . . . . . . . . . . . . . . . . . . . . . . 48Item 7. Management’s Discussion and Analysis of Financial Condition and Results of Operations . . . . 50Item 7A. Quantitative and Qualitative Disclosures About Market Risk . . . . . . . . . . . . . . . . . . . . . . . . . . . 133Item 8. Financial Statements and Supplementary Data . . . . . . . . . . . . . . . . . . . . . . . . . . . . . . . . . . . . . . . 142Item 9. Changes in and Disagreements with Accountants on Accounting and Financial Disclosure . . . . 204Item 9A. Controls and Procedures . . . . . . . . . . . . . . . . . . . . . . . . . . . . . . . . . . . . . . . . . . . . . . . . . . . . . . . . 204Item 9B. Other Information . . . . . . . . . . . . . . . . . . . . . . . . . . . . . . . . . . . . . . . . . . . . . . . . . . . . . . . . . . . . . 207
PART III
Item 10. Directors, Executive Officers and Corporate Governance . . . . . . . . . . . . . . . . . . . . . . . . . . . . . . 207Item 11. Executive Compensation . . . . . . . . . . . . . . . . . . . . . . . . . . . . . . . . . . . . . . . . . . . . . . . . . . . . . . . . 207Item 12. Security Ownership of Certain Beneficial Owners and Management and Related Stockholder
Matters . . . . . . . . . . . . . . . . . . . . . . . . . . . . . . . . . . . . . . . . . . . . . . . . . . . . . . . . . . . . . . . . . . . . . . 207Item 13. Certain Relationships and Related Transactions, and Director Independence . . . . . . . . . . . . . . . 207Item 14. Principal Accountant Fees and Services . . . . . . . . . . . . . . . . . . . . . . . . . . . . . . . . . . . . . . . . . . . . 207
PART IV
Item 15. Exhibits and Financial Statement Schedules . . . . . . . . . . . . . . . . . . . . . . . . . . . . . . . . . . . . . . . . 208

[THIS PAGE INTENTIONALLY LEFT BLANK]

SPECIAL NOTE REGARDING FORWARD-LOOKING STATEMENTS
PartnerRe Ltd. has made statements under the captions Business, Risk Factors, Management’s Discussionand Analysis of Financial Condition and Results of Operations, particularly under the captions “2012 Outlook”(or similarly captioned sections) and in other sections of this annual report on Form 10-K/A (Amendment No. 1)that are forward-looking statements. In some cases, you can identify these statements by forward-looking wordssuch as “may,” “might,” “will,” “should,” “expects,” “plans,” “anticipates,” “believes,” “estimates,” “predicts,”“potential,” or “continue,” the negative of these terms and other comparable terminology. These forward-lookingstatements, which are subject to risks, uncertainties and assumptions about us, may include projections of ourfuture financial performance, our anticipated growth strategies and anticipated trends in our business. Thesestatements are only predictions based on our current expectations and projections about future events. There areimportant factors that could cause our actual results, level of activity, performance or achievements to differmaterially from the results, level of activity, performance or achievements expressed or implied by the forward-looking statements, including those factors described under the caption entitled Risk Factors. You shouldspecifically consider the numerous risks outlined under Risk Factors.
Although we believe the expectations reflected in the forward-looking statements are reasonable, we cannotguarantee future results, level of activity, performance or achievements. Moreover, neither we nor any otherperson assumes responsibility for the accuracy and completeness of any of these forward-looking statements. Weare under no duty to update any of these forward-looking statements after the date of this annual report on Form10-K/A (Amendment No. 1) to conform our prior statements to actual results or revised expectations.
1

PART I
ITEM 1. BUSINESS
General
PartnerRe Ltd. (the Company, PartnerRe or we), incorporated in Bermuda in August 1993, is the ultimateholding company for our international reinsurance group. The Company provides reinsurance on a worldwidebasis through its wholly owned subsidiaries, including Partner Reinsurance Company Ltd. (PartnerRe Bermuda),Partner Reinsurance Europe plc (PartnerRe Europe) and Partner Reinsurance Company of the U.S. (PartnerReU.S.). Risks reinsured include, but are not limited to, property, casualty, motor, agriculture, aviation/space,catastrophe, credit/surety, engineering, energy, marine, specialty property, specialty casualty, multiline and otherlines and mortality, longevity and health. The Company also offers alternative risk products that include weatherand credit protection to financial, industrial and service companies on a worldwide basis.
In 1997, recognizing the limits of a continued monoline strategy, the Company shifted its strategic focus tobecome a leading multiline reinsurer. In July 1997, the Company completed the acquisition of SAFR(subsequently renamed PartnerRe SA), a well-established global professional reinsurer based in Paris. InDecember 1998, the Company completed the acquisition of the reinsurance operations of Winterthur Re, furtherenhancing the Company’s expansion strategy.
In December 2009, the Company completed the acquisition of PARIS RE Holdings Limited (Paris Re), aFrench-listed, Swiss-based holding company and its operating subsidiaries. The Consolidated Statements ofOperations and Cash Flows include the results of Paris Re for the period from October 2, 2009, the date ofacquisition of the controlling interest (Acquisition Date). This acquisition provided the Company with enhancedstrategic and financial flexibility in a less predictable and more limited growth environment.
Business Strategy
The Company assumes and manages global re/insurance and capital markets risks. Its strategy is founded ona capital-based risk appetite and the selected risks that Management believes will allow the Company to meet itsgoals for appropriate profitability and risk management within that appetite. Management believes that thisconstruct allows the Company to balance cedants’ need for absolute certainty of claims payment with itsshareholders’ need for an appropriate return on their capital. Operating return on beginning diluted book valueper common share and common share equivalents outstanding (Operating ROE) and compound annual growthrate in diluted book value per common share and common share equivalents outstanding (Diluted Book Valueper Share) are two of the key metrics used by Management to measure the Company’s results. Consequently, theCompany has set a goal of an average 13% Operating ROE over a reinsurance cycle and a compound annualgrowth rate of 10% in Diluted Book Value per Share after the payment of dividends over a reinsurance cycle. SeeKey Financial Measures in Item 7 of Part II of this report for a detailed discussion of the key measures, used bythe Company to evaluate its financial performance, including definitions and basis of calculation.
The Company has adopted the following five-point strategy:
We are diversified across products and insurance markets: PartnerRe writes most lines of reinsurancebusiness in approximately 150 countries worldwide and is open to assuming reinsurance-like risks to furtherdiversify its portfolio. Management believes diversification is a competitive advantage, which increases returnper unit of risk, provides access to risk worldwide and reduces the overall volatility of results. Diversification isalso the cornerstone of the Company’s risk management approach. The reinsurance business is cyclical, butreinsurance cycles by line of business and by geography are rarely synchronized.
We have an appetite for risk provided it helps us deliver superior risk-adjusted returns: PartnerRe is in thebusiness of assuming risk for appropriate return. The Company’s products address accumulation risks, complexcoverage issues and large exposures faced by clients. The Company’s book of business is focused on severitylines of business such as casualty, catastrophe, specialized property and aviation. The Company is willing to
2

assume such above average risk, but only if the pricing implies significantly above average risk-adjusted returns.The Company’s diversification enables it to assume risks that are individually large for our clients, but are moreeasily diversified within PartnerRe’s portfolio. The Company also writes frequency lines of business such asproperty, motor and life, which have historically provided modestly lower levels of returns with less volatility.
We manage our capital to optimize long-term returns while maintaining an appropriate risk profile:PartnerRe’s business is cyclical and the Company responds to that reality. The Company seeks to manage itscapital to optimize shareholder returns over the reinsurance cycle, but it will not unbalance the portfolio bywriting only the business that offers the highest return at any point in time. In order to manage capitalappropriately across a portfolio and over a reinsurance cycle, the Company believes two things are critical: anappropriate and common measure of risk-adjusted performance and the ability and willingness to redeploycapital for its most efficient and effective use, either within the business or by returning capital to shareholders.To achieve effective and efficient capital allocation, the Company focuses on Operating ROE, supported bystrong actuarial and financial analysis.
We create value through superior risk evaluation and intelligent portfolio and relationship management:The Company’s technical underwriting, actuarial and portfolio management skills enable the Company to createvalue by evaluating, valuing and underwriting risk. The company focuses on overall portfolio profitability. Theaim is not to select a few highly profitable transactions in any year, but to build sustainable portfolios that candeliver superior returns over several years.
We enhance overall returns through our invested assets in the context of a risk framework appropriate for areinsurance organization: Strong underwriting must be complemented with prudent financial management,careful reserving and superior asset management in order to achieve the Company’s targeted returns. Whenselecting asset strategies, the Company’s priority is to support the reinsurance operations. The Company iswilling to take some additional risk on its assets if it helps us generate extra return, but this risk-taking will neverput at risk its reinsurance operation. The Company’s principal business is the assumption of insurance risk. Wewill not use insurance or reinsurance as a means of raising funds to pursue other goals.
Reinsurance Operations
General
The Company provides reinsurance for its clients in approximately 150 countries around the world. Throughits branches and subsidiaries, the Company provides reinsurance of non-life and life risks to ceding companies(primary insurers, cedants or reinsureds) on either a proportional or non-proportional basis through treaties orfacultative reinsurance. The Company’s offices are located in Beijing, Hamilton (Bermuda), Dublin, Greenwich(Connecticut), Hong Kong, Labuan, Mexico City, Miami, Montreal, New York, Paris, Santiago, Sao Paulo,Seoul, Singapore, Tokyo, Toronto, Washington, D.C., Zug and Zurich.
In a proportional (or quota share) treaty reinsurance agreement, the reinsurer assumes a proportional shareof the original premiums and losses incurred by the cedant. The reinsurer pays the ceding company acommission, which is generally based on the ceding company’s cost of acquiring the business being reinsured(including commissions, premium taxes, assessments and miscellaneous administrative expenses) and may alsoinclude a profit.
In a non-proportional (or excess of loss) treaty reinsurance agreement the reinsurer indemnifies thereinsured against all or a specified portion of losses on underlying insurance policies in excess of a specifiedamount, which is called a retention or attachment point. Non-proportional business is written in layers and areinsurer or group of reinsurers accepts a band of coverage up to a specified amount. The total coveragepurchased by the cedant is referred to as a program and is typically placed with predetermined reinsurers inpre-negotiated layers. Any liability exceeding the upper limit of the program reverts to the ceding company.
3

In a facultative (proportional or non-proportional) reinsurance agreement the reinsurer assumes individualrisks. The reinsurer separately rates and underwrites each risk rather than assuming all or a portion of a class ofrisks as in the case of treaty reinsurance.
The Company monitors the performance of its operations in three segments, Non-life, Life and Corporate &Other. Segments and the sub-segments of the Company’s Non-life segment represent markets that are reasonablyhomogeneous in terms of geography, client types, buying patterns, underlying risk patterns and approach to riskmanagement. The composition of the Non-life and Life segments is described in more detail below. Corporateand Other is comprised of the capital markets and investment related activities of the Company, includingprincipal finance transactions, insurance-linked securities and strategic investments, and its corporate activities,including other operating expenses.
The following table summarizes the Company’s gross premiums written by segment for the years endedDecember 31, 2011, 2010 and 2009 (in millions of U.S. dollars):
2011 2010 2009
Non-life segment . . . . . . . . . . . . . . . . . . . . . . . . . . . . . . . . . . . . . . . . . . . . . . . . . . . . . . $3,831 $4,132 $3,398Life segment . . . . . . . . . . . . . . . . . . . . . . . . . . . . . . . . . . . . . . . . . . . . . . . . . . . . . . . . . . 790 749 595Corporate and Other segment . . . . . . . . . . . . . . . . . . . . . . . . . . . . . . . . . . . . . . . . . . . . . 12 4 8
Total . . . . . . . . . . . . . . . . . . . . . . . . . . . . . . . . . . . . . . . . . . . . . . . . . . . . . . . . . . . . . . . . $4,633 $4,885 $4,001
The Company’s Non-life and Life business is geographically diversified with premiums being written on aworld-wide basis. See Note 22 to Consolidated Financial Statements in Item 8 of Part II of this report foradditional disclosure of the geographic distribution of gross premiums written and financial information aboutsegments and sub-segments.
Non-life Segment
The Non-life segment is divided into four sub-segments, North America, Global (Non-U.S.) Property andCasualty (Global (Non-U.S.) P&C), Global (Non-U.S.) Specialty and Catastrophe. The North Americasub-segment includes agriculture, casualty, motor, multiline, property, surety and other risks generallyoriginating in the United States. The Global (Non-U.S.) P&C sub-segment includes casualty, motor and propertybusiness generally originating outside of the United States. The Global (Non-U.S.) Specialty sub-segment iscomprised of business that is generally considered to be specialized due to the sophisticated technicalunderwriting required to analyze risks, and is global in nature. This sub-segment consists of several lines ofbusiness for which the Company believes it has developed specialized knowledge and underwriting capabilities.These lines of business include agriculture, aviation/space, credit/surety, energy, engineering, marine, specialtycasualty, specialty property and other lines. The Catastrophe sub-segment is comprised of the Company’scatastrophe line of business.
The following table summarizes the gross premiums written in each of the Company’s Non-lifesub-segments for the years ended December 31, 2011, 2010 and 2009 (in millions of U.S. dollars and as apercentage of the total gross premiums written in the Company’s Non-life segment):
Non-life sub-segment 2011 2010 2009
North America . . . . . . . . . . . . . . . . . . . . . . . . . . . . . . . . . . . . . . $1,104 29% $1,028 25% $1,162 34%Global (Non-U.S.) P&C . . . . . . . . . . . . . . . . . . . . . . . . . . . . . . . 682 18 909 22 677 20Global (Non-U.S.) Specialty . . . . . . . . . . . . . . . . . . . . . . . . . . . 1,446 38 1,479 36 1,159 34Catastrophe . . . . . . . . . . . . . . . . . . . . . . . . . . . . . . . . . . . . . . . . . 599 15 716 17 400 12
Total . . . . . . . . . . . . . . . . . . . . . . . . . . . . . . . . . . . . . . . . . . . . . . $3,831 100% $4,132 100% $3,398 100%
The gross premiums written in each Non-life sub-segment for the years ended December 31, 2011, 2010 and2009, and the year over year comparisons, are described in Results by Segment in Item 7 of Part II of this report.
4

Lines of Business
The following table summarizes the gross premiums written by line of business in the Company’s Non-lifesegment for the years ended December 31, 2011, 2010 and 2009 (in millions of U.S. dollars and as a percentageof the total gross premiums written in the Company’s Non-life segment):
Line of business 2011 2010 2009
Property and casualtyCasualty . . . . . . . . . . . . . . . . . . . . . . . . . . . . . . . . . . . . . . . $ 510 13% $ 519 13% $ 506 15%Property . . . . . . . . . . . . . . . . . . . . . . . . . . . . . . . . . . . . . . . 676 18 862 21 714 21Motor . . . . . . . . . . . . . . . . . . . . . . . . . . . . . . . . . . . . . . . . . 229 6 311 7 249 7Multiline and other . . . . . . . . . . . . . . . . . . . . . . . . . . . . . . . 71 2 73 2 72 2
SpecialtyAgriculture . . . . . . . . . . . . . . . . . . . . . . . . . . . . . . . . . . . . . 292 8 180 4 305 9Aviation/Space . . . . . . . . . . . . . . . . . . . . . . . . . . . . . . . . . . 235 6 241 6 198 6Catastrophe . . . . . . . . . . . . . . . . . . . . . . . . . . . . . . . . . . . . . 599 15 716 17 400 12Credit/Surety . . . . . . . . . . . . . . . . . . . . . . . . . . . . . . . . . . . 326 8 292 7 234 7Energy . . . . . . . . . . . . . . . . . . . . . . . . . . . . . . . . . . . . . . . . 115 3 113 3 107 3Engineering . . . . . . . . . . . . . . . . . . . . . . . . . . . . . . . . . . . . 189 5 192 5 212 6Marine . . . . . . . . . . . . . . . . . . . . . . . . . . . . . . . . . . . . . . . . 334 9 330 8 200 6Specialty casualty . . . . . . . . . . . . . . . . . . . . . . . . . . . . . . . . 108 3 172 4 129 4Specialty property . . . . . . . . . . . . . . . . . . . . . . . . . . . . . . . 147 4 131 3 72 2
Total Non-life segment . . . . . . . . . . . . . . . . . . . . . . . . . . . . . . . . $3,831 100% $4,132 100% $3,398 100%
The following discussion summarizes the business written in each line of business in the Company’sNon-life segment.
Agriculture—The Company reinsures, primarily on a proportional basis, agricultural yield andprice/revenue risks related to flood, drought, hail and disease related to crops, livestock and aquaculture.
Aviation/Space—The Company provides specialized reinsurance protection for airline, general aviation andspace insurance business primarily on a proportional basis and through facultative arrangements. Its spacebusiness relates to coverages for satellite assembly, launch and operation for commercial space programs.
Casualty—The Company’s casualty business includes third party liability, employers’ liability, workers’compensation and personal accident coverages written on both a proportional and non-proportional basis,including structured reinsurance of casualty risks.
Catastrophe—The Company provides property catastrophe reinsurance protection, written primarily on anon-proportional basis, against the accumulation of losses caused by windstorm, earthquake, tornado, tropicalcyclone, flood or by any other natural hazard that is covered under a comprehensive property policy. Through theuse of underwriting tools based on proprietary computer models developed by its research team, the Companycombines natural science with highly professional underwriting skills in order to offer capacity at a pricecommensurate with the risk.
Credit/Surety—Credit reinsurance, written primarily on a proportional basis, provides coverage tocommercial credit insurers, and the surety line relates primarily to bonds and other forms of security written byspecialized surety insurers.
Energy (Energy Onshore)—The Company provides reinsurance coverage for the onshore oil and gasindustry, mining, power generation and pharmaceutical operations primarily on a proportional basis and throughfacultative arrangements.
5

Engineering—The Company provides reinsurance for engineering projects throughout the world,predominantly on a proportional treaty basis and through facultative arrangements.
Marine (Marine/Energy Offshore)—The Company provides reinsurance protection and technical servicesrelating to marine hull, cargo, transit and offshore oil and gas operations on a proportional or non-proportionalbasis.
Motor—The Company’s motor business includes reinsurance coverages for third party liability and propertydamage risks arising from both passenger and commercial fleet automobile coverages written by cedants. Thisbusiness is written predominantly on a proportional basis.
Multiline—The Company’s multiline business provides both property and casualty reinsurance coverageswritten on both a proportional and non-proportional basis.
Property—Property business provides reinsurance coverage to insurers for property damage or businessinterruption losses resulting from fires, catastrophes and other perils covered in industrial and commercialproperty and homeowners’ policies and is written on both a proportional and non-proportional basis. TheCompany’s most significant exposure is typically to losses from windstorm, tornado and earthquake, althoughthe Company is exposed to losses from sources as diverse as freezes, riots, floods, industrial explosions, fires,hail and a number of other loss events. The Company’s predominant exposure under these property coverages isto property damage. However, other risks, including business interruption and other non-property losses may alsobe covered under a property reinsurance contract when arising from a covered peril. In accordance with marketpractice, the Company’s property reinsurance treaties generally exclude certain risks such as war, nuclear,biological and chemical contamination, radiation and environmental pollution.
Specialty Casualty—The Company provides specialized reinsurance protection for non-U.S. casualtybusiness that requires specialized underwriting expertise due to the nature of the underlying risk or thecomplexity of the reinsurance treaty. This reinsurance protection is offered on a proportional, non-proportional orfacultative basis.
Specialty Property—The Company provides specialized reinsurance protection for non-U.S. propertybusiness that requires specialized underwriting expertise due to the nature of the underlying risk or thecomplexity of the reinsurance treaty. This reinsurance protection is offered on a proportional, non-proportional orfacultative basis.
Distribution
The Company’s Non-life business is produced both through brokers and through direct relationships withinsurance companies. In North America, business is primarily written through brokers, while in the rest of theworld, the business is written on both a direct and broker basis.
For the year ended December 31, 2011, the Company had two brokers that individually accounted for 10%or more of its total Non-life gross premiums written. The Aon Group (including the Benfield Group) accountedfor approximately 28% of total Non-life gross premiums written, while Marsh (including Guy Carpenter)accounted for approximately 25% of total Non-life gross premiums written. The following table summarizes thecombined percentage of gross premiums written through these two brokers by Non-life sub-segment for the yearended December 31, 2011:
Non-life sub-segment 2011
North America . . . . . . . . . . . . . . . . . . . . . . . . . . . . . . . . . . . . . . . . 64%Global (Non-U.S.) P&C . . . . . . . . . . . . . . . . . . . . . . . . . . . . . . . . . 29Global (Non-U.S.) Specialty . . . . . . . . . . . . . . . . . . . . . . . . . . . . . 43Catastrophe . . . . . . . . . . . . . . . . . . . . . . . . . . . . . . . . . . . . . . . . . . . 81
6

Competition
The Company competes with other reinsurers, some of which have greater financial, marketing andmanagement resources than the Company, and it also competes with new market entrants. Competition in the typesof reinsurance that the Company underwrites is based on many factors, including the perceived financial strength ofthe reinsurer, pricing and other terms and conditions, services provided, ratings assigned by independent ratingagencies, speed of claims payment and reputation and experience in the lines of reinsurance to be written.
The Company’s competitors include independent reinsurance companies, subsidiaries or affiliates ofestablished worldwide insurance companies, and reinsurance departments of certain primary insurancecompanies. Management believes that the Company’s major competitors are the larger European, U.S. andBermuda-based international reinsurance companies, as well as specialty reinsurers and regional companies incertain local markets. These competitors include, but are not limited to, Munich Re, Swiss Re, Everest Re,Hannover Re, SCOR, Transatlantic and reinsurance operations of certain primary insurance companies, such asArch Capital, Axis Capital and XL Group.
Management believes the Company ranks among the world’s largest professional reinsurers and is wellpositioned in terms of client services and underwriting expertise. Furthermore, the Company’s capitalization andstrong financial ratios allow the Company to offer security to its clients.
Life Segment
Lines of Business
The Company’s Life segment includes the mortality, longevity and health lines of business written primarilyin the United Kingdom (U.K.), Ireland and France. The Company does not write any new life business in theU.S. The following table summarizes the gross premiums written by line of business in the Company’s Lifesegment for the years ended December 31, 2011, 2010 and 2009 (in millions of U.S. dollars as a percentage ofthe total gross premiums written in the Company’s Life segment):
Line of business 2011 2010 2009
Mortality . . . . . . . . . . . . . . . . . . . . . . . . . . . . . . . . . . . . . . . . . . . . . . . $566 72% $524 70% $480 80%Longevity . . . . . . . . . . . . . . . . . . . . . . . . . . . . . . . . . . . . . . . . . . . . . . 203 25 205 27 93 16Health . . . . . . . . . . . . . . . . . . . . . . . . . . . . . . . . . . . . . . . . . . . . . . . . . 21 3 20 3 22 4
Total Life segment . . . . . . . . . . . . . . . . . . . . . . . . . . . . . . . . . . . . . . . $790 100% $749 100% $595 100%
The gross premiums written in the Life segment for the years ended December 31, 2011, 2010 and 2009,and the year over year comparisons, are described in Results by Segment in Item 7 of Part II of this report.
The following discussion summarizes the business written in the Company’s Life segment by line ofbusiness.
Mortality—The Company provides reinsurance coverage to primary life insurers and pension funds toprotect against individual and group mortality and disability risks. Mortality business is written primarily on aproportional basis through treaty agreements. Mortality business is subdivided into death and disability covers(with various riders) primarily written in Continental Europe, term assurance and critical illness (TCI) primarilywritten in the U.K. and Ireland, and guaranteed minimum death benefit (GMDB) primarily written in ContinentalEurope. The Company also writes certain treaties on a non-proportional basis, primarily in France.
Longevity—The Company provides reinsurance coverage to employer sponsored pension schemes andprimary life insurers who issue annuity contracts offering long-term retirement benefits to consumers, who seekprotection against outliving their financial resources. Longevity business is written on a long term, proportionalbasis primarily in the U.K. The Company’s longevity portfolio is subdivided into standard and non-standard
7

annuities. The non-standard annuities are annuities sold to consumers with aggravated health conditions and areusually medically underwritten on an individual basis. The main risk the Company is exposed to by writinglongevity business is an increase in the future life span of the insured compared to the expected life span.
Health—The Company provides reinsurance coverage to primary life insurers with respect to individual andgroup health risks.
Other than gross premiums written, Management uses the following metrics to measure the growth of theCompany’s mortality and longevity business.
For the mortality book of business, Management uses reinsurance business in force as a growth measure.Reinsurance business in force reflects the addition or acquisition of new mortality business, offset byterminations (e.g., voluntary surrenders of underlying life insurance policies, lapses of underlying policies, deathsof insureds, and the exercises of recapture option by cedants), changes in foreign exchange, and any otherchanges in the amount of insurance in force. The term “in force” refers to the aggregate insurance policy faceamounts, or net amounts at risk. The net assumed business in force for the mortality line of business, includinghealth, was $198 billion, $191 billion and $203 billion at December 31, 2011, 2010 and 2009, respectively. Theincrease in business in force to $198 billion at December 31, 2011 from $191 billion at December 31, 2010 wasprimarily driven by TCI business written in the U.K. The decrease in business in force from $203 billion atDecember 31, 2009 to $191 billion at December 31, 2010 was primarily due to the weakening of the euro againstthe U.S. dollar and a decrease in the sum at risk related to term assurance business.
For the longevity book of business, Management uses net present value of expected future benefits as agrowth measure. The net present value of expected future annuity payments related to the Company’s longevitybusiness (assuming a 4% discount rate) was $3,595 million, $2,932 million and $832 million at December 31,2011, 2010 and 2009, respectively. The increase in net present value of expected future annuity payments from$832 million at December 31, 2009 to $2,932 million at December 31, 2010 and to $3,595 million atDecember 31, 2011 was primarily due to new standard annuity business written.
Distribution
The Company’s Life business is produced both through brokers and through direct relationships withinsurance companies. For the year ended December 31, 2011, one cedant accounted for 13% of the Lifesegment’s total gross premiums written and one broker, the Aon Group (including the Benfield Group),accounted for 16% of the Life segment’s total gross premiums written. No other cedant or broker contributedmore than 10% of the Life segment’s total gross premiums written.
Competition
The Company’s competition differs by location but generally includes multi-national reinsurers and localreinsurers or state-owned insurers in the U.K., Ireland and Continental Europe.
Reserves
General
Loss reserves represent estimates of amounts an insurer or reinsurer ultimately expects to pay in the futureon claims incurred at a given time, based on facts and circumstances known at the time that the loss reserves areestablished. It is possible that the total future payments may exceed, or be less than, such estimates. Theestimates are not precise in that, among other things, they are based on predictions of future developments andestimates of future trends in claim severity, frequency and other variable factors such as inflation. During the losssettlement period, it often becomes necessary to refine and adjust the estimates of liability on a claim eitherupward or downward. Despite such adjustments, the ultimate future liability may exceed or be less than therevised estimates.
8

As part of the reserving process, insurers and reinsurers review historical data and anticipate the impact ofvarious factors such as legislative enactments and judicial decisions that may affect potential losses from casualtyclaims, changes in social and political attitudes that may increase exposure to losses, mortality and morbiditytrends and trends in general economic conditions. This process assumes that past experience, adjusted for theeffects of current developments, is an appropriate basis for anticipating future events.
See Critical Accounting Policies and Estimates in Item 7 of Part II of this report for a discussion of theCompany’s reserving process.
Non-life Reserves
At December 31, 2011 and 2010, the Company recorded gross Non-life reserves for unpaid losses and lossexpenses of $11,273 million and $10,667 million, respectively, and net Non-life reserves for unpaid losses andloss expenses of $10,920 million and $10,318 million, respectively.
The following table provides a reconciliation of the net Non-life reserves for unpaid losses and lossexpenses for the years ended December 31, 2011, 2010 and 2009 (in millions of U.S. dollars):
2011 2010 2009
Net liability at beginning of year . . . . . . . . . . . . . . . . . . . . $10,318 $10,475 $ 7,385Net liability acquired related to Paris Re . . . . . . . . . . . . . . — — 3,176Net incurred losses related to:
Current year . . . . . . . . . . . . . . . . . . . . . . . . . . . . . . . . 4,252 3,138 2,341Prior years . . . . . . . . . . . . . . . . . . . . . . . . . . . . . . . . . (530) (478) (486)
3,722 2,660 1,855Change in Paris Re Reserve Agreement . . . . . . . . . . . . . . (61) (67) (32)Net paid losses . . . . . . . . . . . . . . . . . . . . . . . . . . . . . . . . . . (2,991) (2,579) (2,044)Effects of foreign exchange rate changes . . . . . . . . . . . . . . (68) (171) 135
Net liability at end of year . . . . . . . . . . . . . . . . . . . . . . . . . $10,920 $10,318 $10,475
The increase in net Non-life reserves for unpaid losses and loss expenses from $10,318 million atDecember 31, 2010 to $10,920 million at December 31, 2011 primarily reflects an increase in current year netincurred losses, which is partially offset by an increase in net paid losses. Both the increase in the current year netincurred losses and net paid losses during the year ended December 31, 2011 related to the impact of thecatastrophic events during 2011.
The following table summarizes the net incurred losses for the year ended December 31, 2011 relating to thecurrent and prior accident years by sub-segment for the Company’s Non-life operations (in millions of U.S.dollars):
North America
Global(Non-U.S.)
P&C
Global(Non-U.S.)Specialty Catastrophe
TotalNon-life
segment (1)
Net incurred losses related to:Current year . . . . . . . . . . . . . . . . . . . . . . . . . . $ 930 $ 683 $1,079 $1,555 $4,247Net prior years favorable reserve
development . . . . . . . . . . . . . . . . . . . . . . . . (189) (116) (129) (96) (530)
Total net incurred losses . . . . . . . . . . . . . . . . . . . . . $ 741 $ 567 $ 950 $1,459 $3,717
(1) In addition to the current year net incurred losses in the Non-life segment of $4,247 million were currentyear net incurred losses related to the Corporate and Other segment, resulting in total net incurred losses of$3,722 million.
9

The net favorable development on prior accident years of $530 million for the year ended December 31,2011 primarily resulted from favorable loss emergence, as losses reported by cedants were lower than expected.The most significant drivers of the Non-life net favorable prior year reserve development during the year endedDecember 31, 2011 were the casualty line of business in the Company’s North America sub-segment and theCatastrophe sub-segment. See Management’s Discussion and Analysis of Financial Condition and Results ofOperations for a more detailed discussion of net prior year reserve development by sub-segment and CriticalAccounting Policies and Estimates—Losses and Loss Expenses and Life Policy Benefits in Item 7 of Part II ofthis report for a discussion of the net prior year reserve development by reserving lines for the Company’sNon-life operations.
Reserve Agreement
On December 21, 2006, Colisée Re (formerly known as AXA RE), a subsidiary of AXA SA (AXA)transferred substantially all of its assets and liabilities, other than specified reinsurance and retrocessionagreements and certain other excluded assets and liabilities, to PARIS RE Holdings SA’s French operatingsubsidiary Paris Re France (AXA Transfer)(Paris Re France). The AXA Transfer was immediately followed bythe acquisition by Paris Re of all the outstanding capital stock of Paris Re France (AXA Acquisition). Inconnection with the AXA Acquisition, AXA, Colisée Re and Paris Re entered into various agreements (2006Acquisition Agreements).
On the closing of the AXA Acquisition, AXA, Colisée Re and Paris Re France entered into a reserveagreement (Reserve Agreement). The Reserve Agreement provides that AXA and Colisée Re shall guaranteereserves in respect of Paris Re France and subsidiaries acquired in the AXA Acquisition. The Reserve Agreementcovers losses incurred prior to December 31, 2005, including any adverse development in respect thereof, by thesubsidiaries of Colisée Re transferred to Paris Re France as part of the 2006 Acquisition Agreements, in respectof reinsurance policies issued or renewed, and in respect of which premiums were earned, on or prior toDecember 31, 2005 (but excluding any amendments thereto effected after the closing of the 2006 AcquisitionAgreements).
Pursuant to the Reserve Agreement, AXA has agreed to cause AXA Liabilities Managers, an affiliate ofColisée Re (AXA LM), to provide Paris Re France with periodic reports setting forth the amount of lossesincurred in respect of the business guaranteed by AXA. The reserve guarantee provided by AXA and Colisée Reis conditioned upon, among other things, the guaranteed business, including all related ceded reinsurance, beingmanaged by AXA LM. The Reserve Agreement further contemplates that Colisée Re or Paris Re France, as thecase may be, shall pay to the other party amounts equal to any deficiency or surplus in the transferred reserveswith respect to losses incurred, such losses being net of any recovery by Colisée Re including throughretrocessional protection, salvage or subrogation.
The rights and obligations of AXA LM with respect to the management of this business are set forth in a runoff services and management agreement among AXA LM, Colisée Re and Paris Re France (Run Off Servicesand Management Agreement). Under the Run Off Services and Management Agreement, Paris Re has agreedthat AXA LM will manage claims arising from all reinsurance and retrocession contracts subject to the ReserveAgreement, either directly or, for contracts that were issued by certain Colisée Re entities identified in theagreement, by delegation to certain other specified entities, including Paris Re France. This includes contractadministration, the administration of ceded reinsurance, claims handling, settlements and business commutations.Although Paris Re France has certain consultation rights in connection with the management of the run-off of thecontracts subject to the Reserve Agreement, AXA LM does not need to obtain Paris Re France’s prior consent inconnection with claims handling and settlements, and no consent is required for business commutations if theamount of case reserves related to commuted contracts does not exceed €100 million in any twelve month period.
On October 1, 2010, PartnerRe Europe and Paris Re France effected a cross border merger whereby all theassets and liabilities of Paris Re France were transferred to PartnerRe Europe, including the agreements betweenParis Re France and Colisée Re.
10

Changes in Non-life Reserves
The below table shows the gross, retroceded and net reserves for unpaid losses and loss expenses for theCompany’s Non-life business, and the portion of the gross, retroceded and net reserves that relates to the reservessubject to the Reserve Agreement (Guaranteed Reserves), as of December 31, 2011 and 2010 (in thousands ofU.S. dollars):
2011 2010
Gross reserves . . . . . . . . . . . . . . . . . . . . . . . . . . . . . . . . . . . . . . . . . . . . . $11,273,091 $10,666,604Less: Guaranteed Reserves . . . . . . . . . . . . . . . . . . . . . . . . . . . . . . . . . . . 1,038,800 1,287,576
Gross reserves, excluding Guaranteed Reserves . . . . . . . . . . . . . . . . . . . 10,234,291 9,379,028Retroceded reserves . . . . . . . . . . . . . . . . . . . . . . . . . . . . . . . . . . . . . . . . . 353,105 348,747Less: Guaranteed Reserves . . . . . . . . . . . . . . . . . . . . . . . . . . . . . . . . . . . 27,264 48,099
Retroceded reserves, excluding Guaranteed Reserves . . . . . . . . . . . . . . 325,841 300,648Net reserves . . . . . . . . . . . . . . . . . . . . . . . . . . . . . . . . . . . . . . . . . . . . . . . $10,919,986 $10,317,857Net reserves, excluding Guaranteed Reserves . . . . . . . . . . . . . . . . . . . . $ 9,908,450 $ 9,078,380
The below table is a reconciliation of the net paid losses related to prior years and the net paid losses relatedto prior years, excluding the paid losses for the Guaranteed Reserves, for the years ended December 31, 2011 and2010 (in thousands of U.S. dollars):
2011 2010
Net paid losses related to prior years . . . . . . . . . . . . . . . . . . . . . . . . . . . . . $2,060,152 $2,267,765Less: net paid losses on Guaranteed Reserves . . . . . . . . . . . . . . . . . . . . . . 136,885 173,386
Net paid losses related to prior years, excluding Guaranteed Reserves . . . $1,923,267 $2,094,379
The Guaranteed Reserves have been excluded from the following tables that analyze the development of theCompany’s net reserves for unpaid losses and loss expenses for the Company’s Non-life business given theReserve Agreement covers any adverse or favorable development related to the reserves acquired by Paris Re inthe AXA Acquisition, and therefore, they have no impact on the development of the Company’s gross and netreserves for unpaid losses and loss expenses.
The following table shows the development of net reserves for unpaid losses and loss expenses for theCompany’s Non-life business, excluding Guaranteed Reserves. The table begins by showing the initial reportedyear-end gross and net reserves, including incurred but not reported (IBNR) reserves, recorded at the balancesheet date for each of the ten years presented.
The next section of the table shows the re-estimated amount of the initial reported net reserves, excludingGuaranteed Reserves, for up to ten subsequent years, based on experience at the end of each subsequent year.The re-estimated net liabilities reflect additional information, received from cedants or obtained through reviewsof industry trends, regarding claims incurred prior to the end of the preceding financial year. A redundancy (ordeficiency) arises when the re-estimation of reserves is less (or greater) than its estimation at the preceding year-end. The cumulative redundancies (or deficiencies) reflect cumulative differences between the initial reported netreserves and the currently re-estimated net reserves. Annual changes in the estimates are reflected in the incomestatement for each year as the liabilities are re-estimated. Reserves denominated in foreign currencies arerevalued at each year-end’s foreign exchange rates.
The lower section of the table shows the portion of the initial year-end net reserves, excluding GuaranteedReserves, that were paid (claims paid) as of the end of subsequent years. This section of the table provides anindication of the portion of the re-estimated net liability that is settled and is unlikely to develop in the future.Claims paid are converted to U.S. dollars at the average foreign exchange rates during the year of payment andare not revalued at the current year foreign exchange rates. Because claims paid in prior years are not revalued atthe current year’s foreign exchange rates, the difference between the cumulative claims paid at the end of anygiven year and the immediately previous year represents the claims paid during the year.
11

Dev
elop
men
tof
Los
san
dL
oss
Exp
ense
Res
erve
s(E
xclu
ding
Gua
rant
eed
Res
erve
ssu
bjec
tto
the
Res
erve
Agr
eem
ent)
(in
thou
sand
sof
U.S
.dol
lars
)
2001
2002
2003
2004
2005
2006
2007
2008
2009
(1)
2010
2011
Gro
sslia
bilit
yfo
run
paid
loss
esan
dlo
ssex
pens
es,e
xclu
ding
Gua
rant
eed
Res
erve
s..
....
...
$3,0
05,6
28$3
,658
,416
$4,7
55,0
59$5
,766
,629
$6,7
37,6
61$6
,870
,785
$7,2
31,4
36$7
,510
,666
$9,2
48,5
29$9
,379
,028
$10,
234,
291
Ret
roce
ded
liabi
lity
for
unpa
idlo
sses
and
loss
expe
nses
,ex
clud
ing
Gua
rant
eed
Res
erve
s..
....
....
....
....
214,
891
217,
777
175,
685
153,
018
185,
280
138,
585
132,
479
125,
215
270,
938
300,
648
325,
841
Net
liabi
lity
for
unpa
idlo
sses
and
loss
expe
nses
,exc
ludi
ngG
uara
ntee
dR
eser
ves
....
...
$2,7
90,7
37$3
,440
,639
$4,5
79,3
74$5
,613
,611
$6,5
52,3
81$6
,732
,200
$7,0
98,9
57$7
,385
,451
$8,9
77,5
91$9
,078
,380
$9,
908,
450
Net
liabi
lity
re-e
stim
ated
,ex
clud
ing
Gua
rant
eed
Res
erve
sat
:O
neye
arla
ter
....
....
....
3,03
5,30
93,
806,
231
4,68
8,96
45,
006,
767
6,60
2,83
26,
715,
107
6,34
3,71
47,
076,
796
8,35
4,22
18,
505,
130
Tw
oye
ars
late
r..
....
....
.3,
310,
898
3,97
5,92
64,
301,
161
5,04
4,92
26,
618,
112
6,16
5,29
76,
009,
194
6,68
6,92
67,
877,
438
Thr
eeye
ars
late
r..
....
....
3,45
6,25
03,
781,
574
4,37
3,99
25,
092,
289
6,16
8,44
55,
897,
044
5,67
4,50
96,
351,
663
Four
year
sla
ter
....
....
...
3,32
6,52
73,
894,
500
4,49
4,18
24,
845,
644
6,00
2,03
15,
645,
132
5,40
9,46
0Fi
veye
ars
late
r..
....
....
.3,
433,
887
4,01
9,81
34,
315,
702
4,73
1,85
65,
802,
799
5,43
6,35
3Si
xye
ars
late
r..
....
....
..3,
528,
665
3,91
8,38
04,
264,
865
4,59
5,23
25,
627,
952
Seve
nye
ars
late
r..
....
....
3,44
5,84
43,
894,
155
4,17
1,10
84,
467,
678
Eig
htye
ars
late
r..
....
....
3,44
6,68
33,
822,
959
4,09
1,31
5N
ine
year
sla
ter
....
....
...
3,39
4,93
63,
762,
561
Ten
year
sla
ter
....
....
....
3,34
7,05
8C
umul
ativ
ene
t(d
efic
ienc
y)re
dund
ancy
....
....
....
...
$(5
56,3
21)
$(3
21,9
22)
$48
8,05
9$1
,145
,933
$92
4,42
9$1
,295
,847
$1,6
89,4
97$1
,033
,788
$1,1
00,1
53$
573,
250
Cum
ulat
ive
amou
ntof
net
liabi
lity
paid
thro
ugh:
One
year
late
r..
....
....
..$
923,
165
$1,1
26,8
82$1
,120
,756
$1,2
50,5
34$1
,718
,996
$1,4
73,9
64$1
,340
,788
$1,7
16,7
98$2
,094
,379
$1,9
23,2
67T
wo
year
sla
ter
....
....
...
1,39
1,30
11,
713,
953
1,57
3,31
21,
821,
773
2,48
2,69
52,
116,
025
1,97
1,37
62,
448,
950
2,98
3,83
3T
hree
year
sla
ter
....
....
..1,
740,
277
1,99
3,94
71,
948,
203
2,20
7,69
22,
948,
837
2,58
1,02
22,
470,
068
2,99
1,49
7Fo
urye
ars
late
r..
....
....
.1,
924,
833
2,24
8,98
02,
219,
506
2,51
1,44
63,
273,
808
2,93
2,35
62,
818,
018
Five
year
sla
ter
....
....
...
2,08
6,25
22,
433,
223
2,43
9,36
12,
721,
266
3,53
4,00
33,
183,
573
Six
year
sla
ter
....
....
....
2,21
5,41
22,
580,
225
2,58
9,79
82,
898,
779
3,71
3,40
2Se
ven
year
sla
ter
....
....
..2,
314,
918
2,69
4,07
92,
717,
665
3,04
3,15
1E
ight
year
sla
ter
....
....
..2,
397,
806
2,77
9,63
22,
820,
421
Nin
eye
ars
late
r..
....
....
.2,
463,
518
2,86
0,94
0T
enye
ars
late
r..
....
....
..2,
526,
523
(1)
Pari
sR
e’s
liabi
lity
for
unpa
idlo
sses
and
loss
expe
nses
isin
clud
edas
ofD
ecem
ber
31,2
009
for
the
firs
ttim
e.Fo
rye
ars
prio
rto
2009
,thi
sta
ble
excl
udes
the
rese
rves
ofth
ePa
ris
Re
com
pani
esac
quir
ed.A
ccor
ding
ly,t
here
serv
ede
velo
pmen
t(ne
tlia
bilit
yfo
run
paid
loss
esan
dlo
ssex
pens
esat
the
end
ofth
eye
ar,a
sor
igin
ally
estim
ated
,les
sne
tlia
bilit
yfo
run
paid
loss
esan
dlo
ssex
pens
esre
-est
imat
edas
ofsu
bseq
uent
year
s)fo
rye
ars
prio
rto
2009
rela
tes
only
tolo
sses
reco
rded
byPa
rtne
rRe
and
subs
idia
ries
nota
cqui
red
inth
ePa
ris
Re
acqu
isiti
on.
12

The
follo
win
gta
ble
prov
ides
are
conc
iliat
ion
ofth
eC
ompa
ny’s
re-e
stim
ated
gros
sye
ar-e
ndre
serv
esw
ithth
ere
-est
imat
edne
tyea
r-en
dre
serv
esas
ofD
ecem
ber
31,2
011
prov
ided
abov
e(i
nth
ousa
nds
ofU
.S.d
olla
rs):
2001
2002
2003
2004
2005
2006
2007
2008
2009
2010
Rec
onci
liati
onof
gros
sre
serv
es:
Gro
sslia
bilit
yre
-est
imat
ed,e
xclu
ding
Gua
rant
eed
Res
erve
s..
....
....
....
....
....
....
....
.$3
,576
,494
$3,9
72,5
26$4
,230
,780
$4,5
72,5
97$5
,799
,072
$5,5
39,4
85$5
,497
,851
$6,4
60,1
64$8
,107
,304
$8,7
79,4
45R
e-es
timat
edre
troc
eded
liabi
lity,
excl
udin
gG
uara
ntee
dR
eser
ves
....
....
....
....
....
..22
9,43
620
9,96
513
9,46
510
4,91
917
1,12
010
3,13
288
,391
108,
501
229,
866
274,
315
Net
liabi
lity
re-e
stim
ated
,exc
ludi
ngG
uara
ntee
dR
eser
ves
....
....
....
....
....
....
....
...
$3,3
47,0
58$3
,762
,561
$4,0
91,3
15$4
,467
,678
$5,6
27,9
52$5
,436
,353
$5,4
09,4
60$6
,351
,663
$7,8
77,4
38$8
,505
,130
Cum
ulat
ive
gros
s(d
efic
ienc
y)re
dund
ancy
....
$(5
70,8
66)
$(3
14,1
10)
$52
4,27
9$1
,194
,032
$93
8,58
9$1
,331
,300
$1,7
33,5
85$1
,050
,502
$1,1
41,2
25$
599,
583
The
Com
pany
’sre
serv
ede
velo
pmen
tis
com
pose
dof
the
chan
gein
ultim
ate
loss
esfr
omw
hatt
heC
ompa
nyor
igin
ally
estim
ated
asw
ella
sth
eim
pact
ofth
efo
reig
nex
chan
gere
valu
atio
non
rese
rves
.The
Com
pany
cond
ucts
itsre
insu
ranc
eop
erat
ions
ina
vari
ety
ofno
n-U
.S.c
urre
ncie
san
dre
cord
sits
net
rese
rves
inth
ecu
rren
cyof
the
trea
ty,w
ithth
epr
inci
pale
xpos
ures
bein
gth
eeu
ro,C
anad
ian
dolla
r,B
ritis
hpo
und,
New
Zea
land
dolla
r,Ja
pane
seY
enan
dA
ustr
alia
ndo
llar.
The
impa
ctof
repo
rtin
gth
eC
ompa
ny’s
netr
eser
ves
base
don
the
fore
ign
exch
ange
rate
sat
the
bala
nce
shee
tdat
eca
nbe
asi
gnif
ican
tco
mpo
nent
ofth
ecu
mul
ativ
e(d
efic
ienc
y)re
dund
ancy
inne
tres
erve
san
din
som
eye
ars
can
beth
epr
inci
palc
ompo
nent
.The
follo
win
gta
ble
prov
ides
the
amou
ntof
fore
ign
exch
ange
incl
uded
inth
ecu
mul
ativ
ene
t(de
fici
ency
)re
dund
ancy
repo
rted
abov
eas
wel
las
the
net(
defi
cien
cy)
redu
ndan
cyex
clud
ing
the
impa
ctof
fore
ign
exch
ange
mov
emen
tson
netr
eser
ves
(in
thou
sand
sof
U.S
.dol
lars
):
2001
2002
2003
2004
2005
2006
2007
2008
2009
2010
Cum
ulat
ive
net
(def
icie
ncy)
redu
ndan
cy..
....
$(55
6,32
1)$(
321,
922)
$48
8,05
9$1
,145
,933
$92
4,42
9$1
,295
,847
$1,6
89,4
97$1
,033
,788
$1,1
00,1
53$5
73,2
50L
ess:
Cum
ulat
ive
net(
defi
cien
cy)
redu
ndan
cydu
eto
fore
ign
exch
ange
....
....
....
....
....
...
(467
,797
)(4
25,2
75)
(189
,424
)13
6,34
4(3
95,8
35)
(157
,467
)32
8,56
4(5
1,28
8)17
4,91
242
,793
Cum
ulat
ive
net
(def
icie
ncy)
redu
ndan
cyex
clud
ing
the
impa
ctof
fore
ign
exch
ange
....
$(8
8,52
4)$
103,
353
$67
7,48
3$1
,009
,589
$1,3
20,2
64$1
,453
,314
$1,3
60,9
33$1
,085
,076
$92
5,24
1$5
30,4
57
Mov
emen
tsin
fore
ign
exch
ange
rate
sbe
twee
nac
coun
ting
peri
ods
have
typi
cally
resu
lted
insi
gnif
ican
tvar
iatio
nsin
the
loss
rese
rves
ofth
eC
ompa
nyas
the
U.S
.dol
lar,
the
Com
pany
’sre
port
ing
curr
ency
,app
reci
ated
/dep
reci
ated
agai
nstm
ultip
lecu
rren
cies
.The
Com
pany
,how
ever
,gen
eral
lyho
lds
inve
stm
ents
inth
esa
me
curr
enci
esas
itsne
tres
erve
s,or
ente
rsin
tode
riva
tive
fore
ign
exch
ange
cont
ract
s,w
ithth
ein
tent
ofm
atch
ing
the
fore
ign
exch
ange
mov
emen
tson
itsas
sets
and
liabi
litie
s.Se
eQ
uant
itativ
ean
dQ
ualit
ativ
eD
iscl
osur
esab
outM
arke
tRis
kco
ntai
ned
inIt
em7A
ofPa
rtII
ofth
isre
port
for
am
ore
deta
iled
disc
ussi
onof
the
fore
ign
curr
ency
risk
ofth
eC
ompa
ny’s
asse
tsan
dlia
bilit
ies.
13

The
Com
pany
belie
ves
that
inor
der
toen
hanc
eth
eun
ders
tand
ing
ofits
rese
rve
deve
lopm
ent,
itis
usef
ulfo
rin
vest
ors
toev
alua
teth
eC
ompa
ny’s
rese
rve
deve
lopm
ente
xclu
ding
the
impa
ctof
fore
ign
exch
ange
.The
follo
win
gta
ble
show
sth
ede
velo
pmen
tof
initi
alne
tres
erve
sco
nver
ted
atea
chye
ar’s
aver
age
fore
ign
exch
ange
rate
s(i
nth
ousa
nds
ofU
.S.d
olla
rs).
Usi
ngth
ehi
stor
ical
aver
age
fore
ign
exch
ange
rate
sfo
rth
ede
velo
pmen
tlin
esof
the
tabl
eha
sth
eef
fect
oflin
king
each
year
’sde
velo
pmen
twith
that
year
’sin
com
est
atem
ent.
Thi
sta
ble
shou
ldno
tbe
cons
ider
edas
asu
bstit
ute
for
the
tabl
epr
ovid
edab
ove
asit
does
notr
efle
cta
sign
ific
antp
ortio
nof
the
initi
alne
tres
erve
deve
lopm
entt
hati
sdu
eto
fore
ign
exch
ange
reva
luat
ion.
2001
2002
2003
2004
2005
2006
2007
2008
2009
2010
Net
liabi
lity
for
unpa
idlo
sses
and
loss
expe
nses
,exc
ludi
ngG
uara
ntee
dR
eser
ves
...
$2,
790,
737
$3,4
40,6
39$4
,579
,374
$5,6
13,6
11$6
,552
,381
$6,7
32,2
00$7
,098
,957
$7,3
85,4
51$8
,977
,591
$9,0
78,3
80N
etlia
bilit
yre
-est
imat
ed,e
xclu
ding
Gua
rant
eed
Res
erve
sat
:O
neye
arla
ter
....
....
....
....
....
....
.2,
846,
855
3,49
6,10
24,
440,
338
5,38
2,10
16,
300,
633
6,31
8,15
76,
681,
021
6,89
9,64
28,
499,
708
8,54
7,92
3T
wo
year
sla
ter
....
....
....
....
....
....
2,92
1,90
83,
513,
647
4,29
8,49
35,
232,
707
6,02
3,02
56,
014,
782
6,22
2,15
06,
597,
688
8,05
2,35
0T
hree
year
sla
ter
....
....
....
....
....
...
2,95
6,30
83,
483,
720
4,22
3,93
75,
076,
765
5,77
4,64
35,
640,
480
5,96
1,74
86,
300,
375
Four
year
sla
ter
....
....
....
....
....
...
2,96
4,30
73,
491,
033
4,17
8,13
14,
972,
632
5,52
1,03
45,
451,
479
5,73
8,02
4Fi
veye
ars
late
r..
....
....
....
....
....
..2,
982,
347
3,49
8,70
34,
118,
436
4,79
4,44
55,
376,
045
5,27
8,88
6Si
xye
ars
late
r..
....
....
....
....
....
...
2,97
9,42
63,
480,
094
4,01
2,79
24,
704,
184
5,23
2,11
7Se
ven
year
sla
ter
....
....
....
....
....
..2,
963,
708
3,41
8,35
33,
958,
493
4,60
4,02
2E
ight
year
sla
ter
....
....
....
....
....
...
2,93
5,29
93,
379,
382
3,90
1,89
1N
ine
year
sla
ter
....
....
....
....
....
...
2,91
2,86
83,
337,
286
Ten
year
sla
ter
....
....
....
....
....
....
2,87
9,26
1
Cum
ulat
ive
net
(def
icie
ncy)
redu
ndan
cy..
....
$(8
8,52
4)$
103,
353
$67
7,48
3$1
,009
,589
$1,3
20,2
64$1
,453
,314
$1,3
60,9
33$1
,085
,076
$92
5,24
1$
530,
457
Oth
erP
&C
Exp
osur
es
The
Com
pany
’sre
serv
efo
run
paid
loss
esan
dlo
ssex
pens
esas
ofD
ecem
ber
31,2
011
incl
udes
rese
rves
that
are
diff
icul
tto
estim
ate
usin
gtr
aditi
onal
rese
rvin
gm
etho
dolo
gies
.See
Cri
tical
Acc
ount
ing
Polic
ies
and
Est
imat
es—
Los
ses
and
Los
sE
xpen
ses
and
Lif
ePo
licy
Ben
efits
inIt
em7
ofPa
rtII
ofth
isre
port
for
addi
tiona
linf
orm
atio
nan
ddi
scus
sion
ofth
eun
cert
aint
ies
and
com
plex
ities
rela
ted
toth
eJa
pan
eart
hqua
kean
dre
sulti
ngts
unam
i(Ja
pan
Ear
thqu
ake)
and
the
New
Zea
land
eart
hqua
kes
that
occu
rred
inFe
brua
ryan
dJu
ne20
11(F
ebru
ary
and
June
2011
New
Zea
land
Ear
thqu
akes
),th
eot
her
cata
stro
phic
even
tsth
atoc
curr
edin
2011
,and
the
Com
pany
’sex
posu
reto
clai
ms
aris
ing
from
asbe
stos
and
envi
ronm
enta
lexp
osur
es.
The
reca
nbe
noas
sura
nce
that
the
rese
rves
esta
blis
hed
byth
eC
ompa
nyw
illno
tbe
adve
rsel
yaf
fect
edby
deve
lopm
ento
fot
her
late
ntex
posu
res,
and
furt
her,
ther
eca
nbe
noas
sura
nce
that
the
rese
rves
esta
blis
hed
byth
eC
ompa
nyw
illbe
adeq
uate
.How
ever
,the
yre
pres
entM
anag
emen
t’s
best
estim
ate
for
ultim
ate
loss
esba
sed
onav
aila
ble
info
rmat
ion
atth
istim
e.
14

Life ReservesAt December 31, 2011 and 2010, the Company recorded gross policy benefits for life and annuity contracts
of $1,646 million and $1,750 million, respectively, and net policy benefits for life and annuity contracts of$1,636 million and $1,736 million, respectively.
The following table provides a reconciliation of the net policy benefits for life and annuity contracts for theyears ended December 31, 2011, 2010 and 2009 (in millions of U.S. dollars):
2011 2010 2009
Net liability at beginning of year . . . . . . . . . . . . . . . . . . . . . . $1,736 $1,595 $1,408Net incurred losses related to:
Current year . . . . . . . . . . . . . . . . . . . . . . . . . . . . . . . . . . . 651 612 455Prior years . . . . . . . . . . . . . . . . . . . . . . . . . . . . . . . . . . . . (1) 12 (15)
650 624 440Net policy benefits restructured by a cedant . . . . . . . . . . . . . . (131) — —Net paid losses . . . . . . . . . . . . . . . . . . . . . . . . . . . . . . . . . . . . . (588) (420) (323)Effects of foreign exchange rate changes . . . . . . . . . . . . . . . . (31) (63) 70
Net liability at end of year . . . . . . . . . . . . . . . . . . . . . . . . . . . . $1,636 $1,736 $1,595
The decrease in net policy benefits for life and annuity contracts from $1,736 million at December 31, 2010to $1,636 million at December 31, 2011 is primarily due to the restructuring of a longevity treaty from a fundsheld basis to a swap basis during 2011 and net paid losses, which were partially offset by incurred losses.
For the year ended December 31, 2011, the Company experienced net favorable prior year loss developmentrelated to its mortality book of $1 million. The modest net favorable prior year loss development of $1 million in2011 was the net result of favorable prior year loss development of $6 million on certain mortality treaties and $5million related to the GMDB business, which were almost entirely offset by adverse prior year loss developmentrelated to disability riders on certain short-term non-proportional treaties in the mortality line following thereceipt of updated information from cedants. There was no prior year loss development in 2011 related to theCompany’s longevity book.
The following table shows the Company’s gross policy benefits for life and annuity contracts by line ofbusiness and total ceded and net policy benefits for life and annuity contracts at December 31, 2011 and 2010 (inmillions of U.S. dollars):
Reserving lines 2011 2010
Mortality(1) . . . . . . . . . . . . . . . . . . . . . . . . . . . . . . . . . . . . . . . . . $1,123 $1,041Longevity . . . . . . . . . . . . . . . . . . . . . . . . . . . . . . . . . . . . . . . . . 523 709
Total gross policy benefits for life and annuity contracts . . . . 1,646 1,750Ceded policy benefits for life and annuity contracts . . . . . . . . (10) (14)
Total net policy benefits for life and annuity contracts . . . . . . $1,636 $1,736
(1) Reserves related to the health line are included within the mortality line.
Investments and Investments underlying the Funds Held—Directly Managed AccountThe Company has developed specific investment objectives and guidelines for the management of its
investment portfolio and the investments underlying the funds held – directly managed account (see below fordetails). These objectives and guidelines stress diversification of risk, matching of the underlying liabilitypayments, low credit risk and stability of portfolio income. Despite the prudent focus of these objectives andguidelines, the Company’s investments are subject to general market risk, as well as to risks inherent in particularsecurities.
The Company’s investment strategy is largely consistent with previous years. To ensure that the Companywill have sufficient assets to pay its clients’ claims, the Company’s investment philosophy distinguishes betweenthose assets, including the investments underlying the funds held – directly managed account, that are matchedagainst existing liabilities (liability funds) and those that represent shareholders’ equity (capital funds). Liability
15
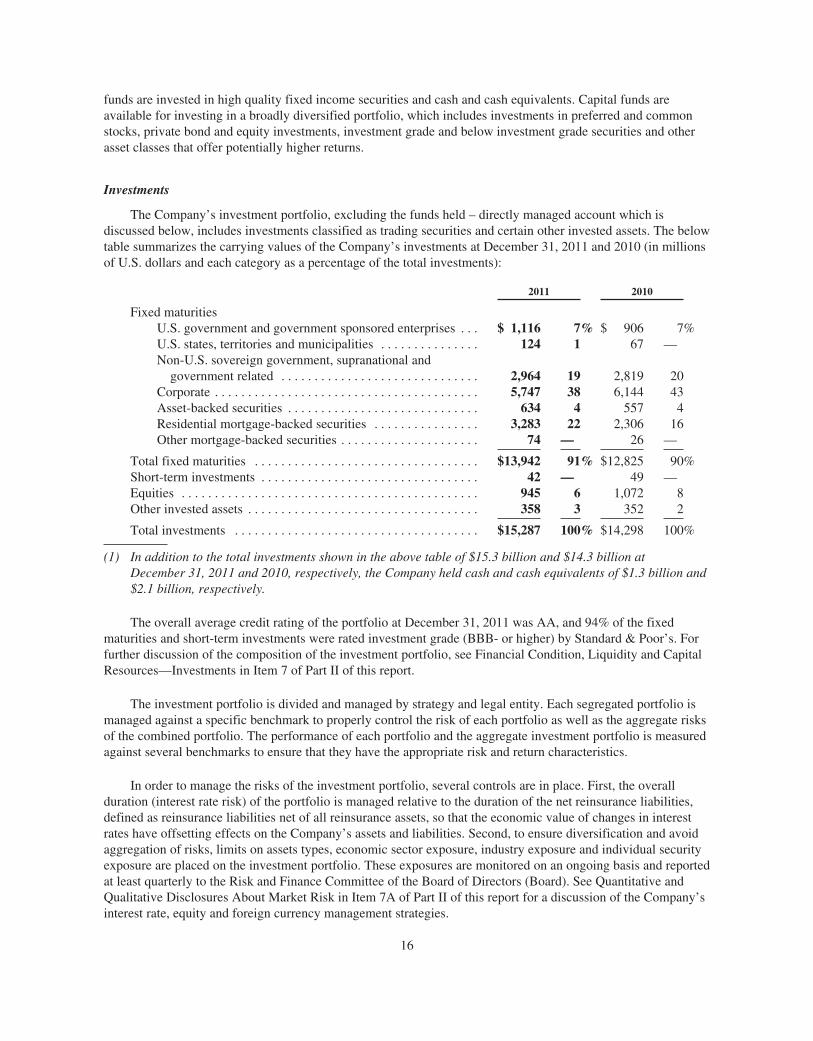
funds are invested in high quality fixed income securities and cash and cash equivalents. Capital funds areavailable for investing in a broadly diversified portfolio, which includes investments in preferred and commonstocks, private bond and equity investments, investment grade and below investment grade securities and otherasset classes that offer potentially higher returns.
Investments
The Company’s investment portfolio, excluding the funds held – directly managed account which isdiscussed below, includes investments classified as trading securities and certain other invested assets. The belowtable summarizes the carrying values of the Company’s investments at December 31, 2011 and 2010 (in millionsof U.S. dollars and each category as a percentage of the total investments):
2011 2010
Fixed maturitiesU.S. government and government sponsored enterprises . . . $ 1,116 7% $ 906 7%U.S. states, territories and municipalities . . . . . . . . . . . . . . . 124 1 67 —Non-U.S. sovereign government, supranational and
government related . . . . . . . . . . . . . . . . . . . . . . . . . . . . . . 2,964 19 2,819 20Corporate . . . . . . . . . . . . . . . . . . . . . . . . . . . . . . . . . . . . . . . . 5,747 38 6,144 43Asset-backed securities . . . . . . . . . . . . . . . . . . . . . . . . . . . . . 634 4 557 4Residential mortgage-backed securities . . . . . . . . . . . . . . . . 3,283 22 2,306 16Other mortgage-backed securities . . . . . . . . . . . . . . . . . . . . . 74 — 26 —
Total fixed maturities . . . . . . . . . . . . . . . . . . . . . . . . . . . . . . . . . . $13,942 91% $12,825 90%Short-term investments . . . . . . . . . . . . . . . . . . . . . . . . . . . . . . . . . 42 — 49 —Equities . . . . . . . . . . . . . . . . . . . . . . . . . . . . . . . . . . . . . . . . . . . . . 945 6 1,072 8Other invested assets . . . . . . . . . . . . . . . . . . . . . . . . . . . . . . . . . . . 358 3 352 2
Total investments . . . . . . . . . . . . . . . . . . . . . . . . . . . . . . . . . . . . . $15,287 100% $14,298 100%
(1) In addition to the total investments shown in the above table of $15.3 billion and $14.3 billion atDecember 31, 2011 and 2010, respectively, the Company held cash and cash equivalents of $1.3 billion and$2.1 billion, respectively.
The overall average credit rating of the portfolio at December 31, 2011 was AA, and 94% of the fixedmaturities and short-term investments were rated investment grade (BBB- or higher) by Standard & Poor’s. Forfurther discussion of the composition of the investment portfolio, see Financial Condition, Liquidity and CapitalResources—Investments in Item 7 of Part II of this report.
The investment portfolio is divided and managed by strategy and legal entity. Each segregated portfolio ismanaged against a specific benchmark to properly control the risk of each portfolio as well as the aggregate risksof the combined portfolio. The performance of each portfolio and the aggregate investment portfolio is measuredagainst several benchmarks to ensure that they have the appropriate risk and return characteristics.
In order to manage the risks of the investment portfolio, several controls are in place. First, the overallduration (interest rate risk) of the portfolio is managed relative to the duration of the net reinsurance liabilities,defined as reinsurance liabilities net of all reinsurance assets, so that the economic value of changes in interestrates have offsetting effects on the Company’s assets and liabilities. Second, to ensure diversification and avoidaggregation of risks, limits on assets types, economic sector exposure, industry exposure and individual securityexposure are placed on the investment portfolio. These exposures are monitored on an ongoing basis and reportedat least quarterly to the Risk and Finance Committee of the Board of Directors (Board). See Quantitative andQualitative Disclosures About Market Risk in Item 7A of Part II of this report for a discussion of the Company’sinterest rate, equity and foreign currency management strategies.
16

Investments underlying the Funds Held—Directly Managed Account
Following the AXA Acquisition, Paris Re France and certain subsidiaries entered into an IssuanceAgreement with Colisée Re to enable Colisée Re to write business on behalf of Paris Re France betweenJanuary 1, 2006 and September 30, 2007. In addition, effective January 1, 2006, Paris Re France and Colisée Reentered into 100% quota share retrocession agreements to transfer the benefits and risks of Colisée Re’sreinsurance agreements to Paris Re and provide for the payment of premiums to Paris Re France in considerationfor reinsuring the covered liabilities (the Quota Share Retrocession Agreement). The Quota Share RetrocessionAgreement provides that these premiums will be on a funds withheld basis. Paris Re France will receive anysurplus, and be responsible for any deficits remaining with respect to the funds held – directly managed account,after all liabilities have been discharged and payments pursuant to the Reserve Agreement have been settled. Inaddition, realized and unrealized investment gains and losses and net investment income related to the investmentportfolio underlying the funds held – directly managed account inure to the benefit of Paris Re France. Theinvestments underlying the funds held – directly managed account were predominantly maintained by Colisée Rein a segregated investment portfolio and managed by the Company. The Company’s strategy related to themanagement of the funds held – directly managed account is as described above related to the Company’sinvestment portfolio.
The table below summarizes the carrying value of the investments underlying the funds held – directlymanaged account at December 31, 2011 and 2010 (in millions of U.S. dollars and each category as a percentageof the investments underlying the funds held – directly managed account):
2011 2010
Fixed maturitiesU.S. government and government sponsored enterprises . . . . . $ 269 26% $ 288 18%U.S. states, territories and municipalities . . . . . . . . . . . . . . . . . — —Non-U.S. sovereign government, supranational and
government related . . . . . . . . . . . . . . . . . . . . . . . . . . . . . . . . 275 26 385 25Corporate . . . . . . . . . . . . . . . . . . . . . . . . . . . . . . . . . . . . . . . . . . 480 45 799 52Mortgage/asset-backed securities . . . . . . . . . . . . . . . . . . . . . . . — — 12 1
Total fixed maturities . . . . . . . . . . . . . . . . . . . . . . . . . . . . . . . . . . . . $1,024 97 $1,484 96Short-term investments . . . . . . . . . . . . . . . . . . . . . . . . . . . . . . . . . . . 18 2 38 3Other invested assets . . . . . . . . . . . . . . . . . . . . . . . . . . . . . . . . . . . . . 16 1 21 1
Total investments . . . . . . . . . . . . . . . . . . . . . . . . . . . . . . . . . . . . . . . $1,058 100% $1,543 100%
(1) In addition to the investments underlying the funds held – directly managed account held at fair value of$1,058 million at December 31, 2011, the funds held – directly managed account also included cash andcash equivalents of $176 million, accrued investment income of $14 million and other assets and liabilitiesheld by Colisée Re related to the underlying business of $20 million.
The overall average credit rating of the portfolio at December 31, 2011 was AA, and all of the fixedmaturities and short-term investments were rated investment grade (BBB- or higher) by Standard & Poor’s.
On February 1, 2011, PartnerRe Europe (formerly Paris Re France prior to its cross border merger withPartnerRe Europe), entered into an Endorsement to Quota Share Retrocession Agreement (the Endorsement) withColisée Re. The Endorsement amended certain terms of the Quota Share Retrocession Agreement and releasedcertain assets forming part of the funds held – directly managed account to PartnerRe Europe.
For further discussion of the composition of the investment portfolio underlying the funds held – directlymanaged account, see Financial Condition, Liquidity and Capital Resources – Funds Held – Directly Managed inItem 7 of Part II of this report. The credit risk of Colisée Re in the event of its insolvency or its failure to honorthe value of the funds held balances for any other reason is discussed in Quantitative and Qualitative DisclosuresAbout Market Risk – Counterparty Credit Risk in Item 7A of Part II of this report.
17

Risk Management
In the reinsurance industry, the core of the business model is the assumption and management of risk. A keychallenge is to create economic value through the intelligent and optimal assumption and management ofreinsurance and capital markets and investment risks, but also to limit or mitigate those risks that can destroytangible as well as intangible value, those risks for which the organization is not sufficiently compensated andthose risks that could threaten the ability of the Company to achieve its objectives. Management believes thatevery organization faces numerous risks that could threaten the successful achievement of a company’s goals andobjectives. These include choice of strategy and markets, economic and business cycles, competition, changes inregulation, data quality and security, fraud, business interruption and management continuity; all factors whichcan be viewed as either strategic or operational risks that are common to any industry. See Risk Factors inItem 1A of Part I of this report. In addition to these risks, the Company assumes risks and its results are primarilydetermined by how well the Company understands, prices and manages assumed risk. While many companiesstart with a return goal and then attempt to shed risks that may derail that goal, the Company starts with a capital-based risk appetite and then looks for risks that meet its return targets within that framework. Managementbelieves that this construct allows the Company to balance the cedants’ need for certainty of claims payment withthe shareholders’ need for an adequate return on their capital.
All business decisions entail a risk/return trade-off. In the context of assumed business risks, this requires anaccurate evaluation of risks to be assumed, and a determination of the appropriate economic returns required asfair compensation for such risks. For other than voluntarily assumed business risks, the decision relates tocomparing the probability and potential severity of a risk event against the costs of risk mitigation strategies. Inmany cases, the potential impact of a risk event is so severe as to warrant significant, and potentially expensive,risk mitigation strategies. In other cases, the probability and potential severity of a risk does not warrantextensive risk mitigation.
The Company has a clearly defined governance structure for risk management. Executive Management andthe Board are responsible for setting the vision and goals including risk appetite and return expectations. Strategyand principles are recommended by Executive Management and approved by the Board. Key policies and Grouppolicies are established by the Chief Executive Officer and policies at the next level down are established byBusiness Unit and functional management. Risk management policies and processes are coordinated by GroupRisk Management and audited by Internal Audit. The results of audits are monitored by the Audit Committee ofthe Board. The Company utilizes a multi-level risk management structure, whereby critical exposure limits,return requirement guidelines, capital at risk and key policies are established by the Executive Management andBoard, but day-to-day execution of risk assumption activities and related risk mitigation strategies are delegatedto the Business Units. Reporting on risk management activities is integrated within the Company’s annualplanning process, quarterly operations reports, periodic reports on exposures and large losses, and presentationsto the Executive Management and Board. Individual Business Units employ, and are responsible for reporting on,operating risk management procedures and controls, while Internal Audit periodically tests these controls toensure ongoing compliance.
Strategic Risks
Strategic risks are managed by Executive Management and include the direction and governance of theCompany, as well as its response to key external factors faced by the reinsurance industry.
The Company manages assumed risk at a strategic level through diversification, risk appetite, and limits.For each key risk, the Board approves a risk appetite that the Company defines as the percentage of economiccapital the Company is willing to expose to economic loss with a modeled probability of occurring once every 15years and once every 75 years. The Company manages its exposure to key risks such that the modeled economicloss at a 1 in 15 year and a 1 in 75 year return period are less than the economic capital the Company is willing toexpose to the key risks at those return periods.
18

The Company’s risk limits are stated as explicit numerical expressions, such as total aggregate limits in acatastrophe zone, earned premium for casualty business, the market value of equity and equity-like securities andan extreme scenario for longevity business. Executive and Business Unit Management set additional specific andaggregate risk limits within the limits approved by the Risk and Finance Committee. The actual level of risk isdependent on current market conditions and the need for balance in the Company’s portfolio of risks. On aquarterly basis, Management reviews and reports to the Board the actual utilization of limits against approvedlimits and modeled economic loss against approved appetite for the key risks.
Individual Business Units manage assumed risks, subject to the appetite and principles approved by theBoard, limits approved by the Risk and Finance Committee of the Board, and policies established by Executiveand Business Unit Management. At an operational level, Business Units manage assumed risk through riskmitigation strategies including strong processes, technical risk assessment and collaboration among differentgroups of professionals who each contribute a particular area of expertise.
Operational and financial risks are managed by designated functions within the organization. They includefailures or weaknesses in financial reporting and controls, regulatory non-compliance, poor cash management,fraud, breach of information technology security and reliance on third party vendors. The Company seeks tominimize these risks through robust processes and controls. Controls and monitoring processes throughout theorganization seek to ensure that the Executive Management and the Board have a comprehensive view of theCompany’s risks and related mitigation strategies at all times.
The major risks to the Company’s balance sheet are typically due to events that Management refers to asshock losses. The Company defines a shock loss as an event that has the potential to materially impact economicvalue. The Company defines its economic value as the difference between the net present value of tangible assetsand the net present value of liabilities, using appropriate risk discount rates, plus the unrecognized value of theLife portfolio. For traded assets, the calculated net present values are equivalent to market values.
There are four areas of risk that the Company has currently identified as having the greatest potential forshock losses: catastrophe risk, reserving risk for casualty and other long-tail lines, equity and equity-likeinvestment risk and longevity risk. The Company manages the risk of shock losses by setting risk appetite andlimits, as described above and below, for each type of shock loss. The Company establishes limits to manage themaximum foreseeable loss from any one event and considers the possibility that several shock losses could occurat one time, for example a major catastrophe event accompanied by a collapse in the equity markets.Management believes that the limits that it has placed on shock losses will allow the Company to continuewriting business should such an event occur.
Other risks such as interest rate risk and credit spread risk have the ability to impact results substantially andmay result in volatility in results from period to period. However, Management believes that by themselves,interest rate risk and credit spread risk are unlikely to represent a material threat to the Company’s long-termeconomic value. See Quantitative and Qualitative Disclosures about Market Risk in Item 7A of Part II of thisreport for additional discussion of interest rate risk, credit spread risk, foreign currency risk, counterparty creditrisk and equity price risk.
Catastrophe Risk
The Company defines this risk as the risk that the aggregate losses from natural perils materially exceed thenet premiums that are received to cover such risks. The Company considers both the loss of capital due to asingle large event and the loss of capital that would occur from multiple (but potentially smaller) events in anyyear.
Catastrophe risk is managed through the real-time allocation of catastrophe exposure capacity in eachexposure zone to different Business Units, regular catastrophe modeling and a combination of quantitative andqualitative analysis. A zone is a geographic area in which the insurance risks are considered to be correlated to asingle catastrophic event. Not all zones have the same limit and zones are broadly defined so that it would be
19

highly unlikely for any single event to substantially erode the aggregate exposure limits from more than onezone. Even extremely high severity/low likelihood events will only partially exhaust the limits in any zone, asthey are likely to only affect a part of the area covered by a wide zone.
The Company imposes a limit to catastrophe risk from any single loss through exposure limit caps in eachzone and to each peril. Limits from catastrophe exposed business include limits on both reinsurance treaties andinsurance-linked securities. The Company also manages its catastrophe exposures such that the chance of aneconomic loss to the Company from all catastrophe losses in aggregate in any one year exceeding $1.4 billion hasa modeled probability of occurring less than once every 75 years. To measure this probability, the Company usesproprietary and vendor models that take into account the likely frequency and severity of catastrophic events witha forward looking approach using exposure. This quantitative analysis is supplemented with the professionaljudgment of experienced underwriters. At December 31, 2011, the modeled economic loss to the Company froma 1 in 75 year catastrophic loss was $1.2 billion, in aggregate, for all zones.
The Company is currently in the process of updating its probable maximum loss (PML) modeling, includingincorporating January 1, 2012 renewals, and expects to release updated PML information for certain selectedcatastrophe exposed zones in due course.
Casualty Reserving Risk
The Company defines this risk as the risk that the estimates of ultimate losses that underlie its bookedreserves for casualty and other long-tail lines will prove to be too low, leading to substantial reservestrengthening. One of the greatest risks in long-tail lines of business, and particularly in U.S. casualty, is that theloss trends are higher than the assumptions underlying the Company’s ultimate loss estimates, resulting inultimate losses that exceed recorded loss reserves. When loss trends prove to be higher than those underlying thereserving assumptions, the risk is great because of a stacking up effect: for long-tail lines, the Company carriesreserves to cover claims arising from several years of underwriting activity and these reserves are likely to beadversely affected by unfavorable loss trends. The effect is likely to be more pronounced for recent underwritingyears because, with the passage of time, actual loss emergence and data provide greater confidence around theadequacy of ultimate liability estimates for older underwriting years. Management believes that the volume oflong-tail business most exposed to these reserving uncertainties should be limited.
The Company’s limit for casualty reserving risk represents the total earned premiums for casualty and otherlong-tail lines for the four most recent underwriting periods. The Company also manages its casualty and otherlong-tail lines exposure such that the chance of an economic loss to the Company from prior years’ deteriorationin casualty and other long-tail reserves exceeding $0.7 billion has a modeled probability of occurring less thanonce every 15 years. To measure this probability, the Company uses proprietary models that contemplate therange of possible reserve outcomes given historic volatility of the Company’s and industry reserve developmentdata and the possible impacts upon the range of reserves of risk factors inherent in the current booked reserves.This quantitative analysis is supplemented with the professional judgment of experienced actuaries. AtDecember 31, 2011, the modeled economic loss to the Company from a 1 in 15 year casualty and other long-taillines prior years’ reserve development was $0.4 billion.
The Company manages and mitigates the reserving risk for long-tail lines in a variety of ways. Underwritersand pricing actuaries follow a disciplined underwriting process that utilizes all available data and information,including industry trends, and the Company establishes prudent reserving policies for determining carriedreserves. These policies are systematic and Management endeavors to apply them consistently over time. SeeCritical Accounting Policies and Estimates—Losses and Loss Expenses and Life Policy Benefits below.
Equity Investment Risk
The Company defines this risk as the risk of a substantial decline in the value of its equity and equity-likesecurities. The Company defines equity and equity-like securities as the market value of all assets that are notinvestment grade fixed income.
20

The Company limits the amount of equity and equity-like securities to a percentage of economic capital.The Company also manages its exposures to equity and equity-like securities such that the chance of aneconomic loss to the Company of a severe decline in value of equity and equity-like securities exceeding $1.1billion has a modeled probability of occurring less than once every 75 years. To measure this probability, theCompany uses proprietary and vendor models that contemplate the range of historic and possible future returns.This quantitative analysis is supplemented with the professional judgment of experienced investmentprofessionals and actuaries. At December 31, 2011, the modeled economic loss to the Company from a 1 in 75year equity and equity-like value decline was $0.4 billion.
Assuming equity risk (and equity-like risks such as those from high yield bonds and convertible securities)within that part of the investment portfolio that is not required to support the Company’s reinsurance liabilitiesprovides valuable diversification from other risk classes, along with the potential for higher returns. However, anoverweight position could lead to a large loss of capital and impair the balance sheet in the case of a marketcrash. The Company sets strict limits on investments in any one name and any one industry, which creates adiversified portfolio and allows Management to focus on the systemic effects of equity risks. Systemic risk ismanaged by asset allocation, subject to strict caps on other than investment grade bonds as a percentage ofcapital. The Company’s fully integrated information system provides real-time data on the investment portfolios,allowing for continuous monitoring and decision support. Each portfolio is managed against a pre-determinedbenchmark to enable alignment with appropriate risk parameters and achievement of desired returns. SeeQuantitative and Qualitative Disclosures about Market Risk—Equity Price Risk in Item 7A of Part II of thisreport.
Longevity Risk
The Company considers longevity exposure to have a material accumulation potential and has established alimit to manage the risk of loss associated with this exposure. The Company defines longevity risk as thepotential for increased actual and future expected annuity payments resulting from annuitants living longer thanexpected, or the expectation that annuitants will live longer in the future. Assuming longevity risk, throughreinsurance or capital markets transactions, is part of the Company’s strategy of building a diversified portfolioof risks. While longevity risk is highly diversifying in relation to other risks in the Company’s portfolio (e.g.mortality products), longevity risk itself is a systemic risk with little opportunity to diversify within the risk class.Longevity risk accumulates across cedants, geographies, and over time because mortality trends can impactdiverse populations in the same manner. Longevity risk can manifest slowly over time as experience provesannuitants are living longer than original expectations, or abruptly as in the case of a “miracle drug” thatincreases the life expectancy of all annuitants simultaneously.
In order to determine a longevity limit metric for the purposes of risk accumulation, the Company examinedextreme scenarios and measured its exposure to loss under those scenarios. Examples of these scenarios included,but were not limited to, immediate elimination of major causes of death and an extreme improvement scenarioequivalent to the adverse result of every annuitant’s life expectancy increasing to approximately 100 years. TheCompany did not rely upon modeled losses to determine the limit metric, but did benchmark the scenario resultsagainst existing tests, scenarios and models. For risk accumulation purposes, the Company selected the mostextreme scenario and added an additional margin for potential deviation.
The Company selected a longevity limit of $2 billion. To measure utilization of the longevity limit(accumulation of longevity exposure), the Company accumulates the net present value of adverse loss resultingfrom the application of the selected extreme scenario and additional margin applied to every in-force longevitytreaty and the notional value of any longevity insurance-linked security.
21

The limits and actual deployed exposures of the Company for its four major risks at December 31, 2011 areas follows:
Limit atDecember 31, 2011
Deployed atDecember 31, 2011
Deployed atDecember 31, 2010
Catastrophe risk—largest zonal limit . . . . . . . . $2.8 billion $2.1 billion $2.5 billion
Casualty reserving risk—total earned premiumsfor casualty and other long-tail lines for thefour most recent underwriting periods . . . . . . 6.3 billion 2.9 billion 3.0 billion
Equity investment risk—value of equity andequity-like securities . . . . . . . . . . . . . . . . . . . 3.3 billion 1.4 billion 1.5 billion
Longevity risk—net present value loss fromextreme mortality improvement scenario . . . 2.0 billion 1.2 billion 1.0 billion
The following table summarizes risk appetite and modeled economic loss at December 31, 2011 for theCompany’s major risks discussed above:
Risk Appetite atDecember 31,
2011(1)
ModeledEconomic Loss at
December 31,2011(1)
ModeledEconomic Loss at
December 31,2010(1)
Catastrophe risk—1 in 75 year annual aggregateloss . . . . . . . . . . . . . . . . . . . . . . . . . . . . . . . . . .
$1.4 billion $1.2 billion $1.3 billion
Casualty reserving risk—casualty and otherlong-tail lines 1 in 15 year prior years reservedevelopment . . . . . . . . . . . . . . . . . . . . . . . . . . 0.7 billion 0.4 billion 0.4 billion
Equity investment risk—1 in 75 year decline invalue . . . . . . . . . . . . . . . . . . . . . . . . . . . . . . . . 1.1 billion 0.4 billion 0.5 billion
(1) The Company has not defined a risk appetite for longevity risk as it believes that establishing a limit iscurrently the most appropriate risk management metric. In addition, the Company has not relied upon amodeled economic loss for longevity risk.
Other Underwriting Risk and Exposure Controls
The Company’s underwriting is conducted at the Business Unit level through specialized underwritingteams with the support of technical staff in disciplines such as actuarial, claims, legal, risk management andfinance.
The Company’s underwriters generally speak the local language and/or are native to their country or area ofspecialization. They develop close working relationships with their ceding company counterparts and brokersthrough regular visits, gathering detailed information about the cedant’s business and local market conditions andpractices. As part of the underwriting process, the underwriters also focus on the reputation and quality of theproposed cedant, the likelihood of establishing a long-term relationship with the cedant, the geographic area inwhich the cedant does business and the cedant’s market share, historical loss data for the cedant and, whereavailable, historical loss data for the industry as a whole in the relevant regions, in order to compare the cedant’shistorical loss experience to industry averages, and to gauge the perceived insurance and reinsurance expertiseand financial strength of the cedant. The Company trains its underwriters extensively and strives to maintaincontinuity of underwriters within specific geographic markets and areas of specialty.
22

Because the Company underwrites volatile lines of business, such as catastrophe reinsurance, the operatingresults and financial condition of the Company can be adversely affected by catastrophes and other large lossesthat may give rise to claims under reinsurance coverages provided by the Company. The Company manages itsexposure to catastrophic and other large losses by (i) attempting to limit its aggregate exposure on catastrophereinsurance in any particular geographic zone, (ii) selective underwriting practices, (iii) diversification of risks bygeographic area and by lines and classes of business, and (iv) by purchasing retrocessional reinsurance.
The Company generally underwrites risks with specified limits per treaty program. Like other reinsurancecompanies, the Company is exposed to multiple insured losses arising out of a single occurrence, whether anatural event such as hurricane, windstorm, tornado, flood or earthquake, or man-made events. Any suchcatastrophic event could generate insured losses in one or many of the Company’s reinsurance treaties andfacultative contracts in one or more lines of business. The Company considers such event scenarios as part of itsevaluation and monitoring of its aggregate exposures to catastrophic events.
Retrocessions
The Company uses retrocessional agreements to reduce its exposure on certain reinsurance risks assumedand to mitigate the effect of any single major event or the frequency of medium-sized events. These agreementsprovide for the recovery of a portion of losses and loss expenses from retrocessionaires. The majority of theCompany’s retrocessional agreements cover the property exposures, predominantly those that are catastropheexposed. The Company also utilizes retrocessions in the Life segment to manage the amount of per-event andper-life risks to which it is exposed. Retrocessionaires are selected based on their financial condition andbusiness practices, with stability, solvency and credit ratings being important criteria.
The Company remains liable to its cedants to the extent that the retrocessionaires do not meet theirobligations under retrocessional agreements, and therefore retrocessions are subject to credit risk in all cases andto aggregate loss limits in certain cases. The Company holds collateral, including escrow funds, securities andletters of credit under certain retrocessional agreements. Provisions are made for amounts considered potentiallyuncollectible and reinsurance losses recoverable from retrocessionaires are reported after allowances foruncollectible amounts.
In addition to the retrocessional agreements, Paris Re France (now PartnerRe Europe) has a ReserveAgreement in place with Colisée Re (see Reserve Agreement above).
Claims
In addition to managing and settling reported claims and consulting with ceding companies on claimsmatters, the Company conducts periodic audits of specific claims and the overall claims procedures at the officesof ceding companies. The Company attempts to evaluate the ceding company’s claim adjusting techniques andreserve adequacy and whether it follows proper claims processing procedures. The Company also providesrecommendations regarding procedures and processes to the ceding company.
Other Key Issues of Management
Enterprise Culture
Management is focused on ensuring that the structure and culture of the organization promote intelligent,prudent, transparent and ethical decision-making. Management believes that a sound enterprise culture starts withthe tone at the top. Management holds regular company-wide information sessions to present and reviewManagement’s latest decisions, whether operational, financial or structural, as well as the financial results of theCompany. Employees are encouraged to address questions related to the Company’s results, strategy orManagement decisions, either anonymously or otherwise to Management so that they can be answered duringthese information sessions. Management believes that these sessions provide a consistent message to allemployees about the Company’s value of transparency. Management also strives to promote a work environment
23

that (i) aligns the skill set of individuals with challenges encountered by the Company, (ii) includes segregationof duties to ensure objectivity in decision-making, and (iii) provides a compensation structure that encouragesand rewards intelligent risk taking and ethical behavior. To that effect, the Company has a written Code ofBusiness Conduct and Ethics and provides employees with a direct communication channel to the AuditCommittee of the Board in the event they become aware of questionable behavior of Management or any otheremployee. Finally, Management believes that building a sound internal control environment, including a strongInternal Audit function, helps ensure that behaviors are consistent with the Company’s cultural values.
Capital Adequacy
A key challenge for Management is to maintain an appropriate level of capital, especially in light of therecent disruptions in the global credit and capital markets. Management’s first priority is to hold sufficient capitalto meet all of the Company’s obligations to cedants, meet regulatory requirements and support its position as oneof the stronger reinsurers in the industry. Holding an excessive amount of capital, however, will reduce theCompany’s Operating ROE. Consequently, Management closely monitors its capital needs and capital levelthroughout the reinsurance cycle and in times of volatility and turmoil in global capital markets, and activelytakes steps to increase or decrease the Company’s capital in order to achieve an appropriate balance of financialstrength and shareholder returns. Capital management is achieved by either deploying capital to fund attractivebusiness opportunities, or in times of excess capital and times when business opportunities are not so attractive,returning capital to its common shareholders by way of share repurchases and dividends. During 2011, theCompany repurchased approximately 5.4 million of its common shares for a total cost of $396 million. Inaddition, the Company increased the quarterly dividends on its common shares by 9% during the year, from$0.55 per share to $0.60 per share.
Liquidity and Cash Flows
The Company aims to be a reliable and financially secure partner to its cedants. This means that theCompany must maintain sufficient liquidity at all times so that it can support its cedants by settling claimsquickly. The Company generates cash flows primarily from its underwriting and investment operations.Management believes that a profitable, well-run reinsurance organization will generate sufficient cash frompremium receipts to pay claims, acquisition costs and operating expenses in most years. To the extent thatunderwriting cash flows are not sufficient to cover operating cash outflows in any year, the Company may utilizecash flows generated from investments and may ultimately liquidate assets from its investment portfolio.Management ensures that its liquidity requirements are supported by maintaining a high quality, well balancedand liquid investment portfolio, and by matching the duration and currency of its investments and investmentsunderlying the funds held – directly managed account with that of its net reinsurance liabilities. In 2012, theCompany expects to continue to generate positive operating cash flows, absent a series of unusual catastrophicevents. The Company also maintains credit facilities with banks that can provide efficient access to cash in theevent of an unforeseen cash requirement.
Employees
The Company had 1,281 employees at December 31, 2011. The Company may increase its staff over timecommensurate with the expansion of operation. The Company believes that its relations with its employees aregood.
Regulation
The business of reinsurance is regulated in all countries in which we operate, although the degree and typeof regulation varies significantly from one jurisdiction to another. Some jurisdictions impose complex regulatoryrequirements on insurance businesses while other jurisdictions impose fewer requirements. In certain foreigncountries, reinsurers are required to be licensed by governmental authorities. These licenses may be subject to
24

modification, suspension or revocation dependent on such factors as amount and types of reserves and minimumcapital and solvency tests. The violation of regulatory requirements may result in fines, censures and/or criminalsanctions in various jurisdictions. See Risk Factors in Item 1A of Part I of this report.
As a holding company, PartnerRe is not directly subject to (re)insurance regulations, but its various materialoperating subsidiaries are subject to regulation as follows:
Bermuda
The Insurance Act 1978 of Bermuda and related regulations, as amended (the Insurance Act), regulates theinsurance business of PartnerRe Bermuda. The Insurance Act imposes solvency and liquidity standards andauditing and reporting requirements on Bermuda insurance companies and grants the Bermuda MonetaryAuthority (BMA) powers to supervise, investigate and intervene in the affairs of insurance companies. TheInsurance Act makes no distinction between insurance and reinsurance business.
PartnerRe Bermuda is licensed as a Class 4 and Class E insurer in Bermuda and is therefore authorized tocarry on general and long-term insurance business in Bermuda. Significant aspects of the Bermuda insuranceregulatory framework and requirements imposed on Class 4 and Class E insurers such as PartnerRe Bermudainclude the following:
Minimum Capital Requirements. The BMA imposes certain minimum capital regulatory requirements onPartnerRe Bermuda referred to as the Enhanced Capital Requirements (ECR). PartnerRe Bermuda’s EnhancedCapital Requirement (ECR) should be calculated by either (a) the model developed by the BMA, or (b) aninternal capital model which the BMA has approved for use for this purpose. PartnerRe Bermuda currently usesthe BMA model in calculating its solvency requirements. The Bermuda risk-based regulatory capital adequacyand solvency margin regime provides a risk-based capital model (termed the Bermuda Solvency CapitalRequirement (BSCR)) as a tool to assist the BMA both in measuring risk and in determining appropriate levels ofcapitalization. The BSCR employs a standard mathematical model that correlates the risk underwritten byBermuda insurers to the capital that is dedicated to their business. The BMA requires that insurers operate at orabove a threshold capital level (termed the Target Capital Level), which exceeds the BSCR or approved internalmodel minimum amounts;
Solvency Assessment. PartnerRe Bermuda must perform an assessment of its own risk and solvencyrequirements, referred to as a Commercial Insurer’s Solvency Self Assessment (CISSA). The CISSA allows theBMA to obtain an insurer’s view of the capital resources required to achieve its business objectives and to assessa company’s governance, risk management and controls surrounding this process. In addition, PartnerReBermuda must file with the BMA a Catastrophe Risk Return which assesses an insurer’s reliance on vendormodels in assessing catastrophe exposure;
Reporting Requirements. PartnerRe Bermuda must prepare annual statutory financial statements and filethem with the BMA, together with audited annual financial statements which are prepared in accordance with theaccounting principles generally accepted in the United States (U.S. GAAP); and
Restrictions on Dividends and Distributions. PartnerRe Bermuda is prohibited from declaring or paying anydividends of more than 25% of its total statutory capital and surplus, as shown in its previous financial yearstatutory balance sheet, unless at least seven days before payment of the dividends it files with the BMA anaffidavit that it will continue to meet its required solvency margins. In addition, PartnerRe Bermuda must obtainthe BMA’s prior approval before reducing its total statutory capital, as shown in its previous financial yearstatutory balance sheet, by 15% or more.
In addition to the above regulatory requirements impacting PartnerRe Bermuda, current internationalinitiatives in the regulation of global insurance and reinsurance groups, such as the European Union’s Solvency IIinitiative (Solvency II), are trending towards the imposition of group supervisory regimes, introducing oneprincipal “home” regulator over all the operating entities in a particular insurance or reinsurance group (referred
25

to as Group Supervision). The Insurance Act sets out provisions regarding Group Supervision including, thepower of the BMA to exclude specified entities from Group Supervision, the power of the BMA to withdraw asgroup supervisor, the functions of the BMA as group supervisor and the power of the BMA to make rulesregarding Group Supervision. This Group Supervision regime is in addition to the regulation of the Company’svarious operating subsidiaries in their local jurisdictions. The BMA’s Group Supervision rules set out the rules inrespect of the assessment of the financial situation and solvency of an insurance group, the system of governanceand risk management, and supervisory reporting and disclosures of an insurance group. The group solvency rulesset out the rules in respect of the capital and solvency return and enhanced capital requirements for an insurancegroup. The BMA has chosen PartnerRe Bermuda as the designated insurer for the purposes of GroupSupervision, and the BMA will act as group supervisor of the PartnerRe group. As group supervisor, the BMAwill gather relevant and essential information on and assess the financial situation of the PartnerRe group, andcoordinate the dissemination of such information to other relevant competent authorities for the purposes ofassisting in their regulatory functions and the enforcement of regulatory action against the PartnerRe group orany of its members. PartnerRe is not an insurer and, as such, is not regulated in Bermuda. However, pursuant toits functions as group supervisor, the BMA may include any member of the group within its Group Supervision,including PartnerRe.
Ireland
The Central Bank of Ireland (the Central Bank) regulates insurance and reinsurance companies authorized inIreland, including PartnerRe Europe. PartnerRe Holdings Europe Limited, a holding company for PartnerReEurope, is not subject to regulation by the Central Bank.
PartnerRe Europe is a reinsurance company incorporated under the laws of Ireland and is duly authorized asa reinsurance undertaking to carry on non-life and life reinsurance business in accordance with the EuropeanCommunities (Reinsurance) Regulations 2006. Significant aspects of the Irish insurance regulatory frameworkand requirements imposed on PartnerRe Europe include the following:
Solvency Requirements. As a composite reinsurer, PartnerRe Europe is required to maintain a minimumcapital (Solvency I) requirement throughout the year. This solvency margin is determined on a premium orclaims basis that covers the total sum of required solvency margins in respect of both non-life and life businessactivities. In addition, the Central Bank requires PartnerRe Europe to specify their Strategic Solvency Target, inexcess of the minimum capital requirement.
Reporting Requirements. PartnerRe Europe must file and submit its annual audited financial statements inaccordance with International Financial Reporting Standards (IFRS) and related reports to the Irish CompaniesRegistration Office together with an annual return of certain core corporate information. Changes to corecorporate information during the year must also be notified to the Registrar. These requirements are in addition tothe regulatory returns required to be filed annually with the Central Bank; and
Restrictions on Dividends and Distributions. Pursuant to Irish company law, PartnerRe Europe is restrictedto declaring dividends only out of “profits available for distribution”. Profits available for distribution are,broadly, a company’s accumulated realized profits less its accumulated realized losses. Such profits may notinclude profits previously utilized.
In addition to the above, PartnerRe Europe has also established operating branches in France, Switzerland,Canada, Singapore and Hong Kong and a representative office in Brazil, which are subject to Irish insurancesupervision regulations. In addition, the Canadian branch is subject to regulation in Canada by the Office of theSuperintendent of Financial Institutions, the Singapore branch is subject to regulation by the Monetary Authorityof Singapore and the Hong Kong branch to regulation by the Office of the Commissioner of Insurance of HongKong. For a further discussion of the regulations pertaining to the Canadian branch see below.
United States
PartnerRe U.S. Corporation is a Delaware domiciled holding company for its wholly owned (re)insurancesubsidiaries, PartnerRe U.S. and PartnerRe Insurance Company of New York (PRNY) (PartnerRe U.S. and
26

PRNY together being the PartnerRe U.S. Insurance Companies). The PartnerRe U.S. Insurance Companies aresubject to regulation under the insurance statutes and regulations of their domiciliary state, New York, and allstates where they are licensed, accredited or approved to underwrite insurance and reinsurance. Currently, thePartnerRe U.S. Companies are licensed, accredited or approved reinsurers and/or insurers in fifty states and theDistrict of Columbia, and are subject to the following requirements:
Risk-Based Capital Requirements. The Risk-Based Capital (RBC) for Insurers Model Act (the Model RBCAct), as it applies to property and casualty insurers and reinsurers, was initially adopted by the NAIC inDecember 1993. The Model RBC Act or similar legislation has been adopted by the majority of states in the U.S.The main purpose of the Model RBC Act is to provide a tool for insurance regulators to evaluate the capital ofinsurers with respect to the risks assumed by them and to determine whether there is a need for possiblecorrective action. U.S. insurers and reinsurers are required to report the results of their RBC calculations as partof the statutory annual statements that such insurers and reinsurers file with state insurance regulatory authorities.The Model RBC Act provides for four different levels of regulatory actions, each of which may be triggered if aninsurer’s Total Adjusted Capital (as defined in the Model RBC Act) is less than a corresponding level of risk-based capital. Decreases in an insurer’s Total Adjusted Capital as a percentage of its Annualized Control Level(as defined in the Model RBC Act) triggers increasing regulatory actions. Such regulatory actions include but arenot limited to issuance of orders for corrective action by the insurer, rehabilitation or liquidation of the insurer;
Insurance Regulatory Information System (IRIS) Ratios. A committee of state insurance regulatorsdeveloped the National Association of Insurance Commissioners’ (NAIC) IRIS primarily to assist state insurancedepartments in executing their statutory mandates to oversee the financial condition of insurance or reinsurancecompanies operating in their respective states. IRIS identifies thirteen industry ratios and specifies usual valuesfor each ratio. Generally, a company will become subject to regulatory scrutiny if it falls outside the usual rangeswith respect to four or more of the ratios, and regulators may then act, if the company has insufficient capital, toconstrain the company’s underwriting capacity. No such action has been taken with respect to the PartnerRe U.S.Companies;
Reporting Requirements. Regulations vary from state to state, but generally require insurance holdingcompanies and insurers and reinsurers that are subsidiaries of insurance holding companies to register and filewith their state domiciliary regulatory authorities certain reports, including information concerning their capitalstructure, ownership, financial condition and general business operations. State regulatory authorities monitorcompliance with, and periodically conduct examinations with respect to, state mandated standards of solvency,licensing requirements, investment limitations, and restrictions on the size of risks which may be reinsured,deposits of securities for the benefit of reinsureds, methods of accounting for assets, reserves for unearnedpremiums and losses, and other purposes. In general, such regulations are for the protection of reinsureds and,ultimately, their policyholders, rather than security holders. In the U.S., PartnerRe U.S. Insurance Companies’current domiciliary regulator is the New York State Department of Financial Services; and
Restrictions on Dividends and Distributions. Under New York law, the New York State Department ofFinancial Services must approve any dividend declared or paid by the PartnerRe U.S. Insurance Companies that,together with all dividends declared or distributed by each of them during the preceding twelve months, exceedsthe lesser of 10% of their respective statutory surplus as shown on the latest statutory financial statements on filewith the New York Department of Financial Services, or 100% of their respective adjusted net investmentincome during that period. New York does not permit a dividend to be declared or distributed, except out ofearned surplus.
In addition to the above, the following laws and initiatives currently impact or may impact the PartnerReU.S. Insurance Companies in the future:
The Dodd-Frank Wall Street Reform and Consumer Protection Act of 2010 (the Dodd-Frank Act). TheDodd-Frank Act represents a comprehensive overhaul of the financial services industry within the United Statesand establishes a Federal Insurance Office under the U.S. Treasury Department to monitor all aspects of theinsurance industry. The Dodd Frank Act made small changes to the regulation of credit for reinsurance and
27

surplus lines insurance in the U.S. Among other responsibilities the Federal Insurance Office will issue reports onhow to modernize or improve insurance regulation and on the role of the global reinsurance market in supportinginsurance in the United States. See Risk Factors in Item 1A of Part I of this report.
NAIC Solvency Modernization Initiative. In 2008 the NAIC began its Solvency Modernization Initiative toexamine the United States insurance solvency regulation framework with a focus on capital requirements,international accounting, insurance valuation, reinsurance and group regulatory issues. The major policydecisions arising from the Solvency Modernization Initiative are anticipated to be concluded by the end of 2012.
Canada
Each of the Canadian branches of PartnerRe Europe and PartnerRe U.S. holds a license to write reinsurancebusiness in Canada. Each Canadian branch is authorized to insure, in Canada, risks falling within the classes ofinsurance as specified in their respective licenses and is limited to the business of reinsurance. The Canadianbranch of PartnerRe Europe is licensed to write life business in Ontario and is currently applying for a license towrite life business in Quebec. The Canadian branch of PartnerRe U.S. is licensed to write property and casualtybusiness in Ontario and Quebec. Each Canadian branch is subject to local regulation for its Canadian branchbusiness, specified principally pursuant to Part XIII of the Insurance Companies Act (the Canadian InsuranceAct) applicable to foreign property and casualty companies and to foreign life companies as well as relevantprovincial insurance acts. The Office of the Superintendent of Financial Institutions, Canada (OSFI) supervisesthe application of the Canadian Insurance Act.
PartnerRe U.S. and PartnerRe Europe maintain sufficient assets, vested in trust at a Canadian financialinstitution approved by OSFI, to allow their branches to meet minimum statutory solvency requirements asrequired by the Act and the regulations made under it. Certain statutory information is filed with federal andprovincial insurance regulators in respect of both property and casualty and life business written by branches.This information includes, among other things, a yearly business plan and an annual Dynamic Capital AdequacyTest (DCAT) report from the Appointed Actuary of the branch that tests the adequacy of the assets that arevested under various adverse scenarios.
Other Regulatory Considerations
Moreover, there are various regulatory bodies and initiatives that impact PartnerRe in multiple internationaljurisdictions and the potential for significant impact on PartnerRe could be heightened as a result of recentindustry and economic developments. In particular, Solvency II, adopted in the European Union aims to establisha revised set of risk-based capital requirements and risk management standards that will replace the currentSolvency I requirements. Once finalized, Solvency II is expected to set out new, strengthened requirementsapplicable to the entire European Union relating to capital adequacy and risk management for insurers. See RiskFactors in Item 1A of Part I of this report.
Taxation of the Company and its Subsidiaries
The following summary of the taxation of the Company, PartnerRe Bermuda, PartnerRe Europe and thePartnerRe U.S. Corporation and its subsidiaries (collectively PartnerRe U.S. Companies) is based upon currentlaw. Legislative, judicial or administrative changes may be forthcoming that could affect this summary. Certainsubsidiaries, branch offices and representative offices of the Company are subject to taxation related tooperations in Brazil, Canada, Chile, China, France, Hong Kong, Ireland, Labuan, Singapore, Switzerland and theUnited States. The discussion below covers the significant locations for which the Company or its subsidiariesare subject to taxation.
Bermuda
The Company and PartnerRe Bermuda have each received from the Minister of Finance an assurance underThe Exempted Undertakings Tax Protection Act, 1966 of Bermuda, to the effect that in the event that there is anylegislation enacted in Bermuda imposing tax computed on profits or income, or computed on any capital asset,
28

gain or appreciation, or any tax in the nature of estate duty or inheritance tax, then the imposition of any such taxshall not be applicable to the Company or PartnerRe Bermuda or to any of their operations or the shares,debentures or other obligations of the Company or PartnerRe Bermuda until March 2035. These assurances aresubject to the proviso that they are not construed to prevent the application of any tax or duty to such persons asare ordinarily resident in Bermuda (the Company and PartnerRe Bermuda are not currently so designated) or toprevent the application of any tax payable in accordance with the provisions of The Land Tax Act, 1967 ofBermuda or otherwise payable in relation to the property leased to PartnerRe Bermuda.
Canada
The Canadian non-life branch of PartnerRe U.S. and, from January 1, 2012, the Canadian life branch ofPartnerRe Europe are subject to Canadian taxation on their profits. The profits of the Canadian life branch ofPartnerRe Europe, from January 1, 2012, are taxed at the federal level as well as the Ontario-provincial level at atotal rate that was 28.25% in 2011.
The Canadian non-life branch of PartnerRe U.S. is subject to taxation on its profits at the federal level aswell as the Ontario and Quebec provincial level at a total rate that was an average of 28.32% in 2011. We expectthis rate to decrease through 2014; however, the exact rate cannot be determined at this time. See also thediscussion of taxation in the United States and Ireland below.
Canada has enacted a phased-in decrease of the Federal income tax rate; combined with the phased-indecrease of the income tax rate in the Province of Ontario, the total rate will be 26.25% in 2012, 25.50% in 2013and 25.00% in 2014.
France
The French branch of PartnerRe Europe is conducting business in and is subject to taxation in France. Thecurrent statutory rate of tax on corporate profits in France is 36.1%. See also the discussion of taxation in Irelandbelow.
Ireland
The Company’s Irish subsidiaries, PartnerRe Holdings Europe Ltd., PartnerRe Europe and PartnerReIreland Insurance Ltd, conduct business in and are subject to taxation in Ireland. Profits of an Irish trade orbusiness are subject to Irish corporation tax at the rate of 12.5%, whereas profits arising from other than a tradeor business are taxable at the rate of 25%. The U.S. subsidiaries and Swiss, French and Canadian life branches ofPartnerRe Europe are subject to taxation in Ireland at the Irish corporation tax rate of 12.5%. However, underIrish domestic tax law, the amount of tax paid in Switzerland, the U.S., France and Canada can be credited ordeducted against the Irish corporation tax. As a result, the Company does not expect to incur significant taxationin Ireland with respect to the Swiss, U.S., French and Canadian branches.
Switzerland
The Swiss branch of PartnerRe Europe is subject to Swiss taxation, mainly on profits and capital. To theextent that net profits are generated, profits are taxed at a rate of approximately 21%. The branch pays capitaltaxes at a rate of approximately 0.17% on its imputed branch capital calculated according to a procured taxationruling. See also the discussion of taxation in Ireland above.
United States
PartnerRe U.S. Corporation and its subsidiaries (collectively the PartnerRe U.S. Companies) transactbusiness in Canada and in the United States and are subject to taxation in the United States. The non-life branchof PartnerRe U.S. is also subject to taxation in Canada.
In addition, PartnerRe Europe writes certain U.S. and Latin American business in Miami, Florida, throughits reinsurance intermediaries, PartnerRe Miami Inc. (PartnerRe Miami) and PartnerRe Connecticut Inc.
29

(PartnerRe Connecticut). As a result, PartnerRe Europe is deemed to be engaged in a United States trade orbusiness and thus is subject to taxation in the United States. The current statutory rate of tax on corporate profitsin the U.S. is 35%. See the discussion of U.S. branch taxation below and the discussion of taxation in Irelandabove.
The Company does not expect that it and its subsidiaries, other than the PartnerRe U.S. Companies,PartnerRe Europe and its respective business sourced through PartnerRe Miami and PartnerRe Connecticut willbe required to pay U.S. corporate income taxes (other than withholding taxes as described below). However,because there is considerable uncertainty as to the activities that constitute a trade or business in the UnitedStates, there can be no assurance that the Internal Revenue Service (the IRS) will not contend successfully thatthe Company or its non-U.S. subsidiaries are engaged in a trade or business in the United States. The maximumfederal tax rate is currently 35% for a corporation’s income that is effectively connected with a trade or businessin the United States. In addition, U.S. branches of foreign corporations may be subject to the branch profits tax,which imposes a tax on U.S. branch after-tax earnings that are deemed repatriated out of the United States, for apotential maximum effective federal tax rate of approximately 54% on the net income connected with a U.S.trade or business.
Foreign corporations not engaged in a trade or business in the United States are subject to U.S. income tax,effected through withholding by the payer, on certain fixed or determinable annual or periodic gains, profits andincome derived from sources within the United States as enumerated in Section 881(a) of the Internal RevenueCode, such as dividends and interest on certain investments.
The United States also imposes an excise tax on insurance and reinsurance premiums paid to foreigninsurers or reinsurers with respect to risks located in the United States. The rate of tax applicable to reinsurancepremiums paid to PartnerRe Bermuda is 1% of gross premiums.
Where You Can Find More Information
The Company’s Annual Reports on Form 10-K, quarterly reports on Form 10-Q, current reports onForm 8-K, and amendments to those reports filed or furnished pursuant to Section 13(a) or 15(d) of the SecuritiesExchange Act are available free of charge through the investor information pages of its website, located athttp://www.partnerre.com. Alternatively, the public may read or copy the Company’s filings with the Securitiesand Exchange Commission (SEC) at the SEC’s Public Reference Room at 100 F Street, N.E., Room 1580,Washington, D.C. 20549. The public may obtain information on the operation of the Public Reference Room bycalling the SEC at 1-800-SEC-0330. The SEC also maintains an internet site that contains reports, proxy andinformation statements, and other information regarding issuers that file electronically with the SEC(http://www.sec.gov). None of the information on the Company’s website or on the SEC’s website isincorporated into this report except to the extent explicitly incorporated by reference in this report.
ITEM 1A. RISK FACTORS
Introduction
Current and potential investors in the Company should be aware that, as with any publicly traded company,investing in our securities carries risk. Managing risk effectively is paramount to our success, and ourorganization is built around intelligent risk assumptions and careful risk management, as evidenced by ourdevelopment of the PartnerRe risk management framework, which provides an integrated approach to risk acrossthe entire organization. We have identified what we believe reflect key significant risks to the organization, andin turn the shareholders. These risks should be read in conjunction with other Risk Factors described in moredetail below under the heading Risk Factors.
First, in order to achieve our targeted compound annual growth in diluted book value per share of 10% overthe reinsurance cycle, we believe we must be able to generate approximately 13% operating return on beginningdiluted book value per share over the reinsurance cycle. Our ability to do that over a reinsurance cycle is
30

dependent on our individual performance, but also on industry factors that impact the level of competition andthe level of cost. The level of competition is determined by supply and demand of capacity. Demand isdetermined by client buying behavior, which varies based on the client’s perception of the amount and volatilityof risk, its financial capacity to bear it and the cost of risk transfer. Supply is determined by the existingreinsurance companies’ level of financial strength and the introduction of capacity from new start-ups or capitalmarkets. Significant new capacity or significant reduction in demand will depress industry profitability until thesupply/demand balance is redressed. Extended periods of imbalance could depress industry profitability to apoint where we would fail to meet our targets.
Second, we knowingly expose ourselves to significant volatility in our quarterly and annual net income. Wecreate shareholder value by assuming risk from the insurance and capital markets. This exposes us to volatileearnings as untoward events happen to our clients and in the capital markets. Examples of potential large lossevents include, without limitation:
• Natural catastrophes such as hurricane, windstorm, flood, tornado, earthquake, etc.;
• Man-made disasters such as terrorism;
• Declines in the equity and credit markets;
• Systemic increases in the frequency or severity of casualty losses; and
• New mass tort actions or reemergence of old mass torts such as cases related to asbestosis.
We manage large loss events through evaluation processes, which are designed to enable proper pricing ofthese risks over time, but which do little to moderate short-term earnings volatility. The only effective tool todampen earnings volatility is through diversification by building a portfolio of uncorrelated risks. We do notcurrently buy significant amounts of retrocessional coverage, nor do we use significant capital market hedges ortrading strategies in the pursuit of stability in earnings.
Third, we expose ourselves to several very significant risks that are of a size that can impact our financialstrength as measured by U.S. GAAP or regulatory capital. We believe that the following can be categorized asvery significant risks:
• Catastrophe risk;
• Casualty reserving risk;
• Equity investment risk; and
• Longevity risk.
Each of these risks can accumulate to the point that they exceed a year’s worth of earnings and affect thecapital base of the Company (for further information about these risks see Risk Management in Item 1 of Part Iof this report).
We rely on our internal risk management processes, models and systems to manage these risks at thenominal exposure levels approved by the Company’s Board. However, because these models and processes mayfail, we also impose limits on our exposure to these risks.
In addition to these enumerated risks, we face numerous other strategic and operational risks that could inthe aggregate lead to shortfalls to our long-term goals or add to short-term volatility in our earnings, as describedin Risk Management in Item 1 of Part I of this report. The following review of important risk factors should notbe construed as exhaustive and should be read in conjunction with other cautionary statements that are includedherein or elsewhere. The words or phrases believe, anticipate, estimate, project, plan, expect, intend, hope,forecast, evaluate, will likely result or will continue or words or phrases of similar import generally involveforward-looking statements. As used in these Risk Factors, the terms “we”, “our” or “us” may, depending uponthe context, refer to the Company, to one or more of the Company’s consolidated subsidiaries or to all of themtaken as a whole.
31

Risk Factors
Risks Related to Our Company
The volatility of the catastrophe business that we underwrite will result in volatility of our earnings.
Catastrophe reinsurance comprised approximately 13% of our net premiums written for the year endedDecember 31, 2011 and a larger percentage of our capital at risk. Catastrophe losses result from events such aswindstorms, hurricanes, tsunamis, earthquakes, floods, hail, tornadoes, severe winter weather, fires, explosionsand other natural and man-made disasters, the incidence and severity of which are inherently unpredictable.Because catastrophe reinsurance accumulates large aggregate exposures to man-made and natural disasters, ourloss experience in this line of business could be characterized as low frequency and high severity. This is likelyto result in substantial volatility in our financial results for any fiscal quarter or year, and may create downwardpressure on the market price of our common shares and limit our ability to make dividend payments andpayments on our debt securities.
Notwithstanding our endeavors to manage our exposure to catastrophic and other large losses, the effect of asingle catastrophic event or series of events affecting one or more geographic zones, or changes in the relativefrequency or severity of catastrophic or other large loss events, could reduce our earnings and limit the fundsavailable to make payments on future claims. The effect of an increase in frequency of mid-size losses in any onereporting period affecting one or more geographic zones, such as an unusual level of hurricane activity, couldalso reduce our earnings. Should we incur more than one very large catastrophe loss, our ability to write futurebusiness may be adversely impacted if we are unable to replenish our capital.
By way of illustration, during the past five calendar years, the Company incurred the following pre-tax largecatastrophe losses, net of reinstatement premiums (in millions of U.S. dollars):
Calendar year Pre-tax large catastrophe losses
2011 . . . . . . . . . . . . . . . . . . . . . . . . . . . . . . $1,7902010 . . . . . . . . . . . . . . . . . . . . . . . . . . . . . . 4852009 . . . . . . . . . . . . . . . . . . . . . . . . . . . . . . —2008 . . . . . . . . . . . . . . . . . . . . . . . . . . . . . . 3052007 . . . . . . . . . . . . . . . . . . . . . . . . . . . . . . 50
Examples of pre-tax large catastrophe losses reflected in the illustration above include a loss in 2007 whichwas the result of one large catastrophe event and losses in 2011, 2010 and 2008 which were incurred as the resultof multiple medium and large catastrophic events. In 2011 these events included the Japan Earthquake, theFebruary and June 2011 New Zealand Earthquakes, the floods that impacted Thailand following unusually heavymonsoon rains in October 2011 (Thailand Floods), tornadoes that caused severe destruction to large areas ofsouthern, mid-western and northeastern United States in April and May 2011 (U.S. tornadoes) and the floods inQueensland, Australia (Australian Floods). In 2010, these events included the earthquake that hit Chile inFebruary 2010 (Chile Earthquake) and the New Zealand earthquake that occurred in September 2010 (2010 NewZealand Earthquake).
Loss estimates arising from earthquakes are inherently more uncertain than those from other catastrophicevents. The Company’s actual losses from the 2010 and February and June 2011 New Zealand Earthquakes maymaterially exceed the estimated losses as a result of, among other things, an increase in industry insured lossestimates, the expected lengthy claims development period, in particular for earthquake related losses, and thereceipt of additional information from cedants, brokers and loss adjusters. In addition, the Company’s lossestimate related to the Japan Earthquake is inherently more uncertain than those from other catastrophic eventsgiven the characteristics of the Company’s reinsurance portfolio in the region. Further, changes in lossassumptions for specific cedants may have a material impact on the Company’s loss estimate related to this event
32

given a significant portion of the losses are concentrated with a few large cedants. The Company believes thereremains a high degree of uncertainty regarding its loss estimates related to the 2010 and February and June 2011New Zealand Earthquakes and the Japan Earthquake and the ultimate losses arising from these events may bematerially in excess of, or less than, the amounts provided for in the Consolidated Balance Sheet at December 31,2011. Any adjustments to the Company’s preliminary estimate of its ultimate losses related to these events willbe reflected in the periods in which they are determined, which may affect the Company’s operating results infuture periods.
We believe, and recent scientific studies have indicated, that the frequency of Atlantic basin hurricanes hasincreased and may change further in the future relative to the historical experience over the past 100 years. As aresult of changing climate conditions, such as global warming, there may be increases in the frequency andseverity of natural catastrophes and the losses that result from them. We monitor and adjust, as we believeappropriate, our risk management models to reflect our judgment of how to interpret current developments andinformation, such as these studies.
We could face unanticipated losses from man-made catastrophic events and these or other unanticipatedlosses could impair our financial condition, reduce our profitability and decrease the market price of ourshares.
We may have substantial exposure to unexpected, large losses resulting from future man-made catastrophicevents, such as acts of terrorism, acts of war and political instability, or from other perils. Although we mayattempt to exclude losses from terrorism and certain other similar risks from some coverage we write, we maycontinue to have exposure to such unforeseen or unpredictable events. This may be because, irrespective of theclarity and inclusiveness of policy language, there can be no assurance that a court or arbitration panel will notlimit enforceability of policy language or otherwise issue a ruling adverse to us.
It is also difficult to predict the timing of such events with statistical certainty, or estimate the amount ofloss any given occurrence will generate. Under U.S. GAAP, we are not permitted to establish reserves forpotential losses associated with man-made or other catastrophic events until an event that may give rise to suchlosses occurs. If such an event were to occur, our reported income would decrease in the affected period. Inparticular, unforeseen large losses could reduce our profitability or impair our financial condition. See Political,regulatory, governmental and industry initiatives could adversely affect our business below for a summary ofrelevant U.S. federal initiatives regarding supply of commercial insurance coverage for certain types of terroristacts in the U.S.
The inherent uncertainty of models and the use of such models as a tool to evaluate risk may have an adverseimpact on our financial results.
In addition to our own proprietary catastrophe models, we use third party vendor analytic and modelingcapabilities to provide us with objective risk assessment relating to other risks in our reinsurance portfolio. Thesemodels help us control risk accumulation, inform management and other stakeholders of capital requirements andto improve the risk/return profile or minimize the amount of capital required to cover the risks in eachreinsurance contract in our overall portfolio of reinsurance contracts. However, given the inherent uncertainty ofmodeling techniques and the application of such techniques, these models and databases may not accuratelyaddress the emergence of a variety of matters which might be deemed to impact certain of our coverages.Accordingly, these models may understate the exposures we are assuming and our financial results may beadversely impacted, perhaps significantly.
If actual losses exceed our estimated loss reserves, our net income and capital position will be reduced.
Our success depends upon our ability to accurately assess the risks associated with the businesses that wereinsure. We establish loss reserves to cover our estimated liability for the payment of all losses and lossexpenses incurred with respect to premiums earned on the contracts that we write. Loss reserves are estimatesinvolving actuarial and statistical projections at a given time to reflect our expectation of the costs of the ultimate
33

settlement and administration of claims. Losses for casualty and liability lines often take a long time to bereported, and frequently can be impacted by lengthy, unpredictable litigation and by the inflation of loss costsover time. As a consequence, actual losses and loss expenses paid may deviate substantially from the reserveestimates reflected in our financial statements.
Although we did not operate prior to 1993, we assumed certain asbestos and environmental exposuresthrough our acquisitions. Our reserves for losses and loss expenses include an estimate of our ultimate liabilityfor asbestos and environmental claims for which we cannot estimate the ultimate value using traditionalreserving techniques, and for which there are significant uncertainties in estimating the amount of our potentiallosses. Certain of our subsidiaries have received and continue to receive notices of potential reinsurance claimsfrom ceding insurance companies, which have in turn received claims asserting asbestos and environmentallosses under primary insurance policies, in part reinsured by us. Such claims notices are often precautionary innature and are generally unspecific, and the primary insurers often do not attempt to quantify the amount, timingor nature of the exposure. Given the lack of specificity in some of these notices, and the legal and tortenvironment that affects the development of claims reserves, the uncertainties inherent in valuing asbestos andenvironmental claims are not likely to be resolved in the near future. In addition, the reserves that we haveestablished may be inadequate. If ultimate losses and loss expenses exceed the reserves currently established, wewill be required to increase loss reserves in the period in which we identify the deficiency to cover any suchclaims.
As a result, even when losses are identified and reserves are established for any line of business, ultimatelosses and loss expenses (that is, the administrative costs of managing and settling claims) may deviate, perhapssubstantially, from estimates reflected in loss reserves in our financial statements. Variations between our lossreserve estimates and actual emergence of losses could be material and could have a material adverse effect onour results of operations and financial condition.
Since we rely on a few reinsurance brokers for a large percentage of our business, loss of business provided bythese brokers could reduce our premium volume and net income.
We produce our business both through brokers and through direct relationships with insurance companyclients. For the year ended December 31, 2011, approximately 72% of our gross premiums written wereproduced through brokers. In 2011, we had two brokers that accounted for 47% of our gross premiums written.Because broker-produced business is concentrated with a small number of brokers, we are exposed toconcentration risk. A significant reduction in the business produced by these brokers could potentially reduce ourpremium volume and net income.
We are exposed to credit risk relating to our reinsurance brokers and cedants.
In accordance with industry practice, we may pay amounts owed under our policies to brokers, and they inturn pay these amounts to the ceding insurer. In some jurisdictions, if the broker fails to make such an onwardpayment, we might remain liable to the ceding insurer for the deficiency. Conversely, the ceding insurer may paypremiums to the broker, for onward payment to us in respect of reinsurance policies issued by us. In certainjurisdictions, these premiums are considered to have been paid to us at the time that payment is made to thebroker, and the ceding insurer will no longer be liable to us for those amounts, whether or not we have actuallyreceived the premiums. We may not be able to collect all premiums receivable due from any particular broker atany given time. We also assume credit risk by writing business on a funds withheld basis. Under sucharrangements, the cedant retains the premium they would otherwise pay to us to cover future loss payments.
If we are significantly downgraded by rating agencies, our standing with brokers and customers could benegatively impacted and may adversely impact our results of operations.
Third party rating agencies assess and rate the claims paying ability and financial strength of insurers andreinsurers, such as the Company’s principal operating subsidiaries. These ratings are based upon criteriaestablished by the rating agencies and have become an important factor in establishing our competitive position
34

in the market. They are not an evaluation directed to investors in our common shares, preferred shares or debtsecurities, and are not a recommendation to buy, sell or hold our common shares, preferred shares or debtsecurities. Rating agencies may downgrade or withdraw their ratings at their sole discretion.
Our current financial strength ratings are:
Standard & Poor’s . . . . . . . . . . . . . . . . . . . . . . . . . . . . . . . . . . . . . A+Moody’s . . . . . . . . . . . . . . . . . . . . . . . . . . . . . . . . . . . . . . . . . . . . . A1A.M. Best . . . . . . . . . . . . . . . . . . . . . . . . . . . . . . . . . . . . . . . . . . . . A+Fitch . . . . . . . . . . . . . . . . . . . . . . . . . . . . . . . . . . . . . . . . . . . . . . . . AA-
On January 24, 2012, A.M. Best placed the Company’s A+ rating under review with negative implications.
If our ratings were significantly downgraded, our competitive position in the reinsurance industry maysuffer, and it could result in a reduction in demand for our products. In addition, certain business that we writecontains terms that give the ceding company or derivative counterparty the right to terminate cover and/or requirecollateral if our ratings are downgraded significantly.
We may require additional capital in the future, which may not be available or may only be available onunfavorable terms.
Our future capital requirements depend on many factors, including our ability to write new businesssuccessfully, the frequency and severity of catastrophic events, and our ability to establish premium rates andreserves at levels sufficient to cover losses. We may need to raise additional funds through financings or curtailour growth and reduce our assets. Any equity or debt financing, if available at all, may be on terms that are notfavorable to us. Equity financings could be dilutive to our existing shareholders and could result in the issuanceof securities that have rights, preferences and privileges that are senior to those of our other securities. Financialmarkets in the U.S., Europe and elsewhere have experienced extreme volatility and disruption in recent times,resulting in part from financial stresses affecting the liquidity of the banking system. Continued disruption in thefinancial markets may limit our ability to access capital required to operate our business and we may be forced todelay raising capital or bear a higher cost of capital, which could decrease our profitability and significantlyreduce our financial flexibility. In addition, if we experience a credit rating downgrade, withdrawal or negativewatch/outlook in the future, we could incur higher borrowing costs and may have more limited means to accesscapital. If we cannot obtain adequate capital on favorable terms or at all, our business, operating results andfinancial condition could be adversely affected.
The exposure of our investments to interest rate, credit and equity risks may limit our net income and mayaffect the adequacy of our capital.
We invest the net premiums we receive unless and until such time as we pay out losses and/or until they aremade available for distribution to shareholders and /or otherwise used for general corporate purposes. Investmentresults comprise a substantial portion of our income. For the year ended December 31, 2011, we had netinvestment income of $629 million, which represented approximately 12% of total revenues. In addition, werecorded realized and unrealized gains on investments during 2011, and we record all realized and unrealizedgains or losses through net income. While the Board has implemented what it believes to be prudent riskmanagement and investment asset allocation practices, we are exposed to significant financial and capital marketrisks, including changes in interest rates, credit spreads, equity prices, foreign exchange rates, market volatility,the performance of the economy in general and other factors outside our control.
Interest rates are highly sensitive to many factors, including fiscal and monetary policies of majoreconomies, economic and political conditions and other factors outside our control. Changes in interest rates cannegatively affect us in two ways. In a declining interest rate environment, we will be required to invest our fundsat lower rates, which would have a negative impact on investment income. In a rising interest rate environment,the market value of our fixed income portfolio may decline.
35

Our fixed income portfolio is primarily invested in high quality, investment grade securities. However, weinvest a portion of the portfolio in securities that are below investment grade, including high yield fixed incomeinvestments and convertible fixed income investments. We also invest a portion of our portfolio in otherinvestments such as fixed income type mutual funds, notes receivable, loans receivable, private placement bondinvestments, derivative exposure assumed and other specialty asset classes. These securities generally pay ahigher rate of interest and have a higher degree of credit or default risk. These securities may also be less liquidin times of economic weakness or market disruptions.
We invest a portion of our portfolio in preferred and common stocks or equity-like securities. The value ofthese assets fluctuates with equity markets. In times of economic weakness, the market value and liquidity ofthese assets may decline, and may impact net income and capital.
We use the term equity-like investments to describe our investments that have market risk characteristicssimilar to equities and are not investment grade fixed income securities. This category includes high yield andconvertible fixed income investments and private placement equity investments. Fluctuations in the fair value ofour equity-like investments may reduce our income in any period or year and cause a reduction in our capital.
Foreign currency fluctuations may reduce our net income and our capital levels.
Through our multinational reinsurance operations, we conduct business in a variety of foreign (non-U.S.)currencies, the principal exposures being the euro, Canadian dollar, British pound, New Zealand dollar, JapaneseYen and Australian dollar. Assets and liabilities denominated in foreign currencies are exposed to changes incurrency exchange rates. Our reporting currency is the U.S. dollar, and exchange rate fluctuations relative to theU.S. dollar may materially impact our results and financial position. We employ various strategies (includinghedging) to manage our exposure to foreign currency exchange risk. To the extent that these exposures are notfully hedged or the hedges are ineffective, our results or equity may be reduced by fluctuations in foreigncurrency exchange rates.
The current state of the global economy and capital markets increases the possibility of adverse effects on ourfinancial position and results of operations. Economic downturns could impair our investment portfolio andaffect the primary insurance market, which could, in turn, harm our operating results and reduce our volumeof new business.
Global capital markets in the United States and Europe continue to experience volatility and certaineconomies remain in recession. Disruptions in the global capital markets increased the spread between the yieldsrealized on risk-free and higher risk securities. Credit spreads increased in 2011 and illiquidity remains in certainparts of the debt capital markets. The longer this economic dislocation persists, the greater the probability thatthese risks could have an adverse effect on our financial results. This may be evidenced in several waysincluding, but not limited to, a potential reduction in our premium income, financial losses in our investmentportfolio and decreases in revenue and net income.
Unfavorable economic conditions also could increase our funding costs, limit our access to the capitalmarkets or result in a decision by lenders not to extend credit to us. These events could prevent us fromincreasing our underwriting activities and negatively impact our operating results. In addition, our cedants andother counterparties may be affected by such developments in the financial markets, which could adversely affecttheir ability to meet their obligations to us.
We have exposure to the European sovereign debt crisis which could have a negative impact on ourinvestment assets.
In 2011, the global economy experienced extreme uncertainty as a result of the European sovereign debtcrisis. Initial worries about the sustainability of the sovereign debt of peripheral European countries as a result ofsignificant economic, fiscal and/or political strains experienced in 2010 have now extended to larger European
36

economies. The sovereign debt crisis has resulted in European financial restructuring efforts. The impact of theseefforts is unclear, however, they may cause a further deterioration in the value of the euro and consequentlyexacerbating instability in global credit markets, and increased credit concerns resulting in the widening of bondyield spreads. In addition, recent rating agency downgrades on European sovereign debt and a growing concernof the potential default of government issuers or of a possible disorganized break-up of the European Union hascontributed to this uncertainty. The impact of these developments, while potentially severe, remains extremelydifficult to predict. However, should European governments default on their obligations, there will be a negativeimpact on government and non-government issued bonds, government guaranteed corporate bonds and bondsand equities issued by financial institutions and financials held within the country of default which in turn couldadversely impact Euro-denominated assets held in our investment portfolio.
We may suffer losses due to defaults by others, including issuers of investment securities, reinsurance andderivative counterparties.
Issuers or borrowers whose securities we hold, reinsurers, clearing agents, clearing houses and otherfinancial intermediaries may default on their obligations to us due to bankruptcy, insolvency, lack of liquidity,adverse economic conditions, fraud or other reasons. Our investment portfolio may include investment securitiesin the financial services sector that have recently experienced defaults. All or any of these types of default couldhave a material adverse effect on our results of operations, financial condition and liquidity.
We may be adversely affected if Colisée Re, AXA or their affiliates fail to honor their obligations to Paris Reor its clients.
As part of the AXA Acquisition, Paris Re entered into the 2006 Acquisition Agreements. See Business—Reserves—Non-life Reserves—Reserve Agreement in Item 1 of Part I of this report.
Pursuant to the Quota Share Retrocession Agreement, the benefits and risks of Colisée Re’s reinsuranceagreements were ceded to Paris Re France (now PartnerRe Europe), but Colisée Re remains both the legalcounterparty for all such reinsurance contracts and the legal holder of the assets relating to such reserves.
Under the Run Off Services and Management Agreement, Paris Re France (now PartnerRe Europe) hasagreed that AXA LM will manage claims arising from all reinsurance and retrocession contracts subject to theReserve Agreement. If AXA LM does not take into account Paris Re France’s commercial concerns in thecontext of Paris Re France’s on-going business relations with the relevant ceding companies andretrocessionaires, our ability to renew reinsurance and retrocession contracts with them may be adverselyaffected.
There can be no assurance that our business activities, financial condition, results or future prospects maynot be adversely affected in spite of the existence of the 2006 Acquisition Agreements. In general, if AXA or itsaffiliates breach or do not satisfy their obligations under the 2006 Acquisition Agreements (potentially as a resultof insolvency or inability or unwillingness to make payments under the terms of the 2006 AcquisitionAgreements), we could be materially adversely affected.
Our debt, credit and International Swap Dealers Association (ISDA) agreements may limit our financial andoperational flexibility, which may affect our ability to conduct our business.
We have incurred indebtedness, and may incur additional indebtedness in the future. Additionally, we haveentered into credit facilities and ISDA agreements with various institutions. Under these credit facilities, theinstitutions provide revolving lines of credit to us and our major operating subsidiaries and issue letters of creditto our clients in the ordinary course of business.
37

The agreements relating to our debt, credit facilities and ISDA agreements contain various covenants thatmay limit our ability, among other things, to borrow money, make particular types of investments or otherrestricted payments, sell assets, merge or consolidate. Some of these agreements also require us to maintainspecified ratings and financial ratios, including a minimum net worth covenant. If we fail to comply with thesecovenants or meet required financial ratios, the lenders or counterparties under these agreements could declare adefault and demand immediate repayment of all amounts owed to them.
If we are in default under the terms of these agreements, then we would also be restricted in our ability todeclare or pay any dividends, redeem, purchase or acquire any shares or make a liquidation payment.
If any one of the financial institutions that we use in our operations, including those that participate in ourcredit facilities, fails or is otherwise unable to meet their commitments, we could incur substantial losses andreduced liquidity.
We maintain cash balances significantly in excess of the U.S. Federal Deposit Insurance Corporationinsurance limits at various depository institutions. We also have funding commitments from a number of banksand financial institutions that participate in our credit facilities. See Item 7—Management’s Discussion andAnalysis of Financial Condition and Results of Operations—Credit Facilities. Access to funds under theseexisting credit facilities is dependent on the ability of the banks that are parties to the facilities to meet theirfunding requirements. Those banks may not be able to meet their funding requirements if they experienceshortages of capital and liquidity or if they experience excessive volumes of borrowing requests within a shortperiod of time, and we might be forced to replace credit sources in a difficult market. There have also been recentconsolidations in the banking industry which could lead to increased reliance on and exposure to a limitednumber of institutions. If we cannot obtain adequate financing or sources of credit on favorable terms, or at all,our business, operating results and financial condition could be adversely impacted.
Changes in current accounting practices and future pronouncements may materially impact our reportedfinancial results.
Developments in accounting practices, for example a convergence of U.S. GAAP with InternationalFinancial Reporting Standards (IFRS), may require considerable additional expense to comply, particularly if weare required to prepare information relating to prior periods for comparative purposes or to apply the newrequirements retroactively. The impact of changes in current accounting practices and future pronouncementscannot be predicted and may be significant. The impact may affect the results of our operations, including amongother things, the calculation of net income, and may affect our financial position, including among other things,the calculation of unpaid losses and loss expenses, policy benefits for life and annuity contracts and totalshareholders’ equity.
Operational risks, including human or systems failures, are inherent in our business.
Operational risks and losses can result from many sources including fraud, errors by employees, failure todocument transactions properly or to obtain proper internal authorization, failure to comply with regulatoryrequirements or information technology failures.
We believe our modeling, underwriting and information technology and application systems are critical toour business and reputation. Moreover, our technology and applications have been an important part of ourunderwriting process and our ability to compete successfully. Such technology is and will continue to be a veryimportant part of our underwriting process. We have also licensed certain systems and data from third parties.We cannot be certain that we will have access to these, or comparable service providers, or that our technology orapplications will continue to operate as intended. In addition, we cannot be certain that we would be able toreplace these service providers or consultants without slowing our underwriting response time. A major defect orfailure in our internal controls or information technology and application systems could result in managementdistraction, harm to our reputation, a loss or delay of revenues or increased expense.
38

The loss of key executive officers could adversely affect us.
Our success has depended, and will continue to depend, partly upon our ability to attract and retainexecutive officers. If any of these executives ceased to continue in his or her present role, we could be adverselyaffected.
We believe there are only a limited number of available qualified executives in the business lines in whichwe compete. Our ability to execute our business strategy is dependent on our ability to attract and retain a staff ofqualified executive officers, underwriters and other key personnel. The skills, experience and knowledge of thereinsurance industry of our management team constitute important competitive strengths. If some or all of thesemanagers leave their positions, and even if we were able to find persons with suitable skills to replace them, ouroperations could be adversely affected.
Risks Related to Our Industry
Our profitability is affected by the cyclical nature of the reinsurance industry.
Historically, the reinsurance industry has experienced significant fluctuations in operating results due tocompetition, levels of available capacity, trends in cash flows and losses, general economic conditions and otherfactors. Demand for reinsurance is influenced significantly by underwriting results of primary insurers, includingcatastrophe losses, and prevailing general economic conditions. The supply of reinsurance is related directly toprevailing prices and levels of capacity that, in turn, may fluctuate in response to changes in rates of return oninvestments being realized in the reinsurance industry. If any of these factors were to result in a decline in thedemand for reinsurance or an overall increase in reinsurance capacity, our profitability could be impacted. Inrecent years, we have experienced a generally softening market cycle, with increased competition, surplusunderwriting capacity, deteriorating rates and less favorable terms and conditions all having an impact on ourability to write business.
We operate in a highly competitive environment.
The reinsurance industry is highly competitive and we compete with a number of worldwide reinsurancecompanies, including, but not limited to, Munich Re, Swiss Re, Everest Re, Hannover Re, SCOR, Transatlanticand reinsurance operations of certain primary insurance companies, such as Arch Capital, Axis Capital and XLGroup. Competition in the types of reinsurance that we underwrite is based on many factors, including theperceived financial strength of the reinsurer, pricing, terms and conditions offered, services provided, ratingsassigned by independent rating agencies, speed of claims payment and experience in the lines of reinsurance tobe written. If competitive pressures reduce our prices, we would expect to write less business. In addition,competition for customers would become more intense and we could incur additional expenses relating tocustomer acquisition and retention, further reducing our operating margins.
Further, insurance-linked securities and derivative and other non-traditional risk transfer mechanisms andvehicles are being developed and offered by other parties, which could impact the demand for traditionalinsurance or reinsurance. A number of new, proposed or potential industry or legislative developments couldfurther increase competition in our industry. New competition from these developments could cause the demandfor insurance or reinsurance to fall or the expense of customer acquisition and retention to increase, either ofwhich could have a material adverse affect on our growth and profitability.
Legal and Regulatory Risks
Political, regulatory, governmental and industry initiatives could adversely affect our business.
Our reinsurance operations are subject to extensive laws and regulations that are administered and enforcedby a number of different governmental and non-governmental self-regulatory authorities and associations in each
39

of their respective jurisdictions and internationally. As a result of the current financial crisis, some of theseauthorities regularly consider enhanced or new regulatory requirements intended to prevent future crises orotherwise assure the stability of institutions under their supervision. These authorities may also seek to exercisetheir supervisory authority in new and more robust ways, and new regulators could become authorized to overseeparts of our business. For example, the European Union’s Solvency II initiative and the NAIC’s SolvencyModernization Initiative include meaningful changes in consolidated supervision and corporate governancerequirements as they apply to insurance and reinsurance corporate groups, which could lead to increases inregulatory capital requirements, reduced operational flexibility and increased compliance costs. In addition, theInternational Association of Insurance Supervisors (IAIS) has recently introduced a concept paper promoting acommon framework for the supervision of internationally active insurance groups (IAIGs). Through the commonframework, the IAIS aims to: (i) develop methods of operating group-wide supervision of IAIGs, (ii) establish acomprehensive framework for supervisors to address group-wide activities and risks and also set grounds forbetter supervisory cooperation, and (iii) foster global convergence of regulatory and supervisory measures andapproaches. It is not possible to predict all future impacts of these types of changes but they could affect the waywe conduct our business and manage our capital, and may require us to satisfy increased capital requirements,any of which, in turn, could affect our results of operations, financial condition and liquidity. Our materialsubsidiaries’ regulatory environments are described in detail under the heading Business — Regulation.Regulations relating to each of our material subsidiaries may in effect restrict each of those subsidiaries’ abilityto write new business, to make certain investments and to distribute funds or assets to us.
Recent government intervention and the possibility of future government intervention have createduncertainty in the insurance and reinsurance markets. Government regulators are generally concerned with theprotection of policyholders to the exclusion of others, including shareholders of reinsurers. In light of the currentfinancial crisis, we believe it is likely there will be increased regulation of, and other forms of governmentparticipation in, our industry in the future, which could adversely affect our business by, among other things:
• Providing reinsurance capacity in markets and to clients that we target or requiring our participation inindustry pools and guaranty associations;
• Further restricting our operational or capital flexibility;
• Expanding the scope of coverage under existing policies;
• Regulating the terms of reinsurance policies; or
• Disproportionately benefiting the companies domiciled in one country over those domiciled in another.
Such a U.S. federal initiative was put forward in response to the tightening of supply in certain insuranceand reinsurance markets resulting from, among other things, the September 11th tragedy, and consequently theTerrorism Risk Insurance Act of 2002 (TRIA) was enacted to ensure the availability of commercial insurancecoverage for certain types of terrorist acts in the U.S. In December 2007, the Terrorism Risk Insurance ProgramReauthorization Act (TRIPRA) was enacted, which further renewed TRIA for another 7 years endingDecember 31, 2014.
Such a state initiative in the U.S. was put forward by the Florida Legislature in response to the tightening ofsupply in certain insurance and reinsurance markets in Florida resulting from, among other things, hurricanedamage in Florida, which enacted the Hurricane Preparedness and Insurance Act to ensure the availability ofcatastrophe insurance coverage for catastrophes in the state of Florida. More recent legislative proposals wouldlimit the reinsurance coverage available from the Florida Hurricane Catastrophe Fund and limit exposure toassessments from the state-run Citizens Property Insurance Company.
The insurance industry is also affected by political, judicial and legal developments that may create new andexpanded theories of liability, which may result in unexpected claim frequency and severity and delays orcancellations of products and services we provide, which could adversely affect our business.
40

We are unable to predict the effect that governmental actions for the purpose of stabilizing the financialmarkets will have on such markets generally or on the Company in particular.
In response to the financial crisis affecting the banking system and financial markets, the U.S. federalgovernment, the European Central Bank and other governmental and regulatory bodies have taken or areconsidering taking other actions to address the governance of those industries that are viewed as presenting asystemic risk to economic stability. Such actions include the International Monetary Fund’s proposal to levy afinancial stability tax on all financial institutions, the proposals for enhanced regulation and supervisioncontained in the recently published Organization for Economic Co-operation and Development paper on theimpact of the financial crisis on the Insurance sector and the financial regulatory reform provisions containedwithin the Dodd-Frank Wall Street Reform and Consumer Protection Act of 2010. We are unable to predict theeffect that the enactment of any such proposals will have on the financial markets generally or on the Company’scompetitive position, business and financial condition in particular, though we are monitoring these and similarproposals as they evolve.
The Dodd-Frank Act may adversely impact our business.
The U.S. Congress and the current administration have made, or called for consideration of, severaladditional proposals relating to a variety of issues with respect to financial regulation reform, includingregulation of the over-the-counter derivatives market, the establishment of a single-state system of licensure forU.S. and foreign reinsurers, further regulation of executive compensation and others. One of those initiatives, theDodd-Frank Act, was signed into law by President Obama on July 21, 2010. The Dodd-Frank Act represents acomprehensive overhaul of the financial services industry within the United States and establishes a FederalInsurance Office under the U.S. Treasury Department to monitor all aspects of the insurance industry. Thedirector of the Federal Insurance Office will have the ability to recommend that an insurance company or aninsurance holding company be subject to heightened prudential standards. Compliance with these new laws andregulations may result in additional costs which may adversely impact our results of operations, financialcondition and liquidity. However, at this time, it is not possible to predict with any degree of certainty whetherany other proposed legislation, rules or regulatory changes will be adopted or what impact, if any, the Dodd-Frank Act or any other such legislation, rules or changes could have on our business, financial condition orresults of operations.
Solvency II could adversely impact our financial results and operations.
Solvency II, a European Union directive concerning the capital adequacy, risk management and regulatoryreporting for insurers, which was adopted by the European Parliament and the European Council in April of2009, may adversely affect our reinsurance businesses. A bifurcated implementation of Solvency II by theEuropean Commission is expected to take effect January 1, 2013 and 2014 in the European Union MemberStates, and will replace the current solvency requirements. Solvency II adopts a risk-based approach to insuranceregulation. Its principal goals are to improve the correlation between capital and risk, effect group supervision ofinsurance and reinsurance affiliates, implement a uniform capital adequacy structure for insurers across theEuropean Union Member States, establish consistent corporate governance standards for insurance andreinsurance companies, and establish transparency through standard reporting of insurance operations.Implementation of Solvency II will require us to utilize a significant amount of resources to ensure compliance.In addition, the measures implementing Solvency II are currently subject to a consultation process and are notexpected to be finalized until 2012; consequently, our implementation plans are based on our currentunderstanding of the Solvency II requirements, which may change. The European Union is in the process ofconsidering the Solvency II equivalence of Bermuda’s insurance regulatory and supervisory regime. TheEuropean Union equivalence assessment considers whether Bermuda’s regulatory regime provides a similar levelof policyholder protection as provided under Solvency II. A finding that Bermuda’s insurance regulatory regimeis not equivalent to the European Union’s Solvency II could have an adverse effect on the cost of PartnerReBermuda’s European business due to the potential to have to post collateral. It would not affect PartnerRe
41

Europe’s ability to operate in Europe. Such a finding could also have adverse indirect commercial impacts on ouroperations. We are monitoring the ongoing legislative and regulatory steps following adoption of Solvency II.The principles, standards and requirements of Solvency II may also, directly or indirectly, impact the futuresupervision of additional operating subsidiaries of ours.
Legal and enforcement activities relating to the insurance industry could affect our business and our industry.
The insurance industry has experienced substantial volatility as a result of litigation, investigations andregulatory activity by various insurance, governmental and enforcement authorities concerning certain practiceswithin the insurance industry. These practices include the accounting treatment for finite reinsurance or othernon-traditional or loss mitigation insurance and reinsurance products.
These investigations have resulted in changes in the insurance and reinsurance markets and industrybusiness practices. While at this time, none of these changes have caused an adverse effect on our business, weare unable to predict the potential effects, if any, that future investigations may have upon our industry.
Emerging claim and coverage issues could adversely affect our business.
Unanticipated developments in the law, as well as changes in social and environmental conditions couldpotentially result in unexpected claims for coverage under our insurance, reinsurance and other contracts. Thesedevelopments and changes may adversely affect our business by either extending coverage beyond ourunderwriting intent or by increasing the number or size of claims. With respect to our casualty businesses, theselegal, social and environmental changes may not become apparent until sometime after their occurrence. Ourexposure to these uncertainties could be exacerbated by an increase in insurance and reinsurance contractdisputes, arbitration and litigation.
The full effects of these and other unforeseen emerging claim and coverage issues are extremely hard topredict. As a result, the full extent of our liability under our coverages, and in particular, our casualty reinsurancecontracts, may not be known for many years after a contract is issued.
The insurance industry is also affected by political, judicial and legal developments that may create new andexpanded theories of liability, which may result in unexpected claim frequency and severity and delays orcancellations of products and services we provide, which could adversely affect our business.
Investors may encounter difficulties in service of process and enforcement of judgments against us in theUnited States.
We are a Bermuda company and some of our directors and officers are residents of various jurisdictionsoutside the United States. All, or a substantial portion, of the assets of our officers and directors and of our assetsare or may be located in jurisdictions outside the United States. Although we have appointed an agent andirrevocably agreed that the agent may be served with process in New York with respect to actions against usarising out of violations of the United States Federal securities laws in any Federal or state court in the UnitedStates, it could be difficult for investors to effect service of process within the United States on our directors andofficers who reside outside the United States. It could also be difficult for investors to enforce against us or ourdirectors and officers judgments of a United States court predicated upon civil liability provisions of UnitedStates Federal securities laws.
There is no treaty in force between the United States and Bermuda providing for the reciprocal recognitionand enforcement of judgments in civil and commercial matters. As a result, whether a United States judgmentwould be enforceable in Bermuda against us or our directors and officers depends on whether the United Statescourt that entered the judgment is recognized by the Bermuda court as having jurisdiction over us or our directorsand officers, as determined by reference to Bermuda conflict of law rules. A judgment debt from a United States
42

court that is final and for a sum certain based on United States Federal securities laws will not be enforceable inBermuda unless the judgment debtor had submitted to the jurisdiction of the United States court, and the issue ofsubmission and jurisdiction is a matter of Bermuda law and not United States law.
In addition to and irrespective of jurisdictional issues, Bermuda courts will not enforce a United StatesFederal securities law that is either penal or contrary to public policy. An action brought pursuant to a public orpenal law, the purpose of which is the enforcement of a sanction, power or right at the instance of the state in itssovereign capacity will not be entered by a Bermuda court. Certain remedies available under the laws of UnitedStates jurisdictions, including certain remedies under United States Federal securities laws, would not beavailable under Bermuda law or enforceable in a Bermuda court, as they would be contrary to Bermuda publicpolicy. Further, no claim can be brought in Bermuda against us or our directors and officers in the first instancefor violation of United States Federal securities laws because these laws have no extra jurisdictional effect underBermuda law and do not have force of law in Bermuda. A Bermuda court may, however, impose civil liability onus or our directors and officers if the facts alleged in a complaint constitute or give rise to a cause of action underBermuda law.
Risks Related to Our Common Shares
We are a holding company, and if our subsidiaries do not make dividend and other payments to us, we maynot be able to pay dividends or make payments on our common and preferred shares and other obligations.
We are a holding company with no operations or significant assets other than the capital stock of oursubsidiaries and other intercompany balances. We have cash outflows in the form of operating expenses,dividends to both common and preferred shareholders and, from time to time, cash outflows for the repurchase ofcommon shares under our share repurchase program. We rely primarily on cash dividends and payments fromour subsidiaries to meet our cash outflows. We expect future dividends and other permitted payments from oursubsidiaries to be the principal source of funds to pay expenses and dividends. The payment of dividends by ourreinsurance subsidiaries is limited under Bermuda and Irish laws and certain statutes of various U.S. states inwhich our U.S. subsidiaries are licensed to transact business. As of December 31, 2011, there were no significantrestrictions on the payment of dividends by the Company’s subsidiaries that would limit the Company’s ability topay common and preferred shareholders’ dividends and its corporate expenses.
Because we are a holding company, our right, and hence the right of our creditors and shareholders, toparticipate in any distribution of assets of any subsidiary of ours, upon our liquidation or reorganization orotherwise, is subject to the prior claims of policyholders and creditors of these subsidiaries.
Provisions in our bye-laws may restrict the voting rights of our shares and may restrict the transferability ofour shares.
Our bye-laws generally provide that if any person owns, directly, indirectly or by attribution, more than9.9% of the total combined voting power of our shares entitled to vote, the voting rights attached to such shareswill be reduced so that such person may not exercise and is not attributed more than 9.9% of the total combinedvoting power. In addition, our board of directors may limit a shareholder’s exercise of voting rights where itdeems it necessary to do so to avoid non-de minimis adverse tax, legal or regulatory consequences to us, any ofour subsidiaries or any of our shareholders.
Under our bye-laws, subject to waiver by our board of directors, no transfer of our shares is permitted ifsuch transfer would result in a shareholder controlling more than 9.9% determined by value or by voting powerof our outstanding shares. Our bye-laws also provide that if our board of directors determines that shareownership by a person may result in (i) shareholder owning directly, indirectly or by retribution, more than 9.9%of the total combined voting power of our shares entitled to vote, or (ii) any non-de minimis adverse tax, legal or
43

regulatory consequences to us, any of our subsidiaries or any of our shareholders, then we have the option, butnot the obligation, to require that shareholder to sell to us for fair market value the minimum number of sharesheld by such person which is necessary so that after such purchase such shareholder will not own more than 9.9%of the total combined voting power, or is necessary to eliminate the non-de minimis adverse tax, legal orregulatory consequences.
We also have the authority under our bye-laws to request information from any shareholder for the purposeof determining whether a shareholder’s voting rights are to be limited pursuant to our bye-laws. If a shareholderfails to timely respond to our request for information or submits incomplete or inaccurate information in responseto a request by us, we may, in our sole discretion, eliminate or reduce the shareholder’s voting rights.
Taxation Risks
If our non-U.S. operations become subject to U.S. income taxation, our net income will decrease.
We believe that we and our non-U.S. subsidiaries (other than business sourced by PartnerRe Europe throughPartnerRe Miami and PartnerRe Connecticut) have operated, and will continue to operate, our respectivebusinesses in a manner that will not cause us to be viewed as engaged in a trade or business in the United Statesand, on this basis, we do not expect that either we or our non-U.S. subsidiaries will be required to pay U.S.corporate income taxes (other than potential withholding taxes on certain types of U.S.-source passive income).Because there is considerable uncertainty as to the activities that constitute being engaged in a trade or businesswithin the United States, the IRS may contend that either we or our non-U.S. subsidiaries are engaged in a tradeor business in the United States. If either we or our non-U.S. subsidiaries are subject to U.S. income tax, ourshareholders’ equity and net income will be reduced by the amount of such taxes, which might be material.
PartnerRe U.S. Corporation and its subsidiaries conduct business in the United States, and are subject toU.S. corporate income taxes.
The impact of Bermuda’s letter of commitment to the Organization for Economic Cooperation andDevelopment to eliminate harmful tax practices is uncertain and could adversely affect our tax status inBermuda.
The Organization for Economic Cooperation and Development (OECD) has published reports and launcheda global initiative among member and non-member countries on measures to limit harmful tax competition.These measures are largely directed at counteracting the effects of tax havens and preferential tax regimes incountries around the world. Bermuda was not listed in the most recent report as an uncooperative tax haven
44

jurisdiction because it had previously committed to eliminate harmful tax practices, to embrace international taxstandards for transparency, to exchange information and to eliminate an environment that attracts business withno substantial domestic activity. We are not able to predict what changes will arise from the commitment orwhether such changes will subject us to additional taxes.
If proposed U.S. legislation is passed, our U.S. reinsurance subsidiary may be subject to higher U.S. taxationand our net income would decrease.
Currently, our U.S. reinsurance subsidiary retrocedes or may retrocede a portion of its U.S. business to ournon-U.S. reinsurance subsidiaries and is generally entitled to deductions for premiums paid for suchretrocessions. Proposed legislation has been introduced that if enacted would impose a limitation on suchdeductions, which could result in increased U.S. tax on this business and decreased net income. It is not possibleto predict whether this or similar legislation may be enacted in the future.
ITEM 1B. UNRESOLVED STAFF COMMENTS
None.
ITEM 2. PROPERTIES
The Company leases office space in Hamilton (Bermuda) where the Company’s principal executive officesare located. Additionally, the Company leases office space in various locations, including Beijing, Dublin,Greenwich (Connecticut), Hong Kong, Mexico City, Miami, Montreal, New York, Paris, Santiago, Sao Paulo,Seoul, Singapore, Tokyo, Toronto, Washington, D.C., Zug and Zurich.
ITEM 3. LEGAL PROCEEDINGS
Litigation
The Company’s reinsurance subsidiaries, and the insurance and reinsurance industry in general, are subjectto litigation and arbitration in the normal course of their business operations. In addition to claims litigation, theCompany and its subsidiaries may be subject to lawsuits and regulatory actions in the normal course of businessthat do not arise from or directly relate to claims on reinsurance treaties. This category of business litigationtypically involves, among other things, allegations of underwriting errors or misconduct, employment claims orregulatory activity. While the outcome of business litigation cannot be predicted with certainty, the Companywill dispute all allegations against the Company and/or its subsidiaries that Management believes are withoutmerit.
As of December 31, 2011, the Company was not a party to any litigation or arbitration that it believes couldhave a material effect on the financial condition, results of operations or liquidity of the Company.
ITEM 4. MINE SAFETY DISCLOSURES
Not applicable.
45

PART II
ITEM 5. MARKET FOR REGISTRANT’S COMMON EQUITY, RELATED STOCKHOLDERMATTERS AND ISSUER PURCHASES OF EQUITY SECURITIES
The Company has the following securities (with their related symbols) traded on the New York StockExchange (NYSE):
Common shares . . . . . . . . . . . . . . . . . . . . . . . . . . . . . . . . . . . PRE6.75% Series C cumulative preferred shares . . . . . . . . . . . . . PRE-PrC6.50% Series D cumulative preferred shares . . . . . . . . . . . . . PRE-PrD7.25% Series E cumulative preferred shares . . . . . . . . . . . . . PRE-PrE
The Company’s common shares are also traded on the NYSE Euronext Paris exchange and Bermuda StockExchange under the symbol PRE.
As of February 17, 2012, the approximate number of common shareholders was 69,088.
The following table provides information about purchases by the Company during the quarter endedDecember 31, 2011, of equity securities that are registered by the Company pursuant to Section 12 of theExchange Act.
Issuer Purchases of Equity Securities
PeriodTotal number ofshares purchased
Average price paidper share
Total number of sharespurchased as part of a
publicly announcedprogram (1)(2)
Maximum number ofshares that may yetbe purchased under
the program(1)
10/01/2011-10/31/2011 . . . . — $ — — 3,732,80711/01/2011-11/30/2011 . . . . 1,439,831 65.45 1,439,831 6,449,82412/01/2011-12/31/2011 . . . . 1,173,000 64.18 1,173,000 5,276,824
Total . . . . . . . . . . . . . . . 2,612,831 $64.88 2,612,831
(1) In November 2011, the Company’s Board of Directors approved a new share repurchase authorization upto a total of 7 million common shares, which replaced the prior authorization of 7 million common sharesapproved in December 2010. Unless terminated earlier by resolution of the Company’s Board of Directors,the program will expire when the Company has repurchased all shares authorized for repurchasethereunder.
(2) At December 31, 2011, approximately 19.4 million common shares were held in treasury and available forreissuance.
The following table sets forth the high and low sales prices per share of the Company’s common shares foreach of the fiscal quarters in the last two fiscal years as reported on the New York Stock Exchange CompositeTape and dividends declared by the Company:
2011 2010
Period High LowDividendsDeclared High Low
DividendsDeclared
Three months ended March 31 . . . . . . . . . . . . . . . . . . $83.18 $72.78 $0.55 $80.20 $72.00 $0.50
Three months ended June 30 . . . . . . . . . . . . . . . . . . . . 82.52 67.28 0.60 81.57 70.06 0.50
Three months ended September 30 . . . . . . . . . . . . . . . 69.50 51.98 0.60 80.18 70.12 0.50
Three months ended December 31 . . . . . . . . . . . . . . . 67.78 50.67 0.60 82.00 77.50 0.55
46

Other information with respect to the Company’s common shares and related shareholder matters iscontained in Notes 7, 12, 13, 14, 16 and 19 to Consolidated Financial Statements in Item 8 of Part II of this reportand in the Proxy Statement and is incorporated by reference to this item.
Comparison of 5-Year Cumulative Total Return
The graph below compares the cumulative shareholder return, including reinvestment of dividends, on theCompany’s common shares to such return for Standard & Poor’s (“S&P”) 500 Composite Stock Price Index andS&P’s 1500 Composite Property & Casualty Insurance Index for the period commencing on December 31, 2006and ending on December 31, 2011, assuming $100 was invested on December 31, 2006. Each measurement pointon the graph below represents the cumulative shareholder return as measured by the last sale price at the end ofeach year during the period from December 31, 2006 through December 31, 2011. As depicted in the graphbelow, during this period the cumulative total shareholder return on the Company’s common shares was 4%, thecumulative total return for the S&P 500 Composite Stock Price Index was (1)% and the cumulative total returnfor the S&P 1500 Composite Property & Casualty Insurance Index was 0%.
The Company has attempted to identify an index which most closely matches its business. There are noindices that properly reflect the returns of the reinsurance industry. The S&P 1500 Composite Property &Casualty Insurance Index is used as it is the broadest index of companies in the property and casualty industry.We caution the reader that this index of 25 companies does not include any companies primarily engaged in thereinsurance business, and therefore it is provided to offer context for evaluating performance, rather than directcomparison.
47

ITEM 6. SELECTED FINANCIAL DATA
Selected Consolidated Financial Data
This data should be read in conjunction with the Consolidated Financial Statements and the accompanyingNotes to Consolidated Financial Statements in Item 8 of Part II of this report and with other informationcontained in this report, including Management’s Discussion and Analysis of Financial Condition and Results ofOperations in Item 7 of Part II of this report.
The Statement of Operations Data reflects the consolidated results of the Company and its subsidiaries for2007, 2008, 2009, 2010 and 2011, including the results of Paris Re from October 2, 2009. The Balance SheetData reflects the consolidated financial position of the Company and its subsidiaries at December 31, 2007, 2008,2009, 2010 and 2011, including Paris Re from December 31, 2009.
(Expressed in millions of U.S. dollars or shares, except per share data)
For the years ended December 31,
Statement of Operations Data 2011 2010 2009 2008 2007
Gross premiums written . . . . . . . . . . . . . . . . . . . . . . . . . . . . . . . . . $4,633 $4,885 $4,001 $4,028 $3,810Net premiums written . . . . . . . . . . . . . . . . . . . . . . . . . . . . . . . . . . . 4,486 4,705 3,949 3,989 3,757Net premiums earned . . . . . . . . . . . . . . . . . . . . . . . . . . . . . . . . . . . $4,648 $4,776 $4,120 $3,928 $3,777Net investment income . . . . . . . . . . . . . . . . . . . . . . . . . . . . . . . . . . 629 673 596 573 523Net realized and unrealized investment gains (losses) . . . . . . . . . . 67 402 591 (531) (72)Net realized gain on purchase of capital efficient notes . . . . . . . . . — — 89 — —Other income (loss) . . . . . . . . . . . . . . . . . . . . . . . . . . . . . . . . . . . . . 8 10 22 10 (17)
Total revenues . . . . . . . . . . . . . . . . . . . . . . . . . . . . . . . . . . . . . . . . . 5,352 5,861 5,418 3,980 4,211Losses and loss expenses and life policy benefits . . . . . . . . . . . . . . 4,373 3,284 2,296 2,609 2,082Total expenses . . . . . . . . . . . . . . . . . . . . . . . . . . . . . . . . . . . . . . . . . 5,797 4,892 3,635 3,918 3,328
(Loss) income before taxes and interest in (losses) earnings ofequity investments . . . . . . . . . . . . . . . . . . . . . . . . . . . . . . . . . . . . (445) 969 1,783 62 883
Income tax expense . . . . . . . . . . . . . . . . . . . . . . . . . . . . . . . . . . . . . 69 129 262 10 82Interest in (losses) earnings of equity investments . . . . . . . . . . . . . (6) 13 16 (5) (83)
Net (loss) income . . . . . . . . . . . . . . . . . . . . . . . . . . . . . . . . . . . . . . $ (520) $ 853 $1,537 $ 47 $ 718
Basic net (loss) income per common share . . . . . . . . . . . . . . . . . . . $ (8.40) $10.65 $23.93 $ 0.22 $12.18Diluted net (loss) income per common share . . . . . . . . . . . . . . . . . $ (8.40) $10.46 $23.51 $ 0.22 $11.87Dividends declared and paid per common share . . . . . . . . . . . . . . . $ 2.35 $ 2.05 $ 1.88 $ 1.84 $ 1.72Operating (loss) earnings available to common
shareholders (1)(3) . . . . . . . . . . . . . . . . . . . . . . . . . . . . . . . . . . . . . . $ (642) $ 492 $ 931 $ 433 $ 841Operating return on beginning diluted book value per common
share and common share equivalents outstanding (2)(3) . . . . . . . . . (10.1)% 7.4% 22.3% 11.5% 26.1%Weighted average number of common shares and common share
equivalents outstanding . . . . . . . . . . . . . . . . . . . . . . . . . . . . . . . . 67.6 78.2 63.9 55.6 57.6Non-life ratiosLoss ratio . . . . . . . . . . . . . . . . . . . . . . . . . . . . . . . . . . . . . . . . . . . . . 96.7% 65.9% 52.7% 63.9% 50.8%Acquisition ratio . . . . . . . . . . . . . . . . . . . . . . . . . . . . . . . . . . . . . . . 21.3 21.3 21.9 23.3 22.9Other operating expense ratio . . . . . . . . . . . . . . . . . . . . . . . . . . . . . 7.4 7.8 7.2 6.9 6.7
Combined ratio . . . . . . . . . . . . . . . . . . . . . . . . . . . . . . . . . . . . . . . . 125.4% 95.0% 81.8% 94.1% 80.4%
48

At December 31,
Balance Sheet Data 2011 2010 2009 2008 2007
Total investments, funds held – directly managed and cashand cash equivalents . . . . . . . . . . . . . . . . . . . . . . . . . . . . . $17,898 $18,181 $18,165 $11,724 $11,572
Total assets . . . . . . . . . . . . . . . . . . . . . . . . . . . . . . . . . . . . . . 22,855 23,364 23,733 16,279 16,149Unpaid losses and loss expenses and policy benefits for life
and annuity contracts . . . . . . . . . . . . . . . . . . . . . . . . . . . . . 12,919 12,417 12,427 8,943 8,773Debt related to senior notes . . . . . . . . . . . . . . . . . . . . . . . . . . 750 750 250 250 —Debt related to capital efficient notes . . . . . . . . . . . . . . . . . . 71 71 71 258 258Long-term debt . . . . . . . . . . . . . . . . . . . . . . . . . . . . . . . . . . . — — — 200 620Total shareholders’ equity . . . . . . . . . . . . . . . . . . . . . . . . . . . 6,468 7,207 7,646 4,199 4,322Diluted book value per common share and common share
equivalents outstanding . . . . . . . . . . . . . . . . . . . . . . . . . . . $ 84.82 $ 93.77 $ 84.51 $ 63.95 $ 67.96Number of common shares outstanding, net of treasury
shares . . . . . . . . . . . . . . . . . . . . . . . . . . . . . . . . . . . . . . . . . 65.3 70.0 82.6 56.5 54.3
(1) Operating earnings or loss available to common shareholders is calculated as net income or loss availableto common shareholders excluding net realized and unrealized gains or losses on investments, net of tax, netrealized gain on purchase of CENts, net of tax, net foreign exchange gains or losses, net of tax, and interestin earnings or losses of equity investments, net of tax, where the Company does not control the investeecompanies’ activities, and is calculated after preferred dividends. The presentation of operating earnings orloss available to common shareholders is a non-GAAP financial measure within the meaning ofRegulation G. See Key Financial Measures in Item 7 of Part II of this report for a detailed discussion of themeasures used by the Company to evaluate its financial performance.
(2) Operating return on beginning diluted book value per common share and common share equivalentsoutstanding (Operating ROE) is calculated using operating earnings or loss, as defined above, per dilutedcommon share and common share equivalents outstanding, divided by diluted book value per common shareand common share equivalents outstanding at the beginning of the year. The presentation of Operating ROEis a non-GAAP financial measure within the meaning of Regulation G. See Key Financial Measures inItem 7 of Part II of this report for a detailed discussion of the measures used by the Company to evaluate itsfinancial performance.
(3) Effective January 1, 2011, Management redefined its operating earnings or loss available to commonshareholders calculation to additionally exclude net foreign exchange gains or losses. In addition,Management redefined its Operating return on beginning diluted book value per share and common shareequivalents outstanding calculation to measure operating return on a diluted per share basis (OperatingROE, previously referred to as operating return on beginning common shareholders’ equity). Operatingearnings or loss and Operating ROE for all periods presented have been recast to reflect the Company’sredefined non-GAAP measures. See Key Financial Measures in Item 7 of Part II of this report for adiscussion of Management’s reasons for redefining these measures.
49

ITEM 7. MANAGEMENT’S DISCUSSION AND ANALYSIS OF FINANCIAL CONDITION ANDRESULTS OF OPERATIONS
The following discussion and analysis reflects the consolidated results of the Company and its subsidiariesfor the years ended December 31, 2009, 2010 and 2011, including the results of Paris Re from October 2, 2009,the date of the acquisition of the controlling interest (Acquisition Date).
Executive Overview
The Company is a leading global reinsurer, with a broadly diversified and balanced portfolio of traditionalreinsurance risks and capital markets risks. The Company’s economic objective is to manage a portfolio of risksthat will generate compound annual Diluted Book Value per Share growth of 10% over the reinsurance cycle andan average Operating Return on Equity (ROE) of 13% over a reinsurance cycle. Management assesses both ofthese economic objectives over the reinsurance cycle, rather than any particular quarterly or annual period, giventhe Company’s profitability is significantly affected by the level of large catastrophic losses that it incurs eachperiod. Both of these metrics are defined below in Key Financial Measures.
Successful risk management is the foundation of the Company’s value proposition, with diversification ofrisks at the core of its risk management strategy. The Company’s ability to succeed in the risk assumption andmanagement business is dependent on its ability to accurately analyze and quantify risk, to understand volatilityand how risks aggregate or correlate, and to establish the appropriate capital requirements and limits for the risksassumed. All risks, whether they are reinsurance related risks or capital market risks, are managed by theCompany within an integrated framework of policies and processes that ensure the intelligent and consistentevaluation and valuation of risk, and ultimately provide an appropriate return to shareholders. For furtherdiscussion of the Company’s risk management framework, see Risk Management in Item 1 of Part I of thisreport.
The following discussion provides an overview of the Company’s business and trends and commentaryregarding the outlook for 2012 in each business.
Non-life reinsurance business, trends and 2012 outlook
The Company generates its Non-life reinsurance revenue from premiums. Premium rates and terms andconditions vary by line of business depending on market conditions. Pricing cycles are driven by supply ofcapital in the industry and demand for reinsurance and other risk transfer products. The reinsurance business isalso influenced by several other factors, including variations in interest rates and financial markets, changes inlegal, regulatory and judicial environments, loss trends, inflation and general economic conditions.
In its reinsurance portfolio, the Company writes all lines of business in virtually all markets worldwide, anddifferentiates itself through its risk management strategy and its financial strength. In assuming its clients’ risks,the Company removes the volatility associated with those risks from the clients’ financial statements, and thenmanages those risks and the risk-related volatility. Through its broad product and geographic diversification, itsexecution capabilities and its local presence in most major markets, the Company is able to stabilize returns,respond quickly to market needs, and capitalize on business opportunities virtually anywhere in the world.
A key challenge facing the Company is to successfully manage risk through all phases of the reinsurancecycle. The Company believes that its long-term strategy of closely monitoring the progression of each line ofbusiness, being selective in the business that it writes, and maintaining the diversification and balance of itsportfolio, will optimize returns over the reinsurance cycle. Individual lines of business and markets have theirown unique characteristics and are at different stages of the reinsurance pricing cycle at any given point in time.Management believes it has achieved appropriate portfolio diversification by product, geography, line and typeof business, length of tail, and distribution channel, and that this diversification, in addition to the financialstrength of the Company and its strong global franchise, will help to mitigate cyclical declines in underwritingprofitability and to achieve a more stable return over the reinsurance cycle.
50

The Non-life reinsurance market has historically been highly cyclical in nature. The reinsurance cycle isdriven by competition, the amount of capital and capacity in the industry, loss events and investment returns. TheCompany’s long-term strategy to generate shareholder value focuses on broad product, asset and geographicdiversification of risks.
The cyclicality of the Non-life reinsurance market is characterized by cycles of growth and decline, knownas hard and soft insurance cycles. Since late 2003, the Company began to see the emergence of a soft marketacross most of lines of business with general decreases in pricing and profitability. With the exception of linesand markets impacted by specific events, this trend continued throughout the decade. In 2011, this trend broadlycontinued with diverse conditions prevailing in various markets. Certain markets and lines of business in theCompany’s Non-life segment experienced increased competition, higher cedant retentions and declines inpricing, while the terms in other markets strengthened or remained stable. The Company also experiencedincreases in pricing in certain loss affected lines of business and markets, which were primarily related to theincreased catastrophic and large loss activity during 2011. The most significant events impacting the Companyduring 2011 were the Japan Earthquake, the February and June 2011 New Zealand Earthquakes, Thailand Floods,U.S. tornadoes and the Australian Floods, which together with the impact of aggregate contracts covering lossesin Australia and New Zealand are collectively referred to as 2011 catastrophic events.
During the January 2012 renewals, the Company experienced a modest increase in expected premiumvolume despite fragmented market conditions with reductions in pricing and increased cedant retentions incertain lines of business, while pricing improvements were observed in other areas. Management believes it hasimproved the balance and diversification in its portfolio by continuing to reduce its catastrophe exposures atJanuary 1, 2012.
Life reinsurance business, trends and 2012 outlook
The Company’s Life segment derives revenues primarily from renewal premiums from existing reinsurancetreaties and new premiums from existing or new reinsurance treaties. The long-term profitability of the Lifesegment mainly depends on the volume and amount of death claims incurred and the ability to adequately pricethe risk the Company assumes. The life reinsurance policies are often in force for the remaining lifetime of theunderlying individuals insured, with premiums earned typically over a period of 10 to 30 years. The volume ofthe business may be reduced each year by terminations of the underlying treaties related to lapses, voluntarysurrenders, death of insureds and recaptures by ceding companies. While death claims are reasonably predictableover a period of many years, claims become less predictable over shorter periods and can fluctuate significantlyfrom quarter to quarter or from year to year.
Within the Company’s Life segment, the reinsurance market is differentiated between mortality (includingdisability) and longevity products, with mortality being the larger market. For both the mortality and longevitymarkets, the Company observed attractive opportunities to grow the portfolio during 2011. Management believesthe life business provides the Company with additional diversification benefits and balance to its portfolio as it isgenerally non-correlated to the Company’s Non-life business. The Company does not write new life business inthe U.S. market.
Given the majority of the Company’s Life segment contracts are written on a continuous basis, theJanuary 1 renewals impact a relatively limited portion of the portfolio, which is exclusive to the mortality line.The Company observed unchanged pricing conditions and terms for renewals, leading the Company to cancel orreduce certain treaty participations, which was largely offset by improved terms on certain other existing treatiesand new business from both new and existing clients.
51

Capital markets business, trends and 2012 outlook
The Company generates revenue from its high quality investment portfolio, as well as the investmentsunderlying the funds held – directly managed account, through net investment income, including coupon intereston fixed maturities and dividends on equities, and realized and unrealized gains and losses on investments.
For the Company’s capital markets risks, which include both public and private market investments,diversification of risk is critical to achieving the risk and return objectives of the Company. The Company’sinvestment policy distinguishes between liquid, high quality assets that support the Company’s liabilities, and themore diversified, higher risk asset classes that make up the Company’s capital funds. While there will be yearswhere capital markets risks achieve less than the risk-free rate of return, or potentially even negative results, theCompany believes the rewards for assuming these risks in a disciplined and measured way will produce apositive excess return to the Company over time. Additionally, since capital markets risks are not fully correlatedwith the Company’s reinsurance risks, this increases the overall diversification of the Company’s total riskportfolio.
The Company’s capital markets and investment operations, including public and private marketinvestments, have experienced volatile market conditions since the middle of 2007, reflecting the continuedinstability in the global economy and financial markets. The Company believes that capital market risks managedin a disciplined and measured way will generate positive excess returns to the Company over time.
The Company follows prudent investment guidelines through a strategy that seeks to maximize returnswhile managing investment risk in line with the Company’s overall objectives of earnings stability and long-termbook value growth. The Company allocates its invested assets into two categories: liability funds and capitalfunds. See the discussion of liability funds and capital funds in Financial Condition, Liquidity and CapitalResources. A key challenge for the Company is achieving the right balance between current investment incomeand total returns (that include price appreciation or depreciation) in changing market conditions. The Companyregularly reviews the allocation of investments to asset classes within its investment portfolio and its funds held –directly managed account and allocates investments to those asset classes the Company anticipates willoutperform in the near future, subject to limits and guidelines. Similarly, the Company reduces its exposure torisk asset classes where returns are underperforming. The Company may also lengthen or shorten the duration ofits fixed income portfolio in anticipation of changes in interest rates, or increase or decrease the amount of creditrisk it assumes, depending on credit spreads and anticipated economic conditions. During 2011, the Companyshortened the duration of its fixed income portfolio given historically low interest rates and to limit the impact ofa potential rise in interest rates.
Assuming constant foreign exchange rates, Management expects net investment income to decrease in 2012compared to 2011 primarily due to lower reinvestment rates with low government yields expected to continuethroughout 2012. Management expects this decrease to be partially offset by expected positive cash flow fromoperations (including net investment income).
52

Key Financial Measures
In addition to the Consolidated Balance Sheets and Consolidated Statements of Operations andComprehensive (Loss) Income, Management uses certain key measures to evaluate its financial performance andthe overall growth in value generated for the Company’s common shareholders. The four key measures thatManagement uses, together with definitions of their calculations, are as follows at December 31, 2011 and 2010and for the years ended December 31, 2011, 2010 and 2009:
December 31,2011
December 31,2010
Diluted book value per common share and common share equivalentsoutstanding (1) . . . . . . . . . . . . . . . . . . . . . . . . . . . . . . . . . . . . . . . . . . . . . . . . . . . . . . . $84.82 $93.77
2011 2010 2009
Operating (loss) earnings available to common shareholders (in millions ofU.S. dollars) (2) . . . . . . . . . . . . . . . . . . . . . . . . . . . . . . . . . . . . . . . . . . . . . . $ (642) $ 492 $ 931
Operating return on beginning diluted book value per common share andcommon share equivalents outstanding (3) . . . . . . . . . . . . . . . . . . . . . . . . . (10.1)% 7.4% 22.3%
Combined ratio (4) . . . . . . . . . . . . . . . . . . . . . . . . . . . . . . . . . . . . . . . . . . . . . . 125.4% 95.0% 81.8%
(1) Diluted book value per common share and common share equivalents outstanding is calculated usingcommon shareholders’ equity (shareholders’ equity less the aggregate liquidation value of preferredshares) divided by the number of fully diluted common shares and common share equivalents outstanding(assuming exercise of all stock-based awards and other dilutive securities).
(2) Operating earnings or loss available to common shareholders (operating earnings or loss) is calculated asnet income or loss available to common shareholders excluding net realized and unrealized gains or losseson investments, net of tax, net realized gain on purchase of capital efficient notes (CENts), net of tax, netforeign exchange gains or losses, net of tax, and interest in earnings or losses of equity investments, net oftax, where the Company does not control the investee companies’ activities, and is calculated afterpreferred dividends. The presentation of operating earnings or loss is a non-GAAP financial measure withinthe meaning of Regulation G (see Comment on Non-GAAP Measures below) and is reconciled to the nearestGAAP financial measure below. Effective January 1, 2011, Management redefined its operating earnings orloss calculation, as discussed below.
(3) Operating return on beginning diluted book value per common share and common share equivalentsoutstanding (Operating ROE) is calculated using annualized operating earnings or loss, as defined above,per diluted common share and common share equivalents outstanding, divided by diluted book value percommon share and common share equivalents outstanding as of the beginning of the year, as defined above.For the year ended December 31, 2009, following the acquisition of Paris Re, Management adjustedOperating ROE to be the sum of the operating earnings per diluted share for the nine months endedSeptember 30, 2009 divided by the beginning diluted book value per common share plus the operatingearnings per diluted share for the three months ended December 31, 2009 divided by the beginning dilutedbook value per common share plus the per diluted share impact of equity issued related to the acquisition ofParis Re. The presentation of Operating ROE is a non-GAAP financial measure within the meaning ofRegulation G (see Comment on Non-GAAP Measures below) and is reconciled to the nearest GAAPfinancial measure below. Effective January 1, 2011, Management redefined its Operating ROE calculation,as discussed below.
(4) The combined ratio of the Non-life segment is calculated as the sum of the technical ratio (losses and lossexpenses and acquisition costs divided by net premiums earned) and the other operating expense ratio(other operating expenses divided by net premiums earned).
Effective January 1, 2011, Management redefined its operating earnings or loss available to commonshareholders (operating earnings or loss) calculation to additionally exclude net foreign exchange gains or losses.Management believes that net foreign exchange gains or losses are not indicative of the performance of, anddistort trends in, the Company’s business as they predominantly result from general economic and foreign
53

exchange market conditions. In addition, Management redefined its Annualized operating return on beginningdiluted book value per common share and common share equivalents outstanding (Operating ROE, previouslyreferred to as operating return on beginning common shareholders’ equity) calculation to measure OperatingROE on a diluted per share basis. Management believes that the redefined Operating ROE incorporates capitalmanagement activities whilst still being based on the concept of deploying available capital on an annual basis.Operating earnings or loss and Operating ROE for the years ended December 31, 2010 and 2009 have been recastto reflect the Company’s redefined non-GAAP measures.
Diluted book value per common share and common share equivalents outstanding (Diluted Book Valueper Share): Management uses compound annual growth rate in Diluted Book Value per Share as a primemeasure of the value the Company is generating for its common shareholders, as Management believes thatgrowth in the Company’s Diluted Book Value per Share ultimately translates into growth in the Company’s shareprice. Management has set a target compound annual growth rate of 10% in Diluted Book Value per Share, afterthe payment of dividends, over the reinsurance cycle. Diluted Book Value per Share is impacted by theCompany’s net income or loss, capital resources management and external factors such as foreign exchange,interest rates, credit spreads and equity markets, which can drive changes in realized and unrealized gains orlosses on its investment portfolio.
The Company’s Diluted Book Value per Share decreased by 10% to $84.82 at December 31, 2011 from$93.77 at December 31, 2010, primarily due to the comprehensive loss of $537 million. The comprehensive losswas driven by the net loss of $520 million resulting primarily from the significant level of 2011 catastrophicevents and dividends declared on the Company’s common and preferred shares of $206 million. These decreaseswere partially offset by the accretive impact of share repurchases during 2011. Net loss for the year endedDecember 31, 2011 and the significant level of 2011 catastrophic losses are described in Overview and Reviewof Net (Loss) Income below.
Over the past five years, since December 31, 2006, the Company has generated a compound annual growthrate in Diluted Book Value per Share in excess of 8% and over the past ten years, since December 31, 2001, theCompany has generated a compound annual growth rate in Diluted Book Value per Share in excess of 11%. Boththe 5-year and the 10-year compound annual growth rates, compared to the decrease in Diluted Book Value perShare during 2011, illustrate why Management takes a longer-term view of growth in Diluted Book Value perShare over the reinsurance cycle, given single periods can be volatile as a result of the level of catastrophe lossesincurred.
Operating earnings or loss available to common shareholders (operating earnings or loss): Managementuses operating earnings or loss to measure its financial performance as this measure focuses on the underlyingfundamentals of the Company’s operations by excluding net realized and unrealized gains or losses oninvestments, interest in earnings or losses of equity investments and net foreign exchange gains or losses. Netrealized and unrealized gains or losses on investments in any particular period are not indicative of theperformance of, and distort trends in, the Company’s business as they predominantly result from generaleconomic and financial market conditions, and the timing of realized gains or losses on investments is largelyopportunistic. Interest in earnings or losses of equity investments are also not indicative of the performance of, ortrends in, the Company’s business as the Company does not control the investee companies’ activities. Netforeign exchange gains or losses are not indicative of the performance of, and distort trends in, the Company’sbusiness as they predominantly result from general economic and foreign exchange market conditions.Management believes that the use of operating earnings or loss enables investors and other users of theCompany’s financial information to analyze its performance in a manner similar to how Management analyzesperformance. Management also believes that this measure follows industry practice and, therefore, allows theusers of financial information to compare the Company’s performance with its industry peer group, and that theequity analysts and certain rating agencies which follow the Company, and the insurance industry as a whole,generally exclude these items from their analyses for the same reasons.
Operating earnings decreased by $1,134 million, from $492 million in 2010 to a loss of $642 million in2011 mainly due to a decrease in the Non-life underwriting result of $1,177 million, which was driven primarily
54

by the large 2011 catastrophic events, and to a lesser extent, a decrease in net investment income of $44 million.These decreases were partially offset by lower corporate operating expenses of $67 million and an increase in theLife underwriting result of $24 million.
Operating earnings decreased by $439 million from $931 million in 2009 to $492 million in 2010 primarilydue to a decrease in the Non-life underwriting result of $451 million, a decrease in Life underwriting result of$40 million and various other factors. These factors contributing to a decrease in operating earnings werepartially offset by a lower tax expense that is attributable to operating earnings of $77 million and an increase innet investment income of $77 million.
These factors contributing to the increases or decreases in operating earnings in 2011 compared to 2010 andin 2010 compared to 2009 are further described in Overview and Review of Net (Loss) Income below.
The presentation of operating earnings or loss available to common shareholders is a non-GAAP financialmeasure within the meaning of Regulation G and should be considered in addition to, and not as a substitute for,measures of financial performance prepared in accordance with GAAP (see Comment on Non-GAAP Measures).The table below provides a reconciliation of operating earnings or loss to the most comparable GAAP financialmeasure for the years ended December 31, 2011, 2010 and 2009 (in millions of U.S. dollars):
2011 2010 2009
Net (loss) income . . . . . . . . . . . . . . . . . . . . . . . . . . . . . . . . . . . . . . . . . . . . . . . . . . . . . . . . $(520) $853 $1,537Less:
Net realized and unrealized investment gains, net of tax . . . . . . . . . . . . . . . . . . . . . . 15 301 497Net realized gain on purchase of capital efficient notes, net of tax . . . . . . . . . . . . . . — — 57Net foreign exchange gains, net of tax . . . . . . . . . . . . . . . . . . . . . . . . . . . . . . . . . . . . 67 13 1Interest in (losses) earnings of equity investments, net of tax . . . . . . . . . . . . . . . . . . (7) 12 16Dividends to preferred shareholders . . . . . . . . . . . . . . . . . . . . . . . . . . . . . . . . . . . . . . 47 35 35
Operating (loss) earnings available to common shareholders . . . . . . . . . . . . . . . . . . . . . . $(642) $492 $ 931
Operating ROE: Management uses annualized Operating ROE as a measure of profitability that focuses onthe return to common shareholders. Management has set an average 13% Operating ROE target over thereinsurance cycle, which Management believes provides an attractive return to shareholders for the risk assumed.Each Business Unit and support department throughout the Company is focused on seeking to ensure that theCompany meets the 13% return objective. This means that most economic decisions, including capital attributionand underwriting pricing decisions, incorporate an Operating ROE impact analysis. For the purpose of thatanalysis, an appropriate amount of capital (equity) is attributed to each transaction for determining thetransaction’s priced return on attributed capital. Subject to an adequate return for the risk level as well as otherfactors, such as the contribution of each risk to the overall risk level and risk diversification, capital is attributedto the transactions generating the highest priced return on deployed capital. Management’s challenge consists of(i) attributing an appropriate amount of capital to each transaction based on the risk created by the transaction,(ii) properly estimating the Company’s overall risk level and the impact of each transaction on the overall risklevel, (iii) assessing the diversification benefit, if any, of each transaction, and (iv) deploying available capital.The risk for the Company lies in mis-estimating any one of these factors, which are critical in calculating ameaningful priced return on deployed capital, and entering into transactions that do not contribute to theCompany’s 13% Operating ROE objective.
Operating ROE decreased from 7.4% in 2010 to a loss of 10.1% in 2011. The decrease in Operating ROEwas primarily due to the decrease in operating earnings, which was driven by the large 2011 catastrophic events.
Operating ROE decreased from 22.3% in 2009 to 7.4% in 2010 primarily due to the decrease in operatingearnings and a higher beginning diluted book value per share balance in 2010 compared to 2009, which alsoresulted in a reduction in the Company’s premium leverage. The higher beginning diluted book value per sharebalance in 2010 was due to the strong net income during 2009.
55

The factors contributing to increases or decreases in operating earnings are described further in Operatingearnings or loss available to common shareholders above and in Overview and Review of Net (Loss) Income.
The average Operating ROE for the last five years and ten years was 11.4% and 12.2%, respectively. Boththe 5-year and the 10-year averages reflect higher Operating ROE primarily in years that were not impacted byany significant catastrophic losses, and illustrates why management measures performance based on an averageOperating ROE target over the reinsurance cycle rather than focusing on the results for single periods, which canbe volatile depending on the level of catastrophic losses incurred.
The presentation of Operating ROE is a non-GAAP financial measure within the meaning of Regulation Gand should be considered in addition to, and not as a substitute for, measures of financial performance preparedin accordance with GAAP (see Comment on Non-GAAP Measures). The table below provides a reconciliation ofOperating ROE to the most comparable GAAP financial measure for the years ended December 31, 2011, 2010and 2009:
2011 2010 2009 (1)
Return on beginning diluted book value per common share calculated with net (loss)income per share available to common shareholders . . . . . . . . . . . . . . . . . . . . . . . . . . (9.0)% 12.4% 37.4%
Less:Net realized and unrealized investment gains, net of tax, on beginning diluted
book value per common share . . . . . . . . . . . . . . . . . . . . . . . . . . . . . . . . . . . . . . . . 0.2 4.6 13.3Net realized gain on purchase of capital efficient notes, net of tax, on beginning
diluted book value per common share . . . . . . . . . . . . . . . . . . . . . . . . . . . . . . . . . . — — 1.5Net foreign exchange gains, net of tax, on beginning diluted book value per
common share . . . . . . . . . . . . . . . . . . . . . . . . . . . . . . . . . . . . . . . . . . . . . . . . . . . . 1.0 0.2 —Net interest in (losses) earnings of equity investments, net of tax, on beginning
diluted book value per common share . . . . . . . . . . . . . . . . . . . . . . . . . . . . . . . . . . (0.1) 0.2 0.3
Operating return on beginning diluted book value per common share . . . . . . . . . . . . . . . (10.1)% 7.4% 22.3%
(1) For the year ended December 31, 2009, following the acquisition of Paris Re, Management adjusted thereturn on beginning diluted book value per common share and common share equivalents outstanding to bethe sum of the results for the nine months ended September 30, 2009 divided by beginning of year dilutedbook value per common share and common share equivalents outstanding plus the results for the threemonths ended December 31, 2009 divided by beginning of year diluted book value per common share andcommon share equivalents outstanding plus the equity issued related to the acquisition of Paris Re.
Combined Ratio: The combined ratio is used industry-wide as a measure of underwriting profitability forNon-life business. A combined ratio under 100% indicates underwriting profitability, as the total losses and lossexpenses, acquisition costs and other operating expenses are less than the premiums earned on that business.While an important metric of underwriting profitability, the combined ratio does not reflect all components ofprofitability, as it does not recognize the impact of investment income earned on premiums between the timepremiums are received and the time loss payments are ultimately made to clients. The key challenges inmanaging the combined ratio metric consist of (i) focusing on underwriting profitable business even in theweaker part of the reinsurance cycle, as opposed to growing the book of business at the cost of profitability,(ii) diversifying the portfolio to achieve a good balance of business, with the expectation that underwriting lossesin certain lines or markets may potentially be offset by underwriting profits in other lines or markets, and(iii) maintaining control over expenses.
Since 2002, the Company has had eight years of underwriting profitability reflected in combined ratios ofless than 100% for its Non-life segment, with the only exceptions being 2005 and 2011. In 2005, when theindustry recorded its worst year in history in terms of catastrophe losses, with Hurricane Katrina being the largestinsured event ever, the Company recorded a net underwriting loss and Non-life combined ratio of 116.3%. In
56

2011, when the industry incurred a high frequency of large losses related to the 2011 catastrophic events theCompany recorded a net underwriting loss and Non-life combined ratio of 125.4%.
The increase in the Non-life combined ratio of 30.4 points to 125.4% in 2011 from 95.0% in 2010 wasprimarily due to an increase in catastrophic loss activity. The large 2011 catastrophic events contributed 45.2points to the combined ratio in 2011. In comparison, the Non-life combined ratio included 13.9 points for theyear ended December 31, 2010 related to the Chile Earthquake, 2010 New Zealand Earthquake, the explosionand subsequent sinking of the Deepwater Horizon Drilling Platform (Deepwater Horizon) and an aggregatecontract covering losses in Australia and New Zealand (collectively, 2010 catastrophic and large loss events).
The increase in the Non-life combined ratio of 13.2 points to 95.0% in 2010 from 81.8% in 2009 wasprimarily due to 13.9 points related to the 2010 catastrophic and large loss events, compared to no largecatastrophic loss activity in 2009.
Comment on Non-GAAP Measures
Throughout this filing, the Company’s results of operations have been presented in the way thatManagement believes will be the most meaningful and useful to investors, analysts, rating agencies and otherswho use financial information in evaluating the performance of the Company. This presentation includes the useof operating earnings or loss and Operating ROE that are not calculated under standards or rules that compriseU.S. GAAP. These measures are referred to as non-GAAP financial measures within the meaning ofRegulation G. Management believes that these non-GAAP financial measures are important to investors,analysts, rating agencies and others who use the Company’s financial information and will help provide aconsistent basis for comparison between years and for comparison with the Company’s peer group, althoughnon-GAAP measures may be defined or calculated differently by other companies. Investors should considerthese non-GAAP measures in addition to, and not as a substitute for, measures of financial performance preparedin accordance with GAAP. A reconciliation of these measures to the most comparable U.S. GAAP financialmeasures, net income or loss and return on beginning common shareholders’ equity calculated with net incomeor loss available to common shareholders, is presented above.
Critical Accounting Policies and Estimates
The Company’s Consolidated Financial Statements have been prepared in accordance with accountingprinciples generally accepted in the United States (U.S. GAAP). The preparation of financial statements inconformity with U.S. GAAP requires Management to make estimates and assumptions that affect the reportedamounts of assets and liabilities at the date of the financial statements and the reported amounts of revenues andexpenses during the reporting period. The following presents a discussion of those accounting policies andestimates that Management believes are the most critical to its operations and require the most difficult,subjective and complex judgment. If actual events differ significantly from the underlying assumptions andestimates used by Management, there could be material adjustments to prior estimates that could potentiallyadversely affect the Company’s results of operations, financial condition and liquidity. These critical accountingpolicies and estimates should be read in conjunction with the Notes to Consolidated Financial Statements,including Note 2, Significant Accounting Policies, for a full understanding of the Company’s accounting policies.The sensitivity estimates that follow are based on outcomes that the Company considers reasonably likely tooccur.
Losses and Loss Expenses and Life Policy Benefits
Losses and Loss Expenses
Because a significant amount of time can elapse between the assumption of risk, occurrence of a loss event,the reporting of the event to an insurance company (the primary company or the cedant), the subsequentreporting to the reinsurance company (the reinsurer) and the ultimate payment of the claim on the loss event by
57

the reinsurer, the Company’s liability for unpaid losses and loss expenses (loss reserves) is based largely uponestimates. The Company categorizes loss reserves into three types of reserves: reported outstanding loss reserves(case reserves), additional case reserves (ACRs) and incurred but not reported (IBNR) reserves. The Companyupdates its estimates for each of the aforementioned categories on a quarterly basis using information receivedfrom its cedants. Case reserves represent unpaid losses reported by the Company’s cedants and recorded by theCompany. ACRs are established for particular circumstances where, on the basis of individual loss reports, theCompany estimates that the particular loss or collection of losses covered by a treaty may be greater than thoseadvised by the cedant. IBNR reserves represent a provision for claims that have been incurred but not yetreported to the Company, as well as future loss development on losses already reported, in excess of the casereserves and ACRs. Unlike case reserves and ACRs, IBNR reserves are often calculated at an aggregated leveland cannot usually be directly identified as reserves for a particular loss or treaty. The Company also estimatesthe future unallocated loss adjustment expenses (ULAE) associated with the loss reserves and these form part ofthe Company’s loss adjustment expense reserves. The Company’s Non-life loss reserves for each category, lineand sub-segment are reported in the tables included later in this section.
The amount of time that elapses before a claim is reported to the cedant and then subsequently reported tothe reinsurer is commonly referred to in the industry as the reporting tail. Lines of business for which claims arereported quickly are commonly referred to as short-tail lines; and lines of business for which a longer period oftime elapses before claims are reported to the reinsurer are commonly referred to as long-tail lines. In general, forreinsurance, the time lags are longer than for primary business due to the delay that occurs between the cedantbecoming aware of a loss and reporting the information to its reinsurer(s). The delay varies by reinsurancemarket (country of cedant), type of treaty, whether losses are first paid by the cedant and the size of the loss. Thedelay could vary from a few weeks to a year or sometimes longer. The Company considers agriculture,catastrophe, energy, property, motor business written in the U.S., proportional motor business written outside ofthe U.S., specialty property and structured risk to be short-tail lines; aviation/space, credit/surety, engineering,marine and multiline to be medium-tail lines; and casualty, non-proportional motor business written outside ofthe U.S. and specialty casualty to be long-tail lines of business. For all lines, the Company’s objective is toestimate ultimate losses and loss expenses. Total loss reserves are then calculated by subtracting losses paid.Similarly, IBNR reserves are calculated by subtraction of case reserves and ACRs from total loss reserves.
The Company analyzes its ultimate losses and loss expenses after consideration of the loss experience ofvarious reserving cells. The Company assigns treaties to reserving cells and allocates losses from the treaty to thereserving cell. The reserving cells are selected in order to ensure that the underlying treaties have homogeneousloss development characteristics (e.g., reporting tail) but are large enough to make estimation of trends credible.The selection of reserving cells is reviewed annually and changes over time as the business of the Companyevolves. For each reserving cell, the Company tabulates losses in reserving triangles that show the total reportedor paid claims at each financial year end by underwriting year cohort. An underwriting year is the year duringwhich the reinsurance treaty was entered into as opposed to the year in which the loss occurred (accident year),or the calendar year for which financial results are reported. For each reserving cell, the Company’s estimates ofloss reserves are reached after a review of the results of several commonly accepted actuarial projectionmethodologies. In selecting its best estimate, the Company considers the appropriateness of each methodology tothe individual circumstances of the reserving cell and underwriting year for which the projection is made. Themethodologies that the Company employs include, but may not be limited to, paid and reported Chain Laddermethods, Expected Loss Ratio method, paid and reported Bornhuetter-Ferguson (B-F) methods, and paid andreported Benktander methods. In addition, the Company uses other methodologies to estimate liabilities forspecific types of claims. For example, internal and vendor catastrophe models are typically used in the estimationof loss and loss expenses at the early stages of catastrophe losses before loss information is reported to thereinsurer. In the case of asbestos and environmental claims, the Company has established reserves for futurelosses and allocated loss expenses based on the results of periodic actuarial studies, which consider theunderlying exposures of the Company’s cedants.
58

The reserve methodologies employed by the Company are dependent on data that the Company collects.This data consists primarily of loss amounts and loss payments reported by the Company’s cedants, andpremiums written and earned reported by cedants or estimated by the Company. The actuarial methods used bythe Company to project loss reserves that it will pay in the future (future liabilities) do not generally includemethodologies that are dependent on claim counts reported, claim counts settled or claim counts open as, due tothe nature of the Company’s business, this information is not routinely provided by cedants for every treaty.
A brief description of the reserving methods commonly employed by the Company and a discussion of theirparticular advantages and disadvantages follows:
Chain Ladder (CL) Development Methods (Reported or Paid)
These methods use the underlying assumption that losses reported (paid) for each underwriting year at aparticular development stage follow a stable pattern. For example, the CL development method assumes that onaverage, every underwriting year will display the same percentage of ultimate liabilities reported by theCompany’s cedants (say x%) at 24 months after the inception of the underwriting year. The percentages reported(paid) are established for each development stage (e.g., at 12 months, 24 months, etc.) after examining historicalaverages from the loss development data. These are sometimes supplemented by external benchmarkinformation. Ultimate liabilities are estimated by multiplying the actual reported (paid) losses by the reciprocal ofthe assumed reported (paid) percentage (e.g., 1/x%). Reserves are then calculated by subtracting paid claimsfrom the estimated ultimate liabilities.
The main strengths of the method are that it is reactive to loss emergence (payments) and that it makes fulluse of historical experience on claim emergence (payments). For homogeneous low volatility lines, under stableeconomic conditions the method can often produce good estimates of ultimate liabilities and reserves. However,the method has weaknesses when the underlying assumption of stable patterns is not true. This may be theconsequence of changes in the mix of business, changes in claim inflation trends, changes in claim reportingpractices or the presence of large claims, among other things. Furthermore, the method tends to produce volatileestimates of ultimate liabilities in situations where there is volatility in reported (paid) patterns. In particular,when the expected percentage reported (paid) is low, small deviations between actual and expected claims canlead to very volatile estimates of ultimate liabilities and reserves. Consequently, this method is often unsuitablefor projections at early development stages of an underwriting year. Finally, the method fails to incorporate anyinformation regarding market conditions, pricing, etc., which could improve the estimate of liabilities andreserves. It therefore tends not to perform very well in situations where there are rapidly changing marketconditions.
Expected Loss Ratio (ELR) Method
This method estimates ultimate losses for an underwriting year by applying an estimated loss ratio to theearned premium for that underwriting year. Although the method is insensitive to actual reported or paid losses,it can often be useful at the early stages of development when very few losses have been reported or paid, and theprincipal sources of information available to the Company consist of information obtained during pricing andqualitative information supplied by the cedant. However, the lack of sensitivity to reported or paid losses meansthat the method is usually inappropriate at later stages of development.
Bornhuetter-Ferguson (B-F) Methods (Reported or Paid)
These methods aim to address the concerns of the Chain Ladder Development methods, which are thevariability at early stages of development and the failure to incorporate external information such as pricing.However, the B-F methods are more sensitive to reported and paid losses than the Expected Loss Ratio method,and can be seen as a blend of the Expected Loss Ratio and Chain Ladder development methods. Unreported(unpaid) claims are calculated using an expected reporting (payment) pattern and an externally determined
59

estimate of ultimate liabilities (usually determined by multiplying an a priori loss ratio with estimates ofpremium volume). The accuracy of the a priori loss ratio is a critical assumption in this method. Usually a prioriloss ratios are initially determined on the basis of pricing information, but may also be adjusted to reflect otherinformation that subsequently emerges about underlying loss experience.
Although the method tends to provide less volatile indications at early stages of development and reflectschanges in the external environment, this method can be slow to react to emerging loss development (payment).In particular, to the extent that the a priori loss ratios prove to be inaccurate (and are not revised), the B-Fmethods will produce loss estimates that take longer to converge with the final settlement value of loss liabilities.
Benktander (B-K) Methods (Reported or Paid)
These methods can be viewed as a blend between the Chain Ladder Development and the B-F methodsdescribed above. The blend is based on predetermined weights at each development stage that depend on thereported (paid) development patterns.
Although mitigated to some extent, this method still exhibits the same advantages and disadvantages as theB-F method, but the mechanics of the calculation imply that it is more reactive to loss emergence (payment) thanthe B-F method.
Method Weights
In determining the loss reserves, the Company often relies on a blend of the results from two or moremethods (e.g., weighted averages). The judgment as to which of the above method(s) is most appropriate for aparticular underwriting year and reserving cell could change over time as new information emerges regardingunderlying loss activity and other data issues. Furthermore, as each line is typically composed of severalreserving cells, it is likely that the reserves for the line will be dependent on several reserving methods. This isbecause reserves for a line are the result of aggregating the reserves for each constituent reserving cell and that adifferent method could be selected for each reserving cell. Although it is not appropriate to refer to reserves for aline as being determined by a particular method, the table below summarizes the methods that were givenprincipal weight in selecting the best estimates of reserves in each reserving line and can therefore be viewed askey drivers of selected reserves. The table distinguishes methods for mature and immature underwriting years, asthey are often different. The definition of maturity is specific to a line and is related to the reporting tail. If at thereserve evaluation date, a significant proportion of losses for the underwriting year are expected to have beenreported, then the underwriting year is deemed to be mature, otherwise it is deemed to be immature. For short-taillines, such as property or agriculture, immature years can refer to the one or two most recent underwriting years,while for longer tail lines, such as casualty, immature years can refer to the three or four most recentunderwriting years. To the extent that the principal reserving methods used for major components of a reservingline are different, these are separately identified in the table below.
60

Reserving line forNon-life Segment
Non-lifeSub-segment
ImmatureUnderwriting
Years
MatureUnderwriting
Years
Agriculture . . . . . . . . . . . . . . . North America and Global(Non-U.S.) Specialty
Expected Loss Ratio /Reported B-F
Reported B-F / Reported CL
Aviation / Space . . . . . . . . . . Global (Non-U.S.)Specialty
Expected Loss Ratio /Reported B-F
Reported B-F / Reported CL
Casualty . . . . . . . . . . . . . . . . . North America Expected Loss Ratio Reported B-F
Casualty / SpecialtyCasualty . . . . . . . . . . . . . . .
Global (Non-U.S.) P&Cand Global (Non-U.S.)Specialty
Expected Loss Ratio /Reported B-F
Reported B-F
Catastrophe . . . . . . . . . . . . . . Catastrophe Expected Loss Ratiobased on exposure analysis
Reported B-F
Credit / Surety . . . . . . . . . . . . North America and Global(Non-U.S.) Specialty
Expected Loss Ratio /Reported B-F
Reported B-F / Reported B-K
Energy Onshore . . . . . . . . . . . Global (Non-U.S.)Specialty
Expected Loss Ratio /Reported B-F / Reported B-K
Reported CL / Reported B-F
Engineering . . . . . . . . . . . . . . Global (Non-U.S.)Specialty
Expected Loss Ratio /Reported B-F
Reported B-F / Reported CL
Marine / Energy Offshore . . . Global (Non-U.S.)Specialty
Reported B-F / Expected LossRatio
Reported B-F
Motor . . . . . . . . . . . . . . . . . . . North America Expected Loss Ratio /Reported B-F
Expected Loss Ratio /Reported B-F
Motor—Non-proportional . . . Global (Non-U.S.) P&C Expected Loss Ratio Reported B-F
Motor—Proportional . . . . . . . Global (Non-U.S.) P&C Expected Loss Ratio /Reported B-F
Reported B-F
Multiline . . . . . . . . . . . . . . . . North America Expected Loss Ratio /Reported B-F
Reported B-F
Property . . . . . . . . . . . . . . . . . North America Reported B-F / Expected LossRatio
Reported B-F
Property / SpecialtyProperty . . . . . . . . . . . . . . .
Global (Non-U.S.) P&Cand Global (Non-U.S.)Specialty
Reported B-K /Expected Loss Ratio /Reported B-F
Reported CL
Other . . . . . . . . . . . . . . . . . . . North America, Global(Non-U.S.) P&C andGlobal (Non-U.S.)Specialty
Periodic actuarial studies Periodic actuarial studies
61

The reserving methods used by the Company are dependent on a number of key parameter assumptions. Theprincipal parameter assumptions underlying the methods used by the Company are:
(i) the loss development factors used to form an expectation of the evolution of reported and paidclaims for several years following the inception of the underwriting year. These are often derived byexamining the Company’s data after due consideration of the underlying factors listed below. Insome cases, where the Company lacks sufficient volume to have statistical credibility, externalbenchmarks are used to supplement the Company’s data;
(ii) the tail factors used to reflect development of paid and reported losses after several years haveelapsed since the inception of the underwriting year;
(iii) the a priori loss ratios used as inputs in the B-F methods; and
(iv) the selected loss ratios used as inputs in the Expected Loss Ratio method.
The validity of all parameter assumptions used in the reserving process is reaffirmed on a quarterly basis.Reaffirmation of the parameter assumptions means that the actuaries determine that the parameter assumptionscontinue to form a sound basis for projection of future liabilities. Parameter assumptions used in projecting futureliabilities are themselves estimates based on historical information. As new information becomes available (e.g.,additional losses reported), the Company’s actuaries determine whether a revised estimate of the parameterassumptions that reflects all available information is consistent with the previous parameter assumptionsemployed. In general, to the extent that the revised estimate of the parameter assumptions are within a closerange of the original assumptions, the Company determines that the parameter assumptions employed continue toform an appropriate basis for projections and continue to use the original assumptions in its models. In this case,any differences could be attributed to the imprecise nature of the parameter estimation process. However, to theextent that the deviations between the two sets of estimates are not within a close range of the originalassumptions, the Company reacts by adopting the revised assumptions as a basis for its reserve models.Notwithstanding the above, even where the Company has experienced no material deviations from its originalassumptions during any quarter, the Company will generally revise the reserving parameter assumptions at leastonce a year to reflect all accumulated available information.
In addition to examining the data, the selection of the parameter assumptions is dependent on severalunderlying factors. The Company’s actuaries review these underlying factors and determine the extent to whichthese are likely to be stable over the time frame during which losses are projected, and the extent to which thesefactors are consistent with the Company’s data. If these factors are determined to be stable and consistent withthe data, the estimation of the reserving parameter assumptions are mainly carried out using actuarial andstatistical techniques applied to the Company’s data. To the extent that the actuaries determine that they cannotcontinue to rely on the stability of these factors, the statistical estimates of parameter assumptions are modified toreflect the direction of the change. The main underlying factors upon which the estimates of reserving parametersare predicated are:
(i) the cedant’s business practices will proceed as in the past with no material changes either insubmission of accounts or cash flows;
(ii) any internal delays in processing accounts received by the cedant are not materially different fromthat experienced historically, and hence the implicit reserving allowance made in loss reservesthrough the methods continues to be appropriate;
(iii) case reserve reporting practices, particularly the methodologies used to establish and report casereserves, are unchanged from historical practices;
(iv) the Company’s internal claim practices, particularly the level and extent of use of ACRs areunchanged;
(v) historical levels of claim inflation can be projected into the future and will have no material effect oneither the acceleration or deceleration of claim reporting and payment patterns;
62

(vi) the selection of reserving cells results in homogeneous and credible future expectations for allbusiness in the cell and any changes in underlying treaty terms are either reflected in cell selection orexplicitly allowed in the selection of trends;
(vii) in cases where benchmarks are used, they are derived from the experience of similar business; and
(viii) the Company can form a credible initial expectation of the ultimate loss ratio of recent underwritingyears through a review of pricing information, supplemented by qualitative information on marketevents.
The Company’s best estimate of total loss reserves is typically in excess of the midpoint of the actuarialultimate liability estimate. The Company believes that there is potentially significant risk in estimating lossreserves for long-tail lines of business and for immature underwriting years that may not be adequately capturedthrough traditional actuarial projection methodologies as these methodologies usually rely heavily on projectionsof prior year trends into the future. In selecting its best estimate of future liabilities, the Company considers boththe results of actuarial point estimates of loss reserves as well as the potential variability of these estimates ascaptured by a reasonable range of actuarial liability estimates. The selected best estimates of reserves are alwayswithin the reasonable range of estimates indicated by the Company’s actuaries. In determining the appropriatebest estimate, the Company reviews (i) the position of overall reserves within the actuarial reserve range, (ii) theresult of bottom up analysis by underwriting year reflecting the impact of parameter uncertainty in actuarialcalculations, and (iii) specific qualitative information on events that may have an effect on future claims butwhich may not have been adequately reflected in actuarial estimates, such as potential for outstanding litigation,claims practices of cedants, etc.
During 2011, 2010 and 2009, the Company reviewed its estimate for prior year losses for the Non-lifesegment and, in light of developing data, adjusted its ultimate loss ratios for prior accident years. The followingtable summarizes the net prior year favorable reserve development for each sub-segment of the Company’sNon-life segment for the years ended December 31, 2011, 2010 and 2009 (in millions of U.S. dollars):
2011 2010 2009
Net Non-life prior year favorable reserve development:North America . . . . . . . . . . . . . . . . . . . . . . . . . . . . . . . . . . . . . . . . . . . . . . . . . . . . . . . . . $189 $165 $177Global (Non-U.S.) P&C . . . . . . . . . . . . . . . . . . . . . . . . . . . . . . . . . . . . . . . . . . . . . . . . . 116 98 152Global (Non-U.S.) Specialty . . . . . . . . . . . . . . . . . . . . . . . . . . . . . . . . . . . . . . . . . . . . . . 129 171 108Catastrophe . . . . . . . . . . . . . . . . . . . . . . . . . . . . . . . . . . . . . . . . . . . . . . . . . . . . . . . . . . . 96 44 49
Total net Non-life prior year favorable reserve development . . . . . . . . . . . . . . . . . . . . . . . . . $530 $478 $486
The net Non-life prior year favorable reserve development for the years ended December 31, 2011, 2010and 2009 was driven by the following factors (in millions of U.S. dollars):
2011 2010 2009
Net Non-life prior year (adverse) favorable reserve development:Net prior year reserve development due to changes in premiums (1) . . . . . . . . . . . . . . . $ (59) $ (7) $ 9Net prior year reserve development due to all other factors (2) . . . . . . . . . . . . . . . . . . . . 589 485 477
Total net Non-life prior year favorable reserve development . . . . . . . . . . . . . . . . . . . . . . . . $530 $478 $486
(1) Net prior year reserve development due to changes in premiums includes, but it is not limited to, the impactto prior years reserves associated with (increases) decreases in the estimated or actual premium exposurereported by cedants.
(2) Net prior year reserve development due to all other factors includes, but is not limited to, loss experience,changes in assumptions and changes in methodology.
For a discussion of net prior year favorable reserve development by Non-life sub-segment, see Results bySegment below and Note 9 to Consolidated Financial Statements in Item 8 of Part II of this report.
63

The table below summarizes the net prior year favorable (adverse) reserve development for the year endedDecember 31, 2011 by reserving line for the Company’s Non-life segment (in millions of U.S. dollars):
Reserving lines
Net favorable(adverse)prior year
reservedevelopment
Agriculture . . . . . . . . . . . . . . . . . . . . . . . . . . . . . . . . . . . . . . . . . . . . . $ 17Aviation / Space . . . . . . . . . . . . . . . . . . . . . . . . . . . . . . . . . . . . . . . . . 50Casualty / Specialty Casualty . . . . . . . . . . . . . . . . . . . . . . . . . . . . . . . 172Catastrophe . . . . . . . . . . . . . . . . . . . . . . . . . . . . . . . . . . . . . . . . . . . . . 96Credit / Surety . . . . . . . . . . . . . . . . . . . . . . . . . . . . . . . . . . . . . . . . . . . 48Energy Onshore . . . . . . . . . . . . . . . . . . . . . . . . . . . . . . . . . . . . . . . . . (11)Engineering . . . . . . . . . . . . . . . . . . . . . . . . . . . . . . . . . . . . . . . . . . . . . (2)Marine / Energy Offshore . . . . . . . . . . . . . . . . . . . . . . . . . . . . . . . . . . 23Motor—Non-U.S. Non-proportional business . . . . . . . . . . . . . . . . . . 54Motor—Non-U.S. Proportional business . . . . . . . . . . . . . . . . . . . . . . 3Motor—North America business . . . . . . . . . . . . . . . . . . . . . . . . . . . . (2)Multiline . . . . . . . . . . . . . . . . . . . . . . . . . . . . . . . . . . . . . . . . . . . . . . . 21Property / Specialty Property . . . . . . . . . . . . . . . . . . . . . . . . . . . . . . . 59Other . . . . . . . . . . . . . . . . . . . . . . . . . . . . . . . . . . . . . . . . . . . . . . . . . . 2
Total net Non-life prior year favorable reserve development . . . . . . $530
The following paragraphs discuss how losses paid and reported during the year ended December 31, 2011compared with the Company’s expectations, and how the Company modified its reserving parameterassumptions in line with the emerging development in each reserving line.
Agriculture: Aggregate losses reported during the year for North America business were below theCompany’s expectations, and primarily related to the 2010 underwriting year, while Global (Non-U.S.)business was in line with expectations. The Company lowered its loss ratio picks, but did not otherwisematerially alter its reserving assumptions.
Aviation / Space: The overall losses reported during the year were significantly lower than theCompany’s expectations. The Company reflected this experience by selecting lower loss ratios forunderwriting years 2008 to 2010.
Casualty / Specialty Casualty: Aggregate losses reported for North America casualty lines have beensignificantly lower than expected, predominantly for underwriting years 2003-2007. The Company reflectedthis favorable experience partially by giving more weight to loss experience based actuarial indications thatresulted in lower loss ratio picks for those underwriting years. In addition, actual development of claimsrelating to the financial crisis of 2008-2009 has been less than expected and ultimate loss estimates havereduced as a result. For Global (Non-U.S.) lines, overall reported losses were lower than expected forunderwriting years 2003-2008 for business in both Global (Non-U.S.) P&C and Global (Non-U.S.)Specialty sub-segments. The Company reflected this experience by reducing the loss ratio selections as wellas changing in the initial expected loss ratio and loss development tail factor assumptions.
Catastrophe: Reserves established for the catastrophe line are primarily a function of the presence orabsence of catastrophic events during the year, and the complexity and uncertainty associated withestimating unpaid losses from these large disclosed events. In addition, reserves are established inconsideration of mid-sized and attritional loss events that occur during a year. Approximately half thereduction in prior year reserves is a result of catastrophic and mid-sized losses developing better thanexpected and the remainder of the reduction resulted from lower than expected development of attritionallosses.
64

Credit / Surety: Aggregate losses reported during the year were higher than expected for NorthAmerica business due to an individual loss reported impacting the 1998 and 1999 underwriting years. ForGlobal (Non-U.S.) business, loss development was significantly better than expected, primarily for theunderwriting year 2009, which was impacted by the financial crisis. The Company reduced the loss ratiosfor most prior underwriting years reflecting the fact that loss emergence was lower than expected.
Energy Onshore: Aggregate reported losses were higher than expected during the year, which wasdriven by increases in premium exposure for various underwriting years, primarily for the underwriting year2010. The Company did not materially change its reserving assumptions for this line.
Engineering: Aggregate reported losses were modestly higher than expected losses for the year, whichwas driven by increases in premium exposure for various underwriting years. The Company did notmaterially change its reserving assumptions for this line.
Marine/Energy Offshore: Aggregate reported losses during the year were lower than expected. TheCompany reacted to the favorable experience by reducing loss ratios for the 2007- 2009 underwriting years.
Motor:
• Aggregate losses reported for North American motor line were modestly higher than expected forthe 2008 -2010 underwriting years. The Company selected higher loss ratios reflecting thisdevelopment for those specific years.
• Aggregate losses reported for the Global (Non-U.S.) motor non-proportional line weresignificantly lower than expectations in most countries resulting in the Company lowering its lossdevelopment tail factor assumptions in addition to reflecting the experience within their loss ratiopicks.
• Aggregate losses reported for the Global (Non-U.S.) motor proportional line were modestly lowerthan expected resulting in the Company lowering its loss development tail factor assumptions inaddition to reflecting the experience within their loss ratio picks.
Multiline: Reported losses were lower than expected for most underwriting years. In addition toselecting lower loss ratios due to the reported loss development, the Company also reflected this experiencethrough the updating of loss development factors for this line.
Property / Specialty Property: Aggregate losses reported for North America and Global (Non-U.S.)property lines were lower than expected for most years. The Company reflected this experience bydecreasing its loss ratios for the most recent underwriting years.
65

As an example of the sensitivity of the Company’s reserves to reserving parameter assumptions, the tablesbelow summarize, by reserving line, the effect on the Company’s reserves of higher/lower a priori loss ratioselections, higher/lower loss development factors and higher/lower tail factors. The Company believes that theillustrated sensitivities to the reserving parameter assumptions are indicative of the potential variability inherentin the estimation process of those parameters.
Reserving lines selected assumptions
Highera priori
loss ratios
Higherloss
developmentfactors
Highertail
factors (1)
Lowera priori
loss ratios
Lowerloss
developmentfactors
Lowertail
factors (1)
Agriculture . . . . . . . . . . . . . . . . . . . . . . . . . 5 points 3 months 2% (5) points (3) months (2)%Aviation / Space . . . . . . . . . . . . . . . . . . . . . 5 3 5 (5) (3) (5)Casualty / Specialty Casualty . . . . . . . . . . . 10 6 10 (10) (6) (10)Catastrophe . . . . . . . . . . . . . . . . . . . . . . . . . 5 3 2 (5) (3) (2)Credit / Surety . . . . . . . . . . . . . . . . . . . . . . 5 3 2 (5) (3) (2)Energy Onshore . . . . . . . . . . . . . . . . . . . . . 5 3 2 (5) (3) (2)Engineering . . . . . . . . . . . . . . . . . . . . . . . . 10 6 5 (10) (6) (5)Marine / Energy Offshore . . . . . . . . . . . . . 5 3 5 (5) (3) (5)Motor—Non-U.S. Non-proportional
business . . . . . . . . . . . . . . . . . . . . . . . . . 10 12 10 (10) (12) (10)Motor—Non-U.S. Proportional
business . . . . . . . . . . . . . . . . . . . . . . . . . 5 3 2 (5) (3) (2)Motor—North America business . . . . . . . . 5 3 2 (5) (3) (2)Multiline . . . . . . . . . . . . . . . . . . . . . . . . . . . 5 6 5 (5) (6) (5)Property / Specialty Property . . . . . . . . . . . 5 3 2 (5) (3) (2)
Reserving lines selected sensitivity(in millions of U.S. dollars)
Highera priori
loss ratios
Higherloss
developmentfactors
Highertail
factors (1)
Lowera priori
loss ratios
Lowerloss
developmentfactors
Lowertail
factors (1)
Agriculture . . . . . . . . . . . . . . . . . . . . . . . . . . $ 20 $ 10 $— $ (20) $— $ —Aviation / Space . . . . . . . . . . . . . . . . . . . . . . 10 20 10 (10) (10) (5)Casualty / Specialty Casualty . . . . . . . . . . . . 310 150 215 (305) (90) (205)Catastrophe . . . . . . . . . . . . . . . . . . . . . . . . . . 10 5 — (10) — —Credit / Surety . . . . . . . . . . . . . . . . . . . . . . . . 40 20 5 (40) (10) (5)Energy Onshore . . . . . . . . . . . . . . . . . . . . . . 10 20 — (10) (15) —Engineering . . . . . . . . . . . . . . . . . . . . . . . . . . 35 50 40 (35) (30) (30)Marine / Energy Offshore . . . . . . . . . . . . . . . 25 25 5 (25) (15) —Motor—Non-U.S. Non-proportional
business . . . . . . . . . . . . . . . . . . . . . . . . . . . 40 30 45 (40) (30) (55)Motor—Non-U.S. Proportional business . . . 10 10 5 (10) — (5)Motor—North America business . . . . . . . . . 10 10 5 (10) (5) (5)Multiline . . . . . . . . . . . . . . . . . . . . . . . . . . . . 10 15 30 (10) (10) (20)Property / Specialty Property . . . . . . . . . . . . 50 100 5 (50) (40) (10)
(1) Tail factors are defined as aggregate development factors after 10 years from the inception of anunderwriting year.
Some reserving lines show little sensitivity to a priori loss ratio, loss development factor or tail factor as theCompany may use reserving methods such as the Expected Loss Ratio method in several of its reserving cellswithin those lines. It is not appropriate to sum the total impact for a specific factor or the total impact for aspecific reserving line as the lines of business are not perfectly correlated.
66

The following table shows the gross reserves reported by cedants (case reserves), those estimated by theCompany (ACRs and IBNR reserves) and the total gross, ceded and net loss reserves recorded at December 31,2011 by reserving line for the Company’s Non-life operations (in millions of U.S. dollars):
Reserving lines Case reserves ACRsIBNR
reserves
Total grossloss reserves
recordedCeded loss
reserves
Total netloss reserves
recorded
Agriculture . . . . . . . . . . . . . . . . . . . . . . . . . . $ 15 $— $ 219 $ 234 $ — $ 234Aviation / Space . . . . . . . . . . . . . . . . . . . . . . 263 2 180 445 (46) 399Casualty / Specialty Casualty . . . . . . . . . . . . 1,530 110 2,572 4,212 (30) 4,182Catastrophe . . . . . . . . . . . . . . . . . . . . . . . . . . 688 317 427 1,432 (81) 1,351Credit / Surety . . . . . . . . . . . . . . . . . . . . . . . . 258 4 169 431 — 431Energy Onshore . . . . . . . . . . . . . . . . . . . . . . 133 4 82 219 (5) 214Engineering . . . . . . . . . . . . . . . . . . . . . . . . . . 282 1 172 455 (15) 440Marine / Energy Offshore . . . . . . . . . . . . . . . 397 18 390 805 (160) 645Motor—Non-U.S. Non-proportional
business . . . . . . . . . . . . . . . . . . . . . . . . . . . 477 2 378 857 (2) 855Motor—Non-U.S. Proportional business . . . 99 — 78 177 (7) 170Motor—North America business . . . . . . . . . 110 4 140 254 — 254Multiline . . . . . . . . . . . . . . . . . . . . . . . . . . . . 81 17 118 216 — 216Property / Specialty Property . . . . . . . . . . . . 855 17 638 1,510 (7) 1,503Other . . . . . . . . . . . . . . . . . . . . . . . . . . . . . . . — — 26 26 — 26
Total Non-life reserves . . . . . . . . . . . . . . . . . $5,188 $496 $5,589 $11,273 $(353) $10,920
The net loss reserves represent the Company’s best estimate of future losses and loss expense amounts basedon the information available at December 31, 2011. Loss reserves rely upon estimates involving actuarial andstatistical projections at a given time that reflect the Company’s expectations of the costs of the ultimate settlementand administration of claims. Estimates of ultimate liabilities are contingent on many future events and the eventualoutcome of these events may be different from the assumptions underlying the reserve estimates. In the event thatthe business environment and social trends diverge from historical trends, the Company may have to adjust its lossreserves to amounts falling significantly outside its current estimate. These estimates are continually reviewed andthe ultimate liability may be in excess of, or less than, the amounts provided, for which any adjustments will bereflected in the period in which the need for an adjustment is determined.
The Company’s best estimates are point estimates within a reasonable range of actuarial liability estimates.These ranges are developed using stochastic simulations and techniques and provide an indication as to thedegree of variability of the loss reserves. The Company interprets the ranges produced by these techniques asconfidence intervals around the point estimates for each Non-life sub-segment. However, due to the inherentvolatility in the business written by the Company, there can be no assurance that the final settlement of the lossreserves will fall within these ranges.
67

The point estimates related to net loss reserves recorded by the Company, and the range of actuarialestimates at December 31, 2011 and 2010, were as follows for each sub-segment of the Non-life segment (inmillions of U.S. dollars):
Recorded PointEstimate High Low
2011 Net Non-life sub-segment loss reserves:North America . . . . . . . . . . . . . . . . . . . . . . . . . . . . . . . . . . . . . . . . . . . . . . . . . . . $3,265 $3,427 $2,620Global (Non-U.S.) P&C . . . . . . . . . . . . . . . . . . . . . . . . . . . . . . . . . . . . . . . . . . . . 2,614 2,747 2,287Global (Non-U.S.) Specialty . . . . . . . . . . . . . . . . . . . . . . . . . . . . . . . . . . . . . . . . 3,690 3,910 3,207Catastrophe . . . . . . . . . . . . . . . . . . . . . . . . . . . . . . . . . . . . . . . . . . . . . . . . . . . . . . 1,351 1,392 1,212
2010 Net Non-life sub-segment loss reserves:North America . . . . . . . . . . . . . . . . . . . . . . . . . . . . . . . . . . . . . . . . . . . . . . . . . . . $3,173 $3,390 $2,506Global (Non-U.S.) P&C . . . . . . . . . . . . . . . . . . . . . . . . . . . . . . . . . . . . . . . . . . . . 2,693 2,937 2,332Global (Non-U.S.) Specialty . . . . . . . . . . . . . . . . . . . . . . . . . . . . . . . . . . . . . . . . 3,609 3,764 3,207Catastrophe . . . . . . . . . . . . . . . . . . . . . . . . . . . . . . . . . . . . . . . . . . . . . . . . . . . . . . 843 889 795
It is not appropriate to add together the ranges of each sub-segment in an effort to determine a high and lowrange around the Company’s total Non-life carried loss reserves.
Of the Company’s $10,920 million of net Non-life loss reserves at December 31, 2011, net loss reserves foraccident years 2005 and prior of $1,012 million are guaranteed by Colisée Re, pursuant to the ReserveAgreement. The Company is not subject to any loss reserve variability associated with the guaranteed reserves.See Business – Reserves in Item 1 of Part I of this report.
In 2011, the Company was exposed to a high frequency of large catastrophic events on a worldwide basis.The events that had a material impact on the Company were the Japan Earthquake, the February and June 2011New Zealand Earthquakes, the Thailand Floods, the U.S. tornadoes and the Australian Floods (the 2011catastrophic events). Reserves were established for each of these events after the consideration of catastrophemodel output, industry loss experience, cedant advices, contract by contract analysis of the Company’s exposure,actual claims development, on site claims audits performed by the Company, developments relating to legal andcontractual liability, and management judgment concerning the complexity and uncertainties in estimating theultimate losses given the nature and number of events.
Given the number and complex nature of the 2011 catastrophic events, a significant amount of judgmentwas used to estimate the range of potential losses from these events and there remains a considerable degree ofuncertainty related to the range of possible ultimate liabilities. These risks and uncertainties include the ongoingcedant and industry revisions of various magnitudes for each of these events, the inability to access certain areasand zones affected by these events to reliably assess claims information, the continuing uncertainty regardinggovernment regulations with respect to the standards of rebuilding in certain affected areas, the degree to whichinflation impacts material required to rebuild affected properties, the characteristics of the Company’s programparticipation for certain affected cedants and potentially affected cedants, and the expected length of the claimssettlement period for these events. In addition, there is additional complexity related to the 2011 and 2010 NewZealand Earthquakes given multiple earthquakes have occurred in the same region in a relatively short timeperiod, resulting in cedants revising their allocation of losses between various treaties, under which the Companymay provide different amounts of coverage.
Loss estimates arising from earthquakes are inherently more uncertain than those from other catastrophicevents. The Company’s actual losses from the 2010 and the February and June 2011 New Zealand Earthquakesmay materially exceed the estimated losses as a result of, among other things, an increase in industry insured lossestimates, the expected lengthy claims development period, in particular for earthquake related losses, and thereceipt of additional information from cedants, brokers and loss adjusters. In addition, the Company’s lossestimate related to the Japan Earthquake is inherently more uncertain than those from other catastrophic events
68

given the characteristics of the Company’s reinsurance portfolio in the region. Further, changes in lossassumptions for specific cedants may have a material impact on the Company’s loss estimate related to this eventgiven a significant portion of the losses are concentrated with a few large cedants. The Company believes thereremains a high degree of uncertainty related to its loss estimates related to the 2010 and the February and June2011 New Zealand Earthquakes and the Japan Earthquake, and the ultimate losses arising from these events maybe materially in excess of, or less than, the amounts provided for in the Consolidated Balance Sheet atDecember 31, 2011.
Based upon information currently available and the estimated range of potential ultimate liabilities, theCompany believes that unpaid loss and loss expense reserves contemplate a reasonable provision for exposurerelated to the 2011 catastrophic events. In addition to the sum of the point estimates recorded for each of the2011 catastrophic events, the Company has recorded additional gross reserves of $50 million (net reserves of $48million after the impact of retrocession), specifically related to the 2011 catastrophic events within itsCatastrophe sub-segment. The additional gross reserves recorded are in consideration of the number of events,the complexity of certain events and the continuing uncertainties in estimating the ultimate losses for these eventsin the aggregate, as discussed in the preceding paragraphs.
The Company will continue to evaluate the additional gross reserves that have been recorded at December 31,2011 as part of its future periodic reserving process. Any changes to the amounts recorded will be based on updatedor new information and Management’s assessment of remaining uncertainty related to the specific factors regardingthe 2011 catastrophic events given any new or updated information. Changes to the amounts recorded may eitherresult in: i) the reallocation of some or all of the additional reserves to one or more of the 2011 catastrophic events;or ii) the release of some or all of the additional reserves to net income in future periods.
Included in the business that is considered to have a long reporting tail is the Company’s exposure toasbestos and environmental claims. The Company’s net reserves for unpaid losses and loss expenses atDecember 31, 2011 included $195 million that represents estimates of its net ultimate liability for asbestos andenvironmental claims. The gross liability for such claims at December 31, 2011 was $203 million, whichprimarily relates to Paris Re’s gross liability for asbestos and environmental claims for accident years 2005 andprior of $127 million, with any favorable or adverse development being subject to the Reserve Agreement. Of theremaining $76 million in gross reserves, the majority relates to casualty exposures in the United States arisingfrom business written by PartnerRe SA and PartnerRe U.S.
Ultimate loss estimates for such claims cannot be estimated using traditional reserving techniques and thereare significant uncertainties in estimating the amount of the Company’s potential losses for these claims. In viewof the legal and tort environment that affect the development of such claims, the uncertainties inherent inestimating asbestos and environmental claims are not likely to be resolved in the near future. There can be noassurance that the reserves established by the Company will not be adversely affected by development of otherlatent exposures, and further, there can be no assurance that the reserves established by the Company will beadequate. The Company does, however, actively evaluate potential exposure to asbestos and environmentalclaims and establishes additional reserves as appropriate. The Company believes that it has made a reasonableprovision for these exposures and is unaware of any specific issues that would materially affect its unpaid lossesand loss expense reserves related to this exposure (see Note 9 to Consolidated Financial Statements in Item 8 ofPart II of this report).
Life Policy Benefits
Policy benefits for life and annuity contracts relate to the business in the Company’s Life segment, whichpredominately includes reinsurance of longevity, subdivided into standard and non-standard annuities, andmortality business, which includes death and disability covers (with various riders) primarily written inContinental Europe, TCI primarily written in the U.K. and Ireland, and GMDB business primarily written inContinental Europe.
69

The Company categorizes life reserves into three types of reserves: reported outstanding loss reserves (casereserves), incurred but not reported (IBNR) reserves and reserves for future policy benefits. Case reservesrepresent unpaid losses reported by the Company’s cedants and recorded by the Company. IBNR reservesrepresent a provision for claims that have been incurred but not yet reported to the Company, as well as futureloss development on losses already reported, in excess of the case reserves. Reserves for future policy benefits,which relate to future events occurring on policies in force over an extended period of time, are calculated as thepresent value of future expected benefits to be paid, reduced by the present value of future expected premiums.Such liabilities are established based on methods and underlying assumptions in accordance with U.S. GAAP andapplicable actuarial standards. Principal assumptions used in the establishment of reserves for future policybenefits have been determined based upon information reported by ceding companies, supplemented by theCompany’s actuarial estimates of mortality, critical illness, persistency and future investment income, withappropriate provision to reflect uncertainty. Case reserves, IBNR reserves and reserves for future policy benefitsare generally calculated at the treaty level. The Company updates its estimates for each of the aforementionedcategories on a periodic basis using information received from its cedants.
The Company’s reserving practices begin with the categorization of the contracts written as short duration,long duration, or universal life business for U.S. GAAP reserving purposes. This categorization determines theCompany’s reserving methodology which is described by line of business below.
Longevity
The reserves for the annuity portfolio of reinsurance contracts within the longevity book are established inaccordance with the provisions for long duration insurance contracts under U.S. GAAP. Many of these contractssubject the Company to risks arising from policyholder mortality over a period that extends beyond the periods inwhich premiums are collected. For long duration contracts, the Company establishes initial reserves based uponManagement’s best estimate of policy benefits and includes a provision for adverse deviation. Management’sbest estimate relies upon actuarial indications of future policy benefits. The provision for adverse deviationcontemplates reasonable deviations from the best estimate assumptions for the key risk elements relevant to theproduct being evaluated, including mortality, critical illness, persistency, expenses, and discount rate amongothers, and are recorded in accordance with U.S. GAAP and applicable actuarial standards. The Company’sactuaries annually verify the current reserving assumptions in consideration of evolving experience and theactuarial indications for assumptions relating to future policy benefits, including mortality, critical illness,persistency, and future investment income, among others. Management makes no adjustments to recordeddeferred acquisition costs or future policy benefits if the actuarial indications conclude that current recorded U.S.GAAP policy benefits are adequate. The Company establishes a premium deficiency reserve, or an increase tofuture policy benefits to the extent that deferred acquisition costs are insufficient to cover the premium deficiencyreserve, if the actuarial indication of life policy benefits is greater than current recorded aggregate amounts forpolicy benefits, settlement costs, and deferred acquisition costs.
For standard annuities, the main risk is a faster increase in future life span than expected in the medium tolong term. Non-standard annuities are annuities sold to people with aggravated health conditions and are usuallymedically underwritten on an individual basis and the main risk is the inadequate assessment of the future lifespan of the insured.
Mortality
The reserves for the short-term mortality business are established in accordance with the provisions for shortduration insurance contracts under U.S. GAAP. They consist of case reserves and IBNR, calculated at the treatylevel based upon cedant information. The Company’s reserving methodology includes a quarterly review ofactual experience against expected experience and the use of the Expected Loss Ratio method described inLosses and Loss Expenses above. Given the very short-term loss development of this portion of the portfolio, thismethod is considered appropriate.
70

The reserves for the long-term traditional mortality and TCI reinsurance portfolio are established inaccordance with the provisions for long duration insurance contracts under U.S. GAAP and follow the reservingmethodology discussed under the Longevity section above.
The reserves for the guaranteed minimum death benefits (GMDB) reinsurance business are established inaccordance with the provisions for universal life contracts under U.S. GAAP. Key actuarial assumptions for thisbusiness are mortality, lapses, interest rates, expected returns on cash and bonds and stock market performance.For the last parameter, a stochastic option pricing approach is used and the benefits used in calculating theliabilities are based on the average benefits payable over a range of scenarios. The assumptions of investmentperformance and volatility are consistent with expected future experience of the respective underlying fundsavailable for policyholder investment options. Recorded reserves for GMDB reflect Management’s best estimatewhich relies upon the quarterly actuarial indications.
The following table provides the Company’s gross and net policy benefits for life and annuity contracts byreserving line at December 31, 2011 (in millions of U.S. dollars):
Reserving lines Case reservesIBNR
reserves
Reserves forfuture policy
benefits
Total grossLife
reservesrecorded
Cededreserves
Total netLife
reservesrecorded
Mortality . . . . . . . . . . . . . . . . . . . . . . . . . . . $188 $474 $461 $1,123 $ (5) $1,118Longevity . . . . . . . . . . . . . . . . . . . . . . . . . . 1 78 444 523 (5) 518
Total policy benefits for life and annuitycontracts . . . . . . . . . . . . . . . . . . . . . . . . . $189 $552 $905 $1,646 $(10) $1,636
Total gross policy benefits for life and annuity contracts include provisions for adverse deviation of $108million and $85 million at December 31, 2011 and 2010, respectively. The increase in the provisions for adversedeviation is a result of new business written in the longevity line.
As an example of the sensitivity of the Company’s policy benefits for life and annuity contracts to reservingparameter assumptions, the table below summarizes, by reserving line, the effect of different assumption selections.
Reserving lines Factors Change
Impact on totalLife reserves(in millions ofU.S. dollars)
LongevityNon-standard annuities . . . . . . . . . . . . Life expectancy + 1 year $ 34Standard annuities . . . . . . . . . . . . . . . . Mortality improvements per annum 1% 177
MortalityLong-term and TCI . . . . . . . . . . . . . . . Mortality 1% 30GMDB . . . . . . . . . . . . . . . . . . . . . . . . . Stock market performance -10% 6
The sensitivity of a 1% per annum improvement in mortality rates related to standard annuities in thelongevity line has increased from $122 million in 2010 to $177 million in 2011 due to a significant mortalityswap written in the longevity line in 2011.
It is not appropriate to sum the total impact for a specific reserving line or the total impact for a specificfactor because the reinsurance portfolios are not perfectly correlated.
Premiums and Acquisition Costs
The Company provides proportional and non-proportional reinsurance coverage to cedants (insurancecompanies). In most cases, cedants seek protection for business that they have not yet written at the time they
71

enter into reinsurance agreements and thus have to estimate the volume of premiums they will cede to theCompany. Reporting delays are inherent in the reinsurance industry and vary in length by reinsurance market(country of cedant) and type of treaty. As delays can vary from a few weeks to a year or sometimes longer, theCompany produces accounting estimates to report premiums and acquisition costs until it receives the cedants’actual premium reported data. Approximately, 43%, 42% and 48% of the Company’s reported net premiumswritten for 2011, 2010 and 2009, respectively, were based upon estimates.
Under proportional treaties, which represented 69% of the Company’s total gross premiums written for theyear ended December 31, 2011, the Company shares proportionally in both the premiums and losses of thecedant and pays the cedant a commission to cover the cedant’s acquisition costs. Under this type of treaty, theCompany’s ultimate premiums written and earned and acquisition costs are not known at the inception of thetreaty. As such, reported premiums written and earned and acquisition costs on proportional treaties are generallybased upon reports received from cedants and brokers, supplemented by the Company’s own estimates ofpremiums written and acquisition costs for which ceding company reports have not been received. Premium andacquisition cost estimates are determined at the individual treaty level. The determination of premium estimatesrequires a review of the Company’s experience with cedants, familiarity with each market, an understanding ofthe characteristics of each line of business and Management’s assessment of the impact of various other factorson the volume of business written and ceded to the Company. Premium and acquisition cost estimates areupdated as new information is received from the cedants and differences between such estimates and actualamounts are recorded in the period in which estimates are changed or the actual amounts are determined.
Under non-proportional treaties, which represented 31% of the Company’s total gross premiums written forthe year ended December 31, 2011, the Company is typically exposed to loss events in excess of a predetermineddollar amount or loss ratio and receives a fixed or minimum premium, which is subject to upward adjustmentdepending on the premium volume written by the cedant. In addition, many of the non-proportional treatiesinclude reinstatement premium provisions. Reinstatement premiums are recognized as written and earned at thetime a loss event occurs, where coverage limits for the remaining life of the contract are reinstated underpre-defined contract terms. The accrual of reinstatement premiums is based on Management’s estimate of lossesand loss expenses associated with the loss event.
The magnitude and impact of changes in premium estimates differs for proportional and non-proportionaltreaties. Although proportional treaties may be subject to larger changes in premium estimates compared tonon-proportional treaties, as the Company generally receives cedant statements in arrears and must estimate allpremiums for periods ranging from one month to more than one year (depending on the frequency of cedantstatements), the pre-tax impact is mitigated by changes in the cedant’s related reported acquisition costs and losses.The impact of the change in estimate on premiums earned and pre-tax results varies depending on when the changebecomes known during the risk period and the underlying profitability of the treaty. Non-proportional treatiesgenerally include a fixed minimum premium and an adjustment premium. While the fixed minimum premiumsrequire no estimation, adjustment premiums are estimated and could be subject to changes in estimates.
The following table shows the amounts recorded within net premiums written and earned that related tochanges in prior year premium estimates reported by cedants for each Non-life sub-segment for the year endedDecember 31, 2011 (in millions of U.S. dollars):
Non-life sub-segment Net premiums written Net premiums earned
North America . . . . . . . . . . . . . . . . . . . . . . . . . . . . . . . . . . . $ (50) $(30)Global (Non-U.S.) P&C . . . . . . . . . . . . . . . . . . . . . . . . . . . 23 20Global (Non-U.S.) Specialty . . . . . . . . . . . . . . . . . . . . . . . . 120 39Catastrophe . . . . . . . . . . . . . . . . . . . . . . . . . . . . . . . . . . . . . 35 29
Total . . . . . . . . . . . . . . . . . . . . . . . . . . . . . . . . . . . . . . . . . . . $128 $ 58
72

These increases in net premiums written and earned, after the corresponding adjustments to acquisition costsand losses and loss expenses, had no material impact on the Company’s consolidated pre-tax net loss. However,as shown, these adjustments are the result of offsetting impacts in each of the Company’s Non-life sub-segmentsfor the year ended December 31, 2011.
As an example of the sensitivity of the Company’s Non-life net premiums written and acquisition costs tochanges in estimates, the table below summarizes the effect of different assumption selections on pre-tax net lossbased on amounts recorded for the year ended December 31, 2011 (in millions of U.S. dollars):
Change
Impact onpre-taxnet loss
Net premiums written – Non-life proportional treaties (1) . . . . . . . . . . . . . . . . . . . . +/-5% $+/-8Net premiums written – Non-life non-proportional treaties (2) . . . . . . . . . . . . . . . . +/-5% +/-26Acquisition costs – all Non-life treaties (3) . . . . . . . . . . . . . . . . . . . . . . . . . . . . . . . +/-1% +/-4
(1) The estimate assumes that the changes in net premiums written become known at the mid-point of the riskperiod and is made by applying the reported technical ratio, before the impact of the 2011 catastrophicevents and prior year loss reserve development, for the year ended December 31, 2011.
(2) The estimate assumes that the changes in net premiums written become known at the mid-point of the riskperiod and also assume there is no change in losses and loss expenses.
(3) The estimate relates to all of the Company’s Non-life treaties (both proportional and non-proportional) andassumes that the changes become known at the mid-point of the risk period and also assumes there is nochange in premium estimates.
Acquisition costs, primarily brokerage fees, commissions and excise taxes, which vary directly with, and aredirectly related to, the acquisition of reinsurance contracts, are capitalized and charged to expense as the relatedpremium is earned. The recovery of deferred policy acquisition costs is dependent upon the future profitability ofthe related business. Deferred policy acquisition costs recoverability testing is performed periodically togetherwith the reserve adequacy test, based on the latest best estimate assumptions by line of business.
Income Taxes
Under U.S. GAAP, a deferred tax asset or liability is to be recognized for the estimated future tax effectsattributable to temporary differences and carryforwards. U.S. GAAP also establishes procedures to assesswhether a valuation allowance should be established for deferred tax assets. All available evidence, both positiveand negative, is considered to determine whether, based on the weight of that evidence, a valuation allowance isneeded for some portion or all of a deferred tax asset. Management must use its judgment in considering therelative impact of positive and negative evidence. The Company has also established tax liabilities relating touncertain tax positions as defined under U.S. GAAP of $12 million at December 31, 2011 (see Notes 2(l) and 15to Consolidated Financial Statements in Item 8 of Part II of this report).
The Company has estimated the future tax effects attributed to temporary differences and has a deferred taxasset at December 31, 2011 of $157 million, net of a valuation allowance of $29 million. The most significantcomponents of the deferred tax asset relate to loss reserve discounting for tax purposes.
The Company has projected future taxable income in the tax jurisdictions in which the deferred tax assetsarise. These projections are based on Management’s projections of premium and investment income, capitalgains and losses, and technical and expense ratios. Based on these projections and an analysis of the ability toutilize loss and foreign tax credits carryforwards at the taxable entity level, Management evaluates the need for avaluation allowance. The valuation allowance of $29 million, recorded at December 31, 2011, related to a taxloss carryforward in Singapore.
73

In accordance with U.S. GAAP, the Company has assumed that the future reversal of deferred tax liabilitieswill result in an increase in taxes payable in future years. Underlying this assumption is an expectation that theCompany will continue to be subject to taxation in the various tax jurisdictions and that the Company willcontinue to generate taxable revenues in excess of deductions.
As an example of the sensitivity of the Company’s unrecognized tax benefit related to uncertain taxpositions, deferred tax asset and net deferred tax liability, the table below summarizes the impact of differentassumption selections on the Company’s net loss and the corresponding impact on net assets based on amountsrecorded at December 31, 2011 (in millions of U.S. dollars):
2011 ChangeImpact on net loss
and net assets
Unrecognized tax benefit related to uncertain tax positions . . . . $ (12) +10% $ (1)Deferred tax asset . . . . . . . . . . . . . . . . . . . . . . . . . . . . . . . . . . . . . 157 -10% (16)Net deferred tax liability . . . . . . . . . . . . . . . . . . . . . . . . . . . . . . . . (200) +10% (20)
Valuation of Investments and Funds Held – Directly Managed, including certain Derivative FinancialInstruments
The Company defines fair value as the price received to sell an asset or paid to transfer a liability in anorderly transaction between market participants at the measurement date. The Company measures the fair valueof its financial instruments according to a fair value hierarchy that prioritizes the information used to measurefair value into three broad levels.
The fair value hierarchy prioritizes the inputs to valuation techniques used to measure fair value bymaximizing the use of observable inputs and minimizing the use of unobservable inputs by requiring that themost observable inputs be used when available. Observable inputs are inputs that market participants would usein pricing an asset or liability based on market data obtained from sources independent of the Company.Unobservable inputs are inputs that reflect the Company’s assumptions about what market participants would usein pricing the asset or liability based on the best information available in the circumstances. The level in thehierarchy within which a given fair value measurement falls is determined based on the lowest level input that issignificant to the measurement.
The Company must determine the appropriate level in the hierarchy for each financial instrument that itmeasures at fair value. In determining fair value, the Company uses various valuation approaches, includingmarket, income and cost approaches. See Note 3 to Consolidated Financial Statements in Item 8 of Part II of thisreport for more detail on the valuation techniques, methods and assumptions that were used by the Company toestimate the fair value of its fixed maturities and short-term investments, equities, other invested assets and itsfixed maturities, short-term investments and other invested assets underlying the funds held – directly managedaccount. See Note 6 to Consolidated Financial Statements in Item 8 of Part II of this report for more discussionof the Company’s use of derivative financial instruments.
The Company records all of its fixed maturities, short-term investments and equities, certain other investedassets, including derivative financial instruments, and its fixed maturities, short-term investments and certainother invested assets underlying the funds held – directly managed account at fair value in its ConsolidatedBalance Sheets. The changes in fair value of all of the Company’s investments, carried at fair value, are recordedin net realized and unrealized investment gains and losses in the Consolidated Statements of Operations and areincluded in the determination of net income or loss in the period in which they are recorded.
74

Under the fair value hierarchy, Management uses certain assumptions and judgments to derive the fair valueof its investments, particularly for those assets with significant unobservable inputs, commonly referred to asLevel 3 assets. At December 31, 2011, the Company’s financial instruments that were measured at fair value andcategorized as Level 3 were as follows (in millions of U.S. dollars):
2011
Fixed maturities . . . . . . . . . . . . . . . . . . . . . . . . . . . . . . . . . . . . . . . $480Equities . . . . . . . . . . . . . . . . . . . . . . . . . . . . . . . . . . . . . . . . . . . . . 16Other invested assets . . . . . . . . . . . . . . . . . . . . . . . . . . . . . . . . . . . 97Funds held – directly managed . . . . . . . . . . . . . . . . . . . . . . . . . . . 16
Total . . . . . . . . . . . . . . . . . . . . . . . . . . . . . . . . . . . . . . . . . . . . . . . $609
For the Company’s Level 3 fixed maturities, equities, other invested assets and investments underlying thefunds held – directly managed account, a 10% decline in the fair value of these investments at December 31, 2011would result in a $61 million pre-tax charge to net income or loss and a corresponding reduction in total assets.
In addition, included in the Company’s other invested assets are various investments which are accountedfor using the cost method of accounting, equity method of accounting or investment company accounting,totaling $268 million at December 31, 2011. The Company does not measure its investments that are accountedfor using any of these three methods at fair value. For investments that are accounted for using the cost methodof accounting, equity method of accounting or investment company accounting, a 10% decline in the carryingvalue of these investments at December 31, 2011 would result in a $27 million pre-tax charge to net income orloss and a corresponding reduction in investments and total assets.
The Company utilizes derivatives for a variety of purposes (see Note 6 to Consolidated Financial Statementsin Item 8 of Part II of this report). The Company’s derivatives are carried at fair value, which is based on quotedmarket prices or internal valuation models where quoted market prices are not available. Most of the Company’sderivatives are fair valued using quoted prices in active markets (an insignificant fair value at December 31,2011), referred to as Level 1 assets, or using significant other observable inputs (fair value of $7 million netunrealized loss at December 31, 2011), referred to as Level 2 assets. In addition, the Company has certain totalreturn swaps and insurance-linked securities that are fair valued using significant other unobservable inputs, andare included in the Level 3 other invested assets. The total return swaps and insurance-linked securities that areclassified as Level 3 have a combined fair value of $6 million net unrealized gain on combined notional exposureof $253 million.
In aggregate, the Company is not significantly exposed to changes in the valuation of its total return andinterest rate swap portfolio due to changes in the general level of interest rates. However, at December 31, 2011,the Company estimated that a 100 basis point increase or decrease in all risk spread assumptions used in theCompany’s internal valuation models would result in a $5 million decrease or a $5 million increase, respectively,in the fair value of its Level 3 total return and interest rate swap portfolio.
The Company is exposed to changes in the expected amount of future cash flows of the reference assets inits total return swap portfolio. The Company’s total return swap portfolio references many different underlyingassets with a number of risk factors. At December 31, 2011, the notional value of the Level 3 total return swapportfolio was $117 million and the fair value of the assets underlying the Level 3 total return swap portfolio was$123 million. The Company estimated that each 1% increase or decrease in the amount of all expected futurecash flows related to the reference assets would result in a $2 million increase or decrease, respectively, in thefair value of its total return swap portfolio at December 31, 2011.
At December 31, 2011, the Company’s insurance-linked securities that are classified as Level 3 includelongevity swaps and weather derivatives, with insignificant fair values. At December 31, 2011, the notionalexposure of the longevity swaps and weather derivatives classified as Level 3 was $121 million and $15 million,
75

respectively. At December 31, 2011, the Company estimated that a 10% improvement in the mortalityassumption used in the Company’s internal valuation models for its longevity swaps would result in a $4 milliondecrease in the fair value of its longevity swap portfolio. The Level 3 weather derivatives are exposed to variouswind events, with maximum aggregate limits of $15 million, and any change in the assumptions used in theCompany’s internal models would have an insignificant impact on the fair values at December 31, 2011.
Goodwill
Goodwill represents the excess of the purchase price over the fair value of the net assets acquired ofPartnerRe SA, Winterthur Re and Paris Re. The Company assesses the appropriateness of its valuation ofgoodwill on at least an annual basis. If, as a result of the assessment, the Company determines that the value ofits goodwill is impaired, goodwill will be written down in the period in which the determination is made. Neitherthe Company’s initial valuation nor its subsequent valuations has indicated any impairment of the Company’sgoodwill asset of $456 million at December 31, 2011.
In making an assessment of the value of its goodwill, the Company uses both market based and non-marketbased valuations. The fair value of the reporting units is determined based on the earnings multiple, present valueof estimated cash flows and present value of future profits methods. Significant changes in the data underlyingthese assumptions could result in an assessment of impairment of the Company’s goodwill asset. In addition, ifthe current economic environment and/or the Company’s financial performance were to deteriorate significantly,this could lead to an impairment of goodwill, the write-off of which would be recorded against net income in theperiod such deterioration occurred.
Intangible Assets
Intangible assets represent the fair value adjustments related to unpaid losses and loss expenses, as well asthe fair values of renewal rights and U.S. insurance licenses arising from the acquisition of Paris Re. Definite-lived intangible assets, related to the unpaid losses and loss expenses and renewal rights, are amortized over theiruseful lives, generally ranging from two to eleven years. The Company recognizes the amortization of allintangible assets in the Consolidated Statement of Operations. Indefinite-lived intangible assets, related to U.S.licenses, are not subject to amortization. The carrying values of intangible assets are regularly reviewed forindicators of impairment. Impairment is recognized if the carrying value of the intangible assets is notrecoverable from its undiscounted cash flows and is measured as the difference between the carrying value andthe fair value. Based upon the Company’s assessment, there was no impairment of its intangible assets of$134 million at December 31, 2011.
Results of Operations
The following discussion of Results of Operations contains forward-looking statements based uponassumptions and expectations concerning the potential effect of future events that are subject to uncertainties. SeeItem 1A of Part I of this report for a complete list of the Company’s risk factors. Any of these risk factors couldcause actual results to differ materially from those reflected in such forward-looking statements.
The Company’s reporting currency is the U.S. dollar. The Company’s significant subsidiaries and brancheshave one of the following functional currencies: U.S. dollar, euro or Canadian dollar. As a significant portion of theCompany’s operations is transacted in foreign currencies, fluctuations in foreign exchange rates may affect yearover year comparisons. To the extent that fluctuations in foreign exchange rates affect comparisons, their impact hasbeen quantified, when possible, and discussed in each of the relevant sections. See Note 2(m) to ConsolidatedFinancial Statements in Item 8 of Part II of this report for a discussion of translation of foreign currencies.
76

The foreign exchange fluctuations for the principal currencies in which the Company transacts businesswere as follows:
• the U.S. dollar average exchange rate was weaker against most currencies in 2011 compared to 2010and was weaker against most currencies, except the euro, in 2010 compared to 2009; and
• the U.S. dollar ending exchange rate strengthened against most currencies, except the Japanese yen, atDecember 31, 2011 compared to December 31, 2010 and weakened against most currencies, except theeuro and British pound, at December 31, 2010 compared to December 31, 2009.
Overview
The Company measures its performance in several ways. Among the performance measures accepted underU.S. GAAP is diluted net income or loss per share, a measure that focuses on the return provided to theCompany’s common shareholders. Diluted net income or loss per share is obtained by dividing net income orloss available to common shareholders by the weighted average number of common shares and common shareequivalents outstanding. Net income or loss available to common shareholders is defined as net income or lossless preferred dividends. See the discussion of the non-GAAP performance measures that the Company uses(operating earnings or loss and Operating ROE) and the reconciliation of those non-GAAP measures to the mostcomparable GAAP measures in Key Financial Measures below.
Net (loss) income, preferred dividends, net (loss) income available to common shareholders and diluted net(loss) income per share for the years ended December 31, 2011, 2010 and 2009 were as follows (in millions ofU.S. dollars, except per share data):
2011 2010 2009
Net (loss) income . . . . . . . . . . . . . . . . . . . . . . . . . . . . . . . . . . . . . . . . . . . . . . . . . . . . . . $ (520) $ 853 $1,537Less: preferred dividends . . . . . . . . . . . . . . . . . . . . . . . . . . . . . . . . . . . . . . . . . . . . . . . . 47 35 35
Net (loss) income available to common shareholders . . . . . . . . . . . . . . . . . . . . . . . . . . $ (567) $ 818 $1,502Diluted net (loss) income per share . . . . . . . . . . . . . . . . . . . . . . . . . . . . . . . . . . . . . . . . $(8.40) $10.46 $23.51
The year over year comparison of the Company’s net (loss) income and diluted (loss) income per share isprimarily affected by the following:
• the losses related to large catastrophic and large loss events in the years ended December 31, 2011 and2010, compared to no significant catastrophic losses in the year ended December 31, 2009;
• the acquisition of Paris Re. The Consolidated Statements of Operations and Cash Flows for the yearended December 31, 2009 include the results of Paris Re only from October 2, 2009, the date ofacquisition of the controlling interest, while the results for the years ended December 31, 2011 and2010 include Paris Re’s results for the full year;
• the decrease in gross and net premiums written and net premiums earned in the Non-life segment.These decreases are primarily due to cancellations and non-renewals of business as a result of declinesin pricing in certain competitive markets and the repositioning of the Company’s portfolio followingthe integration of Paris Re’s business, including a reduction in catastrophe exposures;
• continued volatility in the capital and credit markets; and
• costs related to the integration of Paris Re. These costs include charges related to the Company’svoluntary termination plan (voluntary plan) available to certain eligible employees in France,announced in April 2010 as part of the Company’s integration of Paris Re.
To the extent that the above events have affected the year over year comparison of the Company’s results,their impact has been quantified and discussed in each of the relevant sections. An overview of each of theseevents is provided below.
77

As the Company’s reinsurance operations are exposed to low frequency and high severity risk events, someof which are seasonal, results for certain periods may include unusually low loss experience, while results forother periods may include significant catastrophic losses. For example, the Company’s results for 2009 includedno significant catastrophic losses, while 2010 included losses from large catastrophic and large loss events, and2011 included an unusually high frequency of high severity catastrophic events, in particular the JapanEarthquake and the February and June 2011 New Zealand Earthquakes.
In 2011, the Company incurred losses, net of retrocession, reinstatement premiums and profit commissionadjustments, of $1,790 million related to the combined impact of the 2011 catastrophic events. The Company’sincurred net losses related to these events included $919 million related to the Japan Earthquake, $455 millionrelated to the February and June 2011 New Zealand Earthquakes, $120 million related to the Thailand Floods,$107 million related to the U.S. tornadoes, $100 million related to aggregate contracts covering losses in NewZealand and Australia, $41 million related to the Australian Floods and an additional IBNR reserve of $48million related to the 2011 catastrophic events, above the sum of the recorded point estimates, given the highfrequency of, and uncertainty related to, these complex and volatile events (see Results by Segment below andCritical Accounting Policies—Reserves above for further details).
In comparison, the Company incurred large catastrophic and large losses of $559 million in 2010, net ofretrocession, reinstatement premiums and profit commission adjustments, related to the combined impact of theChile Earthquake, 2010 New Zealand Earthquake, Deepwater Horizon and an aggregate contract covering lossesin Australia and New Zealand.
Loss estimates arising from earthquakes are inherently more uncertain than those from other catastrophicevents. The Company’s actual losses from the 2010 and the February and June 2011 New Zealand Earthquakesmay materially exceed the estimated losses as a result of, among other things, an increase in industry insured lossestimates, the expected lengthy claims development period, in particular for earthquake related losses, and thereceipt of additional information from cedants, brokers and loss adjusters. In addition, the Company’s lossestimate related to the Japan Earthquake is inherently more uncertain than those from other catastrophic eventsgiven the characteristics of the Company’s reinsurance portfolio in the region, changes in loss assumptions forspecific cedants may have a material impact on the Company’s loss estimate related to this event given asignificant portion of the losses are concentrated with a few large cedants. The Company believes there remains ahigh degree of uncertainty related to its loss estimates related to the 2010 and the February and June 2011 NewZealand Earthquakes and the Japan Earthquake and the ultimate losses arising from these events may bematerially in excess of, or less than, the amounts provided for in the Consolidated Balance Sheet at December 31,2011. Any adjustments to the Company’s preliminary estimate of its ultimate losses related to these events willbe reflected in the periods in which they are determined, which may affect the Company’s operating results infuture periods.
78

The following table reflects the combined impact of the above losses and the impact on the Company’stechnical result, net realized and unrealized investment gains, pre-tax loss or income, loss ratio and combinedratio by segment and sub-segment for the years ended December 31, 2011 and 2010 (in millions of U.S. dollars):
December 31, 2011North
America
Global(Non-U.S.)
P&C
Global(Non-U.S.)Specialty Catastrophe
TotalNon-lifeSegment
LifeSegment
Corporateand Other Total
Net losses and loss expenses andlife policy benefits . . . . . . . . . . $ 56 $ 149 $ 65 $1,511 $1,781 $ 3 $ 5 $1,789
Reinstatement premiums . . . . . . . — — — (33) (33) — — (33)Acquisition costs . . . . . . . . . . . . . (6) — — (9) (15) — — (15)
Impact on technical result . . . . . . $ 50 $ 149 $ 65 $1,469 $1,733 $ 3 $ 5 $1,741Net realized and unrealized
investment losses . . . . . . . . . . . — — 49 49
Impact on pre-tax net loss . . . . . . $1,733 $ 3 $ 54 $1,790
Impact on the loss ratio . . . . . . . . 4.9% 19.7% 4.8% 262.1% 45.9%Impact on the combined ratio . . . 45.2%
December 31, 2010North
America
Global(Non-U.S.)
P&C
Global(Non-U.S.)Specialty Catastrophe
TotalNon-lifeSegment
LifeSegment
Corporateand Other Total
Net losses and loss expenses andlife policy benefits . . . . . . . . . . . $ 5 $ 157 $126 $ 280 $ 568 $— $— $568
Reinstatement premiums . . . . . . . . — (1) (2) (6) (9) — — (9)
Impact on technical result andpre-tax net income . . . . . . . . . . . $ 5 $ 156 $124 $ 274 $ 559 $— $— $559
Impact on the loss ratio . . . . . . . . . . 0.5% 17.1% 8.9% 41.2% 14.1%Impact on the combined ratio . . . . . 13.9%
During the year ended December 31, 2011, gross and net premiums written in the Company’s Non-lifesegment decreased by 7% and net premiums earned in the Company’s Non-life segment decreased by 5%compared to 2010. The decreases in gross and net premiums written and net premiums earned impacted all of theCompany’s Non-life sub-segments, except the North America sub-segment. These decreases were primarilydriven by the effects of the Company’s decision to reduce or cancel business, as a result of decreases in pricing incertain competitive markets, and to reposition its portfolios following the integration of Paris Re’s business,which included reducing the level of catastrophe-exposed business written. In contrast, the North Americasub-segment benefitted from an increase in gross and net premiums written and net premiums earned of 7%, 8%and 9%, respectively, due to the agriculture line of business.
In 2011, U.S. and European risk-free interest rates decreased and credit spreads widened, while the U.S.dollar ending exchange rate at December 31, 2011 strengthened against most major currencies compared toDecember 31, 2010. Equity markets were relatively flat over the full year of 2011, despite volatility during thequarterly periods. As a result of these movements, the value of the Company’s investment portfolio and cash andcash equivalents at December 31, 2011 increased compared to December 31, 2010, positively affected by theimpact of decreased risk-free interest rates, which were largely offset by the impact of widening credit spreadsand foreign exchange rates.
In 2010, U.S. and European risk-free rates decreased, equity markets improved and credit spreads modestlydeclined. As a result of these movements, the fair value of the Company’s investment portfolio and cash and cashequivalents increased as of December 31, 2010 compared to December 31, 2009, primarily due to an increase inthe fair value of fixed maturities and equities, as well as net cash provided by operating activities, which waspartially offset by the impact of foreign exchange.
79

In 2010, the Company recorded pre-tax charges of $41 million related to the costs of the voluntary plan withinother operating expenses in its Corporate and Other segment. Participating employees will continue to receive salaryand other employment benefits until they leave the Company. The continuing salary and other employment benefitcosts related to employees participating in the voluntary plan will be expensed as the employee provides service andremains with the Company. Following their departure from the Company, the employees will continue to receivethe pre-determined payments related to employment benefits, which were accrued for by the Company under theterms of the voluntary plan during the year ended December 31, 2010.
These factors affecting the year over year comparison of the Company’s results are discussed below inReview of Net (Loss) Income, Results by Segment and Financial Condition, Liquidity and Capital Resources,and may continue to affect our results of operations and financial condition in the future.
2011 compared to 2010
The decrease in net income, net income available to common shareholders and diluted net income per sharefor 2011 compared to 2010 resulted primarily from:
• a decrease in the Non-life underwriting result of $1,177 million, which was driven by the 2011catastrophic events, a modestly higher level of mid-sized loss activity and lower profitability driven bydeclines in pricing in certain lines of business. These decreases were partially offset by a modestlyhigher level of favorable prior year loss development in 2011 compared to 2010;
• a decrease in pre-tax net realized and unrealized investment gains of $335 million; and
• a decrease in net investment income of $44 million, primarily driven by lower reinvestment rates;partially offset by
• a decrease in other corporate operating expenses of $67 million, primarily driven by the charges relatedto the Company’s voluntary termination plan in 2010;
• a decrease in income tax expense of $60 million, resulting from a lower pre-tax net income; and
• an increase in net foreign exchange gains of $55 million.
2010 compared to 2009
The decrease in net income, net income available to common shareholders and diluted net income per sharefor 2010 compared to 2009 resulted primarily from:
• a decrease in the Non-life underwriting result of $451 million, driven by large catastrophic lossesrelated to the Chile Earthquake and 2010 New Zealand Earthquake, and losses related to DeepwaterHorizon and an aggregate contract covering losses in Australia and New Zealand;
• a decrease in pre-tax net realized and unrealized investment gains of $189 million;
• no activity related to the Company’s capital efficient notes (CENts) in 2010 compared to a gain of$89 million on purchase of CENts in 2009;
• a decrease in the Life underwriting result of $40 million, primarily driven by an increase in net adverseprior year loss development in the longevity line;
• an increase in other corporate operating expenses of $35 million, primarily driven by charges related tothe voluntary plan; and
• various other factors, the primary one being an increase in amortization of intangible assets of$37 million; which were partially offset by
• a decrease in income tax expense of $133 million, resulting primarily from a lower pre-tax income; and
80

• an increase in net investment income of $77 million, driven by the inclusion of Paris Re’s netinvestment income for a full year in 2010 compared to the fourth quarter only in 2009.
Review of Net (Loss) Income
Management analyzes the Company’s net income or loss in three parts: underwriting result, investment resultand other components of net income or loss. Underwriting result consists of net premiums earned and other incomeor loss less losses and loss expenses and life policy benefits, acquisition costs and other operating expenses.Investment result consists of net investment income, net realized and unrealized investment gains or losses andinterest in earnings or losses of equity investments. Net investment income includes interest and dividends, net ofinvestment expenses, generated by the Company’s investment activities, as well as interest income generated onfunds held assets. Net realized and unrealized investment gains or losses include sales of the Company’s fixedincome, equity and other invested assets and investments underlying the funds held – directly managed account andchanges in net unrealized gains or losses. Interest in earnings or losses of equity investments includes theCompany’s strategic investments. Other components of net income or loss include net realized gain on purchase ofCENts in 2009, technical result and other income or loss, other operating expenses, interest expense, amortization ofintangible assets, net foreign exchange gains or losses and income tax expense or benefit.
The components of net (loss) income for the years ended December 31, 2011, 2010 and 2009 were asfollows (in millions of U.S. dollars):
2011 % Change 2010 % Change 2009
Underwriting result:Non-life . . . . . . . . . . . . . . . . . . . . . . . . . . . . . . . . . . . . . . . . $(973) NM% $ 204 (69)% $ 655Life . . . . . . . . . . . . . . . . . . . . . . . . . . . . . . . . . . . . . . . . . . . . (27) (47) (51) 362 (11)
Investment result:Net investment income . . . . . . . . . . . . . . . . . . . . . . . . . . . . 629 (6) 673 13 596Net realized and unrealized investment gains . . . . . . . . . . . 67 (83) 402 (32) 591Interest in (losses) earnings of equity investments (1) . . . . . . (6) NM 13 (19) 16
Corporate and Other:Net realized gain on purchase of capital efficient notes . . . — NM — NM 89Technical result (2) . . . . . . . . . . . . . . . . . . . . . . . . . . . . . . . . . 6 NM — (99) 10Other income (2) . . . . . . . . . . . . . . . . . . . . . . . . . . . . . . . . . . 3 6 3 (61) 7Other operating expenses . . . . . . . . . . . . . . . . . . . . . . . . . . . (99) (41) (166) 27 (131)Interest expense . . . . . . . . . . . . . . . . . . . . . . . . . . . . . . . . . . (49) 10 (44) 57 (28)Amortization of intangible assets (3) . . . . . . . . . . . . . . . . . . . (36) 16 (31) (613) 6Net foreign exchange gains (losses) . . . . . . . . . . . . . . . . . . 34 NM (21) NM (1)Income tax expense . . . . . . . . . . . . . . . . . . . . . . . . . . . . . . . (69) (46) (129) (51) (262)
Net (loss) income . . . . . . . . . . . . . . . . . . . . . . . . . . . . . . . . . . . . . $(520) NM $ 853 (45) $1,537
NM: not meaningful(1) Interest in earnings or loss of equity investments represents the Company’s aggregate share of earnings or
losses related to several private placement investments and limited partnerships within the Corporate andOther segment. See the discussion in Corporate and Other – Interest in Earnings of Equity Investmentsbelow for more details.
(2) Technical result and other income primarily relate to income on insurance-linked securities and principalfinance transactions within the Corporate and Other segment. See the discussion in Corporate and Other –Technical Result and Other Income below for more details.
(3) Amortization of intangible assets relates to intangible assets acquired in the acquisition of Paris Re in 2009.
81

Underwriting result is a measurement that the Company uses to manage and evaluate its Non-life and Lifesegments, as it is a primary measure of underlying profitability for the Company’s core reinsurance operations,separate from the investment results. The Company believes that in order to enhance the understanding of itsprofitability, it is useful for investors to evaluate the components of net income or loss separately and in theaggregate. Underwriting result should not be considered a substitute for net income or loss and does not reflectthe overall profitability of the business, which is also impacted by investment results and other items.
2011 compared to 2010
The underwriting result for the Non-life segment decreased by $1,177 million, from $204 million in 2010 toa loss of $973 million in 2011. The decrease was attributable to:
• an increase in large catastrophic losses and large losses of $1,174 million, net of retrocession,reinstatement premiums and profit commissions, related to the 2011 catastrophic events, compared tothe 2010 catastrophic events and Deepwater Horizon; and
• a decrease of approximately $79 million resulting from a decrease in the book of business, decliningprofitability due to reduced pricing and reduced catastrophe exposures in certain lines of business and amodestly higher level of mid-sized loss activity, which was reduced by the impact of a change in mixtowards the agriculture line in the North America sub-segment; partially offset by
• an increase in net favorable loss development on prior accident years of $52 million, from $478 millionin 2010 to $530 million in 2011. The components of the net favorable loss development are describedin more detail in the discussion of individual sub-segments in Results by Segment below; and
• a decrease in other operating expenses of $34 million, primarily driven by lower personnel costs.
The underwriting result for the Life segment, which does not include allocated investment income,improved by $24 million, from a loss of $51 million in 2010 to a loss of $27 million in 2011. The improvementin the Life underwriting result was primarily due to a decrease in net adverse prior year loss development, fromnet adverse development of $12 million in 2010 to net favorable development of $1 million in 2011, andincreased profitability generated from new and existing business. See Results by Segment below.
Net investment income decreased by $44 million, from $673 million in 2010 to $629 million in 2011. Thedecrease in net investment income of 6% is primarily attributable to a decrease in net investment income fromfixed maturities and the fixed maturities underlying the funds held – directly managed account due to lowerreinvestment rates. See Corporate and Other – Net Investment Income below for more details.
Net realized and unrealized investment gains decreased by $335 million, from $402 million in 2010 to$67 million in 2011. The net realized and unrealized investment gains of $67 million in 2011 were primarily due todeclining U.S. and European risk-free interest rates, which were partially offset by widening credit spreads, realizedand unrealized losses on treasury note futures and losses on insurance-linked securities impacted by the JapanEarthquake. Net realized and unrealized investment gains of $67 million in 2011 primarily consisted of net realizedinvestment gains on fixed maturities and short-term investments and equities of $248 million, the change in netunrealized investment gains on fixed maturities and short-term investments of $128 million and net realized andunrealized investment gains on funds held – directly managed of $11 million. These gains were partially offset bynet realized investment losses on other invested assets, primarily related to treasury note futures, of $176 millionand the change in net unrealized investment losses on equities and other invested assets of $148 million. SeeCorporate and Other – Net Realized and Unrealized Investment Gains below for more details.
82

Other operating expenses included in Corporate and Other decreased by $67 million, from $166 million in2010 to $99 million in 2011. The decrease was primarily due to the charges related to the Company’s voluntarytermination plan in 2010, as well as lower personnel costs in 2011.
Interest expense increased by $5 million, from $44 million in 2010 to $49 million in 2011. The increase wasprimarily due to the timing of the issuance of $500 million 5.500% Senior Notes in March 2010, which was notoutstanding for the entire year in 2010.
Net foreign exchange gains increased by $55 million, from a loss of $21 million in 2010 to a gain of$34 million in 2011. The increase in net foreign exchange gains in 2011 resulted primarily from gains arisingfrom the timing of the hedging activities and lower forward points paid, which reflects the interest ratedifferential between currencies bought and sold against the U.S. dollar. The Company hedges a significantportion of its currency risk exposure as discussed in Quantitative and Qualitative Disclosures about Market Riskin Item 3 of Part I of this report.
Income tax expense decreased by $60 million, from $129 million in 2010 to $69 million in 2011. Thedecrease in the income tax expense was primarily due to the Company’s taxable jurisdictions generating a lowerpre-tax income in 2011 compared to 2010. See Corporate and Other – Income Taxes below for more details.
2010 compared to 2009
The underwriting result for the Non-life segment decreased by $451 million, from $655 million in 2009 to$204 million in 2010. The decrease was principally attributable to:
• an increase in large catastrophic losses and large losses of $559 million, net of reinstatement premiums,related to the Chile Earthquake, 2010 New Zealand Earthquake, Deepwater Horizon and an aggregatecontract covering losses in Australia and New Zealand;
• an increase in other operating expenses of $64 million, primarily due to the inclusion of Paris Re’sNon-life operating expenses for a full year in 2010 compared to the fourth quarter only of 2009; and
• a decrease in net favorable loss development on prior years of $8 million, from $486 million in 2009 to$478 million in 2010. The components of the net favorable loss development are described in moredetail in the discussion of individual sub-segments in Results by Segment below; partially offset by
• an increase of approximately $180 million resulting from the inclusion of Paris Re’s business (beforethe impact of large catastrophic losses, losses and loss expenses related to Deepwater Horizon,operating expenses and net favorable loss development included above), a lower level of loss estimatesrecorded in the specialty casualty and credit/surety lines of business related to the global economic andfinancial crisis and normal fluctuations in profitability between periods, partially offset by a higherlevel of mid-sized loss activity.
Underwriting result for the Life segment decreased by $40 million, from a loss of $11 million in 2009 to aloss of $51 million in 2010. The decrease was primarily driven by net adverse prior year loss development in thelongevity line in 2010 compared to net favorable prior year development in the mortality line in 2009. SeeResults by Segment below.
Net investment income increased by $77 million, from $596 million in 2009 to $673 million in 2010. Theincrease in net investment income of 13% is primarily attributable to an increase in net investment income fromfixed maturities due to the purchase of higher yielding investments, the reinvestment of cash flows fromoperations and the inclusion of Paris Re’s net investment income for a full year in 2010 compared to the fourthquarter only of 2009. The increase was partially offset by cash flows from operations being used to repurchasecommon shares and repay debt during the year and by lower reinvestment rates.
83

Net realized and unrealized investment gains decreased by $189 million, from $591 million in 2009 to$402 million in 2010. The net realized and unrealized investment gains of $402 million in 2010 were primarilydue to decreases in U.S. and European risk-free interest rates and increases in equity markets. Net realized andunrealized investment gains of $402 million in 2010 consist of net realized investment gains on fixed maturities,short-term investments and equities of $218 million, the change in net unrealized investment gains on fixedmaturities, short-term investments, equities and other invested assets of $212 million, net realized and unrealizedinvestment gains on funds held – directly managed and net other realized and unrealized gains of $40 million,which were partially offset by net realized losses on other invested assets of $68 million.
Net realized gain on purchase of CENts was $89 million in 2009 as the Company purchased $187 million ofthe CENts for $93 million, which after deferred issuance costs and fees produced a gain of $89 million. Nosimilar gain was recorded in 2010.
Other operating expenses included in Corporate and Other increased by $35 million, from $131 million in2009 to $166 million in 2010. The increase was primarily due to the charges related to the Company’s voluntaryplan, discussed in Overview above, higher personnel expenses, partially offset by lower consulting andprofessional fees related to the acquisition of Paris Re.
Interest expense increased by $16 million, from $28 million in 2009 to $44 million in 2010 mainly due tointerest related to the issuance of $500 million 5.500% Senior Notes in 2010.
Net foreign exchange losses increased by $20 million, from $1 million in 2009 to $21 million in 2010. Theincrease in net foreign exchange losses in 2010 resulted primarily from losses arising from the impact of theCompany’s hedging program, partially offset by currency movements on unhedged equity securities. TheCompany hedges a significant portion of its currency risk exposure as discussed in Quantitative and QualitativeDisclosures about Market Risk in Item 3 of Part I of this report.
Income tax expense decreased by $133 million, from $262 million in 2009 to $129 million in 2010. Thedecrease in the income tax expense was primarily due to lower pre-tax income, with the Company’s taxablejurisdictions generating lower pre-tax income in 2010 compared to 2009, as well as a decrease in tax on the netrealized gain on purchase of CENts of $31 million recorded in 2009. See Corporate and Other – Income Taxesbelow for more details.
Results by Segment
The Company monitors the performance of its operations in three segments, Non-life, Life and Corporate &Other. The Non-life segment is further divided into four sub-segments, North America, Global (Non-U.S.)Property and Casualty (Global (Non-U.S.) P&C), Global (Non-U.S.) Specialty and Catastrophe. Segments andsub-segments represent markets that are reasonably homogeneous in terms of geography, client types, buyingpatterns, underlying risk patterns and approach to risk management. See the description of the Company’ssegments and sub-segments as well as a discussion of how the Company measures its segment results in Note 22to Consolidated Financial Statements included in Item 8 of Part II of this report.
Segment results are shown before intercompany transactions. Business reported in the Global (Non-U.S.)P&C and Global (Non-U.S.) Specialty Non-life sub-segments and the Life segment is, to a significant extent,denominated in foreign currencies and is reported in U.S. dollars at the average foreign exchange rates for eachperiod. The U.S. dollar has fluctuated against the euro and other currencies during each of the three yearspresented and this should be considered when making year to year comparisons.
84

Non-life Segment
North America
The North America sub-segment is comprised of lines of business that are considered to be either short,medium or long-tail. The short-tail lines consist primarily of agriculture, property and motor business andrepresented 48%, 47% and 54% of net premiums written in this sub-segment in 2011, 2010 and 2009,respectively. Casualty is considered to be long-tail and represented 40%, 42% and 37% of net premiums writtenin 2011, 2010 and 2009, respectively, while credit/surety and multiline are considered to have a medium-tail andaccounted for the balance of net premiums written in this sub-segment. The casualty line typically tends to have ahigher loss ratio and a lower technical result, due to the long-tail nature of the risks involved. Casualty treatiestypically provide for investment income on premiums invested over a longer period as losses are typically paidlater than for other lines. Investment income, however, is not considered in the calculation of technical result.
The following table provides the components of the technical result and the corresponding ratios for thissub-segment (in millions of U.S. dollars):
2011 % Change 2010 % Change 2009
Gross premiums written . . . . . . . . . . . . . . . . . . . . . . . . . . . . . . $1,104 7% $1,028 (12)% $1,162Net premiums written . . . . . . . . . . . . . . . . . . . . . . . . . . . . . . . . 1,104 8 1,026 (12) 1,162Net premiums earned . . . . . . . . . . . . . . . . . . . . . . . . . . . . . . . . $1,135 9 $1,038 (14) $1,210Losses and loss expenses . . . . . . . . . . . . . . . . . . . . . . . . . . . . . (741) 28 (577) (21) (728)Acquisition costs . . . . . . . . . . . . . . . . . . . . . . . . . . . . . . . . . . . (276) (4) (288) (8) (311)
Technical result (1) . . . . . . . . . . . . . . . . . . . . . . . . . . . . . . . . . . . $ 118 (32) $ 173 1 $ 171Loss ratio (2) . . . . . . . . . . . . . . . . . . . . . . . . . . . . . . . . . . . . . . . . 65.3% 55.6% 60.2%Acquisition ratio (3) . . . . . . . . . . . . . . . . . . . . . . . . . . . . . . . . . . 24.3 27.8 25.7
Technical ratio (4) . . . . . . . . . . . . . . . . . . . . . . . . . . . . . . . . . . . . 89.6% 83.4% 85.9%
(1) Technical result is defined as net premiums earned less losses and loss expenses and acquisition costs.(2) Loss ratio is obtained by dividing losses and loss expenses by net premiums earned.(3) Acquisition ratio is obtained by dividing acquisition costs by net premiums earned.(4) Technical ratio is defined as the sum of the loss ratio and the acquisition ratio.
Premiums
The North America sub-segment represented 24%, 22% and 30% of total net premiums written in 2011,2010 and 2009, respectively. The increase in the North America sub-segment’s net premiums written as apercentage of total net premiums written in 2011 compared to 2010 was mainly due to higher net premiumswritten in this sub-segment, primarily in the agriculture line of business, and decreases in net premiums writtenin the Company’s other Non-life sub-segments. The decrease in the North America sub-segment’s net premiumswritten as a percentage of total net premiums written in 2010 compared to 2009 was primarily due to lower netpremiums written in the agriculture line of business, overall declining market conditions and the inclusion of themajority of Paris Re’s premiums in the Company’s other Non-life sub-segments.
2011 compared to 2010
Gross and net premiums written and net premiums earned increased by 7%, 8% and 9%, respectively, in2011 compared to 2010. The increases in gross and net premiums written and net premiums earned wereprimarily attributable to the agriculture line of business and were mainly driven by increased demand, higheragricultural commodity prices and lower downward premium adjustments. The increase in gross and netpremiums written and net premiums earned was partially offset by decreases in certain lines, primarily in theproperty line, driven by cancellations and lower renewals due to increased retentions and reductions in pricing, as
85

well as, higher downward premium adjustments in 2011. Notwithstanding the declining market conditions,higher retentions and the competition prevailing in certain lines of business and markets of this sub-segment, theCompany was able to write business that met its portfolio objectives.
2010 compared to 2009
Gross and net premiums written decreased by 12% and net premiums earned decreased by 14% in 2010compared to 2009. The decrease in gross and net premiums written and net premiums earned was primarilyattributable to the agriculture line of business resulting from lower agricultural commodity price levels andhigher retentions by cedants. Net premiums earned were also impacted by a decrease in the casualty line ofbusiness which was driven by timing differences related to the renewal of treaties and overall declining marketconditions. These decreases in gross and net premiums written and net premiums earned were partially offset bylower downward premium adjustments related to prior periods reported by cedants in 2010 compared to 2009,primarily in the motor, agriculture and casualty lines.
Losses and loss expenses and loss ratio
2011 compared to 2010
The losses and loss expenses and loss ratio reported in 2011 reflected:
• large catastrophic losses, primarily related to the U.S. tornadoes, of $56 million, or 4.9 points on theloss ratio;
• net favorable loss development on prior accident years of $189 million, or 16.7 points on the loss ratio;
• an increase in the book of business and exposure driven by the agriculture line, which also resulted in achange in the mix of business towards the agriculture line, which generally carries a higher loss ratiocompared to most of the other lines of business in this sub-segment;
• a higher level of mid-sized loss activity; and
• declines in pricing in certain lines of business.
The net favorable loss development of $189 million included net favorable development for prior accidentyears in most lines of business, predominantly in the casualty line, while the credit/surety and motor linesexperienced combined adverse loss development for prior accident years of $11 million. Loss informationprovided by cedants in 2011 for prior accident years was lower than the Company expected (higher for credit/surety and motor) and included no individually material losses or reductions but a series of attritional losses orreductions. Based on the Company’s assessment of this loss information, the Company decreased (increased forcredit/surety and motor) its expected ultimate loss ratios for most lines of business, which had the net effect ofdecreasing (increasing for credit/surety and motor) prior year loss estimates.
The increase of $164 million in losses and loss expenses in 2011 compared to 2010 included:
• an increase of approximately $137 million in losses and loss expenses resulting from the increase in thebook of business and exposure and the related change in the mix of business towards the agricultureline of business, the impact of declining pricing and profitability of the business between periods and ahigher level of mid-sized loss activity; and
• an increase of $51 million in large catastrophic losses and large losses and loss expenses; partiallyoffset by
• an increase of $24 million in net favorable prior year loss development.
86

2010 compared to 2009
The losses and loss expenses and loss ratio reported in 2010 reflected:
• net favorable loss development on prior accident years of $165 million, or 16.0 points on the loss ratio;
• no large catastrophic losses;
• the inclusion of losses and loss expenses related to business written by Paris Re;
• losses and loss expenses related to Deepwater Horizon of $5 million, or 0.5 points on the loss ratio;
• a lower level of loss estimates recorded in the casualty line of business reflecting abating economic andfinancial market conditions; and
• a decrease in the book of business and exposure.
The net favorable loss development of $165 million included net favorable development for prior accidentyears in most lines of business, predominantly in the casualty and agriculture lines, while the motor lineexperienced adverse loss development for prior accident years of $8 million. Loss information provided bycedants in 2010 for prior accident years was lower than the Company expected (higher for motor) and includedno individually significant losses or reductions but a series of attritional losses or reductions. Based on theCompany’s assessment of this loss information, the Company decreased its expected ultimate loss ratios for mostlines of business (increased for motor), which had the net effect of decreasing (increasing for motor) prior yearloss estimates.
The decrease of $151 million in losses and loss expenses in 2010 compared to 2009 included:
• a decrease of approximately $168 million in losses and loss expenses resulting from a decrease in thebook of business and exposure, predominantly in the agriculture line of business, a lower level of lossestimates recorded in the casualty line of business and normal fluctuations in profitability betweenperiods; partially offset by
• a decrease of $12 million in net favorable prior year loss development; and
• an increase in losses and loss expenses of $5 million related to Deepwater Horizon.
Acquisition costs and acquisition ratio
2011 compared to 2010
Acquisition costs and the acquisition ratio decreased in 2011 compared to 2010 as a result of the change inthe mix of business towards the agriculture line, which generally carries a lower acquisition ratio compared to theother lines of business in this sub-segment, and lower profit commission adjustments reported by cedants in 2011in various lines of business. This decrease in acquisition costs was partially offset by the impact of higher netpremiums earned in 2011 compared to 2010.
2010 compared to 2009
Acquisition costs decreased in 2010 compared to 2009 primarily as a result of lower net premiums earned.The acquisition ratio increased in 2010 compared to 2009 mainly due to higher profit commission adjustmentsreported by cedants in 2010, primarily in the agriculture line of business, partially offset by lower commissionrates in most lines of business.
87

Technical result and technical ratio
2011 compared to 2010
The decrease of $55 million in the technical result and the corresponding increase in the technical ratio in2011 compared to 2010 was primarily attributable to an increase of $45 million, net of profit commissions, inlarge catastrophic losses and large losses, the change in the mix of business towards the agriculture line, theimpact of declining pricing and profitability of the business and a higher level of mid-sized loss activity. Thesedecreases in the technical result were partially offset by an increase of $24 million in net favorable prior year lossdevelopment.
2010 compared to 2009
The increase of $2 million in the technical result and the corresponding decrease in technical ratio in 2010compared to 2009 was primarily attributable to a lower level of loss estimates recorded in the casualty line ofbusiness and normal fluctuations in profitability between periods, partially offset by a decrease of $12 million innet favorable prior year loss development and an increase of $5 million related to Deepwater Horizon.
2012 Outlook
During the January 1, 2012 renewals, the Company observed a fairly stable environment with competitiveconditions in most markets, and price increases generally in loss affected markets only. The expected premiumvolume from the Company’s January 1, 2012 renewal modestly decreased compared to the prior year renewalprimarily as a result of the Company’s decision to cancel or reduce certain business. The agriculture businesstraditionally renews later and remains largely in process. Management expects a continuation of the observedtrends in pricing and conditions during the remainder of 2012.
Global (Non-U.S.) P&C
The Global (Non-U.S.) P&C sub-segment is composed of short-tail business, in the form of property andproportional motor business, that represented approximately 84%, 82% and 84% of net premiums written in2011, 2010 and 2009, respectively, and long-tail business, in the form of casualty and non-proportional motorbusiness, that represented the balance of net premiums written.
The following table provides the components of the technical result and the corresponding ratios for thissub-segment (in millions of U.S. dollars):
2011 % Change 2010 % Change 2009
Gross premiums written . . . . . . . . . . . . . . . . . . . . . . . . . . . . . . . . $ 682 (25)% $ 909 34% $ 677Net premiums written . . . . . . . . . . . . . . . . . . . . . . . . . . . . . . . . . . 678 (24) 898 32 679Net premiums earned . . . . . . . . . . . . . . . . . . . . . . . . . . . . . . . . . . $ 759 (17) $ 914 25 $ 729Losses and loss expenses . . . . . . . . . . . . . . . . . . . . . . . . . . . . . . . (567) (19) (702) 79 (392)Acquisition costs . . . . . . . . . . . . . . . . . . . . . . . . . . . . . . . . . . . . . . (191) (16) (227) 31 (174)
Technical result . . . . . . . . . . . . . . . . . . . . . . . . . . . . . . . . . . . . . . . $ 1 NM $ (15) NM $ 163Loss ratio . . . . . . . . . . . . . . . . . . . . . . . . . . . . . . . . . . . . . . . . . . . 74.7% 76.8% 53.7%Acquisition ratio . . . . . . . . . . . . . . . . . . . . . . . . . . . . . . . . . . . . . . 25.1 24.9 23.8
Technical ratio . . . . . . . . . . . . . . . . . . . . . . . . . . . . . . . . . . . . . . . 99.8% 101.7% 77.5%
NM: not meaningful
88

Premiums
The Global (Non-U.S.) P&C sub-segment represented 15%, 19% and 17% of total net premiums written in2011, 2010 and 2009, respectively. The decrease in the Global (Non-U.S.) P&C sub-segment’s net premiumswritten as a percentage of total net premiums written in 2011 compared to 2010 was primarily due to the effectsof the Company’s decision to cancel or reduce business as a result of decreases in pricing and the repositioningof the Company’s portfolio, as described below. The increase in the Global (Non-U.S.) P&C sub-segment’s netpremiums written as a percentage of total net premiums written in 2010 compared to 2009 was primarily due tothe inclusion of Paris Re’s premiums for a full year compared to the fourth quarter only of 2009.
2011 compared to 2010
Gross and net premiums written and net premiums earned decreased by 25%, 24% and 17%, respectively, in2011 compared to 2010. The decreases in gross and net premiums written and net premiums earned resulted fromall lines of business and were mainly driven by the effects of the Company’s decision to cancel or reducebusiness due to lower pricing in competitive markets, the repositioning of the Company’s portfolio following theintegration of Paris Re’s business, which included reducing catastrophe-exposed business in the property line,and higher retentions by cedants. These decreases were partially offset by foreign exchange fluctuations, whichincreased gross and net premiums written by 2% and net premiums earned by 4% due to the impact of the weakerU.S. dollar in 2011 compared to 2010. The decrease in net premiums earned was less pronounced than thedecreases in gross and net premiums written due to the impact of continuing to earn the higher level of netpremiums written in 2010 during the year ended December 31, 2011, given most business in this sub-segment iswritten on a proportional basis. Notwithstanding the increased competition and overall declines in pricingprevailing in certain lines of business and markets of this sub-segment, the Company was able to write businessthat met its portfolio objectives.
2010 compared to 2009
Gross and net premiums written and net premiums earned increased by 34%, 32% and 25%, respectively, in2010 compared to 2009. The increases in gross and net premiums written and net premiums earned resultedmainly from business written by Paris Re, which is included in this sub-segment’s results for a full year in 2010compared to the fourth quarter only of 2009. The increases were also driven by an increase in upward premiumadjustments, increases in treaty participations and new business written, predominantly in the property line ofbusiness.
Losses and loss expenses and loss ratio
2011 compared to 2010
The losses and loss expenses and loss ratio reported in 2011 reflected:
• large catastrophic losses related to the Thailand Floods, the February and June 2011 New ZealandEarthquakes, Japan Earthquake and Australian Floods of $149 million, or 19.7 points on the loss ratio;
• net favorable loss development on prior accident years of $116 million, or 15.3 points on the loss ratio;and
• a decrease in the book of business and exposure and declines in pricing.
The net favorable loss development of $116 million included net favorable development for prior accidentyears in all lines of business, and was most pronounced in the motor line. Loss information provided by cedantsin 2011 for prior accident years was lower than the Company expected and included no individually significantlosses or reductions but a series of attritional losses or reductions. Based on the Company’s assessment of thisloss information, the Company decreased its expected ultimate loss ratios for all lines of business, which had thenet effect of decreasing prior year loss estimates.
89

The decrease of $135 million in losses and loss expenses in 2011 compared to 2010 included:
• a decrease of approximately $109 million in losses and loss expenses resulting from a decrease in thebook of business and exposure, which was partially offset by the impact of declining pricing on theprofitability of the business between periods;
• an increase of $18 million in net favorable prior year loss development; and
• a decrease of $8 million in large catastrophic losses.
2010 compared to 2009
The losses and loss expenses and loss ratio reported in 2010 reflected:
• large catastrophic losses related to the Chile Earthquake and 2010 New Zealand Earthquake of $157million, or 17.1 points on the loss ratio;
• the inclusion of losses and loss expenses related to business written by Paris Re;
• net favorable loss development on prior accident years of $98 million, or 10.7 points on the loss ratio;
• a lower level of mid-sized loss activity; and
• an increase in the book of business and exposure.
The net favorable loss development of $98 million included net favorable development for prior accidentyears in all lines of business, but was most pronounced in the property line. Loss information provided bycedants in 2010 for prior accident years was lower than the Company expected and included no individuallysignificant losses or reductions but a series of attritional losses or reductions. Based on the Company’sassessment of this loss information, the Company decreased its expected ultimate loss ratios for all lines ofbusiness, which had the net effect of decreasing prior year loss estimates.
The increase of $310 million in losses and loss expenses in 2010 compared to 2009 included:
• an increase of $157 million in large catastrophic losses;
• an increase of approximately $99 million in losses and loss expenses resulting from an increase inlosses and loss expenses related to business written by Paris Re and an increase in the book of businessand exposure, which was partially offset by normal fluctuations in profitability between periods and alower level of mid-sized loss activity; and
• a decrease of $54 million in net favorable prior year loss development.
Acquisition costs and acquisition ratio
2011 compared to 2010
Acquisition costs decreased in 2011 compared to 2010 primarily as a result of lower net premiums earned.The acquisition ratio was comparable between 2011 and 2010.
2010 compared to 2009
Acquisition costs increased in 2010 compared to 2009 primarily as a result of higher net premiums earned.The increase in the acquisition ratio in 2010 compared to 2009 was primarily due to higher profit commissionadjustments in the casualty line of business and new business with higher commission rates in the motor line ofbusiness, partially offset by the inclusion of Paris Re’s premiums which carry a lower acquisition ratio.
90

Technical result and technical ratio
2011 compared to 2010
The increase of $16 million in the technical result and the corresponding decrease in the technical ratio in2011 compared to 2010 was primarily attributable to an increase of $18 million in net favorable prior year lossdevelopment and a decrease of $7 million, net of reinstatement premiums, in large catastrophic losses. Theseincreases in the technical result were partially offset by declining profitability and lower net premiums earnedbetween periods.
2010 compared to 2009
The decrease of $178 million in the technical result and corresponding increase in technical ratio in 2010compared to 2009 was primarily due to an increase of $156 million, net of reinstatement premiums, in largecatastrophic losses and a decrease of $54 million in net favorable prior year loss development, which waspartially offset by a lower level of mid-sized loss activity and normal fluctuations in profitability betweenperiods.
2012 Outlook
During the January 1, 2012 renewals, the Company generally observed a continuation of the soft market inmost markets with terms and conditions stable to down compared to the prior year renewal. A hardening of termsand conditions and price increases was only generally observed in loss affected markets. Overall, the expectedpremium volume from the Company’s January 1, 2012 renewal, at constant foreign exchange rates, increasedcompared to the prior year renewal primarily as a result of opportunities to write new business in the motor lineof business, which was partially offset by the Company’s decision to further reduce the level of its catastropheexposed business. Management expects a continuation of the observed trends in pricing and terms and conditionsduring the remainder of 2012.
Global (Non-U.S.) Specialty
The Global (Non-U.S.) Specialty sub-segment is primarily comprised of lines of business that areconsidered to be either short or medium-tail. The short-tail lines consist of agriculture, energy and specialtyproperty and represented 23%, 23% and 21% of net premiums written in 2011, 2010 and 2009, respectively.Aviation/space, credit/surety, engineering and marine are considered to have a medium-tail and represented 69%,66% and 68%, respectively, of net premiums written, while specialty casualty is considered to be long-tail andaccounted for the balance of net premiums written in this sub-segment in 2011, 2010 and 2009.
The following table provides the components of the technical result and the corresponding ratios for thissub-segment (in millions of U.S. dollars):
2011 % Change 2010 % Change 2009
Gross premiums written . . . . . . . . . . . . . . . . . . . . . . . . . . . . . . $1,446 (2)% $1,479 28% $1,159Net premiums written . . . . . . . . . . . . . . . . . . . . . . . . . . . . . . . . 1,344 (3) 1,391 25 1,113Net premiums earned . . . . . . . . . . . . . . . . . . . . . . . . . . . . . . . . $1,376 (2) $1,405 26 $1,116Losses and loss expenses . . . . . . . . . . . . . . . . . . . . . . . . . . . . . . (950) (3) (985) 35 (732)Acquisition costs . . . . . . . . . . . . . . . . . . . . . . . . . . . . . . . . . . . . (328) 12 (292) 15 (254)
Technical result . . . . . . . . . . . . . . . . . . . . . . . . . . . . . . . . . . . . . $ 98 (24) $ 128 (1) $ 130Loss ratio . . . . . . . . . . . . . . . . . . . . . . . . . . . . . . . . . . . . . . . . . . 69.1% 70.0% 65.6%Acquisition ratio . . . . . . . . . . . . . . . . . . . . . . . . . . . . . . . . . . . . 23.8 20.8 22.7
Technical ratio . . . . . . . . . . . . . . . . . . . . . . . . . . . . . . . . . . . . . . 92.9% 90.8% 88.3%
91

Premiums
The Global (Non-U.S.) Specialty sub-segment represented 30%, 29% and 28% of total net premiums writtenin 2011, 2010 and 2009, respectively. The increase in the Global (Non-U.S.) Specialty sub-segment’s netpremiums written as a percentage of total net premiums written in 2011 compared to 2010 was primarily due tothe relatively modest decrease in this sub-segment’s net premiums written compared to decreases in netpremiums written in the Global (Non-U.S.) P&C and Catastrophe sub-segments. The increase in the Global(Non-U.S.) Specialty sub-segment’s net premiums written as a percentage of total net premiums written in 2010compared to 2009 was primarily due to the inclusion of Paris Re’s premiums for a full year in 2010 compared tothe fourth quarter only of 2009.
2011 compared to 2010
Gross premiums written and net premiums earned decreased by 2% and net premiums written decreased by3%, in 2011 compared to 2010. The decrease in gross and net premiums written and net premiums earnedresulted from most lines of business and was primarily due to the effects of the Company’s decision to cancel orreduce business as a result of modestly reduced pricing in certain competitive lines of business and therepositioning of the Company’s portfolio following the integration of Paris Re’s business. These decreases werepartially offset by an increase in upward premium adjustments reported by cedants in 2011 compared to 2010,which were primarily driven by the energy and engineering lines of business, increases in treaty participations inthe credit/surety line of business, new business written in the specialty property line of business and the impact ofthe weaker U.S. dollar in 2011 compared to 2010. Foreign exchange fluctuations increased gross and netpremiums written by 2% and net premiums earned by 4%. Notwithstanding the diverse conditions prevailing invarious markets within this sub-segment, with terms in most markets soft and terms in loss affected linesstrengthening, the Company was able to write business that met its portfolio objectives.
2010 compared to 2009
Gross and net premiums written and net premiums earned increased by 28%, 25% and 26% in 2010compared to 2009, respectively. The increases in gross and net premiums written and net premiums earnedresulted mainly from business written by Paris Re, which is included in this sub-segment’s results for a full yearin 2010 compared to the fourth quarter only of 2009. The increases were also driven by the marine, specialtyproperty, credit/surety and aviation lines of business, which benefited from new business written and increasedtreaty participations. These increases in gross and net premiums written and net premiums earned were partiallyoffset by decreases in all other lines, predominantly in the engineering line of business, which was driven by asignificant non-renewable treaty written in 2009.
Losses and loss expenses and loss ratio
2011 compared to 2010
The losses and loss expenses and loss ratio reported in 2011 reflected:
• large catastrophic losses related to the Thailand Floods, U.S. tornadoes, Japan Earthquake, theFebruary and June 2011 New Zealand Earthquakes and Australian Floods of $65 million, or 4.8 pointson the loss ratio;
• net favorable loss development on prior accident years of $129 million, or 9.4 points on the loss ratio;
• a higher level of mid-sized loss activity; and
• a decrease in the book of business and exposure and declines in pricing in certain lines of business.
The net favorable loss development of $129 million included net favorable loss development for prioraccident years in most lines of business, except for the energy and engineering lines, which experienced
92

combined adverse loss development for prior accident years of $13 million. The adverse loss development forprior accident year in the energy and engineering lines was driven by the increase in upward premiumadjustments reported by cedants in 2011, as described above. Loss information provided by cedants in 2011 forprior accident years was lower than the Company expected (higher for energy and engineering) and included noindividually significant losses or reductions but a series of attritional losses or reductions. Based on theCompany’s assessment of this loss information, the Company decreased (increased for energy and engineering)its expected ultimate loss ratios, which had the net effect of decreasing (increasing for energy and engineering)prior year loss estimates.
The decrease of $35 million in losses and loss expenses in 2011 compared to 2010 included:
• a decrease of $72 million in losses and loss expenses related to Deepwater Horizon; and
• a decrease of approximately $16 million in losses and loss expenses resulting from a decrease in thebook of business and exposure, which was partially offset by a higher level of mid-sized loss activityand the impact of declining profitability of the business in certain lines of business between periods;partially offset by
• a decrease of $42 million in net favorable prior year loss development. The decrease in net favorableprior year loss development in 2011 compared to 2010 was due to the increase in upward premiumadjustments reported by cedants; and
• an increase of $11 million related to large catastrophic losses.
2010 compared to 2009
The losses and loss expenses and loss ratio reported in 2010 reflected:
• large catastrophic losses related to the Chile Earthquake of $54 million, or 3.9 points on the loss ratio;
• losses and loss expenses related to Deepwater Horizon of $72 million, or 5.0 points on the loss ratio;
• the inclusion of losses and loss expenses related to business written by Paris Re;
• net favorable loss development on prior accident years of $171 million, or 12.2 points on the loss ratio;
• lower loss estimates in the credit/surety line of business reflecting abating economic and creditconditions;
• a higher level of mid-sized loss activity;
• increasing loss trends in the specialty casualty line of business; and
• an increase in the book of business and exposure.
The net favorable loss development of $171 million reported in 2010 included net favorable developmentfor prior accident years in all lines of business, except for the specialty casualty line, which experienced adverseloss development for prior accident years of $37 million. Loss information provided by cedants in 2010 for prioraccident years was lower than the Company expected (higher for specialty casualty) and included no individuallysignificant losses or reductions but a series of attritional losses or reductions. Based on the Company’sassessment of this loss information, the Company decreased its expected ultimate loss ratios for all lines ofbusiness (increased for specialty casualty), which had the net effect of decreasing (increasing for specialtycasualty) prior year loss estimates.
The increase of $253 million in losses and loss expenses in 2010 compared to 2009 included:
• an increase in losses and loss expenses of $126 million related to large catastrophic losses andDeepwater Horizon; and
93

• an increase in losses and loss expenses of approximately $190 million resulting from an increase inlosses and loss expenses related to business written by Paris Re, a higher level of mid-sized lossactivity, an increase in the book of business and exposure and increasing loss trends in the specialtycasualty line of business, partially offset by lower loss estimates in the credit/surety line of businessand normal fluctuations in profitability between periods; partially offset by
• an increase of $63 million in net favorable prior year loss development.
Acquisition costs and acquisition ratio
2011 compared to 2010
Acquisition costs and the acquisition ratio increased in 2011 compared to 2010 primarily due to higherprofit commission adjustments reported by cedants in the credit/surety line of business, and a shift in the mix ofbusiness towards the credit/surety line of business and towards proportional business, which generally carryrelatively higher acquisition ratios. The increase in acquisition costs was partially offset by the impact ofmodestly lower net premiums earned in 2011 compared to 2010.
2010 compared to 2009
Acquisition costs increased in 2010 compared to 2009 primarily as a result of higher net premiums earned.The acquisition ratio decreased primarily due to a shift from proportional to non-proportional business, whichcarries a lower acquisition cost ratio.
Technical result and technical ratio
2011 compared to 2010
The decrease of $30 million in the technical result and the corresponding increase in the technical ratio in2011 compared to 2010 was primarily attributable to a decrease of $42 million in net favorable prior year lossdevelopment, a higher level of mid-sized loss activity, higher acquisition costs, and modestly decliningprofitability in certain lines of business. These decreases in the technical result were partially offset by a decreasein large catastrophic losses and losses and loss expenses related to Deepwater Horizon of $59 million, net ofretrocession and reinstatement premiums.
2010 compared to 2009
The slight decrease in the technical result and corresponding increase in the technical ratio in 2010compared to 2009 was due to an increase in losses and loss expenses of $124 million, net of reinstatementpremiums, related to large catastrophic losses and Deepwater Horizon, increasing loss trends in the specialtycasualty line of business, a higher level of mid-sized loss activity and normal fluctuations in profitability betweenperiods, partially offset by an increase of $63 million in net favorable prior year loss development and lower lossestimates in the credit/surety line of business.
2012 Outlook
During the January 1, 2012 renewals, the Company generally observed a fragmented market withmeaningful improvements on loss-affected business and catastrophe exposed zones, and most other linesshowing minor improvement or holding steady. Overall, the expected premium volume from the Company’sJanuary 1, 2012 renewal, at constant foreign exchange rates, increased compared to the prior year renewal as aresult of the Company writing new business and increasing its participation on certain existing treaties.Management expects a continuation of the observed trends in pricing and terms and conditions during theremainder of 2012.
94

Catastrophe
The Catastrophe sub-segment writes business predominantly on a non-proportional basis and is exposed tovolatility resulting from catastrophic losses. Thus, profitability in any one year is not necessarily predictive offuture profitability. The results for 2011, 2010 and 2009 demonstrate this volatility. The results for 2011contained a significantly higher level of losses related to the 2011 catastrophic events, and the results for 2010included a large level of catastrophic losses related to the Chile Earthquake and 2010 New Zealand Earthquake,while the results for 2009 included no large catastrophic losses. The varying amounts of catastrophic lossessignificantly impacted the technical result and ratio and affected year over year comparisons as discussed below.
The following table provides the components of the technical result and the corresponding ratios for thissub-segment (in millions of U.S. dollars):
2011 % Change 2010 % Change 2009
Gross premiums written . . . . . . . . . . . . . . . . . . . . . . . . . . . . . . . . $ 599 (16)% $ 716 79% $400Net premiums written . . . . . . . . . . . . . . . . . . . . . . . . . . . . . . . . . . 562 (13) 646 63 397Net premiums earned . . . . . . . . . . . . . . . . . . . . . . . . . . . . . . . . . . $ 574 (15) $ 672 43 $470Losses and loss expenses . . . . . . . . . . . . . . . . . . . . . . . . . . . . . . . (1,459) 271 (393) NM (6)Acquisition costs . . . . . . . . . . . . . . . . . . . . . . . . . . . . . . . . . . . . . . (26) (47) (49) 49 (33)
Technical result . . . . . . . . . . . . . . . . . . . . . . . . . . . . . . . . . . . . . . . $ (911) NM $ 230 (47) $431Loss ratio . . . . . . . . . . . . . . . . . . . . . . . . . . . . . . . . . . . . . . . . . . . 254.2% 58.5% 1.3%Acquisition ratio . . . . . . . . . . . . . . . . . . . . . . . . . . . . . . . . . . . . . . 4.5 7.2 7.0
Technical ratio . . . . . . . . . . . . . . . . . . . . . . . . . . . . . . . . . . . . . . . 258.7% 65.7% 8.3%
NM: not meaningful
Premiums
The Catastrophe sub-segment represented 13%, 14% and 10% of total net premiums written in 2011, 2010and 2009, respectively. The decrease in the Catastrophe sub-segment’s net premiums written as a percentage oftotal net premiums written in 2011 compared to 2010 reflects a significant reduction in the portfolio andexposure, which is almost entirely offset by decreases in net premiums written in the Company’s other Non-lifesub-segments. The increase in the Catastrophe sub-segment’s net premiums written as a percentage of total netpremiums written in 2010 compared to 2009 was primarily due to the inclusion of Paris Re’s premiums writtenfor a full year in 2010 compared to the fourth quarter only of 2009.
2011 compared to 2010
Gross and net premiums written and net premiums earned decreased by 16%, 13%, 15%, respectively, in2011 compared to 2010. The decreases in gross and net premiums written and net premiums earned wereprimarily due to the Company’s decision to reduce certain catastrophe exposures and reposition its portfoliofollowing the integration of Paris Re’s business, and were partially offset by new business written, reinstatementpremiums related to the 2011 catastrophic events, increases in certain treaty participations and the impact of theweaker U.S. dollar in 2011 compared to 2010. Foreign exchange fluctuations increased gross and net premiumswritten by 2% and net premiums earned by 4%.
2010 compared to 2009
Gross and net premiums written and net premiums earned increased by 79%, 63% and 43%, respectively, in2010 compared to 2009. The increases in gross and net premiums written and net premiums earned resultedmainly from the inclusion of catastrophe business written by Paris Re, which is included in this sub-segment’sresults for a full year in 2010 compared to the fourth quarter only of 2009. The increase in gross and net
95

premiums written was also due to new business written as well as a timing difference related to the renewal of asignificant treaty. The increase in net premiums earned was lower than the increases in gross and net premiumswritten primarily due to the earning of premiums in the fourth quarter of 2009 related to Paris Re’s business thatwas written prior to the date of acquisition.
Losses and loss expenses and loss ratio
2011 compared to 2010
The losses and loss expenses and loss ratio reported in 2011 reflected:
• large catastrophic losses related to the Japan Earthquake, the February and June 2011 New ZealandEarthquakes, U.S. tornadoes, Australian Floods, Thailand Floods and losses related to aggregatecontracts covering losses in Australia and New Zealand of $1,511 million, or 262.1 points on the lossratio. The large catastrophic losses of $1,511 million, include a specific IBNR reserve of $48 millionrelated to the 2011 catastrophic events, above the sum of the recorded point estimates, given the highfrequency of, and uncertainty related to, these complex and volatile events;
• net favorable loss development on prior accident years of $96 million, or 16.8 points on the loss ratio;
• a lower level of mid-sized loss activity; and
• a decrease in the book of business and exposure.
The net favorable loss development of $96 million was primarily due to favorable loss emergence, as lossesreported by cedants in 2011 for prior accident years were lower than the Company expected. Based on theCompany’s assessment of this loss information, the Company decreased its expected ultimate loss ratio, whichhad the effect of decreasing the level of prior year loss estimates.
The increase of $1,066 million in losses and loss expenses in 2011 compared to 2010 included:
• an increase of $1,231 million in large catastrophic losses and losses related to aggregate contracts;partially offset by
• an increase of $52 million in net favorable prior year loss development; and
• a decrease of approximately $113 million in losses and loss expenses resulting from a decrease inlosses and loss expenses related to business written by Paris Re, a lower level of mid-sized loss activityand normal fluctuations in profitability between periods.
2010 compared to 2009
The losses and loss expenses and loss ratio reported in 2010 reflected:
• large catastrophic losses related to the Chile Earthquake, 2010 New Zealand Earthquake and largelosses related to an aggregate contract covering losses in Australia and New Zealand of $280 million,or 41.2 points on the loss ratio;
• a higher level of mid-sized loss activity;
• net favorable loss development on prior accident years of $44 million, or 6.5 points on the loss ratio;
• the inclusion of losses and loss expenses related to business written by Paris Re; and
• an increase in the book of business and exposure.
The net favorable loss development of $44 million was primarily due to favorable loss emergence, as lossesreported by cedants in 2010 for prior accident years were lower than the Company expected. Based on theCompany’s assessment of this loss information, the Company decreased its expected ultimate loss ratio, whichhad the effect of decreasing the level of prior year loss estimates.
96

The increase of $387 million in losses and loss expenses in 2010 compared to 2009 included:
• an increase in large catastrophic losses and large losses related to an aggregate contract of $280million;
• an increase in losses and loss expenses of approximately $102 million resulting from an increase inlosses and loss expenses related to business written by Paris Re, a higher level of mid-sized lossactivity and an increase in the book of business and exposure, partially offset by normal fluctuations inprofitability between periods; and
• a decrease of $5 million in net favorable prior year loss development.
Acquisition costs and acquisition ratio
2011 compared to 2010
Acquisition costs decreased in 2011 compared to 2010 primarily due to lower profit commissions as a resultof the large catastrophic losses and the decrease in net premiums earned. The lower profit commissions alsodecreased the acquisition ratio in 2011 compared to 2010.
2010 compared to 2009
Acquisition costs increased in 2010 compared to 2009 primarily as a result of higher net premiums earned.The acquisition ratio in 2010 was comparable to 2009.
Technical result and technical ratio
2011 compared to 2010
The decrease of $1,141 million in the technical result and the corresponding increase in the technical ratio in2011 compared to 2010 was primarily due to an increase of $1,195 million, net of retrocession, reinstatementpremiums and profit commissions, in large catastrophic losses and losses related to aggregate contracts, thedecrease in the book of business and exposure and normal fluctuations in profitability between periods. Thesedecreases in the technical result were partially offset by an increase of $52 million in net favorable prior year lossdevelopment, a decrease in losses and loss expenses related to business written by Paris Re and a lower level ofmid-sized loss activity.
2010 compared to 2009
The decrease of $201 million in the technical result and corresponding increase in the technical ratio in 2010compared to 2009 was primarily explained by an increase of $274 million, net of reinstatement premiums, inlarge catastrophic losses and losses related to an aggregate contract, a higher level of mid-sized loss activity anda decrease of $5 million in net favorable prior year loss development. These factors were partially offset by theinclusion of the technical result (before the impact of large catastrophic losses and prior year loss development)related to Paris Re’s business and normal fluctuations in profitability between periods.
2012 Outlook
During the January 1, 2012 renewals, the Company observed some significant pricing increases, notably inthose regions recently affected by significant loss experience. The expected premium volume from theCompany’s January 1, 2012 renewal, at constant foreign exchange rates, decreased compared to the prior yearrenewal primarily as a result of the Company’s decision to continue reducing catastrophe exposures and limits inall markets in order to rebalance its portfolio. Management expects a continuation of these reductions incatastrophe exposures and the trends for the remainder of 2012.
97

Life Segment
The following table provides the components of the allocated underwriting result for this segment (inmillions of U.S. dollars):
2011 % Change 2010 % Change 2009
Gross premiums written . . . . . . . . . . . . . . . . . . . . . . . . . . . . . . . . . $ 790 5% $ 749 26% $ 595Net premiums written . . . . . . . . . . . . . . . . . . . . . . . . . . . . . . . . . . 786 6 742 26 591Net premiums earned . . . . . . . . . . . . . . . . . . . . . . . . . . . . . . . . . . $ 792 7 $ 744 27 $ 587Life policy benefits . . . . . . . . . . . . . . . . . . . . . . . . . . . . . . . . . . . . (650) 4 (624) 42 (440)Acquisition costs . . . . . . . . . . . . . . . . . . . . . . . . . . . . . . . . . . . . . . (117) 1 (116) 3 (113)
Technical result . . . . . . . . . . . . . . . . . . . . . . . . . . . . . . . . . . . . . . . $ 25 583 $ 4 (89) $ 34Other income . . . . . . . . . . . . . . . . . . . . . . . . . . . . . . . . . . . . . . . . . 1 (62) 2 2 2Other operating expenses . . . . . . . . . . . . . . . . . . . . . . . . . . . . . . . (53) (7) (57) 21 (47)Net investment income . . . . . . . . . . . . . . . . . . . . . . . . . . . . . . . . . 66 (8) 71 16 62
Allocated underwriting result (1) . . . . . . . . . . . . . . . . . . . . . . . . . . . $ 39 94 $ 20 (60) $ 51
(1) Allocated underwriting result is defined as net premiums earned, other income or loss and allocated netinvestment income less life policy benefits, acquisition costs and other operating expenses.
Premiums
The Life segment represented 18%, 16% and 15% of total net premiums written in 2011, 2010 and 2009,respectively. The increase in the Life segment’s net premiums written as a percentage of total net premiumswritten in 2011 compared to 2010 and 2009 was primarily due to decreases in net premiums written in theCompany’s Non-life segment, as described above, and also due to new business written in the Life segment, asdescribed below.
2011 compared to 2010
Gross and net premiums written and net premiums earned increased by 5%, 6% and 7%, respectively, in2011 compared to 2010. The increase in gross and net premiums written and net premiums earned was primarilydue to new business written during 2010 in the longevity line, which is fully reflected in 2011 but was onlypartially reflected in 2010, as well as new business and growth in the mortality line and the impact of foreignexchange. Foreign exchange fluctuations increased gross and net premiums written and net premiums earned by4% due to the impact of the weaker U.S. dollar in 2011 compared to 2010. These increases in gross and netpremiums written and net premiums earned were partially offset by a decrease related to the restructuring of alongevity treaty.
2010 compared to 2009
Gross and net premiums written increased by 26% and net premiums earned increased by 27% in 2010compared to 2009. The increases in gross and net premiums written and net premiums earned were primarilydriven by new business written in the longevity line, and, to a lesser extent, the mortality line.
Allocated underwriting result
2011 compared to 2010
The allocated underwriting result increased by $19 million, from $20 million in 2010 to $39 million in2011. The increase in the allocated underwriting result was due to a decrease of $13 million in net adverse prioryear loss development, increased profitability generated from new and existing business and a decrease in otheroperating expenses, which were partially offset by a decrease in net investment income.
98

The decrease in the net adverse prior year loss development of $13 million in 2011, reflected $1 million ofnet favorable prior year loss development in 2011 compared to $12 million of net adverse prior year lossdevelopment in 2010. The modest net favorable prior year loss development of $1 million in 2011 was the netresult of favorable prior year loss development of $6 million on certain mortality treaties and $5 million relatedto the GMDB business, which were almost entirely offset by adverse prior year loss development related todisability riders on certain short-term non-proportional treaties in the mortality line following the receipt ofupdated information from cedants. The net adverse prior year loss development of $12 million in 2010 isdescribed below.
Net investment income decreased by $5 million, from $71 million in 2010 to $66 million in 2011 primarilydue to a decrease in the funds held balance related to the restructuring of a longevity treaty and lower positiveadjustments on funds held contracts reported by cedants.
2010 compared to 2009
The allocated underwriting result decreased by $31 million, from $51 million in 2009 to $20 million in2010. The decrease in the allocated underwriting result was primarily due to an increase of $27 million in netadverse prior year loss development and an increase in other operating expenses, which were partially offset byan increase in net investment income and normal fluctuations in profitability between periods.
The increase in the net adverse prior year loss development of $27 million in 2010, reflected $12 million ofnet adverse prior year loss development in 2010 compared to $15 million of net favorable prior year lossdevelopment in 2009. The net adverse prior year loss development of $12 million in 2010 was primarily drivenby adverse development of $23 million due to an improvement in the mortality trend related to an ILA treaty inthe longevity line and adverse development on certain mortality treaties. This adverse development was partiallyoffset by favorable prior year loss development of $17 million resulting from the GMDB business, where thepayout is linked to the performance of underlying capital market assets, driven by new cedant information andupdated assumptions. The net favorable prior year loss development of $15 million in 2009 was mainly driven bythe GMDB business.
Other operating expenses increased by $10 million, from $47 million in 2009 to $57 million in 2010primarily due to higher personnel costs. Net investment income increased by $9 million, from $62 million in2009 to $71 million in 2010 primarily as a result of positive adjustments on funds held contracts reported bycedants and higher invested assets, partially offset by lower interest rates.
2012 Outlook
The majority of the Life segment premium arises from in-force contracts that are written on a continuousbasis. The active January 1 renewals impact a relatively limited portion of the in-force premium and areexclusively contained in the mortality line. For those treaties that actively renewed, pricing conditions and termswere generally unchanged leading to a modest level of cancellations and reductions in treaty participations wherethe offered terms were considered inadequate. These reductions were largely offset by improved terms onselected existing treaties and new business from both new and existing clients. Management expects moderatecontinued growth in 2012, assuming constant foreign exchange rates.
99

Premium Distribution by Line of Business
The distribution of net premiums written by line of business for the years ended December 31, 2011, 2010and 2009 was as follows:
2011 2010 2009
Non-lifeProperty and casualty
Casualty . . . . . . . . . . . . . . . . . . . . . . . . . . . . . . . . . . . . . . . . . . . . . . . . . . . . . . . . . . . 11% 11% 13%Property . . . . . . . . . . . . . . . . . . . . . . . . . . . . . . . . . . . . . . . . . . . . . . . . . . . . . . . . . . . 15 18 18Motor . . . . . . . . . . . . . . . . . . . . . . . . . . . . . . . . . . . . . . . . . . . . . . . . . . . . . . . . . . . . . 5 7 6Multiline and other . . . . . . . . . . . . . . . . . . . . . . . . . . . . . . . . . . . . . . . . . . . . . . . . . . 2 2 2
SpecialtyAgriculture . . . . . . . . . . . . . . . . . . . . . . . . . . . . . . . . . . . . . . . . . . . . . . . . . . . . . . . . . 7 4 8Aviation / Space . . . . . . . . . . . . . . . . . . . . . . . . . . . . . . . . . . . . . . . . . . . . . . . . . . . . . 5 5 5Catastrophe . . . . . . . . . . . . . . . . . . . . . . . . . . . . . . . . . . . . . . . . . . . . . . . . . . . . . . . . 13 14 10Credit / Surety . . . . . . . . . . . . . . . . . . . . . . . . . . . . . . . . . . . . . . . . . . . . . . . . . . . . . . 7 6 6Energy . . . . . . . . . . . . . . . . . . . . . . . . . . . . . . . . . . . . . . . . . . . . . . . . . . . . . . . . . . . . 2 2 2Engineering . . . . . . . . . . . . . . . . . . . . . . . . . . . . . . . . . . . . . . . . . . . . . . . . . . . . . . . . 4 4 5Marine . . . . . . . . . . . . . . . . . . . . . . . . . . . . . . . . . . . . . . . . . . . . . . . . . . . . . . . . . . . . 6 6 5Specialty casualty . . . . . . . . . . . . . . . . . . . . . . . . . . . . . . . . . . . . . . . . . . . . . . . . . . . 2 3 3Specialty property . . . . . . . . . . . . . . . . . . . . . . . . . . . . . . . . . . . . . . . . . . . . . . . . . . . 3 2 2
Life . . . . . . . . . . . . . . . . . . . . . . . . . . . . . . . . . . . . . . . . . . . . . . . . . . . . . . . . . . . . . . . . . . . . . . . 18 16 15
Total . . . . . . . . . . . . . . . . . . . . . . . . . . . . . . . . . . . . . . . . . . . . . . . . . . . . . . . . . . . . . . . . . . . . . . 100% 100% 100%
The changes in the distribution of net premiums written by line of business between 2011, 2010 and 2009primarily reflected the Company’s response to existing market conditions, with the comparison between 2011and 2010 specifically affected by the repositioning of its portfolio following the integration of Paris Re and thereduction of catastrophe exposed business. The comparison between 2010 and 2009 is specifically affected bythe inclusion of Paris Re’s premiums for a full year in 2010 compared to the fourth quarter only of 2009. Thedistribution of net premiums written may also be affected by the timing of renewals of treaties, a change in treatystructure, premium adjustments reported by cedants and significant increases or decreases in other lines ofbusiness. In addition, foreign exchange fluctuations affected the comparison for all lines.
• Property: the decrease in the distribution of net premiums written in 2011 compared to 2010 was drivenprimarily by the effects of the Company’s decisions to cancel or reduce business as a result ofreductions in pricing and to reposition its portfolio following the integration of Paris Re’s business,which included reducing the level of catastrophe exposed business.
• Agriculture: the increase in the distribution of net premiums written in 2011 compared to 2010 wasdriven by increased demand, higher agricultural commodity prices and lower downward premiumadjustments. The decrease in the distribution of net premiums written in 2010 compared to 2009 wasprimarily due to lower commodity prices and higher cedants’ retentions.
• Catastrophe: the decrease in the distribution of net premiums written in 2011 compared to 2010 wasdriven by the repositioning of the Company’s portfolio following the integration of Paris Re, whichincluded reducing the level of catastrophe exposed business. Given the absolute decrease inCatastrophe net premiums written was 13%, the percentage distribution by line of business onlydecreased by 1% in 2011 compared to 2010 due to significant decreases in other lines of business. Theincrease in the distribution of net premiums written in 2010 compared to 2009 is primarily due to theinclusion of Paris Re’s premiums, as described above. Paris Re’s catastrophe line of businessrepresented a relatively higher percentage of its net premiums written compared to the Company’s.
100

• Life: the increase in the distribution of net premiums written between 2011, 2010 and 2009 wasprimarily due to the decrease in net premiums written in most of the Company’s Non-life lines ofbusiness and an increase in business written in the longevity and mortality lines, as described above.
2012 Outlook
Based on information received from cedants and brokers during the January 1, 2012 renewals and assumingthat similar trends and conditions to those experienced during the January 1, 2012 renewals continue through theyear, Management expects a further decrease in the relative distribution of net premiums written to thecatastrophe line of business in 2012 compared to 2011, following further reductions in certain catastropheexposures. Management expects other lines to be broadly comparable to 2011.
Premium Distribution by Reinsurance Type
The Company typically writes business on either a proportional or non-proportional basis. On proportionalbusiness, the Company shares proportionally in both the premiums and losses of the cedant. On non-proportionalbusiness, the Company is typically exposed to loss events in excess of a predetermined dollar amount or lossratio. In both proportional and non-proportional business, the Company typically reinsures a large group ofprimary insurance contracts written by the ceding company. In addition, the Company writes business on afacultative basis. Facultative arrangements are generally specific to an individual risk and can be written oneither a proportional or non-proportional basis. Generally, the Company has more influence over pricing, as wellas terms and conditions, in non-proportional and facultative arrangements.
The distribution of gross premiums written by reinsurance type for the years ended December 31, 2011,2010 and 2009 was as follows:
2011 2010 2009
Non-life segmentProportional . . . . . . . . . . . . . . . . . . . . . . . . . . . . . . . . . . . . . . . . . . . . . . . . . . . . . . . . . . . 47% 47% 55%Non-proportional . . . . . . . . . . . . . . . . . . . . . . . . . . . . . . . . . . . . . . . . . . . . . . . . . . . . . . . 27 31 25Facultative . . . . . . . . . . . . . . . . . . . . . . . . . . . . . . . . . . . . . . . . . . . . . . . . . . . . . . . . . . . . 9 7 5
Life segment(1) . . . . . . . . . . . . . . . . . . . . . . . . . . . . . . . . . . . . . . . . . . . . . . . . . . . . . . . . . . . . . . 17 15 15
Total . . . . . . . . . . . . . . . . . . . . . . . . . . . . . . . . . . . . . . . . . . . . . . . . . . . . . . . . . . . . . . . . . . . . . 100% 100% 100%
(1) Substantially all of the Life segment’s gross premiums written for all periods presented are proportional.
The distribution of gross premiums written by reinsurance type is affected by changes in the allocation ofcapacity among lines of business, the timing of receipt by the Company of cedant accounts and premiumadjustments by cedants. In addition, foreign exchange fluctuations affected the comparison for all treaty types.
The changes in the distribution of gross premiums written by reinsurance type between 2011 and 2010primarily reflect a shift from non-proportional business to facultative business in the Non-life segment and a shiftin mix from the Non-life segment to the Life segment. The shift from non-proportional to facultative businesswas driven by a reduction in catastrophe exposed business and new business written and positive premiumadjustments in the marine and engineering lines of business. The shift in the mix of business from the Non-lifesegment to the Life segment results from the decreases in gross premiums written following the cancellation andreduction of business and the repositioning of the Company’s portfolio in certain lines of the Non-life segmentcompared to increases in gross premiums written from the longevity line and mortality lines of business in theLife segment.
The changes in the distribution of gross premiums written by reinsurance type in the Non-life segmentbetween 2010 and 2009 primarily reflected the inclusion of Paris Re’s premiums for a full year in 2010 compared
101

to the fourth quarter only of 2009. The increase in the distribution to non-proportional and facultative in 2010 isdue to Paris Re’s business, which was comprised of a higher percentage of these treaty types than the Company’sother Non-life business. The reduction in the proportional business written in the Non-life segment in 2010 wasalso driven by the decreases in the agriculture line of business, as described above.
2012 Outlook
Based on renewal information from cedants and brokers, and assuming that similar conditions experiencedduring the January 1, 2012 renewals continue throughout the year, Management expects a modest shift in therelative distribution of gross premiums written from non-proportional to other treaty types as a result of theCompany continuing to reduce its catastrophe exposures.
Premium Distribution by Geographic Region
The following table provides the geographic distribution of gross premiums written based on the location ofthe underlying risk for the years ended December 31, 2011, 2010 and 2009:
2011 2010 2009
Europe . . . . . . . . . . . . . . . . . . . . . . . . . . . . . . . . . . . . . . . . . . . . . . . . . . . . . . . . . . . . . . . . . . . . 41% 43% 41%North America . . . . . . . . . . . . . . . . . . . . . . . . . . . . . . . . . . . . . . . . . . . . . . . . . . . . . . . . . . . . . . 36 36 41Asia, Australia and New Zealand . . . . . . . . . . . . . . . . . . . . . . . . . . . . . . . . . . . . . . . . . . . . . . . 12 10 8Latin America, Caribbean and Africa . . . . . . . . . . . . . . . . . . . . . . . . . . . . . . . . . . . . . . . . . . . . 11 11 10
Total . . . . . . . . . . . . . . . . . . . . . . . . . . . . . . . . . . . . . . . . . . . . . . . . . . . . . . . . . . . . . . . . . . . . . . 100% 100% 100%
The decrease in the distribution of gross premiums written in Europe was primarily driven by thecancellation and reduction of business and the repositioning of the Company’s portfolio following the integrationof Paris Re, and was partially offset by higher gross premiums written in the Company’s Life segment and theimpact of foreign exchange fluctuations, as premiums denominated in currencies that have appreciated againstU.S. dollar were converted into U.S. dollar at higher average exchange rates. While gross premiums written inthe Company’s North America sub-segment increased in 2011 compared to 2010, the distribution of grosspremiums written in North America in 2011 was comparable to 2010 due to the more pronounced increase in thedistribution of gross premiums written in Asia, Australia and New Zealand, which was primarily due toreinstatement premiums associated with the Japan Earthquake and the February and June 2011 New ZealandEarthquakes.
2012 Outlook
Based on renewal information from cedants and brokers, and assuming that similar conditions experiencedduring the January 1, 2012 renewals continue throughout the year and based on constant foreign exchange rates,Management expects the distribution of gross premiums written by geographic region in 2012 to be comparableto 2011.
102

Premium Distribution by Production Source
The Company generates its gross premiums written both through brokers and through direct relationshipswith cedants. The percentage of gross premiums written by production source for the years ended December 31,2011, 2010 and 2009 was as follows:
2011 2010 2009
Broker . . . . . . . . . . . . . . . . . . . . . . . . . . . . . . . . . . . . . . . . . . . . . . . . . . . . . . . . . . . . . . . . . . . . 72% 73% 72%Direct . . . . . . . . . . . . . . . . . . . . . . . . . . . . . . . . . . . . . . . . . . . . . . . . . . . . . . . . . . . . . . . . . . . . . 28 27 28
Total . . . . . . . . . . . . . . . . . . . . . . . . . . . . . . . . . . . . . . . . . . . . . . . . . . . . . . . . . . . . . . . . . . . . . . 100% 100% 100%
The distribution of gross premiums written by production source was comparable between 2011, 2010 and2009.
2012 Outlook
Based on renewal information from cedants and brokers, and assuming that similar conditions experiencedduring the January 1, 2012 renewals continue throughout the year, Management expects the production source ofgross premiums written in 2012 to be comparable to 2011.
Corporate and Other
Corporate and Other is comprised of the Company’s capital markets and investment related activities,including principal finance transactions, insurance-linked securities and strategic investments, and its corporateactivities, including other operating expenses. The year over year comparisons of the investment related andcorporate activities are affected by Paris Re’s results being included for a full year in 2011 and 2010, comparedto the fourth quarter only of 2009.
Net Investment Income
The table below provides net investment income by asset source for the years ended December 31, 2011,2010 and 2009 (in millions of U.S. dollars):
2011 % Change 2010 % Change 2009
Fixed maturities . . . . . . . . . . . . . . . . . . . . . . . . . . . . . . . . . . . . . . . . . $562 (3)% $580 4% $559Short-term investments, cash and cash equivalents . . . . . . . . . . . . . . 4 (55) 8 (28) 12Equities . . . . . . . . . . . . . . . . . . . . . . . . . . . . . . . . . . . . . . . . . . . . . . . . 20 (5) 21 50 14Funds held and other . . . . . . . . . . . . . . . . . . . . . . . . . . . . . . . . . . . . . 49 (6) 53 61 33Funds held – directly managed . . . . . . . . . . . . . . . . . . . . . . . . . . . . . . 38 (27) 52 191 18Investment expenses . . . . . . . . . . . . . . . . . . . . . . . . . . . . . . . . . . . . . . (44) 5 (41) 5 (40)
Net investment income . . . . . . . . . . . . . . . . . . . . . . . . . . . . . . . . . . . . $629 (6) $673 13 $596
Because of the interest-sensitive nature of some of the Company’s Life products, net investment income isconsidered in Management’s assessment of the profitability of the Life segment (see Life segment above). Thefollowing discussion includes net investment income from all investment activities, including the net investmentincome allocated to the Life segment.
103

2011 compared to 2010
Net investment income decreased in 2011 compared to 2010 primarily due to:
• a decrease in net investment income from fixed maturities, short-term investments and cash and cashequivalents primarily due to lower reinvestment rates, which was partially offset by purchases ofhigher yielding investments and the reinvestment of cash flows from operations; and
• a decrease in net investment income from funds held – directly managed primarily related to the loweraverage balance in the funds held – directly managed account, which was related to the release ofassets following the Endorsement (see Funds Held – Directly Managed below) to the quota shareretrocessional agreement with Colisée Re in February 2011 and the run-off of the underlying liabilities.The assets released from the funds held – directly managed account were reinvested in the Company’sfixed maturity portfolio at lower reinvestment rates; partially offset by
• the weakening of the U.S. dollar, on average, in 2011 compared to 2010 which contributed a 1%increase in net investment income.
2010 compared to 2009
Net investment income increased in 2010 compared to 2009 primarily due to:
• an increase in net investment income from fixed maturities due to the purchase of higher yieldinginvestments and the reinvestment of cash flows from operations. This increase was partially offset bythe sale of fixed maturities to finance the Company’s repurchase of common shares of $1,083 millionand to repay debt of $200 million during 2010;
• an increase in net investment income from fixed maturities and from funds held – directly managed dueto the inclusion of Paris Re’s net investment income for a full year in 2010 compared to the fourthquarter only of 2009;
• an increase in net investment income on funds held and other as a result of higher investment incomereported by cedants and a higher level of other invested assets held in 2010, on average, compared to2009; and
• an increase in net investment income from equities due to a higher level of equity exposures held, onaverage, in 2010 compared to 2009; partially offset by
• lower reinvestment rates, on average, in 2010 compared to 2009.
2012 Outlook
Assuming constant foreign exchange rates, Management expects net investment income to decrease in 2012compared to 2011 primarily due to lower reinvestment rates with low government yields expected to continuethroughout 2012. Management expects this decrease to be partially offset by expected positive cash flow fromoperations (including net investment income).
Net Realized and Unrealized Investment Gains
The Company’s portfolio managers have dual investment objectives of optimizing current investmentincome and achieving capital appreciation. To meet these objectives, it is often desirable to buy and sellsecurities to take advantage of changing market conditions and to reposition the investment portfolios.Accordingly, recognition of realized gains and losses is considered by the Company to be a normal consequenceof its ongoing investment management activities. In addition, the Company records changes in fair value forsubstantially all of its investments as unrealized investment gains or losses in its Consolidated Statements ofOperations. Realized and unrealized investment gains and losses are generally a function of multiple factors, withthe most significant being prevailing interest rates, credit spreads, and equity market conditions.
104

As discussed in Overview above, U.S. and European risk-free interest rates decreased and credit spreadswidened, while equity markets remained relatively flat during 2011. In addition to these general economicfactors, the Company realized losses on treasury note futures and incurred losses related to certain insurance-linked securities impacted by the Japan Earthquake. The Company uses treasury note futures to manage theduration of its investment portfolio and the realized losses represent the Company reducing the duration of itsinvestment portfolio to protect against the possibility of risk-free interest rates rising. These factors had an impacton the Company’s investment portfolio and the related level of realized and unrealized gains and losses oninvestments compared to 2010, during which U.S. and European risk-free interest rates decreased, equity marketsrose and credit spreads declined modestly.
The components of net realized and unrealized investment gains for the years ended December 31, 2011,2010 and 2009 were as follows (in millions of U.S. dollars):
2011 2010 2009
Net realized investment gains on fixed maturities and short-term investments . . . . . . . . . . $ 157 $173 $105Net realized investment gains (losses) on equities . . . . . . . . . . . . . . . . . . . . . . . . . . . . . . . . 91 45 (45)Net realized investment losses on other invested assets . . . . . . . . . . . . . . . . . . . . . . . . . . . . (176) (68) (36)Change in net unrealized investment (losses) gains on other invested assets . . . . . . . . . . . . (46) 4 58Change in net unrealized investment gains on fixed maturities and short-term
investments . . . . . . . . . . . . . . . . . . . . . . . . . . . . . . . . . . . . . . . . . . . . . . . . . . . . . . . . . . . . 128 143 323Change in net unrealized investment (losses) gains on equities . . . . . . . . . . . . . . . . . . . . . . (102) 65 186Net other realized and unrealized investment gains . . . . . . . . . . . . . . . . . . . . . . . . . . . . . . . 4 13 2Net realized and unrealized investment gains (losses) on funds held – directly managed . . 11 27 (2)
Net realized and unrealized investment gains . . . . . . . . . . . . . . . . . . . . . . . . . . . . . . . . . . . . $ 67 $402 $591
2011 compared to 2010
Net realized and unrealized investment gains decreased by $335 million, from $402 million in 2010 to $67million in 2011. The net realized and unrealized investment gains of $67 million in 2011 were primarily due todeclining U.S. and European risk-free interest rates, which were partially offset by widening credit spreads,realized and unrealized losses on treasury note futures and losses on insurance-linked securities impacted by theJapan Earthquake. Net realized and unrealized investment gains of $67 million in 2011 primarily consisted of netrealized investment gains on fixed maturities and short-term investments and equities of $248 million and thechange in net unrealized investment gains on fixed maturities and short-term investments of $128 million, whichwere partially offset by net realized investment losses on other invested assets (mainly related to treasury notefutures) of $176 million and the change in net unrealized investment losses on equities and other invested assetsof $148 million.
Net realized and the change in net unrealized investment losses on other invested assets were a combinedloss of $222 million in 2011 and primarily related to realized and unrealized losses on treasury note futures, netrealized and unrealized losses on certain non-publicly traded investments, and a realized loss on insurance-linkedderivative securities impacted by the Japan Earthquake. Net realized investment losses and the change in netunrealized investment gains on other invested assets were a combined loss of $64 million in 2010 and primarilyrelated to losses on treasury note futures, which were partially offset by unrealized gains on certain non-publiclytraded investments and net realized and unrealized gains on total return swaps.
Net realized and unrealized investment gains on funds held – directly managed of $11 million and $27million in 2011 and 2010, respectively, primarily related to net realized and the change in net unrealizedinvestment gains on fixed maturities and short-term investments in the segregated investment portfoliounderlying the funds held – directly managed account and were due to decreases in U.S. and European risk-freeinterest rates.
105

2010 compared to 2009
Net realized and unrealized investment gains decreased by $189 million, from $591 million in 2009 to $402million in 2010. The net realized and unrealized investment gains of $402 million in 2010 were primarily due tolower U.S. and European risk-free interest rates, increases in worldwide equity markets and modestly narrowercredit spreads. Net realized and unrealized investment gains of $402 million in 2010 consisted of net realizedinvestment gains on fixed maturities, short-term investments and equities of $218 million, the change in netunrealized investment gains on fixed maturities, short-term investments, equities and other invested assets of$212 million, net realized and unrealized investment gains on funds held – directly managed and net otherrealized and unrealized gains of $40 million, which were partially offset by net realized losses on other investedassets of $68 million.
Net realized losses and the change in net unrealized gains on other invested assets were a combined loss of$64 million in 2010 primarily related to realized and unrealized losses on treasury note futures, which werepartially offset by net unrealized gains on certain non-publicly traded investments and net realized and unrealizedgains on total return swaps. The change in net unrealized gains and net realized losses on other invested assetswere a combined gain of $22 million in 2009 and primarily related to net unrealized gains on total return swapsand treasury note futures and net realized gains on equity futures, which were partially offset by realized losseson treasury note futures and credit default swaps.
Net realized and unrealized investment gains on funds held – directly managed of $27 million in 2010primarily relate to changes in unrealized gains on fixed maturities and short-term investments in the segregatedinvestment portfolio underlying the funds held – directly managed account and were due to decreases in risk-freerates.
Interest in (Losses) Earnings of Equity Investments
The interest in the results of equity investments represents the Company’s aggregate share of earnings orlosses related to several private placement investments and limited partnerships in which the Company has morethan a minor interest.
2011 compared to 2010
The Company’s interest in the results of equity investments decreased from a gain of $13 million in 2010 toa loss of $6 million in 2011 primarily due to net unrealized and realized losses and write-downs on severalunrelated private placement and limited partnership investments.
2010 compared to 2009
The Company’s interest in the results of equity investments was $13 million in 2010 compared to $16million in 2009.
Technical Result and Other Income
Technical result and other income included in Corporate and Other primarily relates to certain insurance-linked securities and principal finance transactions.
2011 compared to 2010
Technical result and other income included in Corporate and Other was $9 million combined in 2011,compared to $3 million combined in 2010. The increase of $6 million in 2011 compared to 2010 was primarilyrelated to an increase in the technical result for insurance-linked securities and was driven by a higher level of netpremiums earned.
106

2010 compared to 2009
Technical result and other income included in Corporate and Other was $3 million combined in 2010,compared to $17 million combined in 2009. The decrease of $14 million in 2010 compared to 2009 wasprimarily related to a decline in the technical result for insurance-linked securities and was driven by lower netpremiums earned and a lower level of net favorable prior year loss development.
Other Operating Expenses
The Company’s total other operating expenses for the years ended December 31, 2011, 2010 and 2009 wereas follows (in millions of U.S. dollars):
2011 % Change 2010 % Change 2009
Other operating expenses . . . . . . . . . . . . . . . . . . . . . . . . . . . . . . . . . . $435 (19)% $540 25% $431
Other operating expenses represent 9.4%, 11.3% and 10.5% of net premiums earned (both Non-life andLife) for the years ended December 31, 2011, 2010 and 2009, respectively. Other operating expenses included inCorporate and Other were $99 million, $166 million and $131 million, of which $83 million, $151 million and$117 million are related to corporate activities for the years ended December 31, 2011, 2010, and 2009,respectively.
2011 compared to 2010
Other operating expenses decreased by 19% in 2011 compared to 2010. The decrease was primarily due to acharge of $41 million in 2010 related to the Company’s voluntary plan, lower personnel costs (including lowershare-based compensation expenses) and lower costs related to Paris Re’s operations following its integrationinto the Company’s operations. These decreases in other operating expenses were partially offset by foreignexchange fluctuations, which increased other operating expenses by 5% due to the weakening of the U.S. dollarin 2011 compared to 2010.
2010 compared to 2009
The increase in other operating expenses of 25% in 2010 compared to 2009 was primarily due to theinclusion of Paris Re’s operating expenses for a full year in 2010 compared to the fourth quarter only of 2009, acharge of $41 million in 2010 related to the Company’s voluntary plan, and increased personnel expenses, whichwere partially offset by lower consulting and professional fees related to the Paris Re acquisition.
Income Taxes
The Company’s effective income tax rate, which we calculate as income tax expense or benefit divided bynet income or loss before taxes, may fluctuate significantly from period to period depending on the geographicdistribution of pre-tax net income or loss in any given period between different jurisdictions with comparativelyhigher tax rates and those with comparatively lower tax rates. The geographic distribution of pre-tax net incomeor loss can vary significantly between periods due to, but not limited to, the following factors: the business mixof net premiums written and earned; the geographic location, quantum and nature of net losses and loss expensesincurred; the quantum and geographic location of other operating expenses, net investment income, net realizedand unrealized investment gains and losses; and the quantum of specific adjustments to determine the income taxbasis in each of the Company’s operating jurisdictions. In addition, a significant portion of the Company’s grossand net premiums are currently written and earned in Bermuda, a non-taxable jurisdiction, including the majorityof the Company’s catastrophe business, which can result in significant volatility to the Company’s pre-tax netincome or loss in any given period.
107

The Company’s income tax expense and effective income tax rate for the years ended December 31, 2011,2010 and 2009 were as follows (in millions of U.S. dollars):
2011 2010 2009
Income tax expense . . . . . . . . . . . . . . . . . . . . . . . . . . . . . . . . . . . . . . . . . . . . . . . . . . . . . . . $ 69 $ 129 $ 262Effective income tax rate . . . . . . . . . . . . . . . . . . . . . . . . . . . . . . . . . . . . . . . . . . . . . . . . . . (15.3)% 13.1% 14.6%
2011 compared to 2010
Income tax expense and the effective income tax rate during 2011 were $69 million and (15.3)%,respectively. Income tax expense and the effective income tax rate during 2011 were primarily driven by thegeographic distribution of the Company’s pre-tax net loss between its various taxable and non-taxablejurisdictions. Specifically, the income tax expense and the effective income tax rate included a significant portionof the Company’s pre-tax net loss recorded in non-taxable jurisdictions and jurisdictions with comparativelylower tax rates with no associated tax benefit, which were driven by the large catastrophic losses described in theReview of Net (Loss) Income. The Company’s taxable jurisdictions recorded pre-tax net income and an incometax expense, which resulted from a relatively low level of catastrophe losses and realized and unrealizedinvestment gains. The income tax expense recorded by the Company’s taxable jurisdictions was partially offsetby the recognition of a tax benefit during 2011 related to the expiration of the statute of limitations of uncertaintax positions following the completion of certain tax examinations.
Income tax expense and the effective income tax rate during 2010 were $129 million and 13.1%,respectively. Income tax expense and the effective income tax rate during 2010 were driven by the geographicdistribution of the Company’s pre-tax net income between its various taxable and non-taxable jurisdictions.Specifically, the income tax expense and the effective income tax rate during 2010, included a relatively evendistribution of the Company’s pre-tax net income between its various jurisdictions. The Company’s taxablejurisdictions recorded significant realized and unrealized investment gains, which were partially offset bysignificant catastrophe losses related to the Chile Earthquake and the 2010 New Zealand Earthquake, lossesrelated to Deepwater Horizon, and charges related to the Company’s voluntary plan. The Company’s non-taxablejurisdictions benefitted from comparatively lower levels of catastrophe losses and realized and unrealizedinvestment gains.
2010 compared to 2009
Income tax expense and the effective income tax rate during 2010 were $129 million and 13.1%,respectively, and were primarily driven by the geographic distribution of the Company’s pre-tax net incomebetween its various taxable and non-taxable jurisdictions, as described above.
Income tax expense and the effective income tax rate during 2009 were $262 million and 14.6%,respectively. Income tax expense and the effective income tax rate during 2009 were primarily driven by thegeographic distribution of the Company’s pre-tax net income between its various taxable and non-taxablejurisdictions. Specifically, the income tax expense and the effective income tax rate included a relatively evendistribution of the Company’s pre-tax net income between its various jurisdictions. The Company’s non-taxableand taxable jurisdictions recorded a significant level of pre-tax net income, in the absence of significantcatastrophe losses, and the taxable jurisdictions recorded a significant level of net realized and unrealizedinvestment gains.
Financial Condition, Liquidity and Capital Resources
The Company purchased, as part of its acquisition of Paris Re, an investment portfolio and a funds held –directly managed account. The discussion of the acquired Paris Re investment portfolio is included in thediscussion of Investments below. The discussion of the segregated investment portfolio underlying the funds held– directly managed account is included separately in Funds Held – Directly Managed below.
108

Investments
Investment philosophy
The Company employs a prudent investment philosophy. It maintains a high quality, well balanced andliquid portfolio having the dual objectives of optimizing current investment income and achieving capitalappreciation. The Company’s invested assets are comprised of total investments, cash and cash equivalents andaccrued investment income. From a risk management perspective, the Company allocates its invested assets intotwo categories: liability funds and capital funds.
Liability funds (including funds held – directly managed) represent invested assets supporting the netreinsurance liabilities, defined as the Company’s operating and reinsurance liabilities net of reinsurance assets,and are invested primarily in high quality fixed income securities. The preservation of liquidity and protection ofcapital are the primary investment objectives for these assets. The portfolio managers are required to adhere toinvestment guidelines as to minimum ratings and issuer and sector concentration limitations. Liability funds areinvested in a way that generally matches them to the corresponding liabilities (referred to as asset-liabilitymatching) in terms of both duration and major currency composition to provide the Company with a naturalhedge against changes in interest and foreign exchange rates. In addition, the Company utilizes certainderivatives to further protect against changes in interest and foreign exchange rates.
Capital funds represent shareholder capital of the Company and are invested in a diversified portfolio withthe objective of maximizing investment return, subject to prudent risk constraints. Capital funds contain most ofthe asset classes typically viewed as offering a higher risk and higher return profile, subject to risk assumptionand portfolio diversification guidelines which include issuer and sector concentration limitations. Capital fundsmay be invested in investment grade and below investment grade fixed income securities, preferred and commonstocks, private placement equity and bond investments, emerging markets and high-yield fixed income securitiesand certain other specialty asset classes. The Company believes that an allocation of a portion of its investmentsto equities is both prudent and desirable, as it helps to achieve broader asset diversification (lower risk) andmaximizes the portfolio’s total return over time.
At December 31, 2011, the liability funds totaled $11.2 billion (including funds held – directly managed), or62% of the Company’s total invested assets, compared to $10.6 billion at December 31, 2010. The liability fundswere comprised of cash and cash equivalents and high quality fixed income securities. The increase in theliability funds at December 31, 2011 compared to December 31, 2010 reflects the increase in unpaid losses andloss expenses, which was driven by the 2011 catastrophic events.
At December 31, 2011, the capital funds totaled $6.9 billion, or 38% of Company’s total invested assets,and were generally comprised of the assets listed above, with 45% invested in investment grade fixed incomesecurities.
The Company’s investment strategy allows for the use of derivative instruments, subject to strict limitations.The Company utilizes various derivative instruments such as treasury note and equity futures contracts, creditdefault swaps, foreign currency option contracts, foreign exchange forward contracts, total return and interestrate swaps, insurance-linked securities and to-be-announced mortgage-backed securities (TBAs) for the purposeof managing and hedging currency risk, market exposure and portfolio duration, hedging certain investments,mitigating the risk associated with underwriting operations, or enhancing investment performance that would beallowed under the Company’s investment policy if implemented in other ways. The use of financial leverage,whether achieved through derivatives or margin borrowing, requires approval from the Risk and FinanceCommittee of the Board.
109

Overview
Total investments and cash were $16.6 billion at December 31, 2011 compared to $16.4 billion atDecember 31, 2010. The major factors influencing the increase during 2011 were:
• net cash provided by operating activities of $574 million;
• net proceeds of $362 million, after underwriting discounts, commissions and other related expenses of$12 million, related to the issuance of the Series E preferred shares (see Note 12 to the ConsolidatedFinancial Statements included in Item 8 of Part II of this report and Contractual Obligations andCommitments and Shareholders’ Equity and Capital Resources Management below); and
• realized and unrealized gains related to the investment portfolio of $56 million primarily resulting froman increase in the fixed maturity and short-term investment portfolios of $285 million, reflecting lowerU.S. and European risk-free interest rates, which were partially offset by widening credit spreads.These realized and unrealized gains were reduced by decreases in other invested assets and the equityportfolio of $233 million, primarily driven by realized losses on treasury note futures (see discussionrelated to duration below); partially offset by
• repurchases of the Company’s common shares of $396 million;
• dividend payments on common and preferred shares totaling $206 million; and
• various factors, the primary one being the effect of a stronger U.S. dollar at December 31, 2011 relativeto most major currencies, resulting in the conversion of non-U.S. dollar invested assets into U.S.dollars at lower exchange rates, amounting to approximately $169 million.
Trading securities
The Company has elected the fair value option for substantially all of its invested assets, including all ofParis Re’s fixed maturities, short-term investments and other invested assets. The market value of fixedmaturities, short-term investments and equities classified as trading securities (excluding funds held – directlymanaged) was $14.9 billion at December 31, 2011 compared to $13.9 billion at December 31, 2010. Tradingsecurities are carried at fair value with changes in fair value included in net realized and unrealized investmentgains and losses in the Consolidated Statements of Operations. In addition, the market value of the Company’sother invested assets was $358 million at December 31, 2011 compared to $352 million at December 31, 2010.The Company’s other invested assets and the investments underlying the funds held – directly managed accountare discussed separately below.
At December 31, 2011, approximately 93% of the Company’s fixed income and short-term investments,which includes fixed income type mutual funds, were rated investment grade (BBB- or higher) by Standard &Poor’s (or estimated equivalent) and 94% were publicly traded. The average credit quality of the Company’sfixed income and short-term investments at December 31, 2011 was AA, comparable to the position atDecember 31, 2010. The average credit quality at December 31, 2011 reflects the impact of Standard & Poor’sdecision in August 2011 to downgrade U.S. government securities and other securities that carry either anexplicit or implicit guarantee of the U.S. government from AAA to AA+ (the downgrade of U.S. governmentsecurities). While other ratings agencies did not take a similar rating action, it is the Company’s policy to useStandard & Poor’s ratings, when available, to rate its investments. The Company does not believe that thedowngrade of U.S. government securities increased the risk level of its investment portfolio, with U.S. treasuriesstill generally considered to be a proxy for a risk-free investment.
On January 13, 2012, Standard & Poor’s announced credit downgrades of nine European sovereigngovernments (the Eurozone downgrade). The Eurozone downgrade did not have a significant impact on theCompany’s investment portfolio with the average credit quality remaining at AA, comparable to the position atDecember 31, 2011. While other rating agencies did not take similar action, it is the Company’s policy to useStandard & Poor’s ratings, when available, to rate its investments. See Ratings Distribution below for furtherdiscussion of the impact of the Eurozone downgrade.
110

The average duration of the Company’s investment portfolio was 2.9 years at December 31, 2011,comparable to 3.0 years at December 31, 2010. For the purposes of managing portfolio duration, the Companyuses exchange traded treasury note futures. The use of treasury note futures reduced the duration of itsinvestment portfolio from 3.5 years to 2.9 years at December 31, 2011, and reflects the Company’s decision tohedge against risk-free interest rates potentially rising.
The average yield to maturity on fixed maturities, short-term investments and cash and cash equivalents was2.4% at December 31, 2011, compared to 2.9% at December 31, 2010. The decrease in the average yield tomaturity at December 31, 2011 compared to December 31, 2010 reflects declining U.S. and European risk-freerates, which were partially offset by widening credit spreads.
The Company’s investment portfolio generated a positive total accounting return (calculated based on thecarrying value of all investments in local currency) of 4.2% and 6.4% for years ended December 31, 2011 and2010, respectively. The lower total accounting return in the year ended December 31, 2011 was mainly due to arelatively lower level of risk-free rates compared to 2010, and relatively flat equity markets in 2011 compared toimproving worldwide equity markets in 2010.
The cost, gross unrealized gains, gross unrealized losses and fair value of fixed maturities, short-terminvestments and equities classified as trading at December 31, 2011 and 2010 were as follows (in millions ofU.S. dollars):
December 31, 2011 Cost(1)
GrossUnrealized
Gains
GrossUnrealized
LossesFair
Value
Fixed maturitiesU.S. government and government sponsored enterprises . . . . . . $ 1,085 $ 31 $ — $ 1,116U.S. states, territories and municipalities . . . . . . . . . . . . . . . . . . 118 6 — 124Non-U.S. sovereign government, supranational and government
related . . . . . . . . . . . . . . . . . . . . . . . . . . . . . . . . . . . . . . . . . . . 2,807 159 (2) 2,964Corporate . . . . . . . . . . . . . . . . . . . . . . . . . . . . . . . . . . . . . . . . . . . 5,461 319 (33) 5,747Asset-backed securities . . . . . . . . . . . . . . . . . . . . . . . . . . . . . . . . 626 12 (4) 634Residential mortgage-backed securities . . . . . . . . . . . . . . . . . . . 3,225 95 (37) 3,283Other mortgage-backed securities . . . . . . . . . . . . . . . . . . . . . . . . 72 3 (1) 74
Total fixed maturities . . . . . . . . . . . . . . . . . . . . . . . . . . . . . . . . . . . . . 13,394 625 (77) 13,942Short-term investments . . . . . . . . . . . . . . . . . . . . . . . . . . . . . . . . . . . . 42 — — 42Equities . . . . . . . . . . . . . . . . . . . . . . . . . . . . . . . . . . . . . . . . . . . . . . . . 918 99 (72) 945
Total . . . . . . . . . . . . . . . . . . . . . . . . . . . . . . . . . . . . . . . . . . . . . . . . . . . $14,354 $ 724 $ (149) $14,929
111

December 31, 2010 Cost(1)
GrossUnrealized
Gains
GrossUnrealized
LossesFair
Value
Fixed maturitiesU.S. government and government sponsored enterprises . . . . . . $ 896 $ 16 $ (6) $ 906U.S. states, territories and municipalities . . . . . . . . . . . . . . . . . . 67 — — 67Non-U.S. sovereign government, supranational and government
related . . . . . . . . . . . . . . . . . . . . . . . . . . . . . . . . . . . . . . . . . . . 2,744 83 (8) 2,819Corporate . . . . . . . . . . . . . . . . . . . . . . . . . . . . . . . . . . . . . . . . . . . 5,876 287 (19) 6,144Asset-backed securities . . . . . . . . . . . . . . . . . . . . . . . . . . . . . . . . 554 12 (9) 557Residential mortgage-backed securities . . . . . . . . . . . . . . . . . . . 2,228 93 (15) 2,306Other mortgage-backed securities . . . . . . . . . . . . . . . . . . . . . . . . 30 1 (5) 26
Total fixed maturities . . . . . . . . . . . . . . . . . . . . . . . . . . . . . . . . . . . . . 12,395 492 (62) 12,825Short-term investments . . . . . . . . . . . . . . . . . . . . . . . . . . . . . . . . . . . . 49 — — 49Equities . . . . . . . . . . . . . . . . . . . . . . . . . . . . . . . . . . . . . . . . . . . . . . . . 943 147 (18) 1,072
Total . . . . . . . . . . . . . . . . . . . . . . . . . . . . . . . . . . . . . . . . . . . . . . . . . . . $13,387 $ 639 $ (80) $13,946
(1) Cost is amortized cost for fixed maturities and short-term investments and cost for equity securities. Forinvestments acquired from Paris Re, cost is based on the fair value at the date of acquisition andsubsequently adjusted for amortization of fixed maturities and short-term investments.
The fair value of the Company’s fixed maturities increased by $1.1 billion from $12.8 billion atDecember 31, 2010 to $13.9 billion at December 31, 2011. The increase in the Company’s fixed maturities ispredominantly in the residential mortgage-backed securities and U.S. government and government sponsoredenterprises categories, which have increased by $977 million and $210 million, respectively, at December 31,2011 compared to December 31, 2010. The increases primarily reflect the reallocation of a portion of theCompany’s cash and cash equivalents to the investment portfolio. In addition, the increase in residentialmortgage-backed securities, and the corresponding decrease in corporate securities, at December 31, 2011compared to December 31, 2010, reflects a rebalancing of the portfolio and an increased allocation to residentialmortgage-backed securities given they provide a higher return than U.S. treasuries, while still being backed byU.S. government agencies.
The U.S. government and government sponsored enterprises category includes U.S. treasuries and U.S.government agency securities which accounted for 98% and 2%, respectively, of this category at December 31,2011. The U.S. treasuries are not rated, however, they are generally considered to have a credit quality equivalentto or greater than AA+ corporate issues. At December 31, 2011, 68% of U.S. government agency securities,although not specifically rated, are generally considered to have a credit quality equivalent to AA+ corporateissues. The remaining 32% of U.S. government agency securities at December 31, 2011 were rated AA.
The U.S. states, territories and municipalities category includes obligations of U.S. states, territories, orcounties. At December 31, 2011, 10% of securities in this category were rated investment grade (BBB- or higher)by Standard & Poor’s (or estimated equivalent), with the remaining 90% not rated.
The non-U.S. sovereign government, supranational and government related category includes obligations ofnon-U.S. sovereign governments, political subdivisions, agencies and supranational debt. At December 31, 2011,82%, 15% and 3% of this category was rated AAA, AA and A, respectively. Non-U.S. sovereign governmentobligations comprised 85% of this category, of which 91% were rated AAA. The largest three issuers (Germany,Canada and France) accounted for 81% of non-U.S. sovereign government obligations at December 31, 2011,with the next four largest issuers (Belgium, Singapore, Austria and the Netherlands) accounting for 18% of theremaining 19% of non-U.S. sovereign government obligations. At December 31, 2011, the remaining 15% of thiscategory was comprised of investment grade Canadian government related obligations, non-U.S. governmentagency obligations (related to France, Canada and South Korea) and non-U.S. government supranational debt
112

representing 11%, 3% and 1% of the total, respectively. If the Eurozone downgrade had occurred atDecember 31, 2011, the impact on the non-U.S. sovereign government, supranational and government relatedcategory would have been to decrease the AAA credit quality of this category from 82% to 58%, with acorresponding increase in AA credit quality from 15% to 39%.
At December 31, 2011, the Company did not have any investments in securities issued by peripheralEuropean Union (EU) sovereign governments (Portugal, Italy, Ireland, Greece and Spain). At December 31,2011, the Company had investments of $1.8 billion in other EU sovereign governments (including $7 million ofinvestments in the short-term investments category), comprised of $879 million, $579 million, $194 million, $79million and $54 million of German, French, Belgian, Austrian and Dutch sovereign government obligations,respectively, with no other EU sovereign government issuer comprising more than $15 million, less than 1% ofthe Company’s total EU sovereign government obligations. In addition to its EU sovereign government exposure,the Company also held $61 million of debt issued by French government agencies.
Corporate bonds are comprised of obligations of U.S. and foreign corporations. At December 31, 2011, 95%of these investments were rated investment grade (BBB- or higher) by Standard & Poor’s (or estimatedequivalent), while 67% were rated A- or better. At December 31, 2011, the ten largest issuers accounted for 17%of the corporate bonds held by the Company (6% of total investments and cash) and no single issuer accountedfor more than 3% of total corporate bonds (1% of total investments and cash). At December 31, 2011, U.S. bondscomprised 63% of this category and no other country accounted for more than 8% of this category. The mainexposures by economic sector were 23% in finance (11% were banks), 14% in consumer noncyclical and 10% ineach of communications and utilities. Within the finance sector, 99% of corporate bonds were rated investmentgrade and 85% were rated A- or better at December 31, 2011.
At December 31, 2011, the Company’s corporate bond portfolio included $393 million of Europeangovernment guaranteed corporate debt, comprised of $261 million, $79 million, $47 million and $6 millioncorporate bonds guaranteed by the Dutch, German, Austrian and Danish governments, respectively. AtDecember 31, 2011, the Company did not hold any government guaranteed corporate debt issued in peripheralEU countries (Portugal, Italy, Ireland, Greece and Spain).
At December 31, 2011, the Company’s corporate bond portfolio (excluding government guaranteedcorporate debt) includes $1.3 billion of corporate bonds issued by companies in the finance sector. Includedwithin this were $127 million of corporate bonds issued by companies in the EU finance sector, comprised of $56million, $14 million, $13 million, $12 million and $8 million of British, French, Danish, Dutch and Germanfinance sector corporate bonds, respectively. Of the remaining EU finance sector corporate bonds, no singlecountry accounts for more than 1% of the Company’s total finance sector corporate bond exposure. AtDecember 31, 2011, the Company held less than $23 million in total of finance sector corporate bonds issued bycompanies in peripheral EU countries (Portugal, Italy, Ireland, Greece and Spain).
The asset-backed securities category includes U.S. asset-backed securities, which accounted for 70% atDecember 31, 2011. Of the U.S. asset-backed securities, 35% were rated investment grade (BBB- or higher) byStandard & Poor’s (or estimated equivalent) and 65% were not rated. Non-U.S. asset-backed securities accountedfor the remainder of this category, all of which were rated A- or higher by Standard & Poor’s (or estimatedequivalent).
Residential mortgage-backed securities includes U.S. residential mortgage-backed securities, whichaccounted for 93% of this category at December 31, 2011. These securities generally have a low risk of defaultand 97% of the U.S. residential mortgage-backed securities are backed by U.S. government agencies, which setstandards on the mortgages before accepting them into the program. Although these U.S. government backedagency securities do not carry a formal rating, they are generally considered to have a credit quality equivalent toor greater than AA+ corporate issues. They are considered prime mortgages and the major risk is uncertainty ofthe timing of prepayments. While there have been market concerns regarding sub-prime mortgages, the Company
113

did not have direct exposure to these types of securities in its own portfolio at December 31, 2011, other than $22million of investments in distressed asset vehicles (included in other invested assets). At December 31, 2011, theCompany’s U.S. residential mortgage-backed securities included approximately $212 million (7% of U.S.residential mortgage-backed securities) of collateralized mortgage obligations, where the Company deemed theentry point and price of the investment to be attractive. At December 31, 2011, the remaining 7% of this categorywas comprised of non-U.S. residential mortgage-backed securities, of which 86% were rated AAA andsubstantially all (more than 99%) were rated investment grade (BBB- or higher) by Standard & Poor’s (orestimated equivalent).
Other mortgaged-backed securities includes U.S. commercial mortgage-backed securities and non-U.S.commercial mortgage backed securities, which accounted for 79% and 21% of this category at December 31,2011, respectively. Approximately 97% of this category was rated investment grade (BBB- or higher) byStandard & Poor’s (or estimated equivalent).
Short-term investments consisted of non-U.S. sovereign government obligations, U.S. treasuries and U.S.corporate bonds which accounted for 70%, 19% and 11%, respectively, of this category at December 31, 2011.The non-U.S. sovereign government obligations were primarily related to Canada, France, and Singapore andwere rated AAA. At December 31, 2011, the U.S. treasuries held were rated AA+ and the U.S. corporate bondswere rated investment grade (BBB- or higher) by Standard & Poor’s (or estimated equivalent).
Publicly traded common stocks (including public exchange traded funds (ETFs)) comprised 73% of equitiesat December 31, 2011. The remaining 27% of this category consisted primarily of funds holding fixed incomesecurities, of which 97% (or $237 million) was comprised of emerging markets funds. Of the publicly tradedcommon stocks and ETFs, U.S. issuers represented 82% at December 31, 2011. At December 31, 2011, the tenlargest common stocks accounted for 17% of equities (excluding equities held in ETFs and funds holding fixedincome securities) and no single common stock issuer accounted for more than 3% of total equities (excludingequities held in ETFs and funds holding fixed income securities) or more than 1% of the Company’s totalinvestments and cash. At December 31, 2011, the largest publicly traded common stock exposures by economicsector were 19% in consumer noncyclical, 13% in energy, 12% in finance, 11% in technology and 10% incommunications. At December 31, 2011, the Company did not have any exposure to equities issued by financesector institutions based in the peripheral EU countries (Portugal, Italy, Ireland, Greece and Spain).
Maturity Distribution
The distribution of fixed maturities and short-term investments at December 31, 2011, by contractualmaturity date, is shown below (in millions of U.S. dollars). Actual maturities may differ from contractualmaturities because certain borrowers have the right to call or prepay certain obligations with or without call orprepayment penalties.
December 31, 2011 CostFair
Value
One year or less . . . . . . . . . . . . . . . . . . . . . . . . . . . . . . . . . . . $ 566 $ 571More than one year through five years . . . . . . . . . . . . . . . . . 4,793 4,923More than five years through ten years . . . . . . . . . . . . . . . . . 3,472 3,713More than ten years . . . . . . . . . . . . . . . . . . . . . . . . . . . . . . . . 682 786
Subtotal . . . . . . . . . . . . . . . . . . . . . . . . . . . . . . . . . . . . . . . . . 9,513 9,993Mortgage/asset-backed securities . . . . . . . . . . . . . . . . . . . . . 3,923 3,991
Total . . . . . . . . . . . . . . . . . . . . . . . . . . . . . . . . . . . . . . . . . . . $13,436 $13,984
114

Ratings Distribution
The following table provides a breakdown of the credit quality of the Company’s fixed maturities and short-term investments at December 31, 2011:
Rating Category % of total
AAA . . . . . . . . . . . . . . . . . . . . . . . . . . . . . . . . . . . . . . . . . . . . . 25%AA . . . . . . . . . . . . . . . . . . . . . . . . . . . . . . . . . . . . . . . . . . . . . . 37A . . . . . . . . . . . . . . . . . . . . . . . . . . . . . . . . . . . . . . . . . . . . . . . 21BBB . . . . . . . . . . . . . . . . . . . . . . . . . . . . . . . . . . . . . . . . . . . . . 11Below investment grade/Unrated . . . . . . . . . . . . . . . . . . . . . . 6
Total . . . . . . . . . . . . . . . . . . . . . . . . . . . . . . . . . . . . . . . . . . . . . 100%
The decrease in the Company’s AAA rated securities, as a percentage of its total fixed income and short-term investments portfolio, from 51% at December 31, 2010 to 25% at December 31, 2011, and thecorresponding increase in AA rated securities from 9% at December 31, 2010 to 37% at December 31, 2011,largely reflects the downgrade of U.S. government securities in August 2011, as discussed above. The overallaverage credit quality of the Company’s fixed income and short-term investments portfolio at December 31,2011 and 2010 was AA.
If the Eurozone downgrade had occurred at December 31, 2011, the impact on the credit quality of theCompany’s investment portfolio would have been to decrease the AAA credit quality from 25% to 20%, andincrease the AA credit quality from 37% to 42%. The overall average credit quality of the Company’s investmentportfolio at December 31, 2011 would have remained at AA.
Other Invested Assets
At December 31, 2011, the Company’s other invested assets totaled $358 million. The Company’s otherinvested assets consisted primarily of investments in asset-backed securities, non-publicly traded companies,notes receivable, loans receivable, private placement equity and bond investments, and other specialty assetclasses. These assets, together with the Company’s derivative financial instruments that were in a net unrealizedgain or loss position at December 31, 2011, are reported within other invested assets in the Company’sConsolidated Balance Sheets.
At December 31, 2011, the Company’s principal finance activities included $168 million of investmentsclassified as other invested assets, which were comprised primarily of asset-backed securities, notes receivable,loans receivable, total return, interest rate and credit default swaps (which are accounted for as derivativefinancial instruments), and private placement equity investments. At December 31, 2011, the carrying value ofthe Company’s investment in asset-backed securities, notes receivable, loans receivable and private placementequity investments was $100 million, $46 million, $21 million and $3 million, respectively, and were partiallyoffset by the combined fair value of total return, interest rate and credit default swaps which was an unrealizedloss of $2 million.
For total return swaps within the principal finance portfolio, the Company uses internal valuation models toestimate the fair value of these derivatives and develops assumptions that require significant judgment, such asthe timing of future cash flows, credit spreads and the general level of interest rates. For interest rate swaps, theCompany uses externally modeled quoted prices that use observable market inputs. At December 31, 2011, thefair value of the Company’s assumed exposure in the form of total return swaps and interest rate swaps was anunrealized gain of $7 million and an unrealized loss of $8 million, respectively. At December 31, 2011, thenotional value of the Company’s assumed exposure in the form of total return swaps was $116 million.
115

At December 31, 2011, 59% of the Company’s principal finance total return and interest rate swap portfoliowas related to tax advantaged real estate income, 38% was related to apparel and retail future flow income orintellectual property backed transactions, for which the underlying investments were rated investment grade, andthe remainder of the portfolio was distributed over a number of generally unrelated risks.
For credit default swaps within the principal finance portfolio, the Company uses externally modeled quotedprices that use observable market inputs to estimate the fair value. At December 31, 2011, the fair value of theCompany’s assumed exposure in the form of credit default swaps was insignificant and the notional value was$13 million.
The Company continues to utilize credit default swaps to mitigate the risk associated with certain of itsunderwriting obligations, most notably in the credit/surety line, to replicate investment positions or to managemarket exposures and to reduce the credit risk for specific fixed maturities in its investment portfolio. Thecounterparties to the Company’s credit default swaps are all highly rated financial institutions, rated A- or betterby Standard & Poor’s at December 31, 2011. The Company uses externally modeled quoted prices that useobservable market inputs to estimate the fair value of these swaps. Excluding the credit default swaps within theprincipal finance portfolio described above, the fair value of these credit default swaps was insignificant atDecember 31, 2011, and the notional value was comprised of $95 million of credit protection purchased and $5million of credit exposure assumed.
The Company has entered into various weather derivatives and longevity total return swaps for which theunderlying risks reference parametric weather risks and longevity risks, respectively. The Company uses internalvaluation models to estimate the fair value of these derivatives and develops assumptions that require significantjudgment, except for exchange traded weather derivatives. In determining the fair value of exchange tradedweather derivatives, the Company uses quoted market prices. At December 31, 2011, the combined fair values ofthe weather derivatives and the longevity total return swaps was insignificant, while their combined notionalvalues were $136 million.
The Company has entered into certain indexed commodity futures contracts (which are accounted for asderivative financial instruments). The Company uses indexed commodity futures to hedge certain investmentsand to replicate the investment return on certain benchmarked commodities. The counterparties to theCompany’s indexed commodity futures contracts are all highly rated financial institutions, rated A- or better byStandard & Poor’s at December 31, 2011. The Company uses quoted market prices to estimate the fair value ofthese contracts. The fair value and the notional value of the indexed commodity futures contracts was anunrealized loss of $2 million and $48 million, respectively, at December 31, 2011.
The Company uses exchange traded treasury note futures for the purposes of managing portfolio duration.The Company also uses equity futures to replicate equity investment positions. At December 31, 2011, the fairvalues of the treasury note and equity futures were insignificant, while the notional values were a net shortposition of $2,486 million and insignificant, respectively.
The Company utilizes foreign exchange forward contracts and foreign currency option contracts as part ofits overall currency risk management and investment strategies. At December 31, 2011, the combined fair valueof foreign exchange forward contracts and foreign currency option contracts was an unrealized gain of $3million. The Company utilizes TBAs as part of its overall investment strategy and to enhance investmentperformance. TBAs represent commitments to purchase future issuances of U.S. government agency mortgage-backed securities. For the period between purchase of a TBA and issuance of the underlying security, theCompany’s position is accounted for as a derivative. The Company’s policy is to maintain designated cashbalances at least equal to the amount of outstanding TBA purchases. At December 31, 2011, the fair value ofTBAs was insignificant and the notional value was $104 million.
116

At December 31, 2011, the Company’s strategic investments of $197 million (of which $179 million wereincluded in other invested assets) includes investments in non-publicly traded companies, private placementequity and bond investments and other specialty asset classes, including the investments in distressed assetvehicles comprised of sub-prime mortgages, which were discussed above in the residential mortgaged-backedsecurities category of Investments—Trading Securities.
At December 31, 2011, the Company’s other invested assets did not include any exposure to peripheral EUcountries (Portugal, Italy, Ireland, Greece and Spain) and included direct exposure to mutual fund investments inother EU countries of less than $8 million. The counterparties to the Company’s credit default swaps, foreignexchange forward contracts and foreign currency option contracts include British, French, and German financesector institutions rated A- or better by Standard & Poor’s and the Company manages its exposure to individualinstitutions. The Company also has exposure to the euro related to the utilization of foreign exchange forwardcontracts and other derivative financial instruments in its hedging strategy (see Quantitative and QualitativeDisclosures About Market Risk—Foreign Currency Risk in Item 7A of Part II of this report).
The Company also had $9 million of other invested assets at December 31, 2011.
Funds Held – Directly Managed
Following Paris Re’s acquisition of substantially all of the reinsurance operations of Colisée Re in 2006,Paris Re and its subsidiaries entered into an issuance agreement and a quota share retrocession agreement toassume business written by Colisée Re from January 1, 2006 to September 30, 2007 as well as the in-forcebusiness as of December 31, 2005. The agreements provided that the premium related to the transferred businesswas retained by Colisée Re and credited to a funds held account. The assets underlying the funds held – directlymanaged account are predominantly maintained by Colisée Re in a segregated investment portfolio which isdirectly managed by the Company. During the year ended December 31, 2011, the Company and Colisée Reentered into an endorsement to the quota share retrocession agreement (the Endorsement) which resulted in arelease of assets of approximately $358 million from the funds held – directly managed account to PartnerReEurope. The composition of the investments underlying the funds held – directly managed account atDecember 31, 2011 is discussed below. See the discussion in Counterparty Credit Risk in Item 7A of Part II ofthis report.
Substantially all of the investments in the segregated investment portfolio underlying the funds held –directly managed account are carried at fair value. Realized and unrealized investment gains and losses and netinvestment income related to this account inure to the benefit of the Company. The Company elected the fairvalue option as of the Acquisition Date of Paris Re for all of the fixed maturities, short-term investments andcertain other invested assets in the segregated investment portfolio underlying this account, and accordingly, allchanges in its fair value subsequent to the Acquisition Date are recorded in net realized and unrealizedinvestment gains and losses in the Consolidated Statements of Operations.
At December 31, 2011, approximately 98% of the fixed income and short-term investments underlying thefunds held – directly managed account were publicly traded and all were rated investment grade (BBB- orhigher) by Standard & Poor’s (or estimated equivalent). The average credit quality of the fixed income and short-term investments underlying the funds held – directly managed account was AA at December 31, 2011 and 2010.The average credit quality reflects the impact of Standard & Poor’s decision in August 2011 related to thedowngrade of U.S. government securities, as described above. The Eurozone downgrade did not have asignificant impact on the investments underlying the funds held – directly managed account, with the overallaverage credit quality remaining at AA, comparable to the position at December 31, 2011.
The average duration of the investments underlying the funds held – directly managed account was 2.7 yearsat December 31, 2011, compared to 3.1 years at December 31, 2010. The average yield to maturity on fixedmaturities, short-term investments and cash and cash equivalents underlying the funds held – directly managed
117

account decreased to 1.7% at December 31, 2011 from 2.4% at December 31, 2010 primarily due to the sale andmaturity of higher yielding investments, which were used to finance the release of assets pursuant to theEndorsement and to pay losses related to the run-off of the underlying reserves.
The cost, gross unrealized gains, gross unrealized losses and fair value of the investments underlying thefunds held – directly managed account at December 31, 2011 and 2010 were as follows (in millions of U.S.dollars):
December 31, 2011 Cost(1)
GrossUnrealized
Gains
GrossUnrealized
LossesFair
Value
Fixed maturitiesU.S. government and government sponsored enterprises . . . . . . . . $ 256 $ 13 $ — $ 269Non-U.S. sovereign government, supranational and government
related . . . . . . . . . . . . . . . . . . . . . . . . . . . . . . . . . . . . . . . . . . . . . 261 14 — 275Corporate . . . . . . . . . . . . . . . . . . . . . . . . . . . . . . . . . . . . . . . . . . . . . 470 13 (3) 480
Total fixed maturities . . . . . . . . . . . . . . . . . . . . . . . . . . . . . . . . . . . . . . . 987 40 (3) 1,024Short-term investments . . . . . . . . . . . . . . . . . . . . . . . . . . . . . . . . . . . . . . 18 — — 18Other invested assets . . . . . . . . . . . . . . . . . . . . . . . . . . . . . . . . . . . . . . . . 26 — (10) 16
Total . . . . . . . . . . . . . . . . . . . . . . . . . . . . . . . . . . . . . . . . . . . . . . . . . . . . . $1,031 $ 40 $ (13) $1,058
December 31, 2010 Cost(1)
GrossUnrealized
Gains
GrossUnrealized
LossesFair
Value
Fixed maturitiesU.S. government and government sponsored enterprises . . . . . . . . $ 281 $ 8 $ (1) $ 288Non-U.S. sovereign government, supranational and government
related . . . . . . . . . . . . . . . . . . . . . . . . . . . . . . . . . . . . . . . . . . . . . 378 7 — 385Corporate . . . . . . . . . . . . . . . . . . . . . . . . . . . . . . . . . . . . . . . . . . . . . 788 14 (3) 799Mortgage/asset-backed securities . . . . . . . . . . . . . . . . . . . . . . . . . . 12 2 (2) 12
Total fixed maturities . . . . . . . . . . . . . . . . . . . . . . . . . . . . . . . . . . . . . . . 1,459 31 (6) 1,484Short-term investments . . . . . . . . . . . . . . . . . . . . . . . . . . . . . . . . . . . . . . 38 — — 38Other invested assets . . . . . . . . . . . . . . . . . . . . . . . . . . . . . . . . . . . . . . . . 25 — (4) 21
Total . . . . . . . . . . . . . . . . . . . . . . . . . . . . . . . . . . . . . . . . . . . . . . . . . . . . . $1,522 $ 31 $ (10) $1,543
(1) Cost is based on the fair value at the date of the acquisition of Paris Re and subsequently adjusted foramortization of fixed maturities and short-term investments.
The decrease in the fair value of the investments underlying the funds held – directly managed account of$485 million, from $1,543 million at December 31, 2010 to $1,058 million at December 31, 2011 is primarilyrelated to the release of assets of approximately $358 million from the funds held – directly managed account toPartnerRe Europe pursuant to the Endorsement and is also due to the sale and maturity of investments to paylosses related to the run-off of the underlying reserves. The release of assets and the sale and maturity ofinvestments to pay losses primarily resulted in a decrease in corporate securities, and to a lesser extent, non-U.S.sovereign government, supranational and government related.
In addition to the investments in the above table at December 31, 2011, the funds held – directly managedaccount included cash and cash equivalents of $176 million, other assets and liabilities of $20 million andaccrued investment income of $14 million. The other assets and liabilities represent working capital assets heldby Colisée Re related to the underlying business. The discussion below focuses on the investments underlying thefunds held – directly managed account.
118

The U.S. government and government sponsored enterprises category underlying the funds held – directlymanaged account is comprised of U.S. government agency securities and U.S. treasuries which accounted for59% and 41% of this category at December 31, 2011, respectively. With the exception of investments totaling$118 million in U.S. government agency securities, which were rated AA, the remaining U.S. governmentagency securities and all of the U.S. treasuries, although not specifically rated, are generally considered to have acredit quality equivalent to or greater than AA+ corporate issues.
Non-U.S. sovereign government, supranational and government related category includes obligations ofnon-U.S. sovereign governments, agencies, political subdivisions and supranational debt. Canadian governmentrelated obligations comprised 56% of this category, with investment grade non-U.S. government agencyobligations, non-U.S. sovereign government obligations, and supranational debt accounting for the remaining19%, 18% and 7%, respectively. Within the non-U.S. government agency obligations category, 99% related toFrance, Canada and Austria, and within the non-U.S. sovereign government obligations category, 92% related toFrance, Austria, Belgium and Germany. At December 31, 2011, 48%, 31% and 21% of this category were ratedAAA, AA and A, respectively, by Standard & Poor’s (or estimated equivalent). If the Eurozone downgrade hadoccurred at December 31, 2011, the impact on the non-U.S. sovereign government, supranational andgovernment related category would have been to decrease the AAA credit quality of this category from 48% to25% with a corresponding increase in the AA credit quality from 31% to 54%.
At December 31, 2011, the investments underlying the funds held – directly managed account included lessthan $1 million of securities issued by peripheral European Union (EU) sovereign governments (Portugal, Italy,Ireland, Greece and Spain). At December 31, 2011, the investments underlying the funds held – directly managedaccount included $49 million of investments in other EU sovereign governments, comprised of $21 million, $10million, $8 million and $6 million of French, Austrian, Belgian and German sovereign government obligations,respectively, with no other EU sovereign government issuer comprising more than $2 million, or 4% of the totalEU sovereign government obligations underlying the funds held – directly managed account. In addition to itsEU sovereign government obligations, the Company also held $34 million of debt issued by French and Austriangovernment agencies.
Corporate bonds underlying the funds held – directly managed account are comprised of obligations of U.S.and foreign corporations. At December 31, 2011, all of these investments were rated investment grade (BBB- orhigher) by Standard & Poor’s (or estimated equivalent), while 90% were rated A- or better. At December 31,2011, the ten largest issuers accounted for 23% of the corporate bonds underlying the funds held – directlymanaged account and no single issuer accounted for more than 4% of corporate bonds underlying the funds held– directly managed account (or more than 2% of the investments and cash underlying the funds held – directlymanaged account). At December 31, 2011, U.S. and French bonds comprised 43% and 16%, respectively, of thiscategory and no other country accounted for more than 10% of this category. The main exposures of thiscategory by economic sector were 48% in finance (26% were banks) and 15% in consumer noncyclical. AtDecember 31, 2011, all of the finance sector corporate bonds held were rated investment grade (BBB- or higher)by Standard & Poor’s (or estimated equivalent) and 95% were rated A- or better.
At December 31, 2011, corporate bonds underlying the funds held – directly managed account included $15million of European corporate debt guaranteed by the German, British, Dutch and Swedish governments. AtDecember 31, 2011, the corporate bond portfolio underlying the funds held – directly managed account did nothave any exposure to government guaranteed debt issued by companies in peripheral EU countries (Portugal,Italy, Ireland, Greece and Spain).
At December 31, 2011, corporate bonds underlying the funds held – directly managed account (excludinggovernment guaranteed corporate debt) included $129 million of corporate bonds issued by companies in the EUfinance sector, including $63 million, $19 million and $15 million of French, Dutch and British finance sectorcorporate bonds, respectively. Of the remaining EU finance sector corporate bonds, no single country accountedfor more than $11 million, or 5% of total finance sector corporate bonds underlying the funds held – directly
119

managed account. At December 31, 2011, corporate bonds underlying the funds held – directly managed accountincluded less than $26 million in total of finance sector corporate bonds issued by companies in peripheral EUcountries (Portugal, Italy, Ireland, Greece and Spain).
Short-term investments underlying the funds held – directly managed account, are comprised of Canadiangovernment and Canadian government related obligations which were rated AA- or higher by Standard & Poor’s(or estimated equivalent) at December 31, 2011.
Other invested assets underlying the funds held – directly managed account consist primarily of real estatefund investments.
Maturity Distribution
The distribution of fixed maturities and short-term investments underlying the funds held – directlymanaged account at December 31, 2011, by contractual maturity date, is shown below (in millions of U.S.dollars). Actual maturities may differ from contractual maturities because certain borrowers have the right to callor prepay certain obligations with or without call or prepayment penalties.
FairDecember 31, 2011 Cost Value
One year or less . . . . . . . . . . . . . . . . . . . . . . . . . . . . . . . . . . . . . $ 227 $ 227More than one year through five years . . . . . . . . . . . . . . . . . . . 553 573More than five years through ten years . . . . . . . . . . . . . . . . . . . 200 215More than ten years . . . . . . . . . . . . . . . . . . . . . . . . . . . . . . . . . . 25 27
Total . . . . . . . . . . . . . . . . . . . . . . . . . . . . . . . . . . . . . . . . . . . . . $1,005 $1,042
Ratings Distribution
The following table provides a breakdown of the credit quality of fixed maturities and short-terminvestments underlying the funds held – directly managed account December 31, 2011:
Rating Category % of total
AAA . . . . . . . . . . . . . . . . . . . . . . . . . . . . . . . . . . . . . . . . . . . . . 22%AA . . . . . . . . . . . . . . . . . . . . . . . . . . . . . . . . . . . . . . . . . . . . . . 50A . . . . . . . . . . . . . . . . . . . . . . . . . . . . . . . . . . . . . . . . . . . . . . . 24BBB . . . . . . . . . . . . . . . . . . . . . . . . . . . . . . . . . . . . . . . . . . . . . 4
Total . . . . . . . . . . . . . . . . . . . . . . . . . . . . . . . . . . . . . . . . . . . . . 100%
The decrease in AAA rated fixed maturities and short-term investments underlying the funds held – directlymanaged account, from 45% at December 31, 2010 to 22% at December 31, 2011, and the correspondingincrease in AA rated securities from 27% at December 31, 2010 to 50% at December 31, 2011, largely reflectsthe downgrade of U.S. government securities in August 2011, as described above. The overall average creditquality of the fixed maturities and short-term investments underlying the funds held – directly managed accountat December 31, 2011 and 2010 was AA.
If the Eurozone downgrade had occurred at December 31, 2011, the impact on the credit quality of theinvestment portfolio underlying the funds held – directly managed account would have been to decrease theAAA credit quality from 22% to 16%, and increase the AA credit quality from 50% to 56%. The overall averagecredit quality of the investment portfolio underlying the funds held – directly managed account at December 31,2011 would have remained at AA.
120

European exposures
As discussed in Item I of Part I of this report, the Company conducts its operations in various countries andin a variety of non-U.S. denominated currencies. A significant portion of the Company’s reinsurance business isconducted with cedants in Europe, with the collection of premiums and the payment of claims denominated inthe euro. As described above, the currency composition of the Company’s liability funds generally matches theunderlying net reinsurance liabilities to protect against changes in foreign exchange rates. Accordingly, theCompany’s liability funds that are held to match net reinsurance liabilities that are denominated in the euro,expose the Company’s investment portfolio and the investments underlying the funds held – directly managedaccount to bonds that are denominated in the euro that are issued by European sovereign governments andgovernment agencies, corporate bonds that are issued by companies in Europe (including those that are alsoguaranteed by a European sovereign government) and equities issued by companies in Europe.
As a result of the recent uncertainties related to European sovereign government debt exposures, anduncertainties surrounding Europe in general, the Company implemented additional risk management guidelinesto reduce and mitigate potential risks arising from these exposures in its investment portfolio and in theinvestments underlying the funds held—directly managed account. These guidelines reflect the Company’sresponse to current conditions and the guidelines may change as the dynamics of the underlying conditions anduncertainties change. The Company’s current guidelines include, but are not limited to, the following:
• Since the beginning of 2010 the Company has eliminated substantially all of its investment exposure tobonds issued by European sovereign governments in the peripheral countries (Portugal, Italy, Ireland,Greece and Spain);
• During the second half of 2011, the Company focused its European sovereign government exposure tofive highly-rated countries. These five countries, Germany, France, Netherlands, Belgium, and Austriaare rated AAA, AA+, AAA, AA and AA+ by Standard & Poor’s;
• The Company has rebalanced its investment portfolio’s to underweight its exposure to corporate bondsissued by companies in the European finance sector, with a bias for holding covered corporate bondsissued by companies in Europe that are backed by cash flows generated from an underlying pool ofassets; and
• The Company continues to minimize its equity exposures to companies in the finance sector in theperipheral countries and to hold only insignificant and opportunistic equity positions in Europeancompanies.
The Company’s exposures to European sovereign governments and other European related investment risksare discussed above within each category of the Company’s investment portfolio and the investments underlyingthe funds held – directly managed account. In addition, the Company’s other investment and derivative exposuresto European counterparties are discussed in Other Invested Assets above. See Risk Factors in Item IA of Part I ofthis report for further discussion on the Company’s exposure to the European sovereign debt crisis.
Funds Held by Reinsured Companies (Cedants)
In addition to the funds held – directly managed account described above, the Company writes certainbusiness on a funds held basis. The following discussion excludes the funds held – directly managed account.Under such contractual arrangements, the cedant retains the net funds that would have otherwise been remitted tothe Company and credits the net fund balance with investment income.
As of December 31, 2011 and 2010, the Company recorded $796 million and $937 million, respectively, offunds held assets in its Consolidated Balance Sheets. The decrease in funds held assets at December 31, 2011compared to December 31, 2010 is primarily related to the restructuring of a longevity treaty from a funds heldbasis to a swap basis (see Policy Benefits for Life and Annuity Contracts below).
121

At December 31, 2011, the five largest cedants represented 60% of the funds held balance. Approximately76% of the funds held balance at December 31, 2011 related to contracts that earned investment income basedupon a predetermined interest rate, either fixed contractually at the inception of the contract or based upon arecognized market index (e.g., LIBOR). Interest rates ranged from 2.0% to 5.0% for the year endedDecember 31, 2011. Under these contractual arrangements, there are no specific assets linked to the funds heldassets, and the Company is only exposed to the credit risk of the cedant. These arrangements include three of thefive cedants with the largest funds held assets, which represented 40% of the Company’s total funds heldbalance.
With respect to the remaining 24% of the funds held balance at December 31, 2011, the Company receivesan investment return based upon either the results of a pool of assets held by the cedant, or the investment returnearned by the cedant on its entire investment portfolio. This portion of the Company’s funds held assets atDecember 31, 2011 included two of the five cedants with the largest funds held assets, which represented 20% ofthe Company’s total funds held balance. The Company does not legally own or directly control the investmentsunderlying its funds held assets and only has recourse to the cedant for the receivable balances and no claim tothe underlying securities that support the balances. Decisions as to purchases and sales of assets underlying thefunds held balances are made by the cedant; in some circumstances, investment guidelines regarding theminimum credit quality of the underlying assets may be agreed upon between the cedant and the Company aspart of the reinsurance agreement, or the Company may participate in an investment oversight committeeregarding the investment of the net funds, but investment decisions are not otherwise influenced by theCompany.
Within this portion of the funds held assets, the Company has several annuity treaties which are structuredso that the return on the funds held balances is tied to the performance of an underlying group of assets held bythe cedant, including fluctuations in the market value of the underlying assets. One such treaty is a retrocessionalagreement under which the Company receives more limited data than what is generally received under a directreinsurance agreement. In these arrangements, the objective of the reinsurance agreement is to provide for thecovered longevity risk and to earn a net investment return on an underlying pool of assets greater than iscontractually due to the annuity holders. While the Company is also exposed to the creditworthiness of thecedant, the Company’s credit risk in some jurisdictions is mitigated by a mandatory right of offset of amountspayable by the Company to a cedant against amounts due to the Company. In certain other jurisdictions theCompany is able to mitigate this risk, depending on the nature of the funds held arrangements, to the extent thatthe Company has the contractual ability to offset any shortfall in the payment of the funds held balances withamounts owed by the Company to cedants for losses payable and other amounts contractually due. The Companyalso has non-life treaties in which the investment performance of the net funds held asset corresponds to theinterest income on the assets held by the cedant; however, the Company is not directly exposed to the underlyingcredit risk of these investments, as they serve only as collateral for the Company’s receivables. That is, theamount owed to the Company is unaffected by changes in the market value of the investments underlying thefunds held.
Unpaid Losses and Loss Expenses
The Company establishes loss reserves to cover the estimated liability for the payment of all losses and lossexpenses incurred with respect to premiums earned on the contracts that the Company writes. Loss reserves donot represent an exact calculation of the liability. Estimates of ultimate liabilities are contingent on many futureevents and the eventual outcome of these events may be different from the assumptions underlying the reserveestimates. The Company believes that the recorded unpaid losses and loss expenses represent Management’s bestestimate of the cost to settle the ultimate liabilities based on information available at December 31, 2011.
At December 31, 2011 and 2010, the Company recorded gross Non-life reserves for unpaid losses and lossexpenses of $11,273 million and $10,667 million, respectively, and net Non-life reserves for unpaid losses andloss expenses of $10,920 million and $10,318 million, respectively. See also Business—Reserves in Item 1 of
122

Part I of this report for a reconciliation of the gross and net Non-life reserves for unpaid losses and loss expensesfor the years ended December 31, 2011, 2010 and 2009 and a discussion of the impact of foreign exchange onunpaid losses and loss expenses.
The net Non-life reserves for unpaid losses and loss expenses at December 31, 2011 and 2010 include$1,012 million and $1,239 million of reserves guaranteed by Colisée Re (see Item 1 of Part I and Note 9 toConsolidated Financial Statements included in Item 8 of Part II of this report for a discussion of the ReserveAgreement).
See Critical Accounting Policies and Estimates—Losses and Loss Expenses and Life Policy Benefits andReview of Net Income—Results by Segment above for a discussion of losses and loss expenses, prior years’reserve developments and uncertainties related to the 2011 catastrophic events.
Policy Benefits for Life and Annuity Contracts
At December 31, 2011 and 2010, the Company recorded gross policy benefits for life and annuity contractsof $1,646 million and $1,750 million, respectively, and net policy benefits for life and annuity contracts of$1,636 million and $1,736 million, respectively. See also Business—Reserves in Item 1 of Part I of this report fora reconciliation of the net policy benefits for life and annuity contracts for the years ended December 31, 2011,2010 and 2009.
See Critical Accounting Policies and Estimates—Losses and Loss Expenses and Life Policy Benefits andResults by Segment above for a discussion of life policy benefits and prior years’ reserve developments.
Reinsurance Recoverable on Paid and Unpaid Losses
The Company has exposure to credit risk related to reinsurance recoverable on paid and unpaid losses. SeeNote 10 to Consolidated Financial Statements in Item 8 of Part II of this report and Quantitative and QualitativeDisclosures about Market Risk—Counterparty Credit Risk in Item 7A of Part II of this report for a discussion ofthe Company’s risk related to reinsurance recoverable on paid and unpaid losses and the Company’s process toevaluate the financial condition of its reinsurers.
At December 31, 2011 and 2010, the Company recorded $363 million of reinsurance recoverable on paidand unpaid losses in its Consolidated Balance Sheets. At December 31, 2011, the distribution of the Company’sreinsurance recoverable on paid and unpaid losses categorized by the reinsurer’s Standard & Poor’s rating was asfollows:
Rating Category
% of totalreinsurance
recoverable onpaid and
unpaid losses
AA . . . . . . . . . . . . . . . . . . . . . . . . . . . . . . . . . . . . . . . . . . . 16%A . . . . . . . . . . . . . . . . . . . . . . . . . . . . . . . . . . . . . . . . . . . . 69Less than A/Unrated/Other . . . . . . . . . . . . . . . . . . . . . . . . 14Collateralized . . . . . . . . . . . . . . . . . . . . . . . . . . . . . . . . . . 1
Total . . . . . . . . . . . . . . . . . . . . . . . . . . . . . . . . . . . . . . . . . 100%
At December 31, 2011, 86% of the Company’s reinsurance recoverable on paid and unpaid losses wereeither due from reinsurers with A- or better rating from Standard & Poor’s or from reinsurers with collateralizedbalances.
123

Contractual Obligations and Commitments
In the normal course of its business, the Company is a party to a variety of contractual obligations assummarized below. These contractual obligations are considered by the Company when assessing its liquidityrequirements and the Company is confident in its ability to meet all of its obligations. Contractual obligations atDecember 31, 2011 were as follows (in millions of U.S. dollars):
Total < 1 year 1-3 years 3-5 years > 5 years
Contractual obligations:Operating leases . . . . . . . . . . . . . . . . . . . . . . . . . . . . . 148.4 34.8 52.2 37.6 23.8Other operating agreements . . . . . . . . . . . . . . . . . . . . 16.1 12.8 2.8 0.5 —Other invested assets (1) . . . . . . . . . . . . . . . . . . . . . . . . 157.5 61.2 62.2 34.1 —Unpaid losses and loss expenses (2) . . . . . . . . . . . . . . . 11,273.1 3,736.9 3,082.4 1,510.4 2,943.4Policy benefits for life and annuity contracts (3) . . . . . 2,698.2 292.7 234.5 202.4 1,968.6Deposit liabilities (3) . . . . . . . . . . . . . . . . . . . . . . . . . . 349.2 22.3 45.9 46.2 234.8Employment agreements (4) . . . . . . . . . . . . . . . . . . . . . 16.8 8.3 6.6 1.6 0.3Other long-term liabilities:
Senior Notes-principal (5) . . . . . . . . . . . . . . . . . . 750 — — — 750Senior Notes-interest . . . . . . . . . . . . . . . . . . . . . NA 44.7 89.4 89.4 44.7 per annumCapital Efficient Notes—principal (6) . . . . . . . . . 63.4 — — — 63.4Capital Efficient Notes—interest . . . . . . . . . . . NA 4.1 8.2 8.2 4.1 per annumSeries C cumulative preferred shares—
principal (7) . . . . . . . . . . . . . . . . . . . . . . . . . . . 290 — — — 290Series C cumulative preferred
shares—dividends . . . . . . . . . . . . . . . . . . . . . NA 19.6 39.2 39.2 19.6 per annumSeries D cumulative preferred shares—
principal (7) . . . . . . . . . . . . . . . . . . . . . . . . . . . 230 — — — 230Series D cumulative preferred
shares—dividends . . . . . . . . . . . . . . . . . . . . . N/A 15.0 29.9 29.9 15.0 per annumSeries E cumulative preferred shares—
principal (7) . . . . . . . . . . . . . . . . . . . . . . . . . . . 374 — — — 374Series E cumulative preferred
shares—dividends . . . . . . . . . . . . . . . . . . . . . N/A 27.1 54.2 54.2 27.1 per annum
N/A: not applicable(1) The amounts above for other invested assets represent the Company’s expected timing of funding capital
commitments related to its strategic investments.(2) The Company’s unpaid losses and loss expenses represent Management’s best estimate of the cost to settle
the ultimate liabilities based on information available as of December 31, 2011, and are not fixed amountspayable pursuant to contractual commitments. The timing and amounts of actual loss payments related tothese reserves might vary significantly from the Company’s current estimate of the expected timing andamounts of loss payments based on many factors, including large individual losses as well as generalmarket conditions.
(3) Policy benefits for life and annuity contracts and deposit liabilities recorded in the Company’s ConsolidatedBalance Sheet at December 31, 2011 of $1,646 million and $249 million, respectively, are computed on adiscounted basis, whereas the expected payments by period in the table above are the estimated payments ata future time and do not reflect a discount of the amount payable.
(4) In 2010, as part of the Company’s integration of Paris Re, the Company announced a voluntary terminationplan (voluntary plan) available to certain eligible employees in France. Following their departure from theCompany, employees participating in the voluntary plan will continue to receive pre-determined paymentsrelated to employment benefits, which were accrued for by the Company under the terms of the voluntaryplan during the year ended December 31, 2010. The amounts in the table above reflect the Company’sremaining obligations to the eligible employees under the voluntary plan that will be paid through 2018.
124

(5) PartnerRe Finance A LLC and PartnerRe Finance B LLC, the issuers of the Senior Notes, do not meetconsolidation requirements under U.S. GAAP. Accordingly, the Company shows the related intercompanydebt of $750 million in its Consolidated Balance Sheets at December 31, 2011 and 2010.
(6) PartnerRe Finance II Inc., the issuer of the CENts, does not meet consolidation requirements under U.S.GAAP. Accordingly, the Company shows the related intercompany debt of $71 million in its ConsolidatedBalance Sheets at December 31, 2011 and 2010.
(7) The Company’s Series C, Series D and Series E preferred shares are cumulative, perpetual and have nomandatory redemption requirement, but may be redeemed at our option under certain circumstances. SeeNote 12 to Consolidated Financial Statements in Item 8 of Part II of this report for further information.
The Contractual Obligations and Commitments table above does not include an estimate of the period ofcash settlement of its tax liabilities with the respective taxing authorities given the Company cannot make areasonably reliable estimate of the timing of cash settlements.
Due to the limited nature of the information presented above, it should not be considered indicative of theCompany’s liquidity or capital needs. See Liquidity below.
Shareholders’ Equity and Capital Resources Management
Shareholders’ equity was $6.5 billion at December 31, 2011, a 10% decrease compared to $7.2 billion atDecember 31, 2010. The major factors contributing to the decrease in shareholders’ equity during the year endedDecember 31, 2011 were:
• a net loss of $520 million;
• a net decrease of $358 million, due to the repurchase of common shares of $396 million under theCompany’s share repurchase program, partially offset by the issuance of common shares under theCompany’s employee equity plans of $38 million;
• dividends declared of $206 million related to both the Company’s common and preferred shares; and
• a decrease of $12 million in the currency translation adjustment, resulting primarily from thetranslation of the financial statements of the Company’s foreign subsidiaries and branches into the U.S.dollar; partially offset by
• net proceeds of $362 million, after underwriting discounts, commissions and other related expenses of$12 million, related to the issuance of the Series E preferred shares (see Note 12 to ConsolidatedFinancial Statements in Item 8 of Part II of this report and Contractual Obligations and Commitmentsabove).
See Results of Operations and Review of Net (Loss) Income above for a discussion of the Company’s netloss for the year ended December 31, 2011.
As part of its long-term strategy, the Company will continue to actively manage capital resources to supportits operations throughout the reinsurance cycle and for the benefit of its shareholders, subject to the ability tomaintain strong ratings from the major rating agencies and the unquestioned ability to pay claims as they arise.Generally, the Company seeks to increase its capital when its current capital position is not sufficient to supportthe volume of attractive business opportunities available. Conversely, the Company will seek to reduce itscapital, through the payment of dividends on its common shares or stock repurchases, when available businessopportunities are insufficient or unattractive to fully utilize the Company’s capital at adequate returns. TheCompany may also seek to reduce or restructure its capital through the repayment or purchase of debtobligations, or increase or restructure its capital through the issuance of debt, when opportunities arise.
125

Management uses compound annual growth rate in Diluted Book Value per Share as a prime measure of thevalue the Company is generating for its common shareholders, as Management believes that growth in theCompany’s Diluted Book Value per Share ultimately translates into growth in the Company’s stock price.Diluted Book Value per Share is calculated using common shareholders’ equity (shareholders’ equity less theaggregate liquidation value of preferred shares) divided by the number of fully diluted common shares andcommon share equivalents outstanding (assuming exercise of all stock-based awards and other dilutivesecurities). The Company’s Diluted Book Value per Share decreased by 10% to $84.82 at December 31, 2011from $93.77 at December 31, 2010, primarily due to the comprehensive loss of $537 million. The comprehensiveloss was driven by the net loss of $520 million, resulting primarily from the significant level of catastrophicevents (see Review of Net (Loss) Income) and dividends declared on the Company’s common and preferredshares of $206 million. These decreases were partially offset by the accretive impact of share repurchases during2011. The 5-year and 10-year compound annual growth rates in Diluted Book Value per Share were in excess of8% and 11%, respectively, and are further discussed in Key Financial Measures.
The table below sets forth the capital structure of the Company at December 31, 2011 and 2010 (in millionsof U.S. dollars):
December 31, 2011 December 31, 2010
Capital Structure:Senior notes (1) . . . . . . . . . . . . . . . . . . . . . . . . . . . . . . . . . . . . . . . . . . . . . . . . . $ 750 10% $ 750 9%Capital efficient notes (2) . . . . . . . . . . . . . . . . . . . . . . . . . . . . . . . . . . . . . . . . . 63 1 63 1Preferred shares, aggregate liquidation value . . . . . . . . . . . . . . . . . . . . . . . . 894 12 520 7Common shareholders’ equity . . . . . . . . . . . . . . . . . . . . . . . . . . . . . . . . . . . . 5,574 77 6,687 83
Total Capital . . . . . . . . . . . . . . . . . . . . . . . . . . . . . . . . . . . . . . . . . . . . . . . . . . $ 7,281 100% $ 8,020 100%
(1) PartnerRe Finance A LLC and PartnerRe Finance B LLC, the issuers of the Senior Notes, do not meetconsolidation requirements under U.S. GAAP. Accordingly, the Company shows the related intercompanydebt of $750 million in its Consolidated Balance Sheets at December 31, 2011 and 2010.
(2) PartnerRe Finance II Inc., the issuer of the CENts, does not meet consolidation requirements under U.S.GAAP. Accordingly, the Company shows the related intercompany debt of $71 million in its ConsolidatedBalance Sheets at December 31, 2011 and 2010.
The decrease in total capital during the year ended December 31, 2011 was related to the same factorsdescribing the decrease in shareholders’ equity above.
Indebtedness
Senior Notes
In March 2010, PartnerRe Finance B LLC (PartnerRe Finance B), an indirect wholly-owned subsidiary ofthe Company, issued $500 million aggregate principal amount of 5.500% Senior Notes (2010 Senior Notes, orcollectively with the 2008 Senior Notes defined below referred to as Senior Notes). The 2010 Senior Notes willmature on June 1, 2020 and may be redeemed at the option of the issuer, in whole or in part, at any time. Intereston the 2010 Senior Notes is payable semi-annually and commenced on June 1, 2010 at an annual fixed rate of5.500%, and cannot be deferred.
The 2010 Senior Notes are ranked as senior unsecured obligations of PartnerRe Finance B. The Companyhas fully and unconditionally guaranteed all obligations of PartnerRe Finance B under the 2010 Senior Notes.The Company’s obligations under this guarantee are senior and unsecured and rank equally with all other seniorunsecured indebtedness of the Company.
126

Contemporaneously, PartnerRe U.S. Holdings, a wholly-owned subsidiary of the Company, issued a 5.500%promissory note, with a principal amount of $500 million to PartnerRe Finance B. Under the terms of thepromissory note, PartnerRe U.S. Holdings promises to pay to PartnerRe Finance B the principal amount onJune 1, 2020, unless previously paid. Interest on the promissory note commenced on June 1, 2010 and is payablesemi-annually at an annual fixed rate of 5.500%, and cannot be deferred.
For the years ended December 31, 2011 and 2010, the Company incurred interest expense of $27.5 millionand $21.8 million, respectively, and paid interest of $27.5 million and $19.6 million, respectively, in relation tothe 2010 Senior Notes issued by PartnerRe Finance B.
In May 2008, PartnerRe Finance A LLC (PartnerRe Finance A), an indirect wholly-owned subsidiary of theCompany, issued $250 million aggregate principal amount of 6.875% Senior Notes (2008 Senior Notes, orcollectively with 2010 Senior Notes referred to as Senior Notes). The 2008 Senior Notes will mature on June 1,2018 and may be redeemed at the option of the issuer, in whole or in part, at any time. Interest on the 2008Senior Notes is payable semi-annually and commenced on December 1, 2008 at an annual fixed rate of 6.875%,and cannot be deferred.
The 2008 Senior Notes are ranked as senior unsecured obligations of PartnerRe Finance A. The Companyhas fully and unconditionally guaranteed all obligations of PartnerRe Finance A under the 2008 Senior Notes.The Company’s obligations under this guarantee are senior and unsecured and rank equally with all other seniorunsecured indebtedness of the Company.
Contemporaneously, PartnerRe U.S. Holdings issued a 6.875% promissory note, with a principal amount of$250 million to PartnerRe Finance A. Under the terms of the promissory note, PartnerRe U.S. Holdings promisesto pay to PartnerRe Finance A the principal amount on June 1, 2018, unless previously paid. Interest on thepromissory note is payable semi-annually and commenced on December 1, 2008 at an annual fixed rate of6.875%, and cannot be deferred.
For the years ended December 31, 2011, 2010 and 2009, the Company incurred interest expense of $17.2million, $17.2 million and $17.2 million, respectively, and paid interest of $17.2 million, $17.2 million and $17.2million, respectively, in relation to the 2008 Senior Notes issued by PartnerRe Finance A (see Note 11 toConsolidated Financial Statements in Item 8 Part II of this report).
Capital Efficient Notes (CENts)
In November 2006, PartnerRe Finance II Inc. (PartnerRe Finance II), an indirect wholly-owned subsidiaryof the Company, issued $250 million aggregate principal amount of 6.440% Fixed-to-Floating Rate JuniorSubordinated CENts. The CENts will mature on December 1, 2066 and may be redeemed at the option of theissuer, in whole or in part, after December 1, 2016 or earlier upon occurrence of specific rating agency or taxevents. Interest on the CENts is payable semi-annually and commenced on June 1, 2007 through to December 1,2016 at an annual fixed rate of 6.440% and will be payable quarterly thereafter until maturity at an annual rate of3-month LIBOR plus a margin equal to 2.325%.
PartnerRe Finance II may elect to defer one or more interest payments for up to ten years, although interestwill continue to accrue and compound at the rate of interest applicable to the CENts. The CENts are ranked asjunior subordinated unsecured obligations of PartnerRe Finance II. The Company has fully and unconditionallyguaranteed on a subordinated basis all obligations of PartnerRe Finance II under the CENts. The Company’sobligations under this guarantee are unsecured and rank junior in priority of payments to the Company’s SeniorNotes.
Contemporaneously, PartnerRe U.S. Holdings issued a 6.440% Fixed-to-Floating Rate promissory note,with a principal amount of $257.6 million to PartnerRe Finance II. Under the terms of the promissory note,PartnerRe U.S. Holdings promises to pay to PartnerRe Finance II the principal amount on December 1, 2066,
127

unless previously paid. Interest on the promissory note is payable semi-annually and commenced on June 1, 2007through to December 1, 2016 at an annual fixed rate of 6.440% and will be payable quarterly thereafter untilmaturity at an annual rate of 3-month LIBOR plus a margin equal to 2.325%.
On March 13, 2009, PartnerRe Finance II, under the terms of a tender offer, paid holders $500 per $1,000principal amount of CENts tendered, and purchased approximately 75% of the issue, or $186.6 million, for $93.3million. Contemporaneously, under the terms of a cross receipt agreement, PartnerRe U.S. Holdings paidPartnerRe Finance II consideration of $93.3 million for the extinguishment of $186.6 million of the principalamount of PartnerRe U.S. Holdings’ 6.440% Fixed-to-Floating Rate promissory note due December 1, 2066. Allother terms and conditions of the remaining CENts and promissory note remain unchanged. A pre-tax gain of$88.4 million, net of deferred issuance costs and fees, was realized on the foregoing transactions during the yearended December 31, 2009. The aggregate principal amount of the CENts and promissory note outstanding atDecember 31, 2011 and 2010 was $63.4 million and $71.0 million, respectively.
For the years ended December 31, 2011, 2010 and 2009, the Company incurred interest expense of $4.6million, $4.6 million and $7.0 million, respectively, and paid interest of $4.6 million, $4.6 million and $8.0million, respectively (see Note 11 to Consolidated Financial Statements in Item 8 Part II of this report).
Long-term Debt
In October 2005, the Company entered into a loan agreement with Citibank, N.A., under which theCompany borrowed $400 million. The loan had an original maturity of April 27, 2009 and bore interest quarterlyat a floating rate of 3-month LIBOR plus 0.50%. In July 2008, under the terms of a loan amendment entered intowith Citibank N.A., the maturity of half of the original $400 million loan was extended to July 12, 2010 withinterest quarterly at a floating rate of 3-month LIBOR plus 0.50% through April 27, 2009 and at a rate of3-month LIBOR plus 0.85% thereafter.
On January 14, 2009, the Company elected to repay the first half of the original $400 million loan that wasdue on April 27, 2009.
On July 12, 2010, the Company repaid the $200 million remaining half of the original $400 million loan.
For the years ended December 31, 2010 and 2009, the Company incurred interest expense of $1.2 millionand $3.9 million, respectively, and paid interest of $1.6 million and $6.3 million, respectively, in relation to thisloan (see Note 11 to Consolidated Financial Statements in Item 8 Part II of this report).
The Company did not enter into any short-term borrowing arrangements during the year endedDecember 31, 2011.
Shareholders’ Equity
Share Repurchases
During 2011, the Company repurchased, under its authorized share repurchase program, 5.4 million of itscommon shares at a total cost of $396.2 million, representing an average cost of $73.41 per share. AtDecember 31, 2011, the Company had approximately 5.3 million common shares remaining under its currentshare repurchase authorization and approximately 19.4 million common shares were held in treasury and areavailable for reissuance (see Note 12 to Consolidated Financial Statements in Item 8 of Part II of this report).
During 2010, the Company repurchased, under its authorized share repurchase program, 14.0 million of itscommon shares at a total cost of $1,082.6 million, representing an average cost of $77.10 per share.
During 2009, no shares were repurchased.
128

Share Issuance
During 2010, the Company’s remaining $200 million forward sale agreement matured. The Company didnot deliver any common shares to the forward counterparty (see Note 19 to Consolidated Financial Statements inItem 8 of Part II of this report).
During 2009, pursuant to the acquisition of Paris Re, the Company issued 25.7 million common shares, ofwhich 1.3 million common shares were reissued from treasury (see Note 12 to Consolidated Financial Statementsin Item 8 of Part II of this report).
Cumulative Redeemable Preferred Shares
The Company has issued and outstanding Series C, Series D and Series E cumulative redeemable preferredshares (Series C, D and E preferred shares) as follows (in millions of U.S. dollars or shares except percentageamounts):
Series C Series D Series E
Date of issuance . . . . . . . . . . . . . . . . . . . . . . . . . . . . . . . . . . . . May 2003 November 2004 June 2011Number of preferred shares issued . . . . . . . . . . . . . . . . . . . . . . 11.6 9.2 15.0Annual dividend rate . . . . . . . . . . . . . . . . . . . . . . . . . . . . . . . . . 6.75% 6.5% 7.25%Total consideration . . . . . . . . . . . . . . . . . . . . . . . . . . . . . . . . . . $ 280.9 $ 222.3 $ 361.7Underwriting discounts and commissions . . . . . . . . . . . . . . . . $ 9.1 $ 7.7 $ 12.1Aggregate liquidation value . . . . . . . . . . . . . . . . . . . . . . . . . . . $ 290.0 $ 230 $ 373.8
During 2011, the Company raised proceeds, before underwriting discounts and commissions, of $374mfrom the issuance of Series E preferred shares.
The Company may redeem each of the Series C, D and E preferred shares at $25.00 per share plus accruedand unpaid dividends without interest as follows: (i) each of the Series C and D preferred shares can be redeemedat our option at any time or in part from time to time, and (ii) the Series E preferred shares can be redeemed atour option on or after June 1, 2016 or at any time upon certain changes in tax law. Dividends on each of theSeries C, D and E preferred shares are cumulative from the date of issuance and are payable quarterly in arrears.
In the event of liquidation of the Company, each series of outstanding preferred shares ranks on parity witheach other series of preference shares and would rank senior to the common shares, and holders thereof wouldreceive a distribution of $25.00 per share, or the aggregate liquidation value for each of the Series C, D and Epreferred shares, respectively, plus accrued and unpaid dividends, if any (see Note 12 to Consolidated FinancialStatements in Item 8 of Part II of this report).
Liquidity
Liquidity is a measure of the Company’s ability to access sufficient cash flows to meet the short-term andlong-term cash requirements of its business operations. Management believes that its significant cash flows fromoperations and high quality liquid investment portfolio will provide sufficient liquidity for the foreseeable future.Cash and cash equivalents decreased from $2.1 billion at December 31, 2010 to $1.3 billion at December 31,2011 primarily due to the investment of a portion of the cash and cash equivalents into the Company’s fixedmaturity portfolio and loss payments related to the 2011 catastrophic losses.
Cash flows from operations in 2011 decreased to $574 million from $1,227 million in 2010. The decrease incash flows from operations was primarily due to lower underwriting cash flows reflecting loss payments relatedto the 2011 catastrophic events and a lower level of premiums received, which was driven by the decrease ingross and net premiums written (as discussed in Overview and Results by Segment above). These decreases inunderwriting cash flows were partially offset by cash received related to the release of assets from the funds held– directly managed account to PartnerRe Europe pursuant to the Endorsement (see Funds Held – DirectlyManaged above).
129

Net cash used in investing activities was $1.1 billion during 2011 compared to net cash provided byinvesting activities of $1.1 billion during 2010. The net cash used in investing activities during 2011 reflects theinvestment of a portion of the cash and cash equivalents into the Company’s fixed maturity portfolio, theinvestment of net cash provided by operations and the investment of the proceeds related to the issuance of theSeries E preferred shares.
Net cash used in financing activities in 2011 was $242 million compared to $922 million in 2010. Net cashused in financing activities in 2011 was primarily related to the Company’s share repurchases and dividendpayments on common and preferred shares, which were partially offset by the net proceeds of $362 millionrelated to the issuance of the Series E preferred shares.
The Company is a holding company with no operations or significant assets other than the capital stock ofthe Company’s subsidiaries and other intercompany balances. The Company has cash outflows in the form ofoperating expenses, interest payments related to its debt, dividends to both common and preferred shareholdersand, from time to time, cash outflows for principal repayments related to its debt, and the repurchase of itscommon shares under its share repurchase program. For the year ended December 31, 2011, the Companyincurred other operating expenses of $77 million, common dividends paid were $159 million, preferred dividendspaid were $47 million and share repurchases were $396 million. In February 2012, the Company announced thatit was increasing its quarterly dividend to $0.62 per common share or approximately $162 million in total for2012, assuming a constant number of common shares outstanding and a constant dividend rate, and it will payapproximately $62 million in dividends to preferred shareholders.
The Company relies primarily on cash dividends and payments from its reinsurance subsidiaries to pay theoperating expenses, interest expense, shareholder dividends and other obligations of the holding company thatmay arise from time to time. The Company expects future dividends and other permitted payments from itsreinsurance subsidiaries to be the principal source of its funds to pay such expenses and dividends. The paymentof dividends by the reinsurance subsidiaries to the Company is limited under Bermuda and Irish laws and certainstatutes of various U.S. states in which PartnerRe U.S. is licensed to transact business. As of December 31, 2011,there were no significant restrictions on the payment of dividends by the Company’s reinsurance subsidiaries thatwould limit the Company’s ability to pay common and preferred shareholders’ dividends and its corporateexpenses (see Note 14 to Consolidated Financial Statements in Item 8 of Part II of this report).
The reinsurance subsidiaries of the Company depend upon cash inflows from the collection of premiums aswell as investment income and proceeds from the sales and maturities of investments to meet their obligations.Cash outflows are in the form of claims payments, purchase of investments, operating expenses, income taxpayments, intercompany payments as well as dividend payments to the holding company, and additionally, in thecase of PartnerRe U.S. Holdings, interest payments on the Senior Notes and the CENts. At December 31, 2011,PartnerRe U.S. Holdings and its subsidiaries have $750 million in Senior Notes and $63 million of CENtsoutstanding and will pay approximately $49 million in aggregate interest payments in 2012 related to this debt.
Historically, the operating subsidiaries of the Company have generated sufficient cash flows to meet all oftheir obligations. Because of the inherent volatility of the business written by the Company, the seasonality in thetiming of payments by cedants, the irregular timing of loss payments, the impact of a change in interest rates andcredit spreads on the investment income as well as seasonality in coupon payment dates for fixed incomesecurities, cash flows from operating activities may vary significantly between periods. The Company believesthat annual positive cash flows from operating activities will be sufficient to cover claims payments, absent aseries of additional large catastrophic loss activity. In the event that paid losses accelerate beyond the ability tofund such payments from operating cash flows, the Company would use its cash balances available, liquidate aportion of its high quality and liquid investment portfolio or borrow under the Company’s revolving line of credit(see Credit Facilities below). As discussed in Investments above, the Company’s investments and cash totaled$16.6 billion at December 31, 2011, the main components of which were investment grade fixed maturities,short-term investments and cash and cash equivalents totaling $14.5 billion.
130

Financial strength ratings and senior unsecured debt ratings represent the opinions of rating agencies on theCompany’s capacity to meet its claims paying obligations. In the event of a significant downgrade in ratings, theCompany’s ability to write business and to access the capital markets could be impacted. Some of the Company’sreinsurance treaties contain special funding and termination clauses that would be triggered in the event theCompany or one of its subsidiaries is downgraded by one of the major rating agencies to levels specified in thetreaties, or the Company’s capital is significantly reduced. If such an event were to occur, the Company would berequired, in certain instances, to post collateral in the form of letters of credit and/or trust accounts againstexisting outstanding losses, if any, related to the treaty. In a limited number of instances, the subject treatiescould be cancelled retroactively or commuted by the cedant.
The Company’s current financial strength ratings are:
Standard & Poor’s . . . . . . . . . . . . . . . . . . . . . . . . . . . . . . . . . . . . . A+Moody’s . . . . . . . . . . . . . . . . . . . . . . . . . . . . . . . . . . . . . . . . . . . . . A1A.M. Best . . . . . . . . . . . . . . . . . . . . . . . . . . . . . . . . . . . . . . . . . . . . A+Fitch . . . . . . . . . . . . . . . . . . . . . . . . . . . . . . . . . . . . . . . . . . . . . . . . AA-
On January 24, 2012, A.M. Best put the Company’s A+ rating under review with negative implications.
See Risk Factors in Item 1A of Part I of this report for the Company’s financial strength ratings.
Credit Facilities
In the normal course of its operations, the Company enters into agreements with financial institutions toobtain unsecured and secured credit facilities. At December 31, 2011, the total amount of such credit facilitiesavailable to the Company was $1,440 million, with each of the significant facilities described below. Thesefacilities are used primarily for the issuance of letters of credit, although a portion of these facilities may also beused for liquidity purposes. Under the terms of certain reinsurance agreements, irrevocable letters of credit wereissued on an unsecured and secured basis in the amount of $246 million and $524 million, respectively, atDecember 31, 2011, in respect of reported loss and unearned premium reserves.
Included in the total credit facilities available to the Company at December 31, 2011 is a $750 million three-year syndicated unsecured credit facility. This facility has the following terms: (i) a maturity date of July 16,2013, (ii) a $250 million accordion feature, which enables the Company to potentially increase its available creditfrom $750 million to $1 billion, and (iii) a minimum consolidated tangible net worth requirement. TheCompany’s ability to increase its available credit to $1 billion is subject to the agreement of the credit facilityparticipants. The Company’s breach of any of the covenants would result in an event of default, upon which theCompany may be required to repay any outstanding borrowings and replace or cash collateralize letters of creditissued under this facility. The Company was in compliance with all of the covenants at December 31, 2011. Thisfacility is predominantly used for the issuance of letters of credit, although the Company and its subsidiaries haveaccess to a revolving line of credit of up to $375 million as part of this facility. During the year endedDecember 31, 2011, there were no borrowings under this revolving line of credit.
Additionally, the syndicated unsecured credit facility allows for an adjustment to the level of pricing shouldthe Company experience a change in its senior unsecured debt ratings. The pricing grid provides the Companygreater flexibility and simultaneously provides participants under the facility with some price protection.
On November 14, 2011, the Company entered into an agreement to modify an existing credit facility. Underthe terms of the agreement, this credit facility was increased from a $250 million to a $300 million combinedcredit facility, with the first $100 million being unsecured and any utilization above the $100 million beingsecured. This credit facility matures on November 14, 2012, and can be extended for one additional year underthe terms of the agreement.
131

In addition to the unsecured credit facilities available, the Company maintains two committed secured letterof credit facilities with amounts available of $150 million and $200 million at December 31, 2011. The facilitiesare used for the issuance of letters of credit, which must be secured fully or partially with cash and/orgovernment bonds and/or investment grade bonds. The agreements include default covenants, which couldrequire the Company to fully secure the outstanding letters of credit to the extent that the facility is not alreadyfully secured, and disallow the issuance of any new letters of credit. The $200 million credit facility has amaturity date of December 31, 2014. The Company is currently negotiating an extension of the $150 millioncredit facility. At December 31, 2011, no conditions of default existed under these facilities (see Note 20 toConsolidated Financial Statements in Item 8 of Part II of this report).
Off-Balance Sheet Arrangements
In October 2005, the Company entered into a forward sale agreement under which it agreed to sell commonshares to an affiliate of Citigroup Global Markets Inc., which affiliate is referred to as the forward counterparty,on settlement dates chosen by the Company prior to October 2008. On July 31, 2008, the Company amended theforward sale agreement, with half the contract maturing and the remaining half extended to April 2010.
On April 28, 2010, under the terms of the amendment to the forward sale agreement with the forwardcounterparty, the remaining forward sale agreement matured. Commencing on April 28, 2010, there was a 40 dayvaluation period, whereby the Company could deliver up to 3.4 million common shares over the valuation period,subject to a minimum price per share of $59.05 and a maximum price per share of $84.15. As a result of theCompany’s share price trading between the minimum and the maximum price per share during the valuationperiod, the Company did not deliver any common shares to the forward counterparty.
This transaction had no other impact on the Company’s common shareholders’ equity, and the Company’sdiluted net income per share for the years ended December 31, 2010 and 2009 did not include any dilutive effectrelated to this agreement (see Note 19 to Consolidated Financial Statements in Item 8 of Part II of this report).
Currency
The Company’s reporting currency is the U.S. dollar. The Company has exposure to foreign currency riskdue to both its ownership of its Irish, French and Canadian subsidiaries and branches, whose functionalcurrencies are the euro and the Canadian dollar, and to underwriting reinsurance exposures, collecting premiumsand paying claims and other operating expenses in currencies other than the U.S. dollar and holding certain netassets in such currencies. The Company’s most significant foreign currency exposure is to the euro.
At December 31, 2011, the value of the U.S. dollar strengthened against most major currencies compared toDecember 31, 2010, which resulted in a decrease in the U.S. dollar value of the assets and liabilities denominatedin non-U.S. dollar currencies. See Results of Operations and Review of Net (Loss) Income above for a discussionof the impact of foreign exchange and net foreign exchange gains and losses during the years endedDecember 31, 2011, 2010 and 2009.
The foreign exchange gain or loss resulting from the translation of the Company’s subsidiaries’ andbranches’ financial statements (expressed in euro or Canadian dollar functional currency) into U.S. dollars isclassified in the currency translation adjustment account, which is a component of accumulated othercomprehensive income or loss in shareholders’ equity. The currency translation adjustment account decreased by$12 million during the year ended December 31, 2011 compared to a decrease of $67 million and an increase of$48 million during the years ended December 31, 2010 and 2009, respectively, due to both the Company’s netasset exposure to currencies other than the U.S. dollar and the impact of foreign exchange fluctuations.
132

The following table provides a reconciliation of the currency translation adjustment for the years endedDecember 31, 2011, 2010 and 2009 (in millions of U.S. dollars):
2011 2010 2009
Currency translation adjustment at beginning of year . . . . . . . . . . . . . . . . . . . . . . . . . . . . . . . $ 16 $ 83 $ 35Change in currency translation adjustment included in accumulated other comprehensive
(loss) income . . . . . . . . . . . . . . . . . . . . . . . . . . . . . . . . . . . . . . . . . . . . . . . . . . . . . . . . . . . . . (12) (66) 77Net realized loss on designated net investment hedges included in accumulated other
comprehensive (loss) income . . . . . . . . . . . . . . . . . . . . . . . . . . . . . . . . . . . . . . . . . . . . . . . . — (1) (29)
Currency translation adjustment at end of year . . . . . . . . . . . . . . . . . . . . . . . . . . . . . . . . . . . . $ 4 $ 16 $ 83
From time to time, the Company enters into net investment hedges. At December 31, 2011, there were nooutstanding foreign exchange contracts hedging the Company’s net investment exposure.
See Quantitative and Qualitative Disclosures About Market Risk—Foreign Currency Risk in Item 3 of Part Ibelow for a discussion of the Company’s risk related to changes in foreign currency movements.
Effects of Inflation
The effects of inflation are considered implicitly in pricing and estimating reserves for unpaid losses andloss expenses. The actual effects of inflation on the results of operations of the Company cannot be accuratelyknown until claims are ultimately settled.
New Accounting Pronouncements
See Note 2(u) to the Consolidated Financial Statements included in Item 8 of Part II of this report.
ITEM 7A. QUANTITATIVE AND QUALITATIVE DISCLOSURES ABOUT MARKET RISK
Overview
Management believes that the Company is principally exposed to five types of market related risk: interestrate risk, credit spread risk, foreign currency risk, counterparty credit risk and equity price risk. How these risksrelate to the Company, and the process used to manage them, is discussed below.
As discussed above in this report, the Company’s investment philosophy distinguishes between assets thatare generally matched against the estimated net reinsurance liabilities (liability funds) and those assets thatrepresent shareholder capital (capital funds). Liability funds are invested in a way that generally matches them tothe corresponding liabilities in both duration and currency composition to provide a natural hedge againstchanges in interest rates and foreign exchange rates.
The Company’s investment philosophy is to reduce foreign currency risk on capital funds by investingprimarily in U.S. dollar denominated investments. In considering the market risk of capital funds, it is importantto recognize the benefits of portfolio diversification. Although these asset classes in isolation may introduce morerisk into the portfolio, market forces have a tendency to influence each class in different ways and at differenttimes. Consequently, the aggregate risk introduced by a portfolio of these assets should be less than might beestimated by summing the individual risks.
Although the focus of this discussion is to identify risk exposures that impact the market value of assetsalone, it is important to recognize that the risks discussed herein are significantly mitigated to the extent that theCompany’s investment strategy allows market forces to influence the economic valuation of assets and liabilitiesin a way that is generally offsetting.
133

As described above in this report, the Company’s investment strategy allows the use of derivativeinvestments, subject to strict limitations. The Company also imposes a high standard for the credit quality ofcounterparties in all derivative transactions and aims to diversify its counterparty credit risk exposure. See Note 6to the Consolidated Financial Statements in Item 8 of Part II of this report for additional information related toderivatives.
The following comments address those areas where the Company believes it has exposure to materialmarket risk in its operations.
Interest Rate Risk
The Company’s fixed income portfolio and the fixed income securities in the investment portfoliounderlying the funds held – directly managed account are exposed to interest rate risk. Fluctuations in interestrates have a direct impact on the market valuation of these securities. The Company manages interest rate risk onliability funds by constructing bond portfolios in which the economic impact of a general interest rate shift iscomparable to the impact on the related liabilities. This process involves matching the duration of the investmentportfolio to the estimated duration of the liabilities. For unpaid loss reserves and policy benefits related tonon-life and traditional life business, the estimated duration of the Company’s liabilities is based on projectedclaims payout patterns. For policy benefits related to annuity business, the Company estimates duration based onits commitment to annuitants. The Company believes that this matching process mitigates the overall interest raterisk on an economic basis. The Company manages the exposure to interest rate volatility on capital funds bychoosing a duration profile that it believes will optimize the risk-reward relationship.
While this matching of duration insulates the Company from the economic impact of interest rate changes,changes in interest rates do impact the Company’s shareholders’ equity. The Company’s liabilities are carried attheir nominal value, and are not adjusted for changes in interest rates, with the exception of certain policybenefits for life and annuity contracts and deposit liabilities that are interest rate sensitive. However, substantiallyall of the Company’s invested assets (including the investments underlying the funds held – directly managedaccount) are carried at fair value, which reflects such changes. As a result, an increase in interest rates will resultin a decrease in the fair value of the Company’s investments (including the investments underlying the fundsheld – directly managed account) and a corresponding decrease, net of applicable taxes, in the Company’sshareholders’ equity. A decrease in interest rates would have the opposite effect.
At December 31, 2011, the Company held approximately $3,991 million of its total invested assets inmortgage/asset-backed securities. These assets are exposed to prepayment risk, the adverse impact of which ismore evident in a declining interest rate environment.
134

At December 31, 2011, the Company estimates that the hypothetical case of an immediate 100 basis pointsor 200 basis points parallel shift in global bond curves would result in a change in the fair value of investmentsexposed to interest rate risk, the fair value of funds held – directly managed account exposed to interest rate risk,total invested assets, and shareholders’ equity as follows (in millions of U.S. dollars):
-200 BasisPoints
%Change
-100 BasisPoints
%Change
December 31,2011
+100 BasisPoints
%Change
+200 BasisPoints
%Change
Fair value of investmentsexposed to interest raterisk (1) (2) . . . . . . . . . . . . . . $16,236 6% $15,789 3% $15,342 $14,895 (3)% $14,448 (6)%
Fair value of funds held –directly managed accountexposed to interest raterisk (2) . . . . . . . . . . . . . . . . 1,284 5 1,251 3 1,218 1,185 (3) 1,152 (5)
Total invested assets (3) . . . . . 19,027 5 18,547 3 18,067 17,587 (3) 17,107 (5)Shareholders’ equity . . . . . . 7,428 15 6,948 7 6,468 5,988 (7) 5,508 (15)
(1) Includes certain other invested assets, certain cash and cash equivalents and funds holding fixed incomesecurities.
(2) Excludes accrued interest.(3) Includes total investments, cash and cash equivalents, the investment portfolio underlying the funds held –
directly managed account and accrued interest.
The changes do not take into account any potential mitigating impact from the equity market, taxes or thecorresponding change in the economic value of the Company’s reinsurance liabilities, which, as noted above,would substantially offset the economic impact on invested assets, although the offset would not be reflected inthe Consolidated Balance Sheets.
As discussed above, the Company strives to match the foreign currency exposure in its fixed incomeportfolio to its multicurrency liabilities. The Company believes that this matching process creates adiversification benefit. Consequently, the exact market value effect of a change in interest rates will depend onwhich countries experience interest rate changes and the foreign currency mix of the Company’s fixed incomeportfolio at the time of the interest rate changes. See Foreign Currency Risk below.
The impact of an immediate change in interest rates on the fair value of investments and funds held –directly managed exposed to interest rate risk, the Company’s total invested assets and shareholders’ equity, inboth absolute terms and as a percentage of total invested assets and shareholders’ equity, has not changedsignificantly at December 31, 2011 compared to December 31, 2010.
Interest rate movements also affect the economic value of the Company’s outstanding debt obligations andpreferred securities in the same way that they affect the Company’s fixed income investments, and this can resultin a liability whose economic value is different from the carrying value reported in the Consolidated BalanceSheets. The Company believes that the economic fair value of its outstanding Senior Notes, CENts and preferredshares at December 31, 2011 was as follows (in millions of U.S. dollars):
CarryingValue
FairValue
Debt related to Senior Notes (1) . . . . . . . . . . . . . . . . . . . . . . . . . . . . . . . . . . . . . . . . . . . . . . . . . . . . $750 $781Debt related to Capital Efficient Notes (2) . . . . . . . . . . . . . . . . . . . . . . . . . . . . . . . . . . . . . . . . . . . 63 56Series C cumulative preferred shares . . . . . . . . . . . . . . . . . . . . . . . . . . . . . . . . . . . . . . . . . . . . . . 290 294Series D cumulative preferred shares . . . . . . . . . . . . . . . . . . . . . . . . . . . . . . . . . . . . . . . . . . . . . . 230 230Series E cumulative preferred shares . . . . . . . . . . . . . . . . . . . . . . . . . . . . . . . . . . . . . . . . . . . . . . . 374 396
(1) PartnerRe Finance A LLC and PartnerRe Finance B LLC, the issuers of the Senior Notes, do not meetconsolidation requirements under U.S. GAAP. Accordingly, the Company shows the related intercompanydebt of $750 million in its Consolidated Balance Sheets at December 31, 2011 and 2010.
135

(2) PartnerRe Finance II Inc., the issuer of the CENts, does not meet consolidation requirements under U.S.GAAP. Accordingly, the Company shows the related intercompany debt of $71 million in its ConsolidatedBalance Sheets at December 31, 2011 and 2010.
The fair value of the debt related to Senior Notes issued by PartnerRe Finance B LLC, PartnerRe Finance ALLC and the CENts was calculated based on internal models using observable inputs based on the aggregateprincipal amount outstanding of $500 million from PartnerRe Finance B LLC, $250 million from PartnerReFinance A and $63 million from PartnerRe Finance II, respectively. For the Company’s Series C, Series D andSeries E cumulative preferred shares, fair value is based on quoted market prices, while carrying value is basedon the aggregate liquidation value of the shares.
The fair value of the Company’s outstanding debt obligations and preferred shares has not changedsignificantly at December 31, 2011 compared to December 31, 2010, other than related to the issuance of theSeries E cumulative preferred shares during 2011.
Credit Spread Risk
The Company’s fixed income portfolio and the fixed income securities in the investment portfoliounderlying the funds held – directly managed account are exposed to credit spread risk. Fluctuations in marketcredit spreads have a direct impact on the market valuation of these securities. The Company manages creditspread risk by the selection of securities within its fixed income portfolio. Changes in credit spreads directlyaffect the market value of certain fixed income securities, but do not necessarily result in a change in the futureexpected cash flows associated with holding individual securities. Other factors, including liquidity, supply anddemand, and changing risk preferences of investors, may affect market credit spreads without any change in theunderlying credit quality of the security.
As with interest rates, changes in credit spreads impact the shareholders’ equity of the Company as investedassets are carried at fair value, which includes changes in credit spreads. As a result, an increase in credit spreadswill result in a decrease in the fair value of the Company’s investments (including the investment portfoliounderlying the funds held – directly managed account) and a corresponding decrease, net of applicable taxes, inthe Company’s shareholders’ equity. A decrease in credit spreads would have the opposite effect.
At December 31, 2011, the Company estimates that the hypothetical case of an immediate 100 basis pointsor 200 basis points parallel shift in global credit spreads would result in a change in the fair value of investmentsand the fair value of funds held – directly managed account exposed to credit spread risk, total invested assetsand shareholders’ equity as follows (in millions of U.S. dollars):
-200 BasisPoints
%Change
-100 BasisPoints
%Change
December 31,2011
+100 BasisPoints
%Change
+200 BasisPoints
%Change
Fair value of investmentsexposed to credit spreadrisk (1) (2) . . . . . . . . . . . . . . $16,054 5% $15,698 2% $15,342 $14,986 (2)% $14,630 (5)%
Fair value of funds held –directly managed accountexposed to credit spreadrisk (2) . . . . . . . . . . . . . . . . 1,266 4 1,242 2 1,218 1,194 (2) 1,170 (4)
Total invested assets (3) . . . . . 18,827 4 18,447 2 18,067 17,687 (2) 17,307 (4)Shareholders’ equity . . . . . . 7,228 12 6,848 6 6,468 6,088 (6) 5,708 (12)
(1) Includes certain other invested assets, certain cash and cash equivalents and funds holding fixed incomesecurities.
(2) Excludes accrued interest.
136

(3) Includes total investments, cash and cash equivalents, the investment portfolio underlying the funds held –directly managed account and accrued interest.
The impacts of changes in credit spreads for all parallel shifts in basis points are lower than the impacts ofchanges in interest rates, as the change in credit spreads does not impact government fixed income securities.However, the change in credit spreads does assume that mortgage-backed securities issued by governmentsponsored entities are affected, even though these typically exhibit significantly lower spread volatility thancorporate fixed income securities. These changes also exclude any potential mitigating impact from the equitymarket, taxes, and the change in the economic value of the Company’s reinsurance liabilities, which may offsetthe economic impact on invested assets.
The impact of an immediate change in credit spreads on the fair value of investments and funds held –directly managed exposed to credit spread risk, the Company’s total invested assets and shareholders’ equity, inboth absolute terms and as a percentage of total invested assets and shareholders’ equity, has not changedsignificantly at December 31, 2011 compared to December 31, 2010.
Foreign Currency Risk
Through its multinational reinsurance operations, the Company conducts business in a variety of non-U.S.currencies, with the principal exposures being the euro, Canadian dollar, British pound, New Zealand dollar,Japanese Yen and Australian dollar. As the Company’s reporting currency is the U.S. dollar, foreign exchangerate fluctuations may materially impact the Company’s Consolidated Financial Statements.
The Company is generally able to match its liability funds against its net reinsurance liabilities both bycurrency and duration to protect the Company against foreign exchange and interest rate risks. However, anatural offset does not exist for all currencies. For the non-U.S. dollar currencies for which the Company deemsthe net asset or liability exposures to be material, the Company employs a hedging strategy utilizing foreignexchange forward contracts and other derivative financial instruments, as appropriate, to reduce exposure andmore appropriately match the liability funds by currency. The Company does not hedge currencies for which itsasset or liability exposures are not material or where it is unable or impractical to do so. In such cases, theCompany is exposed to foreign currency risk. However, the Company does not believe that the foreign currencyrisks corresponding to these unhedged positions are material, except for those related to the Company’s capitalfunds.
For the Company’s capital funds, including its net investment in foreign subsidiaries and branches, theCompany does not typically employ hedging strategies. However, from time to time the Company does enter intonet investment hedges to offset foreign exchange volatility (see Currency in Item 7 of Part II of this report).
The table below summarizes the Company’s gross and net exposure in its Consolidated Balance Sheet atDecember 31, 2011 to foreign currency as well as the associated foreign currency derivatives the Company hasentered into to manage this exposure (in millions of U.S. dollars):
euro CAD GBP NZD JPY AUD Other Total(1)
Total assets . . . . . . . . . . . . . . . . . . . . . . $ 4,739 $1,317 $1,012 $ 14 $ 91 $ 80 $ 710 $7,963Total liabilities . . . . . . . . . . . . . . . . . . . (4,211) (752) (767) (467) (455) (317) (1,265) (8,234)
Total gross foreign currencyexposure . . . . . . . . . . . . . . . . . . . . . . 528 565 245 (453) (364) (237) (555) (271)
Total derivative amount . . . . . . . . . . . . (408) 16 (242) 421 255 145 509 696
Net foreign currency exposure . . . . . . . 120 581 3 (32) (109) (92) (46) 425
(1) As the U.S. dollar is the Company’s reporting currency, there is no currency risk attached to the U.S. dollarand it is excluded from this table. The U.S. dollar accounted for the difference between the Company’s totalforeign currency exposure in this table and the total assets and total liabilities in the Company’sConsolidated Balance Sheet at December 31, 2011.
137

The above numbers include the Company’s investment in PartnerRe Holdings Europe Limited, whosefunctional currency is the euro, and certain of its subsidiaries and branches, whose functional currencies are theeuro or Canadian dollar.
Assuming all other variables remain constant and disregarding any tax effects, a change in the U.S. dollar of10% or 20% relative to the other currencies held by the Company would result in a change in the Company’s netassets of $43 million and $85 million, respectively, inclusive of the effect of foreign exchange forward contractsand other derivative financial instruments.
At December 31, 2010, the Company’s net foreign currency exposure in its Consolidated Balance Sheet,after the effect of derivatives, was $975 million. The $550 million decrease in the Company’s net foreigncurrency exposure compared to December 31, 2010 is primarily related to a decrease in the Company’s euroexposure related to a decline in level of net assets held by its European subsidiaries following capitaldistributions to the Company.
Counterparty Credit Risk
The Company has exposure to credit risk primarily as a holder of fixed income securities. The Companycontrols this exposure by emphasizing investment grade credit quality in the fixed income securities it purchases.At December 31, 2011, approximately 25% of the Company’s fixed income portfolio (including the funds held –directly managed account and funds holding fixed income securities) was rated AAA (or equivalent rating). Thedecline in the percentage of the Company’s fixed income portfolio rated AAA from 50% at December 31, 2010largely reflects Standard & Poor’s decision in August 2011 related to the downgrade of U.S. governmentsecurities, as discussed in Financial Condition, Liquidity and Capital Resources—Investments above.
On January 13, 2012, Standard & Poor’s announced credit downgrades of nine European sovereigngovernments (the Eurozone downgrade). If the Eurozone downgrade had occurred at December 31, 2011, theimpact on the credit quality of the Company’s fixed income and short-term investments (including the funds held– directly managed account and funds holding fixed income securities) would have been to decrease the AAAcredit quality from 25% to 19%, with a corresponding increase in the AA credit quality from 37% to 43%. Theaverage credit quality of the Company’s fixed income and short-term investments (including the funds held –directly managed account and funds holding fixed income securities) would have remained at AA atDecember 31, 2011. See Financial Condition, Liquidity and Capital Resources Management—Investments.
At December 31, 2011, approximately 82% the Company’s fixed income and short-term investments(including funds holding fixed income securities and excluding the funds held – directly managed account) wasrated A- or better and 7% was rated below investment grade or not rated. The Company believes this high qualityconcentration reduces its exposure to credit risk on fixed income investments to an acceptable level. AtDecember 31, 2011, the Company is not exposed to any significant credit concentration risk on its investments,excluding securities issued by the U.S. and German governments which are rated AA+ and AAA, respectively. Inaddition, the single largest corporate issuer and the top 10 corporate issuers accounted for less than 3% and 17%of the Company’s total corporate fixed income securities (excluding the funds held – directly managed account),respectively. Within the segregated investment portfolio underlying the funds held – directly managed account,the single largest corporate issuer and the top 10 corporate issuers accounted for less than 4% and 24% of totalcorporate fixed income securities underlying the funds held – directly managed account at December 31, 2011,respectively.
The Company keeps cash and cash equivalents in several banks and ensures that there are no significantconcentrations at any point in time, in any one bank.
To a lesser extent, the Company also has credit risk exposure as a party to foreign exchange forwardcontracts and other derivative contracts. To mitigate this risk, the Company monitors its exposure by
138

counterparty, aims to diversify its counterparty credit risk and ensures that counterparties to these contracts arehigh credit quality international banks or counterparties. These contracts are generally of short duration(approximately 90 days) and settle on a net basis, which means that the Company is exposed to the movement ofone currency against the other, as opposed to the notional amount of the contracts. At December 31, 2011, theCompany’s absolute notional value of foreign exchange forward contracts and foreign currency option contractswas $2,665 million, while the net fair value of those contracts was an unrealized gain of $3 million.
The Company is also exposed to credit risk in its underwriting operations, most notably in the credit/suretyline and for alternative risk products. Loss experience in these lines of business is cyclical and is affected by thegeneral economic environment. The Company provides its clients in these lines of business with protectionagainst credit deterioration, defaults or other types of financial non-performance of or by the underlying creditsthat are the subject of the protection provided and, accordingly, the Company is exposed to the credit risk ofthose credits. As with all of the Company’s business, these risks are subject to rigorous underwriting and pricingstandards. In addition, the Company strives to mitigate the risks associated with these credit-sensitive lines ofbusiness through the use of risk management techniques such as risk diversification, careful monitoring of riskaggregations and accumulations and, at times, through the use of retrocessional reinsurance protection and thepurchase of credit default swaps and total return and interest rate swaps. At December 31, 2011, the Companypurchased protection related to its investment portfolio and credit/surety line primarily in the form of creditdefault swaps with a notional value of $95 million and an unrealized loss of $1 million.
The Company is subject to the credit risk of its cedants in the event of their insolvency or their failure tohonor the value of the funds held balances due to the Company for any other reason. However, the Company’scredit risk in some jurisdictions is mitigated by a mandatory right of offset of amounts payable by the Companyto a cedant against amounts due to the Company. In certain other jurisdictions the Company is able to mitigatethis risk, depending on the nature of the funds held arrangements, to the extent that the Company has thecontractual ability to offset any shortfall in the payment of the funds held balances with amounts owed by theCompany to cedants for losses payable and other amounts contractually due. Funds held balances for which theCompany receives an investment return based upon either the results of a pool of assets held by the cedant or theinvestment return earned by the cedant on its investment portfolio are exposed to an additional layer of creditrisk. The Company is also exposed to some extent to the underlying financial market risk of the pool of assets,inasmuch as the underlying policies may have guaranteed minimum returns.
The funds held – directly managed account due to the Company is related to one cedant, Colisée Re (seeInvestments underlying the Funds Held – Directly Managed Account in Item 1 of Part I of this report). TheCompany is subject to the credit risk of this cedant in the event of insolvency or Colisée Re’s failure to honor thevalue of the funds held balances for any other reason. However, the Company’s credit risk is somewhat mitigatedby the fact that the Company generally has the right to offset any shortfall in the payment of the funds heldbalances with amounts owed by the Company to the cedant for losses payable and other amounts contractuallydue. See also Risk Factors in Item 1A of Part I of this report for additional discussion of the Company’s exposureif Colisée Re, or its affiliates, breach or do not satisfy their obligations. In addition to exposure to Colisée Re, theCompany is also subject to the credit risk of AXA or its affiliates in the event of their insolvency or their failureto honor their obligations under the acquisition agreements.
The Company has exposure to credit risk as it relates to its business written through brokers if any of theCompany’s brokers is unable to fulfill their contractual obligations with respect to payments to the Company. Inaddition, in some jurisdictions, if the broker fails to make payments to the insured under the Company’s policy,the Company might remain liable to the insured for the deficiency. The Company’s exposure to such credit riskis somewhat mitigated in certain jurisdictions by contractual terms. See Risk Factors in Item 1A of Part I of thisreport for information related to two brokers that accounted for approximately 47% of the Company’s grosspremiums written for the year ended December 31, 2011.
The Company has exposure to credit risk as it relates to its reinsurance balances receivable and reinsurancerecoverable on paid and unpaid losses. Reinsurance balances receivable from the Company’s clients at
139

December 31, 2011 were $2,060 million, including balances both currently due and accrued. The Companybelieves that credit risk related to these balances is mitigated by several factors, including but not limited to,credit checks performed as part of the underwriting process and monitoring of aged receivable balances. Inaddition, as the majority of its reinsurance agreements permit the Company the right to offset reinsurancebalances receivable from clients against losses payable to them, the Company believes that the credit risk in thisarea is substantially reduced. Provisions are made for amounts considered potentially uncollectible and theallowance for uncollectible reinsurance balances receivable was $8 million at December 31, 2011.
The Company purchases retrocessional reinsurance and requires its reinsurers to have adequate financialstrength. The Company evaluates the financial condition of its reinsurers and monitors its concentration of creditrisk on an ongoing basis. Provisions are made for amounts considered potentially uncollectible. At December 31,2011, the balance of reinsurance recoverable on paid and unpaid losses was $363 million, which is net of theallowance provided for uncollectible reinsurance recoverables of $12 million. At December 31, 2011, 86% of theCompany’s reinsurance recoverable on paid and unpaid losses were either due from reinsurers with an A- orbetter rating from Standard & Poor’s or from reinsurers with collateralized balances. See Financial Condition,Liquidity and Capital Resources—Reinsurance Recoverable on Paid and Unpaid Losses above for details of theCompany’s reinsurance recoverable on paid and unpaid losses categorized by the reinsurer’s Standard & Poor’srating.
Other than the items discussed above, the concentrations of the Company’s counterparty credit riskexposures have not changed materially at December 31, 2011, compared to December 31, 2010.
Equity Price Risk
The Company invests a portion of its capital funds in marketable equity securities (fair market value of $701million, excluding funds holding fixed income securities of $244 million) at December 31, 2011. These equityinvestments are exposed to equity price risk, defined as the potential for loss in market value due to a decline inequity prices. The Company believes that the effects of diversification and the relatively small size of itsinvestments in equities relative to total invested assets mitigate its exposure to equity price risk. The Companyestimates that its equity investment portfolio has a beta versus the S&P 500 Index of approximately 1.01 onaverage. Portfolio beta measures the response of a portfolio’s performance relative to a market return, where abeta of 1 would be an equivalent return to the index. Given the estimated beta for the Company’s equityportfolio, a 10% and 20% movement in the S&P 500 Index would result in a change in the fair value of theCompany’s equity portfolio, total invested assets and shareholders’ equity at December 31, 2011 as follows (inmillions of U.S. dollars):
20%Decrease
%Change
10%Decrease
%Change
December 31,2011
10%Increase
%Change
20%Increase
%Change
Equities (1) . . . . . . . . . . . . . . $ 559 (20)% $ 630 (10)% $ 701 $ 772 10% $ 843 20%Total invested assets (2) . . . . 17,925 (1) 17,996 — 18,067 18,138 — 18,209 1Shareholders’ equity . . . . . 6,326 (2) 6,397 (1) 6,468 6,539 1 6,610 2
(1) Excludes funds holding fixed income securities of $244 million.(2) Includes total investments, cash and cash equivalents, the investment portfolio underlying the funds held –
directly managed account and accrued interest.
This change does not take into account any potential mitigating impact from the fixed income securities ortaxes.
The absolute impact of a 10% change in the S&P 500 Index on the Company’s equity portfolio, totalinvested assets and shareholders’ equity decreased to $71 million at December 31, 2011 compared to $114million at December 31, 2010, as a result of the decrease in the fair value of the equity portfolio, excluding funds
140

holding fixed income securities, to $701 million at December 31, 2011 from $1,031 million at December 31,2010. There was no material change in the percentage impact of an immediate change of 10% in the S&P 500Index on the Company’s total invested assets and shareholders’ equity at December 31, 2011 compared toDecember 31, 2010.
141

ITEM 8. FINANCIAL STATEMENTS AND SUPPLEMENTARY DATA
PartnerRe Ltd.
Consolidated Balance Sheets(Expressed in thousands of U.S. dollars, except parenthetical share and per share data)
December 31,2011
December 31,2010
AssetsInvestments:Fixed maturities, trading securities, at fair value (amortized cost: 2011, $13,394,404; 2010,
$12,394,797) . . . . . . . . . . . . . . . . . . . . . . . . . . . . . . . . . . . . . . . . . . . . . . . . . . . . . . . . . . . . . . . $13,941,829 $12,824,389Short-term investments, trading securities, at fair value (amortized cost: 2011, $42,563; 2010,
$49,132) . . . . . . . . . . . . . . . . . . . . . . . . . . . . . . . . . . . . . . . . . . . . . . . . . . . . . . . . . . . . . . . . . . 42,571 49,397Equities, trading securities, at fair value (cost: 2011, $917,613; 2010, $942,745) . . . . . . . . . . . . 944,691 1,071,676Other invested assets . . . . . . . . . . . . . . . . . . . . . . . . . . . . . . . . . . . . . . . . . . . . . . . . . . . . . . . . . . . 358,154 352,405
Total investments . . . . . . . . . . . . . . . . . . . . . . . . . . . . . . . . . . . . . . . . . . . . . . . . . . . . . . . . . . . . 15,287,245 14,297,867Funds held – directly managed (cost: 2011, $1,241,222; 2010, $1,751,276) . . . . . . . . . . . . . . . . 1,268,010 1,772,118Cash and cash equivalents, at fair value, which approximates amortized cost . . . . . . . . . . . . . . . 1,342,257 2,111,084Accrued investment income . . . . . . . . . . . . . . . . . . . . . . . . . . . . . . . . . . . . . . . . . . . . . . . . . . . . . 189,074 201,928Reinsurance balances receivable . . . . . . . . . . . . . . . . . . . . . . . . . . . . . . . . . . . . . . . . . . . . . . . . . . 2,059,976 2,076,884Reinsurance recoverable on paid and unpaid losses . . . . . . . . . . . . . . . . . . . . . . . . . . . . . . . . . . . 397,788 382,878Funds held by reinsured companies . . . . . . . . . . . . . . . . . . . . . . . . . . . . . . . . . . . . . . . . . . . . . . . 796,290 937,032Deferred acquisition costs . . . . . . . . . . . . . . . . . . . . . . . . . . . . . . . . . . . . . . . . . . . . . . . . . . . . . . . 547,202 595,557Deposit assets . . . . . . . . . . . . . . . . . . . . . . . . . . . . . . . . . . . . . . . . . . . . . . . . . . . . . . . . . . . . . . . . 241,513 256,702Net tax assets . . . . . . . . . . . . . . . . . . . . . . . . . . . . . . . . . . . . . . . . . . . . . . . . . . . . . . . . . . . . . . . . . 66,574 14,960Goodwill . . . . . . . . . . . . . . . . . . . . . . . . . . . . . . . . . . . . . . . . . . . . . . . . . . . . . . . . . . . . . . . . . . . . 455,533 455,533Intangible assets . . . . . . . . . . . . . . . . . . . . . . . . . . . . . . . . . . . . . . . . . . . . . . . . . . . . . . . . . . . . . . 133,867 178,715Other assets . . . . . . . . . . . . . . . . . . . . . . . . . . . . . . . . . . . . . . . . . . . . . . . . . . . . . . . . . . . . . . . . . . 70,044 83,113
Total assets . . . . . . . . . . . . . . . . . . . . . . . . . . . . . . . . . . . . . . . . . . . . . . . . . . . . . . . . . . . . . . . . . . $22,855,373 $23,364,371
LiabilitiesUnpaid losses and loss expenses . . . . . . . . . . . . . . . . . . . . . . . . . . . . . . . . . . . . . . . . . . . . . . . . . . $11,273,091 $10,666,604Policy benefits for life and annuity contracts . . . . . . . . . . . . . . . . . . . . . . . . . . . . . . . . . . . . . . . . 1,645,662 1,750,410Unearned premiums . . . . . . . . . . . . . . . . . . . . . . . . . . . . . . . . . . . . . . . . . . . . . . . . . . . . . . . . . . . 1,448,841 1,599,139Other reinsurance balances payable . . . . . . . . . . . . . . . . . . . . . . . . . . . . . . . . . . . . . . . . . . . . . . . 443,873 491,194Deposit liabilities . . . . . . . . . . . . . . . . . . . . . . . . . . . . . . . . . . . . . . . . . . . . . . . . . . . . . . . . . . . . . 249,382 268,239Net tax liabilities . . . . . . . . . . . . . . . . . . . . . . . . . . . . . . . . . . . . . . . . . . . . . . . . . . . . . . . . . . . . . . 297,153 316,325Accounts payable, accrued expenses and other . . . . . . . . . . . . . . . . . . . . . . . . . . . . . . . . . . . . . . 208,840 244,552Debt related to senior notes . . . . . . . . . . . . . . . . . . . . . . . . . . . . . . . . . . . . . . . . . . . . . . . . . . . . . . 750,000 750,000Debt related to capital efficient notes . . . . . . . . . . . . . . . . . . . . . . . . . . . . . . . . . . . . . . . . . . . . . . 70,989 70,989
Total liabilities . . . . . . . . . . . . . . . . . . . . . . . . . . . . . . . . . . . . . . . . . . . . . . . . . . . . . . . . . . . . . . . 16,387,831 16,157,452
Shareholders’ EquityCommon shares (par value $1.00; issued: 2011, 84,766,693 shares; 2010, 84,033,089
shares) . . . . . . . . . . . . . . . . . . . . . . . . . . . . . . . . . . . . . . . . . . . . . . . . . . . . . . . . . . . . . . . . . . . . 84,767 84,033Preferred shares (par value $1.00; issued and outstanding: 2011, 35,750,000 shares; 2010,
20,800,000 shares; aggregate liquidation value: 2011, $893,750; 2010, $520,000) . . . . . . . . . 35,750 20,800Additional paid-in capital . . . . . . . . . . . . . . . . . . . . . . . . . . . . . . . . . . . . . . . . . . . . . . . . . . . . . . . 3,803,796 3,419,864Accumulated other comprehensive (loss) income:
Currency translation adjustment . . . . . . . . . . . . . . . . . . . . . . . . . . . . . . . . . . . . . . . . . . . . . . 4,267 16,101Other accumulated comprehensive loss (net of tax of: 2011, $6,590; 2010, $4,872) . . . . . . (16,911) (12,045)
Retained earnings . . . . . . . . . . . . . . . . . . . . . . . . . . . . . . . . . . . . . . . . . . . . . . . . . . . . . . . . . . . . . 4,035,103 4,761,178Common shares held in treasury, at cost (2011, 19,444,365 shares; 2010, 14,046,895
shares) . . . . . . . . . . . . . . . . . . . . . . . . . . . . . . . . . . . . . . . . . . . . . . . . . . . . . . . . . . . . . . . . . . . . (1,479,230) (1,083,012)
Total shareholders’ equity . . . . . . . . . . . . . . . . . . . . . . . . . . . . . . . . . . . . . . . . . . . . . . . . . . . . . 6,467,542 7,206,919
Total liabilities and shareholders’ equity . . . . . . . . . . . . . . . . . . . . . . . . . . . . . . . . . . . . . . . . . $22,855,373 $23,364,371
See accompanying Notes to Consolidated Financial Statements.
142

PartnerRe Ltd.
Consolidated Statements of Operations and Comprehensive (Loss) Income(Expressed in thousands of U.S. dollars, except share and per share data)
For the year endedDecember 31,
2011
For the year endedDecember 31,
2010
For the year endedDecember 31,
2009
RevenuesGross premiums written . . . . . . . . . . . . . . . . . . . . . . . . . . . . $ 4,633,054 $ 4,885,266 $ 4,000,888
Net premiums written . . . . . . . . . . . . . . . . . . . . . . . . . . . . . . $ 4,486,329 $ 4,705,116 $ 3,948,704Decrease in unearned premiums . . . . . . . . . . . . . . . . . . . . . . 161,425 71,355 171,121
Net premiums earned . . . . . . . . . . . . . . . . . . . . . . . . . . . . . . 4,647,754 4,776,471 4,119,825Net investment income . . . . . . . . . . . . . . . . . . . . . . . . . . . . . 629,148 672,782 596,071Net realized and unrealized investment gains . . . . . . . . . . . . 66,692 401,482 591,707Net realized gain on purchase of capital efficient notes . . . . — — 88,427Other income . . . . . . . . . . . . . . . . . . . . . . . . . . . . . . . . . . . . . 7,915 10,470 22,312
Total revenues . . . . . . . . . . . . . . . . . . . . . . . . . . . . . . . . . . . 5,351,509 5,861,205 5,418,342
ExpensesLosses and loss expenses and life policy benefits . . . . . . . . . 4,372,570 3,283,618 2,295,296Acquisition costs . . . . . . . . . . . . . . . . . . . . . . . . . . . . . . . . . . 938,361 972,537 885,214Other operating expenses . . . . . . . . . . . . . . . . . . . . . . . . . . . 434,846 539,751 430,808Interest expense . . . . . . . . . . . . . . . . . . . . . . . . . . . . . . . . . . . 48,949 44,413 28,301Amortization of intangible assets . . . . . . . . . . . . . . . . . . . . . 36,405 31,461 (6,133)Net foreign exchange (gains) losses . . . . . . . . . . . . . . . . . . . (34,675) 20,686 1,464
Total expenses . . . . . . . . . . . . . . . . . . . . . . . . . . . . . . . . . . . 5,796,456 4,892,466 3,634,950(Loss) income before taxes and interest in (losses) earnings
of equity investments . . . . . . . . . . . . . . . . . . . . . . . . . . . . (444,947) 968,739 1,783,392Income tax expense . . . . . . . . . . . . . . . . . . . . . . . . . . . . . . . . 68,972 128,784 262,090Interest in (losses) earnings of equity investments . . . . . . . . (6,372) 12,597 15,552
Net (loss) income . . . . . . . . . . . . . . . . . . . . . . . . . . . . . . . . . (520,291) 852,552 1,536,854Preferred dividends . . . . . . . . . . . . . . . . . . . . . . . . . . . . . . . . 47,020 34,525 34,525
Net (loss) income available to common shareholders . . . $ (567,311) $ 818,027 $ 1,502,329
Comprehensive (loss) incomeNet (loss) income . . . . . . . . . . . . . . . . . . . . . . . . . . . . . . . . . $ (520,291) $ 852,552 $ 1,536,854Change in currency translation adjustment . . . . . . . . . . . . . . (11,834) (66,742) 47,955Change in other accumulated comprehensive (loss) income,
net of tax . . . . . . . . . . . . . . . . . . . . . . . . . . . . . . . . . . . . . . (4,866) (14,129) 14,164
Comprehensive (loss) income . . . . . . . . . . . . . . . . . . . . . . . $ (536,991) $ 771,681 $ 1,598,973
Per share dataNet (loss) income per common share:Basic net (loss) income . . . . . . . . . . . . . . . . . . . . . . . . . . . . . $ (8.40) $ 10.65 $ 23.93Diluted net (loss) income . . . . . . . . . . . . . . . . . . . . . . . . . . . $ (8.40) $ 10.46 $ 23.51Weighted average number of common shares
outstanding . . . . . . . . . . . . . . . . . . . . . . . . . . . . . . . . . . . . 67,558,732 76,839,519 62,786,234Weighted average number of common shares and common
share equivalents outstanding . . . . . . . . . . . . . . . . . . . . . . 67,558,732 78,234,312 63,890,638Dividends declared per common share . . . . . . . . . . . . . . . . . $ 2.35 $ 2.05 $ 1.88
See accompanying Notes to Consolidated Financial Statements.
143

PartnerRe Ltd.
Consolidated Statements of Shareholders’ Equity(Expressed in thousands of U.S. dollars)
For the year endedDecember 31,
2011
For the year endedDecember 31,
2010
For the year endedDecember 31,
2009
Common sharesBalance at beginning of year . . . . . . . . . . . . . . . . . . . . . . . $ 84,033 $ 82,586 $ 57,749Issuance of common shares, other . . . . . . . . . . . . . . . . . . . 734 1,447 476Issuance of common shares related to the acquisition of
Paris Re . . . . . . . . . . . . . . . . . . . . . . . . . . . . . . . . . . . . . — — 24,361
Balance at end of year . . . . . . . . . . . . . . . . . . . . . . . . . . . . 84,767 84,033 82,586
Preferred sharesBalance at beginning of year . . . . . . . . . . . . . . . . . . . . . . . 20,800 20,800 20,800Issuance of preferred shares . . . . . . . . . . . . . . . . . . . . . . . 14,950 — —
Balance at end of year . . . . . . . . . . . . . . . . . . . . . . . . . . . . 35,750 20,800 20,800
Additional paid-in capitalBalance at beginning of year . . . . . . . . . . . . . . . . . . . . . . . 3,419,864 3,357,004 1,465,688Issuance of preferred shares . . . . . . . . . . . . . . . . . . . . . . . 346,772 — —Issuance of common shares, other . . . . . . . . . . . . . . . . . . . 37,160 62,860 33,261Issuance of common shares related to the acquisition of
Paris Re . . . . . . . . . . . . . . . . . . . . . . . . . . . . . . . . . . . . . — — 1,858,055
Balance at end of year . . . . . . . . . . . . . . . . . . . . . . . . . . . . 3,803,796 3,419,864 3,357,004
Accumulated other comprehensive (loss) incomeBalance at beginning of year . . . . . . . . . . . . . . . . . . . . . . . 4,056 84,927 22,808Change in currency translation adjustment . . . . . . . . . . . . (11,834) (66,742) 47,955Change in other accumulated comprehensive (loss)
income . . . . . . . . . . . . . . . . . . . . . . . . . . . . . . . . . . . . . . (4,866) (14,129) 14,164
Balance at end of year . . . . . . . . . . . . . . . . . . . . . . . . . . . . (12,644) 4,056 84,927
Retained earningsBalance at beginning of year . . . . . . . . . . . . . . . . . . . . . . . 4,761,178 4,100,782 2,729,662Net (loss) income . . . . . . . . . . . . . . . . . . . . . . . . . . . . . . . . (520,291) 852,552 1,536,854Dividends on common shares . . . . . . . . . . . . . . . . . . . . . . (158,764) (157,631) (117,326)Dividends on preferred shares . . . . . . . . . . . . . . . . . . . . . . (47,020) (34,525) (34,525)Reissuance of treasury shares related to the acquisition of
Paris Re . . . . . . . . . . . . . . . . . . . . . . . . . . . . . . . . . . . . . — — (13,883)
Balance at end of year . . . . . . . . . . . . . . . . . . . . . . . . . . . . 4,035,103 4,761,178 4,100,782
Common shares held in treasuryBalance at beginning of year . . . . . . . . . . . . . . . . . . . . . . . (1,083,012) (372) (97,599)Repurchase of common shares . . . . . . . . . . . . . . . . . . . . . (396,218) (1,082,640) —Reissuance of treasury shares related to the acquisition of
Paris Re . . . . . . . . . . . . . . . . . . . . . . . . . . . . . . . . . . . . . — — 97,227
Balance at end of year . . . . . . . . . . . . . . . . . . . . . . . . . . . . (1,479,230) (1,083,012) (372)
Total shareholders’ equity . . . . . . . . . . . . . . . . . . . . . . . $ 6,467,542 $ 7,206,919 $7,645,727
See accompanying Notes to Consolidated Financial Statements.
144

PartnerRe Ltd.
Consolidated Statements of Cash Flows(Expressed in thousands of U.S. dollars)
For the year endedDecember 31,
2011
For the year endedDecember 31,
2010
For the year endedDecember 31,
2009
Cash flows from operating activitiesNet (loss) income . . . . . . . . . . . . . . . . . . . . . . . . . . . . . . . . . . . . . . . . $ (520,291) $ 852,552 $ 1,536,854Adjustments to reconcile net (loss) income to net cash provided by
operating activities:Amortization of net premium on investments . . . . . . . . . . . . . . . . . . 91,339 78,620 17,312Amortization of intangible assets . . . . . . . . . . . . . . . . . . . . . . . . . . . . 36,405 31,461 (6,133)Net realized and unrealized investment gains . . . . . . . . . . . . . . . . . . (66,692) (401,482) (591,707)Net realized gain on purchase of capital efficient notes . . . . . . . . . . . — — (88,427)Changes in:Reinsurance balances, net . . . . . . . . . . . . . . . . . . . . . . . . . . . . . . . . . . (21,036) 217,066 170,986Reinsurance recoverable on paid and unpaid losses, net of ceded
premiums payable . . . . . . . . . . . . . . . . . . . . . . . . . . . . . . . . . . . . . . 625 (30,033) (20,836)Funds held by reinsured companies and funds held – directly
managed . . . . . . . . . . . . . . . . . . . . . . . . . . . . . . . . . . . . . . . . . . . . . 606,266 296,174 54,416Deferred acquisition costs . . . . . . . . . . . . . . . . . . . . . . . . . . . . . . . . . 52,069 35,317 67,899Net tax assets and liabilities . . . . . . . . . . . . . . . . . . . . . . . . . . . . . . . . (58,970) (56,599) 208,052Unpaid losses and loss expenses including life policy benefits . . . . . 606,698 227,240 (112,108)Unearned premiums . . . . . . . . . . . . . . . . . . . . . . . . . . . . . . . . . . . . . . (161,425) (71,355) (171,121)Other net changes in operating assets and liabilities . . . . . . . . . . . . . 8,647 47,959 33,414
Net cash provided by operating activities . . . . . . . . . . . . . . . . . . . . 573,635 1,226,920 1,098,601
Cash flows from investing activitiesSales of fixed maturities . . . . . . . . . . . . . . . . . . . . . . . . . . . . . . . . . . . 8,328,352 8,621,227 7,271,909Redemptions of fixed maturities . . . . . . . . . . . . . . . . . . . . . . . . . . . . . 1,211,016 1,272,885 1,065,353Purchases of fixed maturities . . . . . . . . . . . . . . . . . . . . . . . . . . . . . . . (10,549,343) (8,572,471) (9,039,313)Sales and redemptions of short-term investments . . . . . . . . . . . . . . . 336,456 270,087 201,479Purchases of short-term investments . . . . . . . . . . . . . . . . . . . . . . . . . (331,432) (141,157) (182,211)Sales of equities . . . . . . . . . . . . . . . . . . . . . . . . . . . . . . . . . . . . . . . . . 730,929 607,459 688,360Purchases of equities . . . . . . . . . . . . . . . . . . . . . . . . . . . . . . . . . . . . . (619,533) (769,557) (826,246)Cash acquired related to the acquisition of Paris Re (1) . . . . . . . . . . . . — — 492,466Other, net . . . . . . . . . . . . . . . . . . . . . . . . . . . . . . . . . . . . . . . . . . . . . . (186,823) (185,965) (118,473)
Net cash (used in) provided by investing activities . . . . . . . . . . . . (1,080,378) 1,102,508 (446,676)
Cash flows from financing activitiesCash dividends paid to shareholders . . . . . . . . . . . . . . . . . . . . . . . . . (205,784) (192,156) (151,851)Net proceeds from issuance of preferred shares . . . . . . . . . . . . . . . . . 361,722 — —Repurchase of common shares . . . . . . . . . . . . . . . . . . . . . . . . . . . . . . (413,737) (1,065,121) —Issuance of common shares . . . . . . . . . . . . . . . . . . . . . . . . . . . . . . . . 16,041 37,682 16,034Proceeds from issuance of senior notes . . . . . . . . . . . . . . . . . . . . . . . — 500,000 —Contract fees on forward sale agreement . . . . . . . . . . . . . . . . . . . . . . — (2,638) (5,070)Repayment of debt . . . . . . . . . . . . . . . . . . . . . . . . . . . . . . . . . . . . . . . — (200,000) (200,000)Share capital repayment paid to former shareholders of Paris Re . . . — — (330,103)Purchase of capital efficient notes . . . . . . . . . . . . . . . . . . . . . . . . . . . — — (94,241)
Net cash used in financing activities . . . . . . . . . . . . . . . . . . . . . . . . (241,758) (922,233) (765,231)Effect of foreign exchange rate changes on cash . . . . . . . . . . . . . . (20,326) (34,420) 13,335(Decrease) increase in cash and cash equivalents . . . . . . . . . . . . . (768,827) 1,372,775 (99,971)Cash and cash equivalents – beginning of year . . . . . . . . . . . . . . . 2,111,084 738,309 838,280
Cash and cash equivalents – end of year . . . . . . . . . . . . . . . . . . . . $ 1,342,257 $ 2,111,084 $ 738,309
Supplemental cash flow information:Taxes paid . . . . . . . . . . . . . . . . . . . . . . . . . . . . . . . . . . . . . . . . . . . . . . $ 197,610 $ 199,838 $ 118,174Interest paid . . . . . . . . . . . . . . . . . . . . . . . . . . . . . . . . . . . . . . . . . . . . $ 49,259 $ 42,995 $ 32,476
(1) The acquisition of Paris Re’s assets and liabilities involved non-cash share for share transactions, which have beenexcluded from the Consolidated Statements of Cash Flows.
145

PartnerRe Ltd.
Notes to Consolidated Financial Statements
1. Organization
PartnerRe Ltd. (the Company) provides reinsurance on a worldwide basis through its principal wholly-owned subsidiaries, including Partner Reinsurance Company Ltd. (PartnerRe Bermuda), Partner ReinsuranceEurope plc (PartnerRe Europe) and Partner Reinsurance Company of the U.S (PartnerRe U.S.). Risks reinsuredinclude, but are not limited to, property, casualty, motor, agriculture, aviation/space, catastrophe, credit/surety,engineering, energy, marine, specialty property, specialty casualty, multiline and other lines, mortality, longevityand health and alternative risk products. The Company’s alternative risk products include weather and creditprotection to financial, industrial and service companies on a worldwide basis.
The Company was incorporated in August 1993 under the laws of Bermuda. The Company commencedoperations in November 1993 upon completion of the sale of common shares and warrants pursuant tosubscription agreements and an initial public offering.
In July 1997, the Company completed the acquisition of SAFR (subsequently renamed PartnerRe SA), andin December 1998, the Company completed the acquisition of the reinsurance operations of Winterthur Group(Winterthur Re).
Effective October 2, 2009, the Company obtained a controlling interest in PARIS RE Holdings Limited(Paris Re), a French-listed, Swiss-based holding company and its operating subsidiaries. Subsequent toOctober 2, 2009, the Company acquired additional common shares of Paris Re and effected a statutory merger(Merger), resulting in the Company obtaining 100% ownership of Paris Re on December 7, 2009. TheConsolidated Statements of Operations and Cash Flows include the results of Paris Re for the period fromOctober 2, 2009, the date of acquisition of the controlling interest (Acquisition Date) (see Note 7).
2. Significant Accounting Policies
The Company’s Consolidated Financial Statements have been prepared in accordance with accountingprinciples generally accepted in the United States (U.S. GAAP). The Consolidated Financial Statements includethe accounts of the Company and its subsidiaries. Intercompany accounts and transactions have been eliminated.To facilitate comparison of information across periods, certain reclassifications have been made to prior yearamounts to conform to the current year’s presentation.
The preparation of financial statements in conformity with U.S. GAAP requires Management to makeestimates and assumptions that affect the reported amounts of assets and liabilities at the date of the financialstatements and the reported amounts of revenues and expenses during the reporting period. While Managementbelieves that the amounts included in the Consolidated Financial Statements reflect its best estimates andassumptions, actual results could differ from those estimates. The Company’s principal estimates include:
• Unpaid losses and loss expenses;
• Policy benefits for life and annuity contracts;
• Gross and net premiums written and net premiums earned;
• Recoverability of deferred acquisition costs;
• Recoverability of deferred tax assets;
• Valuation of goodwill and intangible assets; and
• Valuation of certain assets and derivative financial instruments that are measured using significantunobservable inputs.
146

The following are the Company’s significant accounting policies:
(a) Premiums
Gross premiums written and earned are based upon reports received from ceding companies, supplementedby the Company’s own estimates of premiums written and earned for which ceding company reports have notbeen received. The determination of premium estimates requires a review of the Company’s experience withcedants, familiarity with each market, an understanding of the characteristics of each line of business andManagement’s assessment of the impact of various other factors on the volume of business written and ceded tothe Company. Premium estimates are updated as new information is received from cedants and differencesbetween such estimates and actual amounts are recorded in the period in which the estimates are changed or theactual amounts are determined. Net premiums written and earned are presented net of ceded premiums, whichrepresent the cost of retrocessional protection purchased by the Company. Premiums are earned on a basis that isconsistent with the risks covered under the terms of the reinsurance contracts, which is generally one to twoyears. For U.S. and European wind and certain other risks, premiums are earned commensurate with theseasonality of the underlying exposure. Reinstatement premiums are recognized as written and earned at the timea loss event occurs, where coverage limits for the remaining life of the contract are reinstated under pre-definedcontract terms. The accrual of reinstatement premiums is based on Management’s estimate of losses and lossexpenses associated with the loss event. Unearned premiums represent the portion of premiums written which isapplicable to the unexpired risks under contracts in force.
Premiums related to individual life and annuity business are recorded over the premium-paying period onthe underlying policies. Premiums on annuity and universal life contracts for which there is no significantmortality or critical illness risk are accounted for in a manner consistent with accounting for interest-bearingfinancial instruments and are not reported as revenues, but rather as direct deposits to the contract. Amountsassessed against annuity and universal life policyholders are recognized as revenue in the period assessed.
(b) Losses and Loss Expenses and Life Policy Benefits
The liability for unpaid losses and loss expenses includes amounts determined from loss reports onindividual treaties (case reserves), additional case reserves when the Company’s loss estimate is higher thanreported by the cedants (ACRs) and amounts for losses incurred but not yet reported to the Company (IBNR).Such reserves are estimated by Management based upon reports received from ceding companies, supplementedby the Company’s own actuarial estimates of reserves for which ceding company reports have not been received,and based on the Company’s own historical experience. To the extent that the Company’s own historicalexperience is inadequate for estimating reserves, such estimates may be determined based upon industryexperience and Management’s judgment. The estimates are continually reviewed and the ultimate liability maybe in excess of, or less than, the amounts provided. Any adjustments are reflected in the periods in which they aredetermined, which may affect the Company’s operating results in future periods.
The liabilities for policy benefits for ordinary life and accident and health policies have been establishedbased upon information reported by ceding companies, supplemented by the Company’s actuarial estimates ofmortality, critical illness, persistency and future investment income, with appropriate provision to reflectuncertainty. Future policy benefit reserves for annuity and universal life contracts are carried at their accumulatedvalues. Reserves for policy claims and benefits include both mortality and critical illness claims in the process ofsettlement, and claims that have been incurred but not yet reported.
The Company purchases retrocessional contracts to reduce its exposure to risk of losses on reinsuranceassumed. Reinsurance recoverable on paid and unpaid losses involves actuarial estimates consistent with thoseused to establish the associated liabilities for unpaid losses and loss expenses and life policy benefits.
147

(c) Deferred Acquisition Costs
Acquisition costs, primarily brokerage fees, commissions and excise taxes, which vary directly with, and arerelated to, the acquisition of reinsurance contracts, are capitalized and charged to expense as the related premiumis earned.
Acquisition costs related to individual life and annuity contracts are deferred and amortized over thepremium-paying periods in proportion to anticipated premium income, allowing for lapses, terminations andanticipated investment income. Acquisition costs related to universal life and single premium annuity contractsfor which there is no significant mortality or critical illness risk are deferred and amortized over the lives of thecontracts as a percentage of the estimated gross profits expected to be realized on the contracts.
Actual and anticipated losses and loss expenses, other costs and investment income related to underlyingpremiums are considered in determining the recoverability of Non-life deferred acquisition costs. Actual andanticipated loss experience, together with the present value of future gross premiums, the present value of futurebenefits, settlement and maintenance costs are considered in determining the recoverability of life deferredacquisition costs.
(d) Funds Held by Reinsured Companies (Cedants)
The Company writes certain business on a funds held basis. Under such contractual arrangements, thecedant retains the premiums that would have otherwise been paid to the Company and the Company earnsinterest on these funds. With the exception of those arrangements discussed below, the Company generally earnsinvestment income on the funds held balances based upon a predetermined interest rate, either fixed contractuallyat the inception of the contract or based upon a recognized index (e.g., LIBOR).
In certain circumstances, the Company may receive an investment return based upon either the result of apool of assets held by the cedant, generally used to collateralize the funds held balance, or the investment returnearned by the cedant on its entire investment portfolio. This is most common in the Company’s life reinsurancebusiness. In these arrangements, gross investment returns are typically reflected in net investment income with acorresponding increase or decrease (net of a spread) being recorded as life policy benefits in the Company’sConsolidated Statements of Operations. In these arrangements, the Company is exposed, to a limited extent, tothe underlying credit risk of the pool of assets inasmuch as the underlying life policies may have guaranteedminimum returns. In such cases, an embedded derivative exists and its fair value is recorded by the Company asan increase or decrease to the funds held balance.
(e) Deposit Assets and Liabilities
In the normal course of its operations, the Company writes certain contracts that do not meet the risktransfer provisions of U.S. GAAP. While these contracts do not meet risk transfer provisions for accountingpurposes, there is a remote possibility that the Company will suffer a loss. The Company accounts for thesecontracts using the deposit accounting method, originally recording deposit liabilities for an amount equivalent tothe consideration received. The consideration to be retained by the Company, irrespective of the experience ofthe contracts, is earned over the expected settlement period of the contracts, with any unearned portion recordedas a component of deposit liabilities. Actuarial studies are used to estimate the final liabilities under thesecontracts and the appropriate accretion rates to increase or decrease the liabilities over the term of the contracts.The change for the period is recorded in other income or loss in the Consolidated Statements of Operations.
Under some of these contracts, cedants retain the assets on a funds-held basis. In those cases, the Companyrecords those assets as deposit assets and records the related income in net investment income in theConsolidated Statements of Operations.
148

(f) Investments
The Company elects the fair value option for all of its fixed maturities, short-term investments, equities andcertain other invested assets (excluding those that are accounted for using the cost or equity methods ofaccounting or investment company accounting). The Company defines fair value as the price received to sell anasset or paid to transfer a liability in an orderly transaction between market participants at the measurement date.The Company measures the fair value of financial instruments according to a fair value hierarchy that prioritizesthe information used to measure fair value into three broad levels. Following the election of the fair value optionfor an eligible item, changes in that item’s fair value in subsequent reporting periods must be recognized inearnings. See Note 3 for additional information on fair value.
The Company elected the fair value option as of the Acquisition Date for all of Paris Re’s fixed maturitiesand short-term investments and certain other invested assets.
Short-term investments comprise securities with a maturity greater than three months but less than one yearfrom the date of purchase.
Other invested assets consist primarily of investments in non-publicly traded companies, private placementequity and fixed maturity investments, derivative financial instruments and other specialty asset classes. Entitiesin which the Company has an ownership of more than 20% and less than 50% of the voting shares, and limitedpartnerships in which the Company has more than a minor interest, are accounted for using the equity method.Other invested assets are recorded based on valuation techniques depending on the nature of the individual assets.The valuation techniques used by the Company are generally commensurate with standard valuation techniquesfor each asset class.
Net investment income includes interest and dividend income, amortization of premiums and discounts onfixed maturities and short-term investments and investment income on funds held and funds held – directlymanaged, and is net of investment expenses and withholding taxes. Investment income is recognized whenearned. Realized gains and losses on the disposal of investments are determined on a first-in, first-out basis.Investment purchases and sales are recorded on a trade-date basis.
(g) Funds Held - Directly Managed
The Company elected the fair value option as of the Acquisition Date of Paris Re for substantially all of thefixed maturities, short-term investments and certain other invested assets in the segregated investment portfoliounderlying the funds held – directly managed account, and accordingly, all changes in the fair value of thesegregated investment portfolio underlying the funds held – directly managed account subsequent to theAcquisition Date are recorded in net realized and unrealized investment gains and losses in the ConsolidatedStatements of Operations.
(h) Cash and Cash Equivalents
Cash equivalents are carried at fair value and include debt securities that, at purchase, have a maturity ofthree months or less.
(i) Business Combinations
The Company obtained control of Paris Re on the Acquisition Date. The transaction was accounted for as anacquisition method business combination with the purchase price allocated to identifiable assets and liabilities,including certain intangible assets, based on their estimated fair value at the Acquisition Date. The fair value ofnoncontrolling interests was also recorded at fair value at the Acquisition Date. The estimates of fair values forassets and liabilities assumed were determined by management based on various market and income analyses andappraisals. All costs associated with the acquisition were expensed as incurred.
149

(j) Goodwill
Goodwill represents the excess of the purchase price over the fair value of the net assets acquired ofPartnerRe SA, Winterthur Re and Paris Re. The Company assesses the appropriateness of its valuation ofgoodwill on at least an annual basis. If, as a result of the assessment, the Company determines that the value ofits goodwill is impaired, goodwill will be written down in the period in which the determination is made.
(k) Intangible Assets
Intangible assets represent the fair value adjustments related to unpaid losses and loss expenses andunearned premiums, as well as the fair values of renewal rights and U.S. licenses all arising from the acquisitionof Paris Re. Definite-lived intangible assets are amortized over their useful lives, generally ranging from two toeleven years. The Company recognizes the amortization of all intangible assets in the Consolidated Statement ofOperations. Indefinite-lived intangible assets are not subject to amortization. The carrying values of intangibleassets are regularly reviewed for indicators of impairment. Impairment is recognized if the carrying value of theintangible assets is not recoverable from its undiscounted cash flows and is measured as the difference betweenthe carrying value and the fair value.
(l) Income Taxes
Certain subsidiaries and branches of the Company operate in jurisdictions where they are subject to taxation.Current and deferred income taxes are charged or credited to net income, or, in certain cases, to accumulatedother comprehensive income, based upon enacted tax laws and rates applicable in the relevant jurisdiction in theperiod in which the tax becomes accruable or realizable. Deferred income taxes are provided for all temporarydifferences between the bases of assets and liabilities used in the Consolidated Balance Sheets and those used inthe various jurisdictional tax returns. When Management’s assessment indicates that it is more likely than notthat deferred income tax assets will not be realized, a valuation allowance is recorded against the deferred taxassets.
The Company recognizes a tax benefit relating to uncertain tax positions only where the position is morelikely than not to be sustained assuming examination by tax authorities. A liability must be recognized for anytax benefit (along with any interest and penalty, if applicable) claimed in a tax return in excess of the amountallowed to be recognized in the financial statements under U.S. GAAP. Any changes in amounts recognized arerecorded in the period in which they are determined.
(m) Translation of Foreign Currencies
The reporting currency of the Company is the U.S. dollar. The national currencies of the Company’ssubsidiaries and branches are generally their functional currencies, except for the Company’s Bermudasubsidiaries and its Swiss subsidiaries and branch, whose functional currencies are the U.S. dollar. In translatingthe financial statements of those subsidiaries or branches whose functional currency is other than the U.S. dollar,assets and liabilities are converted into U.S. dollars using the rates of exchange in effect at the balance sheetdates, and revenues and expenses are converted using the average foreign exchange rates for the period. Theeffect of translation adjustments are reported in the Consolidated Balance Sheets as currency translationadjustment, a separate component of accumulated other comprehensive income.
In recording foreign currency transactions, revenue and expense items are converted into the functionalcurrency at the average rates of exchange for the period. Assets and liabilities originating in currencies other thanthe functional currency are translated into the functional currency at the rates of exchange in effect at the balancesheet dates. The resulting foreign exchange gains or losses are included in net foreign exchange gains and lossesin the Consolidated Statements of Operations. The Company also records realized and unrealized foreignexchange gains and losses on certain hedged items in net foreign exchange gains and losses in the ConsolidatedStatements of Operations (see Note 2(n)).
150

(n) Derivatives
Derivatives Used in Hedging Activities
The Company utilizes derivative financial instruments as part of its overall currency risk managementstrategy. The Company recognizes all derivative financial instruments, including embedded derivativeinstruments, as either assets or liabilities in the Consolidated Balance Sheets and measures those instruments atfair value. On the date the Company enters into a derivative contract, Management designates whether thederivative is to be used as a hedge of an identified underlying exposure (a designated hedge). The accounting forgains and losses associated with changes in the fair value of a derivative and the effect on the ConsolidatedFinancial Statements depends on its hedge designation and whether the hedge is highly effective in achievingoffsetting changes in the fair value of the asset or liability being hedged.
The derivatives employed by the Company to hedge currency exposure related to fixed income securitiesand derivatives employed by the Company to hedge currency exposure related to other reinsurance assets andliabilities, except for any hedges of the Company’s net investment in non-U.S. dollar functional currencysubsidiaries and branches, are not designated as hedges. The changes in fair value of these non-designated hedgesare recognized in net foreign exchange gains and losses in the Consolidated Statements of Operations.
As part of its overall strategy to manage its level of currency exposure, from time to time the Company usesforward foreign exchange derivatives to hedge or partially hedge the net investment in certain non-U.S. dollarfunctional currency subsidiaries and branches. These derivatives have been designated as net investment hedges,and accordingly, the changes in fair value of the derivative and the hedged item related to foreign currency arerecognized in currency translation adjustment in the Consolidated Balance Sheets. The Company also uses, fromtime to time, interest rate derivatives to mitigate exposure to interest rate volatility.
The Company formally documents all relationships between designated hedging instruments and hedgeditems, as well as its risk management objective and strategy for undertaking various hedge transactions. In thisdocumentation, the Company specifically identifies the asset or liability that has been designated as a hedgeditem and states how the hedging instrument is expected to hedge the risks related to the hedged item. TheCompany formally measures effectiveness of its designated hedging relationships, both at the hedge inceptionand on an ongoing basis. The Company assesses the effectiveness of its designated hedges using theperiod-to-period dollar offset method on an individual currency basis. If the ratio obtained with this method iswithin the range of 80% to 125%, the Company considers the hedge effective. The time value component of thedesignated net investment hedges is included in the assessment of hedge effectiveness.
The Company will discontinue hedge accounting prospectively if it is determined that the derivative is nolonger effective in offsetting changes in the fair value of a hedged item. To the extent that the Companydiscontinues hedge accounting related to its net investment in non-U.S. dollar functional currency of subsidiariesand branches, because, based on Management’s assessment, the derivative no longer qualifies as an effectivehedge, the derivative will continue to be carried in the Consolidated Balance Sheets at its fair value, with changesin its fair value recognized in net foreign exchange gains and losses.
Other Derivatives
The Company’s investment strategy allows for the use of derivative instruments, subject to strict limitations.The Company utilizes various derivative instruments such as foreign exchange forward contracts, foreigncurrency option contracts, futures contracts, to-be-announced mortgage-backed securities (TBAs) and creditdefault swaps, for the purpose of managing overall currency risk, market exposures and portfolio duration andhedging certain investments, or enhancing investment performance that would be allowed under the Company’sinvestment policy if implemented in other ways. These instruments are recorded at fair value as assets andliabilities in the Consolidated Balance Sheets. Changes in fair value are included in net realized and unrealizedinvestment gains and losses in the Consolidated Statements of Operations, except changes in the fair value of
151

foreign currency option contracts and foreign exchange forward contracts which are included in net foreignexchange gains and losses in the Consolidated Statements of Operations. Margin balances required bycounterparties, which are equal to a percentage of the total value of open futures contracts, are included in cashand cash equivalents.
The Company has entered into weather and longevity related transactions that are structured as derivatives,which are recorded at fair value with the changes in fair value reported in net realized and unrealized investmentgains and losses in the Consolidated Statements of Operations.
The Company has entered into total return and interest rate swaps. Margins related to these swaps areincluded in other income or loss in the Consolidated Statements of Operations and any changes in the fair valueof the swaps are included in net realized and unrealized investment gains and losses in the ConsolidatedStatements of Operations.
(o) Treasury Shares
Common shares repurchased by the Company and not cancelled are classified as treasury shares, and arerecorded at cost. This results in a reduction of shareholders’ equity in the Consolidated Balance Sheets. Whenshares are reissued from treasury, the Company uses the average cost method to determine the cost of thereissued shares. Gains on sales of treasury shares are credited to additional paid-in capital, while losses arecharged to additional paid-in capital to the extent that previous net gains from sales of treasury shares areincluded therein, otherwise losses are charged to retained earnings.
(p) Net Income per Common Share
Diluted net income per common share is defined as net income available to common shareholders dividedby the weighted average number of common shares and common share equivalents outstanding, calculated usingthe treasury stock method for all potentially dilutive securities. Net income available to common shareholders isdefined as net income less preferred share dividends. When the effect of dilutive securities would be anti-dilutive, these securities are excluded from the calculation of diluted net income per share. Basic net income pershare is defined as net income available to common shareholders divided by the weighted average number ofcommon shares outstanding for the period, giving no effect to dilutive securities.
(q) Share-Based Compensation
The Company currently uses five types of share-based compensation: share options, restricted shares (RS),restricted share units (RSUs), share-settled share appreciation rights (SSARs) and shares issued under theCompany’s employee share purchase plans.
The majority of the Company’s share-based compensation awards qualify for equity classification. The fairvalue of the compensation cost is measured at the grant date and is expensed over the period for which theemployee is required to provide services in exchange for the award. Forfeiture benefits are estimated at the timeof grant and incorporated in the determination of share-based compensation costs. Awards granted to employeeswho are eligible for retirement and do not have to provide additional services are expensed at the date of grant.
Those share-based compensation awards that do not meet the equity classification criteria, are classified asliability awards. Liability-classified awards are recorded at fair value in the Accounts payable, accrued expensesand other in the Consolidated Balance Sheets with changes in fair value relating to the vested portion of theaward recorded in the Consolidated Statements of Operations.
152

(r) Pensions
The Company recognizes an asset or a liability in the Consolidated Balance Sheets for the funded status ofits defined benefit plans that are overfunded or underfunded, respectively, measured as the difference betweenthe fair value of plan assets and the pension obligation and recognizes changes in the funded status of definedbenefit plans in the year in which the changes occur as a component of accumulated other comprehensive incomeor loss, net of tax.
(s) Variable Interest Entities
The Company is involved in the normal course of business with variable interest entities (VIEs) as a passiveinvestor in certain limited partnerships, fixed maturity investments and asset-backed securities, that are issued bythird party VIEs. Prior to January 1, 2010, under then effective guidance, the Company performed a quantitativeassessment upon initial involvement in a VIE to determine whether it was the primary beneficiary of, andrequired to consolidate, the VIE. Subsequent to January 1, 2010, in accordance with revised guidance, theCompany performs a qualitative assessment at the date when it becomes initially involved in the VIE followedby ongoing reassessments related to its involvement in VIEs. The Company’s maximum exposure to loss withrespect to these investments is limited to the investment carrying amounts reported in the Company’sConsolidated Balance Sheets and any unfunded commitments.
The Company also has three indirect wholly-owned subsidiaries, PartnerRe Finance A LLC, PartnerReFinance B LLC and PartnerRe Finance II Inc., that are considered to be VIEs, which were utilized to issue theCompany’s Senior Notes and Capital Efficient Notes (CENts). The Company determined that it was not theprimary beneficiary of any of these VIEs at December 31, 2011. As a result, the Company has not consolidatedPartnerRe Finance A LLC, PartnerRe Finance B LLC and PartnerRe Finance II Inc., and has reflected the debtissued by the Company related to the Senior Notes and CENts as liabilities in the Consolidated Balance Sheets(see Note 11). The interest on the debt related to the Senior Notes and CENts is reported as interest expense inthe Consolidated Statements of Operations.
(t) Segment Reporting
The Company monitors the performance of its operations in three segments, Non-life, Life andCorporate and Other. The Non-life segment is further divided into four sub-segments: North America, Global(Non-U.S.) Property and Casualty (Global (Non-U.S.) P&C), Global (Non-U.S.) Specialty and Catastrophe.
Segments and sub-segments represent markets that are reasonably homogeneous in terms of geography,client types, buying patterns, underlying risk patterns or approach to risk management.
(u) Recent Accounting Pronouncements
In October 2010, the Financial Accounting Standards Board (FASB) issued new accounting guidanceclarifying that only acquisition costs related directly to the successful acquisition of new or renewal insurancecontracts may be capitalized. Those acquisition costs that may be capitalized include incremental direct costs,such as commissions, and a portion of salaries and benefits of certain employees who are involved inunderwriting and policy issuance, that are directly related to time spent on an acquired contract. This guidance iseffective for interim and annual periods beginning after December 15, 2011. The Company does not expect theadoption of this guidance to have an impact on its consolidated shareholders’ equity or net income.
In May 2011, the FASB issued new accounting guidance, which updates the existing guidance, related tofair value measurement and disclosures. The guidance clarifies or changes the application of certain existingrequirements and does not extend the use of fair value. The guidance also requires additional disclosuresincluding details of transfers between Levels 1 and 2 of the fair value hierarchy and increased quantitative andqualitative information relating to fair value measurements categorized under Level 3 of the fair value hierarchy.The guidance is effective for interim and annual periods beginning after December 15, 2011. The Company does
153

not expect the adoption of this guidance to have an impact on its consolidated shareholders’ equity or net incomeand is currently evaluating the impact of the adoption of this guidance on its disclosures.
In September 2011, the FASB issued new accounting guidance, which updates the existing guidance, relatedto goodwill impairment testing. The amendments revise the application of certain existing requirements to allowthe option of performing a qualitative goodwill impairment assessment before calculating the fair value ofreporting units, which could, depending on the results of the assessment, eliminate the need for further testing ofgoodwill for impairment. The guidance is effective for interim and annual periods beginning after December 15,2011 with early adoption permitted. The Company does not expect the adoption of this guidance to have animpact on its consolidated shareholders’ equity or net income.
In December 2011, the FASB issued new guidance aimed at enhancing disclosures about financial andderivative instruments and transactions subject to offsetting arrangements. The guidance is effective for interimand annual periods beginning on or after January 1, 2013. The Company is currently evaluating the impact of theadoption of this guidance on its disclosures.
3. Fair Value
(a) Fair Value of Financial Instrument Assets
The fair value hierarchy prioritizes the inputs to valuation techniques used to measure fair value by maximizingthe use of observable inputs and minimizing the use of unobservable inputs by requiring that the most observableinputs be used when available. Observable inputs are inputs that market participants would use in pricing an asset orliability based on market data obtained from sources independent of the Company. Unobservable inputs are inputs thatreflect the Company’s assumptions about what market participants would use in pricing the asset or liability based onthe best information available in the circumstances. The level in the hierarchy within which a given fair valuemeasurement falls is determined based on the lowest level input that is significant to the measurement.
The Company determines the appropriate level in the hierarchy for each financial instrument that it measures atfair value. In determining fair value, the Company uses various valuation approaches, including market, income andcost approaches. The hierarchy is broken down into three levels based on the observability of inputs as follows:
• Level 1 inputs—Unadjusted, quoted prices in active markets for identical assets or liabilities that theCompany has the ability to access.
The Company’s financial instruments that it measures at fair value using Level 1 inputs generallyinclude: equities listed on a major exchange, exchange traded funds and exchange traded derivatives,such as futures and weather derivatives that are actively traded.
• Level 2 inputs—Quoted prices in active markets for similar assets or liabilities, quoted prices foridentical or similar assets or liabilities in inactive markets and significant directly or indirectlyobservable inputs, other than quoted prices, used in industry accepted models.
The Company’s financial instruments that it measures at fair value using Level 2 inputs generallyinclude: U.S. Government issued bonds; U.S. Government sponsored enterprises bonds; U.S. state,territory and municipal entities bonds; Non-U.S. sovereign government, supranational and governmentrelated bonds consisting primarily of bonds issued by non-U.S. national governments and theiragencies, non-U.S. regional governments and supranational organizations; investment grade and highyield corporate bonds; catastrophe bonds; mortality bonds; asset-backed securities; mortgage-backedsecurities; certain equities traded on foreign exchanges; certain fixed income mutual funds; foreignexchange forward contracts; over-the-counter derivatives such as foreign currency option contracts,non-exchange traded futures, credit default swaps, interest rate swaps and TBAs.
• Level 3 inputs—Unobservable inputs.
The Company’s financial instruments that it measures at fair value using Level 3 inputs generallyinclude: inactively traded fixed maturities including U.S. state, territory and municipal bonds; privately
154

issued corporate securities; special purpose financing asset-backed bonds; unlisted equities; real estatemutual fund investments; credit-linked notes; inactively traded weather derivatives; notes, annuitiesand loans receivable and longevity and other total return swaps.
The Company’s financial instruments measured at fair value include investments classified as tradingsecurities, certain other invested assets and the segregated investment portfolio underlying the funds held – directlymanaged account (see Notes 4 and 5). At December 31, 2011 and 2010, the Company’s financial instrumentsmeasured at fair value were categorized between Levels 1, 2 and 3 as follows (in thousands of U.S. dollars):
December 31, 2011
Quoted prices inactive markets for
identical assets(Level 1)
Significant otherobservable inputs
(Level 2)
Significantunobservable
inputs(Level 3) Total
Fixed maturitiesU.S. government and government sponsored enterprises . . . . . . . . . . $ — $ 1,115,777 $ — $ 1,115,777U.S. states, territories and municipalities . . . . . . . . . . . . . . . . . . . . . . — 12,269 111,415 123,684Non-U.S. sovereign government, supranational and government
related . . . . . . . . . . . . . . . . . . . . . . . . . . . . . . . . . . . . . . . . . . . . . . . — 2,964,091 — 2,964,091Corporate . . . . . . . . . . . . . . . . . . . . . . . . . . . . . . . . . . . . . . . . . . . . . . . — 5,635,297 111,700 5,746,997Asset-backed securities . . . . . . . . . . . . . . . . . . . . . . . . . . . . . . . . . . . . — 376,384 257,415 633,799Residential mortgage-backed securities . . . . . . . . . . . . . . . . . . . . . . . — 3,282,901 — 3,282,901Other mortgage-backed securities . . . . . . . . . . . . . . . . . . . . . . . . . . . . — 74,580 — 74,580
Fixed maturities . . . . . . . . . . . . . . . . . . . . . . . . . . . . . . . . . . . . . . . . . . . . . $ — $13,461,299 $480,530 $13,941,829Short-term investments . . . . . . . . . . . . . . . . . . . . . . . . . . . . . . . . . . . . . . . . $ — $ 42,571 $ — $ 42,571Equities
Consumer noncyclical . . . . . . . . . . . . . . . . . . . . . . . . . . . . . . . . . . . . . $124,697 $ 154 $ — $ 124,851Energy . . . . . . . . . . . . . . . . . . . . . . . . . . . . . . . . . . . . . . . . . . . . . . . . . 83,403 858 — 84,261Finance . . . . . . . . . . . . . . . . . . . . . . . . . . . . . . . . . . . . . . . . . . . . . . . . 69,722 191 9,670 79,583Technology . . . . . . . . . . . . . . . . . . . . . . . . . . . . . . . . . . . . . . . . . . . . . 74,729 — — 74,729Communications . . . . . . . . . . . . . . . . . . . . . . . . . . . . . . . . . . . . . . . . . 64,036 44 — 64,080Industrials . . . . . . . . . . . . . . . . . . . . . . . . . . . . . . . . . . . . . . . . . . . . . . 58,254 — — 58,254Insurance . . . . . . . . . . . . . . . . . . . . . . . . . . . . . . . . . . . . . . . . . . . . . . . 58,017 — — 58,017Consumer cyclical . . . . . . . . . . . . . . . . . . . . . . . . . . . . . . . . . . . . . . . . 52,305 108 — 52,413Other . . . . . . . . . . . . . . . . . . . . . . . . . . . . . . . . . . . . . . . . . . . . . . . . . . 69,457 239 — 69,696Mutual funds and exchange traded funds . . . . . . . . . . . . . . . . . . . . . . 35,285 237,027 6,495 278,807
Equities . . . . . . . . . . . . . . . . . . . . . . . . . . . . . . . . . . . . . . . . . . . . . . . . . . . . $689,905 $ 238,621 $ 16,165 $ 944,691Other invested assets
Derivative assetsForeign exchange forward contracts . . . . . . . . . . . . . . . . . . . . . . $ — $ 7,865 $ — $ 7,865Foreign currency option contracts . . . . . . . . . . . . . . . . . . . . . . . . — 1,074 — 1,074Futures contracts . . . . . . . . . . . . . . . . . . . . . . . . . . . . . . . . . . . . . 13,524 48 — 13,572Credit default swaps (protection purchased) . . . . . . . . . . . . . . . . — 92 — 92Credit default swaps (assumed risks) . . . . . . . . . . . . . . . . . . . . . — 246 — 246Total return swaps . . . . . . . . . . . . . . . . . . . . . . . . . . . . . . . . . . . . — 443 7,230 7,673TBAs . . . . . . . . . . . . . . . . . . . . . . . . . . . . . . . . . . . . . . . . . . . . . . — 747 — 747
Other assets . . . . . . . . . . . . . . . . . . . . . . . . . . . . . . . . . . . . . . . . . . . . . . . . . — — 91,405 91,405Derivative liabilities
Foreign exchange forward contracts . . . . . . . . . . . . . . . . . . . . . . — (5,816) — (5,816)Foreign currency option contracts . . . . . . . . . . . . . . . . . . . . . . . . — (321) — (321)Futures contracts . . . . . . . . . . . . . . . . . . . . . . . . . . . . . . . . . . . . . (12,905) (1,268) — (14,173)Credit default swaps (protection purchased) . . . . . . . . . . . . . . . . — (1,285) — (1,285)Credit default swaps (assumed risks) . . . . . . . . . . . . . . . . . . . . . — (772) — (772)Insurance-linked securities . . . . . . . . . . . . . . . . . . . . . . . . . . . . . — — (968) (968)Total return swaps . . . . . . . . . . . . . . . . . . . . . . . . . . . . . . . . . . . . — — (640) (640)Interest rate swaps . . . . . . . . . . . . . . . . . . . . . . . . . . . . . . . . . . . . — (7,992) — (7,992)TBAs . . . . . . . . . . . . . . . . . . . . . . . . . . . . . . . . . . . . . . . . . . . . . . — (58) — (58)
Other liabilities . . . . . . . . . . . . . . . . . . . . . . . . . . . . . . . . . . . . . . . . . . — (137) — (137)
Other invested assets . . . . . . . . . . . . . . . . . . . . . . . . . . . . . . . . . . . . . . . . . . $ 619 $ (7,134) $ 97,027 $ 90,512Funds held – directly managed
U.S. government and government sponsored enterprises . . . . . . . . . . $ — $ 268,539 $ — $ 268,539U.S. states, territories and municipalities . . . . . . . . . . . . . . . . . . . . . . — — 334 334Non-U.S. sovereign government, supranational and government
related . . . . . . . . . . . . . . . . . . . . . . . . . . . . . . . . . . . . . . . . . . . . . . . — 274,665 — 274,665Corporate . . . . . . . . . . . . . . . . . . . . . . . . . . . . . . . . . . . . . . . . . . . . . . . — 480,485 — 480,485Short-term investments . . . . . . . . . . . . . . . . . . . . . . . . . . . . . . . . . . . . — 18,097 — 18,097Other invested assets . . . . . . . . . . . . . . . . . . . . . . . . . . . . . . . . . . . . . . — — 15,433 15,433
Funds held – directly managed . . . . . . . . . . . . . . . . . . . . . . . . . . . . . . . . . . $ — $ 1,041,786 $ 15,767 $ 1,057,553
Total . . . . . . . . . . . . . . . . . . . . . . . . . . . . . . . . . . . . . . . . . . . . . . . . . . . . . . $690,524 $14,777,143 $609,489 $16,077,156
155

December 31, 2010
Quoted prices inactive markets for
identical assets(Level 1)
Significant otherobservable inputs
(Level 2)
Significantunobservable
inputs(Level 3) Total
Fixed maturitiesU.S. government and government sponsored
enterprises . . . . . . . . . . . . . . . . . . . . . . . . . . . . . . . . . . $ — $ 906,032 $ — $ 906,032U.S. states, territories and municipalities . . . . . . . . . . . . — 11,568 55,124 66,692Non-U.S. sovereign government, supranational and
government related . . . . . . . . . . . . . . . . . . . . . . . . . . . — 2,819,193 — 2,819,193Corporate . . . . . . . . . . . . . . . . . . . . . . . . . . . . . . . . . . . . . — 6,066,865 76,982 6,143,847Asset-backed securities . . . . . . . . . . . . . . . . . . . . . . . . . . — 343,518 213,139 556,657Residential mortgage-backed securities . . . . . . . . . . . . . — 2,305,525 — 2,305,525Other mortgage-backed securities . . . . . . . . . . . . . . . . . . — 26,153 290 26,443
Fixed maturities . . . . . . . . . . . . . . . . . . . . . . . . . . . . . . . . . . . . $ — $12,478,854 $345,535 $12,824,389Short-term investments . . . . . . . . . . . . . . . . . . . . . . . . . . . . . . $ — $ 49,397 $ — $ 49,397Equities
Consumer noncyclical . . . . . . . . . . . . . . . . . . . . . . . . . . . $ 186,016 $ — $ — $ 186,016Technology . . . . . . . . . . . . . . . . . . . . . . . . . . . . . . . . . . . 119,214 — — 119,214Energy . . . . . . . . . . . . . . . . . . . . . . . . . . . . . . . . . . . . . . . 118,372 — — 118,372Finance . . . . . . . . . . . . . . . . . . . . . . . . . . . . . . . . . . . . . . 112,309 — 2,486 114,795Communications . . . . . . . . . . . . . . . . . . . . . . . . . . . . . . . 110,982 — — 110,982Industrials . . . . . . . . . . . . . . . . . . . . . . . . . . . . . . . . . . . . 100,572 — — 100,572Consumer cyclical . . . . . . . . . . . . . . . . . . . . . . . . . . . . . . 81,595 — — 81,595Insurance . . . . . . . . . . . . . . . . . . . . . . . . . . . . . . . . . . . . . 48,611 — — 48,611Other . . . . . . . . . . . . . . . . . . . . . . . . . . . . . . . . . . . . . . . . 90,220 — — 90,220Mutual funds and exchange traded funds . . . . . . . . . . . . 60,372 — 40,927 101,299
Equities . . . . . . . . . . . . . . . . . . . . . . . . . . . . . . . . . . . . . . . . . . $1,028,263 $ — $ 43,413 $ 1,071,676Other invested assets
Derivative assetsForeign exchange forward contracts . . . . . . . . . . . . $ — $ 27,880 $ — $ 27,880Foreign currency option contracts . . . . . . . . . . . . . . — 3,516 — 3,516Futures contracts . . . . . . . . . . . . . . . . . . . . . . . . . . . 30,593 — — 30,593Credit default swaps (protection purchased) . . . . . . — 93 — 93Credit default swaps (assumed risks) . . . . . . . . . . . — 533 — 533Insurance-linked securities . . . . . . . . . . . . . . . . . . . 1,320 — — 1,320Total return swaps . . . . . . . . . . . . . . . . . . . . . . . . . . — 449 5,592 6,041Interest rate swaps . . . . . . . . . . . . . . . . . . . . . . . . . . — 246 — 246TBAs . . . . . . . . . . . . . . . . . . . . . . . . . . . . . . . . . . . . — 363 — 363
Other assets . . . . . . . . . . . . . . . . . . . . . . . . . . . . . . . . . . . — — 86,278 86,278Derivative liabilities
Foreign exchange forward contracts . . . . . . . . . . . . — (13,647) — (13,647)Futures contracts . . . . . . . . . . . . . . . . . . . . . . . . . . . (7,956) — — (7,956)Credit default swaps (protection purchased) . . . . . . — (2,407) — (2,407)Credit default swaps (assumed risks) . . . . . . . . . . . — (401) — (401)Insurance-linked securities . . . . . . . . . . . . . . . . . . . (695) — (698) (1,393)Total return swaps . . . . . . . . . . . . . . . . . . . . . . . . . . — — (12,848) (12,848)Interest rate swaps . . . . . . . . . . . . . . . . . . . . . . . . . . — (6,033) — (6,033)TBAs . . . . . . . . . . . . . . . . . . . . . . . . . . . . . . . . . . . . — (553) — (553)
Other liabilities . . . . . . . . . . . . . . . . . . . . . . . . . . . . . . . . — (251) — (251)
Other invested assets . . . . . . . . . . . . . . . . . . . . . . . . . . . . . . . . $ 23,262 $ 9,788 $ 78,324 $ 111,374Funds held – directly managed
U.S. government and government sponsoredenterprises . . . . . . . . . . . . . . . . . . . . . . . . . . . . . . . . . . $ — $ 288,164 $ — $ 288,164
U.S. states, territories and municipalities . . . . . . . . . . . . — — 368 368Non-U.S. sovereign government, supranational and
government related . . . . . . . . . . . . . . . . . . . . . . . . . . . — 384,553 — 384,553Corporate . . . . . . . . . . . . . . . . . . . . . . . . . . . . . . . . . . . . . — 798,587 — 798,587Mortgage/asset-backed securities . . . . . . . . . . . . . . . . . . — — 12,118 12,118Short-term investments . . . . . . . . . . . . . . . . . . . . . . . . . . — 38,613 — 38,613Other invested assets . . . . . . . . . . . . . . . . . . . . . . . . . . . . — — 20,528 20,528
Funds held – directly managed . . . . . . . . . . . . . . . . . . . . . . . . $ — $ 1,509,917 $ 33,014 $ 1,542,931
Total . . . . . . . . . . . . . . . . . . . . . . . . . . . . . . . . . . . . . . . . . . . . $1,051,525 $14,047,956 $500,286 $15,599,767
156

At December 31, 2011 and 2010, the aggregate carrying amounts of items included in Other invested assetsthat the Company did not measure at fair value were $267.6 million and $241.0 million, respectively, whichrelated to the Company’s investments that are accounted for using the cost method of accounting, equity methodof accounting or investment company accounting.
In addition to the investments underlying the funds held – directly managed account held at fair value of$1,057.6 million and $1,542.9 million at December 31, 2011 and 2010, respectively, the funds held – directlymanaged account also included cash and cash equivalents, carried at fair value, of $176.3 million and $129.2million, respectively, and accrued investment income of $13.7 million and $19.9 million, respectively. AtDecember 31, 2011 and 2010, the aggregate carrying amounts of items included in the funds held – directlymanaged account that the Company did not measure at fair value were $20.4 million and $80.1 million,respectively, which primarily related to other assets and liabilities held by Colisée Re related to the underlyingbusiness, which are carried at cost (see Note 5).
At December 31, 2011 and 2010, substantially all of the accrued investment income in the ConsolidatedBalance Sheets related to the Company’s investments and the investments underlying the funds held – directlymanaged account for which the fair value option was elected.
During the years ended December 31, 2011 and 2010, there were no significant transfers between Level 1and Level 2.
Disclosures about the fair value of financial instruments that the Company does not measure at fair valueexclude insurance contracts and certain other financial instruments. At December 31, 2011 and 2010, the fairvalues of financial instrument assets recorded in the Consolidated Balance Sheets not described above,approximate their carrying values.
157

The following tables are reconciliations of the beginning and ending balances for all financial instrumentsmeasured at fair value using Level 3 inputs for the years ended December 31, 2011 and 2010 (in thousands ofU.S. dollars):
For the year endedDecember 31, 2011
Balance atbeginning
of year
Realized andunrealizedinvestment
gains (losses)included in
net loss
Purchasesand
issuances (1)Sales and
settlements (1)
Nettransfers
intoLevel 3 (2)
Balanceat endof year
Change inunrealized
investment gains(losses) relating
to assets heldat end of year
Fixed maturitiesU.S. states, territories
andmunicipalities . . . . . $ 55,124 $ 5,288 $ 51,163 $ (160) $ — $111,415 $ 5,288
Corporate . . . . . . . . . . 76,982 (36,617) 41,246 (10,091) 40,180 111,700 2,430Asset-backed
securities . . . . . . . . 213,139 15,161 182,090 (152,975) — 257,415 14,938Residential mortgage-
backed securities . . — 1,385 4,212 (5,597) — — —Other mortgage-
backed securities . . 290 (225) 408 (473) — — —
Fixed maturities . . . . . . . . . $345,535 $(15,008) $279,119 $(169,296) $40,180 $480,530 $ 22,656Short-term investments . . . $ — $ (1,069) $ 3,992 $ (2,923) $ — $ — $ —Equities
Finance . . . . . . . . . . . . $ 2,486 $ 223 $ 9,523 $ (2,562) $ — $ 9,670 $ (4)Mutual funds and
exchange tradedfunds . . . . . . . . . . . . 40,927 1,195 — (35,627) — 6,495 (429)
Equities . . . . . . . . . . . . . . . $ 43,413 $ 1,418 $ 9,523 $ (38,189) $ — $ 16,165 $ (433)Other invested assets
Derivatives, net . . . . . $ (7,954) $ (3,546) $ (4,103) $ 21,225 $ — $ 5,622 $ 2,548Other assets . . . . . . . . 86,278 (23,698) 61,574 (32,749) — 91,405 (24,499)
Other invested assets . . . . . $ 78,324 $(27,244) $ 57,471 $ (11,524) $ — $ 97,027 $(21,951)Funds held – directly
managedU.S. states, territories
andmunicipalities . . . . . $ 368 $ (34) $ — $ — $ — $ 334 $ (34)
Mortgage/asset-backed securities . . 12,118 (150) — (11,968) — — —
Other investedassets . . . . . . . . . . . 20,528 (3,855) — (1,240) — 15,433 (3,519)
Funds held – directlymanaged . . . . . . . . . . . . . $ 33,014 $ (4,039) $ — $ (13,208) $ — $ 15,767 $ (3,553)
Total . . . . . . . . . . . . . . . . . . $500,286 $(45,942) $350,105 $(235,140) $40,180 $609,489 $ (3,281)
(1) Purchases and issuances of derivatives includes issuances of $5.1 million. Sales and settlements ofderivatives includes settlements of $21.2 million.
(2) The Company’s policy is to recognize the transfers between the hierarchy levels at the beginning of theperiod.
158

For the year endedDecember 31, 2010
Balance atbeginning
of year
Realized andunrealizedinvestment
gains (losses)included innet income
Netpurchases,sales and
settlements
Nettransfers(out of)/
intoLevel 3 (2)
Balance atend ofyear
Change inunrealized
investment (losses)gains relatingto assets heldat end of year
Fixed maturitiesU.S. states, territories and
municipalities . . . . . . . . . . $ 4,286 $ 2,379 $ 52,745 $ (4,286) $ 55,124 $ (126)Corporate . . . . . . . . . . . . . . . 15,041 38 72,653 (10,750) 76,982 38Asset-backed securities . . . . 99,952 20,692 95,395 (2,900) 213,139 (3,331)Residential mortgage-backed
securities . . . . . . . . . . . . . . 77,440 191 (77,631) — — —Other mortgage-backed
securities . . . . . . . . . . . . . . 874 (239) (345) — 290 (239)
Fixed maturities . . . . . . . . . . . . . . $197,593 $23,061 $142,817 $(17,936) $345,535 $(3,658)Equities
Finance . . . . . . . . . . . . . . . . . $ 2,488 $ (696) $ 694 $ — $ 2,486 $ (2)Industrials . . . . . . . . . . . . . . . 805 (84) (721) — — —Mutual funds and exchange
traded funds . . . . . . . . . . . 34,810 1,117 5,000 — 40,927 1,117
Equities . . . . . . . . . . . . . . . . . . . . . $ 38,103 $ 337 $ 4,973 $ — $ 43,413 $ 1,115Other invested assets
Derivatives, net . . . . . . . . . . . $ (9,361) $12,939 $ (19,698) $ 8,166 $ (7,954) $ 4,348Other assets . . . . . . . . . . . . . . 25,815 1,654 58,809 — 86,278 2,506
Other invested assets . . . . . . . . . . $ 16,454 $14,593 $ 39,111 $ 8,166 $ 78,324 $ 6,854Funds held – directly managed
U.S. states, territories andmunicipalities . . . . . . . . . . $ 375 $ (7) $ — $ — $ 368 $ (7)
Non-U.S. sovereigngovernment, supranationaland government related . . . 3,417 (13) (3,404) — — —
Mortgage/asset-backedsecurities . . . . . . . . . . . . . . 142 (4,890) — 16,866 12,118 (4,877)
Other invested assets . . . . . . 35,685 (3,842) (11,315) — 20,528 (3,824)
Funds held – directly managed . . . $ 39,619 $ (8,752) $ (14,719) $ 16,866 $ 33,014 $(8,708)
Total . . . . . . . . . . . . . . . . . . . . . . . $291,769 $29,239 $172,182 $ 7,096 $500,286 $(4,397)
During the year ended December 31, 2011, a catastrophe bond (included within corporate fixed maturities)with a fair value of $40.2 million was transferred from Level 2 into Level 3. The transfer into Level 3 was due tothe lack of observable market inputs at March 31, 2011, leading the Company to apply inputs that were notdirectly observable. The catastrophe bond matured during the year ended December 31, 2011 with a realized lossof $39.2 million.
During the year ended December 31, 2010, certain fixed maturities with a fair value of $17.9 million weretransferred from Level 3 into Level 2. The reclassifications to Level 2 consisted of U.S. municipal (includedwithin U.S. states, territories and municipalities), corporate and student loan (included within asset-backedsecurities) fixed maturities. The transfers into Level 2 were due to the availability of quoted prices for similarassets in active markets used for valuation at December 31, 2010, resulting from the continued recovery of thefinancial markets. In addition, during the year ended December 31, 2010, certain derivatives with a fair value in anet liability position of $8.2 million were transferred out of Level 3 into Level 2 due to the availability ofobservable inputs.
159

During the year ended December 31, 2010, certain fixed maturities within the investments underlying thefunds held – directly managed account with a fair value of $16.9 million were transferred from Level 2 intoLevel 3. The reclassification into Level 3 consisted of asset-backed securities and residential and commercialmortgage-backed securities. The transfers into Level 3 were the result of the lack of observable market inputs,leading the Company to apply inputs that were not directly observable.
Changes in the fair value of the Company’s financial instruments subject to the fair value option during theyears ended December 31, 2011, 2010 and 2009, respectively, were as follows (in thousands of U.S. dollars):
2011 2010 2009
Fixed maturities and short-term investments . . . . . . . . . . . . . . . . . . . . . . . . . . $ 128,224 $142,634 $322,944Equities . . . . . . . . . . . . . . . . . . . . . . . . . . . . . . . . . . . . . . . . . . . . . . . . . . . . . . . (101,860) 64,825 185,925Other invested assets . . . . . . . . . . . . . . . . . . . . . . . . . . . . . . . . . . . . . . . . . . . . . (24,839) (1,176) 2,053Funds held – directly managed . . . . . . . . . . . . . . . . . . . . . . . . . . . . . . . . . . . . . 5,853 24,358 1,885
Total . . . . . . . . . . . . . . . . . . . . . . . . . . . . . . . . . . . . . . . . . . . . . . . . . . . . . . . . . $ 7,378 $230,641 $512,807
All of the above changes in fair value are included in the Consolidated Statements of Operations under thecaption Net realized and unrealized investment gains.
The following methods and assumptions were used by the Company in estimating the fair value of eachclass of financial instrument recorded in the Consolidated Balance Sheets. There have been no material changesin the Company’s valuation techniques during the periods presented.
Fixed maturities
• U.S. government and government sponsored enterprises—U.S. government and government sponsoredenterprises securities consist primarily of bonds issued by the U.S. Treasury, corporate debt securitiesissued by the Federal National Mortgage Association, the Federal Home Loan Bank and the PrivateExport Funding Corporation. These securities are generally priced by independent pricing services. Theindependent pricing services may use actual transaction prices for securities that have been activelytraded. For securities that have not been actively traded, each pricing source has its own proprietarymethod to determine the fair value, which may incorporate option adjusted spreads (OAS), interest ratedata and market news. The Company generally classifies these securities in Level 2.
• U.S. states, territories and municipalities—U.S. states, territories and municipalities securities consistprimarily of bonds issued by U.S. states, territories and municipalities. These securities are generallypriced by independent pricing services using the techniques described for U.S. government andgovernment sponsored enterprises above. The Company generally classifies these securities in Level 2.Certain of the bonds that are issued by municipal housing authorities are not actively traded and arepriced based on internal models using unobservable inputs. Accordingly, the Company classifies thesesecurities in Level 3.
• Non-U.S. sovereign government, supranational and government related—Non-U.S. sovereigngovernment, supranational and government related securities consist primarily of bonds issued bynon-U.S. national governments and their agencies, non-U.S. regional governments and supranationalorganizations. These securities are generally priced by independent pricing services using thetechniques described for U.S. government and government sponsored enterprises above. The Companygenerally classifies these securities in Level 2.
• Corporate—Corporate securities consist primarily of bonds issued by U.S. and foreign corporationscovering a variety of industries and issuing countries. These securities are generally priced byindependent pricing services and brokers. The pricing provider incorporates information includingcredit spreads, interest rate data and market news into the valuation of each security. The Companygenerally classifies these securities in Level 2. When a corporate security is inactively traded or thevaluation model uses unobservable inputs, the Company classifies the security in Level 3.
160

• Asset-backed securities—Asset-backed securities primarily consist of bonds issued by U.S. and foreigncorporations that are backed by student loans, automobile loans, credit card receivables, equipmentleases, and special purpose financing. With the exception of special purpose financing, these asset-backed securities are generally priced by independent pricing services and brokers. The pricingprovider applies dealer quotes and other available trade information, prepayment speeds, yield curvesand credit spreads to the valuation. The Company generally classifies these securities in Level 2.Special purpose financing securities are generally inactively traded and are priced based on valuationmodels using unobservable inputs, including cash flow assumptions and credit spreads. The Companygenerally classifies these securities in Level 3.
• Residential mortgage-backed securities—Residential mortgage-backed securities primarily consist ofbonds issued by the Government National Mortgage Association, the Federal National MortgageAssociation, the Federal Home Loan Mortgage Corporation, as well as private, non-agency issuers.With the exception of private, non-agency issuers, these residential mortgage-backed securities aregenerally priced by independent pricing services and brokers. When current market trades are notavailable, the pricing provider will employ proprietary models with observable inputs including othertrade information, prepayment speeds, yield curves and credit spreads. The Company generallyclassifies these securities in Level 2.
• Other mortgage-backed securities—Other mortgage-backed securities primarily consist of commercialmortgage-backed securities. These securities are generally priced by independent pricing services andbrokers. The pricing provider applies dealer quotes and other available trade information, prepaymentspeeds, yield curves and credit spreads to the valuation. The Company generally classifies thesesecurities in Level 2. When a commercial mortgage-backed security is inactively traded or thevaluation model uses unobservable inputs, the Company classifies the security in Level 3.
In general, the methods employed by the independent pricing services to determine the fair value of thesecurities that have not actively traded involve the use of “matrix pricing” in which the independent pricingsource applies the credit spread for a comparable security that has traded recently to the current yield curve todetermine a reasonable fair value. The Company uses a pricing service ranking to consistently select the mostappropriate pricing service in instances where it receives multiple quotes on the same security. When fair valuesare unavailable from these independent pricing sources, quotes are obtained directly from broker-dealers who areactive in the corresponding markets. Most of the Company’s fixed maturities are priced from the pricing servicesor dealer quotes. The Company will typically not make adjustments to prices received from pricing services ordealer quotes; however, in instances where the quoted external price for a security uses significant unobservableinputs, the Company will categorize that security as Level 3. The Company’s inactively traded fixed maturitiesare classified as Level 3. For all fixed maturity investments, the bid price is used for estimating fair value.
To validate prices, the Company compares the fair value estimates to its knowledge of the current marketand will investigate prices that it considers not to be representative of fair value. The Company also reviews aninternally generated fixed maturity price validation report which converts prices received for fixed maturityinvestments from the independent pricing sources and from broker-dealers quotes and plots OAS and duration ona sector and rating basis. The OAS is calculated using established algorithms developed by an independent riskanalytics platform vendor. The OAS on the fixed maturity price validation report are compared for securities in asimilar sector and having a similar rating, and outliers are identified and investigated for price reasonableness. Inaddition, the Company completes quantitative analyses to compare the performance of each fixed maturityinvestment portfolio to the performance of an appropriate benchmark, with significant differences identified andinvestigated.
Short term investments
Short term investments are valued in a manner similar to the Company’s fixed maturity investments and aregenerally classified in Level 2.
161

Equities
Equity securities include U.S. and foreign common and preferred stocks, mutual funds and exchange tradedfunds. Equities and exchange traded funds are generally classified in Level 1 as the Company uses pricesreceived from independent pricing sources based on quoted prices in active markets. Equities categorized asLevel 2 are generally mutual funds invested in fixed income securities, where the net asset value of the fund isprovided on a daily basis, and common stocks traded in inactive markets. Equities categorized as Level 3 aregenerally mutual funds invested in securities other than the common stock of publicly traded companies, wherethe net asset value is not provided on a daily basis, and inactively traded common stocks.
To validate prices, the Company completes quantitative analyses to compare the performance of each equityinvestment portfolio to the performance of an appropriate benchmark, with significant differences identified andinvestigated.
Other invested assets
The Company’s exchange traded derivatives, such as futures and certain weather derivatives, are generallycategorized as Level 1 as their fair values are quoted prices in active markets. The Company’s foreign exchangeforward contracts, foreign currency option contracts, non-exchange traded futures, credit default swaps, totalreturn swaps, interest rate swaps and TBAs are generally categorized as Level 2 within the fair value hierarchyand are priced by independent pricing services.
Included in the Company’s Level 3 categorization, in general, are credit-linked notes, certain inactively tradedweather derivatives, notes, annuities and loans receivable and longevity and other total return swaps. For Level 3instruments, the Company will generally either (i) receive a price based on a manager’s or trustee’s valuation for theasset; or (ii) develop an internal discounted cash flow model to measure fair value. Where the Company receivesprices from the manager or trustee, these prices are based on the manager’s or trustee’s estimate of fair value for theassets and are generally audited on an annual basis. Where the Company develops its own discounted cash flowmodels, the inputs will be specific to the asset in question, based on appropriate historical information, adjusted asnecessary, and using appropriate discount rates. As part of the Company’s modeling to determine the fair value ofan investment, the Company considers counterparty credit risk as an input to the model, however, the majority ofthe Company’s counterparties are highly rated institutions and the failure of any one counterparty would not have asignificant impact on the Company’s consolidated financial statements.
To validate prices, the Company will compare them to benchmarks, where appropriate, or to the businessresults generally within that asset class and specifically to those particular assets. In addition, the fair valuemeasurements of all Level 3 investments are presented to, and peer reviewed by, an internal valuation committeethat the Company has established.
Funds held – directly managed
The segregated investment portfolio underlying the funds held – directly managed account is comprised offixed maturities, short-term investments and other invested assets which are fair valued on a basis consistent withthe methods described above. Substantially all fixed maturities and short-term investments within the funds held– directly managed account are categorized as Level 2 within the fair value hierarchy.
The other invested assets within the segregated investment portfolio underlying the funds held – directlymanaged account, which are categorized as Level 3 investments, are primarily real estate mutual fundinvestments carried at fair value. For the real estate mutual fund investments, the Company receives a price basedon the real estate fund manager’s valuation for the asset and further adjusts the price, if necessary, based onappropriate current information on the real estate market.
To validate prices within the segregated investment portfolio underlying the funds held – directly managedaccount, the Company utilizes the methods described above.
162

(b) Fair Value of Financial Instrument Liabilities
At December 31, 2011 and 2010, the fair values of financial instrument liabilities recorded in theConsolidated Balance Sheets approximate their carrying values, with the exception of the debt related to seniornotes (Senior Notes) and the debt related to capital efficient notes (CENts).
The following methods and assumptions were used by the Company in estimating the fair value of eachclass of financial instrument liability recorded in the Consolidated Balance Sheets for which the Company doesnot measure that instrument at fair value:
• the fair value of the Senior Notes was calculated based on internal models using observable inputsbased on the aggregate principal amount outstanding of $250 million from PartnerRe Finance A LLCand $500 million from PartnerRe Finance B LLC at December 31, 2011 and 2010; and
• the fair value of the CENts was calculated based on internal models using observable inputs based onthe aggregate principal amount outstanding from PartnerRe Finance II Inc. of $63 million atDecember 31, 2011 and 2010.
The carrying values and fair values of the Senior Notes and CENts at December 31, 2011 and 2010 were asfollows (in thousands of U.S. dollars):
December 31, 2011 December 31, 2010
Carrying Value Fair Value Carrying Value Fair Value
Debt related to senior notes (1) . . . . . . . . . . . . . . . . . . . . . . $750,000 $781,449 $750,000 $781,950Debt related to capital efficient notes (2) . . . . . . . . . . . . . . . 63,384 55,678 63,384 59,261
(1) PartnerRe Finance A LLC and PartnerRe Finance B LLC, the issuers of the Senior Notes, do not meetconsolidation requirements under U.S. GAAP. Accordingly, the Company shows the related intercompanydebt of $750 million in its Consolidated Balance Sheets at December 31, 2011 and 2010.
(2) PartnerRe Finance II Inc., the issuer of the CENts, does not meet consolidation requirements under U.S.GAAP. Accordingly, the Company shows the related intercompany debt of $71 million in its ConsolidatedBalance Sheets at December 31, 2011 and 2010.
Disclosures about the fair value of financial instrument liabilities exclude insurance contracts and certainother financial instruments.
163

4. Investments
(a) Fixed Maturities, Short-Term Investments and Equities
The cost, gross unrealized gains, gross unrealized losses and fair value of investments classified as tradingsecurities at December 31, 2011 and 2010 were as follows (in thousands of U.S. dollars):
December 31, 2011 Cost (1)
GrossUnrealized
Gains
GrossUnrealized
Losses Fair Value
Fixed maturitiesU.S. government and government sponsored
enterprises . . . . . . . . . . . . . . . . . . . . . . . . . . . . . . . . $ 1,084,533 $ 31,283 $ (39) $ 1,115,777U.S. states, territories and municipalities . . . . . . . . . . 117,528 6,169 (13) 123,684Non-U.S. sovereign government, supranational and
government related . . . . . . . . . . . . . . . . . . . . . . . . . . 2,807,363 158,900 (2,172) 2,964,091Corporate . . . . . . . . . . . . . . . . . . . . . . . . . . . . . . . . . . . 5,461,478 319,090 (33,571) 5,746,997Asset-backed securities . . . . . . . . . . . . . . . . . . . . . . . . 626,508 11,558 (4,267) 633,799Residential mortgage-backed securities . . . . . . . . . . . . 3,224,850 94,781 (36,730) 3,282,901Other mortgage-backed securities . . . . . . . . . . . . . . . . 72,144 2,833 (397) 74,580
Total fixed maturities . . . . . . . . . . . . . . . . . . . . . . . . . . . . . . 13,394,404 624,614 (77,189) 13,941,829Short-term investments . . . . . . . . . . . . . . . . . . . . . . . . . . . . 42,563 22 (14) 42,571Equities . . . . . . . . . . . . . . . . . . . . . . . . . . . . . . . . . . . . . . . . 917,613 99,152 (72,074) 944,691
Total . . . . . . . . . . . . . . . . . . . . . . . . . . . . . . . . . . . . . . . . . . . $14,354,580 $723,788 $(149,277) $14,929,091
December 31, 2010 Cost (1)
GrossUnrealized
Gains
GrossUnrealized
Losses Fair Value
Fixed maturitiesU.S. government and government sponsored
enterprises . . . . . . . . . . . . . . . . . . . . . . . . . . . . . . . . $ 895,862 $ 15,584 $ (5,414) $ 906,032U.S. states, territories and municipalities . . . . . . . . . . 66,548 271 (127) 66,692Non-U.S. sovereign government, supranational and
government related . . . . . . . . . . . . . . . . . . . . . . . . . . 2,743,922 82,984 (7,713) 2,819,193Corporate . . . . . . . . . . . . . . . . . . . . . . . . . . . . . . . . . . . 5,876,392 286,463 (19,008) 6,143,847Asset-backed securities . . . . . . . . . . . . . . . . . . . . . . . . 554,326 11,707 (9,376) 556,657Residential mortgage-backed securities . . . . . . . . . . . . 2,227,938 92,534 (14,947) 2,305,525Other mortgage-backed securities . . . . . . . . . . . . . . . . 29,809 1,787 (5,153) 26,443
Total fixed maturities . . . . . . . . . . . . . . . . . . . . . . . . . . . . . . 12,394,797 491,330 (61,738) 12,824,389Short-term investments . . . . . . . . . . . . . . . . . . . . . . . . . . . . 49,132 283 (18) 49,397Equities . . . . . . . . . . . . . . . . . . . . . . . . . . . . . . . . . . . . . . . . 942,745 146,700 (17,769) 1,071,676
Total . . . . . . . . . . . . . . . . . . . . . . . . . . . . . . . . . . . . . . . . . . . $13,386,674 $638,313 $ (79,525) $13,945,462
(1) Cost is amortized cost for fixed maturities and short-term investments and cost for equity securities. Forinvestments acquired from Paris Re, cost is based on the fair value at the date of acquisition andsubsequently adjusted for amortization of fixed maturities and short-term investments.
164

(b) Maturity Distribution of Fixed Maturities and Short-Term Investments
The distribution of fixed maturities and short-term investments at December 31, 2011, by contractualmaturity date, is shown below (in thousands of U.S. dollars). Actual maturities may differ from contractualmaturities because certain borrowers have the right to call or prepay certain obligations with or without call orprepayment penalties.
Cost Fair Value
One year or less . . . . . . . . . . . . . . . . . . . . . . . . . . . . . . . . . . . . . . . . . . . . . . . . . . . . . . $ 566,515 $ 570,829More than one year through five years . . . . . . . . . . . . . . . . . . . . . . . . . . . . . . . . . . . . 4,792,769 4,923,116More than five years through ten years . . . . . . . . . . . . . . . . . . . . . . . . . . . . . . . . . . . . 3,471,876 3,713,242More than ten years . . . . . . . . . . . . . . . . . . . . . . . . . . . . . . . . . . . . . . . . . . . . . . . . . . . 682,305 785,933
Subtotal . . . . . . . . . . . . . . . . . . . . . . . . . . . . . . . . . . . . . . . . . . . . . . . . . . . . . . . . . . . . 9,513,465 9,993,120Mortgage/asset-backed securities . . . . . . . . . . . . . . . . . . . . . . . . . . . . . . . . . . . . . . . . 3,923,502 3,991,280
Total . . . . . . . . . . . . . . . . . . . . . . . . . . . . . . . . . . . . . . . . . . . . . . . . . . . . . . . . . . . . . . $13,436,967 $13,984,400
(c) Change in Net Unrealized Gains or Losses on Investments
The change in net unrealized gains or losses on investments reflected in change in other accumulatedcomprehensive (loss) income for the years ended December 31, 2011, 2010 and 2009 was $(0.9) million, $(4.9)million and $8.1 million, respectively. The related tax impact for all years was $nil.
(d) Net Realized and Unrealized Investment Gains
The components of the net realized and unrealized investment gains for the years ended December 31, 2011,2010 and 2009 were as follows (in thousands of U.S. dollars):
2011 2010 2009
Net realized investment gains on fixed maturities and short-terminvestments . . . . . . . . . . . . . . . . . . . . . . . . . . . . . . . . . . . . . . . . . . . . . . . . . . $ 157,207 $173,426 $105,249
Net realized investment gains (losses) on equities . . . . . . . . . . . . . . . . . . . . . . 90,866 44,736 (45,258)Net realized losses on other invested assets . . . . . . . . . . . . . . . . . . . . . . . . . . . (176,295) (68,568) (35,426)Change in net unrealized (losses) gains on other invested assets . . . . . . . . . . . (46,278) 3,742 58,196Change in net unrealized investment gains on fixed maturities and short-term
investments . . . . . . . . . . . . . . . . . . . . . . . . . . . . . . . . . . . . . . . . . . . . . . . . . . 128,224 142,634 322,944Change in net unrealized investment (losses) gains on equities . . . . . . . . . . . . (101,860) 64,825 185,925Net other realized and unrealized investment gains . . . . . . . . . . . . . . . . . . . . . 3,617 13,335 1,777Net realized and unrealized investment gains (losses) on funds held –
directly managed . . . . . . . . . . . . . . . . . . . . . . . . . . . . . . . . . . . . . . . . . . . . . . 11,211 27,352 (1,700)
Total net realized and unrealized investment gains . . . . . . . . . . . . . . . . . . . . . $ 66,692 $401,482 $591,707
Included in net realized investment gains (losses) on equities for the year ended December 31, 2009 is a gain of$18.3 million related to the Company’s equity investment in Paris Re prior to the Acquisition Date (see Note 7).
165

(e) Net Investment Income
The components of net investment income for the years ended December 31, 2011, 2010 and 2009 were asfollows (in thousands of U.S. dollars):
2011 2010 2009
Fixed maturities . . . . . . . . . . . . . . . . . . . . . . . . . . . . . . . . . . . . . . . . . . . . . . . . . $561,576 $580,258 $559,330Short-term investments, cash and cash equivalents . . . . . . . . . . . . . . . . . . . . . . 3,843 8,541 11,799Equities . . . . . . . . . . . . . . . . . . . . . . . . . . . . . . . . . . . . . . . . . . . . . . . . . . . . . . . . 19,815 20,794 13,861Funds held and other . . . . . . . . . . . . . . . . . . . . . . . . . . . . . . . . . . . . . . . . . . . . . 49,502 52,794 32,793Funds held – directly managed . . . . . . . . . . . . . . . . . . . . . . . . . . . . . . . . . . . . . . 37,919 51,775 17,766Investment expenses . . . . . . . . . . . . . . . . . . . . . . . . . . . . . . . . . . . . . . . . . . . . . . (43,507) (41,380) (39,478)
Net investment income . . . . . . . . . . . . . . . . . . . . . . . . . . . . . . . . . . . . . . . . . . . . $629,148 $672,782 $596,071
Other than the funds held – directly managed account, the Company generally earns investment income onfunds held by reinsured companies based upon a predetermined interest rate, either fixed contractually at theinception of the contract or based upon a recognized index (e.g., LIBOR). Interest rates ranged from 2.0% to5.0% for the year ended December 31, 2011 and from 3.0% to 6.0% for the year ended December 31, 2010. SeeNote 5 for additional information on the funds held – directly managed account.
(f) Pledged Assets
At December 31, 2011 and 2010, approximately $21.3 million and $271.2 million, respectively, of cash andcash equivalents and approximately $2,314.7 million and $1,679.2 million, respectively, of securities weredeposited, pledged or held in escrow accounts in favor of ceding companies and other counterparties orgovernment authorities to comply with reinsurance contract provisions and insurance laws.
(g) Net Payable for Securities Purchased/Sold
Included within Accounts payable, accrued expenses and other in the Consolidated Balance Sheets atDecember 31, 2011 and 2010 were amounts of gross receivable balances for securities sold and gross payablebalances for securities purchased as follows (in thousands of U.S. dollars):
2011 2010
Receivable for securities sold . . . . . . . . . . . . . . . . . . . . . . . . . . . . . . . . . . . . . . . . . . . . . . . . . $ 71,477 $ 16,669Payable for securities purchased . . . . . . . . . . . . . . . . . . . . . . . . . . . . . . . . . . . . . . . . . . . . . . (86,557) (23,802)
Net payable for securities purchased/sold . . . . . . . . . . . . . . . . . . . . . . . . . . . . . . . . . . . . . . . $(15,080) $ (7,133)
5. Funds Held – Directly Managed
Following Paris Re’s acquisition of substantially all of the reinsurance operations of Colisée Re (previouslyknown as AXA RE), a subsidiary of AXA SA (AXA), in 2006, Paris Re and its subsidiaries entered into anissuance agreement and a quota share retrocession agreement to assume business written by Colisée Re fromJanuary 1, 2006 to September 30, 2007 as well as the in-force business at December 31, 2005. The agreementsprovided that the premium related to the transferred business was retained by Colisée Re and credited to a fundsheld account. During the year ended December 31, 2011, the Company and Colisée Re entered into anendorsement to the quota share retrocession agreement, which resulted in a release of assets of approximately$358 million from the funds held – directly managed account to the Company.
The assets underlying the funds held – directly managed account are maintained by Colisée Re in asegregated investment portfolio and managed by the Company. The segregated investment portfolio underlyingthe funds held – directly managed account is carried at fair value. Realized and unrealized investment gains andlosses and net investment income related to the underlying investment portfolio in the funds held – directlymanaged account inure to the benefit of the Company.
166

(a) Fixed Maturities, Short-Term Investments, Other Invested Assets and Other Assets and Liabilities
The cost, gross unrealized gains, gross unrealized losses and fair value of investments underlying the fundsheld – directly managed account at December 31, 2011 and 2010 were as follows (in thousands of U.S. dollars):
December 31, 2011 Cost (1)
GrossUnrealized
Gains
GrossUnrealized
Losses Fair Value
Fixed maturitiesU.S. government and government sponsored
enterprises . . . . . . . . . . . . . . . . . . . . . . . . . . . . . . . . . . . $ 255,573 $12,966 $ — $ 268,539U.S. states, territories and municipalities . . . . . . . . . . . . . 373 — (39) 334Non-U.S. sovereign government, supranational and
government related . . . . . . . . . . . . . . . . . . . . . . . . . . . . 260,695 14,024 (54) 274,665Corporate . . . . . . . . . . . . . . . . . . . . . . . . . . . . . . . . . . . . . . 470,546 12,889 (2,950) 480,485
Total fixed maturities . . . . . . . . . . . . . . . . . . . . . . . . . . . . . . . . 987,187 39,879 (3,043) 1,024,023Short-term investments . . . . . . . . . . . . . . . . . . . . . . . . . . . . . . . 18,097 — — 18,097Other invested assets . . . . . . . . . . . . . . . . . . . . . . . . . . . . . . . . . 25,628 — (10,063) 15,565
Total . . . . . . . . . . . . . . . . . . . . . . . . . . . . . . . . . . . . . . . . . . . . . . $1,030,912 $39,879 $(13,106) $1,057,685
December 31, 2010 Cost (1)
GrossUnrealized
Gains
GrossUnrealized
Losses Fair Value
Fixed maturitiesU.S. government and government sponsored
enterprises . . . . . . . . . . . . . . . . . . . . . . . . . . . . . . . . . . . $ 280,414 $ 7,969 $ (219) $ 288,164U.S. states, territories and municipalities . . . . . . . . . . . . . 373 8 (13) 368Non-U.S. sovereign government, supranational and
government related . . . . . . . . . . . . . . . . . . . . . . . . . . . . 377,591 7,052 (90) 384,553Corporate . . . . . . . . . . . . . . . . . . . . . . . . . . . . . . . . . . . . . . 787,804 13,501 (2,718) 798,587Mortgage/asset-backed securities . . . . . . . . . . . . . . . . . . . 12,269 2,337 (2,488) 12,118
Total fixed maturities . . . . . . . . . . . . . . . . . . . . . . . . . . . . . . . . 1,458,451 30,867 (5,528) 1,483,790Short-term investments . . . . . . . . . . . . . . . . . . . . . . . . . . . . . . . 38,613 — — 38,613Other invested assets . . . . . . . . . . . . . . . . . . . . . . . . . . . . . . . . . 25,133 238 (4,741) 20,630
Total . . . . . . . . . . . . . . . . . . . . . . . . . . . . . . . . . . . . . . . . . . . . . . $1,522,197 $31,105 $(10,269) $1,543,033
(1) Cost is based on the fair value at the date of the acquisition of Paris Re and subsequently adjusted foramortization of fixed maturities and short-term investments.
In addition to the investments underlying the funds held – directly managed account in the above table atDecember 31, 2011 and 2010, were cash and cash equivalents of $176.3 million and $129.2 million, respectively,other assets and liabilities of $20.3 million and $80.0 million, respectively, and accrued investment income of$13.7 million and $19.9 million, respectively. The other assets and liabilities represent working capital assetsheld by Colisée Re related to the underlying business.
167

(b) Maturity Distribution of Fixed Maturities and Short-Term Investments
The distribution of fixed maturities and short-term investments underlying the funds held – directlymanaged account at December 31, 2011, by contractual maturity date, is shown below (in thousands of U.S.dollars). Actual maturities may differ from contractual maturities because certain borrowers have the right to callor prepay certain obligations with or without call or prepayment penalties.
Cost Fair Value
One year or less . . . . . . . . . . . . . . . . . . . . . . . . . . . . . . . . . . . . . . . . . . . . . . . . . . . . . . . . $ 226,988 $ 227,517More than one year through five years . . . . . . . . . . . . . . . . . . . . . . . . . . . . . . . . . . . . . . 553,586 572,896More than five years through ten years . . . . . . . . . . . . . . . . . . . . . . . . . . . . . . . . . . . . . . 199,821 214,636More than ten years . . . . . . . . . . . . . . . . . . . . . . . . . . . . . . . . . . . . . . . . . . . . . . . . . . . . . 24,889 27,071
Total . . . . . . . . . . . . . . . . . . . . . . . . . . . . . . . . . . . . . . . . . . . . . . . . . . . . . . . . . . . . . . . . $1,005,284 $1,042,120
(c) Net Realized and Unrealized Investment Gains (Losses)
The components of the net realized and unrealized investment gains (losses) on the funds held – directlymanaged account for the years ended December 31, 2011 and 2010 and for the period from October 2, 2009 toDecember 31, 2009 were as follows (in thousands of U.S. dollars):
2011 2010 2009
Net realized investment gains (losses) on fixed maturities and short terminvestments . . . . . . . . . . . . . . . . . . . . . . . . . . . . . . . . . . . . . . . . . . . . . . . . . . . . . . $ 5,369 $ 1,041 $(2,200)
Net realized investment (losses) gains on other invested assets . . . . . . . . . . . . . . . . (42) 1,635 —Change in net unrealized investment gains on fixed maturities and short-term
investments . . . . . . . . . . . . . . . . . . . . . . . . . . . . . . . . . . . . . . . . . . . . . . . . . . . . . . 12,314 27,568 1,920Change in net unrealized investment losses on other invested assets . . . . . . . . . . . (6,430) (2,892) (1,420)
Net realized and unrealized investment gains (losses) on funds held – directlymanaged . . . . . . . . . . . . . . . . . . . . . . . . . . . . . . . . . . . . . . . . . . . . . . . . . . . . . . . . $11,211 $27,352 $(1,700)
(d) Net Investment Income
The components of net investment income underlying the funds held – directly managed account for theyears ended December 31, 2011 and 2010 and for the period from October 2, 2009 to December 31, 2009 were asfollows (in thousands of U.S. dollars):
2011 2010 2009
Fixed maturities . . . . . . . . . . . . . . . . . . . . . . . . . . . . . . . . . . . . . . . . . . . . . . . . . . . . $31,542 $46,200 $10,956Short-term investments, cash and cash equivalents . . . . . . . . . . . . . . . . . . . . . . . . . 1,906 1,607 287Other . . . . . . . . . . . . . . . . . . . . . . . . . . . . . . . . . . . . . . . . . . . . . . . . . . . . . . . . . . . . . 5,402 6,078 6,934Investment expenses . . . . . . . . . . . . . . . . . . . . . . . . . . . . . . . . . . . . . . . . . . . . . . . . . (931) (2,110) (411)
Net investment income on funds held – directly managed . . . . . . . . . . . . . . . . . . . $37,919 $51,775 $17,766
168

6. Derivatives
The Company’s derivative instruments are recorded in the Consolidated Balance Sheets at fair value, withchanges in fair value mainly recognized in either net foreign exchange gains and losses or net realized andunrealized investment gains and losses in the Consolidated Statements of Operations or accumulated othercomprehensive income or loss in the Consolidated Balance Sheets, depending on the nature of the derivativeinstrument. The Company’s objectives for holding or issuing these derivatives are as follows:
Foreign Exchange Forward Contracts
The Company utilizes foreign exchange forward contracts as part of its overall currency risk managementand investment strategies. From time to time, the Company also utilizes foreign exchange forward contracts tohedge a portion of its net investment exposure resulting from the translation of its foreign subsidiaries andbranches whose functional currency is other than the U.S. dollar.
Foreign Currency Option Contracts and Futures Contracts
The Company utilizes foreign currency option contracts to mitigate foreign currency risk. The Companyuses exchange traded treasury note futures contracts to manage portfolio duration and commodity and equityfutures to hedge certain investments. The Company also uses commodities futures to replicate the investmentreturn on certain benchmarked commodities.
Credit Default Swaps
The Company purchases protection through credit default swaps to mitigate the risk associated with itsunderwriting operations, most notably in the credit/surety line, and to manage market exposures.
The Company also assumes credit risk through credit default swaps to replicate investment positions. Theoriginal term of these credit default swaps is generally five years or less and there are no recourse provisionsassociated with these swaps. While the Company would be required to perform under exposure assumed throughcredit default swaps in the event of a default on the underlying issuer, no issuer was in default at December 31,2011. The counterparties on the Company’s assumed credit default swaps are all highly rated financialinstitutions.
Insurance-Linked Securities
The Company has entered into various weather derivatives, weather futures and longevity total return swapsfor which the underlying risks reference parametric weather risks for the weather derivatives and weather futures,and longevity risk for the longevity total return swaps.
Total Return and Interest Rate Swaps and Interest Rate Derivatives
The Company has entered into total return swaps referencing various project, investments and principalfinance obligations. The Company has also entered into interest rate swaps to mitigate the interest rate risk oncertain of the total return swaps. The Company may also use other interest rate derivatives to mitigate exposureto interest rate volatility.
To-Be-Announced Mortgage-Backed Securities
The Company utilizes TBAs as part of its overall investment strategy and to enhance investmentperformance.
169

The fair values and the related notional values of derivatives included in the Company’s ConsolidatedBalance Sheets at December 31, 2011 and 2010 were as follows (in thousands of U.S. dollars):
Assetderivatives
at fairvalue
Liabilityderivatives
at fairvalue
Net derivatives
December 31, 2011Net notional
exposureFairvalue
Derivatives not designated as hedgesForeign exchange forward contracts . . . . . . . . . . . . . . . . . . . . . . . $ 7,865 $ (5,816) $2,555,230 $ 2,049Foreign currency option contracts . . . . . . . . . . . . . . . . . . . . . . . . . 1,074 (321) 110,079 753Futures contracts . . . . . . . . . . . . . . . . . . . . . . . . . . . . . . . . . . . . . . 13,572 (14,173) 2,534,995 (601)Credit default swaps (protection purchased) . . . . . . . . . . . . . . . . . 92 (1,285) 94,961 (1,193)Credit default swaps (assumed risks) . . . . . . . . . . . . . . . . . . . . . . 246 (772) 17,500 (526)Insurance-linked securities (1) . . . . . . . . . . . . . . . . . . . . . . . . . . . . . — (968) 136,375 (968)Total return swaps . . . . . . . . . . . . . . . . . . . . . . . . . . . . . . . . . . . . . 7,673 (640) 122,230 7,033Interest rate swaps (2) . . . . . . . . . . . . . . . . . . . . . . . . . . . . . . . . . . . — (7,992) — (7,992)TBAs . . . . . . . . . . . . . . . . . . . . . . . . . . . . . . . . . . . . . . . . . . . . . . . 747 (58) 104,315 689
Total derivatives . . . . . . . . . . . . . . . . . . . . . . . . . . . . . . . . . . . . . $31,269 $(32,025) $ (756)
Assetderivatives
at fairvalue
Liabilityderivatives
at fairvalue
Net derivatives
December 31, 2010Net notional
exposureFairvalue
Derivatives designated as hedgesForeign exchange forward contracts (net investment hedge) . . . . $ — $ (1,160) $ 198,448 $ (1,160)
Total derivatives designated as hedges . . . . . . . . . . . . . . . . . . . $ — $ (1,160) $ (1,160)
Derivatives not designated as hedgesForeign exchange forward contracts . . . . . . . . . . . . . . . . . . . . . . . $27,880 $(12,487) $1,770,448 $15,393Foreign currency option contracts . . . . . . . . . . . . . . . . . . . . . . . . . 3,516 — 104,386 3,516Futures contracts . . . . . . . . . . . . . . . . . . . . . . . . . . . . . . . . . . . . . . 30,593 (7,956) 1,756,811 22,637Credit default swaps (protection purchased) . . . . . . . . . . . . . . . . . 93 (2,407) 113,752 (2,314)Credit default swaps (assumed risks) . . . . . . . . . . . . . . . . . . . . . . 533 (401) 27,500 132Insurance-linked securities . . . . . . . . . . . . . . . . . . . . . . . . . . . . . . 1,320 (1,393) 88,765 (73)Total return swaps . . . . . . . . . . . . . . . . . . . . . . . . . . . . . . . . . . . . . 6,041 (12,848) 161,408 (6,807)Interest rate swaps (2) . . . . . . . . . . . . . . . . . . . . . . . . . . . . . . . . . . . 246 (6,033) — (5,787)TBAs . . . . . . . . . . . . . . . . . . . . . . . . . . . . . . . . . . . . . . . . . . . . . . . 363 (553) 149,065 (190)
Total derivatives not designated as hedges . . . . . . . . . . . . . . . . $70,585 $(44,078) $26,507
Total derivatives . . . . . . . . . . . . . . . . . . . . . . . . . . . . . . . . . . . . . $70,585 $(45,238) $25,347
(1) At December 31, 2011, insurance-linked securities include a longevity swap for which the notional amountis not reflective of the overall potential exposure of the swap. As such, the Company has included theprobable maximum loss under the swap within the net notional exposure as an approximation of thenotional amount.
(2) The Company enters into interest rate swaps to mitigate notional exposures on certain total return swaps.Accordingly, the notional value of interest rate swaps is not presented separately in the table.
The fair value of all derivatives at December 31, 2011 and 2010 is recorded in Other invested assets in theCompany’s Consolidated Balance Sheets. At December 31, 2011, none of the Company’s derivatives weredesignated as hedges. The effective portion of net investment hedging derivatives recognized in accumulatedother comprehensive income at December 31, 2010 was a loss of $1.2 million.
170

The gains and losses in the Consolidated Statements of Operations for derivatives not designated as hedgesfor the years ended December 31, 2011, 2010 and 2009 were as follows (in thousands of U.S. dollars):
2011 2010 2009
Foreign exchange forward contracts . . . . . . . . . . . . . . . . . . . . . . . . . . . . . . . . . $ 98,089 $ 65,973 $ 39,573Foreign currency option contracts . . . . . . . . . . . . . . . . . . . . . . . . . . . . . . . . . . . (9,927) 6,368 5,734
Total included in net foreign exchange gains and losses . . . . . . . . . . . . . . . $ 88,162 $ 72,341 $ 45,307Futures contracts . . . . . . . . . . . . . . . . . . . . . . . . . . . . . . . . . . . . . . . . . . . . . . . . $(185,816) $(81,789) $(10,147)Credit default swaps (protection purchased) . . . . . . . . . . . . . . . . . . . . . . . . . . . (352) (2,155) (15,535)Credit default swaps (assumed risks) . . . . . . . . . . . . . . . . . . . . . . . . . . . . . . . . . 886 918 7,062Insurance-linked securities . . . . . . . . . . . . . . . . . . . . . . . . . . . . . . . . . . . . . . . . . (9,584) 10,241 3,524Total return swaps . . . . . . . . . . . . . . . . . . . . . . . . . . . . . . . . . . . . . . . . . . . . . . . 2,473 4,029 22,083Interest rate swaps . . . . . . . . . . . . . . . . . . . . . . . . . . . . . . . . . . . . . . . . . . . . . . . (2,200) 2,374 4,190Interest rate derivatives . . . . . . . . . . . . . . . . . . . . . . . . . . . . . . . . . . . . . . . . . . . — (3,848) —TBAs . . . . . . . . . . . . . . . . . . . . . . . . . . . . . . . . . . . . . . . . . . . . . . . . . . . . . . . . . 15,366 1,737 (858)Other . . . . . . . . . . . . . . . . . . . . . . . . . . . . . . . . . . . . . . . . . . . . . . . . . . . . . . . . . . — (158) 107
Total included in net realized and unrealized investment gains andlosses . . . . . . . . . . . . . . . . . . . . . . . . . . . . . . . . . . . . . . . . . . . . . . . . . . . . . . . $(179,227) $(68,651) $ 10,426
Total derivatives . . . . . . . . . . . . . . . . . . . . . . . . . . . . . . . . . . . . . . . . . . . . . . . . $ (91,065) $ 3,690 $ 55,733
7. Business Combination
On July 4, 2009, the Company entered into definitive agreements to effect a multi-step acquisition of all theoutstanding common shares and warrants of Paris Re, a French listed, Swiss based holding company and itsoperating subsidiaries. In July 2009, the Company purchased approximately 6% of the outstanding Paris Recommon shares. On October 2, 2009, the Company closed its block purchase of Paris Re’s common shares andwarrants which represented, in the aggregate, approximately 77% of the outstanding common shares of Paris Re,resulting in the Company’s ownership of Paris Re’s common shares increasing to approximately 83%.Subsequent to October 2, 2009, the Company acquired additional common shares of Paris Re and effected aMerger, resulting in the Company obtaining 100% ownership of Paris Re on December 7, 2009. The Companyissued its common shares, in exchange for Paris Re common shares and warrants, for all steps of the acquisition.
The aggregate purchase price paid by the Company to acquire 100% of the outstanding Paris Re commonshares and warrants was $1,979.7 million for total identifiable net assets acquired, at fair value, of $1,953.7million. The Company recorded goodwill of $26.0 million related to the acquisition (see Note 8).
The Consolidated Statements of Operations and Cash Flows include results of Paris Re for the period fromOctober 2, 2009, the Acquisition Date. For the period from October 2, 2009 to December 7, 2009, Paris Re hadnon-controlling interests. Net income attributable to Paris Re’s non-controlling interests during this period was$4.3 million, and has been recorded within other income in the Consolidated Statement of Operations.
171

8. Goodwill and Intangible Assets
The following tables show the Company’s goodwill and intangible assets at December 31, 2011 and 2010(in thousands of U.S. dollars):
2011 Goodwill
Definite-lived intangible
assets
Indefinite-lived intangible
asset Total
Balance at January 1, 2011 . . . . . . . . . . . . . . . . . . . . . . . . . $455,533 $171,365 $7,350 $634,248Intangible assets amortization . . . . . . . . . . . . . . . . . . . . . . . — (44,848) — (44,848)
Balance at December 31, 2011 . . . . . . . . . . . . . . . . . . . . . . $455,533 $126,517 $7,350 $589,400
2010 Goodwill
Definite-lived intangible
assets
Indefinite-lived intangible
asset Total
Balance at January 1, 2010 . . . . . . . . . . . . . . . . . . . . . . . . . $455,533 $239,919 $7,350 $702,802Intangible assets amortization . . . . . . . . . . . . . . . . . . . . . . . — (68,554) — (68,554)
Balance at December 31, 2010 . . . . . . . . . . . . . . . . . . . . . . $455,533 $171,365 $7,350 $634,248
Intangible asset amortization during the years ended December 31, 2011, 2010 and 2009 totaled $44.8million, $68.6 million and $40.3 million, respectively, of which $8.4 million, $37.1 million and $46.4 million,respectively, is recorded within acquisition costs and $36.4 million, $31.5 million and $(6.1) million,respectively, is recorded within amortization of intangible assets in the Consolidated Statements of Operations.The amounts recorded within acquisition costs in the Consolidated Statements of Operations approximates theamount of Paris Re’s deferred acquisition costs that would have been recorded as acquisition costs had they notbeen fair valued under purchase accounting.
The gross carrying value and accumulated amortization of intangible assets by type at December 31, 2011and 2010 is as follows (in thousands of U.S. dollars):
2011 2010
Gross carryingvalue
Accumulatedamortization
Gross carryingvalue
Accumulatedamortization
Definite-lived intangible assets:Unpaid losses and loss expenses . . . . . . . . . . . . . . $191,196 $ 72,854 $191,196 $ 44,076Unearned premiums . . . . . . . . . . . . . . . . . . . . . . . . 56,300 56,300 56,300 51,130Renewal rights . . . . . . . . . . . . . . . . . . . . . . . . . . . . 32,700 24,525 32,700 13,625
Total definite-lived intangible assets . . . . . . . . . . . . . . . $280,196 $153,679 $280,196 $108,831Indefinite-lived intangible asset:
U.S. insurance licenses . . . . . . . . . . . . . . . . . . . . . 7,350 — 7,350 —
Total intangible assets . . . . . . . . . . . . . . . . . . . . . . . . . . $287,546 $153,679 $287,546 $108,831
172

At December 31, 2011 and 2010, the allocation of the goodwill among the Company’s segments andsub-segments was as follows (in thousands of U.S. dollars):
Amount
Non-life segment:North America . . . . . . . . . . . . . . . . . . . . . . . . . . . . . . . . $ 82,026Global (Non-U.S.) P&C . . . . . . . . . . . . . . . . . . . . . . . . . 149,895Global (Non-U.S.) Specialty . . . . . . . . . . . . . . . . . . . . . 179,641Catastrophe . . . . . . . . . . . . . . . . . . . . . . . . . . . . . . . . . . . 26,014
Life segment . . . . . . . . . . . . . . . . . . . . . . . . . . . . . . . . . . . . . . 17,957
Total goodwill . . . . . . . . . . . . . . . . . . . . . . . . . . . . . . . . . . . . $455,533
The estimated amortization expense for each of the five succeeding fiscal years related to the Company’sdefinite-lived intangible assets is as follows (in thousands of U.S. dollars):
Period Amount
2012 . . . . . . . . . . . . . . . . . . . . . . . . . . . . . . . . . . . . . . . . . . . . . $31,7992013 . . . . . . . . . . . . . . . . . . . . . . . . . . . . . . . . . . . . . . . . . . . . . 19,4792014 . . . . . . . . . . . . . . . . . . . . . . . . . . . . . . . . . . . . . . . . . . . . . 15,9502015 . . . . . . . . . . . . . . . . . . . . . . . . . . . . . . . . . . . . . . . . . . . . . 13,9002016 . . . . . . . . . . . . . . . . . . . . . . . . . . . . . . . . . . . . . . . . . . . . . 12,034
Total . . . . . . . . . . . . . . . . . . . . . . . . . . . . . . . . . . . . . . . . . . . . . $93,162
9. Unpaid Losses and Loss Expenses and Policy Benefits for Life and Annuity Contracts
(a) Unpaid Losses and Loss Expenses
Unpaid losses and loss expenses are categorized into three types of reserves: reported outstanding lossreserves (case reserves), additional case reserves (ACRs) and incurred but not reported (IBNR) reserves. Casereserves represent unpaid losses reported by the Company’s cedants and recorded by the Company. ACRs areestablished for particular circumstances where, on the basis of individual loss reports, the Company estimatesthat the particular loss or collection of losses covered by a treaty may be greater than those advised by the cedant.IBNR reserves represent a provision for claims that have been incurred but not yet reported to the Company, aswell as future loss development on losses already reported, in excess of the case reserves and ACRs. Thefollowing table shows the Company’s gross liability for unpaid losses and loss expenses reported by cedants(case reserves) and those estimated by the Company (ACRs and IBNR reserves) at December 31, 2011 and 2010(in thousands of U.S. dollars):
2011 2010
Case reserves . . . . . . . . . . . . . . . . . . . . . . . . . . . . . . . . . . . . . . . . . . . . . . . . . . . . . . . . $ 5,187,761 $ 4,652,281ACRs . . . . . . . . . . . . . . . . . . . . . . . . . . . . . . . . . . . . . . . . . . . . . . . . . . . . . . . . . . . . . . 495,593 326,721IBNR reserves . . . . . . . . . . . . . . . . . . . . . . . . . . . . . . . . . . . . . . . . . . . . . . . . . . . . . . . 5,589,737 5,687,602
Total unpaid losses and loss expenses . . . . . . . . . . . . . . . . . . . . . . . . . . . . . . . . . . . . $11,273,091 $10,666,604
173

The table below is a reconciliation of the beginning and ending gross and net liability for unpaid losses andloss expenses, excluding policy benefits for life and annuity contracts, for the years ended December 31, 2011,2010 and 2009 (in thousands of U.S. dollars):
2011 2010 2009
Gross liability at beginning of year . . . . . . . . . . . . . . . . . . . . . . . . . . . $10,666,604 $10,811,483 $ 7,510,666Reinsurance recoverable at beginning of year . . . . . . . . . . . . . . . . . . 348,747 336,352 125,215
Net liability at beginning of year . . . . . . . . . . . . . . . . . . . . . . . . . . . . 10,317,857 10,475,131 7,385,451Net liability acquired related to Paris Re . . . . . . . . . . . . . . . . . . . . . . — — 3,176,255Net incurred losses related to:Current year . . . . . . . . . . . . . . . . . . . . . . . . . . . . . . . . . . . . . . . . . . . . . 4,252,766 3,137,874 2,340,768Prior years . . . . . . . . . . . . . . . . . . . . . . . . . . . . . . . . . . . . . . . . . . . . . . (530,457) (477,883) (485,809)
3,722,309 2,659,991 1,854,959Change in Paris Re Reserve Agreement . . . . . . . . . . . . . . . . . . . . . . . (61,383) (66,783) (32,027)
Net paid losses related to:Current year . . . . . . . . . . . . . . . . . . . . . . . . . . . . . . . . . . . . . . . . . . . . . 930,407 311,253 327,080Prior years . . . . . . . . . . . . . . . . . . . . . . . . . . . . . . . . . . . . . . . . . . . . . . 2,060,152 2,267,765 1,716,798
2,990,559 2,579,018 2,043,878Effects of foreign exchange rate changes . . . . . . . . . . . . . . . . . . . . . . (68,238) (171,464) 134,371
Net liability at end of year . . . . . . . . . . . . . . . . . . . . . . . . . . . . . . . . . . 10,919,986 10,317,857 10,475,131Reinsurance recoverable at end of year . . . . . . . . . . . . . . . . . . . . . . . 353,105 348,747 336,352
Gross liability at end of year . . . . . . . . . . . . . . . . . . . . . . . . . . . . . . . . $11,273,091 $10,666,604 $10,811,483
The table below is a reconciliation of losses and loss expenses including life policy benefits for the yearsended December 31, 2011, 2010 and 2009 (in thousands of U.S. dollars):
2011 2010 2009
Net incurred losses related to:Non-life . . . . . . . . . . . . . . . . . . . . . . . . . . . . . . . . . . . . . . . . . . . . . . . . . . . $3,722,309 $2,659,991 $1,854,959Life . . . . . . . . . . . . . . . . . . . . . . . . . . . . . . . . . . . . . . . . . . . . . . . . . . . . . . 650,261 623,627 440,337
Losses and loss expenses and life policy benefits . . . . . . . . . . . . . . . . . . . $4,372,570 $3,283,618 $2,295,296
The following table summarizes the prior year net favorable development of loss reserves for each of theCompany’s Non-life sub-segments for the years ended December 31, 2011, 2010 and 2009 (in thousands of U.S.dollars):
2011 2010 2009
Prior year net favorable loss development:Non-life sub-segment
North America . . . . . . . . . . . . . . . . . . . . . . . . . . . . . . . . . . . . . . . . . . . . . . $189,180 $165,780 $177,571Global (Non-U.S.) P&C . . . . . . . . . . . . . . . . . . . . . . . . . . . . . . . . . . . . . . . 115,995 97,539 151,456Global (Non-U.S.) Specialty . . . . . . . . . . . . . . . . . . . . . . . . . . . . . . . . . . . 128,975 170,931 107,632Catastrophe . . . . . . . . . . . . . . . . . . . . . . . . . . . . . . . . . . . . . . . . . . . . . . . . . 96,307 43,633 49,150
Total net Non-life prior year loss development . . . . . . . . . . . . . . . . . . . . . . . . . $530,457 $477,883 $485,809
Within the Company’s North America sub-segment, the Company reported net favorable loss development forprior accident years in 2011, 2010 and 2009. The net favorable loss development in 2011 included net favorabledevelopment for prior accident years in most lines of business, predominantly in the casualty line, while the credit/surety and motor lines experienced combined adverse loss development for prior accident years of $11 million. The
174

net favorable loss development in 2010 included net favorable development for prior accident years in most lines ofbusiness, predominantly in the casualty and agriculture lines, while the motor line of business experienced adverseloss development for prior accident years of $8 million. The net favorable loss development in 2009 included netfavorable development for prior accident years in most lines of business, predominantly in the casualty line, whilethe multiline line experienced adverse loss development for prior accident years of $8 million. The net favorableloss development in each year was primarily due to favorable loss emergence. Loss information provided by cedantsduring each of these years for prior accident years was lower than the Company expected and included noindividually material losses or reductions but a series of attritional losses or reductions. Attritional losses are lossesthat may not be significant on an individual basis, but are monitored on an aggregated basis by the Company toidentify trends that may be meaningful from a reserving standpoint.
For the Global (Non-U.S.) P&C sub-segment, the Company reported net favorable loss development forprior accident years in 2011, 2010 and 2009. The net favorable loss development in 2011 included net favorabledevelopment for prior accident years in all lines of business and was most pronounced in the motor line. The netfavorable loss development in 2010 included net favorable development for prior accident years in all lines ofbusiness, but was most pronounced in the property line. The net favorable loss development in 2009 included netfavorable development for prior accident years in all lines of business, but was most pronounced in the motor andcasualty lines. The net favorable loss development in each year was primarily due to favorable loss emergence.Loss information provided by cedants during each of these years for prior accident years was lower than theCompany expected and included no individually significant losses or reductions but a series of attritional lossesor reductions.
For the Global (Non-U.S.) Specialty sub-segment, the Company reported net favorable loss development forprior accident years in 2011, 2010 and 2009. The net favorable loss development in 2011 included net favorabledevelopment for prior accident years in most lines of business, except for the energy and engineering lines,which experienced combined adverse loss development for prior accident years of $13 million. The adverse lossdevelopment for prior accident years in the energy and engineering lines was driven by the increases in upwardpremium adjustments reported by cedants in 2011. The net favorable loss development in 2010 included netfavorable development for prior accident years in all lines of business, except for the specialty casualty line,which experienced adverse loss development for prior accident years of $37 million. The net favorable lossdevelopment in 2009 included net favorable development for prior accident years in most lines of business,predominantly in the aviation and engineering lines, while the agriculture and credit/surety lines experiencedcombined adverse loss development for prior accident years. The net favorable loss development in each yearwas primarily due to favorable loss emergence. Loss information provided by cedants during each of these yearsfor prior accident years was lower than the Company expected and included no individually significant losses orreductions but a series of attritional losses or reductions.
For the Catastrophe sub-segment, the Company reported net favorable loss development for prior accidentyears in 2011, 2010 and 2009. The net favorable loss development in each year was primarily due to favorableloss emergence, as losses reported by cedants for prior accident years were lower than the Company expected.
(b) Paris Re Reserve Agreement
Following Paris Re’s acquisition of substantially all of the reinsurance operations of Colisée Re in 2006,Paris Re’s French operating subsidiary (Paris Re France) entered into a reserve agreement (Reserve Agreement),which provides that AXA and Colisée Re shall guarantee reserves in respect of Paris Re France and subsidiariesacquired in the acquisition. The Reserve Agreement relates to losses incurred prior to December 31, 2005.Accordingly, the Company’s Consolidated Statements of Operations do not include any favorable or adversedevelopment related to these guaranteed reserves. The reserve guarantee provided by AXA and Colisée Re isconditioned upon, among other things, the guaranteed business, including all related ceded reinsurance, beingmanaged by AXA Liabilities Managers, an affiliate of Colisée Re.
175

Favorable or adverse development related to the guaranteed reserves is recorded as a change in unpaidlosses and loss expenses in the Consolidated Balance Sheets and as a change in the Reserve Agreement payableor receivable balance to/from Colisée Re, which is included within Other reinsurance balances payable in theConsolidated Balance Sheets. Accordingly, the reconciliation of the beginning and ending gross and net liabilityfor unpaid losses and loss expenses for the years ended December 31, 2011, 2010 and 2009 includes the changein the Reserve Agreement. At December 31, 2011 and 2010, the Company’s net liability for unpaid losses andloss expenses includes $1,012 million and $1,239 million, respectively, of guaranteed reserves and Otherreinsurance balances payable includes $183 million and $128 million, respectively, payable to Colisée Re relatedto the Reserve Agreement.
(c) Claims Related to Catastrophic Events
Loss estimates arising from earthquakes are inherently more uncertain than those from other catastrophicevents. The Company’s actual losses from the earthquakes that occurred in New Zealand in September 2010(2010 New Zealand Earthquake) and in February and June 2011 (February and June 2011 New ZealandEarthquakes) may materially exceed the estimated losses as a result of, among other things, an increase inindustry insured loss estimates, the expected lengthy claims development period, in particular for earthquakerelated losses, and the receipt of additional information from cedants, brokers and loss adjusters. In addition, theCompany’s loss estimate related to the Japan Earthquake is inherently more uncertain than those from othercatastrophic events given the characteristics of the Company’s reinsurance portfolio in the region. Further,changes in loss assumptions for specific cedants may have a material impact on the Company’s loss estimaterelated to this event given a significant portion of the losses are concentrated with a few large cedants. TheCompany believes there remains a high degree of uncertainty regarding its loss estimates related to the 2010 andthe February and June 2011 New Zealand Earthquakes and the Japan Earthquake, and the ultimate losses arisingfrom these events may be materially in excess of, or less than, the amounts provided for in the ConsolidatedBalance Sheet at December 31, 2011. Any adjustments to the Company’s preliminary estimate of its ultimatelosses related to these events will be reflected in the periods in which they are determined, which may affect theCompany’s operating results in future periods.
(d) Asbestos and Environmental Claims
The Company’s net reserves for unpaid losses and loss expenses at December 31, 2011 and 2010 included$195 million and $214 million, respectively, that represent estimates of its net ultimate liability for asbestos andenvironmental claims. The gross liability for such claims at December 31, 2011 and 2010 was $203 million and$222 million, respectively, which primarily relate to Paris Re’s gross liability for asbestos and environmentalclaims for accident years 2005 and prior of $127 million and $144 million, respectively, with any favorable oradverse development being subject to the Reserve Agreement. Of the remaining $76 million and $78 million,respectively, in gross reserves, the majority relates to casualty exposures in the United States arising frombusiness written by PartnerRe SA and PartnerRe U.S.
Ultimate loss estimates for such claims cannot be estimated using traditional reserving techniques and thereare significant uncertainties in estimating the amount of the Company’s potential losses for these claims. In viewof the legal and tort environment that affect the development of such claims, the uncertainties inherent inestimating asbestos and environmental claims are not likely to be resolved in the near future. There can be noassurance that the reserves established by the Company will not be adversely affected by development of otherlatent exposures, and further, there can be no assurance that the reserves established by the Company will beadequate. The Company does, however, actively evaluate potential exposure to asbestos and environmentalclaims and establishes additional reserves as appropriate. The Company believes that it has made a reasonableprovision for these exposures and is unaware of any specific issues that would materially affect its unpaid lossesand loss expense reserves related to this exposure.
176

(e) Policy Benefits for Life and Annuity Contracts
The Life segment reported net favorable loss development for prior accident years of $1 million and$15 million for the years ended December 31, 2011 and 2009, respectively, and net adverse loss development forprior accident years of $12 million for the year ended December 31, 2010.
The modest net favorable prior year loss development of $1 million in 2011 was the net result of favorableprior year loss development of $6 million on certain mortality treaties and $5 million related to the guaranteedminimum death benefit (GMDB) business, which were almost entirely offset by adverse prior year lossdevelopment related to disability riders on certain short-term non-proportional treaties in the mortality linefollowing the receipt of updated information from cedants.
The net adverse prior year loss development of $12 million in 2010 was primarily driven by adversedevelopment of $23 million due to an improvement in the mortality trend related to an impaired life annuitytreaty in the longevity line and adverse development on certain mortality treaties. This adverse development waspartially offset by favorable prior year loss development of $17 million resulting from the GMDB business,where the payout is linked to the performance of underlying capital market assets, driven by new cedantinformation and updated assumptions.
The net favorable prior year loss development of $15 million in 2009 was mainly driven by the GMDBbusiness.
The Company used interest rate assumptions to estimate its liabilities for policy benefits for life and annuitycontracts which ranged from 1.0% to 7.0% and 1.0% to 6.0% at December 31, 2011 and 2010, respectively.
10. Reinsurance
(a) Reinsurance Recoverable on Paid and Unpaid Losses
The Company uses retrocessional agreements to reduce its exposure to risk of loss on reinsurance assumed.These agreements provide for recovery from retrocessionaires of a portion of losses and loss expenses. TheCompany remains liable to its cedants to the extent that the retrocessionaires do not meet their obligations underthese agreements, and therefore the Company evaluates the financial condition of its reinsurers and monitorsconcentration of credit risk on an ongoing basis. The Company actively manages its reinsurance exposures bygenerally selecting retrocessionaires having a credit rating of A- or higher. In certain cases where an otherwisesuitable retrocessionaire has a credit rating lower than A-, the Company generally requires the posting ofcollateral, including escrow funds and letters of credit, as a condition to its entering into a retrocessionagreement. The selection of retrocessionaires follows a precise qualitative and quantitative process. TheCompany regularly reviews its reinsurance recoverable balances to estimate an allowance for uncollectibleamounts based on quantitative and qualitative factors. The allowance for uncollectible reinsurance recoverablewas $12.5 million and $6.9 million at December 31, 2011 and 2010, respectively.
177

(b) Ceded Reinsurance
Net premiums written, net premiums earned and losses and loss expenses and life policy benefits arereported net of reinsurance in the Company’s Consolidated Statements of Operations. Assumed, ceded and netamounts for the years ended December 31, 2011, 2010 and 2009 were as follows (in thousands of U.S. dollars):
PremiumsWritten
PremiumsEarned
Losses and LossExpenses and Life
Policy Benefits
2011
Assumed . . . . . . . . . . . . . . . . . . . . . . . . . . . . . . . . . . . . . . . . . . . . . . . $4,633,054 $4,789,293 $4,456,094Ceded . . . . . . . . . . . . . . . . . . . . . . . . . . . . . . . . . . . . . . . . . . . . . . . . . 146,725 141,539 83,524
Net . . . . . . . . . . . . . . . . . . . . . . . . . . . . . . . . . . . . . . . . . . . . . . . . . . . $4,486,329 $4,647,754 $4,372,5702010
Assumed . . . . . . . . . . . . . . . . . . . . . . . . . . . . . . . . . . . . . . . . . . . . . . . $4,885,266 $4,956,897 $3,399,157Ceded . . . . . . . . . . . . . . . . . . . . . . . . . . . . . . . . . . . . . . . . . . . . . . . . . 180,150 180,426 115,539
Net . . . . . . . . . . . . . . . . . . . . . . . . . . . . . . . . . . . . . . . . . . . . . . . . . . . $4,705,116 $4,776,471 $3,283,618
2009
Assumed . . . . . . . . . . . . . . . . . . . . . . . . . . . . . . . . . . . . . . . . . . . . . . . $4,000,888 $4,202,379 $2,313,951Ceded . . . . . . . . . . . . . . . . . . . . . . . . . . . . . . . . . . . . . . . . . . . . . . . . . 52,184 82,554 18,655
Net . . . . . . . . . . . . . . . . . . . . . . . . . . . . . . . . . . . . . . . . . . . . . . . . . . . $3,948,704 $4,119,825 $2,295,296
11. Debt
Senior Notes
In March 2010, PartnerRe Finance B LLC (PartnerRe Finance B), an indirect wholly-owned subsidiary ofthe Company, issued $500 million aggregate principal amount of 5.500% Senior Notes (2010 Senior Notes, orcollectively with the 2008 Senior Notes defined below referred to as Senior Notes). The 2010 Senior Notes willmature on June 1, 2020 and may be redeemed at the option of the issuer, in whole or in part, at any time. Intereston the 2010 Senior Notes is payable semi-annually and commenced on June 1, 2010 at an annual fixed rate of5.500%, and cannot be deferred.
The 2010 Senior Notes are ranked as senior unsecured obligations of PartnerRe Finance B. The Companyhas fully and unconditionally guaranteed all obligations of PartnerRe Finance B under the 2010 Senior Notes.The Company’s obligations under this guarantee are senior and unsecured and rank equally with all other seniorunsecured indebtedness of the Company.
Contemporaneously, PartnerRe U.S. Holdings, a wholly-owned subsidiary of the Company, issued a 5.500%promissory note, with a principal amount of $500 million to PartnerRe Finance B. Under the terms of thepromissory note, PartnerRe U.S. Holdings promises to pay to PartnerRe Finance B the principal amount onJune 1, 2020, unless previously paid. Interest on the promissory note commenced on June 1, 2010 and is payablesemi-annually at an annual fixed rate of 5.500%, and cannot be deferred.
For the years ended December 31, 2011 and 2010, the Company incurred interest expense of $27.5 millionand $21.8 million, respectively, and paid interest of $27.5 million and $19.6 million, respectively, in relation tothe 2010 Senior Notes issued by PartnerRe Finance B.
In May 2008, PartnerRe Finance A LLC (PartnerRe Finance A), an indirect wholly-owned subsidiary of theCompany, issued $250 million aggregate principal amount of 6.875% Senior Notes (2008 Senior Notes, or collectivelywith 2010 Senior Notes referred to as Senior Notes). The 2008 Senior Notes will mature on June 1, 2018 and may beredeemed at the option of the issuer, in whole or in part, at any time. Interest on the 2008 Senior Notes is payable semi-annually and commenced on December 1, 2008 at an annual fixed rate of 6.875%, and cannot be deferred.
178

The 2008 Senior Notes are ranked as senior unsecured obligations of PartnerRe Finance A. The Companyhas fully and unconditionally guaranteed all obligations of PartnerRe Finance A under the 2008 Senior Notes.The Company’s obligations under this guarantee are senior and unsecured and rank equally with all other seniorunsecured indebtedness of the Company.
Contemporaneously, PartnerRe U.S. Holdings issued a 6.875% promissory note, with a principal amount of$250 million to PartnerRe Finance A. Under the terms of the promissory note, PartnerRe U.S. Holdings promisesto pay to PartnerRe Finance A the principal amount on June 1, 2018, unless previously paid. Interest on thepromissory note is payable semi-annually and commenced on December 1, 2008 at an annual fixed rate of6.875%, and cannot be deferred.
For the years ended December 31, 2011, 2010 and 2009, the Company incurred interest expense of$17.2 million, $17.2 million and $17.2 million, respectively, and paid interest of $17.2 million, $17.2 million and$17.2 million, respectively, in relation to the 2008 Senior Notes issued by PartnerRe Finance A.
Capital Efficient Notes (CENts)
In November 2006, PartnerRe Finance II Inc. (PartnerRe Finance II), an indirect wholly-owned subsidiaryof the Company, issued $250 million aggregate principal amount of 6.440% Fixed-to-Floating Rate JuniorSubordinated CENts. The CENts will mature on December 1, 2066 and may be redeemed at the option of theissuer, in whole or in part, after December 1, 2016 or earlier upon occurrence of specific rating agency or taxevents. Interest on the CENts is payable semi-annually and commenced on June 1, 2007 through to December 1,2016 at an annual fixed rate of 6.440% and will be payable quarterly thereafter until maturity at an annual rate of3-month LIBOR plus a margin equal to 2.325%.
PartnerRe Finance II may elect to defer one or more interest payments for up to ten years, although interestwill continue to accrue and compound at the rate of interest applicable to the CENts. The CENts are ranked asjunior subordinated unsecured obligations of PartnerRe Finance II. The Company has fully and unconditionallyguaranteed on a subordinated basis all obligations of PartnerRe Finance II under the CENts. The Company’sobligations under this guarantee are unsecured and rank junior in priority of payments to the Company’s SeniorNotes.
Contemporaneously, PartnerRe U.S. Holdings issued a 6.440% Fixed-to-Floating Rate promissory note,with a principal amount of $257.6 million to PartnerRe Finance II. Under the terms of the promissory note,PartnerRe U.S. Holdings promises to pay to PartnerRe Finance II the principal amount on December 1, 2066,unless previously paid. Interest on the promissory note is payable semi-annually and commenced on June 1, 2007through to December 1, 2016 at an annual fixed rate of 6.440% and will be payable quarterly thereafter untilmaturity at an annual rate of 3-month LIBOR plus a margin equal to 2.325%.
On March 13, 2009, PartnerRe Finance II, under the terms of a tender offer, paid holders $500 per$1,000 principal amount of CENts tendered, and purchased approximately 75% of the issue, or $186.6 million,for $93.3 million. Contemporaneously, under the terms of a cross receipt agreement, PartnerRe U.S. Holdingspaid PartnerRe Finance II consideration of $93.3 million for the extinguishment of $186.6 million of theprincipal amount of PartnerRe U.S. Holdings’ 6.440% Fixed-to-Floating Rate promissory note due December 1,2066. All other terms and conditions of the remaining CENts and promissory note remain unchanged. A pre-taxgain of $88.4 million, net of deferred issuance costs and fees, was realized on the foregoing transactions duringthe year ended December 31, 2009. The aggregate principal amount of the CENts and promissory noteoutstanding at December 31, 2011 and 2010 was $63.4 million and $71.0 million, respectively.
For the years ended December 31, 2011, 2010 and 2009, the Company incurred interest expense of$4.6 million, $4.6 million and $7.0 million, respectively, and paid interest of $4.6 million, $4.6 million and$8.0 million, respectively.
179

Long-term Debt
In October 2005, the Company entered into a loan agreement with Citibank, N.A., under which theCompany borrowed $400 million. The loan had an original maturity of April 27, 2009 and bore interest quarterlyat a floating rate of 3-month LIBOR plus 0.50%. In July 2008, under the terms of a loan amendment entered intowith Citibank N.A., the maturity of half of the original $400 million loan was extended to July 12, 2010 withinterest quarterly at a floating rate of 3-month LIBOR plus 0.50% through April 27, 2009 and at a rate of3-month LIBOR plus 0.85% thereafter.
On January 14, 2009, the Company elected to repay the first half of the original $400 million loan that wasdue on April 27, 2009.
On July 12, 2010, the Company repaid the $200 million remaining half of the original $400 million loan.
For the years ended December 31, 2010 and 2009, the Company incurred interest expense of $1.2 millionand $3.9 million, respectively, and paid interest of $1.6 million and $6.3 million, respectively, in relation to thisloan.
12. Shareholders’ Equity
Authorized Shares
At December 31, 2011 and 2010, the total authorized shares of the Company were 200 million shares, parvalue $1.00 per share, as follows (in millions of shares):
2011 2010
Designated common shares . . . . . . . . . . . . . . . . . . . . . . . . . . . . . . . . . . . . . . . . . . . . . . . . . . . . . . . 130.0 130.0Designated 6.75% Series C cumulative redeemable preferred shares . . . . . . . . . . . . . . . . . . . . . . 11.6 11.6Designated 6.5% Series D cumulative redeemable preferred shares . . . . . . . . . . . . . . . . . . . . . . . 9.2 9.2Designated 7.25% Series E cumulative redeemable preferred shares . . . . . . . . . . . . . . . . . . . . . . 15.0 —Designated and redeemed preference shares . . . . . . . . . . . . . . . . . . . . . . . . . . . . . . . . . . . . . . . . . . 14.0 14.0Undesignated . . . . . . . . . . . . . . . . . . . . . . . . . . . . . . . . . . . . . . . . . . . . . . . . . . . . . . . . . . . . . . . . . . 20.2 35.2
200.0 200.0
Common Shares
Share repurchases
During 2011, the Company repurchased, under its authorized share repurchase program, 5.4 million of itscommon shares at a total cost of $396.2 million, representing an average cost of $73.41 per share. AtDecember 31, 2011, the Company had approximately 5.3 million common shares remaining under its currentshare repurchase authorization and approximately 19.4 million common shares were held in treasury and areavailable for reissuance.
During 2010, the Company repurchased, under its authorized share repurchase program, 14.0 million of itscommon shares at a total cost of $1,082.6 million, representing an average cost of $77.10 per share.
During 2009, no shares were repurchased.
Share issuance
During 2010, the Company’s remaining $200 million forward sale agreement matured. The Company didnot deliver any common shares to the forward counterparty (see Note 19).
During 2009, pursuant to the acquisition of Paris Re, the Company issued 25.7 million common shares, ofwhich 1.3 million common shares were reissued from treasury.
180

Cumulative Redeemable Preferred Shares
The Company has issued Series C, Series D and Series E cumulative redeemable preferred shares (Series C,D and E preferred shares) as follows (in millions of U.S. dollars or shares, except percentage amounts):
Series C Series D Series E
Date of issuance . . . . . . . . . . . . . . . . . . . . . . . . . . . . . . . . . . . . . . . May 2003 November 2004 June 2011Number of preferred shares issued . . . . . . . . . . . . . . . . . . . . . . . . . 11.6 9.2 15.0Annual dividend rate . . . . . . . . . . . . . . . . . . . . . . . . . . . . . . . . . . . . 6.75% 6.5% 7.25%Total consideration . . . . . . . . . . . . . . . . . . . . . . . . . . . . . . . . . . . . . $ 280.9 $ 222.3 $ 361.7Underwriting discounts and commissions . . . . . . . . . . . . . . . . . . . $ 9.1 $ 7.7 $ 12.1Aggregate liquidation value . . . . . . . . . . . . . . . . . . . . . . . . . . . . . . $ 290.0 $ 230.0 $ 373.8
During 2011, the Company raised proceeds, before underwriting discounts and commissions, of $374mfrom the issuance of Series E preferred shares.
The Company may redeem each of the Series C, D and E preferred shares at $25.00 per share plus accruedand unpaid dividends without interest as follows: (i) each of the Series C and D preferred shares can be redeemedat our option at any time or in part from time to time, and (ii) the Series E preferred shares can be redeemed atour option on or after June 1, 2016 or at any time upon certain changes in tax law. Dividends on each of theSeries C, D and E preferred shares are cumulative from the date of issuance and are payable quarterly in arrears.
In the event of liquidation of the Company, each series of outstanding preferred shares ranks on parity witheach other series of preference shares and would rank senior to the common shares, and holders thereof wouldreceive a distribution of $25.00 per share, or the aggregate liquidation value for each of the Series C, D and Epreferred shares, respectively, plus accrued and unpaid dividends, if any.
13. Net (Loss) Income per Share
The reconciliation of basic and diluted net (loss) income per share for the years ended December 31, 2011,2010 and 2009 is as follows (in thousands of U.S. dollars or shares, except per share amounts):
For the year endedDecember 31,
2011
For the year endedDecember 31,
2010
For the year endedDecember 31,
2009 (1)
Numerator:Net (loss) income . . . . . . . . . . . . . . . . . . . . . . . . . . . . . $(520,291) $ 852,552 $1,536,854Less: preferred dividends . . . . . . . . . . . . . . . . . . . . . . . (47,020) (34,525) (34,525)
Net (loss) income available to commonshareholders . . . . . . . . . . . . . . . . . . . . . . . . . . . . . . . . $(567,311) $ 818,027 $1,502,329
Denominator:Weighted number of common shares outstanding—
basic . . . . . . . . . . . . . . . . . . . . . . . . . . . . . . . . . . . . . 67,558.7 76,839.5 62,786.2Share options and other (2) . . . . . . . . . . . . . . . . . . . . . . . — 1,394.8 1,104.4
Weighted average number of common shares andcommon share equivalents outstanding—diluted . . . 67,558.7 78,234.3 63,890.6
Basic net (loss) income per share . . . . . . . . . . . . . . . . . . . . $ (8.40) $ 10.65 $ 23.93Diluted net (loss) income per share (2) . . . . . . . . . . . . . . . . $ (8.40) $ 10.46 $ 23.51
(1) Net (loss) income and net (loss) income available to common shareholders include $4.3 million, and basicnet income per share and diluted net income per share include $0.07 per share related to the noncontrollinginterests’ share of Paris Re’s net income for the period from October 2, 2009 to December 7, 2009.
181

(2) Dilutive securities, in the form of share options and other, of 687.3 thousand shares were not included in theweighted average number of common shares and common share equivalents outstanding for the purpose ofcomputing the diluted net loss per share because to do so would have been anti-dilutive for the year endedDecember 31, 2011. In addition, at December 31, 2011, 2010 and 2009, share based awards to purchase2,854.4 thousand, 489.7 thousand and 387.0 thousand common shares, respectively, were excluded from thecalculation of diluted weighted average number of common shares and common share equivalentsoutstanding because their exercise prices were greater than the average market price of the common shares.
14. Dividend Restrictions and Statutory Requirements
The Company’s ability to pay common and preferred shareholders’ dividends and its corporate expenses isdependent mainly on cash dividends from PartnerRe Bermuda, PartnerRe Europe and PartnerRe U.S.(collectively, the reinsurance subsidiaries), which are the Company’s most significant subsidiaries. The paymentof such dividends by the reinsurance subsidiaries to the Company is limited under Bermuda and Irish laws andcertain statutes of various U.S. states in which PartnerRe U.S. is licensed to transact business. The restrictions aregenerally based on net income and/or certain levels of policyholders’ earned surplus as determined in accordancewith the relevant statutory accounting practices. At December 31, 2011, there were no significant restrictions onthe payment of dividends by the Company’s reinsurance subsidiaries that would limit the Company’s ability topay common and preferred shareholders’ dividends and its corporate expenses.
The reinsurance subsidiaries are required to file annual statements with insurance regulatory authoritiesprepared on an accounting basis prescribed or permitted by such authorities (statutory basis), maintain minimumlevels of solvency and liquidity and comply with risk-based capital requirements and licensing rules. AtDecember 31, 2011, the reinsurance subsidiaries’ solvency, liquidity and risk-based capital amounts were inexcess of the minimum levels required. The typical adjustments to insurance statutory basis amounts to convertto U.S. GAAP include elimination of certain statutory reserves, deferral of certain acquisition costs, recognitionof goodwill, intangible assets and deferred income taxes, valuation of bonds at fair value and presentation ofceded reinsurance balances gross of assumed balances.
The statutory net (loss) income of the Company’s reinsurance subsidiaries for the years ended December 31,2011, 2010 and 2009 was as follows (in millions of U.S. dollars):
2011(unauditedestimated) 2010 2009
PartnerRe Bermuda . . . . . . . . . . . . . . . . . . . . . . . . . . . . . . . . . . . . . . . . . $(524) $496 $1,044PartnerRe Europe . . . . . . . . . . . . . . . . . . . . . . . . . . . . . . . . . . . . . . . . . . 2 198 307PartnerRe U.S. . . . . . . . . . . . . . . . . . . . . . . . . . . . . . . . . . . . . . . . . . . . . . 106 147 89
The following table summarizes the statutory shareholders’ equity of the Company’s reinsurancesubsidiaries at December 31, 2011 and 2010 (in millions of U.S. dollars):
2011(unauditedestimated) 2010
PartnerRe Bermuda . . . . . . . . . . . . . . . . . . . . . . . . . . . . . . . . . . . . . . . . . . . . . . . . $3,428 $3,099PartnerRe Europe . . . . . . . . . . . . . . . . . . . . . . . . . . . . . . . . . . . . . . . . . . . . . . . . . 1,234 1,430PartnerRe U.S. . . . . . . . . . . . . . . . . . . . . . . . . . . . . . . . . . . . . . . . . . . . . . . . . . . . . 1,174 1,197
At December 31, 2011 and 2010, the Company has Swiss and French operations that are branches ofPartnerRe Europe and are regulated by the Central Bank of Ireland, as prescribed by the EU ReinsuranceDirective.
182

15. Taxation
The Company and its Bermuda domiciled subsidiaries are not subject to Bermuda income or capital gainstax under current Bermuda law. In the event that there is a change in current law such that taxes on income orcapital gains are imposed, the Company and its Bermuda domiciled subsidiaries would be exempt from such taxuntil March 2035 pursuant to the Bermuda Exempted Undertakings Tax Protection Act of 1966.
The Company has subsidiaries and branches that operate in various other jurisdictions around the world thatare subject to tax in the jurisdictions in which they operate. The significant jurisdictions in which the Company’ssubsidiaries and branches are subject to tax are Canada, France, Ireland, Singapore, Switzerland and the UnitedStates.
Income tax returns are open for examination for the tax years 2007-2011 in Canada, Ireland, Singapore andSwitzerland, 2008-2011 in the United States and 2010-2011 in France. As a global organization, the Companymay be subject to a variety of transfer pricing or permanent establishment challenges by taxing authorities invarious jurisdictions. While management believes that adequate provision has been made in the ConsolidatedFinancial Statements for any potential assessments that may result from tax examinations for all open tax years,the completion of tax examinations for open years may result in changes to the amounts recognized in theConsolidated Financial Statements.
Income tax expense for the years ended December 31, 2011, 2010 and 2009 was as follows (in thousands ofU.S. dollars):
2011 2010 2009
Current income tax expenseU.S. . . . . . . . . . . . . . . . . . . . . . . . . . . . . . . . . . . . . . . . . . . . . . . . . . . . . . . . . . . . $ 82,065 $ 28,180 $ 43,020Non U.S. . . . . . . . . . . . . . . . . . . . . . . . . . . . . . . . . . . . . . . . . . . . . . . . . . . . . . . . 72,268 36,706 47,980
Total current income tax expense . . . . . . . . . . . . . . . . . . . . . . . . . . . . . . . . . . . $154,333 $ 64,886 $ 91,000
Deferred income tax (benefit) expenseU.S. . . . . . . . . . . . . . . . . . . . . . . . . . . . . . . . . . . . . . . . . . . . . . . . . . . . . . . . . . . . $ (36,780) $ 46,988 $ 83,583Non U.S. . . . . . . . . . . . . . . . . . . . . . . . . . . . . . . . . . . . . . . . . . . . . . . . . . . . . . . . (8,112) 4,738 86,837
Total deferred income tax (benefit) expense . . . . . . . . . . . . . . . . . . . . . . . . . . . $ (44,892) $ 51,726 $170,420
Unrecognized tax (benefit) expenseU.S. . . . . . . . . . . . . . . . . . . . . . . . . . . . . . . . . . . . . . . . . . . . . . . . . . . . . . . . . . . . $ 81 $ — $ (461)Non U.S. . . . . . . . . . . . . . . . . . . . . . . . . . . . . . . . . . . . . . . . . . . . . . . . . . . . . . . . (40,550) 12,172 1,131
Total unrecognized tax (benefit) expense . . . . . . . . . . . . . . . . . . . . . . . . . . . . . $ (40,469) $ 12,172 $ 670
Total income tax expenseU.S. . . . . . . . . . . . . . . . . . . . . . . . . . . . . . . . . . . . . . . . . . . . . . . . . . . . . . . . . . . . $ 45,366 $ 75,168 $126,142Non U.S. . . . . . . . . . . . . . . . . . . . . . . . . . . . . . . . . . . . . . . . . . . . . . . . . . . . . . . . 23,606 53,616 135,948
Total income tax expense . . . . . . . . . . . . . . . . . . . . . . . . . . . . . . . . . . . . . . . . . . $ 68,972 $128,784 $262,090
183

(Loss) income before taxes attributable to the Company’s domestic and foreign operations and areconciliation of the actual income tax rate to the amount computed by applying the effective tax rate of 0%under Bermuda (the Company’s domicile) law to (loss) income before taxes was as follows for the years endedDecember 31, 2011, 2010 and 2009 (in thousands of U.S. dollars):
2011 2010 2009
Domestic (Bermuda) . . . . . . . . . . . . . . . . . . . . . . . . . . . . . . . . . . . . . . . . . . . $(634,310) $441,074 $ 895,663Foreign . . . . . . . . . . . . . . . . . . . . . . . . . . . . . . . . . . . . . . . . . . . . . . . . . . . . . . 182,991 540,262 903,281
(Loss) income before taxes . . . . . . . . . . . . . . . . . . . . . . . . . . . . . . . . . . . . . . $(451,319) $981,336 $1,798,944
Reconciliation of effective tax rate (% of (loss) income before taxes)Expected tax rate . . . . . . . . . . . . . . . . . . . . . . . . . . . . . . . . . . . . . . . . . . . . . . 0.0% 0.0% 0.0%Foreign taxes at local expected tax rates . . . . . . . . . . . . . . . . . . . . . . . . . . . . (7.2) 14.9 14.2Impact of foreign exchange gains . . . . . . . . . . . . . . . . . . . . . . . . . . . . . . . . . 0.4 (3.4) (0.4)Unrecognized tax benefit . . . . . . . . . . . . . . . . . . . . . . . . . . . . . . . . . . . . . . . . 9.0 1.2 —Tax-exempt income and expenses not deductible . . . . . . . . . . . . . . . . . . . . . (11.6) (0.7) (1.2)Impact of enacted changes in tax laws . . . . . . . . . . . . . . . . . . . . . . . . . . . . . . — (1.9) (0.1)Foreign branch tax . . . . . . . . . . . . . . . . . . . . . . . . . . . . . . . . . . . . . . . . . . . . . (5.7) (0.2) 1.8Valuation allowance . . . . . . . . . . . . . . . . . . . . . . . . . . . . . . . . . . . . . . . . . . . . (1.9) 2.0 —Other . . . . . . . . . . . . . . . . . . . . . . . . . . . . . . . . . . . . . . . . . . . . . . . . . . . . . . . 1.7 1.2 0.3
Actual tax rate . . . . . . . . . . . . . . . . . . . . . . . . . . . . . . . . . . . . . . . . . . . . . . . . (15.3)% 13.1% 14.6%
Deferred tax assets and liabilities reflect the tax impact of temporary differences between the carryingamounts of assets and liabilities for financial reporting and income tax purposes. Significant components of thenet deferred tax assets and liabilities at December 31, 2011 and 2010 were as follows (in thousands of U.S.dollars):
2011 2010
Deferred tax assetsDiscounting of loss reserves and adjustment to life policy reserves . . . . . . . . . . . . . . . . . $ 84,977 $ 62,591Foreign tax credit carryforwards . . . . . . . . . . . . . . . . . . . . . . . . . . . . . . . . . . . . . . . . . . . . 15,005 17,845Tax loss carryforwards . . . . . . . . . . . . . . . . . . . . . . . . . . . . . . . . . . . . . . . . . . . . . . . . . . . . 31,823 4,723Unearned premiums . . . . . . . . . . . . . . . . . . . . . . . . . . . . . . . . . . . . . . . . . . . . . . . . . . . . . . 19,152 20,191Other deferred tax assets . . . . . . . . . . . . . . . . . . . . . . . . . . . . . . . . . . . . . . . . . . . . . . . . . . 35,040 9,319
185,997 114,669Valuation allowance . . . . . . . . . . . . . . . . . . . . . . . . . . . . . . . . . . . . . . . . . . . . . . . . . . . . . . (29,201) (19,642)
Deferred tax assets . . . . . . . . . . . . . . . . . . . . . . . . . . . . . . . . . . . . . . . . . . . . . . . . . . . . . . 156,796 95,027
Deferred tax liabilitiesDeferred acquisition costs . . . . . . . . . . . . . . . . . . . . . . . . . . . . . . . . . . . . . . . . . . . . . . . . . 42,913 47,152Goodwill and other intangibles . . . . . . . . . . . . . . . . . . . . . . . . . . . . . . . . . . . . . . . . . . . . . 71,000 73,174Equalization reserves . . . . . . . . . . . . . . . . . . . . . . . . . . . . . . . . . . . . . . . . . . . . . . . . . . . . . 104,884 113,293Unrealized appreciation and timing differences on investments . . . . . . . . . . . . . . . . . . . . 105,817 82,226Other deferred tax liabilities . . . . . . . . . . . . . . . . . . . . . . . . . . . . . . . . . . . . . . . . . . . . . . . . 32,397 32,877
Deferred tax liabilities . . . . . . . . . . . . . . . . . . . . . . . . . . . . . . . . . . . . . . . . . . . . . . . . . . . 357,011 348,722
Net deferred tax liabilities . . . . . . . . . . . . . . . . . . . . . . . . . . . . . . . . . . . . . . . . . . . . . . . . $(200,215) $(253,695)
184

The net tax assets and liabilities and their components at December 31, 2011 and 2010 were as follows (inthousands of U.S. dollars):
2011 2010
Net tax assets . . . . . . . . . . . . . . . . . . . . . . . . . . . . . . . . . . . . . . . . . . . . . . . . . . . . . . . . . . . $ 66,574 $ 14,960Net tax liabilities . . . . . . . . . . . . . . . . . . . . . . . . . . . . . . . . . . . . . . . . . . . . . . . . . . . . . . . . . (297,153) (316,325)
Net tax liabilities . . . . . . . . . . . . . . . . . . . . . . . . . . . . . . . . . . . . . . . . . . . . . . . . . . . . . . . . . $(230,579) $(301,365)
2011 2010
Net current tax (liabilities) assets . . . . . . . . . . . . . . . . . . . . . . . . . . . . . . . . . . . . . . . . . . . . $ (18,074) $ 3,859Net deferred tax liabilities . . . . . . . . . . . . . . . . . . . . . . . . . . . . . . . . . . . . . . . . . . . . . . . . . (200,215) (253,695)Net unrecognized tax benefit . . . . . . . . . . . . . . . . . . . . . . . . . . . . . . . . . . . . . . . . . . . . . . . (12,290) (51,529)
Net tax liabilities . . . . . . . . . . . . . . . . . . . . . . . . . . . . . . . . . . . . . . . . . . . . . . . . . . . . . . . . . $(230,579) $(301,365)
Realization of the deferred tax asset is dependent on generating sufficient taxable income in future periods.Although realization is not assured, Management believes that it is more likely than not that the deferred tax assetwill be realized. The valuation allowance recorded at December 31, 2011 related to a tax loss carryforward inSingapore, while the valuation allowance recorded at December 31, 2010 related to foreign tax creditcarryforwards in Ireland of $17.8 million with the balance related to certain tax loss carryforwards.
At December 31, 2011, the deferred tax assets (after valuation allowance) primarily related to foreign taxcredit carryforwards of $9.0 million in Ireland, which can be carried forward for an unlimited period of time, anddeferred foreign tax credits of $6.0 million in Ireland and the United States. At December 31, 2010, the deferredtax assets (after valuation allowance) related to capital losses in the United States of $2.9 million, which can becarried forward for five years.
The total amount of unrecognized tax benefits for the years ended December 31, 2011, 2010 and 2009 wasas follows (in thousands of U.S. dollars):
January 1,2011
Changes in taxpositions takenduring a prior
period
Tax positionstaken
during thecurrent period
Change as aresult of a lapseof the statute of
limitations
Impact of thechange in
foreign currencyexchange rates
December 31,2011
Unrecognized taxbenefits that, ifrecognized, wouldimpact the effectivetax rate . . . . . . . . . . . . $51,529 $3,194 $3,788 $(47,886) $1,254 $11,879
Interest and penaltiesrecognized on theabove . . . . . . . . . . . . . — 435 — — (24) 411
Total unrecognized taxbenefits, includinginterest andpenalties . . . . . . . . . . . $51,529 $3,629 $3,788 $(47,886) $1,230 $12,290
185

January 1,2010
Changes intax positions
taken during aprior period
Tax positionstaken
during thecurrent period
Change as aresult of a lapseof the statute of
limitations
Impact of thechange in
foreign currencyexchange rates
December 31,2010
Unrecognized taxbenefits that, ifrecognized, wouldimpact the effectivetax rate . . . . . . . . . . . . $41,935 $13,215 $2,578 $(3,254) $(2,945) $51,529
Interest and penaltiesrecognized on theabove . . . . . . . . . . . . . 544 104 — (471) (177) —
Total unrecognized taxbenefits, includinginterest andpenalties . . . . . . . . . . . $42,479 $13,319 $2,578 $(3,725) $(3,122) $51,529
January 1,2009
Changes in taxpositions takenduring a prior
period
Tax positionstaken
during thecurrent period
Change as aresult of a lapseof the statute of
limitations
Impact of thechange in
foreign currencyexchange rates
Unrecognizedtax benefitsof Paris Re
December 31,2009
Unrecognized taxbenefits that, ifrecognized,would impactthe effective taxrate . . . . . . . . . . $39,208 $2,053 $ 21 $(1,428) $623 $1,458 $41,935
Interest andpenaltiesrecognized onthe above . . . . . 559 347 — (362) — — 544
Totalunrecognizedtax benefits,includinginterest andpenalties . . . . . . $39,767 $2,400 $ 21 $(1,790) $623 $1,458 $42,479
For the years ended December 31, 2011, 2010 and 2009, there were no unrecognized tax benefits that, ifrecognized, would create a temporary difference between the reported amount of an item in the Company’sConsolidated Balance Sheets and its tax basis. The Company recognizes interest and penalties as income taxexpense in its Consolidated Statements of Operations.
At December 31, 2011, the total amount of unrecognized tax benefits for which it is reasonably possible tochange within twelve months was $1.1 million, which primarily relates to the expected expiration of the statuteof limitations related to certain tax positions and various intra-group transactions in Europe.
16. Share-Based Awards
Employee Equity Plan
In May 2005, the shareholders approved the PartnerRe Ltd. Employee Equity Plan (EEP). The EEP permits thegrant of share options, RS, RSUs, SSARs or other share-based awards to employees of the Company. The EEP isadministered by the Compensation and Management Development Committee of the Board (the Committee).
186

The EEP permits the grant of up to 8.3 million shares, of which a total of 3.4 million shares can be issued aseither RS or RSUs and 4.9 million shares can be issued as share options or SSARs. If an award under the EEP iscancelled or forfeited without the delivery of the full number of shares underlying such award, only the netnumber of shares actually delivered to the participant will be counted against the EEP’s authorized shares. Underthe EEP, the exercise price of the award will not be less than the fair value of the award at the time of grant. Thefair value is defined in the EEP as the closing price reported on the grant date. RSU awards granted under theEEP generally cliff vest after 3 years of continuous service. Share options and SSARs vest ratably over 3 years ofcontinuous service and have a ten year contractual term. Participants in the EEP are eligible to receive dividendequivalents, which the Company records as an expense, on RSUs that are unvested. At December 31, 2011,5.4 million shares remained available for issuance under this plan.
Certain awards to certain senior executives will, if the Committee intends such award to qualify as“qualified performance based compensation” under Section 162(m) of the Internal Revenue Code (IRC), becomeearned and payable only if pre-established targets relating to one or more of the following performance measuresare achieved: (i) earnings per share, (ii) financial year return on common equity, (iii) underwriting year return onequity, (iv) return on net assets, (v) organizational objectives, and (vi) premium growth. The individualmaximum number of shares underlying any such share-denominated award granted in any year will be0.8 million shares, and the individual maximum amount earned with respect to any such non-share denominatedaward granted in any year will be $5.0 million.
In September 2009, in connection with the acquisition of Paris Re, the shareholders approved an amendmentto the EEP to increase the number of shares available for issuance by 0.4 million shares, of which 0.3 millionmay be awarded as RS or RSUs. As part of the acquisition of Paris Re, the Company issued replacement shareoptions, RSUs, and warrants to holders of Paris Re share options, RSUs and warrants. These replacement awardswere issued under the terms and conditions of the Paris Re 2006 Equity Purchase Plan, Paris Re 2006 EquityIncentive Plan, Paris Re 2006 Executive Equity Incentive Plan and Paris Re 2007 Equity Incentive Plan and werenot considered to be grants under the Company’s EEP.
Non-Employee Directors’ Stock Plan
The PartnerRe Ltd. Non-Employee Directors Stock Plan (Directors’ Stock Plan), which was approved by theCompany’s shareholders, permits the grant of up to 0.8 million share options, RS, RSUs, alternative awards andother share-based awards. Under the Directors’ Stock Plan, the exercise price of the share options will be equivalentto the fair value of the share options at the time of grant. The fair value is defined in the Directors’ Stock Plan as theclosing price reported on the grant date. Options are awarded on an annual basis and are issued under the Directors’Stock Plan. They generally vest at the time of grant and are expensed immediately and have a ten year contractualterm. Prior to May 2010, RSU awards granted under the Directors’ Stock Plan generally vested at the time of grantwith a delivery date restriction of one year and were expensed immediately. With effect from May 2010, RSUs areawarded on an annual basis and have a five year cliff vest with no delivery restrictions and are expensed over thevesting period. Before the grant date, directors must elect to receive their awards in the form of either 100% RSUs,or split, with 60% of the award being RSUs and 40% of the award being cash upon delivery. At December 31, 2011,0.1 million shares remained available for issuance under this plan.
Employee Share Purchase Plan
The PartnerRe Ltd. Employee Share Purchase Plan (ESPP), which was approved by the Company’sshareholders, has a twelve month offering period with two purchase periods of six months each. All employeesare eligible to participate in the ESPP and can contribute between 1% and 10% of their base salary toward thepurchase of the Company’s shares up to the limit set by the IRC. Employees who enroll in the ESPP maypurchase the Company’s shares at a 15% discount of the lower fair value on either the enrolment date or purchasedate. Participants in the ESPP are eligible to receive dividends on their shares as of the purchase date. A total of0.6 million common shares may be issued under the ESPP. At December 31, 2011, 0.4 million shares remainedavailable for issuance under this plan.
187

Swiss Share Purchase Plan
The Swiss Share Purchase Plan (SSPP) has two offering periods per year with two purchase periods of sixmonths each. Swiss employees, who work at least 20 hours per week, are eligible to participate in the SSPP andcan contribute between 1% and 8% of their base salary toward the purchase of the Company’s shares up to amaximum of 5,000 Swiss francs per annum. Employees who enroll in the SSPP may purchase the Company’sshares at a 40% discount of the fair value on the purchase date. There is a restriction on transfer or sale of theseshares for a period of two years following purchase. Participants in the SSPP are eligible to receive dividends ontheir shares as of the purchase date. A total of 0.4 million common shares may be issued under the SSPP. AtDecember 31, 2011, 0.2 million shares remained available for issuance under this plan.
Share-Based Compensation
Under each of the Company’s equity plans, the Company issues new shares upon the exercise of shareoptions or the conversion of RSUs and SSARs into shares.
For the years ended December 31, 2011, 2010 and 2009, the Company’s share-based compensation expensewas $24.2 million, $33.5 million and $21.7 million, respectively, with a tax benefit of $2.4 million, $3.4 millionand $2.7 million, respectively. Included within these tax benefits are amounts related to the exercise of shareoptions and the conversion of RSUs and SSARs into shares by employees of the Company’s U.S. subsidiaries of$3.1 million, $5.9 million and $1.6 million for the years ended December 31, 2011, 2010 and 2009, respectively.
Share Options
The following table summarizes the activity related to options granted and exercised for the years endedDecember 31, 2011, 2010 and 2009.
2011 2010 2009
Options granted . . . . . . . . . . . . . . . . . . . . . . . . . . . . . . . . . . . . . . . . . . . . . . . . . 123,162 91,817 598,698Weighted average grant date fair value of options granted . . . . . . . . . . . . . . . . $ 7.43 $ 10.29 $ 7.95
Options exercised . . . . . . . . . . . . . . . . . . . . . . . . . . . . . . . . . . . . . . . . . . . . . . . . 194,201 860,154 250,400Total intrinsic value of options exercised (in millions of U.S. dollars) . . . . . . . $ 4.6 $ 21.0 $ 5.0Proceeds from option exercises (in millions of U.S. dollars) . . . . . . . . . . . . . . $ 10.6 $ 37.2 $ 12.7
The activity related to the Company’s share options for the year ended December 31, 2011 was as follows:
OptionsWeighted Average
Exercise Price
Outstanding at January 1, 2011 . . . . . . . . . . . . . . . . . . . . . . . . . . . . . . . . . . . . . . . . . 1,936,095 $61.86Granted . . . . . . . . . . . . . . . . . . . . . . . . . . . . . . . . . . . . . . . . . . . . . . . . . . . . . . . . . . . 123,162 68.59Exercised . . . . . . . . . . . . . . . . . . . . . . . . . . . . . . . . . . . . . . . . . . . . . . . . . . . . . . . . . . (194,201) 56.19Forfeited or expired . . . . . . . . . . . . . . . . . . . . . . . . . . . . . . . . . . . . . . . . . . . . . . . . . . (1,900) 65.05
Outstanding at December 31, 2011 . . . . . . . . . . . . . . . . . . . . . . . . . . . . . . . . . . . . . . 1,863,156 62.89Options exercisable at December 31, 2011 . . . . . . . . . . . . . . . . . . . . . . . . . . . . . . . . 1,856,435 62.84Options vested and expected to vest at December 31, 2011 . . . . . . . . . . . . . . . . . . . 1,862,867 62.89
The weighted average remaining contractual term and the aggregate intrinsic value of share optionsoutstanding, exercisable, vested and expected to vest at December 31, 2011, was 3.6 years and $7.4 million,respectively.
188

The Company values share options issued with a Black-Scholes valuation model and used the followingassumptions for the years ended December 31, 2011, 2010 and 2009:
2011 2010 2009
Expected life . . . . . . . . . . . . . . . . . . . . . . . . . . . . . . . . . . . . . . . . . . . . . . . . . . . . . . . . . 6 years 6 years 3 yearsExpected volatility . . . . . . . . . . . . . . . . . . . . . . . . . . . . . . . . . . . . . . . . . . . . . . . . . . . . 14.9% 15.8% 15.8%Risk-free interest rate . . . . . . . . . . . . . . . . . . . . . . . . . . . . . . . . . . . . . . . . . . . . . . . . . . 2.0% 2.8% 2.8%Dividend yield . . . . . . . . . . . . . . . . . . . . . . . . . . . . . . . . . . . . . . . . . . . . . . . . . . . . . . . 2.7% 2.7% 2.7%
The expected life of the replacement share options issued as part of the acquisition of Paris Re in 2009 wasassumed to be 3 years. The expected life of all other share options issued during the years ended December 31,2011, 2010 and 2009 was assumed to be 6 years. Expected volatility is based on the historical volatility of theCompany’s common shares over a period equivalent to the expected life of the Company’s share options. Therisk-free interest rate is based on the market yield of U.S. treasury securities with maturities equivalent to theexpected life of the Company’s share options. The dividend yield is based on the average dividend yield of theCompany’s shares over the expected life of the Company’s share options.
Restricted Share Units
During the years ended December 31, 2011, 2010 and 2009, the Company issued 314,182 RSUs, 374,366RSUs and 607,173 RSUs with a weighted average grant date fair value of $81.20, $79.18 and $75.09,respectively. The Company values RSUs issued under all plans at the fair value of its common shares at the timeof grant, as defined by the plan document.
The activity related to the Company’s RSUs for the year ended December 31, 2011 was as follows:
RSUs
Outstanding at January 1, 2011 . . . . . . . . . . . . . . . . . . . . . . . . . . . . . . . . . . . . . . . . 868,002Granted . . . . . . . . . . . . . . . . . . . . . . . . . . . . . . . . . . . . . . . . . . . . . . . . . . . . . . . . . . 314,182Released . . . . . . . . . . . . . . . . . . . . . . . . . . . . . . . . . . . . . . . . . . . . . . . . . . . . . . . . . (462,912)Forfeited . . . . . . . . . . . . . . . . . . . . . . . . . . . . . . . . . . . . . . . . . . . . . . . . . . . . . . . . . (23,528)
Outstanding at December 31, 2011 . . . . . . . . . . . . . . . . . . . . . . . . . . . . . . . . . . . . . 695,744
The RSUs that vested during the years ended December 31, 2011, 2010 and 2009 had a fair value of$18.3 million, $30.9 million and $9.6 million, respectively.
Of the 695,744 RSUs outstanding at December 31, 2011, 34,866 are subject to a five year delivery daterestriction from the grant date and were not released for conversion into shares.
Total unrecognized share-based compensation expense related to unvested RSUs was approximately$26.4 million at December 31, 2011, which is expected to be recognized over a weighted-average period of 1.8years.
Share-Settled Share Appreciation Rights (SSARs)
During the years ended December 31, 2011, 2010 and 2009, the Company issued 210,582 SSARs, 450,568SSARs, and 105,344 SSARs with a weighted average grant date fair value of $10.32, $10.45 and $8.42,respectively.
189

The activity related to the Company’s SSARs for the year ended December 31, 2011 was as follows:
SSARs
Outstanding at January 1, 2011 . . . . . . . . . . . . . . . . . . . . . . . . . . . . . . . . . . . . . . 1,337,350Granted . . . . . . . . . . . . . . . . . . . . . . . . . . . . . . . . . . . . . . . . . . . . . . . . . . . . . . . . . 210,582Exercised . . . . . . . . . . . . . . . . . . . . . . . . . . . . . . . . . . . . . . . . . . . . . . . . . . . . . . . (21,462)Forfeited or expired . . . . . . . . . . . . . . . . . . . . . . . . . . . . . . . . . . . . . . . . . . . . . . . (11,263)
Outstanding at December 31, 2011 . . . . . . . . . . . . . . . . . . . . . . . . . . . . . . . . . . . 1,515,207Exercisable at December 31, 2011 . . . . . . . . . . . . . . . . . . . . . . . . . . . . . . . . . . . . 1,031,110
Total unrecognized share-based compensation expense related to unvested SSARs was approximately $3.1million at December 31, 2011, which is expected to be recognized over a weighted-average period of 1.7 years.
The Company values SSARs issued with a Black-Scholes valuation model and used the followingassumptions for the years ended December 31, 2011, 2010 and 2009:
2011 2010 2009
Expected life . . . . . . . . . . . . . . . . . . . . . . . . . . . . . . . . . . . . . . . . . . . . . . . . . . . . . . . . . 6 years 6 years 6 yearsExpected volatility . . . . . . . . . . . . . . . . . . . . . . . . . . . . . . . . . . . . . . . . . . . . . . . . . . . . 15.6% 15.8% 15.4%Risk-free interest rate . . . . . . . . . . . . . . . . . . . . . . . . . . . . . . . . . . . . . . . . . . . . . . . . . . 2.7% 2.8% 2.7%Dividend yield . . . . . . . . . . . . . . . . . . . . . . . . . . . . . . . . . . . . . . . . . . . . . . . . . . . . . . . 2.8% 2.7% 2.6%
In determining the weighted average assumptions used, the Company used the same methodology asdescribed in share options above.
Warrants
In 2009, the Company issued 27,655 replacement warrants as part of the acquisition of Paris Re. AtDecember 31, 2011, 15,270 warrants are outstanding and fully vested with a weighted average remainingcontractual life of 4 years and a weighted average exercise price of $34.42. During the year ended December 31,2011, 7,993 warrants were exercised with a weighted average exercise price of $35.33.
17. Retirement Benefit Arrangements
For employee retirement benefits, the Company maintains certain defined contributions plans and otheractive and frozen defined benefit plans. The majority of the defined benefit obligation at December 31, 2011relates to the active defined benefit plan for the Company’s Zurich office employees (the Zurich Plan).
Defined Contribution Plans
Contributions are made by the Company, and in some locations, these contributions are supplemented by thelocal plan participants. Contributions are based on a percentage of the participant’s base salary depending uponcompetitive local market practice and vesting provisions meeting legal compliance standards and market trends.The accumulated benefits for the majority of these plans vest immediately or over a four-year period. As requiredby law, certain retirement plans also provide for death and disability benefits and lump sum indemnities toemployees upon retirement.
The Company incurred expenses for these defined contribution arrangements of $16.0 million, $14.8million, and $13.0 million for the years ended December 31, 2011, 2010 and 2009, respectively.
190

Active Defined Benefit Plan
The Company maintains the Zurich Plan, which is classified as a hybrid plan and accounted for as a definedbenefit plan under U.S. GAAP. At December 31, 2011 and 2010, the funded status of the Zurich Plan was asfollows (in thousands of U.S. dollars):
2011 2010
Funded statusUnfunded pension obligation at beginning of year . . . . . . . . . . . . . . . . . . . . . . . . . . . . . . . . $ 17,144 $ 9,117
Change in pension obligationService cost . . . . . . . . . . . . . . . . . . . . . . . . . . . . . . . . . . . . . . . . . . . . . . . . . . . . . . . . . . . . . . 7,141 5,683Interest cost . . . . . . . . . . . . . . . . . . . . . . . . . . . . . . . . . . . . . . . . . . . . . . . . . . . . . . . . . . . . . . 3,308 3,020Plan participants’ contributions . . . . . . . . . . . . . . . . . . . . . . . . . . . . . . . . . . . . . . . . . . . . . . . 2,174 5,761Actuarial loss . . . . . . . . . . . . . . . . . . . . . . . . . . . . . . . . . . . . . . . . . . . . . . . . . . . . . . . . . . . . . 8,470 7,268Benefits paid . . . . . . . . . . . . . . . . . . . . . . . . . . . . . . . . . . . . . . . . . . . . . . . . . . . . . . . . . . . . . (248) (7,562)Foreign currency adjustments . . . . . . . . . . . . . . . . . . . . . . . . . . . . . . . . . . . . . . . . . . . . . . . . (850) 9,994Settlements . . . . . . . . . . . . . . . . . . . . . . . . . . . . . . . . . . . . . . . . . . . . . . . . . . . . . . . . . . . . . . (13,178) —
Change in pension obligation . . . . . . . . . . . . . . . . . . . . . . . . . . . . . . . . . . . . . . . . . . . . . . . 6,817 24,164
Change in fair value of plan assetsActual return on plan assets . . . . . . . . . . . . . . . . . . . . . . . . . . . . . . . . . . . . . . . . . . . . . . . . . 3,610 3,181Employer contributions . . . . . . . . . . . . . . . . . . . . . . . . . . . . . . . . . . . . . . . . . . . . . . . . . . . . . 6,627 6,025Plan participants’ contributions . . . . . . . . . . . . . . . . . . . . . . . . . . . . . . . . . . . . . . . . . . . . . . . 2,174 5,761Benefits paid . . . . . . . . . . . . . . . . . . . . . . . . . . . . . . . . . . . . . . . . . . . . . . . . . . . . . . . . . . . . . (248) (7,562)Foreign currency adjustments . . . . . . . . . . . . . . . . . . . . . . . . . . . . . . . . . . . . . . . . . . . . . . . . (186) 8,732Settlements . . . . . . . . . . . . . . . . . . . . . . . . . . . . . . . . . . . . . . . . . . . . . . . . . . . . . . . . . . . . . . (13,178) —
Change in fair value of plan assets . . . . . . . . . . . . . . . . . . . . . . . . . . . . . . . . . . . . . . . . . . (1,201) 16,137
Funded statusUnfunded pension obligation at end of year . . . . . . . . . . . . . . . . . . . . . . . . . . . . . . . . . . . . . $ 25,162 $ 17,144Additional information:Projected benefit obligation . . . . . . . . . . . . . . . . . . . . . . . . . . . . . . . . . . . . . . . . . . . . . . . . . $121,156 $114,339Accumulated pension obligation . . . . . . . . . . . . . . . . . . . . . . . . . . . . . . . . . . . . . . . . . . . . . . 116,904 110,240Fair value of plan assets . . . . . . . . . . . . . . . . . . . . . . . . . . . . . . . . . . . . . . . . . . . . . . . . . . . . 95,994 97,195
At December 31, 2011 and 2010, the funded status was included in accounts payable, accrued expenses andother in the Consolidated Balance Sheets. The total amounts recognized in accumulated other comprehensive(loss) income at December 31, 2011 and 2010 were $19.1 million (net of $5.1 million of taxes) and $15.2 million(net of $4.1 million of taxes), respectively.
The net periodic benefit cost for the years ended December 31, 2011, 2010 and 2009 were $10.0 million,$6.1 million and $6.0 million, respectively.
The investment strategy of the Zurich Plan’s Pension Committee is to achieve a consistent long-term return,which will provide sufficient funding for future pension obligations while limiting risk. The expected long-termrate of return on plan assets is based on the expected asset allocation and assumptions concerning long-terminterest rates, inflation rates and risk premiums for equities above the risk-free rates of return. These assumptionstake into consideration historical long-term rates of return for the relevant asset categories. The investmentstrategy is reviewed regularly.
The fair values of the Zurich Plan’s assets at December 31, 2011 and 2010 were equity funds (Level 1) of$nil and $4.3 million, respectively, and insured funds and cash (Level 2) of $96.0 million and $92.9 million,respectively. The equity funds are primarily publicly quoted open-end funds that invest in a full replication of
191

European benchmark indices. The insured funds comprise the accumulated pension plan contributions andinvestment returns thereon, which are held in an insurance arrangement that provides at least a guaranteedminimum investment return. The insured funds are held by a collective foundation of AXA Life Ltd. and areguaranteed under the insurance arrangement.
The assumptions used to determine the pension obligation and net periodic benefit cost for the years endedDecember 31, 2011, 2010 and 2009 were as follows:
2011 2010 2009
Pensionobligation
Net periodicbenefit cost
Pensionobligation
Net periodicbenefit cost
Pensionobligation
Net periodicbenefit cost
Discount rate . . . . . . . . . . . . . . . . . . . . . . 2.50% 2.75% 2.75% 3.25% 3.25% 2.75%Expected return on plan assets . . . . . . . . . — 3.0 — 3.6 — 3.0Rate of compensation increase . . . . . . . . . 3.5 3.5 3.5 3.5 3.5 3.5
At December 31, 2011, estimated employer contributions to be paid in 2012 were $5.7 million and futurebenefit payments were estimated to be paid as follows (in thousands of U.S. dollars):
Period Amount
2012 . . . . . . . . . . . . . . . . . . . . . . . . . . . . . . . . . . . . . . . . . . . . . $ 4,7242013 . . . . . . . . . . . . . . . . . . . . . . . . . . . . . . . . . . . . . . . . . . . . . 4,6662014 . . . . . . . . . . . . . . . . . . . . . . . . . . . . . . . . . . . . . . . . . . . . . 4,6462015 . . . . . . . . . . . . . . . . . . . . . . . . . . . . . . . . . . . . . . . . . . . . . 5,1902016 . . . . . . . . . . . . . . . . . . . . . . . . . . . . . . . . . . . . . . . . . . . . . 5,2152017 to 2021 . . . . . . . . . . . . . . . . . . . . . . . . . . . . . . . . . . . . . . . 27,051
The Company does not believe that any plan assets will be returned to the Company during 2012.
18. Commitments and Contingencies
(a) Concentration of Credit Risk
Fixed maturities
The Company’s investment portfolio is managed following prudent standards of diversification and aprudent investment philosophy. The Company is not exposed to any significant credit concentration risk on itsinvestments, except for debt securities issued by the U.S. government and other highly rated sovereigngovernments’ securities. At December 31, 2011, the Company’s fixed maturity investments included $879million, or 13.6% of the Company’s total shareholders’ equity, issued by the Government of Germany. AtDecember 31, 2010, the Company’s fixed maturity investments included $846 million, or 11.7% of theCompany’s total shareholders’ equity, issued by the Government of France. Other than the U.S. government andthe Government of Germany at December 31, 2011 and the U.S. government and the Government of France atDecember 31, 2010, the Company’s fixed maturity portfolio did not contain exposure to any other sovereigngovernment that accounted for more than 10% of the Company’s total shareholders’ equity. The Company keepscash and cash equivalents in several banks and may keep up to $500 million, excluding custodial accounts, at anypoint in time in any one bank.
Derivatives
The Company’s investment strategy allows for the use of derivative instruments, subject to strict limitations.Derivative instruments may be used to replicate investment positions and manage currency, market exposure andduration risk, or to enhance investment performance that would be allowed under the Company’s investmentpolicy if implemented in other ways. The Company is exposed to credit risk in the event of non-performance bythe counterparties to the Company’s derivative contracts. However, the Company diversifies the counterparties to
192

its derivative contracts to reduce credit risk, and because the counterparties to these contracts are high creditquality international banks, the Company does not anticipate non-performance. These contracts are generally ofshort duration and settle on a net basis. The difference between the contract amounts and the related market valuerepresents the Company’s maximum credit exposure.
Financing receivables
Included in the Company’s Other invested assets are certain notes receivable which meet the definition offinancing receivables and are accounted for using the cost method of accounting. These notes receivable arecollateralized by commercial or residential property. The Company utilizes a third party consultant to determinethe initial investment criteria and to monitor the subsequent performance of the notes receivable. The processundertaken prior to the investment in these notes receivable includes an examination of the underlying collateral.The Company reviews its receivable positions on at least a quarterly basis using actual redemption experience.Performance of these notes receivable to date has been within expectations. At December 31, 2011 and 2010,none of the Company’s notes receivable are past due or in default and, accordingly, the Company believes that anallowance for credit losses related to these notes receivable is not required.
The Company monitors the performance of the notes receivable based on the type of underlying collateraland by assigning a “performing” or a “non-performing” indicator of credit quality to each individual receivable.At December 31, 2011, the Company’s notes receivable of $80.4 million were all performing and werecollateralized by residential property and commercial property of $45.9 million and $34.5 million, respectively.At December 31, 2010, the Company’s notes receivable of $55.6 million were all performing and werecollateralized by residential property and commercial property of $28.9 million and $26.7 million, respectively.
The Company purchased financing receivables of $84.5 million during the year ended December 31, 2011.There were no sales of financing receivables during the year ended December 31, 2011, however, the outstandingbalance has been reduced by settlements of the underlying debt.
Underwriting operations
The Company is also exposed to credit risk in its underwriting operations, most notably in the credit/suretyline and for alternative risk products. Loss experience in these lines of business is cyclical and is affected by thestate of the general economic environment. The Company provides its clients in these lines of business withreinsurance protection against credit deterioration, defaults or other types of financial non-performance of or bythe underlying credits that are the subject of the reinsurance provided and, accordingly, the Company is exposedto the credit risk of those credits. The Company mitigates the risks associated with these credit-sensitive lines ofbusiness through the use of risk management techniques such as risk diversification, careful monitoring of riskaggregations and accumulations and, at times, through the use of retrocessional reinsurance protection and thepurchase of credit default, total return and interest rate swaps.
The Company has exposure to credit risk as it relates to its business written through brokers, if any of theCompany’s brokers is unable to fulfill their contractual obligations with respect to payments to the Company. Inaddition, in some jurisdictions, if the broker fails to make payments to the insured under the Company’s policy,the Company might remain liable to the insured for the deficiency. The Company’s exposure to such credit riskis somewhat mitigated in certain jurisdictions by contractual terms.
The Company has exposure to credit risk related to reinsurance balances receivable and reinsurance recoverableon paid and unpaid losses. The credit risk exposure related to these balances is mitigated by several factors, includingbut not limited to, credit checks performed as part of the underwriting process, monitoring of aged receivablebalances and the contractual right to offset premiums receivable or funds held balances against unpaid losses and lossexpenses. The Company regularly reviews its reinsurance recoverable balances to estimate an allowance foruncollectible amounts based on quantitative and qualitative factors. At December 31, 2011 and 2010, the Companyhas recorded a provision for uncollectible premiums receivable of $8.2 million and $12.6 million, respectively. Seealso Note 10 for discussion of credit risk related to reinsurance recoverable on paid and unpaid losses.
193

The Company is also subject to the credit risk of its cedants in the event of insolvency or the cedant’s failureto honor the value of funds held balances for any other reason. The funds held – directly managed account is withone cedant and is supported by an underlying portfolio of investments, which are managed by the Company (seeNote 5). However, the Company’s credit risk in some jurisdictions is mitigated by a mandatory right of offset ofamounts payable by the Company to a cedant against amounts due to the Company. In certain other jurisdictionsthe Company is able to mitigate this risk, depending on the nature of the funds held arrangements, to the extentthat the Company has the contractual ability to offset any shortfall in the payment of the funds held balances withamounts owed by the Company to cedants for losses payable and other amounts contractually due.
(b) Lease Arrangements
The Company leases office space under operating leases expiring in various years through 2019. The leasesare renewable at the option of the lessee under certain circumstances. The following is a schedule of futureminimum rental payments, exclusive of escalation clauses, on non-cancelable leases at December 31, 2011 (inthousands of U.S. dollars):
Period Amount
2012 . . . . . . . . . . . . . . . . . . . . . . . . . . . . . . . . . . . . . . . . . . . . $ 34,7372013 . . . . . . . . . . . . . . . . . . . . . . . . . . . . . . . . . . . . . . . . . . . . 28,6032014 . . . . . . . . . . . . . . . . . . . . . . . . . . . . . . . . . . . . . . . . . . . . 23,5942015 . . . . . . . . . . . . . . . . . . . . . . . . . . . . . . . . . . . . . . . . . . . . 18,8272016 . . . . . . . . . . . . . . . . . . . . . . . . . . . . . . . . . . . . . . . . . . . . 18,7762017 through 2019 . . . . . . . . . . . . . . . . . . . . . . . . . . . . . . . . . 23,818
Total future minimum rental payments . . . . . . . . . . . . . . . . . $148,355
Rent expense for the years ended December 31, 2011, 2010 and 2009 was $37.0 million, $36.1 million, and$30.9 million, respectively.
(c) Employment Agreements
The Company has entered into employment agreements with its executive officers. These agreementsprovide for annual compensation in the form of salary, benefits, annual incentive payments, share-basedcompensation, the reimbursement of certain expenses, retention incentive payments, as well as certain severanceprovisions.
In 2010, as part of the Company’s integration of Paris Re, the Company announced a voluntary terminationplan (voluntary plan) available to certain eligible employees in France. Following their departure from theCompany, employees participating in the voluntary plan will continue to receive pre-determined paymentsrelated to employment benefits, which were accrued for by the Company under the terms of the voluntary planduring the year ended December 31, 2010. During the year ended December 31, 2010 the Company recorded apre-tax charge of $40.7 million related to the costs of the voluntary plan within other operating expenses.
(d) Other Agreements
The Company has entered into service agreements and lease contracts that provide for business andinformation technology support and computer equipment. Future payments under these contracts amount to $16.1million through 2015.
The Company has entered into strategic investments with unfunded capital commitments totaling $157.5million through 2016. The Company expects to fund capital commitments of $61.2 million, $36.3 million, $25.9million, $22.4 million and $11.7 million during 2012, 2013, 2014, 2015 and 2016, respectively.
194

(e) Legal Proceedings
Litigation
The Company’s reinsurance subsidiaries, and the insurance and reinsurance industry in general, are subject tolitigation and arbitration in the normal course of their business operations. In addition to claims litigation, theCompany and its subsidiaries may be subject to lawsuits and regulatory actions in the normal course of business thatdo not arise from or directly relate to claims on reinsurance treaties. This category of business litigation typicallyinvolves, among other things, allegations of underwriting errors or misconduct, employment claims or regulatoryactivity. While the outcome of business litigation cannot be predicted with certainty, the Company will dispute allallegations against the Company and/or its subsidiaries that Management believes are without merit.
At December 31, 2011, the Company was not a party to any litigation or arbitration that it believes couldhave a material effect on the financial condition, results of operations or liquidity of the Company.
19. Off-Balance Sheet Arrangements
In October 2005, the Company entered into a forward sale agreement under which it agreed to sell commonshares to an affiliate of Citigroup Global Markets Inc., which affiliate is referred to as the forward counterparty,on settlement dates chosen by the Company prior to October 2008. On July 31, 2008, the Company amended theforward sale agreement, with half the contract maturing and the remaining half extended to April 2010.
On April 28, 2010, under the terms of the amendment to the forward sale agreement with the forwardcounterparty, the remaining forward sale agreement matured. Commencing on April 28, 2010, there was a 40 dayvaluation period, whereby the Company could deliver up to 3.4 million common shares over the valuation period,subject to a minimum price per share of $59.05 and a maximum price per share of $84.15. As a result of theCompany’s share price trading between the minimum and the maximum price per share during the valuationperiod, the Company did not deliver any common shares to the forward counterparty.
This transaction had no other impact on the Company’s common shareholders’ equity, and the Company’sdiluted net income per share for the years ended December 31, 2010 and 2009 did not include any dilutive effectrelated to this agreement.
20. Credit Agreements
In the normal course of its operations, the Company enters into agreements with financial institutions toobtain unsecured and secured credit facilities. At December 31, 2011, the total amount of such credit facilitiesavailable to the Company was $1,440 million, with each of the significant facilities described below. Thesefacilities are used primarily for the issuance of letters of credit, although a portion of these facilities may also beused for liquidity purposes. Under the terms of certain reinsurance agreements, irrevocable letters of credit wereissued on an unsecured and secured basis in the amount of $246 million and $524 million, respectively, atDecember 31, 2011, in respect of reported loss and unearned premium reserves.
Included in the total credit facilities available to the Company at December 31, 2011 is a $750 million three-year syndicated unsecured credit facility. This facility has the following terms: (i) a maturity date of July 16,2013, (ii) a $250 million accordion feature, which enables the Company to potentially increase its available creditfrom $750 million to $1 billion, and (iii) a minimum consolidated tangible net worth requirement. TheCompany’s ability to increase its available credit to $1 billion is subject to the agreement of the credit facilityparticipants. The Company’s breach of any of the covenants would result in an event of default, upon which theCompany may be required to repay any outstanding borrowings and replace or cash collateralize letters of creditissued under this facility. The Company was in compliance with all of the covenants at December 31, 2011. Thisfacility is predominantly used for the issuance of letters of credit, although the Company and its subsidiaries haveaccess to a revolving line of credit of up to $375 million as part of this facility. During the year endedDecember 31, 2011, there were no borrowings under this revolving line of credit.
195

Additionally, the syndicated unsecured credit facility allows for an adjustment to the level of pricing shouldthe Company experience a change in its senior unsecured debt ratings. The pricing grid provides the Companygreater flexibility and simultaneously provides participants under the facility with some price protection.
On November 14, 2011, the Company entered into an agreement to modify an existing credit facility. Underthe terms of the agreement, this credit facility was increased from a $250 million to a $300 million combinedcredit facility, with the first $100 million being unsecured and any utilization above the $100 million beingsecured. This credit facility matures on November 14, 2012, and can be extended for one additional year underthe terms of the agreement.
In addition to the unsecured credit facilities available, the Company maintains two committed secured letterof credit facilities with amounts available of $150 million and $200 million at December 31, 2011. The facilitiesare used for the issuance of letters of credit, which must be secured fully or partially with cash and/orgovernment bonds and/or investment grade bonds. The agreements include default covenants, which couldrequire the Company to fully secure the outstanding letters of credit to the extent that the facility is not alreadyfully secured, and disallow the issuance of any new letters of credit. The $200 million credit facility has amaturity date of December 31, 2014. The Company is currently negotiating an extension of the $150 millioncredit facility. At December 31, 2011, no conditions of default existed under these facilities.
21. Agreements with Related Parties
The Company was party to agreements with Atradius N.V. since December 2003 (a company in which aboard member is a supervisory director) and Delta Lloyd since May 2008 (a company in which a board memberis a director). All agreements entered into with Atradius N.V. and Delta Lloyd were completed on an arm’s-length basis.
Agreements with Atradius N.V.
In the normal course of its underwriting activities, the Company and certain subsidiaries entered intoreinsurance contracts with Atradius N.V. The activity included in the Consolidated Statements of Operationsrelated to Atradius N.V. for the years ended December 31, 2011, 2010 and 2009 was as follows (in thousands ofU.S. dollars):
2011 2010 2009
Net premiums written . . . . . . . . . . . . . . . . . . . . . . . . . . . . . . . . . . . . . . . . . . . . . . . . $75,991 $80,975 $49,487Net premiums earned . . . . . . . . . . . . . . . . . . . . . . . . . . . . . . . . . . . . . . . . . . . . . . . . 77,230 69,094 63,724Losses and loss expenses and life policy benefits . . . . . . . . . . . . . . . . . . . . . . . . . . 32,595 40,740 58,394Acquisition costs . . . . . . . . . . . . . . . . . . . . . . . . . . . . . . . . . . . . . . . . . . . . . . . . . . . 33,906 22,012 20,824
Included in the Consolidated Balance Sheets were the following balances related to Atradius N.V. atDecember 31, 2011 and 2010 (in thousands of U.S. dollars):
2011 2010
Reinsurance balances receivable . . . . . . . . . . . . . . . . . . . . . . . . . . . . . . . . . . . . . . . . . . . . . . . . $ 5,332 $21,571Unpaid losses and loss expenses . . . . . . . . . . . . . . . . . . . . . . . . . . . . . . . . . . . . . . . . . . . . . . . . 75,173 71,929Unearned premiums . . . . . . . . . . . . . . . . . . . . . . . . . . . . . . . . . . . . . . . . . . . . . . . . . . . . . . . . . 34,836 36,744Other net assets . . . . . . . . . . . . . . . . . . . . . . . . . . . . . . . . . . . . . . . . . . . . . . . . . . . . . . . . . . . . . 14,187 12,916
196

Agreements with Delta Lloyd
In the normal course of its underwriting activities, the Company and certain subsidiaries entered intoreinsurance contracts with Delta Lloyd. The activity included in the Consolidated Statements of Operationsrelated to Delta Lloyd for the years ended December 31, 2011, 2010 and 2009 includes net premiums earned of$1.9 million, $1.2 million and $1.4 million, respectively, and losses and loss expenses and life policy benefits of$0.8 million, $0.3 million and $0.5 million, respectively. Included in the Consolidated Balance Sheets atDecember 31, 2011 and 2010 were unpaid losses and loss expenses of $7.5 million and $8.9 million,respectively.
Other Agreements
In the normal course of its investment operations, the Company bought or held securities of companies inwhich board members of the Company are also directors or non-executive directors. All transactions entered intoas part of the investment portfolio were completed on market terms.
22. Segment Information
The Company monitors the performance of its operations in three segments, Non-life, Life and Corporateand Other. The Non-life segment is further divided into four sub-segments: North America, Global (Non-U.S.)P&C, Global (Non-U.S.) Specialty and Catastrophe. Segments and sub-segments represent markets that arereasonably homogeneous in terms of geography, client types, buying patterns, underlying risk patterns andapproach to risk management.
The North America sub-segment includes agriculture, casualty, motor, multiline, property, surety and otherrisks generally originating in the United States. The Global (Non-U.S.) P&C sub-segment includes casualty,motor and property business generally originating outside of the United States. The Global (Non-U.S.) Specialtysub-segment is comprised of business that is generally considered to be specialized due to the sophisticatedtechnical underwriting required to analyze risks, and is global in nature. This sub-segment consists of severallines of business for which the Company believes it has developed specialized knowledge and underwritingcapabilities. These lines of business include agriculture, aviation/space, credit/surety, energy, engineering,marine, specialty casualty, specialty property and other lines. The Catastrophe sub-segment is comprised of theCompany’s catastrophe line of business. The Life segment includes mortality, longevity and health lines ofbusiness. Corporate and Other is comprised of the capital markets and investment related activities of theCompany, including principal finance transactions, insurance-linked securities and strategic investments, and itscorporate activities, including other operating expenses.
Because the Company does not manage its assets by segment, net investment income is not allocated to theNon-life segment. However, because of the interest-sensitive nature of some of the Company’s Life products, netinvestment income is considered in Management’s assessment of the profitability of the Life segment. Thefollowing items are not considered in evaluating the results of the Non-life and Life segments: net realized andunrealized investment gains and losses, net realized gain on purchase of capital efficient notes, interest expense,amortization of intangible assets, net foreign exchange gains and losses, income tax expense or benefit andinterest in earnings and losses of equity investments. Segment results are shown before consideration ofintercompany transactions.
Management measures results for the Non-life segment on the basis of the loss ratio, acquisition ratio,technical ratio, other operating expense ratio and combined ratio (all defined below). Management measuresresults for the Non-life sub-segments on the basis of the loss ratio, acquisition ratio and technical ratio.Management measures results for the Life segment on the basis of the allocated underwriting result, whichincludes revenues from net premiums earned, other income or loss and allocated net investment income for Life,and expenses from life policy benefits, acquisition costs and other operating expenses.
197

The following tables provide a summary of the segment results for the years ended December 31, 2011,2010 and 2009 (in millions of U.S. dollars, except ratios):
Segment InformationFor the year ended December 31, 2011
NorthAmerica
Global(Non-U.S.)
P&C
Global(Non-U.S.)Specialty Catastrophe
TotalNon-lifeSegment
LifeSegment
Corporateand Other Total
Gross premiums written . . . . . . . . . . . . . $1,104 $ 682 $1,446 $ 599 $ 3,831 $ 790 $ 12 $ 4,633Net premiums written . . . . . . . . . . . . . . . $1,104 $ 678 $1,344 $ 562 $ 3,688 $ 786 $ 12 $ 4,486Decrease in unearned premiums . . . . . . . 31 81 32 12 156 6 — 162
Net premiums earned . . . . . . . . . . . . . . . $1,135 $ 759 $1,376 $ 574 $ 3,844 $ 792 $ 12 $ 4,648Losses and loss expenses and life policy
benefits . . . . . . . . . . . . . . . . . . . . . . . . (741) (567) (950) (1,459) (3,717) (650) (6) (4,373)Acquisition costs . . . . . . . . . . . . . . . . . . (276) (191) (328) (26) (821) (117) — (938)
Technical result . . . . . . . . . . . . . . . . . . . $ 118 $ 1 $ 98 $ (911) $ (694) $ 25 $ 6 $ (663)Other income . . . . . . . . . . . . . . . . . . . . . 4 1 3 8Other operating expenses . . . . . . . . . . . . (283) (53) (99) (435)
Underwriting result . . . . . . . . . . . . . . . $ (973) $ (27) n/a $(1,090)Net investment income . . . . . . . . . . . . . . 66 563 629
Allocated underwriting result (1) . . . . . $ 39 n/a n/aNet realized and unrealized investment
gains . . . . . . . . . . . . . . . . . . . . . . . . . . 67 67Interest expense . . . . . . . . . . . . . . . . . . . (49) (49)Amortization of intangible assets . . . . . . (36) (36)Net foreign exchange gains . . . . . . . . . . 34 34Income tax expense . . . . . . . . . . . . . . . . (69) (69)Interest in losses of equity
investments . . . . . . . . . . . . . . . . . . . . . (6) (6)
Net loss . . . . . . . . . . . . . . . . . . . . . . . . . . n/a $ (520)
Loss ratio (2) . . . . . . . . . . . . . . . . . . . . . . . 65.3% 74.7% 69.1% 254.2% 96.7%Acquisition ratio (3) . . . . . . . . . . . . . . . . . 24.3 25.1 23.8 4.5 21.3
Technical ratio (4) . . . . . . . . . . . . . . . . . . . 89.6% 99.8% 92.9% 258.7% 118.0%Other operating expense ratio (5) . . . . . . . 7.4
Combined ratio (6) . . . . . . . . . . . . . . . . . . 125.4%
(1) Allocated underwriting result is defined as net premiums earned, other income or loss and allocated net investmentincome less life policy benefits, acquisition costs and other operating expenses.
(2) Loss ratio is obtained by dividing losses and loss expenses by net premiums earned.(3) Acquisition ratio is obtained by dividing acquisition costs by net premiums earned.(4) Technical ratio is defined as the sum of the loss ratio and the acquisition ratio.(5) Other operating expense ratio is obtained by dividing other operating expenses by net premiums earned.(6) Combined ratio is defined as the sum of the technical ratio and the other operating expense ratio.
198

Segment InformationFor the year ended December 31, 2010
NorthAmerica
Global(Non-U.S.)
P&C
Global(Non-U.S.)Specialty Catastrophe
TotalNon-lifeSegment
LifeSegment
Corporateand Other Total
Gross premiums written . . . . . . . . . $1,028 $ 909 $1,479 $ 716 $ 4,132 $ 749 $ 4 $ 4,885Net premiums written . . . . . . . . . . . $1,026 $ 898 $1,391 $ 646 $ 3,961 $ 742 $ 2 $ 4,705Decrease in unearned premiums . . . 12 16 14 26 68 2 1 71
Net premiums earned . . . . . . . . . . . $1,038 $ 914 $1,405 $ 672 $ 4,029 $ 744 $ 3 $ 4,776Losses and loss expenses and life
policy benefits . . . . . . . . . . . . . . . (577) (702) (985) (393) (2,657) (624) (3) (3,284)Acquisition costs . . . . . . . . . . . . . . . (288) (227) (292) (49) (856) (116) — (972)
Technical result . . . . . . . . . . . . . . . $ 173 $ (15) $ 128 $ 230 $ 516 $ 4 $ — $ 520Other income . . . . . . . . . . . . . . . . . . 5 2 3 10Other operating expenses . . . . . . . . (317) (57) (166) (540)
Underwriting result . . . . . . . . . . . $ 204 $ (51) n/a $ (10)Net investment income . . . . . . . . . . 71 602 673
Allocated underwriting result . . . $ 20 n/a n/aNet realized and unrealized
investment gains . . . . . . . . . . . . . 402 402Interest expense . . . . . . . . . . . . . . . . (44) (44)Amortization of intangible
assets . . . . . . . . . . . . . . . . . . . . . . (31) (31)Net foreign exchange losses . . . . . . (21) (21)Income tax expense . . . . . . . . . . . . . (129) (129)Interest in earnings of equity
investments . . . . . . . . . . . . . . . . . 13 13
Net income . . . . . . . . . . . . . . . . . . . n/a $ 853
Loss ratio . . . . . . . . . . . . . . . . . . . . . 55.6% 76.8% 70.0% 58.5% 65.9%Acquisition ratio . . . . . . . . . . . . . . . 27.8 24.9 20.8 7.2 21.3
Technical ratio . . . . . . . . . . . . . . . . 83.4% 101.7% 90.8% 65.7% 87.2%Other operating expense ratio . . . . . 7.8
Combined ratio . . . . . . . . . . . . . . . . 95.0%
199

Segment InformationFor the year ended December 31, 2009
NorthAmerica
Global(Non-U.S.)
P&C
Global(Non-U.S.)Specialty Catastrophe
TotalNon-lifeSegment
LifeSegment
Corporateand Other Total
Gross premiums written . . . . . . . . . $1,162 $ 677 $1,159 $400 $ 3,398 $ 595 $ 8 $ 4,001Net premiums written . . . . . . . . . . . $1,162 $ 679 $1,113 $397 $ 3,351 $ 591 $ 7 $ 3,949Decrease (increase) in unearned
premiums . . . . . . . . . . . . . . . . . . 48 50 3 73 174 (4) 1 171
Net premiums earned . . . . . . . . . . . $1,210 $ 729 $1,116 $470 $ 3,525 $ 587 $ 8 $ 4,120Losses and loss expenses and life
policy benefits . . . . . . . . . . . . . . . (728) (392) (732) (6) (1,858) (440) 2 (2,296)Acquisition costs . . . . . . . . . . . . . . . (311) (174) (254) (33) (772) (113) — (885)
Technical result . . . . . . . . . . . . . . . $ 171 $ 163 $ 130 $431 $ 895 $ 34 $ 10 $ 939Other income . . . . . . . . . . . . . . . . . . 13 2 7 22Other operating expenses . . . . . . . . (253) (47) (131) (431)
Underwriting result . . . . . . . . . . . $ 655 $ (11) n/a $ 530Net investment income . . . . . . . . . . 62 534 596
Allocated underwriting result . . . $ 51 n/a n/aNet realized and unrealized
investment gains . . . . . . . . . . . . . 591 591Net realized gain on purchase of
capital efficient notes . . . . . . . . . 89 89Interest expense . . . . . . . . . . . . . . . . (28) (28)Amortization of intangible
assets . . . . . . . . . . . . . . . . . . . . . . 6 6Net foreign exchange losses . . . . . . (1) (1)Income tax expense . . . . . . . . . . . . . (262) (262)Interest in earnings of equity
investments . . . . . . . . . . . . . . . . . 16 16
Net income . . . . . . . . . . . . . . . . . . . n/a $ 1,537
Loss ratio . . . . . . . . . . . . . . . . . . . . . 60.2% 53.7% 65.6% 1.3% 52.7%Acquisition ratio . . . . . . . . . . . . . . . 25.7 23.8 22.7 7.0 21.9
Technical ratio . . . . . . . . . . . . . . . . 85.9% 77.5% 88.3% 8.3% 74.6%Other operating expense ratio . . . . . 7.2
Combined ratio . . . . . . . . . . . . . . . . 81.8%
200

The following table provides the distribution of net premiums written by line of business for the years endedDecember 31, 2011, 2010 and 2009:
2011 2010 2009
Non-lifeProperty and casualty
Casualty . . . . . . . . . . . . . . . . . . . . . . . . . . . . . . . . . . . . . . . . . . . . . . . . . . . . . . . . . . . 11% 11% 13%Property . . . . . . . . . . . . . . . . . . . . . . . . . . . . . . . . . . . . . . . . . . . . . . . . . . . . . . . . . . . 15 18 18Motor . . . . . . . . . . . . . . . . . . . . . . . . . . . . . . . . . . . . . . . . . . . . . . . . . . . . . . . . . . . . . 5 7 6Multiline and other . . . . . . . . . . . . . . . . . . . . . . . . . . . . . . . . . . . . . . . . . . . . . . . . . . 2 2 2
SpecialtyAgriculture . . . . . . . . . . . . . . . . . . . . . . . . . . . . . . . . . . . . . . . . . . . . . . . . . . . . . . . . . 7 4 8Aviation/Space . . . . . . . . . . . . . . . . . . . . . . . . . . . . . . . . . . . . . . . . . . . . . . . . . . . . . . 5 5 5Catastrophe . . . . . . . . . . . . . . . . . . . . . . . . . . . . . . . . . . . . . . . . . . . . . . . . . . . . . . . . 13 14 10Credit/Surety . . . . . . . . . . . . . . . . . . . . . . . . . . . . . . . . . . . . . . . . . . . . . . . . . . . . . . . 7 6 6Energy . . . . . . . . . . . . . . . . . . . . . . . . . . . . . . . . . . . . . . . . . . . . . . . . . . . . . . . . . . . . 2 2 2Engineering . . . . . . . . . . . . . . . . . . . . . . . . . . . . . . . . . . . . . . . . . . . . . . . . . . . . . . . . 4 4 5Marine . . . . . . . . . . . . . . . . . . . . . . . . . . . . . . . . . . . . . . . . . . . . . . . . . . . . . . . . . . . . 6 6 5Specialty casualty . . . . . . . . . . . . . . . . . . . . . . . . . . . . . . . . . . . . . . . . . . . . . . . . . . . 2 3 3Specialty property . . . . . . . . . . . . . . . . . . . . . . . . . . . . . . . . . . . . . . . . . . . . . . . . . . . 3 2 2
Life . . . . . . . . . . . . . . . . . . . . . . . . . . . . . . . . . . . . . . . . . . . . . . . . . . . . . . . . . . . . . . . . . . . . . . . 18 16 15
Total . . . . . . . . . . . . . . . . . . . . . . . . . . . . . . . . . . . . . . . . . . . . . . . . . . . . . . . . . . . . . . . . . . . . . . 100% 100% 100%
The following table provides the geographic distribution of gross premiums written based on the location ofthe underlying risk for the years ended December 31, 2011, 2010 and 2009:
2011 2010 2009
Europe . . . . . . . . . . . . . . . . . . . . . . . . . . . . . . . . . . . . . . . . . . . . . . . . . . . . . . . . . . . . . . . . . . . . 41% 43% 41%North America . . . . . . . . . . . . . . . . . . . . . . . . . . . . . . . . . . . . . . . . . . . . . . . . . . . . . . . . . . . . . . 36 36 41Asia, Australia and New Zealand . . . . . . . . . . . . . . . . . . . . . . . . . . . . . . . . . . . . . . . . . . . . . . . 12 10 8Latin America, Caribbean and Africa . . . . . . . . . . . . . . . . . . . . . . . . . . . . . . . . . . . . . . . . . . . . 11 11 10
Total . . . . . . . . . . . . . . . . . . . . . . . . . . . . . . . . . . . . . . . . . . . . . . . . . . . . . . . . . . . . . . . . . . . . . . 100% 100% 100%
The Company produces its business both through brokers and through direct relationships with insurancecompany clients. None of the Company’s cedants accounted for more than 5% of total gross premiums writtenduring the years ended December 31, 2011 and 2010 and more than 6% during the year ended December 31, 2009.
The Company had two brokers that individually accounted for 10% or more of its gross premiums writtenduring the years ended December 31, 2011, 2010 and 2009. The brokers accounted for 26%, 25%, and 25% and21%, 21%, and 19% of gross premiums written for the years ended December 31, 2011, 2010 and 2009,respectively.
The following table summarizes the percentage of gross premiums written through these two brokers bysegment and sub-segment for the years ended December 31, 2011, 2010 and 2009:
2011 2010 2009
Non-lifeNorth America . . . . . . . . . . . . . . . . . . . . . . . . . . . . . . . . . . . . . . . . . . . . . . . . . . . . . . . . . . 64% 77% 78%Global (Non-U.S.) P&C . . . . . . . . . . . . . . . . . . . . . . . . . . . . . . . . . . . . . . . . . . . . . . . . . . 29 32 25Global (Non-U.S.) Specialty . . . . . . . . . . . . . . . . . . . . . . . . . . . . . . . . . . . . . . . . . . . . . . . 43 37 27Catastrophe . . . . . . . . . . . . . . . . . . . . . . . . . . . . . . . . . . . . . . . . . . . . . . . . . . . . . . . . . . . . 81 70 70
Life . . . . . . . . . . . . . . . . . . . . . . . . . . . . . . . . . . . . . . . . . . . . . . . . . . . . . . . . . . . . . . . . . . . . . . . 16 15 18
201

23. Unaudited Quarterly Financial Information
2011 2010
(in millions of U.S. dollars, except pershare amounts)
FourthQuarter
ThirdQuarter
SecondQuarter
FirstQuarter
FourthQuarter
ThirdQuarter
SecondQuarter
FirstQuarter
Net premiums written . . . . . . . . . $ 879.9 $1,079.6 $1,056.5 $1,470.4 $ 820.6 $ 987.6 $1,112.7 $1,784.2Net premiums earned . . . . . . . . . 1,181.4 1,294.3 1,107.5 1,064.6 1,204.6 1,313.4 1,104.6 1,153.8Net investment income . . . . . . . . 155.5 163.7 158.3 151.6 160.8 164.4 174.5 173.1Net realized and unrealized
investment gains (losses) . . . . . 74.6 26.1 78.2 (112.2) (83.2) 293.2 46.0 145.5Other income . . . . . . . . . . . . . . . . 3.1 1.4 1.6 1.8 5.1 3.3 0.8 1.3
Total revenues . . . . . . . . . . . . . . . 1,414.6 1,485.5 1,345.6 1,105.8 1,287.3 1,774.3 1,325.9 1,473.7Losses and loss expenses and life
policy benefits . . . . . . . . . . . . . 1,069.2 881.7 814.5 1,607.2 817.8 748.9 704.6 1,012.4Acquisition costs . . . . . . . . . . . . . 238.8 262.5 229.2 207.9 246.6 261.6 244.1 220.1Other operating expenses . . . . . . 113.0 103.8 113.7 104.3 133.2 118.2 160.2 128.1Interest expense . . . . . . . . . . . . . . 12.3 12.2 12.2 12.3 12.2 12.3 12.8 7.1Amortization of intangible
assets . . . . . . . . . . . . . . . . . . . . 8.9 9.5 9.2 8.8 8.8 10.0 7.8 4.8Net foreign exchange (gains)
losses . . . . . . . . . . . . . . . . . . . . (14.7) (10.6) (8.7) (0.7) 8.3 27.1 (11.0) (3.6)
Total expenses . . . . . . . . . . . . . . . 1,427.5 1,259.1 1,170.1 1,939.8 1,226.9 1,178.1 1,118.5 1,368.9(Loss) income before taxes and
interest in (losses) earnings ofequity investments . . . . . . . . . . (12.9) 226.4 175.5 (834.0) 60.4 596.2 207.4 104.8
Income tax expense (benefit) . . . 3.3 41.8 50.1 (26.3) 10.9 72.6 17.8 27.6Interest in (losses) earnings of
equity investments . . . . . . . . . . (1.4) (4.5) (1.2) 0.7 7.5 1.3 1.3 2.4
Net (loss) income . . . . . . . . . . . . (17.6) 180.1 124.2 (807.0) 57.0 524.9 190.9 79.6Preferred dividends . . . . . . . . . . . 15.4 14.4 8.6 8.6 8.6 8.6 8.6 8.6
Net (loss) income available tocommon shareholders . . . . . . . $ (33.0) $ 165.7 $ 115.6 $ (815.6) $ 48.4 $ 516.3 $ 182.3 $ 71.0
Basic net (loss) income percommon share . . . . . . . . . . . . . $ (0.49) $ 2.45 $ 1.71 $ (11.99) $ 0.66 $ 6.86 $ 2.36 $ 0.87
Diluted net (loss) income percommon share . . . . . . . . . . . . . (0.49) 2.43 1.69 (11.99) 0.65 6.76 2.31 0.85
Dividends declared per commonshare . . . . . . . . . . . . . . . . . . . . 0.60 0.60 0.60 0.55 0.55 0.50 0.50 0.50
202

REPORT OF INDEPENDENT REGISTERED PUBLIC ACCOUNTING FIRM
To the Board of Directors and Shareholders of PartnerRe Ltd.
We have audited the accompanying consolidated balance sheets of PartnerRe Ltd. and subsidiaries (theCompany) as of December 31, 2011 and 2010, and the related consolidated statements of operations andcomprehensive (loss) income, shareholders’ equity, and cash flows for each of the three years in the period endedDecember 31, 2011. These financial statements are the responsibility of the Company’s management. Ourresponsibility is to express an opinion on these financial statements based on our audits.
We conducted our audits in accordance with the standards of the Public Company Accounting OversightBoard (United States). Those standards require that we plan and perform the audit to obtain reasonable assuranceabout whether the financial statements are free of material misstatement. An audit includes examining, on a testbasis, evidence supporting the amounts and disclosures in the financial statements. An audit also includesassessing the accounting principles used and significant estimates made by management, as well as evaluatingthe overall financial statement presentation. We believe that our audits provide a reasonable basis for ouropinion.
In our opinion, such consolidated financial statements present fairly, in all material respects, the financialposition of PartnerRe Ltd. and subsidiaries as of December 31, 2011 and 2010, and the results of their operationsand their cash flows for each of the three years in the period ended December 31, 2011, in conformity withaccounting principles generally accepted in the United States of America.
We have also audited, in accordance with the standards of the Public Company Accounting Oversight Board(United States), the Company’s internal control over financial reporting as of December 31, 2011, based on thecriteria established in Internal Control—Integrated Framework issued by the Committee of SponsoringOrganizations of the Treadway Commission and our report dated February 24, 2012 expressed an unqualifiedopinion on the Company’s internal control over financial reporting.
/s/ DELOITTE & TOUCHE LTD.Deloitte & Touche Ltd.
Hamilton, BermudaFebruary 24, 2012
203

ITEM 9. CHANGES IN AND DISAGREEMENTS WITH ACCOUNTANTS ON ACCOUNTING ANDFINANCIAL DISCLOSURE
None.
ITEM 9A. CONTROLS AND PROCEDURES
Disclosure Controls and Procedures
The Company carried out an evaluation, under the supervision and with the participation of Management,including the Chief Executive Officer and Chief Financial Officer, as of December 31, 2011, of the effectivenessof the design and operation of its disclosure controls and procedures, as defined in Rules 13a-15(e) and 15d-15(e)under the Securities Exchange Act of 1934, as amended. Based upon that evaluation, the Chief Executive Officerand Chief Financial Officer concluded that, as of December 31, 2011, the disclosure controls and procedures areeffective such that information required to be disclosed by the Company in reports that it files or submitspursuant to the Securities Exchange Act is recorded, processed, summarized and reported within the time periodsspecified in the rules and forms of the Securities and Exchange Commission and is accumulated andcommunicated to Management, including its principal executive and principal financial officers, as appropriate,to allow timely decisions regarding required disclosures.
Management’s Report on Internal Control over Financial Reporting
Management is responsible for establishing and maintaining adequate internal control over financialreporting as defined in Rules 13a-15(f) and 15d-15(f) under the Securities Exchange Act of 1934, as amended.Internal control over financial reporting is designed to provide reasonable assurance regarding the reliability offinancial reporting and the preparation of financial statements for external purposes in accordance with generallyaccepted accounting principles. Internal control over financial reporting includes those policies and proceduresthat:
(i) pertain to the maintenance of records that, in reasonable detail, accurately and fairly reflect thetransactions and dispositions of the assets of the Company;
(ii) provide reasonable assurance that transactions are recorded as necessary to permit preparation offinancial statements in accordance with generally accepted accounting principles, and that receipts andexpenditures are being made only in accordance with authorizations of Management and directors; and
(iii) provide reasonable assurance regarding prevention or timely detection of unauthorized acquisition, use,or disposition of assets that could have a material effect on the financial statements.
Because of its inherent limitations, internal control over financial reporting may not prevent or detectmaterial misstatements. Also, projections of any evaluation of effectiveness to future periods are subject to therisk that the controls may become inadequate because of changes in conditions, or that the degree of compliancewith the policies or procedures may deteriorate.
Management has assessed the effectiveness of internal control over financial reporting as of December 31,2011. In making this assessment, Management used the criteria set forth by the Committee of SponsoringOrganizations of the Treadway Commission in Internal Control-Integrated Framework.
Based on our assessment and those criteria, Management believes that the Company maintained effectiveinternal control over financial reporting as of December 31, 2011.
Deloitte & Touche Ltd., the Company’s independent registered public accounting firm, has issued a reporton the effectiveness of the Company’s internal control over financial reporting, and its report appears below.
204

Internal Control Over Financial Reporting
There have been no changes in the Company’s internal control over financial reporting identified inconnection with such evaluation that occurred during the three months ended December 31, 2011 that havematerially affected, or are reasonably likely to materially affect, the Company’s internal controls over financialreporting.
205

REPORT OF INDEPENDENT REGISTERED PUBLIC ACCOUNTING FIRM
To the Board of Directors and Shareholders of PartnerRe Ltd.
We have audited the internal control over financial reporting of PartnerRe Ltd. and subsidiaries (theCompany) as of December 31, 2011, based on criteria established in Internal Control—Integrated Frameworkissued by the Committee of Sponsoring Organizations of the Treadway Commission. The Company’smanagement is responsible for maintaining effective internal control over financial reporting and for itsassessment of the effectiveness of internal control over financial reporting, included in the accompanyingManagement’s Report on Internal Control over Financial Reporting. Our responsibility is to express an opinionon the Company’s internal control over financial reporting based on our audit.
We conducted our audit in accordance with the standards of the Public Company Accounting OversightBoard (United States). Those standards require that we plan and perform the audit to obtain reasonable assuranceabout whether effective internal control over financial reporting was maintained in all material respects. Ouraudit included obtaining an understanding of internal control over financial reporting, assessing the risk that amaterial weakness exists, testing and evaluating the design and operating effectiveness of internal control basedon the assessed risk, and performing such other procedures as we considered necessary in the circumstances. Webelieve that our audit provides a reasonable basis for our opinion.
A company’s internal control over financial reporting is a process designed by, or under the supervision of,the company’s principal executive and principal financial officers, or persons performing similar functions, andeffected by the company’s board of directors, management, and other personnel to provide reasonable assuranceregarding the reliability of financial reporting and the preparation of financial statements for external purposes inaccordance with generally accepted accounting principles. A company’s internal control over financial reportingincludes those policies and procedures that (1) pertain to the maintenance of records that, in reasonable detail,accurately and fairly reflect the transactions and dispositions of the assets of the company; (2) provide reasonableassurance that transactions are recorded as necessary to permit preparation of financial statements in accordancewith generally accepted accounting principles, and that receipts and expenditures of the company are being madeonly in accordance with authorizations of management and directors of the company; and (3) provide reasonableassurance regarding prevention or timely detection of unauthorized acquisition, use, or disposition of thecompany’s assets that could have a material effect on the financial statements.
Because of the inherent limitations of internal control over financial reporting, including the possibility ofcollusion or improper management override of controls, material misstatements due to error or fraud may not beprevented or detected on a timely basis. Also, projections of any evaluation of the effectiveness of the internalcontrol over financial reporting to future periods are subject to the risk that the controls may become inadequatebecause of changes in conditions, or that the degree of compliance with the policies or procedures maydeteriorate.
In our opinion, the Company maintained, in all material respects, effective internal control over financialreporting as of December 31, 2011, based on the criteria established in Internal Control—Integrated Frameworkissued by the Committee of Sponsoring Organizations of the Treadway Commission.
We have also audited, in accordance with the standards of the Public Company Accounting Oversight Board(United States), the consolidated financial statements as of and for the year ended December 31, 2011 of theCompany and our report dated February 24, 2012 expressed an unqualified opinion on those financial statements.
/s/ DELOITTE & TOUCHE LTD.Deloitte & Touche Ltd.
Hamilton, BermudaFebruary 24, 2012
206

ITEM 9B. OTHER INFORMATION
None.
PART III
ITEM 10. DIRECTORS, EXECUTIVE OFFICERS AND CORPORATE GOVERNANCE
The information with respect to directors and executive officers and corporate governance of the Companyis contained under the captions Our Directors, Our Executive Officers, Corporate Governance and Election ofDirectors in the Proxy Statement and is incorporated herein by reference in response to this item.
CODE OF ETHICS
The information with respect to the Company’s code of ethics is contained under the caption Code ofBusiness Conduct and Ethics in the Proxy Statement and is incorporated herein by reference in response to thisitem.
AUDIT COMMITTEE
The information with respect to the Company’s audit committee is contained under the caption AuditCommittee in the Proxy Statement and is incorporated herein by reference in response to this item.
ITEM 11. EXECUTIVE COMPENSATION
The information with respect to executive compensation is contained under the caption ExecutiveCompensation and Director Compensation in the Proxy Statement and is incorporated herein by reference inresponse to this item.
ITEM 12. SECURITY OWNERSHIP OF CERTAIN BENEFICIAL OWNERS AND MANAGEMENTAND RELATED STOCKHOLDER MATTERS
The information with respect to security ownership of certain beneficial owners and management and theequity compensation plan disclosure is contained under the captions Security Ownership of Certain BeneficialOwners, Management and Directors and Equity Compensation in the Proxy Statement and is incorporated hereinby reference in response to this item.
ITEM 13. CERTAIN RELATIONSHIPS AND RELATED TRANSACTIONS, AND DIRECTORINDEPENDENCE
The information with respect to certain relationships and related transactions, and director independence iscontained under the caption Certain Relationships and Related Transactions in the Proxy Statement and isincorporated herein by reference in response to this item.
ITEM 14. PRINCIPAL ACCOUNTANT FEES AND SERVICES
The information with respect to principal accountant fees and services is contained under the captionPrincipal Accountant Fees and Services in the Proxy Statement and is incorporated herein by reference inresponse to this item.
207

PART IV
ITEM 15. EXHIBITS AND FINANCIAL STATEMENT SCHEDULES
Incorporated by Reference
FiledHerewithExhibit Description Form
OriginalNumber
DateFiled
SEC FileReferenceNumber
(a) Exhibits and Financial Statement Schedules
1. Financial Statements
Included in Part II—See Item 8 of this report . . . . . . . . . . . . . . . . . . . X
2. Financial Statement Schedules
Included in Part IV of this report:
Report of Independent Registered Public Accounting Firm onFinancial Statement Schedules . . . . . . . . . . . . . . . . . . . . . . . . . . . . . . X
Schedule I—Consolidated Summary of Investments—at December31, 2011 . . . . . . . . . . . . . . . . . . . . . . . . . . . . . . . . . . . . . . . . . . . . . . . . X
Schedule II—Condensed Financial Information of PartnerRe Ltd. . . X
Schedule III—Supplementary Insurance Information—for the YearsEnded December 31, 2011, 2010 and 2009 . . . . . . . . . . . . . . . . . . . . X
Schedule IV—Reinsurance—for the Years Ended December 31,2011, 2010 and 2009 . . . . . . . . . . . . . . . . . . . . . . . . . . . . . . . . . . . . . . X
Schedule VI—Supplemental Information Concerning Property-Casualty Insurance Operations—for the Years Ended December 31,2011, 2010 and 2009 . . . . . . . . . . . . . . . . . . . . . . . . . . . . . . . . . . . . . . X
3. Exhibits
Included on page 218
208

SIGNATURES
Pursuant to the requirements of Section 13 or 15(d) of the Securities Exchange Act of 1934, the Companyhas duly caused this report to be signed on its behalf by the undersigned, thereunto duly authorized, onFebruary 29, 2012.
PARTNERRE LTD.
By: /S/ WILLIAM BABCOCK
Name: William Babcock
Title: Executive Vice President & Chief Financial Officer
209

REPORT OF INDEPENDENT REGISTERED PUBLIC ACCOUNTING FIRM
To the Board of Directors and Shareholders of PartnerRe Ltd.
We have audited the consolidated financial statements of PartnerRe Ltd. and subsidiaries (the Company) asof December 31, 2011 and 2010, and for each of the three years in the period ended December 31, 2011, and theCompany’s internal control over financial reporting as of December 31, 2011, and have issued our reportsthereon dated February 24, 2012; such reports are included elsewhere in this Form 10-K/A (Amendment No. 1).Our audits also included the financial statement schedules of the Company listed in Item 15. These financialstatement schedules are the responsibility of the Company’s management. Our responsibility is to express anopinion based on our audits. In our opinion, such financial statement schedules, when considered in relation tothe basic consolidated financial statements taken as a whole, present fairly, in all material respects, theinformation set forth therein.
/S/ DELOITTE & TOUCHE LTD.Deloitte & Touche Ltd.
Hamilton, BermudaFebruary 24, 2012
210

SCHEDULE I
PartnerRe Ltd.
Consolidated Summary of InvestmentsOther Than Investments in Related Parties
at December 31, 2011(Expressed in thousands of U.S. dollars)
Type of investment Cost (1) (2) Fair Value (2)
Amount at whichshown in the
balance sheet (2)
Fixed maturitiesU.S. government and government sponsored enterprises . . $ 1,084,533 $ 1,115,777 $ 1,115,777U.S. states, territories and municipalities . . . . . . . . . . . . . . . 117,528 123,684 123,684Non-U.S. sovereign government, supranational and
government related . . . . . . . . . . . . . . . . . . . . . . . . . . . . . . 2,807,363 2,964,091 2,964,091Corporate . . . . . . . . . . . . . . . . . . . . . . . . . . . . . . . . . . . . . . . 5,461,478 5,746,997 5,746,997Asset-backed securities . . . . . . . . . . . . . . . . . . . . . . . . . . . . . 626,508 633,799 633,799Residential mortgage-backed securities . . . . . . . . . . . . . . . . 3,224,850 3,282,901 3,282,901Other mortgage-backed securities . . . . . . . . . . . . . . . . . . . . 72,144 74,580 74,580
Total fixed maturities . . . . . . . . . . . . . . . . . . . . . . . . . . . . . . . . . . 13,394,404 13,941,829 13,941,829Equities
Banks, trust and insurance companies . . . . . . . . . . . . . . . . . 151,622 137,600 137,600Public utilities . . . . . . . . . . . . . . . . . . . . . . . . . . . . . . . . . . . . 25,822 28,415 28,415Industrial, miscellaneous and all other . . . . . . . . . . . . . . . . . 740,169 778,676 778,676
Total equities . . . . . . . . . . . . . . . . . . . . . . . . . . . . . . . . . . . . . . . . 917,613 944,691 944,691Short-term investments . . . . . . . . . . . . . . . . . . . . . . . . . . . . . . . . . $ 42,563 42,571 42,571Other invested assets(3) . . . . . . . . . . . . . . . . . . . . . . . . . . . . . . . . . 90,512 90,512
Total . . . . . . . . . . . . . . . . . . . . . . . . . . . . . . . . . . . . . . . . . . . . . . . $15,019,603 $15,019,603
(1) Original cost of fixed maturities reduced by repayments and adjusted for amortization of premiums oraccrual of discounts. Original cost of equity securities. For investments acquired from Paris Re, cost isbased on the fair value at the date of acquisition and subsequently adjusted for amortization of fixedmaturities and short-term investments.
(2) Excludes the investment portfolio underlying the funds held – directly managed account. While the netinvestment income and net realized and unrealized gains and losses inure to the benefit of the Company, theCompany does not legally own the investments.
(3) Other invested assets excludes the Company’s investments accounted for using the cost method ofaccounting, equity method of accounting or investment company accounting.
211

SCHEDULE II
PartnerRe Ltd.
Condensed Balance Sheets—Parent Company Only(Expressed in thousands of U.S. dollars, except parenthetical share and per share data)
December 31,2011
December 31,2010
AssetsFixed maturities, trading securities, at fair value (amortized cost: 2011, $178,674;
2010, $10,356) . . . . . . . . . . . . . . . . . . . . . . . . . . . . . . . . . . . . . . . . . . . . . . . . . . . . . $ 181,117 $ 10,337Short-term investments, trading securities, at fair value (amortized cost: 2011,
$8,463; 2010, $Nil) . . . . . . . . . . . . . . . . . . . . . . . . . . . . . . . . . . . . . . . . . . . . . . . . . 8,467 —Cash and cash equivalents, at fair value, which approximates amortized cost . . . . . . 51,729 329,054Investments in subsidiaries . . . . . . . . . . . . . . . . . . . . . . . . . . . . . . . . . . . . . . . . . . . . . 7,693,969 7,576,571Intercompany loans and balances receivable . . . . . . . . . . . . . . . . . . . . . . . . . . . . . . . 350,265 442,290Other . . . . . . . . . . . . . . . . . . . . . . . . . . . . . . . . . . . . . . . . . . . . . . . . . . . . . . . . . . . . . . 10,066 13,069
Total assets . . . . . . . . . . . . . . . . . . . . . . . . . . . . . . . . . . . . . . . . . . . . . . . . . . . . . . . . . $ 8,295,613 $ 8,371,321
LiabilitiesIntercompany loans and balances payable (1) . . . . . . . . . . . . . . . . . . . . . . . . . . . . . . . . $ 1,815,049 $ 1,131,463Accounts payable, accrued expenses and other . . . . . . . . . . . . . . . . . . . . . . . . . . . . . . 13,022 32,939
Total liabilities . . . . . . . . . . . . . . . . . . . . . . . . . . . . . . . . . . . . . . . . . . . . . . . . . . . . . . 1,828,071 1,164,402
Shareholders’ EquityCommon shares (par value $1.00, issued: 2011, 84,766,693 shares; 2010,
84,033,089 shares) . . . . . . . . . . . . . . . . . . . . . . . . . . . . . . . . . . . . . . . . . . . . . . . . . . 84,767 84,033Preferred shares (par value $1.00, issued and outstanding: 2011, 35,750,000
shares, 2010, 20,800,000 shares; aggregate liquidation value: 2011, $893,750;2010, $520,000) . . . . . . . . . . . . . . . . . . . . . . . . . . . . . . . . . . . . . . . . . . . . . . . . . . . . 35,750 20,800
Additional paid-in capital . . . . . . . . . . . . . . . . . . . . . . . . . . . . . . . . . . . . . . . . . . . . . . 3,803,796 3,419,864Accumulated other comprehensive (loss) income:Currency translation adjustment . . . . . . . . . . . . . . . . . . . . . . . . . . . . . . . . . . . . . . . . . 4,267 16,101Other accumulated comprehensive loss, net of tax . . . . . . . . . . . . . . . . . . . . . . . . . . . (16,911) (12,045)Retained earnings . . . . . . . . . . . . . . . . . . . . . . . . . . . . . . . . . . . . . . . . . . . . . . . . . . . . 4,035,103 4,761,178Common shares held in treasury, at cost (2011, 19,444,365 shares; 2010, 14,046,895
shares) . . . . . . . . . . . . . . . . . . . . . . . . . . . . . . . . . . . . . . . . . . . . . . . . . . . . . . . . . . . (1,479,230) (1,083,012)
Total shareholders’ equity . . . . . . . . . . . . . . . . . . . . . . . . . . . . . . . . . . . . . . . . . . . . 6,467,542 7,206,919
Total liabilities and shareholders’ equity . . . . . . . . . . . . . . . . . . . . . . . . . . . . . . . . . $ 8,295,613 $ 8,371,321
(1) The Company has fully and unconditionally guaranteed on a subordinated basis all obligations ofPartnerRe Finance II Inc., an indirect wholly-owned finance subsidiary of the Company, related to theremaining $63.4 million aggregate principal amount of 6.440% Fixed-to-Floating Rate Junior SubordinatedCapital Efficient Notes (CENts). The Company’s obligations under this guarantee are unsecured and rankjunior in priority of payments to the Company’s Senior Notes.
The Company has fully and unconditionally guaranteed all obligations of PartnerRe Finance A andPartnerRe Finance B, indirect wholly-owned finance subsidiaries of the Company, related to the issuance of$250 million aggregate principal amount of 6.875% Senior Notes and $500 million aggregate principalamount of 5.500% Senior Notes. The Company’s obligations under these guarantees are senior andunsecured and rank equally with all other senior unsecured indebtedness of the Company.
212

SCHEDULE II
PartnerRe Ltd.
Condensed Statements of Operations—Parent Company Only(Expressed in thousands of U.S. dollars)
For the yearended
December 31,2011
For the yearended
December 31,2010
For the yearended
December 31,2009
RevenuesNet investment income (loss) . . . . . . . . . . . . . . . . . . . . . . . . . . . . . . . . . $ 2,452 $ 1,745 $ (375)Net realized and unrealized investment gains (losses) . . . . . . . . . . . . . . 5,499 (3,884) 18,582
Total revenues . . . . . . . . . . . . . . . . . . . . . . . . . . . . . . . . . . . . . . . . . . . . 7,951 (2,139) 18,207
ExpensesOther operating expenses . . . . . . . . . . . . . . . . . . . . . . . . . . . . . . . . . . . . 76,690 92,361 103,293Interest expense on intercompany loans . . . . . . . . . . . . . . . . . . . . . . . . . 739 5,609 6,425Interest expense . . . . . . . . . . . . . . . . . . . . . . . . . . . . . . . . . . . . . . . . . . . . — 301 3,919Net foreign exchange (gains) losses . . . . . . . . . . . . . . . . . . . . . . . . . . . . (9,540) 17,244 4,517
Total expenses . . . . . . . . . . . . . . . . . . . . . . . . . . . . . . . . . . . . . . . . . . . . 67,889 115,515 118,154
Loss before equity in net (loss) income of subsidiaries . . . . . . . . . . . (59,938) (117,654) (99,947)Equity in net (loss) income of subsidiaries . . . . . . . . . . . . . . . . . . . . . . . (460,353) 970,206 1,636,801
Net (loss) income . . . . . . . . . . . . . . . . . . . . . . . . . . . . . . . . . . . . . . . . . . $(520,291) $ 852,552 $1,536,854
213

SCHEDULE II
PartnerRe Ltd.
Condensed Statements of Cash Flows—Parent Company Only(Expressed in thousands of U.S. dollars)
For the yearended
December 31,2011
For the yearended
December 31,2010
For the yearended
December 31,2009
Cash flows from operating activitiesNet (loss) income . . . . . . . . . . . . . . . . . . . . . . . . . . . . . . . . . . . . . . . . . . $(520,291) $ 852,552 $ 1,536,854Adjustments to reconcile net (loss) income to net cash used in
operating activities:Equity in net loss (income) of subsidiaries . . . . . . . . . . . . . . . . . . . . . . 460,353 (970,206) (1,636,801)Other, net . . . . . . . . . . . . . . . . . . . . . . . . . . . . . . . . . . . . . . . . . . . . . . . . 7,663 36,388 8,203
Net cash used in operating activities . . . . . . . . . . . . . . . . . . . . . . . . . (52,275) (81,266) (91,744)
Cash flows from investing activitiesSales and redemptions of fixed maturities . . . . . . . . . . . . . . . . . . . . . . . 446,452 698,393 —Sales and redemptions of short-term investments . . . . . . . . . . . . . . . . . 154,473 69,489 —Purchases of short-term investments . . . . . . . . . . . . . . . . . . . . . . . . . . . (99,955) — —Advances to/from subsidiaries, net . . . . . . . . . . . . . . . . . . . . . . . . . . . . 3,511 697,019 508,213Net issue of intercompany loans receivable and payable . . . . . . . . . . . 379,676 380,771 —Investments in subsidiaries . . . . . . . . . . . . . . . . . . . . . . . . . . . . . . . . . . (860,000) — (175,111)Other, net . . . . . . . . . . . . . . . . . . . . . . . . . . . . . . . . . . . . . . . . . . . . . . . . 2,408 (4,283) (2,851)Foreign exchange forward contracts . . . . . . . . . . . . . . . . . . . . . . . . . . . (6,750) 3,528 (71,303)
Net cash provided by investing activities . . . . . . . . . . . . . . . . . . . . . . 19,815 1,844,917 258,948
Cash flows from financing activitiesCash dividends paid to shareholders . . . . . . . . . . . . . . . . . . . . . . . . . . . (205,784) (192,156) (151,851)Repurchase of common shares . . . . . . . . . . . . . . . . . . . . . . . . . . . . . . . . (413,737) (1,065,121) —Net proceeds from issuance of preferred shares . . . . . . . . . . . . . . . . . . 361,722 — —Issuance of common shares . . . . . . . . . . . . . . . . . . . . . . . . . . . . . . . . . . 16,041 37,682 16,034Repayment of debt . . . . . . . . . . . . . . . . . . . . . . . . . . . . . . . . . . . . . . . . . — (200,000) (200,000)Contract fees on forward sale agreement . . . . . . . . . . . . . . . . . . . . . . . . — (2,638) (5,070)
Net cash used in financing activities . . . . . . . . . . . . . . . . . . . . . . . . . . (241,758) (1,422,233) (340,887)
Effect of foreign exchange rate changes on cash . . . . . . . . . . . . . . . . (3,107) (15,867) (1,342)(Decrease) increase in cash and cash equivalents . . . . . . . . . . . . . . . (277,325) 325,551 (175,025)Cash and cash equivalents—beginning of year . . . . . . . . . . . . . . . . . 329,054 3,503 178,528
Cash and cash equivalents—end of year . . . . . . . . . . . . . . . . . . . . . . $ 51,729 $ 329,054 $ 3,503
Supplemental cash flow information:Interest paid . . . . . . . . . . . . . . . . . . . . . . . . . . . . . . . . . . . . . . . . . . . . . . $ 743 $ 1,680 $ 14,362
(1) The Company received non-cash dividends from its subsidiaries of $274 million, $500 million and $600million for the years ended December 31, 2011, 2010 and 2009, respectively, which have been excludedfrom the Condensed Statements of Cash Flows—Parent Company Only.
(2) During 2010, the Company sold a wholly-owned subsidiary to another wholly-owned subsidiary andreceived fixed maturities and short-term investments as partial settlement of certain intercompany loansreceivable. These non-cash transactions have been excluded from the Condensed Statements of CashFlows—Parent Company Only.
(3) The acquisition of assets and liabilities as part of the Paris Re acquisition in 2009 involved non-cash sharefor share transactions which have been excluded from the Condensed Statements of Cash Flows—ParentCompany Only.
214

SCH
ED
UL
EII
I
Par
tner
Re
Ltd
.
Supp
lem
enta
ryIn
sura
nce
Info
rmat
ion
For
the
year
sen
ded
Dec
embe
r31
,201
1,20
10an
d20
09(E
xpre
ssed
inth
ousa
nds
ofU
.S.d
olla
rs)
Def
erre
dP
olic
yA
cqui
siti
onC
osts
Gro
ssR
eser
ves
Une
arne
dP
rem
ium
s
Oth
erB
enef
its
Pay
able
Pre
miu
mR
even
ue
Net
inve
stm
ent
Inco
me(
1)L
osse
sIn
curr
edA
mor
tiza
tion
ofD
AC
Oth
erO
pera
ting
Exp
ense
s(2)
Pre
miu
ms
Wri
tten
2011
Non
-lif
e..
....
....
....
....
..$3
39,0
10$1
1,27
3,09
1$1
,432
,476
$—
$3,8
44,2
70$
N/A
$3,7
17,1
71$8
20,7
47$2
83,4
50$3
,688
,185
Lif
e..
....
....
....
....
....
.20
8,10
8—
15,3
161,
645,
662
792,
148
66,0
6965
0,26
111
6,88
452
,905
N/A
Cor
pora
tean
dO
ther
....
....
..84
—1,
049
—11
,336
563,
079
5,13
873
098
,491
12,3
90
Tot
al..
....
....
....
....
....
.$5
47,2
02$1
1,27
3,09
1$1
,448
,841
$1,6
45,6
62$4
,647
,754
$629
,148
$4,3
72,5
70$9
38,3
61$4
34,8
46$3
,700
,575
2010
Non
-lif
e..
....
....
....
....
..$3
69,0
75$1
0,66
6,60
4$1
,578
,696
$—
$4,0
29,6
44$
N/A
$2,6
57,0
41$8
56,0
68$3
16,9
00$3
,960
,713
Lif
e..
....
....
....
....
....
.22
6,47
6—
20,3
851,
750,
410
743,
565
71,5
3962
3,62
711
6,28
056
,965
N/A
Cor
pora
tean
dO
ther
....
....
..6
—58
—3,
262
601,
243
2,95
018
916
5,88
61,
964
Tot
al..
....
....
....
....
....
.$5
95,5
57$1
0,66
6,60
4$1
,599
,139
$1,7
50,4
10$4
,776
,471
$672
,782
$3,2
83,6
18$9
72,5
37$5
39,7
51$3
,962
,677
2009
Non
-lif
e..
....
....
....
....
..$3
43,7
29$1
0,81
1,48
3$1
,684
,015
$—
$3,5
24,6
90$
N/A
$1,8
57,4
81$7
71,6
84$2
52,8
61$3
,350
,909
Lif
e..
....
....
....
....
....
.27
1,09
1—
21,7
241,
615,
193
587,
553
61,8
3344
0,33
711
2,92
047
,247
N/A
Cor
pora
tean
dO
ther
....
....
..37
—1,
077
—7,
582
534,
238
(2,5
22)
610
130,
700
6,91
1
Tot
al..
....
....
....
....
....
.$6
14,8
57$1
0,81
1,48
3$1
,706
,816
$1,6
15,1
93$4
,119
,825
$596
,071
$2,2
95,2
96$8
85,2
14$4
30,8
08$3
,357
,820
(1)
Bec
ause
the
Com
pany
does
notm
anag
eit
sas
sets
byse
gmen
t,ne
tinv
estm
enti
ncom
eis
nota
lloc
ated
toth
eN
on-l
ife
segm
ento
fthe
rein
sura
nce
oper
atio
ns.H
owev
er,b
ecau
seof
the
inte
rest
-sen
siti
vena
ture
ofso
me
ofth
eC
ompa
ny’s
Lif
epr
oduc
ts,n
etin
vest
men
tinc
ome
isco
nsid
ered
inM
anag
emen
t’s
asse
ssm
ento
fthe
prof
itab
ilit
yof
the
Lif
ese
gmen
t.(2
)O
ther
oper
atin
gex
pens
esar
ea
com
pone
ntof
unde
rwri
ting
resu
ltfo
rth
eN
on-l
ife
and
Lif
ese
gmen
ts.O
ther
oper
atin
gex
pens
esin
clud
edin
Cor
pora
tean
dO
ther
repr
esen
tcor
pora
teex
pens
esan
dot
her
oper
atin
gex
pens
esre
late
dto
the
Com
pany
’spr
inci
palf
inan
cetr
ansa
ctio
ns,i
nsur
ance
-lin
ked
secu
riti
esan
dst
rate
gic
inve
stm
ents
.
215

SCHEDULE IV
PartnerRe Ltd.
ReinsuranceFor the years ended December 31, 2011, 2010 and 2009
(Expressed in thousands of U.S. dollars)
Grossamount
Ceded toother
companies
Assumedfrom othercompanies Net amount
Percentageof amountassumed
to net
2011Life reinsurance in force . . . . . . . . . . . . . . . . $ — $1,673,196 $199,347,294 $197,674,098 101%Premiums earned
Life . . . . . . . . . . . . . . . . . . . . . . . . . . . . — 3,470 774,383 770,913 100%Accident and health . . . . . . . . . . . . . . . . — — 21,235 21,235 100%Property and casualty . . . . . . . . . . . . . . 73,567 138,069 3,920,108 3,855,606 102%
Total premiums . . . . . . . . . . . . . . . $73,567 $ 141,539 $ 4,715,726 $ 4,647,754 101%
2010Life reinsurance in force . . . . . . . . . . . . . . . . $ — $1,726,050 $192,669,971 $190,943,921 101%Premiums earned
Life . . . . . . . . . . . . . . . . . . . . . . . . . . . . — 5,118 729,007 723,889 101%Accident and health . . . . . . . . . . . . . . . . — — 19,676 19,676 100%Property and casualty . . . . . . . . . . . . . . 25,532 175,308 4,182,682 4,032,906 104%
Total premiums . . . . . . . . . . . . . . . $25,532 $ 180,426 $ 4,931,365 $ 4,776,471 103%
2009Life reinsurance in force . . . . . . . . . . . . . . . . $ — $1,636,933 $204,704,933 $203,068,000 101%Premiums earned
Life . . . . . . . . . . . . . . . . . . . . . . . . . . . . — 4,608 570,118 565,510 101%Accident and health . . . . . . . . . . . . . . . . — — 22,043 22,043 100%Property and casualty . . . . . . . . . . . . . . 8,390 77,946 3,601,828 3,532,272 102%
Total premiums . . . . . . . . . . . . . . . $ 8,390 $ 82,554 $ 4,193,989 $ 4,119,825 102%
216

SCH
ED
UL
EV
I
Par
tner
Re
Ltd
.
Supp
lem
enta
lInf
orm
atio
nC
once
rnin
gP
rope
rty-
Cas
ualt
yIn
sura
nce
Ope
rati
ons
For
the
year
sen
ded
Dec
embe
r31
,201
1,20
10an
d20
09(E
xpre
ssed
inth
ousa
nds
ofU
.S.d
olla
rs)
Aff
iliat
ion
wit
hR
egis
tran
t
Def
erre
dP
olic
yA
cqui
siti
onC
osts
Lia
bilit
yfo
rU
npai
dL
osse
san
dL
oss
Exp
ense
sU
near
ned
Pre
miu
ms
Pre
miu
ms
Ear
ned
Los
ses
and
Los
sE
xpen
ses
Incu
rred
Am
orti
zati
onof
Def
erre
dP
olic
yA
cqui
siti
onC
osts
Pai
dL
osse
san
dL
oss
Exp
ense
sP
rem
ium
sW
ritt
en
Con
solid
ated
subs
idia
ries
2011
....
....
....
....
....
....
....
$339
,094
$11,
273,
091
$1,4
33,5
25$3
,855
,606
$3,7
22,3
09$8
21,4
77$2
,990
,559
$3,7
00,5
7520
10..
....
....
....
....
....
....
..36
9,08
110
,666
,604
1,57
8,75
44,
032,
906
2,65
9,99
185
6,25
72,
579,
018
3,96
2,67
720
09..
....
....
....
....
....
....
..34
3,76
610
,811
,483
1,68
5,09
23,
532,
272
1,85
4,95
977
2,29
42,
043,
878
3,35
7,82
0
217

EXHIBIT INDEX
ExhibitNumber Exhibit Description
Incorporated by Reference
FiledHerewithForm
OriginalNumber Date Filed
SEC FileReferenceNumber
3.1 Amended Memorandum of Association. F-3 3.1 June 20, 1997 333-7094
3.2 Amended and Restated Bye-laws ofPartnerRe Ltd., dated as of May 22,2009.
8-K 3.1 May 28, 2009 001-1453609856453
4.1 Specimen Common Share Certificate. 10-Q 4.1 December 10,1993
0-2253
4.2 Specimen Share Certificate for the6.75% Series C CumulativeRedeemable Preferred Shares.
8-K 99.3 May 2, 2003 001-1453603680524
4.2.1 Certificate of Designation of theCompany’s 6.75% Series C CumulativeRedeemable Preferred Shares.
8-K 99.4 May 2, 2003 001-1453603680524
4.3 Specimen Share Certificate for the6.50% Series D CumulativeRedeemable Preferred Shares.
8-K 99.3 November 12,2004
001-14536041136085
4.3.1 Certificate of Designation, Preferencesand Rights of the Company’s 6.50%Series D Cumulative RedeemablePreferred Shares.
8-K 99.4 November 12,2004
001-14536041136085
4.4 Specimen Share Certificate for the7.25% Series E Cumulative RedeemablePreferred Shares.
8-K 4.1 June 15, 2011 001-1453611912259
4.4.1 Certificate of Designation, Preferencesand Rights of the Company’s 7.25%Series E Cumulative RedeemablePreferred Shares.
8-K 3.1 June 15, 2011 001-1453611912259
4.5 Junior Subordinated Indenture datedNovember 2, 2006 among PartnerReFinance II Inc., the Company, J.P.Morgan Securities Inc., LehmanBrothers Inc. and the other underwritersnamed therein.
8-K 4.1 November 7,2006
001-14536061194484
4.5.1 First Supplemental Junior SubordinatedIndenture (including the form of theCENts) among PartnerRe Finance IIInc., the Company and The Bank ofNew York.
8-K 4.2 November 7,2006
001-14536061194484
4.6 Junior Subordinated Debt SecuritiesGuarantee Agreement datedNovember 7, 2006 between theCompany and The Bank of New York.
8-K 4.3 November 7,2006
001-14536061194484
218

ExhibitNumber Exhibit Description
Incorporated by Reference
FiledHerewithForm
OriginalNumber Date Filed
SEC FileReferenceNumber
4.6.1 First Supplemental Junior SubordinatedDebt Securities Guarantee Agreementdated November 7, 2006 between theCompany and The Bank of New York.
8-K 4.4 November 7,2006
001-14536061194484
4.7 Indenture dated May 27, 2008 amongPartnerRe Finance A LLC, PartnerReLtd. and The Bank of New York.
8-K 4.1 May 27, 2008 001-1453608860178
4.7.1 First Supplemental Indenture datedMay 27, 2008 among PartnerRe FinanceA LLC, PartnerRe Ltd. and The Bank ofNew York.
8-K 4.2 May 27, 2008 001-1453608860178
4.8 Debt Securities Guarantee Agreementdated May 27, 2008 between PartnerReLtd. and The Bank of New York.
8-K 4.3 May 27, 2008 001-1435608860178
4.8.1 First Supplemental Debt SecuritiesGuarantee Agreement dated May 27,2008 between PartnerRe Ltd. and TheBank of New York.
8-K 4.4 May 27, 2008 001-1453608860178
4.9 Indenture dated March 15, 2010 amongPartnerRe Finance B LLC, PartnerReLtd. and The Bank of New YorkMellon.
8-K 4.1 March 15,2010
001-1453610681438
4.9.1 First Supplemental Indenture datedMarch 15, 2010 among PartnerReFinance B LLC, PartnerRe Ltd. and TheBank of New York Mellon.
8-K 4.2 March 15,2010
001-1453610681438
4.10 Senior Debt Securities GuaranteeAgreement dated March 15, 2010between PartnerRe Ltd. and The Bankof New York Mellon.
8-K 4.3 March 15,2010
001-1453610681438
4.10.1 First Supplemental Senior DebtSecurities Guarantee Agreement datedMarch 15, 2010 between PartnerRe Ltd.and The Bank of New York Mellon.
8-K 4.4 March 15,2010
001-1453610681438
10.1 Credit Agreement among PartnerReLtd., the Designated SubsidiaryBorrowers, the Lenders and JPMorganChase Bank, N.A. dated July 16, 2010.
8-K 10.1 July 21, 2010 001-1453610962355
10.2 Capital Management MaintenanceAgreement, effective February 20,2004, between PartnerRe Ltd.,PartnerRe U.S. Corporation and PartnerReinsurance Company of the U.S.
10-Q 10.2 August 6,2004
001-1453604957898
219

ExhibitNumber Exhibit Description
Incorporated by Reference
FiledHerewithForm
OriginalNumber Date Filed
SEC FileReferenceNumber
10.3 Capital Management MaintenanceAgreement, effective July 27, 2005,between PartnerRe Ltd., PartnerReHoldings Ireland Limited and PartnerReIreland Insurance Limited.
8-K 10.1 August 1,2005
001-1453605988483
10.4 Capital Management MaintenanceAgreement, effective January 1, 2008,between PartnerRe Ltd. and PartnerReinsurance Europe Limited.
10-K 10.5.2 February 29,2008
001-1453608653416
10.5 PartnerRe Ltd. Amended EmployeeIncentive Plan, effective February 6,1996.
10-K 10.9 February 28,2011
001-1453611644674
10.5.1 Form of PartnerRe Ltd. AmendedEmployee Incentive Plan ExecutiveStock Option Agreement and Notice ofGrant.
8-K 10.1 February 16,2005
001-1453605621655
10.5.2 Form of PartnerRe Ltd. AmendedEmployee Incentive Plan ExecutiveRestricted Stock Unit AwardAgreement and Notice of RestrictedStock Units.
8-K 10.2 February 16,2005
001-1453605621655
10.6 PartnerRe Ltd. amended and restatedEmployee Equity Plan.
10-Q 10.3 August 4,2011
001-14536111010074
10.6.1 Form PartnerRe Ltd. Amended andRestated Employee Equity PlanExecutive Restricted Share Unit AwardAgreement.
10-K 10.10.1 February 28,2011
001-1453611644674
10.6.2 Form PartnerRe Ltd. Amended andRestated Employee Equity PlanExecutive Share-Settled ShareAppreciation Right Agreement.
10-K 10.10.2 February 28,2011
001-1453611644674
10.7 PartnerRe Ltd. 2009 Employee SharePurchase Plan effective May 22, 2009.
10-Q 10.1 August 10,2009
001-1453609998853
10.8 PartnerRe Ltd. Swiss Share PurchasePlan.
10-Q 10.4 August 4,2011
001-14536111010074
10.9 PartnerRe Ltd. Non-Employee DirectorsShare Plan dated May 22, 2003.
10-K 10.13 February 28,2011
001-1453611644674
10.9.1 Form of PartnerRe Ltd. Non-EmployeeDirector Share Option Agreement.
10-Q 10.2 May 4, 2011 001-1453611810844
10.9.2 Form of PartnerRe Ltd. Non-EmployeeDirector Restricted Share Unit AwardAgreement.
10-Q 10.3 May 4, 2011 001-1453611810844
220

ExhibitNumber Exhibit Description
Incorporated by Reference
FiledHerewithForm
OriginalNumber Date Filed
SEC FileReferenceNumber
10.9.3 Form of PartnerRe Ltd. Non-EmployeeDirectors Stock Plan Restricted ShareUnit Award and Notice of RestrictedShare Units.
8-K 10.2 September 20,2004
001-14536041037442
10.10 Form of Annual Incentive DeferralExecutive Restricted Shares Unit AwardAgreement.
8-K 10.3 May 16, 2005 001-1453605835956
10.11 Form of Executive Restricted SharesUnit Award Agreement CompanyMatch on AI Deferral.
8-K 10.4 May 16, 2005 001-1453605835956
10.12 Form of Executive Stock OptionAgreement.
8-K 10.5 May 16, 2005 001-1453605835956
10.13 PartnerRe Ltd. Change in ControlPolicy.
10-K 10.17 February 28,2011
001-1453611644674
10.14 Amended Executive TotalCompensation Program.
10-K 10.14 February 24,2012
001-1453612636834
10.15 Board of Directors CompensationProgram for Non-Executive Directors.
10-Q 10.1 May 4, 2011 001-1453611810844
10.16 Employment Agreement betweenPartnerRe Ltd. and Costas Miranthisdated as of January 1, 2011.
8-K 10.1 February 23,2011
001-1453611632606
10.17 Employment Agreement betweenPartnerRe Holdings Europe Limited,Zurich Branch and Emmanuel Clarke,effective as of September 1, 2010.
10-K 10.17 February 24,2012
001-1453612636834
10.18 Employment Agreement betweenPartnerRe Ltd. and William Babcock,effective as of October 1, 2010.
10-Q 10.2 November 3,2011
001-14536111177762
10.19 Employment Agreement betweenPartnerRe Capital Markets Corporationand Marvin Pestcoe, effective as ofOctober 1, 2010.
10-Q 10.3 November 3,2011
001-14536111177762
10.20 Employment Agreement betweenPartner Reinsurance Company of theU.S and Theodore C. Walker, effectiveas of January 1, 2011.
10-Q 10.4 November 3,2011
001-14536111177762
10.21 Second Amendment to EmploymentAgreement between PartnerRe Ltd. andPatrick A. Thiele, effective as ofFebruary 26, 2002.
8-K 99.1 March 25,2002
001-1453602584632
10.21.1 Letter Agreement Between PartnerReLtd. and Patrick A. Thiele datedMay 15, 2007.
10-Q 10.1 August 9,2007
001-14536071037066
221

ExhibitNumber Exhibit Description
Incorporated by Reference
FiledHerewithForm
OriginalNumber Date Filed
SEC FileReferenceNumber
10.21.2 Amended and Restated RetentionAward Agreement between PartnerReLtd. and Patrick A. Thiele, datedNovember 19, 2009.
10-K 10.22.3 March 1,2010
001-1453610646399
10.23 Executive Employment Agreementbetween PartnerRe Capital MarketsCorp. and Albert A. Benchimol dated asof January 1, 2009.
8-K 10.1 February 11,2009
001-1453609589545
10.23.1 Letter Agreement between PartnerReLtd. and Albert A. Benchimol dated asof July 28, 2010.
8-K 10.1 August 3,2010
001-1453610988370
10.24 Form of Indemnification Agreementbetween PartnerRe Ltd. and itsdirectors.
10-Q 10.16 November 4,2009
001-14536091158470
10.25 Transaction Agreement dated as ofJuly 4, 2009 between PartnerRe Ltd.and PARIS RE Holdings Limited.
8-K 2.2 July 9, 2009 001-1453609937187
10.25.1 Amendment No. 1 to the TransactionAgreement dated as of September 28,2009 among PartnerRe Ltd., PARIS REHoldings Limited and PartnerReHoldings II GmbH.
8-K 2.1 September 29,2009
001-14536091093820
10.26 Securities Purchase Agreement dated asof July 4, 2009 among PartnerRe Ltd.,PARIS RE Holdings Limited and thesellers named therein.
8-K 2.1 July 9, 2009 001-1453609937187
10.26.1 Amendment No. 1 to the SecuritiesPurchase Agreement dated as ofJuly 17, 2009 among PartnerRe Ltd.,PARIS RE Holdings Limited and thesellers named therein.
8-K 2.1 July 23, 2009 001-1453609957790
10.26.2 Amendment No. 2 to the SecuritiesPurchase Agreement dated as ofSeptember 28, 2009 among PartnerReLtd., PartnerRe Holdings II SwitzerlandGmbH, PARIS RE Holdings Limitedand the sellers named therein.
8-K 2.2 September 29,2009
001-14536091093820
10.27 Form of Investor Agreement betweenPartnerRe Ltd. and shareholders partythereto.
8-K 2.3 July 9, 2009 001-1453609937187
10.28 Form of Registration Rights Agreementbetween PartnerRe Ltd. andshareholders party thereto.
8-K 2.4 July 9, 2009 001-1453609937187
222

ExhibitNumber Exhibit Description
Incorporated by Reference
FiledHerewithForm
OriginalNumber Date Filed
SEC FileReferenceNumber
10.29 Form of Securities Purchase Agreementdated as of July 17, 2009 and effectiveas of July 25, 2009 between PartnerReLtd. and each seller named therein.
8-K 2.1 July 27, 2009 001-1453609965322
10.30 Securities Purchase Agreement dated asof September 28, 2009 amongPartnerRe Ltd., PartnerRe Holdings IISwitzerland GmbH and Mr. Hans-PeterGerhardt.
8-K 2.3 September 29,2009
001-14536091093820
10.31 Form of Securities Purchase Agreementdated as of October 15, 2009 andeffective as of October 21, 2009 amongPartnerRe Ltd., PartnerRe Holdings IIGmbH and the seller named therein.
8-K 2.1 October 23,2009
001-14536091134537
10.32 Amended and Restated Run OffServices and Management Agreementdated as of December 21, 2006 betweenAXA Liabilities Managers, AXA REand PARIS RE.
10-K 10.27.1 March 1, 2010 001-1453610646399
10.33 Reserve Agreement dated as ofDecember 21, 2006 between AXA,AXA RE and PARIS RE.
10-K 10.27.2 March 1, 2010 001-1453610646399
10.34 Claims Management and ServicesAgreement dated as ofDecember 21, 2006 between AXA REand PARIS RE.
10-K 10.27.3 March 1, 2010 001-1453610646399
10.35 Canadian Quota Share RetrocessionAgreement dated December 21, 2006and effective January 1, 2006 betweenAXA RE and PARIS RE.
10-K 10.27.4 March 1, 2010 001-1453610646399
10.36 Quota Share Retrocession Agreementdated December 21, 2006 and effectiveJanuary 1, 2006 between AXA RE andPARIS RE.
10-K 10.27.5 March 1, 2010 001-1453610646399
10.36.1 Endorsement to Quota ShareRetrocession Agreement datedFebruary 1, 2011 and effectiveJanuary 1, 2006 between Colisée Re andPartner Reinsurance Europe Limited.
8-K 10.1 February 7,2011
001-1453611579242
14.1 Code of Business Conduct and Ethics. 10-K 14.1 February 24,2012
001-1453612636834
21.1 Subsidiaries of the Company. 10-K 21.1 February 24,2012
001-1453612636834
23.1 Consent of Deloitte & Touche Ltd. X
223

ExhibitNumber Exhibit Description
Incorporated by Reference
FiledHerewithForm
OriginalNumber Date Filed
SEC FileReferenceNumber
31.1 Certification of Constantinos Miranthis,Chief Executive Officer, as required byRule 13a-14(a) of the SecuritiesExchange Act of 1934. X
31.2 Certification of William Babcock, ChiefFinancial Officer, as required byRule 13a-14(a) of the SecuritiesExchange Act of 1934. X
32 Certifications of ConstantinosMiranthis, Chief Executive Officer, andWilliam Babcock, Chief FinancialOfficer, as required by Rule 13a-14(b)of the Securities Exchange Act of 1934. X
101.1 The following financial informationfrom PartnerRe Ltd.’s Annual Report onForm 10-K/A (Amendment No. 1) forthe year ended December 31, 2011formatted in XBRL: (i) ConsolidatedBalance Sheets at December 31, 2011and 2010; (ii) Consolidated Statementsof Operations and Comprehensive(Loss) Income for the years endedDecember 31, 2011, 2010 and 2009;(iii) Consolidated Statements ofShareholders’ Equity for the yearsended December 31, 2011, 2010 and2009; (iv) Consolidated Statements ofCash Flows for the years endedDecember 31, 2011, 2010 and 2009; (v)Notes to Consolidated FinancialStatements and (vi) FinancialStatements Schedules. (1)
(1) As provided in Rule 406T of Regulation S-T, this information is “furnished” herewith and not “filed” forpurposes of Sections 11 and 12 of the Securities Act of 1933 and Section 18 of the Securities Exchange Actof 1934. Such exhibit will not be deemed to be incorporated by reference into any filing under the SecuritiesAct of 1933 or the Securities Exchange Act of 1934 unless PartnerRe Ltd. specifically incorporates it byreference.
224

[THIS PAGE INTENTIONALLY LEFT BLANK]

[THIS PAGE INTENTIONALLY LEFT BLANK]

1 John Adimari Chief Operations Officer, North America
2 Abigail Clifford Chief Human Resources Officer, Group
3 Laurie Desmet Chief Operations Officer, Global
4 Ted Dziurman General Manager and Executive Director, PartnerRe Europe
5 Alain Flandrin Head of Property & Casualty, Global
6 Eric Gesick Chief Actuarial Officer, Group
7 Nick Giuntini Chief Risk and Financial Officer, Capital Markets
8 Charles Goldie Head of Specialty Lines, Global
9 Dean Graham Head of Life
10 Dan Hickey Head of Standard Lines, North America
11 Mandy Noschese Chief Information Officer, Group
12 David Phillips Head of Capital Assets, Capital Markets
13 Michel Plécy Deputy CEO, Global
14 Jim Ramsay Head of Fixed Income, Capital Markets
15 Dick Sanford Head of Specialty Lines, North America
16 Brian Secrett Head of Catastrophe, Global
17 Amanda Sodergren Chief Legal Officer, Group
18 Dom Tobey Head of Facultative, Global
19 Andrew Turnbull Group Strategy and Business Development Officer, Group
20 Stephan Winands Chief Financial Officer, Global
PARTNERRE ORGANIZATION
Senior Management Group
1
2
3
4
5
6
7
8
9
10
16
17
18
19
20
11
12
13
14
15
227

Group
21 Joe Barbosa Group Treasurer
22 Trevor Brookes Chief Audit Officer
23 Jérôme Carré Chief Risk Management Officer
24 Richard Glaser Head of Tax
25 Lindsay Hyland Group Human Resources Director
26 Philip Martin Group Compensation and Benefits Director
27 David Outtrim Chief Accounting Officer
28 Christine Patton Secretary and Corporate Counsel to the Board
29 Celia Powell Chief Communications Officer
30 Robin Sidders Investor Relations Director
31 Marc Wetherhill General Counsel, Partner Reinsurance Company
North America
32 Maria Amelio Head of Programs
33 Rob Brian Head of Regional/Multiline
34 Hervé Castella Head of Canada
35 Christina Cronin Head of Property
36 Carol Desbiens COO and Deputy Head, Canada
37 Dave Durbin Head of Research and Development
38 Jeffrey Englander Chief Reserving Actuary
39 Russell Fillers Head of Space
40 Vincent Forgione Human Resources Director
41 Tom Forsyth General Counsel
42 Ken Graham Head of Claims
43 Lynn Halper Head of Specialty Casualty
44 Richard Meyerholz Head of Surety
45 John Peppard Head of Managed Programs
46 Mike Zielin Head of Agriculture
21
22
23
24
25
26
27
28
29
30
31
32
33
34
35
36
37
38
39
40
41
42
43
44
45
46
Business Unit and Support Management
PARTNERRE ORGANIZATION
228

59 Jacques de Franclieu Head of Property & Casualty, U.K., France, Benelux and Southern Europe
60 Erick Derotte Head of Catastrophe Underwriting, Zurich
61 Philippe Domart Head of Retrocession and Risk Management
62 Pascale Gallego Head of Life Market, Southern Europe, Middle East and Latin America
63 Paul Hazel Head of Facultative Energy Onshore
64 Holger Hillebrand Head of Facultative Engineering
65 Christopher Ho Chairman of Client Relationships, Asia and Pacific, Head of Singapore Office
66 Ian Houston Chief Underwriting Officer and Deputy Head of Specialty Lines
67 Michel Hurtevent Chief Underwriting Officer, Facultative
68 Patrick Lacourte General Manager PartnerRe Insurance, Dublin
69 Jean-Marie Le Goff Head of Human Resources
70 Markus Lützelschwab Head of Life Market, Asia, Northern, Central and Eastern Europe
53 Francis Blumberg Head of Property & Casualty Northern, Central and Eastern Europe
54 Jürg Buff Head of Specialty Lines Engineering
55 Michel Büker Head of Global Clients and London Market
56 Juan Calvache Head of Miami Office
57 Patrick Chevrel Head of Specialty Property
58 Laura Davis Head of Catastrophe Underwriting, Bermuda
Global
47 Scott Altstadt Chief Underwriting Officer and Deputy Head of Property & Casualty
48 Felix Arbenz Head of Specialty Casualty
49 Simon Arnot General Counsel
50 Patrick Bachofen Head of Facultative Global Property Accounts
51 Markus Bassler Head of Specialty Lines Energy Onshore
52 Emil Bergundthal Head of Property & Casualty Asia, Pacific and India
Business Unit and Support Management (Continued)
47
48
49
50
51
52
53
54
55
56
57
58
59
60
61
62
63
64
65
66
67
68
69
70
229

71 Jeremy Lilburn Head of Agriculture
72 Jorge Linero Head of Facultative Property Americas
73 Philip Nye Head of Hong Kong Office
74 John O’Neill Head of Life Market, U.K. and Ireland
75 Kevin O’Regan Head of Life Market, Longevity
76 Salvatore Orlando Head of Property & Casualty, Middle East, Africa and Latin America
77 Adrian Poxon Head of Marine and Energy Offshore
78 Christophe Rénia Head of Credit & Surety
79 Erik Rüttener Chief Underwriting Officer and Deputy Head of Catastrophe
80 Eija Tuulensuu Head of Client and Corporate Communications
81 Philippe Vivares Head of Facultative Energy Offshore
82 Benjamin Weber Head of Aviation and Space
83 Karl Whitehead Head of Special Risks
84 Stephen Woodward Head of Facultative Property, Europe and Asia
85 Martin Zeller Head of Claims
Capital Markets
86 Michael Bennis Senior Portfolio Manager, Mortgage-backed Securities
87 Vanessa Frattaroli Human Resources Director
88 David Graham Head of Asset Allocation and Chief Economist
89 Joseph Hissong Head of Strategic Investments
90 Lee Iannarone General Counsel
91 Jay Madia Head of Equities
92 Dave Moran Head of Principal Finance
93 Brian Tobben Head of Insurance-linked Securities
94 David Yim Senior Portfolio Manager, Credit
71
72
73
74
75
76
77
78
79
80
81
82
83
84
85
86
87
88
89
90
91
92
93
94
PARTNERRE ORGANIZATION
Business Unit and Support Management (Continued)
230

Board Of Directors
chairman Jean-Paul Montupet Executive Vice President and Advisory Director Emerson Electric Co. USA
Vito h. Baumgartner Group President (Retired) Caterpillar Inc. United Kingdom
Judith c. hanratty, cVD, OBE Company Secretary and Counsel to the Board (Retired) BP plc United Kingdom
Jan h. holsboer Executive Director (Retired) ING Group The Netherlands
Roberto g. Mendoza Senior Managing Director Atlas Advisors, LLC USA
costas Miranthis President and Chief Executive Officer PartnerRe Ltd. Bermuda
John A. Rollwagen Chairman and CEO (Retired) Cray Research Inc. USA
Rémy sautter Chairman RTL Radio France
lucio stanca Chairman (Retired) IBM Europe, Middle East, Africa Italy
Kevin M. twomey President and Chief Operating Officer (Retired) The St. Joe Company USA
Dr. Jürgen Zech Chief Executive Officer (Retired) Gerling-Konzern Versicherungs Beteiligung – AG Germany
David K. Zwiener President and Chief Operating Officer (Retired) Hartford Financial Services Group Inc. USA
Secretary and Corporate Counsel To The Board
christine Patton PartnerRe Ltd.
Investor Relations Director
Robin sidders PartnerRe Ltd.
Shareholders’ Meeting
The 2011 Annual General Meeting will be held on May 16, 2012, in Pembroke, Bermuda.
Independent Registered Public Accounting Firm
Deloitte & Touche Ltd. Corner House Church & Parliament Streets Hamilton, Bermuda
Outside Counsel
U.s.
Davis Polk & Wardwell 450 Lexington Avenue New York, New York 10017 USA
Bermuda
Appleby Canon’s Court 22 Victoria Street Hamilton HM 12 Bermuda
Market Information
The following PartnerRe shares (with their related symbols) are traded on the New York Stock Exchange, NYSE Euronext and the Bermuda Stock Exchange:
Common Shares “PRE”
The following PartnerRe shares (with their related symbols) are traded on the New York Stock Exchange:
6.75% Series C Cumulative Redeemable Preferred Shares “PRE PR C” 6.5% Series D Cumulative Redeemable Preferred Shares “PRE PR D”
7.25% Series E Cumulative Redeemable Preferred Shares “PRE PR E”
As of February 17, 2012, the approximate number of common shareholders was 69,088.
Share Transfer and Dividend Payment Agent
Computershare Trust Company, N.A. P.O. Box 43078 Providence, RI 02940-3078
Additional Information
PartnerRe’s Annual Report on Form 10-K/A and PartnerRe’s 1934 Act filings, as filed with the Securities and Exchange Commission, are available at the corporate headquarters in Bermuda or on the Company website at www.partnerre.com
shAREhOlDER infORMAtiOn
For contact information visit: www.partnerre.com/contacts

www.partnerre.com