balance-of-payment-constrained growth: the case of china
TRANSCRIPT

�
DEPARTMENT OF ECONOMICS WORKING PAPER SERIES
Balance-of-Payment-Constrained Growth: The Case of China, 1979-2002
Yongbok Jeon
Working Paper No: 2006-06
University of Utah Department of Economics
1645 East Central Campus Dr., Rm. 308 Salt Lake City, UT 84112-9300
Tel: (801) 581-7481 Fax: (801) 585-5649
http://www.econ.utah.edu

�
Balance-of-Payment-Constrained Growth: The Case of China, 1979-2002
Yongbok Jeon
Department of Economics, University of Utah
ABSTRACT
The aim of this study is to empirically test the validity of Thirlwall’s Law in China during the reform period of 1979-2002. For the income elasticity of import demand, an aggregate import demand function for the Chinese economy is estimated using ARDL-UECM model and the bounds test. This study finds (1) that for 1979-2002, the Chinese economy has grown on average as fast as Thirlwall’s Law predicts: the average actual growth rate and predicted growth rate were, respectively, 9.25 and 8.55, which are statistically identical; (2) that the growth of GDP and of exports are cointegrated. Both (1) and (2) provide strong support for Thirlwall’s Law in China during the reform period after 1978. The supportive result of Thirlwall’s Law implies the relevance of demand-side approach to economic growth in China. JEL Classification: F14, F43, O53 Key words: Chinese economy, balance-of-payment constrained growth, aggregate import function, trade multiplier, bounds test for cointegration Acknowledgements: I would like to thank, without implications, Professor Matias Vernengo for
his comments to a preliminary version.

�
1. INTRODUCTION
In explaining differences in rates of economic growth among countries or regions and factors that
constrain a country’s economic growth, broadly speaking, two viewpoints have contested each other.
On the one hand, the conventional view has taken a supply-oriented approach in which differences
in economic performance among countries or regions are explained exclusively by exogenously
determined technological progress and factors of production available in the economies considered.
Therefore, economic growth is constrained by only factors that prescribe supply conditions. On the
other hand, the demand-oriented approach has questioned the very presumption of the exogeneity of
the factors of production and technical progress. In this viewpoint, the supply of factors of
production and technological progress are driven by demand,1 rather than determined exogenously
outside the economy.
It is well known that in the Kaldorian line, export demand from abroad is considered the ultimate
demand determinant and hence the determinant of economic growth. As shown in Figure 1,
following Adam Smith’s notion of vent for surplus, increase of exports as a demand component is
likely to result in a better supply condition, e.g., the improvement of productivity derived from
more outputs used to meet the increased demand for exports and more efficient reallocation of
factors of production which in turn may lead to further increase in demand for exports because they
can in the next round be produced and traded with better terms: that is, initial stimuli from demand
from abroad may result in a prosperous supply conditions and further increase in demand. Thus, the
1 For a comprehensive discussion on the issues related to demand-oriented approach, see McCombie &
Thirlwall (1994)

�
qualifying term of “demand-oriented” may be in a sense misleading: indeed, for this approach,
supply side does matter, but for a different reason than that of “supply-oriented” approach .
[Figure 1] THE STRUCTURE OF KALDORIAN GROWTH THEORY
�������� ���������������
� ������������������� ��� � ��!"���� #$� %&���� ���
�����'��" ��� �'�
��� '( ����#��')*� #�����')��������
PRICE�������+����,� � ���*������� �����������
�����,�����'�,���-&-&� �
��� �����*.,����� ������ �( �����')'��������'���!,���/� �
���*.��'��� ������ �( �����')'�,�����
Thirlwall (1979), in accordance with a Kaldorian line, formalized the notion of balance-of-
payments (BOP) constrained growth. Assuming away stable long-run terms of trade and net capital
flows, in order for an economy’s growth to be sustainable in an international context, the growing
demand for imports associated with economic growth must be financed by the revenue of foreign
exchange from exports: economies grow only at a pace allowed by the constraint imposed by the
requirement of balanced payments.
After commencing the reform and open door policy package in 1978 moving on from a planned and
closed to a market and open economy, China has grown on average at annual rate of 9.25% in GDP
and 15.22% in exports during the reform period of 1979-2002 (see [Table 3])2. In order to identify
2 It is much true that exports could grow that fast because of the rearrangement of external policies so as to
attract foreign direct investments which have played key role in achieving such an export performance in

0
the connection between the economic growth and the growth of exports, this study aims at
empirically testing the validity of Thirlwall’s Law3 in China. Since the BOP constrained growth
model was developed in Thirlwall (1979), a sizable body of empirical work has been documented,
and the claim that Thirlwall’s Law holds good in various economies and time periods is supported
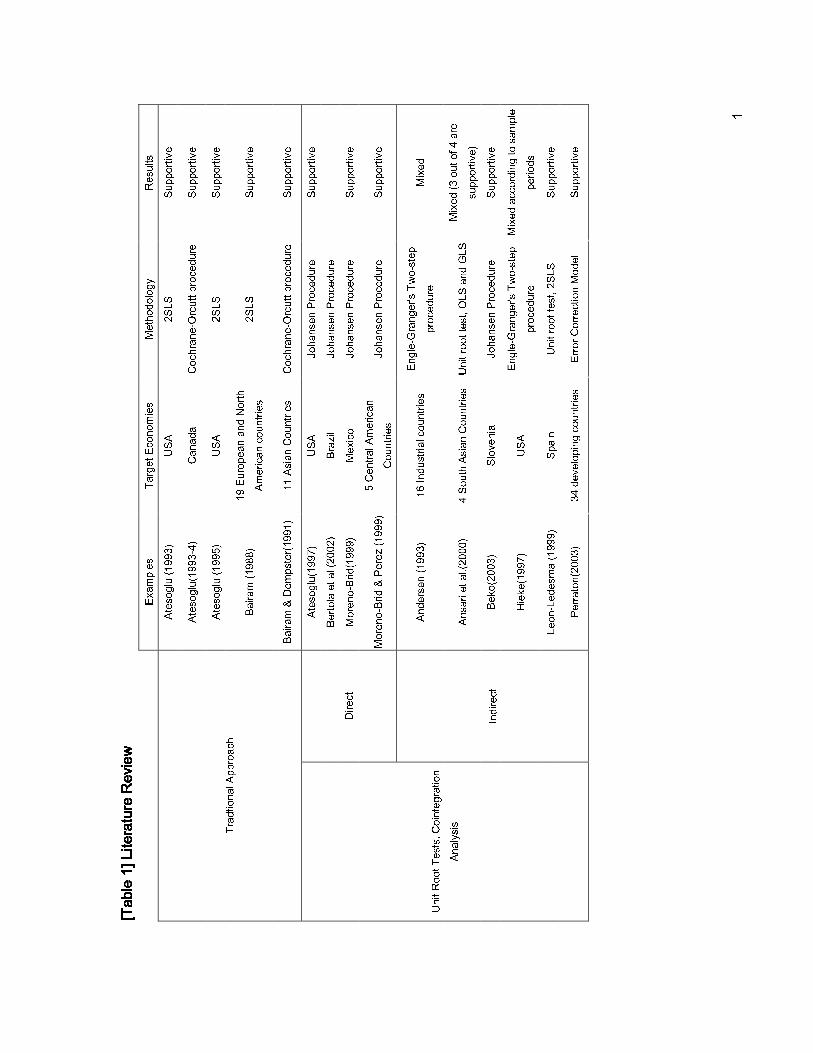
by the majority of these works which are summarized in [Table1]. However, putting aside the lack
of study on the Chinese economy in the demand-oriented tradition, it is hard to find applications of
this model to a transitional economy like China.4
[Table 1]
This study finds that, (1) for 1979-2002, the Chinese economy has grown on average as fast as
Thirlwall’s Law predicts: the average actual growth rate and predicted growth rate were,
respectively, 9.25 and 8.55, which are statistically identical; (2) it is shown that the growth of GDP
and of exports are cointegrated. Both (1) and (2) provide strong support for Thirlwall’s Law in
China during the reform period after late 1970s.
With the empirical work procedures, the present paper is expected to contribute to the literature in
China. An address on the issue of the institutional factors that might well contribute to the economic
achievements in China is not an issue here, but requires a separate research.
1Reflecting the development process of the model and the empirical studies, Thirlwall (1997) himself is
willing to call it “stylized fact” or “empirical generalization”.
2For the Slovenian economy, Beko (2003) is one exception. Considering that Thirlwall’s Law is concerned
with long-run phenomena, the 7-year sample period of this study may be too short. For a comprehensive
survey of empirical tests for Thirlwall’s Law, see McCombie (1997)

3
four ways. First, this study is the first to apply Thirlwall’s Law to China, a transitional economy.
This study provides an alternative explanation to the growth accounting approach to the Chinese
economic experience. Second, considering that there are only two estimations of the aggregate
import demand function for China (Senhadji, 1998; Tang, 2003), this study documents another
empirical result in the literature on international economic relations in China. Third, in addition to
Atesoglu(1997), Moreno-Brid(1999) and Moreno-Brid & Perez (1999), this study adds one more
example of the new approach to the subject, “direct test” of Thirlwall’s Law using cointegration
analysis. Finally, to identify the long run relationships of variables under consideration, this study
utilizes a ‘bounds test approach’, which is a recent development in time series econometric
techniques. It is argued that the bounds test approach has superior properties to the Johansen
procedure in terms of small sample bias and the problem of mixing the order of integration of
variables.
In order to demonstrate these findings, this paper is organized as follows. In section 2 I lay out the
theoretical model on which the present study is based. Section 3 presents empirical methodology
and the results. In section 4, I comment further on the relevance of the demand-side approach
implied by the empirical results. Finally, the last section concludes and summarizes.
2. THEORETICAL MODEL
Following Thirlwall & Hussain (1982) in which capital flows are explicitly incorporated, a balance
of payments equilibrium in accounting form is represented as:

4
fPX EF EP M+ = (1)
where P is the domestic price level measured in home currency, X is the quantity of demand for
exports of the home country, E is the nominal exchange rate defined as the home price of one unit
of foreign currency, F is the net capital inflows measured in foreign currency, fP is the foreign
price level measured in foreign currency, and M is the quantity of demand for imports of the home
country. Note that F > 0 indicates capital inflows and F < 0 indicates capital outflows. Also, define
the proportion of exports out of total receipts from abroad as
PXPX EF
θ =+
1EF
orPX EF
θ� �− =� �+� � (2)
Export and import demand functions are expressed in terms of standard demand theory:
f
PX Z
EP
ηε� �= � �
� � (3)
where Z is the real income of trade partners, η and ε are the price and income elasticity,
respectively, of foreign demand for export. Hence, as in standard demand theory with respect to
price and income, we expect 0η < , 0ε > . Similarly, the import demand function is specified as:
fEPM Y
P
ψπ� �
= � �� �
(4)

5
where Y is domestic real income, ψ and π are the price and income elasticity, respectively, of
domestic demand for imports, with expected signs being 0ψ < and 0π > .
Next, log-differentiation of equations (1), (3) and (4) converts them into growth forms for involved
variables.
( ) (1 )( ) fp x e f e p mθ θ+ + − + = + + (5)
( )fx p e p zη ε= − − + (6)
( )fm p e p yψ π= + − + (7)
where lower case letters stand for growth rates of the respective variables defined above. Note in
driving (5) we used equation (2) together with (1).
Plugging (6) and (7) into (5) and then solving for y, we obtain the growth rate of domestic income:
( 1)( ) (1 )( )f
b
z p e p e f py
θε θη ψ θπ
+ + + − − + − + −= (8)
The subscript b is added to y, implying that the domestic income growth rate is consistent with the
restriction imposed by equilibrium in balance of payments. The first term of numeration in the right
hand side captures the effect on the growth of home income of (exogenous) growth of income

6
abroad through income elasticity of export demand for domestic goods and services; given the
parameters, the second term gives the effect arising from change in terms of trade; finally, the third
term indicates the effect of the rate of growth of capital inflows denominated by domestic price.
According to various assumptions on equation (8), several versions of BOP constrained growth
models appear in the literature. First of all, assuming that the terms of trade (or relative home price
with respect to foreign price) is stable in the long run, we obtain:
(1 )( )bb
x e f py
θ θπ
+ − + −= (9)
Note that the first term of the right-hand-side turns out x instead of zε , since x zε= from
equation (6) under the assumption made here. Equation (9) predicts BOP equilibrium rate of growth
of output as the ratio of the weighted sum of export revenue and capital inflows to the income
elasticity of demand for imports in which the weight equals the initial export share out of total
foreign receipts.
Next, assuming in equation (8) that there is no capital inflow or that capital inflow occupies an
ignorable share in total receipts of foreign exchange, so that 1θ = , we obtain the simplified
version:
( 1)( )f
b
z p e py
ε η ψπ
+ + + − −= (10)

�'7
The equation (10) shows that, for the exogenous growth of foreign income, growth rate of domestic
income is determined by: (1) import and export price elasticities of demand, (2) long-run terms of
trade and (3) export and import income elasticities of demand. Economists in this field (Thirlwall,
1986; McCombie, 1989) believe that the ration of income elasticities ( /ε π ) represents non-price
competitiveness of the economy.
Adding to equation (10) the assumption of stable long-run terms of trade results in:
b
zy
επ
= (11)
and, from equation (6) again,
b
xy
π= (12)
Equation (12), known as Thirlwall’s Law, that is derived from both assumptions of no capital flow
and stable long-run terms of trade is the most parsimonious expression of a balance-of-payments
constrained growth equation. It states that the long-run rate of output growth conformable with
balanced payments is predicted by the ratio of the growth rate of export demand to the income
elasticity of demand for imports.
In terms of the assumption made on demand for exports, Perraton (2003) further distinguishes a
“weak” and “strong” form of the BOP constrained growth hypothesis, depending on whether or not
the effect of terms of trade is included. Equation (10) and (11) falls in the strong form in which
export is treated as a stochastic variable, while equations (9) and (12), which treat export as a

�8�
deterministic variable, are classified into the strong form of the hypothesis5.
Either the weak or strong form of the hypothesis shows that balance of payments is a crucial
binding constraint imposed on the growth rate of domestic income. Given the foreign rate of
economic growth (z) in equation (11), for example, the ratio of the income elasticity of demand for
exports abroad to income elasticity of demand for imports imposes the upper limit of the growth
rate for domestic growth, as long as there is no obstacle such as a bottleneck on the domestic supply
side. This means that income elasticity of demand for import and export play a dominant role in
determining the upper limit of domestic income growth. It is easy to see that, in order for the BOP
constraint not to be binding, a high income elasticity of demand for imports (π ), for instance, must
be met by high income elasticity of demand for exports, unless foreign economic growth and
consequential growth of foreign demand for domestic goods and services are fast enough to offset
the effect of high income elasticity of demand for imports on balance of payments. Otherwise, a
higher propensity to import implied by the high-income elasticity of demand for imports must be
met by a reduction of domestic income to fulfill the requirement of balanced payments.
5 Contrary to the connotation that might be brought by the terminology of “strong” form of Thirlwall’s Law,
Bairam (1997) argues that equation (12), a “weak form of Thirlwall’s Law, could be superior to equation (11)
for an empirical study. According to his empirical observations, the ratio of income elasticity of export to that
of import is reversely related to the level of development. More important are the findings that the income
elasticity of export demand is likely to vary over time as economies progress, while the income elasticity of
import demand is relatively constant in the long run. The time-varying income elasticity of export demand
may indicate that the “weak form” of Thirlwall’s Law is more relevant, since Thirlwall’s Law is about the
long run relationship between the growth of exports and the income level. Therefore, the present study shall
focus on the “weak” form instead of “strong” one.

���
The BOP constrained growth models, however, do not go without criticisms and objections. A brief
discussion is useful here.6 The main body of theoretical criticism focuses on issue of (1) the
assumption of “long-run stable terms of trade” and (2) the direction of causality in equations (11)
and (12). In our view, the others are minor in a sense that they are the side issues derived from these
two main points.
Thirlwall and Dixon (1979) attributes the empirical observation of long-run constant relative price
to three possible reasons: (1) the law of one price, (2) flexible exchange rate, and (3) oligopolistic
market structure. McGregor and Swales argue that the reason (2) should be rejected because of its
lack of a mechanism relating exchange rate changes to prices. If this is the case, they argue, the
BOP constrained model runs into a dilemma. On the one hand, if reason (1) is taken, the model
implies supply constraints in which output level is determined by increasing cost as production
expands, instead of demand constraints. This means that, if the binding constraints lie in the supply
side, the causality of BOP constrained growth should run from domestic income to exports. On the
other hand, if reason (3) is taken, the functions of demand for import and export are misspecified,
because they do not include the component reflecting non-price competitions reflecting
oligopolistic market structure and consequential change in share of world market.
Thirlwall (1986) replies that the terminology of “the law of one price” was an unfortunate usage and
what he meant with the term is merely to indicate the observed fact of constant relative price in the
9What follow are drawn on the battles in the journal, Applied Economics, between critics McGregor and
Swales (1985, 1986, and 1991) and advocates Thirlwall (1986) and McCombie (1989, 1992)
�'�
long run. Furthermore, he advocates the demand-constrained viewpoint by arguing that “any form
of imperfect competition implies excess capacity, and excess capacity implies that individual
producers face a limited demand for their product.” Therefore, the reverse causality derived from
the neoclassical interpretation of the law of one price should be rejected.
McCombie agrees with the argument that, if the law of one price holds in the neoclassical sense, the
BOP constrained growth model is not relevant. But, he also argues that reality and a bunch of
empirical studies readily available show that pricing behaviors are oligopolistic. With regard to the
specification issue of an export demand function under the assumption of an oligopolistic market,
he shows that the concept of income elasticity of demand for exports already incorporates the
changes in market shares which result from non-price competitions (see McCombie, 1989, for an
algebraic proof). Therefore, the specification of the demand function used for deriving Thirlwall’s
Law is correct, effectively capturing non-price competition. This demonstration strengthens, in
practice, the notion that the ratio of income elasticity of demand for export to that of import reflects
an economy’s strength in non-price competition.
3. EMPIRICAL ANALYSIS: CHINA, 1979-2002
This empirical study covers the reform period after 1978 when China announced and launched a
series of “reform and open door policies.” We use annual data coming from World Tables published
by World Bank (2004).7
7 It is gratefully acknowledged that Tuck Cheung Tang, Monash University, Malaysia, collected from the

� �
Subsection 3.1 provides the general model and test procedure for a bounds test as well as some
justifications and motivations. This model and procedure will be used through the empirical studies
in the next two subsections. Subsection 3.2 is devoted to an indirect test for Thirlwall’s Law in
China. Here, first, we estimate an aggregate import demand function. Second, the estimate for
income elasticity of import demand is used to calculate the growth rate of GDP that Thirlwall’s Law
predicts. In the final stage of the indirect test, the actual rate of GDP growth is compared with the
predicted rate of growth. In subsection 3.3, Thirlwall’s Law is tested directly by examining whether
the growth rate of GDP and that of export are cointegrated.
3.1 ECONOMETRIC METHODOLOGY
It has come to be common practice in this field to apply nonstationary time series econometric
techniques of multivariate time series cointegration analysis in a VAR incorporating error correction
term, so called “Johansen Procedure” (Johansen, 1988; Johansen and Juselius, 1990).8 In spite of its
innovative properties and its popularity, the Johansen procedure has been under scrutiny in terms of
sample size. For example, Cheung and Lai (1993) demonstrates that the likelihood Ratio (LR) test,
that Johansen cointegration analysis relies on, is likely to bias for finite small samples. Using more
frequent data, e.g., quarterly or monthly data, for the same time span does not necessarily make the
cointegration analysis more robust (Hakkio and Rush, 1991). Furthermore, this strategy might make
the problem worse for the reason of seasonality, embedded in quarterly or/and monthly time series
World Table the data set for China and sent it to the author through personal correspondence.
8 Unlike the other examples surveyed in [Table1], Hieke (1997) utilize Engle-Granger two-step procedure,
which might be not free from common criticism applied to Engle-Granger procedure.

� 0
(Charemza and Deadman, 1997, pp. 130-1).
Recently, Pesaran et al.(2001) suggested the “bounds test approach” basing on unrestricted error
correction mechanism (UECM) to address small sample bias in cointegration analysis. A number of
recent applied works in various fields and purposes have found it successful (inter alia, Mah, 2000;
Pattichis, 1999; Tang, 2003; Tang & Nair, 2002). This is because, in addition to its capability of
addressing small sample bias, bounds test allows mixtures of I(1) and I(0) regressors as long as the
dependent variable is I(1).
Building on Pesaran et al.(2001)’s modeling procedures, we establish an ARDL-UECM model for
econometric practice in the following.
0 1 1 , 1 12 1 2 0
qk l k
t t j j t i t i ji t i tj i j i
y y x b y b x uβ β β− − − −= = = =
∆ = + + + ∆ + ∆ +� � � � (13)
where y is a scalar variable and ix is a vector of the other variables involved. Note that there is
no reason that lag-lengths of ,l q are equivalent to each other; neither is it true between q’s.
Equation (13) is estimated by OLS. To test the existence of a long-run level relationship between
the involved variables, the test statistics are calculated under the null hypothesis that all parameters
for lagged variables are statistically equal to zero (no cointegration) against the alternative
hypothesis that they are not. Formally,

��3
0 : 0, 1, ,
: 0, 1, ,j
a j
H j k
H j k
ββ
= = ⋅⋅⋅
≠ = ⋅⋅⋅ (14)
The bounds test is a Wald Test (or F-test) in which the joint significance of coefficients for lagged
variables is tested with F-statistics calculated under the null. The distribution of the test statistics
under the null is non-standard, in which critical values depend on the order of integration of
variables involved. Utilizing Monte Carlo simulation experiments, Pesaran et al. (2001) tabulates
asymptotic critical values, depending on whether or not drift and/or time trend terms are included as
well as the number of independent variables. Given the number of independent variables, if all
variables are (0)I , the critical value comes to a minimum and, if they are all (1)I , the
corresponding critical value become a maximum. In the cases of a mixture of integrating orders
among variables, the critical value falls between a minimum and a maximum. Therefore, if the
calculated F-statistics under the null is located outside the maximum, the null hypothesis of no
cointegration is rejected, while if it is located inside the minimum, the null is not rejected. Finally, if
the test statistics falls between them, one can not draw a conclusive decision. In this case, further
investigation based on more information about orders of integration is required to reach a
conclusion.
Once the null is rejected, that is, once a cointegration relation between variables is found, the
cointegrating vector is calculated by dividing through ( 2, , )j j kβ = ⋅⋅⋅ by negative 1β ,
normalizing with respect to m .
3.2 INDIRECT TEST OF THIRWALL’S LAW

� 4
The first step to test the validity of Thirlwall’s law is to estimate the income elasticity of import
demand of foreign goods and services in China. We will estimate the traditional aggregate import
demand function in the form of equation (4). In the econometric practice, we will make use of
following log-log form of:
( )fp
m yp
π ψ= + (15)
where , , ,fm y p p are natural logarithms of: import, GDP, foreign price level in domestic
currency, and domestic price level, respectively. To figure out the long-run relationship between
imports, GDP and relative price basing on the bounds test approach, we build an ARDL-UECM
model in the form of equation (13) as following.
0 1 1 2 1 3 1
1 2 31 0 0
( / )
( / )
ft t t t
ql rf
i t i i t i i t i ti i i
m m y p p
b m b y b p p u
β β β β− − −
− − −= = =
∆ = + + +
+ ∆ + ∆ + ∆ +� � � (16)
An examination shows that m is I(1) implying the validity of the model for our context. And, as the
results of a pre-test (not reported here) of each variable indicate, a time trend term is omitted.
Because there is no reason that all the structural lag-lengths in equation (16) are identical, we
choose 3, 4, 3l q r= = = , as both AIC and SC indicate. [Appendix 1] reports estimating the
equation with a value for R-squared of 0.99 and an adjusted R-squared of 0.98. The results of
various diagnostic tests appear in [Appendix 2]. This table shows that there is no evidence of serial

��5
correlation (Breusch-Godfrey LM Test), nonnormality (Jarque-Bera Test), ARCH effect (ARCH(1)
Test), and misspecification (RESET Test). The CUSUM and CUSUM of squares tests in [Appendix
3] do not cast any doubt about stability of parameters over the sample period.
Before interpreting the estimated import demand function, we have to make a clear decision as to
whether there is a long-run relationship between variables involved in the demand function. If no
cointegration relation is found, the magnitudes of coefficients have nothing to do with a long-run
pattern of demand for imports. [Table 2] summarizes the result of the bounds test described in the
previous section. Since the F-statistic of 43.96 is definitely above the critical value of the upper
bound of 6.36 at even 1% significance level, we reject the null hypothesis of no cointegration.
[Table 2]
Based on the result of the bounds test, we can extract and write a long-run relation of demand for
imports normalized with respect to imports:
( )
1.78 0.59
(4.83) 6.18
ft
t tt
pm y
p� �
= − � �� �
− (17)
where the figures right below coefficients are the corresponding t-statistics. All estimated
coefficients of the long-run aggregate import function shows the theoretically expected sign, and
both are significantly different from zero at a 1% significance level. The result shows that in the

�'6
long run, demand for imports is elastic (1.78)9 with respect to income, while it is inelastic (-0.59)
with respect to relative price.10
In the next step, using the estimated income elasticity of 1.78 and the growth rates of exports during
the sample period, we can calculate the BOP constrained rate of growth that follows equation (12).
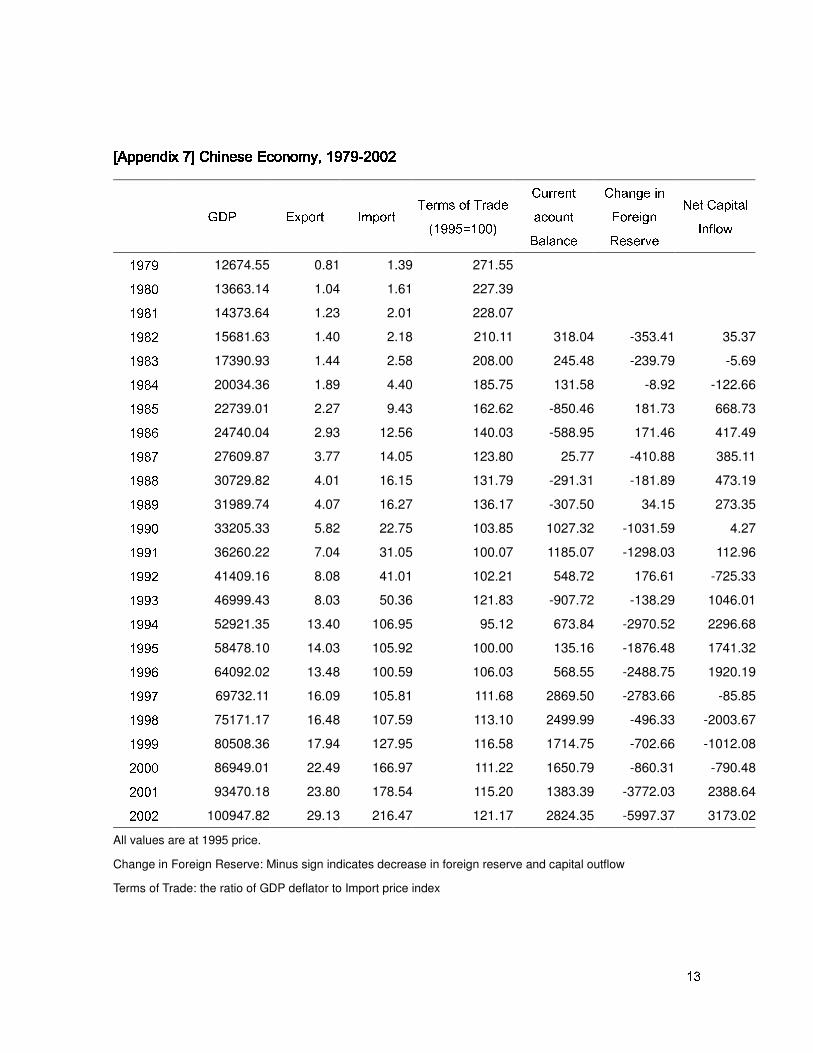
[Appendix 7] shows year-by-year comparison between the actual and the BOP constrained rate of
growth. However, since the theory is established for a long run trend, it would not make much sense
9 It is worth noting that the notion of the binding constraint imposed on economic growth by the requirement
in the foreign sector relies on the critical role of income elasticity of demand for imports and exports as the
determinants of the volumes of imports and exports: If income elasticity of demand for import is big enough
relative to that of exports, the requirement of balance-of-payment should be met by a reduction of income at
home. In contrast, according to the stories of the supply-oriented approach, economic growth is independent
of the balance-of-payments constraint and supply-determined because price should adjust in such a way that
current accounts are always balanced. This means that price elasticity of demand for imports and exports are
well greater than unity. As in our case here, however, almost all empirical studies on import and export
demand functions have repeatedly rejected the key assumption of elastic price elasticity.
:<;This is in sharp contrast to the results of preceding studies. To the present author’s knowledge, only a few
studies (Senhadji, 1998; Tang, 2003) are submitted in the literature on an import demand function for China.
The fact that price is inelastic of import demand in China is consistent with all the preceding works
(Tang(2003) provides the results with various specifications). However, all studies report an inelastic income
elasticity. Although the relevant specification and estimation technique is not a central issue in this paper, it
should be worth mentioning the fact that all studies but Tang(2003)’s first specification removes export from
the measurement of domestic income makes their income elasticity not relevant to our purpose. Furthermore,
to evaluate the results correctly, it must be considered that in China exports have caused imports (Liu et al.,
2001; Liu, et al., 2002).

�=7
to compare the actual and the predicted values year by year. In [table 3], I instead calculate the
mean decennial rates of growth of the variables involved for overlapping periods.
[Table 3] and [Figure 2]
Looking at the growth rates closely, the trends of the actual and the predicted rates of growth (see
also [figure 2]) detects three main patterns. First, the actual growth rate in the long run has been
stable in China, while the theoretically predicted rates of growth fluctuates relatively widely
reflecting wide variation of export performance in China. Second, after the periods embracing mid-
1980s, China has grown faster than the BOP constrained rate of growth, which is an unusual case in
the literature.
The third pattern relates to association between terms of trade, capital inflow and the actual growth
rate. A faster growth rate than the predicted rate of growth may be explained in terms of a change in
terms of trade or/and net capital inflow. Equation (8) predicts that the rate of growth of income can
be higher without external stress when (1) terms of trade improves or (2) capital inflow increases
and (3) a favorite factor out of the two overweighs the deteriorating factor. Regarding the terms of
trade, the figures in [Appendix 7] show that the actual growth rate has moved in the opposite
direction to terms of trade. The terms of trade were getting worse until 1994 while the actual growth
rates were increasing. After 1994 when terms of trade started to get better, the actual growth rate
also became higher. Therefore, the terms of trade seems to have little relevance in explaining the
faster actual growth than the predicted rate. Moving on to the capital inflows, they fluctuate so
widely that it seems there is no association with the actual growth rate. However, it is interesting to
see that the actual growth rate starts decreasing during the period, 1985-1994, when capital inflow

�>�
drops sharply, while it shows a bit of recovery when capital inflow increases from 1991 on. To
conclude, the higher actual growth rate compared to the theoretically predicted growth rate may be
attributable to capital inflow, instead of the factor of terms of trade. Indeed, considering a worsening
of the terms of trade, the effect of capital inflows may have overweighed the effect of change in
relative price.
Finally, but most importantly, even though the actual growth rate seems to have in a systematic way
been higher than the predicted ones, the two average rates of growth over the entire sample period
of 1979-2002 do not statistically different from each other. From 1979 through 2002, the Chinese
economy has grown at the annual average rate of 9.25%, while the BOP constrained growth model,
based on the estimated income elasticity predicts annual average rate of 8.55%. We conduct the
equality test between these two values in the framework of analysis of variance (ANOVA).
Formally, we test the following hypothesis:
0
1
:
:actual Thirlwall
actual Thirlwall
H
H
µ µµ µ
=≠
(18)
where ,actual Thirlwallµ µ are the mean actual rate of growth and the mean rate of gowth that are
predicted by Thirlwall’s Law, respectively, over the sample period of 1979-2002.
[Table 4]
The result is reported in [Table 4]. The ANOVA table shows that the overall means of the actual rate
of growth and the predicted rate of growth are statistically equal at 5% significance level. To

�8�
conclude, the equality of two averages of the rates of growth can be seen as an evidence for
Thirlwall’s Law in China.
3.3 DIRECT TEST OF THIRWALL’S LAW
In addition to the equality between the actual rate of growth and the theoretical rate of growth, the
relevance of Thirlwall’s Law requires the actual growth rate of income to be associated with exports
in a systematic way. In time-series econometric parlance, they must be cointegrated. The existence
of cointegration between the growth rate of income and of exports should be a strong support of
Thirlwall’s Law formulated in equation (12).
Therefore, instead of estimating income elasticity of import demand first, I estimate a form of
equation (12) directly and test the existence of a long-run relationship between the growth rate of
GDP (y) and that of export (x). To carry out the test for whether the rate of GDP growth is
cointegrated with the rate that the model indicates, we rely again on a bounds test approach based
on ARDL-UECM type model. Basically, test procedures are the same as those applied to the
estimation of the import demand function in the previous section. We build a model containing the
two variables of growth rate11: y and x, which is similar to the econometric model of equation (16).
:$:Atesoglu(1997) and his follower, Moreno-Brid(1999) use the logarithm of GDP and exports instead of
growth rate. Although, in terms of the econometric interpretation, the estimated coefficients from either data
are regarded as “elasticity”, in econometric practice they are not the same. For example, growth rate data are
the log-difference of level data, implying the possibility of different stochastic process.

�=�
0 1 1 2 1 1 1 2 11 0
ql
t t t i t i t ti i
y y x b y b x uβ β β− − − −= =
∆ = + + + ∆ + ∆ +� � (19)
As laid out in the above section, the model is estimated by OLS and the test for a long-run
relationship or cointegration is carried out by a joint test as follows:
0 1 2
1 1 2
: 0
: 0, 0
H
H
β ββ β
= =≠ ≠
(20)
Rejection of the null hypothesis implies that variables are cointegrated and there exist a long-run
relationship. The critical value for the test is provided by Pesaran et al.(2001).
The Bounds test approach requires only the dependent variable to be I(1). A pre-test approves that
the growth rate of income has a unit root. I choose lag lengths of 1, 2l q= = according to AIC
and SC information. The estimated equation is reported in [Appendix 4]. The results of various
diagnostic teats in [Appendix 5] and [Appendix 6] verify that there is no problem with the model.
The results of the bounds test for cointegration are summarized in [Table 5] indicating that there is a
strong long-run association between the rate of growth of income and of exports at the 1%
significance level.
[Table 5]
The cointegration equation is extracted from the estimated model as

� �
( )0.288
2.26
y x= (21)
The figure in parenthesis is the t-statistic associated with the coefficient which indicates that the
coefficient is significant at the 5% significance level. The income elasticity implicit in the
coefficient of 0.288 is 3.47 (1/0.288), which is much bigger than that in the import demand function
in the above section. This may be explained by referring back to equation (8). According to
equation (8), the estimate of 0.288 should embrace all the other factors, such as effects of change in
terms of trade and of capital inflow, amplifying the income elasticity.
In sum, although the income elasticity implicit in the direct test format for Thirlwall’s Law, given
the prime interest in the long-run association between income and exports, the main point is the fact
that they are cointegrated in the long run. Of course, this can be considered strong support of
Thirlwall’s Law in China.
4. THE DIRECTION OF CAUSALITY AND DEMAND-LED GROWTH
The results in the previous section imply further the relevance of a demand-oriented explanation of
economic growth in China. To interpret the fact that Thirlwall’s Law holds good in China, relates
critically to the direction of causality in equation (11) and (12). As noted above, for the proponents
of the demand-oriented approach, the causality runs from the right to the left hand side of the
equations, but not the other way round. Indeed, the direction of causality is the crucial thrust that
distinguishes the demand-constrained model from the supply-constrained model.
� 0
Krugman (1989) rediscovers empirically the systematic relationship between the ratio of income
elasticity of export and import demand ( /ε π ) and the growth rate of income. He calls it “45-
degree rule,” which is very much consistent with Thirlwall’s prediction based on demand-oriented
approaches. However, Krugman wants to challenge the interpretation in favor of demand side by
saying that “I am simply going to dismiss a prior the argument that income elasticities [ /ε π ]
determine economic growth, rather than the other way round” because “it is hard [for him] to see
what channel links balance of payments due to unfavorable income elasticities to total productivity
growth” (p.1037). As a matter of fact, he makes no reference to the writers in the camp of the
demand-oriented approach, who have provided ample theoretical and empirical ‘channels’.
In principle, much discussion on the causality running from output growth to productivity has been
given under the title of Verdoorn’s Law (Verdoorn, 1949[2002]) which Kaldor (1966) revived as the
key operational rule for a circular and cumulative causation (see also Kaldor, 1970, 1981).12 In an
open economy context, a prosperous position in balance of payments allows fast economic growth,
which in turn will result in faster productivity growth by Verdoorn’s Law. Now, higher productivity
will manifest itself in the form of more advantageous price and/or non-price competitiveness of the
economy, accelerating demand for export further and hence faster economic growth. The virtuous
circle in which output growth initiated by demand for export with favorable income elasticity
enhances productivity growth would work through a Hick’s super-multiplier (Thirlwall, 1991-2).
Replying to Krugman, McCombie & Thirlwall (1994) reminds us that:
It is tautologically true that if faster growing countries manage to sell more exports, they
:<?McCombie et al. (2002: 8-27) makes a long and thorough list of empirical woks on Verdoorn’s Law.

�83
will be observed to have higher income elasticity of demand for exports, but the model [of
Krugman’s] does not explain how faster growth arises in the first place (except by the
assumption of a faster growth of the labor force), or why a faster growing country will
necessarily export more independent of the characteristics of the goods it produces.
Greater supply availability and/or variety is not sufficient if demand is relatively lacking
(p.389, emphasis added)
It must be clear that the Kaldorian approach does not ignore the supply conditions. Indeed, recalling
[Figure 1] above, the supply conditions do matter, because it could determine price and non-price
competitiveness of a economy, which will in turn make the economy export more. What they
attempt to do, however, is to make the supposed exogenous factors in the supply side be
endogenous to demand. If the export performance were to be determined by such factors of
production in the supply side as the growth of labor forces and technical progress like in Krugman
(1989), this should be because the conditions in the demand side mainly set conditions in the supply
side in that way. To conclude, the empirical results supportive of Thirlwall’s Law above may imply
that the demands for Chinese goods from abroad have played important role in pulling the
economic growth in China.
5. CONCLUSION
Thirlwall’s Law basically suggests that economic growth phenomena could be understood better
with a demand-oriented approach rather than a supply-oriented approach. Furthermore, it is
explicitly concerned with the constraints imposed on economies by the requirement of external
balance. Therefore, Thirlwall’s Law reguires (1) the actual rate of growth of GDP be equal to the

� 4
rate of growth produced by the interaction between export and income elasticity of import demand;
(2) there must be a long-run association between GDP growth and export growth.
The requirement (1) for Thirlwall’s Law was tested “indirectly” by estimating the import demand
function and hence income elasticity of import demand in China. The test for requirement (2) was
carried out by identifying “directly” whether there is a cointegration relationship between the
growth rate of GDP and of export.
Both tests verify that Thirlwall’s Law holds in China. First, when we use the estimate for income
elasticity of import demand in the traditional form of a import demand function, over the entire
reform period after 1979 through 2002, the Chinese economy has grown on average as fast as the
interaction between income elasticity and export predicts. Second, according to the direct test
approach, there is a strong long-run association between the growth rate of GDP and the growth rate
of export. These two findings are strong supports of Thirlwall’s Law. Overall, the empirical findings
supportive of Thirlwall’s Law in China suggest further the relevance of a demand-oriented approach
to economic growth in China.

�85
REFERENCES
Andersen, P.S. (1993), ‘The 45-degree Rule Revisited’, Applied Economics, 25(9), pp. 1279-84
Ansari, M., Hashemzadeh, N. & Xi, Y. (2000) ‘The Chronicle of Economic Growth in Southeast
Asian Countries: Does Thirlwall’s Law Provide and Adequate Explanation?’ Journal of
Post Keynesian Economics, 22(4), pp. 573-88
Atesoglu, H.S. (1993) ‘Balance-of-Payments Constrained Growth: Evidence from the United
States’, Journal of Post Keynesian Economics, 15(4), pp. 507-14
Atesoglu, H.S. (1993-4) ‘Exports, Capital Flows, Relative Prices and Economic Growth in Canada’,
Journal of Post Keynesian Economics, 16(2), pp. 289-98
Atesoglu, H.S. (1995) ‘An Explanation of the Slowdown in U.S. Economic Growth’, Applied
Economics Letters, 2(4), pp. 91-4
Atesoglu, H.S. (1997) ‘Balance-of-Payments-Constrained Growth Model and Its Implications for
the United States’, Journal of Post Keynesian Economics, 19(3), pp. 327-35
Bairam, E.I. (1988) ‘Balance of Payments, the Harrod Foreign Trade Multiplier and Economic
Growth: the European and North American Experience, 1970-85’, Applied Economics,
20(12), pp. 1635-42
Bairam, E.I. (1997) ‘Level of Economic Development and Appropriate Specification of the Harrod
Foreign-trade Multiplier’, Journal of Post Keynesian Economics, 19(3), pp. 337-44
Bairam, E.I. & Dempster, G. (1991) ‘The Harrod Foreign Trade Multiplier and Economic Growth in
Asian Countries, Applied Economics, 23(11), pp.1719-24
Beko, J. (2003) ‘The Validity of the Balance-of-Payments-Constrained Growth Model for a Small

�=6
Economy in Transition: the Case of Slovenia’, Journal of Post Keynesian Economics,
26(1), pp. 69-93
Bertola L., Higachi H. & Procile, G. (2002) ‘Balance-of-Payments-Constrained Growth in Brazil: a
test of Thirlwall’s Law, 1890-1973’, Journal of Post Keynesian Economics, 25(1), pp.
123-140
Charemza, W.W. & Deadman, D.F. (1997) New Directions in Econometric Practice: General To
Specific Modeling, Cointegration and Vector Autoregression, 2nd edition, Northampton:
Edward Elgar
Cheung, Y.W. & Lai, K.S. (1993) ‘Finite-sample Sizes of Johansen’s Likelihood Ratio Tests for
Cointegration, Oxford Bulletin of Economics and Statistics, 55, pp.313-28
Hakkio, C.S. & Rush, M. (1991) ‘Cointegration: How short is the Long run’, Journal of
International Money and Finance, 10, pp.571-81
Hieke, H. (1997) ‘Balance-of-Payments-Constrained Growth: a Reconsideration of the Evidence for
the US Economy’, Journal of Post Keynesian Economics, 19(3), pp. 313-25
Johansen, S. (1988) ‘Statistical Analysis of Cointegration Vectors’, Journal of Economic Dynamics
and control, 12, June-Sept. pp. 231-54
Johansen, S. & Juselius, K. (1990) ‘Maximum Likelihood Estimation and Inference on
Cointegration With Applications to the Demand for Money’, Oxford Bulletin of
Economics and Statistics, 52, pp. 169-210
Kaldor, N. (1966) Caused of the Slow Rate of Economic Growth of the United Kingdom: an
Inaugural Lecture, Cambridge: Cambridge University Press, reprinted in Targetti, F. &
Thirlwall, A.P. (ed.) (1989) The Essential Kaldor, New York: Holmes & Meier

�87
Kaldor, N. (1970) ‘The Case for Regional Policies’, Scottish Journal of Political Economy, 17(3),
pp.337-48
Kaldor, N. (1981) ‘The Role of Increasing Returns, Technical Progress and Cumulative Causation
in the Theory of International Trade and Economic Growth’, Economie Appliqee, No.4,
reprinted in Targetti, F. & Thirlwall, A.P. (ed.) (1989) The Essential Kaldor, New York:
Holmes & Meier
Krugman, P. (1989) ‘Differences in Income Elasticities and Trends in Real Exchange Rates’,
European Economic Review, 33 (May), pp.1031-46
Leon-Ledesma, M. (1999) ‘An Application of Thirlwall’s Law to the Spanish Economy’, Journal of
Post Keynesian Economics, 21(3), pp. 431-9
Liu, X., Wang, C. & Wei, Y. (2001) ‘Causal Links Between Foreign Direct Investment and Trade in
China’, China Economic Review, 12(2/3), pp.190-202
Liu, X., Burridge, P. & Sinclair, P.J.N. (2002) ‘Relationships Between Economic Growth, Foreign
Direct Investment and Trade: Evidence From China’, Applied Economics, 34(11),
pp.1433-40
Mah, J.S. (2000) ‘An Empirical Examination of the disaggregated Import Demand of Korea—the
Case of Information Technology Products’, Journal of Asian Economics, 11(2), pp.237-44
McCombie, J.S.L (1989) ‘”Thirlwall’s Law” and Balance of Payments Constrained Growth—A
Comment on the Debate’, Applied Economics, 21(6), pp.611-29
McCombie, J.S.L (1992) ‘”Thirlwall’s Law” and Balance of Payments Constrained Growth: More
on the Debate’, Applied Economics, 24(5), pp.493-512
McCombie, J.S.L. (1997) ‘On the Empirics of Balance-of-Payments-Constrained Growth’, Journal

�@�
of Post Keynesian Economics, 19(3), pp. 345-75
McCombie, J.S.L., Pugno, M., & Soro, B. (ed.) (2002) Productivity Growth and Economic
Performance: Essays on Verdoorn’s Law, New York: Palgrave Macmillan
McCombie, J.S.L. & Thirlwall, A.P (2004) Economic Growth and the Balance-of-Payments
Constraint, New York: St. Martin’s Press
McGregor, P.G. & Swales, J.K. (1985) ‘Professor Thirlwall and Balance of Payments Constrained
Growth’, Applied Economics, 17(1), pp. 33-40
McGregor, P.G. & Swales, J.K. (1986) ‘Balance of Payments Constrained Growth: A Rejoinder to
Professor Thirlwall’, Applied Economics, 18(12), pp.1265-75
McGregor, P.G. & Swales, J.K. (1991) ‘Thirlwall’s Law and Balance of Payments Constrained
Growth: Further Comment on the Debate’, Applied Economics, 23(1), pp.9-20
Moreno-Brid J.C. (1999) ‘Mexico’s Economic Growth and the Balance of Payments Constraint: a
Cointegration Analysis’, International Review of Applied Economics, 13(2), pp. 149-159
Moreno-Brid J.C. & Perez E. (1999) ‘Balance-of-Payments-Constrained Growth in Central
America: 1950-96’, Journal of Post Keynesian Economics, 22(1), 131-147
Pattichis, C.A. (1999) ‘Price and Income Elasticities of Disaggregated Import Demand: Results
from UECMs and an Application’, Applied Economics, 31(9), pp.1061-71
Pesaran, H. Shin, Y., & Smith, R.J. (2001) Bounds Testing Approaches to the Analysis of Level
Relationships, Journal of Applied Econometrics, 16, pp.289-326
Perraton J. (2003) ‘Balance of Payments Constrained Growth and Developing Countries: an
Examination of Thirlwall’s Hypothesis’, International Review of Applied Economics,
17(1), pp. 1-22

���
Senhadji, A. (1998) ‘Time-series Estimation of Structural Import Demand Equations: A Cross-
country Analysis’, IMF Staff Papers 45, pp.236-68
Tang, T.C. (2003) ‘An Empirical Analysis of China’s Aggregate Import Demand Function’, China
Economic Review, 14(2), pp.142-63
Tang. T.C. & Nair, M. (2002) ‘A Cointegration Analysis of Malaysian Import Demand Function:
Reassessment from the Bounds Test’, Applied Economics Letters, 9(5), pp.293-296
Thirlwall, A.P. (1979) ‘The Balance of Payments Constraint as an Explanation of International
Growth Rate Differences’, Banca Nazionale del Lavoro Quarterly Review, March.
Thirlwall, A.P. (1986) ‘Balance of Payments Constrained Growth: A Reply to McGregor and
Swales’, Applied Economics, 18(12), pp.1259-63
Thirlwall, A.P. (1991-2) ‘Professor Krugman’s 45-degree Rule’, Journal of Post Keynesian
Economics, 14(1), pp.23-8
Thirlwall, A.P. (1997) ‘Reflections on the Concept of Balance-of-Payments-Constrained Growth’,
Journal of Post Keynesian Economics, 19(3), pp.377-85
Thirlwall, A.P. & Dixon (1979) ‘A Model of Export-led Growth with a Balance of Payments
Constraint’, in Bowers (ed.), Inflation, Development and Integration, Leeds: Leeds
University Press
Thirlwall, A.P. & Hussain, N. (1982) ‘The Balance of Payments Constraint, Capital Flows and
Growth Rate Differences Between Developing Countries’, Oxford Economic Papers, 10,
pp.498-510
Verdoorn, P.J. (1949[2002]) ‘Factors that Determine the Growth of Labor Productivity’, translated
by A.P. Thirlwall from Verdoorn (1949) ‘Fattori che regolano lo sviluppo della produtivita

�8�
del lavoro’, L’Industria, Vol. 1, 3-10, and printed in McCombie et al. (2002) in English
A
BCDEF GHIJK L GMDLNMGO GPK GQ
BCDEF GHIJK L GMDLNMGO GPK GQ
BCDEF GHIJK L GMDLNMGO GPK GQ
BCDEF GHIJK L GMDLNMGO GPK GQ
R STUVW XY
Z T[\X]R ^_`_Ua XY
b X]c _d _W _\e
f XYgW ] Y
h ] XY_\Wgi jkklm
noh
po qo
o gVV_[]a rX
h ] XY_\Wgi jkkltsum
v T`Td T
v _^c [T`X sw [^g]]V[_^Xdg[X
o gVV_[]a rX
h ] XY_\Wgi jkkxm
noh
po qo
o gVV_[]a rX
y Ta [TUi jkzzm
jkR g[_VXT`T`d{ _[]c
h UX[a ^T`^_g`] [a XY
po qo
o gVV_[]a rX
Z [Td ]a _`TWh VV[_T^c
y Ta [TU| } XUVY] X[i jkkjmjjh Ya T`v _g`] [a XY
v _^c [T`X sw [^g]]V[_^Xdg[X
o gVV_[]a rX
h ] XY_\Wgi jkk~m
noh
� _c T`YX`� [_^Xdg[X
o gVV_[]a rX
y X[] _W TX] TWi p��pm
y [T �aW
� _c T`YX`� [_^Xdg[X
b _[X`_sy [adi jkkkm
b X Sa ^_
� _c T`YX`� [_^Xdg[X
o gVV_[]a rX
}a [X^]
b _[X`_sy [ad| � X[X �i jkkkm
xv X`] [TWh UX[a ^T`
v _g`] [a XY
� _c T`YX`� [_^Xdg[X
o gVV_[]a rX
h `d X[YX`i jkklm
j�� `dgY] [a TW ^_g`] [a XY
R `\W X s� [T`\X[� YZ �_sY] XV
V[_^Xdg[X
ba SXd
h `YT[a X] TW'�i p���m
uo _g]ch Ya T`v _g`] [a XYn `a ][__]] XY]��w qoT`d� qo
ba SXdi l _g] _� uT[X
YgVV_[]a rXm
y X� _i p��lm
o W _ rX`a T
� _c T`YX`� [_^Xdg[X
o gVV_[]a rX
�a X� Xi jkk~m
noh
R `\W X s� [T`\X[� YZ �_sY] XV
V[_^Xdg[X
ba SXd T^^_[da `\] _YTUVW X
VX[a _d Y
q X_` sq Xd XYUTi jkkkm
o VTa `
n `a ][__]] XY]��po qo
o gVV_[]a rX
n `a ]f __]Z XY] Y �v _a `] X\[T]a _`
h `TW eYa Y
� `da [X^]
� X[[T] _`i p��lm
lud X rXW _Va `\^_g`] [a XY
R [[_[v _[[X^]a _`b _d XW
o gVV_[]a rX

�
[Table 2] Bounds Test for Import Demand
Function
Computed F-statistic 43.96***
Critical Value Bounds
Lower 3.79 5%
Upper 4.85
Lower 5.15 1%
Upper 6.36
(Critical Values Drawn from Pesaran et al (2001), p.300,
Table CI(iii) Case III with k=2)
(***) indicate rejection of the null at 1% significance level

�
� �����8� ���*���>�����/�� ¢¡ �¤£¦¥<�/§©¨«ª¬ �¯®�ª=¡ �/��°²±'³=´8³� �����8� ���*���>�����/�� ¢¡ �¤£¦¥<�/§©¨«ª¬ �¯®�ª=¡ �/��°²±'³=´8³� �����8� ���*���>�����/�� ¢¡ �¤£¦¥<�/§©¨«ª¬ �¯®�ª=¡ �/��°²±'³=´8³� �����8� ���*���>�����/�� ¢¡ �¤£¦¥<�/§©¨«ª¬ �¯®�ª=¡ �/��°²±'³=´8³=µµ µµ ¶�·8·�¶¹¸�º¤°¶�·8·�¶¹¸�º¤°¶�·8·�¶¹¸�º¤°¶�·8·�¶¹¸�º¤° »�8���¦¼=�8����� »�8���¦¼=�8����� »�8���¦¼=�8����� »�8���¦¼=�8�������8¡ ���'¥<��¨½�8¾�8¡ ���'¥<��¨½�8¾�8¡ ���'¥<��¨½�8¾�8¡ ���'¥<��¨½�8¾
����
¿=À/Á½Â Ã�Ä�Å Æ�Ç�È�Ã/Á É Ê©ËÌ¿�Í Î�Ï Î�ÐÑ,Ò�Ó�Ô'Õ<Ó'Ò Ñ�Ö�× Ø�Ô Ò8× Ù'Ö Ó8× Ù*ÔÑ,Ò�Ó=Ñ�Õ<Ò'Ô Ñ,Ó8× Ñ�Ö Ó8× Ú�Ú Ñ,Ô8× Ñ,ÒÑ,Ò�Ó'Ù�Õ<Ò8Ñ Ñ,Ó8× Û�Ó Ó8× Ü'Ó Ñ,Ô8× Û'ÙÑ,Ò�Ó�Û'Õ<Ò�Ù Ñ�Ü�× Ø�Û Ò8× Ö*Ù Ò8× Ò=ÑÑ,Ò�Ó�Ö*Õ<Ò'Û Ñ�Ö�× Ó�Ô Ò8× Ó�Ú Ó8× Û=ÑÑ,Ò�Ó�Ú'Õ<ÒÖ Ù�Ñ'× Ú�Ö Ò8× Ò=Ñ Ñ�Ù=× Ñ,ÔÑ,Ò�Ó�Ø'Õ<Ò'Ú Ñ,Ó8× Ô�Ú Ò8× Ü'Ø Ñ,Ô8× Ñ�ÖÑ,Ò�Ó*Ü�Õ<Ò'Ø Ñ,Û8× Ó Ù Ò8× Ü'Ú Ü�× Ü'ØÑ,Ò�Ó�Ó'Õ<Ò�Ü Ñ�Ö�× Ô�Ö Ò8× Ö/Ó Ü�× Ó�ÒÑ,Ò�Ó�Ò'Õ<Ò'Ó Ñ�Ù=× Ö/Ú Ò8× Ñ�Ñ Ø8× Ò�ÒÑ,Ò�Ò�Ô'Õ<Ò'Ò Ñ�Ù=× Ù'Ö Ò8× Ô�Ó Ø8× Ó�ÓÑ,Ò�Ò=Ñ�Õ<Ô'Ô Ñ�Ù=× Ò*Ü Ò8× Ñ,Ó Ü�× Ù*ÒÑ,Ò�Ò'Ù�Õ<Ô8Ñ Ñ�Ñ'× Ú�Ö Ó8× Ò�Û Ø8× Ö/ÓÑ,Ò�Ò�Û'Õ<Ô�Ù Ñ�Ù=× Ó�Û Ó8× Ú'Ù Ü�× Ù�Ñ
ÝÌÞ Þ¿=À/Á½Â Ã�Ä Ñ,Ú8× Ù�Ù Ò8× Ù*Ú Ó8× Ú�Ú

ß
à á²âÌã@ä åçæ@è@éëê�âÌä ì�í�î íðï�ñ>òóâÌô�î âÌê�õ8åà á²âÌã@ä åçæ@è@éëê�âÌä ì�í�î íðï�ñ>òóâÌô�î âÌê�õ8åà á²âÌã@ä åçæ@è@éëê�âÌä ì�í�î íðï�ñ>òóâÌô�î âÌê�õ8åà á²âÌã@ä åçæ@è@éëê�âÌä ì�í�î íðï�ñ>òóâÌô�î âÌê�õ8å
öÌ÷�ø8ù<ú�û¢÷/ü8ýÿþ�ù�� þ���� ÷�� ��� à � ��� × � ü �¦û8þ��»ö���� ����� �½þ�� ���<ý²þ�� ø/û� û�� �óû8û�� Û8× Ö/Ó � � ! ��� ß#" ��� ��$�%�& �� � ß' � ��(!� � Û�Ò8× Ü�Ù �!)�� � � � &=�* ÷��½þ�� Ö/Û8× Ù*Ô ��$�� � � � )� * � ÷!�+�½þ�� ��ú/ù�� ��� ú*þ������+,/þ�� ø/û¢þ��#&�-/.0&1� )!)
à á²âÌã@ä å32�è54²ï76@ê#8@í:9 ïÌî ê�;tå�<Ìôtâ�;$î ïÌê�áÿå�í�;=4ÿå#;?>¢å@å�êA@CBED âÌê#8à á²âÌã@ä å32�è54²ï76@ê#8@í:9 ïÌî ê�;tå�<Ìôtâ�;$î ïÌê�áÿå�í�;=4ÿå#;?>¢å@å�êA@CBED âÌê#8à á²âÌã@ä å32�è54²ï76@ê#8@í:9 ïÌî ê�;tå�<Ìôtâ�;$î ïÌê�áÿå�í�;=4ÿå#;?>¢å@å�êA@CBED âÌê#8à á²âÌã@ä å32�è54²ï76@ê#8@í:9 ïÌî ê�;tå�<Ìôtâ�;$î ïÌê�áÿå�í�;=4ÿå#;?>¢å@å�êA@CBED âÌê#8
F�G1H�ïÌôI;F�G1H�ïÌôI;F�G1H�ïÌôI;F�G1H�ïÌôI;
Computed F-statistic 11.08***
Critical Value Bounds
Lower 5.73 5%
Upper 4.94
Lower 7.84 1%
Upper 6.84
(Critical Values Drawn from Pesaran et al (2001), p.300,
Table CI(iii) Case III with k=1)
(***) indicate rejection of the null at 5% significance level

&
J�K�L MN�O�PRQ�S:T7UWVYX�Z\[]�^�_�Oa`Lb]#P�cedYf�[]#[ghL f3i=O�[�jk_�lRLb]RZ=l�Lb]#`7m5npo�q�o�X�Q!r�rsQJ�K�L MN�O�PRQ�S:T7UWVYX�Z\[]�^�_�Oa`Lb]#P�cedYf�[]#[ghL f3i=O�[�jk_�lRLb]RZ=l�Lb]#`7m5npo�q�o�X�Q!r�rsQJ�K�L MN�O�PRQ�S:T7UWVYX�Z\[]�^�_�Oa`Lb]#P�cedYf�[]#[ghL f3i=O�[�jk_�lRLb]RZ=l�Lb]#`7m5npo�q�o�X�Q!r�rsQJ�K�L MN�O�PRQ�S:T7UWVYX�Z\[]�^�_�Oa`Lb]#P�cedYf�[]#[ghL f3i=O�[�jk_�lRLb]RZ=l�Lb]#`7m5npo�q�o�X�Q!r�rsQ
tuvwxy ty uy v
y z xbt?{+x z|y z x y { z t y z x?ub{ zIy}y z xb~?{ z u y z x v { z ~ y z xb�?{ z?v�y z xbw?{ z � y z xb�?{ z w y z xbx?{ z � y z x z { z x y zbz t?{ zbz|y zbzIy {+tbt y zbz ub{+t y}y zbz ~?{+t?u���!�b� ���
������ ��� �
� �s�

)
à é�H1H�å�ê#8Ìî G���è3F²í�;$î �çâ�;$î ïÌê ï�ñ�� ��H�ïÌô+;ABóåY�çâÌê#8��76@ê�õ�;$î ïÌê��>ïÌôR9��@î ê�â��à é�H1H�å�ê#8Ìî G���è3F²í�;$î �çâ�;$î ïÌê ï�ñ�� ��H�ïÌô+;ABóåY�çâÌê#8��76@ê�õ�;$î ïÌê��>ïÌôR9��@î ê�â��à é�H1H�å�ê#8Ìî G���è3F²í�;$î �çâ�;$î ïÌê ï�ñ�� ��H�ïÌô+;ABóåY�çâÌê#8��76@ê�õ�;$î ïÌê��>ïÌôR9��@î ê�â��à é�H1H�å�ê#8Ìî G���è3F²í�;$î �çâ�;$î ïÌê ï�ñ�� ��H�ïÌô+;ABóåY�çâÌê#8��76@ê�õ�;$î ïÌê��>ïÌôR9��@î ê�â��
���1 1����1 1����1 1����1 1�¡¡ ¡¡£¢¤1¤�¢¢¤1¤�¢¢¤1¤�¢¢¤1¤�¢
Dependent Variable: D(M)
Included observations: 20 after adjusting endpoints
Variable Coefficient Std. Error t-Statistic Prob.
C -1.645226 0.462638 -3.556186 0.0237
M(-1) -0.990547 0.292272 -3.389131 0.0276
Y(-1) 1.777982 0.368089 4.83031 0.0085
PFP(-1) -0.585888 0.094846 -6.177224 0.0035
D(M(-1)) -0.356103 0.232482 -1.531744 0.2003
D(M(-2)) -0.828323 0.234901 -3.526266 0.0243
D(M(-3)) 0.237137 0.128962 1.838815 0.1398
D(Y) -1.273857 0.516896 -2.464439 0.0694
D(Y(-1)) 3.731926 0.914245 4.081977 0.0151
D(Y(-2)) 1.663741 0.648068 2.567232 0.0622
D(Y(-3)) -0.111895 1.004182 -0.111429 0.9166
D(Y(-4)) -6.369264 0.954311 -6.674202 0.0026
D(PFP) 0.40267 0.192796 2.088577 0.105
D(PFP(-1)) 1.544163 0.151089 10.22023 0.0005
D(PFP(-2)) 1.169928 0.123871 9.444733 0.0007
D(PFP(-3)) 0.641175 0.091036 7.043133 0.0021
R-squared 0.994938 Mean dependent var 0.128592
Adjusted R-squared 0.975957 S.D. dependent var 0.142021
S.E. of regression 0.022021 Akaike info criterion -4.803048
Sum squared resid 0.00194 Schwarz criterion -4.006462
Log likelihood 64.03048 F-statistic 52.41733
Durbin-Watson stat 2.67523 Prob(F-statistic) 0.000799

$
All variables are in natural logarithms
M: Imports, Y: Real GDP, PFP: Relative Price, D(*): difference operator
[Appendix 2] Diagnostic Tests for Estimated Import Demand Function
Ramsey RESET Test (the Number of Fitted Term=1)
F-statistic 1.499628 p-Value 0.308118
Breusch-Godfrey Serial Correlation LM Test (Lags=2)
F-statistic 0.732961 p-Value 0.577047
Normality Test
Jarque-Bera 0.380115 p-Value 0.826912
ARCH (1) Test:
F-statistic 0.056308 p-Value 0.815265

"
à é�H1H�å�ê#8Ìî G¦¥�è�9¨§=©5§Eª âÌê�8«9¨§=©5§Eª ï�ñ�í!¬76�âÌô�å�í¢áÿå�í�;�ñtïÌô� ��H�ïÌôI;�BóåY�çâÌê#8:��6�ê�õ�;$î ïÌêà é�H1H�å�ê#8Ìî G¦¥�è�9¨§=©5§Eª âÌê�8«9¨§=©5§Eª ï�ñ�í!¬76�âÌô�å�í¢áÿå�í�;�ñtïÌô� ��H�ïÌôI;�BóåY�çâÌê#8:��6�ê�õ�;$î ïÌêà é�H1H�å�ê#8Ìî G¦¥�è�9¨§=©5§Eª âÌê�8«9¨§=©5§Eª ï�ñ�í!¬76�âÌô�å�í¢áÿå�í�;�ñtïÌô� ��H�ïÌôI;�BóåY�çâÌê#8:��6�ê�õ�;$î ïÌêà é�H1H�å�ê#8Ìî G¦¥�è�9¨§=©5§Eª âÌê�8«9¨§=©5§Eª ï�ñ�í!¬76�âÌô�å�í¢áÿå�í�;�ñtïÌô� ��H�ïÌôI;�BóåY�çâÌê#8:��6�ê�õ�;$î ïÌê
-6
-4
-2
0
2
4
6
2000 2001 2002
CUSUM 5% Significance

%
� ®°¯�¯*���/¼�¡ ±E²8�>�³�¨«¡ ë�/¨t¡ ���ë��´1µ/����¶� ®°¯�¯*���/¼�¡ ±E²8�>�³�¨«¡ ë�/¨t¡ ���ë��´1µ/����¶� ®°¯�¯*���/¼�¡ ±E²8�>�³�¨«¡ ë�/¨t¡ ���ë��´1µ/����¶� ®°¯�¯*���/¼�¡ ±E²8�>�³�¨«¡ ë�/¨t¡ ���ë��´1µ/����¶�µµ µµ&¥�·=�k¸²��� �/¨«¡ ��� �/�/¨ § �8��� ¬ �*���� »� ���*¼ ��±�¯*��¥ ¨¥�·=�k¸²��� �/¨«¡ ��� �/�/¨ § �8��� ¬ �*���� »� ���*¼ ��±�¯*��¥ ¨¥�·=�k¸²��� �/¨«¡ ��� �/�/¨ § �8��� ¬ �*���� »� ���*¼ ��±�¯*��¥ ¨¥�·=�k¸²��� �/¨«¡ ��� �/�/¨ § �8��� ¬ �*���� »� ���*¼ ��±�¯*��¥ ¨����
Dependent Variable: D(Y)
Included observations: 21 after adjusting endpoints
Variable Coefficient Std. Error t-Statistic Prob.
C 4.250282 1.966608 2.161225 0.0485
Y(-1) -0.861524 0.18486 -4.660405 0.0004
X(-1) 0.248508 0.11013 2.256489 0.0406
D(Y(-1)) 0.644904 0.190116 3.392167 0.0044
D(X) 0.102328 0.03813 2.683669 0.0178
D(X(-1)) -0.077461 0.065031 -1.191142 0.2534
D(X(-2)) -0.020933 0.037212 -0.562537 0.5826
R-squared 0.659532 Mean dependent var 0.125081
Adjusted R-squared 0.513618 S.D. dependent var 2.787829
S.E. of regression 1.944263 Akaike info criterion 4.428844
-0.4
0.0
0.4
0.8
1.2
1.6
1999 2000 2001 2002
CUSUM of Squares 5% Significance

�
Sum squared resid 52.92221 Schwarz criterion 4.777018
Log likelihood -39.50287 F-statistic 4.519986
Durbin-Watson stat 1.677058 Prob(F-statistic) 0.009438
All variables are growth rate
Y: growth rate of GDP
X: growth rate of exports
D(*): difference of variable (*)
[Appendix 5] Diagnostic Test For Cointegration Equation of GDP
and Export
����
Ramsey RESET Test (the Number of Fitted Term=1)
F-statistic 0.339512 p-Value 0.57
Breusch-Godfrey Serial Correlation LM Test (Lags=2)
F-statistic 0.479209 p-Value 0.5
Normality Test
Jarque-Bera 0.5566 p-Value 0.757

�!�
ARCH (1) Test:
F-statistic 0.380208 p-Value 0.545

� �
à é�H1H�å�ê#8Ìî G¦¹�è�9¨§=©5§Eª âÌê�8«9¨§=©5§Eª ï�ñ�í!¬76�âÌô�å�íº©»;<âÌã@î ä î ;½ì áÿå�í�;à é�H1H�å�ê#8Ìî G¦¹�è�9¨§=©5§Eª âÌê�8«9¨§=©5§Eª ï�ñ�í!¬76�âÌô�å�íº©»;<âÌã@î ä î ;½ì áÿå�í�;à é�H1H�å�ê#8Ìî G¦¹�è�9¨§=©5§Eª âÌê�8«9¨§=©5§Eª ï�ñ�í!¬76�âÌô�å�íº©»;<âÌã@î ä î ;½ì áÿå�í�;à é�H1H�å�ê#8Ìî G¦¹�è�9¨§=©5§Eª âÌê�8«9¨§=©5§Eª ï�ñ�í!¬76�âÌô�å�íº©»;<âÌã@î ä î ;½ì áÿå�í�;
-0.4
0.0
0.4
0.8
1.2
1.6
1990 1992 1994 1996 1998 2000 2002
CUSUM of Squares 5% Significance
-12
-8
-4
0
4
8
12
1990 1992 1994 1996 1998 2000 2002
CUSUM 5% Significance
� �
à é�H1H�åà é�H1H�åà é�H1H�åà é�H1H�å ê#8Ìî G¦ �è�9��@î ê�å�í=å:Fÿõ/ïÌê�ï7�ðìY�Y���1 1�ê#8Ìî G¦ �è�9��@î ê�å�í=å:Fÿõ/ïÌê�ï7�ðìY�Y���1 1�ê#8Ìî G¦ �è�9��@î ê�å�í=å:Fÿõ/ïÌê�ï7�ðìY�Y���1 1�ê#8Ìî G¦ �è�9��@î ê�å�í=å:Fÿõ/ïÌê�ï7�ðìY�Y���1 1�¡¡ ¡¡£¢¤1¤�¢¢¤1¤�¢¢¤1¤�¢¢¤1¤�¢
¼¨½»¾ ¿�À��*÷�ù?� Á Âk�*÷�ù?� * û�ù�Â�� ÷/ü * ù<þ � ûà � %!%�&�. � ! �Ä
Å�ø8ùtù<û��s�þ8ú�÷�ø��s�� þ�� þ��*ú�û
Åh(*þ���Æ8ûC� ��=÷�ù<û�� Æ��Ç û!��û�ù?,/û
È û���Å þ��!� �<þ��Á �'ü�� ÷��
� %!$!%12674.55 0.81 1.39 271.55
� % " 13663.14 1.04 1.61 227.39
� % " �14373.64 1.23 2.01 228.07
� % " �15681.63 1.40 2.18 210.11 318.04 -353.41 35.37
� % " �17390.93 1.44 2.58 208.00 245.48 -239.79 -5.69
� % "/ß20034.36 1.89 4.40 185.75 131.58 -8.92 -122.66
� % " &22739.01 2.27 9.43 162.62 -850.46 181.73 668.73
� % " )24740.04 2.93 12.56 140.03 -588.95 171.46 417.49
� % " $27609.87 3.77 14.05 123.80 25.77 -410.88 385.11
� % "!"30729.82 4.01 16.15 131.79 -291.31 -181.89 473.19
� % " %31989.74 4.07 16.27 136.17 -307.50 34.15 273.35
� %!%! 33205.33 5.82 22.75 103.85 1027.32 -1031.59 4.27
� %!% �36260.22 7.04 31.05 100.07 1185.07 -1298.03 112.96
� %!%��41409.16 8.08 41.01 102.21 548.72 176.61 -725.33
� %!%8�46999.43 8.03 50.36 121.83 -907.72 -138.29 1046.01
� %!% ß52921.35 13.40 106.95 95.12 673.84 -2970.52 2296.68
� %!%�&58478.10 14.03 105.92 100.00 135.16 -1876.48 1741.32
� %!%�)64092.02 13.48 100.59 106.03 568.55 -2488.75 1920.19
� %!%!$69732.11 16.09 105.81 111.68 2869.50 -2783.66 -85.85
� %!% "75171.17 16.48 107.59 113.10 2499.99 -496.33 -2003.67
� %!%!%80508.36 17.94 127.95 116.58 1714.75 -702.66 -1012.08
�� ! ! 86949.01 22.49 166.97 111.22 1650.79 -860.31 -790.48
�� ! �93470.18 23.80 178.54 115.20 1383.39 -3772.03 2388.64
�� ! ��100947.82 29.13 216.47 121.17 2824.35 -5997.37 3173.02
All values are at 1995 price.
Change in Foreign Reserve: Minus sign indicates decrease in foreign reserve and capital outflow
Terms of Trade: the ratio of GDP deflator to Import price index