balance of payments - new learner · 17-05-11 1 canada’s balance of payments today ’s menu: i)...
TRANSCRIPT
17-05-11
1
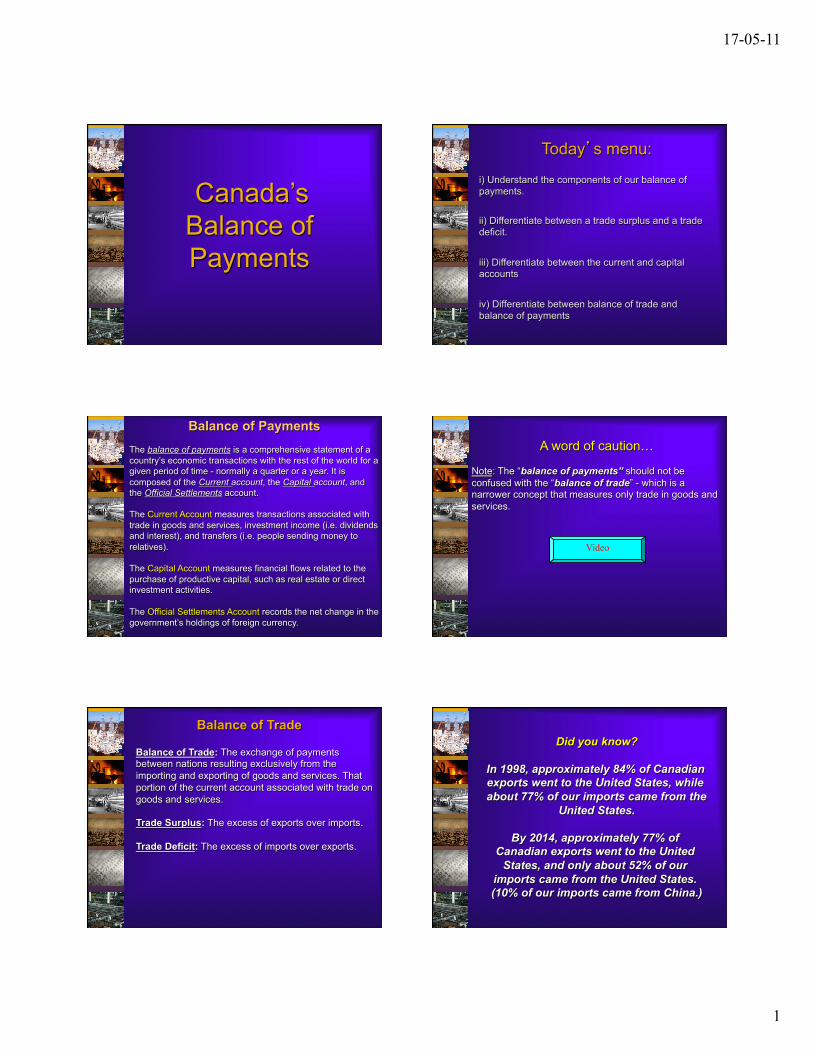
Canada’s Balance of Payments
Today’s menu:
i) Understand the components of our balance of payments.
ii) Differentiate between a trade surplus and a trade deficit.
iii) Differentiate between the current and capital accounts
iv) Differentiate between balance of trade and balance of payments
Balance of Payments The balance of payments is a comprehensive statement of a country’s economic transactions with the rest of the world for a given period of time - normally a quarter or a year. It is composed of the Current account, the Capital account, and the Official Settlements account.
The Current Account measures transactions associated with trade in goods and services, investment income (i.e. dividends and interest), and transfers (i.e. people sending money to relatives).
The Capital Account measures financial flows related to the purchase of productive capital, such as real estate or direct investment activities.
The Official Settlements Account records the net change in the government’s holdings of foreign currency.
A word of caution…
Note: The “balance of payments” should not be confused with the “balance of trade” - which is a narrower concept that measures only trade in goods and services.
Video
Balance of Trade
Balance of Trade: The exchange of payments between nations resulting exclusively from the importing and exporting of goods and services. That portion of the current account associated with trade on goods and services. Trade Surplus: The excess of exports over imports.
Trade Deficit: The excess of imports over exports.
Did you know?
In 1998, approximately 84% of Canadian exports went to the United States, while about 77% of our imports came from the
United States.
By 2014, approximately 77% of Canadian exports went to the United
States, and only about 52% of our imports came from the United States. (10% of our imports came from China.)
17-05-11
2
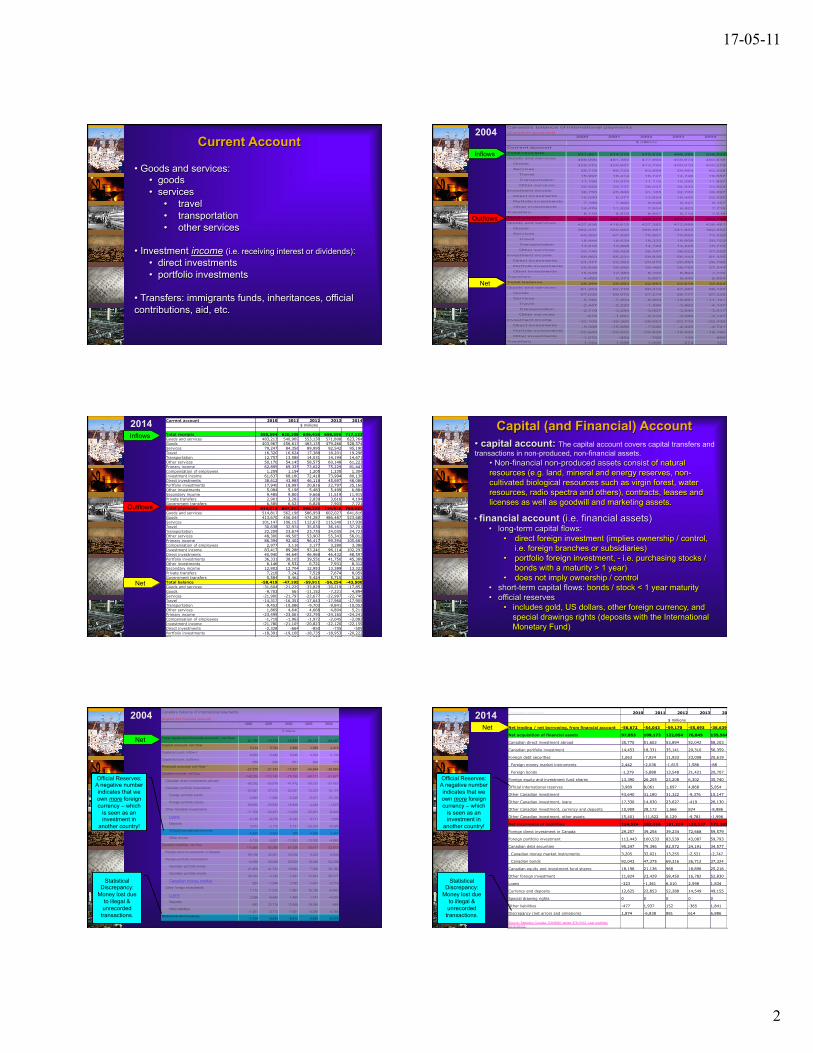
Current Account
• Goods and services: • goods • services
• travel • transportation • other services
• Investment income (i.e. receiving interest or dividends): • direct investments • portfolio investments
• Transfers: immigrants funds, inheritances, official contributions, aid, etc.
2000 2001 2002 2003 2004
Total receipts 531,961 514,219 515,836 499,388 538,533Goods and services 489,090 481,383 477,694 459,974 492,618
Goods 429,372 420,657 413,795 400,010 430,279Services 59,718 60,725 63,899 59,964 62,338
Travel 15,997 16,414 16,747 14,746 16,557Transportation 11,196 10,574 11,115 10,285 11,857Other services 32,525 33,737 36,037 34,933 33,924
Investment income 36,755 25,866 31,185 32,700 38,897Direct investments 15,090 6,377 13,624 16,455 22,025Portfolio investments 7,189 7,960 9,628 9,321 9,157Other investments 14,476 11,529 7,934 6,923 7,715
Transfers 6,116 6,970 6,957 6,714 7,019Total payments 502,692 489,216 493,171 475,570 504,710Goods and services 427,836 418,612 427,382 412,688 436,481
Goods 362,337 350,682 356,581 341,833 362,952Services 65,500 67,930 70,801 70,855 73,529
Travel 18,444 18,634 18,333 18,608 20,703Transportation 13,916 13,868 14,122 14,225 15,774Other services 33,140 35,428 38,347 38,022 37,052
Investment income 69,863 65,231 59,839 56,443 61,335Direct investments 24,477 22,263 20,670 20,884 26,766Portfolio investments 29,838 30,585 30,466 28,755 27,344Other investments 15,548 12,383 8,702 6,804 7,225
Transfers 4,992 5,373 5,951 6,440 6,894Total balance 29,269 25,003 22,664 23,818 33,824Goods and services 61,254 62,770 50,312 47,287 56,137
Goods 67,036 69,975 57,214 58,177 67,328Services -5,782 -7,204 -6,903 -10,891 -11,191
Travel -2,447 -2,220 -1,586 -3,862 -4,147Transportation -2,719 -3,294 -3,007 -3,940 -3,917Other services -615 -1,691 -2,310 -3,089 -3,127
Investment income -33,109 -39,365 -28,653 -23,743 -22,438Direct investments -9,388 -15,886 -7,046 -4,429 -4,741Portfolio investments -22,649 -22,625 -20,838 -19,433 -18,186Other investments -1,072 -854 -769 119 490
Transfers 1,124 1,598 1,006 274 125
Canada's balance of international payments(Current account)
$ millions
Current account
Inflows
Outflows
Net
2004
Inflows
Outflows
Net
2014 Current account 2010 2011 2012 2013 2014 $ millions Total receipts 555,594 620,108 636,418 658,556 717,122 Goods and services 483,213 540,969 553,130 571,808 623,764 Goods 403,967 456,613 463,135 479,266 528,574 Services 79,247 84,356 89,995 92,542 95,190 Travel 16,320 16,624 17,388 18,201 19,296 Transportation 12,757 13,588 14,031 14,194 14,671 Other services 50,170 54,145 58,575 60,148 61,223 Primary income 62,895 69,335 73,622 75,229 81,443 Compensation of employees 1,259 1,154 1,205 1,235 1,304 Investment income 61,637 68,180 72,418 73,994 80,138 Direct investments 38,612 43,985 46,118 45,697 48,088 Portfolio investments 17,940 18,997 20,816 22,797 25,166 Other investments 5,084 5,198 5,483 5,499 6,884 Secondary income 9,485 9,805 9,666 11,519 11,915 Private transfers 2,901 3,282 2,839 3,616 4,194 Government transfers 6,585 6,523 6,826 7,903 7,721 Total payments 614,013 667,303 696,329 714,810 760,621 Goods and services 514,817 562,198 586,959 602,027 641,616 Goods 413,670 456,045 474,287 486,487 523,680 Services 101,147 106,153 112,672 115,540 117,936 Travel 30,638 32,974 35,030 36,161 37,201 Transportation 22,209 23,674 23,735 24,035 24,723 Other services 48,300 49,505 53,907 55,343 56,012 Primary income 86,394 92,402 96,417 99,394 105,683 Compensation of employees 2,977 3,116 3,177 3,280 3,386 Investment income 83,417 89,286 93,241 96,114 102,297 Direct investments 40,940 44,649 46,968 46,432 48,597 Portfolio investments 36,331 38,105 39,551 41,750 45,389 Other investments 6,146 6,532 6,721 7,931 8,312 Secondary income 12,802 12,704 12,953 13,389 13,322 Private transfers 7,218 7,242 7,528 7,674 8,059 Government transfers 5,584 5,462 5,424 5,715 5,263 Total balance -58,419 -47,195 -59,911 -56,254 -43,500 Goods and services -31,604 -21,229 -33,829 -30,219 -17,852 Goods -9,703 567 -11,152 -7,221 4,894 Services -21,900 -21,797 -22,677 -22,997 -22,746 Travel -14,317 -16,351 -17,643 -17,960 -17,905 Transportation -9,452 -10,086 -9,703 -9,841 -10,052 Other services 1,869 4,640 4,668 4,804 5,211 Primary income -23,499 -23,067 -22,795 -24,165 -24,241 Compensation of employees -1,718 -1,962 -1,972 -2,045 -2,082 Investment income -21,780 -21,105 -20,823 -22,120 -22,159 Direct investments -2,328 -664 -850 -735 -509 Portfolio investments -18,391 -19,108 -18,735 -18,953 -20,222 Other investments -1,061 -1,334 -1,238 -2,432 -1,428 Secondary income -3,316 -2,899 -3,287 -1,870 -1,407 Private transfers -4,317 -3,959 -4,689 -4,058 -3,865 Government transfers 1,001 1,061 1,402 2,188 2,458 Source: Statistics Canada, CANSIM, tables 376-0101, Last modified: 2015-03-02.
Capital (and Financial) Account • capital account: The capital account covers capital transfers and transactions in non-produced, non-financial assets.
• Non-financial non-produced assets consist of natural resources (e.g. land, mineral and energy reserves, non-cultivated biological resources such as virgin forest, water resources, radio spectra and others), contracts, leases and licenses as well as goodwill and marketing assets.
• financial account (i.e. financial assets) • long-term capital flows:
• direct foreign investment (implies ownership / control, i.e. foreign branches or subsidiaries)
• portfolio foreign investment, - i.e. purchasing stocks / bonds with a maturity > 1 year)
• does not imply ownership / control • short-term capital flows: bonds / stock < 1 year maturity • official reserves
• includes gold, US dollars, other foreign currency, and special drawings rights (deposits with the International Monetary Fund)
2000 2001 2002 2003 2004
Total capital and financial accounts, net flow-21,756 -15,379 -12,850 -20,725 -24,447
Capital account, net flow5,314 5,784 4,988 3,968 4,415
Capital account, inflow s6,003 6,482 5,648 4,834 5,130
Capital account, outf low s-689 -698 -661 -866 -715
Financial account, net flow 1
-27,070 -21,163 -17,837 -24,694 -28,862Canadian assets, net f low
-142,039 -113,743 -79,765 -68,111 -81,677Canadian direct investments abroad
-66,352 -55,918 -41,472 -30,191 -57,453Canadian portfolio investments
-63,927 -37,573 -25,087 -12,519 -16,174Foreign portfolio bonds
-3,963 -1,920 -6,229 -8,071 -15,102Foreign portfolio stocks
-59,965 -35,653 -18,858 -4,449 -1,073Other Canadian investments
-11,759 -20,251 -13,206 -25,401 -8,049Loans -5,126 -8,219 -8,182 6,171 1,935Deposits
3,973 -2,172 5,731 -23,234 -8,528Official international reserves
-5,480 -3,353 298 4,693 3,427Other assets
-5,125 -6,507 -11,053 -13,030 -4,882Canadian liabilities, net f low
114,969 92,580 61,928 43,417 52,814Foreign direct investments in Canada
99,198 42,561 33,026 9,222 8,548Foreign portfolio investments
14,598 38,509 20,935 18,469 53,208Canadian portfolio bonds
-21,458 41,733 18,684 7,000 20,156Canadian portfolio stocks
35,232 4,125 -1,531 12,931 35,771Canadian money market 824 -7,349 3,782 -1,461 -2,719
Other foreign investments1,173 11,510 7,967 15,726 -8,942
Loans 3,396 -6,493 1,400 1,741 -4,222Deposits
-962 23,716 13,568 18,265 -566Other liabilities
-1,261 -5,713 -7,001 -4,280 -4,154Statistical discrepancy
-7,514 -9,624 -9,815 -3,092 -9,376
Canada's balance of international payments
(Capital and financial account)
$ millions
Net
Statistical Discrepancy:
Money lost due to illegal & unrecorded
transactions.
Official Reserves: A negative number indicates that we own more foreign currency – which
is seen as an investment in
another country!
2004
Net
Financial Account 2010 2011 2012 2013 2014
$ millions
Net lending / net borrowing, from financial account -56,672 -54,043 -59,170 -55,693 -36,639
Net acquisition of financial assets 97,853 109,173 122,054 76,845 135,564
Canadian direct investment abroad 35,770 51,602 53,894 52,042 58,203
Canadian portfolio investment 14,453 18,331 35,141 29,310 56,359
Foreign debt securities 1,063 -7,924 11,933 23,008 20,619
Foreign money market instruments 2,442 -2,036 -1,615 1,586 -88
Foreign bonds -1,379 -5,888 13,548 21,421 20,707
Foreign equity and investment fund shares 13,390 26,255 23,208 6,302 35,740
Official international reserves 3,989 8,061 1,697 4,868 5,854
Other Canadian investment 43,640 31,180 31,322 -9,376 15,147
Other Canadian investment, loans 17,330 14,630 23,627 -419 26,130
Other Canadian investment, currency and deposits 10,909 28,172 1,566 824 -8,986
Other Canadian investment, other assets 15,401 -11,622 6,129 -9,781 -1,996
Net incurrence of liabilities 154,524 163,216 181,224 132,537 172,203
Foreign direct investment in Canada 29,257 39,254 39,234 72,668 59,579
Foreign portfolio investment 113,443 100,533 83,539 43,087 59,793
Canadian debt securities 95,247 79,396 82,572 24,191 34,577
Canadian money market instruments 3,205 32,021 13,255 -2,521 -2,747
Canadian bonds 92,043 47,375 69,316 26,712 37,324
Canadian equity and investment fund shares 18,196 21,136 968 18,896 25,216
Other foreign investment 11,824 23,429 58,450 16,782 52,830
Loans -323 -1,361 6,010 2,598 1,834
Currency and deposits 12,625 22,853 52,288 14,549 49,155
Special drawing rights 0 0 0 0 0
Other liabilities -477 1,937 152 -365 1,841
Discrepancy (net errors and omissions) 1,874 -6,838 881 614 6,886
Source: Statistics Canada, CANSIM, tables 376-0102, Last modified: 2015-03-02.
Official Reserves: A negative number indicates that we own more foreign currency – which
is seen as an investment in
another country!
Statistical Discrepancy:
Money lost due to illegal & unrecorded
transactions.
2014

17-05-11
3
Official Reserves Account Bank of Canada
• official reserves (net official monetary movements)
Includes gold, US dollars, other foreign currency, and special drawings rights (deposits with the International Monetary Fund)
Not too long ago, we had a handsome positive balance in our Current Account. Generally speaking, a trade surplus. Q: How is it that we can have trade surpluses when we traditionally sell low value-added products (wheat, fish, lumber, etc.) while buying high value-added products from abroad (technology, appliances, vehicles, etc.)? What exports are we selling these days that are bringing in such big bucks? A: Contrary to popular belief we DON'T export low value-added products. By far, our biggest NET export item is now auto parts and finished cars. We "consume" about 12% of the North American auto market, yet we produce 16%. Currently, Ontario produces more auto parts and finished cars than the state of Michigan!
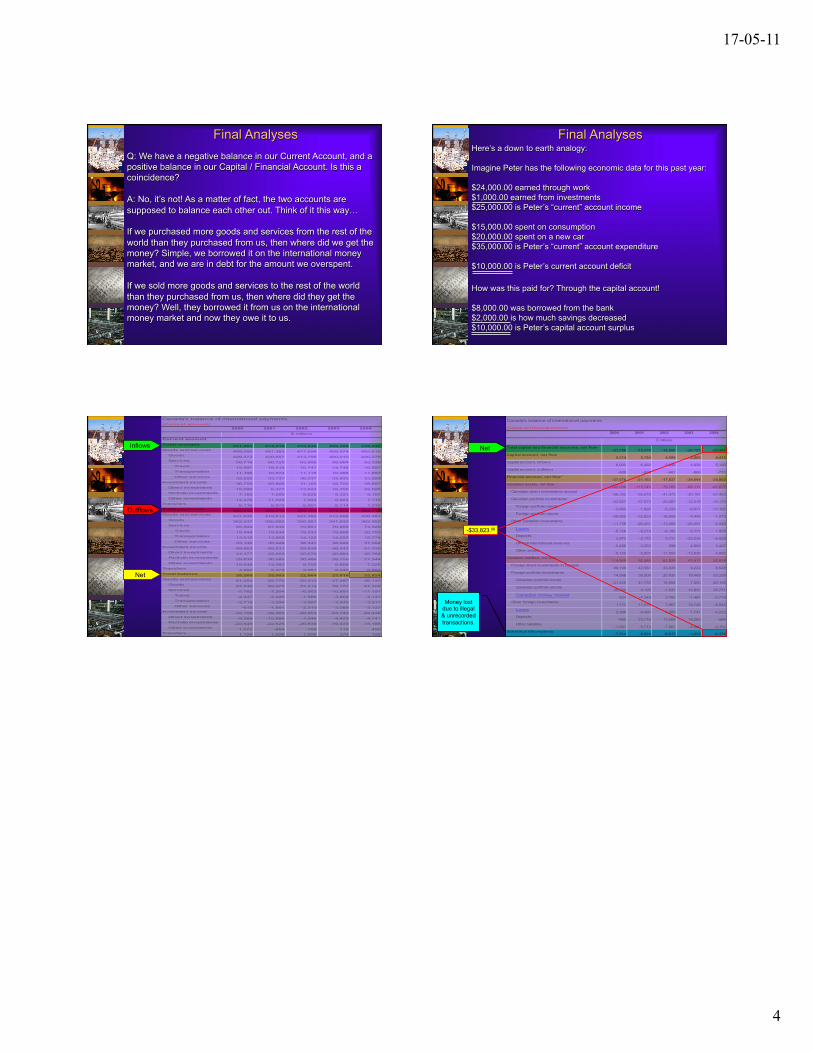
Final Analyses
Is it bad to have a negative balance in our Capital & Financial Account? Q: What does the capital and financial account actually show us? A: The Capital and Financial Accounts indicate how much capital is flowing into Canada versus how much is flowing out. A negative number would indicate that more capital is flowing OUT of Canada because Canadians are purchasing a lot more foreign stocks, bonds, and real-estate than foreigners are purchasing of Canadian stocks, bonds, and real-estate. Thus, it would mean we are buying up more interest in foreign markets than they are buying in ours.
Final Analyses
Q: So then, is a negative balance in the financial account good or bad? A: A negative balance in the Capital is generally viewed as a good thing… this is for a couple of reasons.
1. A negative balance in the Capital account means that we have a positive balance in our Current account. More on that later! 2. Our negative balance indicates that Canadians are buying up more interest in foreign markets than they are buying in ours.
So then, what would you prefer? Would you rather own, or be owned. In the words of CBC’s financial commentator Michael Hlinka, who owns shares of American firms like Budweiser, Pfizer, and Washington Mutual (who tend to pay regular and generous quarterly dividends) “…the idea of all of those Americans working for little old me warms the cockles of my heart!”
Final Analyses
17-05-11
4
Q: We have a negative balance in our Current Account, and a positive balance in our Capital / Financial Account. Is this a coincidence? A: No, it’s not! As a matter of fact, the two accounts are supposed to balance each other out. Think of it this way… If we purchased more goods and services from the rest of the world than they purchased from us, then where did we get the money? Simple, we borrowed it on the international money market, and we are in debt for the amount we overspent. If we sold more goods and services to the rest of the world than they purchased from us, then where did they get the money? Well, they borrowed it from us on the international money market and now they owe it to us.
Final Analyses
Here’s a down to earth analogy: Imagine Peter has the following economic data for this past year: $24,000.00 earned through work $1,000.00 earned from investments $25,000.00 is Peter’s “current” account income $15,000.00 spent on consumption $20,000.00 spent on a new car $35,000.00 is Peter’s “current” account expenditure $10,000.00 is Peter’s current account deficit
Final Analyses
How was this paid for? Through the capital account! $8,000.00 was borrowed from the bank $2,000.00 is how much savings decreased $10,000.00 is Peter’s capital account surplus
2000 2001 2002 2003 2004
Total receipts 531,961 514,219 515,836 499,388 538,533Goods and services 489,090 481,383 477,694 459,974 492,618
Goods 429,372 420,657 413,795 400,010 430,279Services 59,718 60,725 63,899 59,964 62,338
Travel 15,997 16,414 16,747 14,746 16,557Transportation 11,196 10,574 11,115 10,285 11,857Other services 32,525 33,737 36,037 34,933 33,924
Investment income 36,755 25,866 31,185 32,700 38,897Direct investments 15,090 6,377 13,624 16,455 22,025Portfolio investments 7,189 7,960 9,628 9,321 9,157Other investments 14,476 11,529 7,934 6,923 7,715
Transfers 6,116 6,970 6,957 6,714 7,019Total payments 502,692 489,216 493,171 475,570 504,710Goods and services 427,836 418,612 427,382 412,688 436,481
Goods 362,337 350,682 356,581 341,833 362,952Services 65,500 67,930 70,801 70,855 73,529
Travel 18,444 18,634 18,333 18,608 20,703Transportation 13,916 13,868 14,122 14,225 15,774Other services 33,140 35,428 38,347 38,022 37,052
Investment income 69,863 65,231 59,839 56,443 61,335Direct investments 24,477 22,263 20,670 20,884 26,766Portfolio investments 29,838 30,585 30,466 28,755 27,344Other investments 15,548 12,383 8,702 6,804 7,225
Transfers 4,992 5,373 5,951 6,440 6,894Total balance 29,269 25,003 22,664 23,818 33,824Goods and services 61,254 62,770 50,312 47,287 56,137
Goods 67,036 69,975 57,214 58,177 67,328Services -5,782 -7,204 -6,903 -10,891 -11,191
Travel -2,447 -2,220 -1,586 -3,862 -4,147Transportation -2,719 -3,294 -3,007 -3,940 -3,917Other services -615 -1,691 -2,310 -3,089 -3,127
Investment income -33,109 -39,365 -28,653 -23,743 -22,438Direct investments -9,388 -15,886 -7,046 -4,429 -4,741Portfolio investments -22,649 -22,625 -20,838 -19,433 -18,186Other investments -1,072 -854 -769 119 490
Transfers 1,124 1,598 1,006 274 125
Canada's balance of international payments(Current account)
$ millions
Current account
Inflows
Outflows
Net
2000 2001 2002 2003 2004
Total capital and financial accounts, net flow-21,756 -15,379 -12,850 -20,725 -24,447
Capital account, net flow5,314 5,784 4,988 3,968 4,415
Capital account, inflow s6,003 6,482 5,648 4,834 5,130
Capital account, outf low s-689 -698 -661 -866 -715
Financial account, net flow 1
-27,070 -21,163 -17,837 -24,694 -28,862Canadian assets, net f low
-142,039 -113,743 -79,765 -68,111 -81,677Canadian direct investments abroad
-66,352 -55,918 -41,472 -30,191 -57,453Canadian portfolio investments
-63,927 -37,573 -25,087 -12,519 -16,174Foreign portfolio bonds
-3,963 -1,920 -6,229 -8,071 -15,102Foreign portfolio stocks
-59,965 -35,653 -18,858 -4,449 -1,073Other Canadian investments
-11,759 -20,251 -13,206 -25,401 -8,049Loans -5,126 -8,219 -8,182 6,171 1,935Deposits
3,973 -2,172 5,731 -23,234 -8,528Official international reserves
-5,480 -3,353 298 4,693 3,427Other assets
-5,125 -6,507 -11,053 -13,030 -4,882Canadian liabilities, net f low
114,969 92,580 61,928 43,417 52,814Foreign direct investments in Canada
99,198 42,561 33,026 9,222 8,548Foreign portfolio investments
14,598 38,509 20,935 18,469 53,208Canadian portfolio bonds
-21,458 41,733 18,684 7,000 20,156Canadian portfolio stocks
35,232 4,125 -1,531 12,931 35,771Canadian money market 824 -7,349 3,782 -1,461 -2,719
Other foreign investments1,173 11,510 7,967 15,726 -8,942
Loans 3,396 -6,493 1,400 1,741 -4,222Deposits
-962 23,716 13,568 18,265 -566Other liabilities
-1,261 -5,713 -7,001 -4,280 -4,154Statistical discrepancy
-7,514 -9,624 -9,815 -3,092 -9,376
Canada's balance of international payments
(Capital and financial account)
$ millions
Net
Money lost due to illegal & unrecorded transactions.
-$33,823.00