balanced distillation equipment design - gtc … distillation equipment design f ... fouling issues...
TRANSCRIPT
Balanced distillation equipment design
Fouling tendency is a critical issue in crude distillation units and should not be overlooked
when designing crude distillation columns. Corrosion tendency can influence fouling issues as well. Since fouling resistance has an inverse relationship to efficiency in distillation equipment design, opti-mising equipment design between fouling resistance and efficiency requirements must be precise. Poor
Fouling resistance and efficiency requirements for distillation equipment are balanced and optimised for reliable unit performance
SOUN HO LEEGTC Technology
application know-how as well as poor equipment design often downgrade column performance and reduce unit run length.
This article will discuss common fouling issues associated with crude distillation column design. Actual retrofits for crude atmospheric columns are demonstrated through two case studies. These studies examine how fouling resistance and efficiency requirements for distilla-
tion equipment are balanced and optimised through careful evalua-tion and design methodologies.
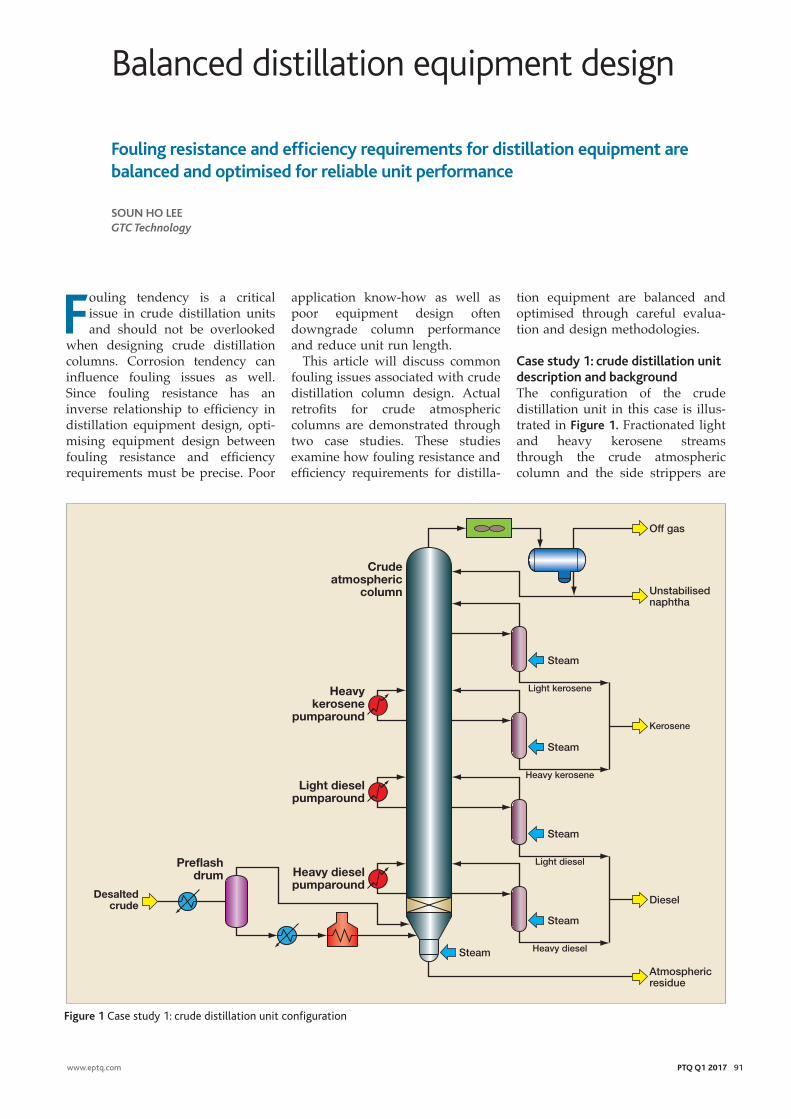
Case study 1: crude distillation unit description and backgroundThe configuration of the crude distillation unit in this case is illus-trated in Figure 1. Fractionated light and heavy kerosene streams through the crude atmospheric column and the side strippers are
www.eptq.com PTQ Q1 2017 91
Off gas
Unstabilised naphtha
Steam
Diesel
Atmospheric residue
Preflash drum
Desalted crude
Steam Heavy diesel
Heavy dieselpumparound
Heavy kerosene
pumparound
Steam
Light diesel
Light dieselpumparound
Steam
Kerosene
Heavy kerosene
Steam
Light kerosene
Crude atmospheric
column
Figure 1 Case study 1: crude distillation unit configuration
92 PTQ Q1 2017 www.eptq.com
fractionation sections. Kerosene or diesel intermediate product yield limitation was also experienced when kerosene or diesel boiling range material composition was increased in the charged crude slate. Charge crude compositions were frequently varied during operation.
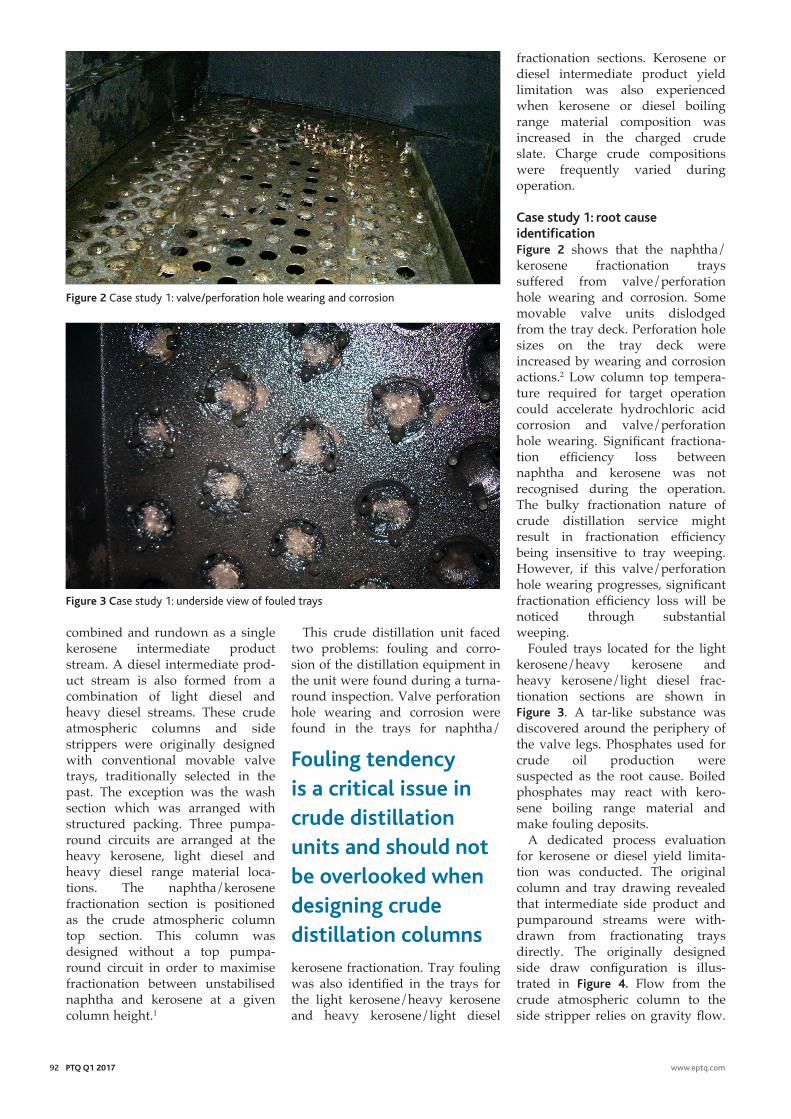
Case study 1: root cause identificationFigure 2 shows that the naphtha/kerosene fractionation trays suffered from valve/perforation hole wearing and corrosion. Some movable valve units dislodged from the tray deck. Perforation hole sizes on the tray deck were increased by wearing and corrosion actions.2 Low column top tempera-ture required for target operation could accelerate hydrochloric acid corrosion and valve/perforation hole wearing. Significant fractiona-tion efficiency loss between naphtha and kerosene was not recognised during the operation. The bulky fractionation nature of crude distillation service might result in fractionation efficiency being insensitive to tray weeping. However, if this valve/perforation hole wearing progresses, significant fractionation efficiency loss will be noticed through substantial weeping.
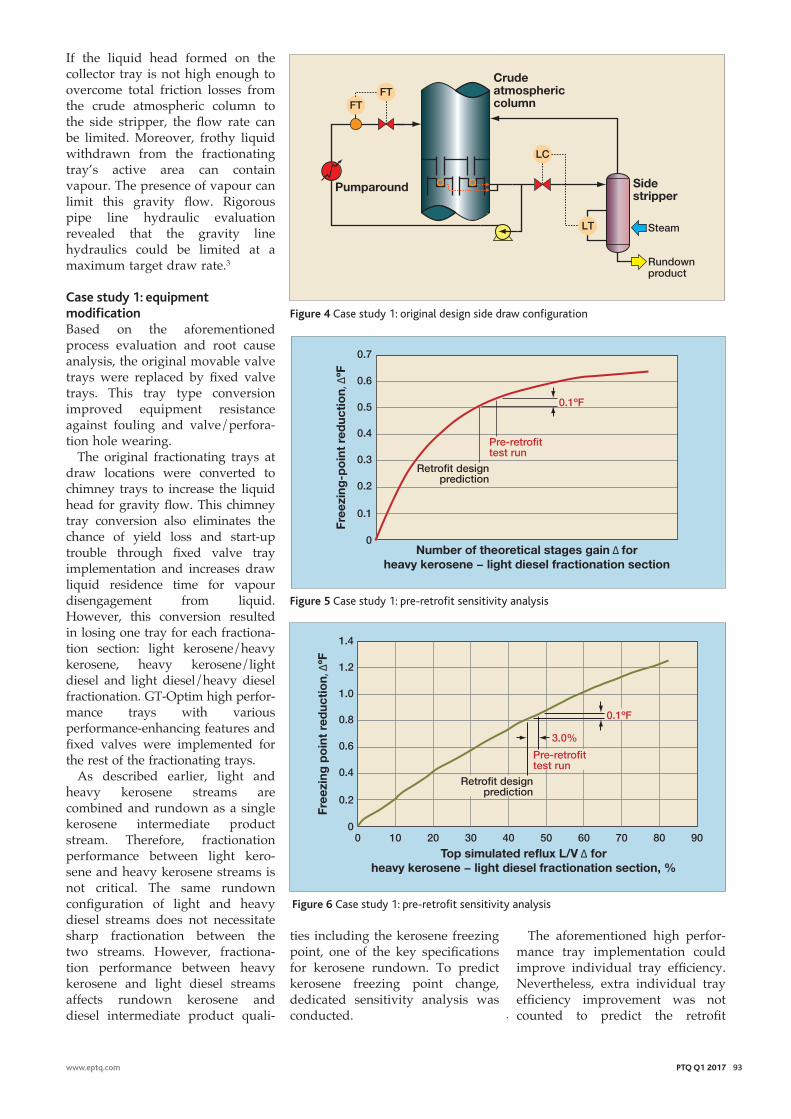
Fouled trays located for the light kerosene/heavy kerosene and heavy kerosene/light diesel frac-tionation sections are shown in Figure 3. A tar-like substance was discovered around the periphery of the valve legs. Phosphates used for crude oil production were suspected as the root cause. Boiled phosphates may react with kero-sene boiling range material and make fouling deposits.
A dedicated process evaluation for kerosene or diesel yield limita-tion was conducted. The original column and tray drawing revealed that intermediate side product and pumparound streams were with-drawn from fractionating trays directly. The originally designed side draw configuration is illus-trated in Figure 4. Flow from the crude atmospheric column to the side stripper relies on gravity flow.
combined and rundown as a single kerosene intermediate product stream. A diesel intermediate prod-uct stream is also formed from a combination of light diesel and heavy diesel streams. These crude atmospheric columns and side strippers were originally designed with conventional movable valve trays, traditionally selected in the past. The exception was the wash section which was arranged with structured packing. Three pumpa-round circuits are arranged at the heavy kerosene, light diesel and heavy diesel range material loca-tions. The naphtha/kerosene fractionation section is positioned as the crude atmospheric column top section. This column was designed without a top pumpa-round circuit in order to maximise fractionation between unstabilised naphtha and kerosene at a given column height.1
This crude distillation unit faced two problems: fouling and corro-sion of the distillation equipment in the unit were found during a turna-round inspection. Valve perforation hole wearing and corrosion were found in the trays for naphtha/
kerosene fractionation. Tray fouling was also identified in the trays for the light kerosene/heavy kerosene and heavy kerosene/light diesel
Figure 2 Case study 1: valve/perforation hole wearing and corrosion
Figure 3 Case study 1: underside view of fouled trays
Fouling tendency is a critical issue in crude distillation units and should not be overlooked when designing crude distillation columns
If the liquid head formed on the collector tray is not high enough to overcome total friction losses from the crude atmospheric column to the side stripper, the flow rate can be limited. Moreover, frothy liquid withdrawn from the fractionating tray’s active area can contain vapour. The presence of vapour can limit this gravity flow. Rigorous pipe line hydraulic evaluation revealed that the gravity line hydraulics could be limited at a maximum target draw rate.3
Case study 1: equipment modificationBased on the aforementioned process evaluation and root cause analysis, the original movable valve trays were replaced by fixed valve trays. This tray type conversion improved equipment resistance against fouling and valve/perfora-tion hole wearing.
The original fractionating trays at draw locations were converted to chimney trays to increase the liquid head for gravity flow. This chimney tray conversion also eliminates the chance of yield loss and start-up trouble through fixed valve tray implementation and increases draw liquid residence time for vapour disengagement from liquid. However, this conversion resulted in losing one tray for each fractiona-tion section: light kerosene/heavy kerosene, heavy kerosene/light diesel and light diesel/heavy diesel fractionation. GT-Optim high perfor-mance trays with various performance-enhancing features and fixed valves were implemented for the rest of the fractionating trays.
As described earlier, light and heavy kerosene streams are combined and rundown as a single kerosene intermediate product stream. Therefore, fractionation performance between light kero-sene and heavy kerosene streams is not critical. The same rundown configuration of light and heavy diesel streams does not necessitate sharp fractionation between the two streams. However, fractiona-tion performance between heavy kerosene and light diesel streams affects rundown kerosene and diesel intermediate product quali-
www.eptq.com PTQ Q1 2017 93
ties including the kerosene freezing point, one of the key specifications for kerosene rundown. To predict kerosene freezing point change, dedicated sensitivity analysis was conducted.
The aforementioned high perfor-mance tray implementation could improve individual tray efficiency. Nevertheless, extra individual tray efficiency improvement was not counted to predict the retrofit
FTFT
LC
LT Steam
Rundown product
Pumparound Side stripper
Crude atmospheric column
Figure 4 Case study 1: original design side draw configuration
0.6
0.7
0.5
0.4
0.3
0.2
0.1
Free
zing
-po
int
red
ucti
on,
ƼF
0Number of theoretical stages gain ∆ for
heavy kerosene − light diesel fractionation section
Retrofit design prediction
Pre-retrofit test run
0.1ºF
Figure 5 Case study 1: pre-retrofit sensitivity analysis
1.2
1.4
1.0
0.8
0.6
0.4
0.2
0
Free
zing
po
int
red
ucti
on,
ƼF
0 10 20 30 40 50 60 70 80 90Top simulated reflux L/V ∆ for
heavy kerosene − light diesel fractionation section, %
3.0%
Retrofit design prediction
Pre-retrofit test run
0.1ºF
Figure 6 Case study 1: pre-retrofit sensitivity analysis

94 PTQ Q1 2017 www.eptq.com
test run conditions were obtained through the same operating mode, SOR (start of run) for fair compari-son. Since the internal vapour/liquid traffic and heat balances of the crude atmospheric column were not measurable operating parame-ters, these values were quantified through simulation modelling. Like the simulation model for the pre-retrofit case, the simulation model for the post-retrofit case was also validated with selected post-retrofit test run conditions. The crude charge rate was increased during the post-retrofit test run. The product yield balance reveals that the post-retrofit test run crude slate contained more kerosene boiling range materials compared to pre-retrofit crude slate. Kerosene and diesel yield limitation experienced in the past was eliminated.
The simulated crude atmospheric column heat balance of the post- retrofit case was also shifted from that of the pre-retrofit case due to a change in the crude slate composi-tion. Laboratory test results showed that the post-retrofit kerosene freez-ing point was relaxed by 0.2°F. Meanwhile, simulation modelling showed that the post-retrofit inter-nal reflux L/V ratio for the heavy kerosene/light diesel fractionation was reduced compared to the pre-retrofit value.
The heavy kerosene/light diesel fractionation section performance through the post-retrofit test run was evaluated and compared to the pre-retrofit section performance.
The post-retrofit kerosene freez-ing point was plotted and compared to the pre-retrofit sensi-tivity curve in Figure 7. Relaxing the kerosene freezing point by 0.2°F predicted an internal reflux L/V ratio reduction of 8% on the pre-retrofit sensitivity curve. A lower internal reflux ratio of 15% was simulated with the same 0.2°F freezing point relaxation at the post-retrofit test run conditions. Results indicated that the actual post-retrofit heavy kerosene/light diesel fractionation section effi-ciency was more satisfactory than the predicted retrofit efficiency value.
0.1°F by using a chimney tray conversion scenario. Figure 6 also shows another kerosene freezing point sensitivity curve per heavy kerosene/light diesel fractionation section internal reflux L/V (liquid/vapour) ratio. A freezing point increment of 0.1°F was predicted at a 3% lower heavy kerosene/light diesel fractionation section internal reflux L/V ratio. Undetected kero-sene freezing point changes were anticipated through the sensitivity analysis.
Case study 1: performance summaryThe pre- and post-retrofit perfor-mances are summarised and compared in Table 1. Both retrofit
heavy kerosene/light diesel frac-tionation performance.
Case study 1: sensitivity analysisFor reliable sensitivity analysis, simulation modelling was first vali-dated with pertinent unit test run conditions. Simulated kerosene freezing point value was reasona-bly matched to actual value. The tray efficiency and internal vapour/liquid traffic profile for each frac-tionation section were quantified through model validation. A constructed kerosene freezing point sensitivity curve per varied theoret-ical stages is plotted in Figure 5. This curve predicted that the freez-ing point could be increased by
Case Pre-retrofit Post-retrofitParameter Test run Test runYield balance Crude charge, BPD Base +∆12 Unstabilised naphtha, LV% Base +∆6.0 Kerosene, LV% Base +∆19.5 Diesel, LV% Base +∆12.1 Fractionation performance Light kerosene 5% - naphtha 95%,1 °F Base +∆1.0 Light diesel 5% - heavy kerosene 95%,1 °F Base -∆1.0 Kerosene flash point, °F Base ∆0 Kerosene freezing point, °F Base +∆0.2 Heavy kerosene/light diesel internal reflux L/V,2,3 weight basis % Base -∆15 Heat balance Heat removal - overhead condenser,2 % of total BTU/hr 72 62 Heat removal - heavy kerosene pumparound,2 % of total BTU/hr 4 6Heat removal - light diesel pumparound,2 % of total BTU/hr 7 10Heat removal - heavy diesel pumparound,2 % of total BTU/hr 16 21
1. ASTM D86 (LV%)2. Simulated value3. At the top tray of the section
Case study 1: performance summary
Table 1
1.2
1.4
1.0
0.8
0.6
0.4
0.2
0
Free
zing
po
int
red
ucti
on,
ƼF
0 10 20 30 40 50 60 70 80 90Top simulated reflux L/V ∆ for
heavy kerosene − light diesel fractionation section, %
Retrofit design prediction
Pre-retrofit test run
15%Post-retrofit
test run
0.2ºF
8%
Figure 7 Case study 1: pre- and post-retrofit sensitivity analysis
96 PTQ Q1 2017 www.eptq.com
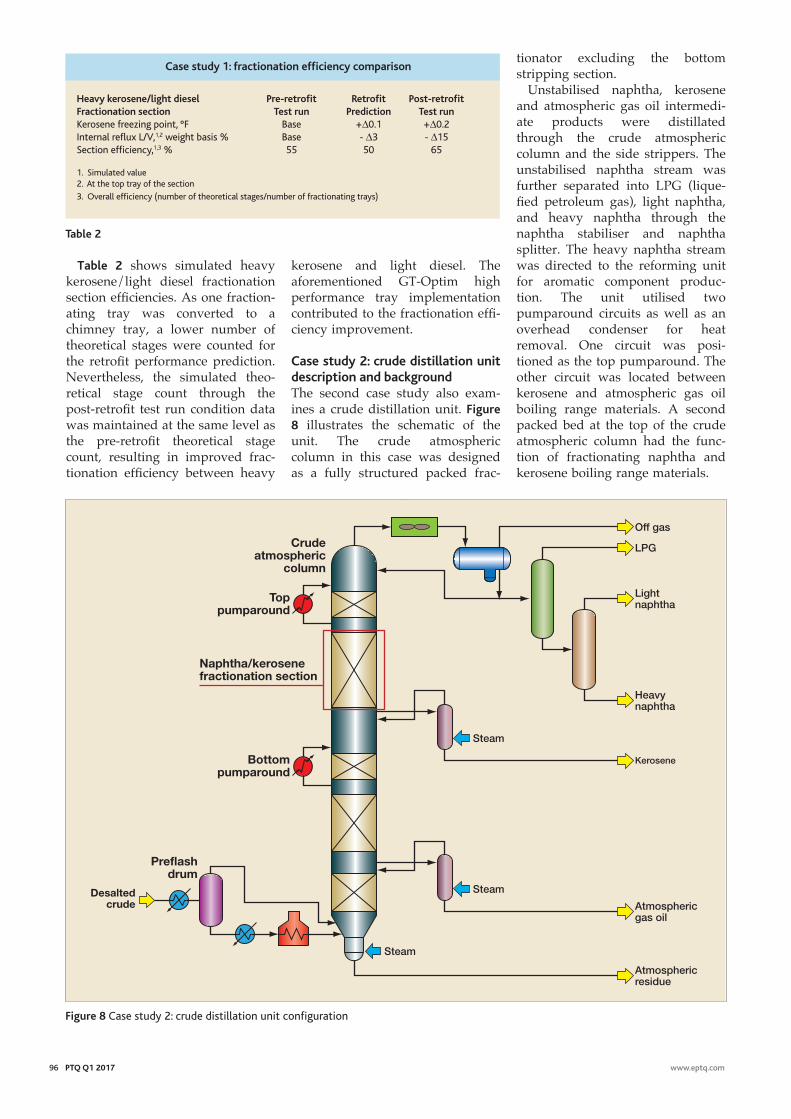
tionator excluding the bottom stripping section.
Unstabilised naphtha, kerosene and atmospheric gas oil intermedi-ate products were distillated through the crude atmospheric column and the side strippers. The unstabilised naphtha stream was further separated into LPG (lique-fied petroleum gas), light naphtha, and heavy naphtha through the naphtha stabiliser and naphtha splitter. The heavy naphtha stream was directed to the reforming unit for aromatic component produc-tion. The unit utilised two pumparound circuits as well as an overhead condenser for heat removal. One circuit was posi-tioned as the top pumparound. The other circuit was located between kerosene and atmospheric gas oil boiling range materials. A second packed bed at the top of the crude atmospheric column had the func-tion of fractionating naphtha and kerosene boiling range materials.
kerosene and light diesel. The aforementioned GT-Optim high performance tray implementation contributed to the fractionation effi-ciency improvement.
Case study 2: crude distillation unit description and backgroundThe second case study also exam-ines a crude distillation unit. Figure 8 illustrates the schematic of the unit. The crude atmospheric column in this case was designed as a fully structured packed frac-
Table 2 shows simulated heavy kerosene/light diesel fractionation section efficiencies. As one fraction-ating tray was converted to a chimney tray, a lower number of theoretical stages were counted for the retrofit performance prediction. Nevertheless, the simulated theo-retical stage count through the post-retrofit test run condition data was maintained at the same level as the pre-retrofit theoretical stage count, resulting in improved frac-tionation efficiency between heavy
Heavy kerosene/light diesel Pre-retrofit Retrofit Post-retrofitFractionation section Test run Prediction Test runKerosene freezing point, °F Base +∆0.1 +∆0.2 Internal reflux L/V,1,2 weight basis % Base - ∆3 - ∆15 Section efficiency,1,3 % 55 50 65
1. Simulated value2. At the top tray of the section
3. Overall efficiency (number of theoretical stages/number of fractionating trays)
Case study 1: fractionation efficiency comparison
Table 2
Off gas
LPG
Light naphtha
Heavy naphtha
Steam
Atmospheric residue
Atmospheric gas oil
Preflash drum
Desalted crude
Steam
Bottompumparound
Toppumparound
Naphtha/kerosene fractionation section
Steam
Kerosene
Crude atmospheric
column
Figure 8 Case study 2: crude distillation unit configuration

98 PTQ Q1 2017 www.eptq.com
target fractionation efficiency. However, the liquid distributor drip point density originally selected was excessive for the 1in crimp size.
The basic equation used to size gravity liquid distributors is:
H = Liquid height (‘Head’) above round shaped holeLv = Liquid volumetric flowN = Number of drip holes HA = Hole areaK = Orifice coefficient
A minimum liquid head needs to be maintained to ensure uniform liquid distribution. A certain number of drip holes, which indi-cates ‘drip point density’, is required for the desired distribution quality. However, unnecessarily high drip point density reduces distributor drip hole size and increases a chance of fouling. Distributor operating range affects hole size because the liquid head should be maintained at the minimum rate for uniform liquid distribution. The original liquid distributor (as designed) was not properly optimised between fouling resistance and liquid distri-bution quality.
Case study 2: distributor modificationThe liquid distributor modifications for the naphtha/kerosene fractiona-tion section are summarised in Table 3. In order to enlarge liquid distrib-utor drip hole size, the drip point density was reduced in a new design. The new density was care-fully selected by considering the commercially proven drip point density in the given size packing and application. Distributor operat-ing range was also adjusted further to increase distributor drip hole size. The minimum end of the distributor operating range was increased. This adjusted distributor operating range does not reduce the unit operating range. The minimum rate of the liquid distributor does not have to be matched to the minimum unit charge rate.4 Heat balance shifting through pumparound adjustments or increasing furnace coil outlet
Findings showed that the column’s inside wall cladding using Monel metallurgy was only applied to the portion where the top pumparound section was posi-tioned. The column inside wall portion of the naphtha/kerosene fractionation section remained as carbon steel. Rusted wall pieces from corrosion could accelerate fouling.
A review of the original distilla-tion equipment drawing revealed that the gravity flow trough-type liquid distributor for the naphtha/kerosene fractionation section was designed with high drip point density and small drip hole size. The naphtha/kerosene fractiona-tion packed bed was equipped with structured packing with a 1in crimp size and a 45° inclination angle.
This packing size at the given bed height was suitable to achieve
A particular unit limitation the refiner faced was that fractionation performance between naphtha and kerosene was substantially down-graded after a four-month operation. Substantial amounts of kerosene boiling range materials were down-graded to the naphtha stream. This downgrading not only limited the kerosene yield but also influenced the downstream reforming unit performance. The high rear end distillation point of the heavy naph-tha stream adversely affected the reforming reactor catalyst activation.
Case Study 2: root-cause identificationInspection during unit turnaround showed that the trough-type liquid distributor for the naphtha/kero-sene fractionation section was fouled. Several root causes of the fouling were identified through rigorous evaluation.
Amine-based corrosion inhibitor was injected into the crude distilla-tion unit. Chloride present in the column overhead may react with the inhibitor and form ammonium salt, which can foul the distributor. Formed ammonium salt particles could reside in the top pumparound bed and also migrate to the naph-tha/kerosene fractionation bed.
Naphtha/kerosene fractionation Original ModificationDistributor drip point density, drip point/ft2 16 4.6Distributor operating range 2.5:1 1.7:1Drip hole elevation,1 inch 1.5 3Distributor drip hole diameter, inch 3/16 7/16
1. From the bottom of the trough
Case study 2: distributor modification summary
Table 3
2
⎟⎠
⎞⎜⎝
⎛××
=HANk
LH v
300
320
330
310
290
280Tem
pera
ture
, ºF
2700 50 100 150 200 250 300 350 400
Unit run length, days
Pre-retrofitPost-retrofit
Figure 9 Case study 2: performance trend – naphtha end point
A minimum liquid head needs to be maintained to ensure uniform liquid distribution

www.eptq.com PTQ Q1 2017 99
2 Kister H Z, Distillation Operation, McGraw-Hill Company, 1990.3 Libermann N P, Process Design for Reliable Operations, Gulf Publishing Company, 2nd Edition.4 Bonilla J A, Don’t neglect liquid distributors, Chemical Engineering Progress, Mar 1993.
Soun Ho Lee is Manager of Refining Application for GTC Technology US, LLC, in Euless, Texas, specialising in process design, simulation modelling, energy saving design and troubleshooting for refining and aromatic applications. Email: [email protected]
for reliable crude distillation unit performance.
This article is an updated version of a presentation given at AIChE’s Spring Meeting Distillation Symposium, 11-14 Apr 2016, in Houston, TX.
GT-OPTIM is a mark of GTC Technology US LLC.
References1 Lee S H, et al, Optimising crude unit design, PTQ, Q2 2009.
temperature can maintain the required minimum distributor rate during lower unit charge rate opera-tion. This strategy can increase energy consumption during mini-mum charge rate operation. But it can assure efficient unit operation in the entire charge range and more efficient overall unit economics can be achieved. Distributor drip hole elevation from the bottom of the trough was increased to slow down distributor fouling.
The measured naphtha end point and kerosene flash point trends are plotted in Figure 9 and Figure 10 respectively. Plots in red indicate values gathered during pre-modifi-cation operating periods while plots in blue represent values achieved after the modification. Stable naphtha end points and kerosene flash points were main-tained for more than eight months of operation.
These case studies show how fouling resistance and efficiency requirements for distillation equip-ment are balanced and optimised
106
110
112
114
108
104
102Tem
pera
ture
, ºF
1000 50 100 150 200 250 300 350 400
Unit run length, days
Pre-retrofitPost-retrofit
Figure 10 Case study 2: performance trend – kerosene flash point