balanced income portfolio
TRANSCRIPT
x
x
x
x
x
x
x
x
x
x
x
x
x
x
x
x
x
x
x
x
x
x
x
x
x
x
x
x
x
x
x
x
x
x
x
x
x
x
x
x
x
x
x
x
x
x
x
1
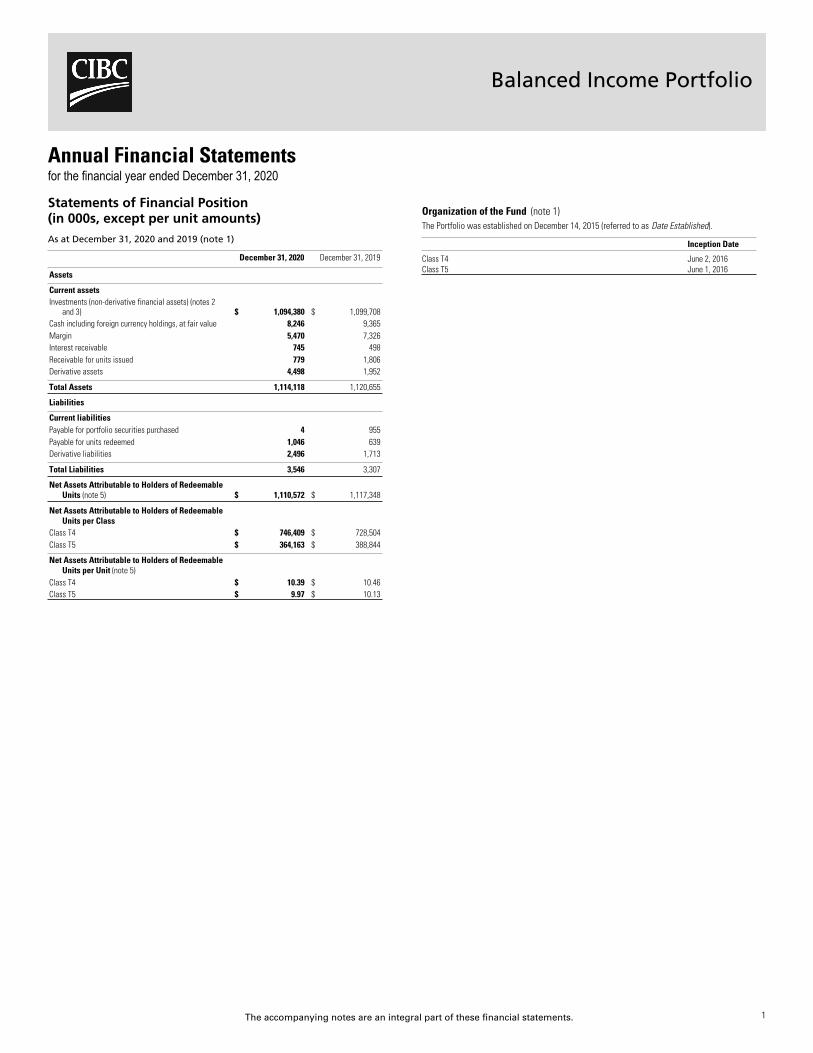
Balanced Income Portfolio
Annual Financial Statements
for the financial year ended December 31, 2020
Statements of Financial Position
(in 000s, except per unit amounts)
As at December 31, 2020 and 2019 (note 1)
December 31, 2020 December 31, 2019
Assets
Current assets
Investments (non-derivative financial assets) (notes 2
and 3) $ 1,094,380 $ 1,099,708
Cash including foreign currency holdings, at fair value 8,246 9,365
Margin 5,470 7,326
Interest receivable 745 498
Receivable for units issued 779 1,806
Derivative assets 4,498 1,952
Total Assets 1,114,118 1,120,655
Liabilities
Current liabilities
Payable for portfolio securities purchased 4 955
Payable for units redeemed 1,046 639
Derivative liabilities 2,496 1,713
Total Liabilities 3,546 3,307
Net Assets Attributable to Holders of Redeemable
Units (note 5) $ 1,110,572 $ 1,117,348
Net Assets Attributable to Holders of Redeemable
Units per Class
Class T4 $ 746,409 $ 728,504
Class T5 $ 364,163 $ 388,844
Net Assets Attributable to Holders of Redeemable
Units per Unit (note 5)
Class T4 $ 10.39 $ 10.46
Class T5 $ 9.97 $ 10.13
Organization of the Fund (note 1)
The Portfolio was established on December 14, 2015 (referred to as Date Established).
Inception Date
Class T4 June 2, 2016
Class T5 June 1, 2016
The accompanying notes are an integral part of these financial statements.
Balanced Income Portfolio
x
x
x
x
x
x
x
x
x
x
x
x
x
x x
x
x
x
x
x
x
x
x
x
x
x
x
x
x
x
x
x
x
x
x
x
x
x
x
x
x
x
x
x
x
x
x
x
x
x
x
x
x
x
x
x
x
x
x
x
x
x
x
x
x
x
x
x
x
x
..
x
x
2
The accompanying notes are an integral part of these financial statements.
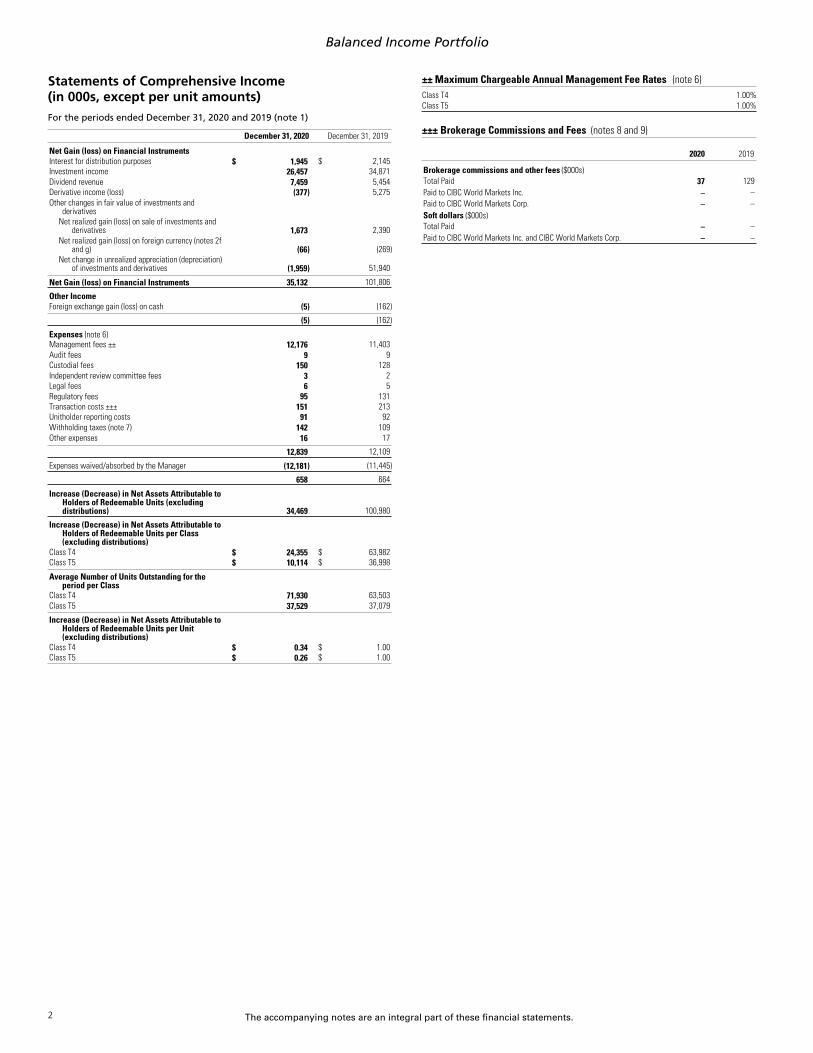
Statements of Comprehensive Income
(in 000s, except per unit amounts)
For the periods ended December 31, 2020 and 2019 (note 1)
December 31, 2020 December 31, 2019
x
Net Gain (loss) on Financial Instruments
Interest for distribution purposes
$ 1,945
$ 2,145
Investment income
26,457
34,871
Dividend revenue
7,459
5,454
Derivative income (loss)
(377)
5,275
Other changes in fair value of investments and
x
derivatives
Net realized gain (loss) on sale of investments and
derivatives
1,673
2,390
Net realized gain (loss) on foreign currency (notes 2f
and g)
(66)
(269)
Net change in unrealized appreciation (depreciation)
of investments and derivatives
(1,959)
51,940
Net Gain (loss) on Financial Instruments 35,132
101,806
x
Other Income
Foreign exchange gain (loss) on cash
(5)
(162)
(5)
(162)
x
Expenses (note 6)
Management fees ±±
12,176
11,403
Audit fees
9
9
Custodial fees
150
128
Independent review committee fees
3
2
Legal fees
6
5
Regulatory fees 95 131
Transaction costs ±±±
151
213
Unitholder reporting costs
91
92
Withholding taxes (note 7)
142
109
Other expenses
16
17
12,839
12,109
Expenses waived/absorbed by the Manager
(12,181)
(11,445)
658
664
Increase (Decrease) in Net Assets Attributable to
Holders of Redeemable Units (excluding
distributions) 34,469
100,980
Increase (Decrease) in Net Assets Attributable to
Holders of Redeemable Units per Class
x
(excluding distributions)
Class T4
$ 24,355
$ 63,982
Class T5
$ 10,114
$ 36,998
Average Number of Units Outstanding for the
x
period per Class
Class T4
71,930
63,503
Class T5
37,529
37,079
Increase (Decrease) in Net Assets Attributable to
Holders of Redeemable Units per Unit
x
(excluding distributions)
Class T4
$ 0.34
$ 1.00
Class T5
$ 0.26
$ 1.00
±± Maximum Chargeable Annual Management Fee Rates (note 6)
Class T4 1.00%
Class T5 1.00%
±±± Brokerage Commissions and Fees (notes 8 and 9)
x
2020 2019
Brokerage commissions and other fees ($000s)
Total Paid
37
129
Paid to CIBC World Markets Inc.
–
–
Paid to CIBC World Markets Corp.
–
–
Soft dollars ($000s)
Total Paid
–
–
Paid to CIBC World Markets Inc. and CIBC World Markets Corp.
–
–
xBalanced Income Portfolio
x
x.
x
x
x.
x.
x.
x.
x.
x
x
x
x
x.
x.
x.
x.
x.
x
x
x
x
x.
x.
x.
x
x
x
x
x.
x.
x.
x.
x.
x.
x
x
x.
x.
x
x
x
x
3
The accompanying notes are an integral part of these financial statements.
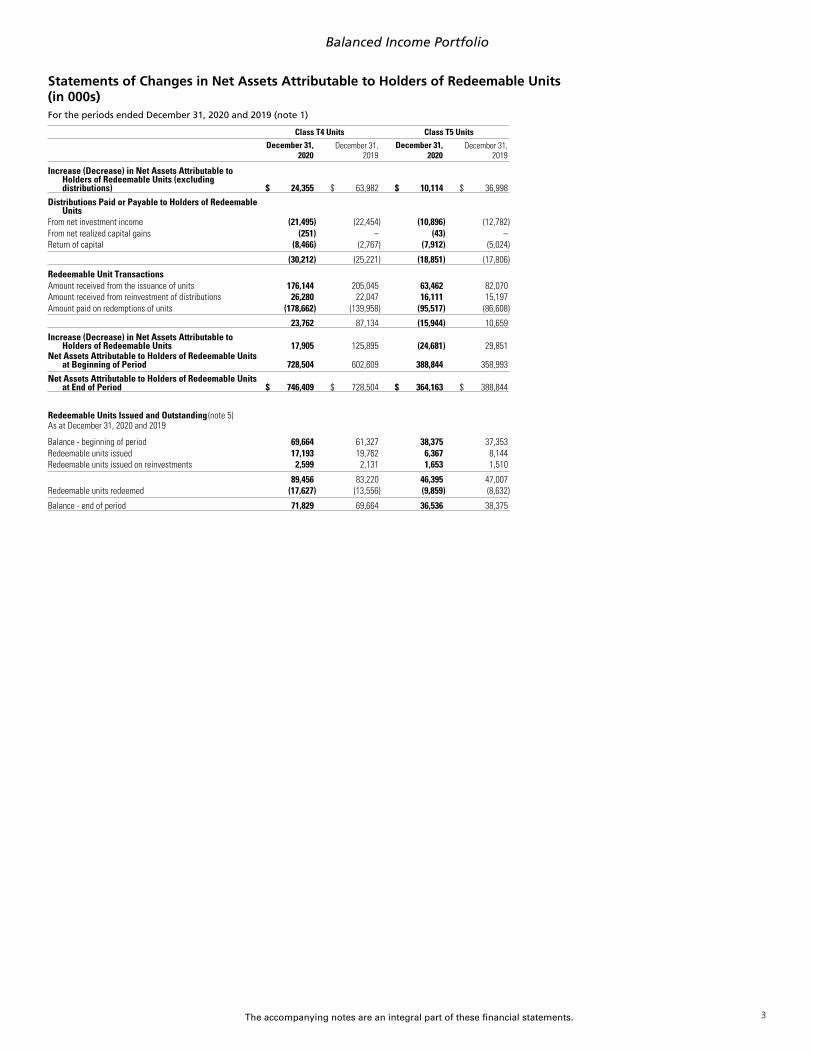
Statements of Changes in Net Assets Attributable to Holders of Redeemable Units
(in 000s)
For the periods ended December 31, 2020 and 2019 (note 1)
Class T4 Units Class T5 Units
December 31,
2020
December 31,
2019
December 31,
2020
December 31,
2019
Increase (Decrease) in Net Assets Attributable to
Holders of Redeemable Units (excluding
distributions) $ 24,355 $ 63,982 $ 10,114 $ 36,998
Distributions Paid or Payable to Holders of Redeemable
Units
From net investment income (21,495) (22,454) (10,896) (12,782)
From net realized capital gains (251) – (43) –
Return of capital (8,466) (2,767) (7,912) (5,024)
(30,212) (25,221) (18,851) (17,806)
Redeemable Unit Transactions
Amount received from the issuance of units 176,144 205,045 63,462 82,070
Amount received from reinvestment of distributions 26,280 22,047 16,111 15,197
Amount paid on redemptions of units (178,662) (139,958) (95,517) (86,608)
23,762 87,134 (15,944) 10,659
Increase (Decrease) in Net Assets Attributable to
Holders of Redeemable Units 17,905 125,895 (24,681) 29,851
Net Assets Attributable to Holders of Redeemable Units
at Beginning of Period 728,504 602,609 388,844 358,993
Net Assets Attributable to Holders of Redeemable Units
at End of Period $ 746,409 $ 728,504 $ 364,163 $ 388,844
Redeemable Units Issued and Outstanding (note 5)
As at December 31, 2020 and 2019
Balance - beginning of period 69,664 61,327 38,375 37,353
Redeemable units issued 17,193 19,762 6,367 8,144
Redeemable units issued on reinvestments 2,599 2,131 1,653 1,510
89,456 83,220 46,395 47,007
Redeemable units redeemed (17,627) (13,556) (9,859) (8,632)
Balance - end of period 71,829 69,664 36,536 38,375

xBalanced Income Portfolio
x
x
x.
x.
x.
x.
x.
x.
x.
x.
x.
x.
x.
x.
x.
x
x
x
x
x.
x.
x.
x.
x.
x
x
x
x
x.
x
x
x.
x
x
x.
x
x
x.
x
x.
x.
4
The accompanying notes are an integral part of these financial statements.
Statements of Cash Flows
(in 000s)
For the periods ended December 31, 2020 and 2019 (note 1)
December 31, 2020 December 31, 2019
Cash Flows from Operating Activities
Increase (Decrease) in Net Assets Attributable to Holders of Redeemable Units from Operations (excluding distributions) $ 34,469 $ 100,980
Adjustments for:
Foreign exchange loss (gain) on cash 5 162
Net realized (gain) loss on sale of investments and derivatives (1,673) (2,390)
Net change in unrealized (appreciation) depreciation of investments and derivatives 1,959 (51,940)
Reinvested distributions from underlying funds (33,183) (39,854)
Purchase of investments (435,871) (685,849)
Proceeds from the sale of investments 471,382 633,085
Margin 1,856 (4,652)
Interest receivable (247) (20)
Dividends receivable – 47
38,697 (50,431)
Cash Flows from Financing Activities
Amount received from the issuance of units 240,633 286,173
Amount paid on redemptions of units (273,772) (226,904)
Distributions paid to unitholders (6,672) (5,783)
(39,811) 53,486
Increase (Decrease) in Cash during the Period (1,114) 3,055
Foreign exchange loss (gain) on cash (5) (162)
Cash (Bank Overdraft) at Beginning of Period 9,365 6,472
Cash (Bank Overdraft) at End of Period $ 8,246 $ 9,365
Interest received $ 1,698 $ 2,125
Dividends received, net of withholding taxes $ 661 $ 453
Balanced Income Portfolio
x
..
..
..
..
..
..
..
..
..
.
.
..
..
..
..
..
.
.
..
..
..
..
.
.
..
..
..
..
.
.
..
..
..
..
..
..
..
.
.
..
.
.
..
.
.
..
..
..
..
..
.
.
..
..
..
..
.
.
..
..
..
..
..
.
.
..
..
..
..
.
.
..
..
..
..
.
.
..
..
..
..
.
.
..
.
.
..
.
.
..
.
.
..
..
..
..
..
..
..
.
.
..
.
..
..
.
.
..
..
5
The accompanying notes are an integral part of these financial statements.
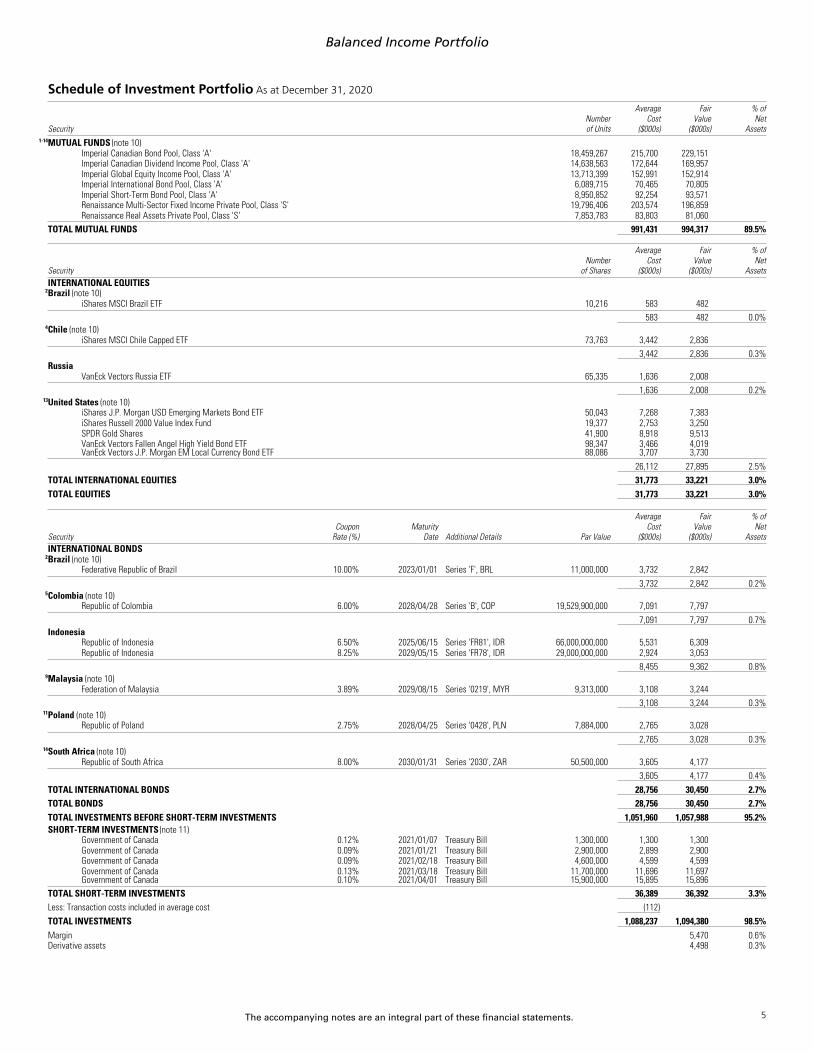
Schedule of Investment Portfolio As at December 31, 2020
Security
Number
of Units
Average
Cost
($000s)
Fair
Value
($000s)
% of
Net
Assets
1-14
MUTUAL FUNDS (note 10)
Imperial Canadian Bond Pool, Class 'A' 18,459,267 215,700 229,151
Imperial Canadian Dividend Income Pool, Class 'A' 14,638,563 172,644 169,957
Imperial Global Equity Income Pool, Class 'A' 13,713,399 152,991 152,914
Imperial International Bond Pool, Class 'A' 6,089,715 70,465 70,805
Imperial Short-Term Bond Pool, Class 'A' 8,950,852 92,254 93,571
Renaissance Multi-Sector Fixed Income Private Pool, Class 'S' 19,796,406 203,574 196,859
Renaissance Real Assets Private Pool, Class 'S' 7,853,783 83,803 81,060
TOTAL MUTUAL FUNDS 991,431 994,317 89.5%
Security
Number
of Shares
Average
Cost
($000s)
Fair
Value
($000s)
% of
Net
Assets
INTERNATIONAL EQUITIES
2
Brazil (note 10)
iShares MSCI Brazil ETF 10,216 583 482
583 482 0.0%
4
Chile (note 10)
iShares MSCI Chile Capped ETF 73,763 3,442 2,836
3,442 2,836 0.3%
Russia
VanEck Vectors Russia ETF 65,335 1,636 2,008
1,636 2,008 0.2%
13
United States (note 10)
iShares J.P. Morgan USD Emerging Markets Bond ETF 50,043 7,268 7,383
iShares Russell 2000 Value Index Fund 19,377 2,753 3,250
SPDR Gold Shares 41,900 8,918 9,513
VanEck Vectors Fallen Angel High Yield Bond ETF 98,347 3,466 4,019
VanEck Vectors J.P. Morgan EM Local Currency Bond ETF 88,086 3,707 3,730
26,112 27,895 2.5%
TOTAL INTERNATIONAL EQUITIES 31,773 33,221 3.0%
TOTAL EQUITIES 31,773 33,221 3.0%
Security
Coupon
Rate (%)
Maturity
Date Additional Details Par Value
Average
Cost
($000s)
Fair
Value
($000s)
% of
Net
Assets
INTERNATIONAL BONDS
2
Brazil (note 10)
Federative Republic of Brazil 10.00% 2023/01/01 Series 'F', BRL 11,000,000 3,732 2,842
3,732 2,842 0.2%
5
Colombia (note 10)
Republic of Colombia 6.00% 2028/04/28 Series 'B', COP 19,529,900,000 7,091 7,797
7,091 7,797 0.7%
Indonesia
Republic of Indonesia 6.50% 2025/06/15 Series 'FR81', IDR 66,000,000,000 5,531 6,309
Republic of Indonesia 8.25% 2029/05/15 Series 'FR78', IDR 29,000,000,000 2,924 3,053
8,455 9,362 0.8%
9
Malaysia (note 10)
Federation of Malaysia 3.89% 2029/08/15 Series '0219', MYR 9,313,000 3,108 3,244
3,108 3,244 0.3%
11
Poland (note 10)
Republic of Poland 2.75% 2028/04/25 Series '0428', PLN 7,884,000 2,765 3,028
2,765 3,028 0.3%
14
South Africa (note 10)
Republic of South Africa 8.00% 2030/01/31 Series '2030', ZAR 50,500,000 3,605 4,177
3,605 4,177 0.4%
TOTAL INTERNATIONAL BONDS 28,756 30,450 2.7%
TOTAL BONDS 28,756 30,450 2.7%
TOTAL INVESTMENTS BEFORE SHORT-TERM INVESTMENTS 1,051,960 1,057,988 95.2%
SHORT-TERM INVESTMENTS (note 11)
Government of Canada 0.12% 2021/01/07 Treasury Bill 1,300,000 1,300 1,300
Government of Canada 0.09% 2021/01/21 Treasury Bill 2,900,000 2,899 2,900
Government of Canada 0.09% 2021/02/18 Treasury Bill 4,600,000 4,599 4,599
Government of Canada 0.13% 2021/03/18 Treasury Bill 11,700,000 11,696 11,697
Government of Canada 0.10% 2021/04/01 Treasury Bill 15,900,000 15,895 15,896
TOTAL SHORT-TERM INVESTMENTS 36,389 36,392 3.3%
Less: Transaction costs included in average cost (112)
TOTAL INVESTMENTS 1,088,237 1,094,380 98.5%
Margin 5,470 0.6%
Derivative assets 4,498 0.3%

Balanced Income Portfolio
Schedule of Investment Portfolio As at December 31, 2020 (cont'd)
..
..
..
..
..
.
.
..
..
x
x
x
..
x
x
..
..
..
..
..
..
..
..
..
..
..
..
..
..
..
..
..
..
..
.
.
..
x
x
..
..
..
..
..
..
..
..
..
..
..
..
..
..
..
..
..
..
..
..
..
..
..
..
..
..
..
..
..
..
..
..
..
..
..
..
..
6
The accompanying notes are an integral part of these financial statements.
Security
Coupon
Rate (%)
Maturity
Date Additional Details Par Value
Average
Cost
($000s)
Fair
Value
($000s)
% of
Net
Assets
Derivative liabilities (2,496) (0.2)%
Other Assets, less Liabilities 8,720 0.8%
TOTAL NET ASSETS ATTRIBUTABLE TO HOLDERS OF
REDEEMABLE UNITS 1,110,572 100.0%
1-14
Hedging reference number. Refers to a corresponding number on the Schedule of Derivative Assets and Liabilities - Forward Foreign Currency Contracts.
Schedule of Derivative Assets and Liabilities - Futures Contracts (note 11)
Contracted
Value ($) Name of Future Expiry Date
Number of
Contracts Currency
Contracted
Price
Fair
Value ($)
Unrealized Gain
(Loss) ($000s)
5,011,960 Australian SPI 200 Index March 2021 31 AUD 6,590.00 4,971,652
(40)
2,157,142 Brent Crude Commodity October 2021 36 USD 47.07 2,325,588
168
1,148,156 Copper Commodity March 2021 11 USD 328.00 1,231,817
84
5,653,948 Euro Stoxx 50 Dividend December 2024 448 EUR 81.16 6,562,510
909
1,858,726 Euro Stoxx Banks March 2021 319 EUR 74.94 1,837,892
(21)
906,482 FTSE 100 Index March 2021 8 GBP 6,509.50 894,019
(12)
1,719,451 FTSE Taiwan Index January 2021 27 USD 1,250.75 1,753,814
34
4,087,500 Hang Seng China Enterprises Index January 2021 48 HKD 10,372.69 4,216,877
129
1,365,822 Iron Ore Commodity January 2021 74 USD 145.00 1,492,137
126
3,597,168 Korean KOSPI 200 Index March 2021 34 KRW 361.16 3,875,971
279
5,220,060 Malaysian Kuala Lumpur Composite Index January 2021 200 MYR 1,649.59 5,158,053
(62)
2,561,106 MSCI Singapore Index January 2021 82 SGD 324.28 2,553,370
(8)
995,646 OMX Stockholm 30 Index January 2021 34 SEK 1,892.80 987,992
(7)
846,124 Polish WIG20 Index March 2021 64 PLN 1,940.00 868,804
23
(12,190,600) Ten-Year Government of Canada Bond March 2021 (82) CAD 148.67 (12,226,200)
(36)
(12,791,611) United States S&P 500 E-Mini Index March 2021 (55) USD 3,654.25 (13,122,581)
(331)
12,147,080 13,381,715
1,235
As at December 31, 2020, $5,241,443 cash was deposited as margin for the futures contracts.
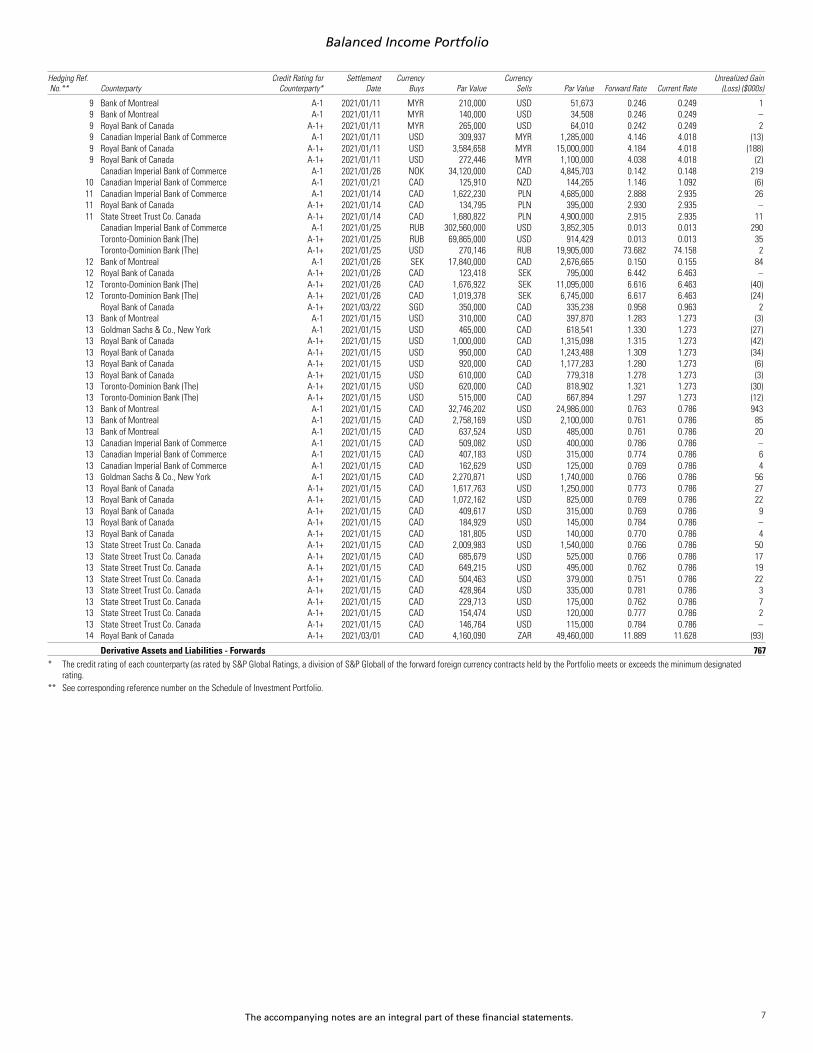
Schedule of Derivative Assets and Liabilities - Forward Foreign Currency Contracts (note 10)
Hedging Ref.
No.** Counterparty
Credit Rating for
Counterparty*
Settlement
Date
Currency
Buys Par Value
Currency
Sells Par Value Forward Rate Current Rate
Unrealized Gain
(Loss) ($000s)
1 Toronto-Dominion Bank (The) A-1+ 2021/03/15 CAD 3,517,971 AUD 3,675,000 1.045 1.019 (90)
2 Royal Bank of Canada A-1+ 2021/03/02 USD 2,845,160 BRL 15,365,000 5.400 5.200 (140)
3 Toronto-Dominion Bank (The) A-1+ 2021/02/26 CAD 2,180,621 CHF 1,520,000 0.697 0.695 (8)
Canadian Imperial Bank of Commerce A-1 2021/03/08 CNY 67,040,000 CAD 13,152,706 0.196 0.195 (111)
4 Royal Bank of Canada A-1+ 2021/01/26 CLP 572,520,000 USD 757,803 0.001 0.001 61
4 Bank of Montreal A-1 2021/01/26 USD 138,866 CLP 106,170,000 764.550 710.570 (13)
4 Royal Bank of Canada A-1+ 2021/01/26 USD 1,153,536 CLP 909,240,000 788.220 710.570 (160)
4 Royal Bank of Canada A-1+ 2021/01/26 USD 833,914 CLP 629,030,000 754.310 710.570 (65)
5 Royal Bank of Canada A-1+ 2021/01/26 COP 4,250,310,000 USD 1,226,995 0.000289 0.000293 22
5 Canadian Imperial Bank of Commerce A-1 2021/01/26 USD 4,447,698 COP 17,143,650,000 3,854.500 3,415.322 (728)
5 Canadian Imperial Bank of Commerce A-1 2021/01/26 USD 164,875 COP 605,090,000 3,670.000 3,415.322 (16)
6 State Street Trust Co. Canada A-1+ 2021/01/14 EUR 890,000 CAD 1,379,909 1.550 1.555 4
6 Toronto-Dominion Bank (The) A-1+ 2021/01/14 EUR 720,000 CAD 1,105,914 1.536 1.555 14
6 Goldman Sachs & Co., New York A-1 2021/01/14 CAD 146,513 EUR 95,000 0.648 0.643 (1)
6 Royal Bank of Canada A-1+ 2021/01/14 CAD 615,882 EUR 400,000 0.649 0.643 (6)
6 Royal Bank of Canada A-1+ 2021/01/14 CAD 148,150 EUR 95,000 0.641 0.643 –
6 Royal Bank of Canada A-1+ 2021/01/14 CAD 116,507 EUR 75,000 0.644 0.643 –
6 State Street Trust Co. Canada A-1+ 2021/01/14 CAD 1,642,789 EUR 1,055,000 0.642 0.643 2
6 State Street Trust Co. Canada A-1+ 2021/01/14 CAD 642,199 EUR 410,000 0.638 0.643 5
7 Canadian Imperial Bank of Commerce A-1 2021/03/08 CAD 1,446,155 HKD 8,685,000 6.006 6.090 20
7 Canadian Imperial Bank of Commerce A-1 2021/03/08 CAD 89,151 HKD 540,000 6.057 6.090 –
Toronto-Dominion Bank (The) A-1+ 2021/03/23 IDR 28,950,645,000 USD 2,029,559 0.000070 0.000071 50
Toronto-Dominion Bank (The) A-1+ 2021/03/23 IDR 6,185,060,000 USD 432,824 0.000070 0.000071 12
Bank of Montreal A-1 2021/03/08 INR 32,160,000 USD 432,432 0.013 0.014 7
Royal Bank of Canada A-1+ 2021/03/08 INR 817,960,000 USD 11,010,365 0.013 0.014 151
8 Royal Bank of Canada A-1+ 2021/02/26 KRW 54,400,000 USD 50,006 0.001 0.001 –
8 Canadian Imperial Bank of Commerce A-1 2021/02/26 USD 1,675,092 KRW 1,870,290,000 1,116.530 1,088.020 (56)
8 Royal Bank of Canada A-1+ 2021/02/26 USD 136,605 KRW 149,220,000 1,092.350 1,088.020 (1)
8 Royal Bank of Canada A-1+ 2021/02/26 USD 101,493 KRW 110,500,000 1,088.750 1,088.020 –
8 Toronto-Dominion Bank (The) A-1+ 2021/02/26 USD 254,140 KRW 276,220,000 1,086.880 1,088.020 –
Royal Bank of Canada A-1+ 2021/01/14 MXN 146,020,000 CAD 8,911,590 0.061 0.064 419
Royal Bank of Canada A-1+ 2021/01/14 CAD 1,336,954 MXN 21,690,000 16.223 15.650 (49)
Royal Bank of Canada A-1+ 2021/01/14 CAD 1,101,547 MXN 17,285,000 15.692 15.650 (3)
Toronto-Dominion Bank (The) A-1+ 2021/01/14 CAD 159,993 MXN 2,530,000 15.813 15.650 (2)
Royal Bank of Canada A-1+ 2021/02/12 PEN 2,970,000 USD 825,826 0.278 0.276 (7)
Royal Bank of Canada A-1+ 2021/02/12 USD 826,515 PEN 2,970,000 3.593 3.619 7
9 Bank of Montreal A-1 2021/01/11 MYR 325,000 USD 77,966 0.240 0.249 4
Balanced Income Portfolio
..
..
..
..
..
..
..
..
..
..
..
..
..
..
..
..
..
..
..
..
..
..
..
..
..
..
..
..
..
..
..
..
..
..
..
..
..
..
..
..
..
..
..
..
..
..
..
..
..
..
..
.
.
..
7
The accompanying notes are an integral part of these financial statements.
Hedging Ref.
No.** Counterparty
Credit Rating for
Counterparty*
Settlement
Date
Currency
Buys Par Value
Currency
Sells Par Value Forward Rate Current Rate
Unrealized Gain
(Loss) ($000s)
9 Bank of Montreal A-1 2021/01/11 MYR 210,000 USD 51,673 0.246 0.249 1
9 Bank of Montreal A-1 2021/01/11 MYR 140,000 USD 34,508 0.246 0.249 –
9 Royal Bank of Canada A-1+ 2021/01/11 MYR 265,000 USD 64,010 0.242 0.249 2
9 Canadian Imperial Bank of Commerce A-1 2021/01/11 USD 309,937 MYR 1,285,000 4.146 4.018 (13)
9 Royal Bank of Canada A-1+ 2021/01/11 USD 3,584,658 MYR 15,000,000 4.184 4.018 (188)
9 Royal Bank of Canada A-1+ 2021/01/11 USD 272,446 MYR 1,100,000 4.038 4.018 (2)
Canadian Imperial Bank of Commerce A-1 2021/01/26 NOK 34,120,000 CAD 4,845,703 0.142 0.148 219
10 Canadian Imperial Bank of Commerce A-1 2021/01/21 CAD 125,910 NZD 144,265 1.146 1.092 (6)
11 Canadian Imperial Bank of Commerce A-1 2021/01/14 CAD 1,622,230 PLN 4,685,000 2.888 2.935 26
11 Royal Bank of Canada A-1+ 2021/01/14 CAD 134,795 PLN 395,000 2.930 2.935 –
11 State Street Trust Co. Canada A-1+ 2021/01/14 CAD 1,680,822 PLN 4,900,000 2.915 2.935 11
Canadian Imperial Bank of Commerce A-1 2021/01/25 RUB 302,560,000 USD 3,852,305 0.013 0.013 290
Toronto-Dominion Bank (The) A-1+ 2021/01/25 RUB 69,865,000 USD 914,429 0.013 0.013 35
Toronto-Dominion Bank (The) A-1+ 2021/01/25 USD 270,146 RUB 19,905,000 73.682 74.158 2
12 Bank of Montreal A-1 2021/01/26 SEK 17,840,000 CAD 2,676,665 0.150 0.155 84
12 Royal Bank of Canada A-1+ 2021/01/26 CAD 123,418 SEK 795,000 6.442 6.463 –
12 Toronto-Dominion Bank (The) A-1+ 2021/01/26 CAD 1,676,922 SEK 11,095,000 6.616 6.463 (40)
12 Toronto-Dominion Bank (The) A-1+ 2021/01/26 CAD 1,019,378 SEK 6,745,000 6.617 6.463 (24)
Royal Bank of Canada A-1+ 2021/03/22 SGD 350,000 CAD 335,238 0.958 0.963 2
13 Bank of Montreal A-1 2021/01/15 USD 310,000 CAD 397,870 1.283 1.273 (3)
13 Goldman Sachs & Co., New York A-1 2021/01/15 USD 465,000 CAD 618,541 1.330 1.273 (27)
13 Royal Bank of Canada A-1+ 2021/01/15 USD 1,000,000 CAD 1,315,098 1.315 1.273 (42)
13 Royal Bank of Canada A-1+ 2021/01/15 USD 950,000 CAD 1,243,488 1.309 1.273 (34)
13 Royal Bank of Canada A-1+ 2021/01/15 USD 920,000 CAD 1,177,283 1.280 1.273 (6)
13 Royal Bank of Canada A-1+ 2021/01/15 USD 610,000 CAD 779,318 1.278 1.273 (3)
13 Toronto-Dominion Bank (The) A-1+ 2021/01/15 USD 620,000 CAD 818,902 1.321 1.273 (30)
13 Toronto-Dominion Bank (The) A-1+ 2021/01/15 USD 515,000 CAD 667,894 1.297 1.273 (12)
13 Bank of Montreal A-1 2021/01/15 CAD 32,746,202 USD 24,986,000 0.763 0.786 943
13 Bank of Montreal A-1 2021/01/15 CAD 2,758,169 USD 2,100,000 0.761 0.786 85
13 Bank of Montreal A-1 2021/01/15 CAD 637,524 USD 485,000 0.761 0.786 20
13 Canadian Imperial Bank of Commerce A-1 2021/01/15 CAD 509,082 USD 400,000 0.786 0.786 –
13 Canadian Imperial Bank of Commerce A-1 2021/01/15 CAD 407,183 USD 315,000 0.774 0.786 6
13 Canadian Imperial Bank of Commerce A-1 2021/01/15 CAD 162,629 USD 125,000 0.769 0.786 4
13 Goldman Sachs & Co., New York A-1 2021/01/15 CAD 2,270,871 USD 1,740,000 0.766 0.786 56
13 Royal Bank of Canada A-1+ 2021/01/15 CAD 1,617,763 USD 1,250,000 0.773 0.786 27
13 Royal Bank of Canada A-1+ 2021/01/15 CAD 1,072,162 USD 825,000 0.769 0.786 22
13 Royal Bank of Canada A-1+ 2021/01/15 CAD 409,617 USD 315,000 0.769 0.786 9
13 Royal Bank of Canada A-1+ 2021/01/15 CAD 184,929 USD 145,000 0.784 0.786 –
13 Royal Bank of Canada A-1+ 2021/01/15 CAD 181,805 USD 140,000 0.770 0.786 4
13 State Street Trust Co. Canada A-1+ 2021/01/15 CAD 2,009,983 USD 1,540,000 0.766 0.786 50
13 State Street Trust Co. Canada A-1+ 2021/01/15 CAD 685,679 USD 525,000 0.766 0.786 17
13 State Street Trust Co. Canada A-1+ 2021/01/15 CAD 649,215 USD 495,000 0.762 0.786 19
13 State Street Trust Co. Canada A-1+ 2021/01/15 CAD 504,463 USD 379,000 0.751 0.786 22
13 State Street Trust Co. Canada A-1+ 2021/01/15 CAD 428,964 USD 335,000 0.781 0.786 3
13 State Street Trust Co. Canada A-1+ 2021/01/15 CAD 229,713 USD 175,000 0.762 0.786 7
13 State Street Trust Co. Canada A-1+ 2021/01/15 CAD 154,474 USD 120,000 0.777 0.786 2
13 State Street Trust Co. Canada A-1+ 2021/01/15 CAD 146,764 USD 115,000 0.784 0.786 –
14 Royal Bank of Canada A-1+ 2021/03/01 CAD 4,160,090 ZAR 49,460,000 11.889 11.628 (93)
Derivative Assets and Liabilities - Forwards 767
* The credit rating of each counterparty (as rated by S&P Global Ratings, a division of S&P Global) of the forward foreign currency contracts held by the Portfolio meets or exceeds the minimum designated
rating.
..
** See corresponding reference number on the Schedule of Investment Portfolio.

Balanced Income Portfolio
x
x
..
..
..
..
..
..
.
.
..
..
..
..
..
..
.
.
x
x
..
..
. x
x
x
x
..
x .
x
8
The accompanying notes are an integral part of these financial statements.
Supplemental Schedule to Schedule of Investment Portfolio
Offsetting Arrangements (note 2d)
(in 000s)
The Portfolio may enter into various master netting arrangements or other similar agreements that do not meet the criteria for offsetting in the Statements of Financial Position but still
allow for the related amounts to be set off in certain circumstances, such as bankruptcy or the termination of the contracts.
The following table reconciles the net amount of “Over-The-Counter” derivatives presented in the Statements of Financial Position, as at December 31, 2020 and 2019, to:
• The gross amount before offsetting required under IFRS; and
• The net amount after offsetting under the terms of master netting arrangements or other similar arrangements, but which do not meet the criteria for offsetting under IFRS.
Financial Assets and Liabilities Amounts Offset Amounts Not Offset Net
Gross Assets
(Liabilities)
Amounts Offset Under
IFRS
Net Amounts
Presented on
Statements of
Financial Position
Master Netting
Arrangements
Cash Collateral
Received
As at December 31, 2020
OTC Derivative Assets $ 2,746 $ – $ 2,746 $ (1,448) $ – $ 1,298
OTC Derivative Liabilities (1,979) – (1,979) 1,448 – (531)
Total $ 767 $ – $ 767 $ – $ – $ 767
As at December 31, 2019
OTC Derivative Assets $ 1,392 $ – $ 1,392 $ (923) $ – $ 469
OTC Derivative Liabilities (1,002) – (1,002) 923 – (79)
Total $ 390 $ – $ 390 $ – $ – $ 390
Interests in Underlying Funds (note 4)
The following table presents additional information on the Portfolio’s investments in underlying funds where the ownership interest exceeds 20% of each underlying fund as at
December 31, 2020 and 2019:
The Renaissance Investment family of funds are mutual fund trusts organized under the laws of Ontario and the address of the funds' registered office is Brookfield Place, 161 Bay
Street, 22nd Floor, Toronto, Ontario, M5J 2S1.
As at December 31, 2020
Holding % of Net Assets
Country of Establishment &
Principal Place of Business
% of
Ownership
Interest
Renaissance Multi-Sector Fixed Income
Private Pool 17.7 Canada 44.3
Renaissance Real Assets Private Pool 7.3 Canada 20.0
As at December 31, 2019
Holding % of Net Assets
Country of Establishment &
Principal Place of Business
% of
Ownership
Interest
Renaissance Multi-Sector Fixed Income
Private Pool 17.9 Canada 46.0

Balanced Income Portfolio
x
x
x
x
x
x
x
x
x
x
x
x
x
x
x
x
x
x
x
x
x
x
x
x
x
x
x
x
x
x
x
x
x
x
x
x
x
x
x
x
x
x
.
x
x
x
x
x
x
x
x
x
x
x
x
x
x
x
x
x
.
.
x
x
x
x
x
x
x
x
x
x
x
x
x
x
9
The accompanying notes are an integral part of these financial statements.
Financial Instrument Risks
Investment Objective: Balanced Income Portfolio (referred to as the Portfolio) seeks to
provide a balance of income and capital appreciation potential by investing primarily in
units of Canadian and global mutual funds.
Investment Strategies: The Portfolio invests primarily in units of mutual funds managed
by the Manager or its affiliates. The Portfolio has, under normal market conditions, a
long-term strategic asset mix of fixed income (45%-75%) and equities (25%-55%). The
portfolio advisor may review and adjust the asset mix, in its sole discretion, depending
on economic conditions and relative value of income and equity securities.
As the Portfolio invests in the Underlying Funds, it may be indirectly exposed to
concentration, credit, currency, and interest rate risks from these holdings. Only direct
exposure to significant risks that are relevant to the Portfolio is discussed here. General
information on risk management and specific discussion on concentration, credit,
currency, interest rate, liquidity, and other price/market risk can be found in note 2 of
the financial statements.
In the following risk tables, Net Assets is defined as meaning “Net assets attributable
to holders of redeemable units".
Concentration Risk as at December 31, 2020 and 2019
The Schedule of Investment Portfolio presents the securities held by the Portfolio as at
December 31, 2020.
The following table presents the investment sectors held by the Portfolio as at
December 31, 2019 and groups the securities by asset type, industry sector, geographic
region, or currency exposure:
As at December 31, 2019
Portfolio Breakdown
% of Net
Assets
International Equities
Chile 0.3
Israel 0.2
Russia 0.1
United States 1.0
International Bonds
Brazil 0.2
Chile 0.6
Colombia 0.4
Indonesia 0.3
Malaysia 0.1
Poland 0.2
Mutual Funds
Canadian Bond 29.2
Canadian Equity 15.3
International Bond 24.2
International Equity 20.7
Short-Term Investments 5.6
Margin 0.7
Other Assets, less Liabilities 0.9
Total 100.0
Credit Risk
Credit ratings represent a consolidation of the ratings provided by various outside
service providers and are subject to change, which could be material.
See the Schedule of Investment Portfolio for counterparties related to over-the-counter
derivative contracts, where applicable.
As at December 31, 2020 and 2019, the Portfolio invested in debt securities with the
following credit ratings:
% of Net Assets
Debt Securities by Credit Rating (note 2b) December 31, 2020 December 31, 2019
'AAA' 3.3 5.6
'A' 0.3 1.0
'BBB' 1.8 0.6
Below 'BBB' 0.6 0.2
Total 6.0 7.4
Currency Risk
The tables that follow indicate the currencies to which the Portfolio had significant
exposure as at December 31, 2020 and 2019, based on the market value of the
Portfolio's financial instruments (including cash and cash equivalents) and the
underlying principal amounts of forward foreign currency contracts, as applicable.
As at December 31, 2020
Currency (note 2m)
Total Currency
Exposure* ($000s)
% of
Net Assets
INR 14,720 1.3
IDR 13,174 1.2
CNY 13,042 1.2
MXN 6,884 0.6
RUB 6,050 0.5
NOK 5,065 0.5
USD (12,646) (1.1)
* Amounts reflect the carrying value of monetary and non-monetary items (including the notional
amount of forward foreign currency contracts, if any).
As at December 31, 2019
Currency (note 2m)
Total Currency
Exposure* ($000s)
% of
Net Assets
INR 10,487 0.9
IDR 9,413 0.8
MXN 6,471 0.6
RUB 5,202 0.5
EUR (8,474) (0.8)
* Amounts reflect the carrying value of monetary and non-monetary items (including the notional
amount of forward foreign currency contracts, if any).
The table that follows indicates how net assets as at December 31, 2020 and 2019
would have decreased or increased had the Canadian dollar strengthened or weakened
by 1% in relation to all foreign currencies. This analysis assumes that all other variables
remain unchanged. In practice, the actual results may differ from this analysis and the
difference could be material.
December 31, 2020 December 31, 2019
Impact on Net Assets ($000s) 425 234
Interest Rate Risk
The Portfolio’s short-term assets and liabilities were not subject to significant amounts
of risk due to fluctuations in the prevailing level of market interest rates.
The table that follows indicates the Portfolio’s exposure to fixed income securities by
remaining term-to-maturity.
Remaining Term-to-Maturity
December 31, 2020
($000s)
December 31, 2019
($000s)
1-3 years 2,842 –
3-5 years 6,309 2,742
> 5 years 21,299 17,792
Total 30,450 20,534
The table that follows indicates how net assets as at December 31, 2020 and 2019
would have increased or decreased had the interest rate decreased or increased by 25
basis points and assuming a parallel shift in the yield curve. This change is estimated
using the weighted average duration of the fixed income portfolio. This analysis
assumes that all other variables remain unchanged. In practice, actual results may differ
from this analysis and the difference could be material.
December 31, 2020 December 31, 2019
Impact on Net Assets ($000s) 416 354

Balanced Income Portfolio
x
x
x
x
x
x
x
x
x
x
x
x
x
x
x
x
x
x
x
x
x
x
x
x
x
x
x
x
x
x
x
x
x
x
x
x
D
x
x
x
x
x
x
x
x
x
x
x
x
x
x
x
x
x
x
x
x
x
10
The accompanying notes are an integral part of these financial statements.
Liquidity Risk
Liquidity risk is the risk that the Portfolio will encounter difficulty in meeting obligations
associated with financial liabilities. The Portfolio is exposed to daily cash redemptions
of redeemable units. The Portfolio maintains sufficient cash on hand to fund anticipated
redemptions.
With the exception of derivative contracts, where applicable, all of the Portfolio’s
financial liabilities are short-term liabilities maturing within 90 days after the period
end.
For portfolios that hold derivative contracts with a term-to-maturity that exceeds 90
days from the period end, further information related to those contracts can be
referenced in the derivative schedules following the Schedule of Investment Portfolio.
Other Price/Market Risk
The table that follows indicates how net assets as at December 31, 2020 and 2019
would have increased or decreased had the value of the Portfolio’s benchmark(s)
increased or decreased by 1%. This change is estimated based on the historical
correlation between the return of Class T4 units of the Portfolio as compared to the
return of the Portfolio’s benchmark(s), using 36 monthly data points, as available, based
on the monthly net returns of the Portfolio. This analysis assumes that all other
variables remain unchanged. The historical correlation may not be representative of the
future correlation and, accordingly, the impact on net assets could be materially
different.
During the period, the Portfolio's blended benchmark was changed to better reflect the
Portfolio's strategic asset mix. The Current Blended Benchmark and Previous Blended
Benchmark are outlined in the table below.
Impact on Net Assets ($000s)
Benchmark ecember 31, 2020 December 31, 2019
FTSE Canada Universe Bond Index
9,791 6,304
20.7% FTSE Canada Universe Bond Index
18% Bloomberg Barclays U.S. Aggregate Bond Index
15.3% S&P/TSX Composite Dividend Index
13.5% MSCI World High Dividend Yield Index
10% FTSE Canada 91 Day T-Bill Index
9% FTSE Canada Short Term Overall Bond Index
6.3% FTSE World Government Bond Index (Hedged to
CAD)
3.6% Dow Jones Brookfield Global Infrastructure Index
2.9% FTSE EPRA/NAREIT Developed Real Estate Index
(Net)
0.5% Bank of America Merrill Lynch Global High Yield
Index
0.2% Bank of America Merrill Lynch Global Broad
Market Corporate Index
(referred to as Current Blended Benchmark)
14,297 n/a
20.7% FTSE Canada Universe Bond Index
18% Bloomberg Barclays U.S. Aggregate Bond Index
15.3% S&P/TSX Composite Dividend Index
13.5% MSCI World Index
10% FTSE Canada 91 Day T-Bill Index
9% FTSE Canada Short Term Overall Bond Index
6.3% FTSE World Government Bond Index (Hedged to
CAD)
3.6% Dow Jones Brookfield Global Infrastructure Index
2.9% FTSE EPRA/NAREIT Developed Real Estate Index
(Net)
0.5% Bank of America Merrill Lynch Global High Yield
Index
0.2% Bank of America Merrill Lynch Global Broad
Market Corporate Index
(referred to as Previous Blended Benchmark)
n/a 11,006
Fair Value Measurement of Financial Instruments
The following is a summary of the inputs used as at December 31, 2020 and 2019 in
valuing the Portfolio’s financial assets and financial liabilities, carried at fair value:
As at December 31, 2020
Classification
Level 1 (i)
($000s)
Level 2 (ii)
($000s)
Level 3 (iii)
($000s)
Total
($000s)
Financial Assets
x
Fixed Income Securities – 30,450 – 30,450
Short-Term Investments – 36,392 – 36,392
Equities 33,221 – – 33,221
Mutual Funds 994,317 – – 994,317
Derivative assets 1,752 2,746 – 4,498
Total Financial Assets 1,029,290 69,588 – 1,098,878
Financial Liabilities
x
Derivative liabilities (517) (1,979) – (2,496)
Total Financial Liabilities (517) (1,979) – (2,496)
Total Financial Assets and Liabilities 1,028,773 67,609 – 1,096,382
(i) Quoted prices in active markets for identical assets
(ii) Significant other observable inputs
(iii) Significant unobservable inputs
As at December 31, 2019
Classification
Level 1 (i)
($000s)
Level 2 (ii)
($000s)
Level 3 (iii)
($000s)
Total
($000s)
Financial Assets
x
Fixed Income Securities – 20,534 – 20,534
Short-Term Investments – 62,172 – 62,172
Equities 18,215 – – 18,215
Mutual Funds 998,787 – – 998,787
Derivative assets 265 1,687 – 1,952
Total Financial Assets 1,017,267 84,393 – 1,101,660
Financial Liabilities
x
Derivative liabilities (631) (1,082) – (1,713)
Total Financial Liabilities (631) (1,082) – (1,713)
Total Financial Assets and Liabilities 1,016,636 83,311 – 1,099,947
(i) Quoted prices in active markets for identical assets
(ii) Significant other observable inputs
(iii) Significant unobservable inputs
Transfer of assets between Level 1 and Level 2
Financial assets and liabilities transferred from Level 1 to Level 2 are the result of
securities no longer being traded in an active market.
For the periods ended December 31, 2020 and 2019, there were no transfers of financial
assets and liabilities from Level 1 to Level 2.
Financial assets and liabilities transferred from Level 2 to Level 1 are the result of
securities now being traded in an active market.
For the periods ended December 31, 2020 and 2019, there were no transfers of financial
assets and liabilities from Level 2 to Level 1.
Reconciliation of financial asset and liability movement – Level 3
The Portfolio did not hold any Level 3 investments at the beginning of, during, or at the
end of either reporting period.

x
x
11
Notes to Financial Statements
x
As at and for the periods as disclosed in the financial statements (note 1)
1. Organization of the Funds and Financial Reporting Periods
The Imperial Pools consist of Imperial Money Market Pool, Imperial Short-Term Bond Pool, Imperial Canadian Bond Pool, Imperial Canadian Diversified Income Pool, Imperial International Bond Pool, Imperial Equity
High Income Pool, Imperial Canadian Dividend Income Pool, Imperial Global Equity Income Pool, Imperial Canadian Equity Pool, Imperial U.S. Equity Pool, Imperial International Equity Pool, Imperial Overseas Equity
Pool, and Imperial Emerging Economies Pool (referred to as individually, a Pool, and collectively, the Pools).
The Income Generation Portfolios consist of Conservative Income Portfolio, Balanced Income Portfolio and Enhanced Income Portfolio (referred to as individually, a Portfolio, and collectively, the Portfolios).
Each of the Imperial Pools and Income Generation Portfolios (referred to as individually, a Fund, and collectively, the Funds) is a mutual fund trust organized under the laws of Ontario and governed by a declaration
of trust (referred to as Declaration of Trust). The address of the Funds' head office is Brookfield Place, 161 Bay Street, 22
nd
Floor, Toronto, Ontario.
Canadian Imperial Bank of Commerce (referred to as CIBC) is the manager (referred to as the Manager) of the Funds and CIBC Trust Corporation is the trustee (referred to as the Trustee) of the Funds. Each Fund
may issue an unlimited number of classes of units and an unlimited number of units of each class. As at the date of these financial statements, each of the Pools offer Class A units for sale and the Imperial Equity
High Income Pool, Imperial Canadian Dividend Income Pool and the Imperial Global Equity Income Pool also offer Class W units for sale. The Conservative Income Portfolio offers Class T3 and Class T4 units, the
Balanced Income Portfolio offers Class T4 and Class T5 units, and the Enhanced Income Portfolio offers Class T5 and Class T6 units for sale.
The date upon which each Fund was established by Declaration of Trust (referred to as Date Established) and the date upon which units of each Fund was first sold to the public (referred to as Inception Date) are
reported in the footnote Organization of the Fund on the Statements of Financial Position.
The Schedule of Investment Portfolio of each Fund is as at December 31, 2020. The Statements of Financial Position of each of the Funds are as at December 31, 2020 and 2019. The Statements of Comprehensive
Income, Statements of Changes in Net Assets Attributable to Holders of Redeemable Units, and Statements of Cash Flows of each of the Funds are for the years ended December 31, 2020 and 2019, except for
Funds established during either year, in which case the information presented is from the Date Established or the Inception Date to December 31, 2020 and 2019.
These financial statements were approved for issuance by the Manager on March 10, 2021.
2. Summary of Significant Accounting Policies
These financial statements have been prepared in accordance with International Financial Reporting Standards (referred to as IFRS) as published by the International Accounting Standards Board.
The financial statements have been prepared on a going concern basis using the historical cost convention. However, each Fund is an investment entity and primarily all financial assets and financial liabilities are
measured at fair value in accordance with IFRS. Accordingly, the Funds’ accounting policies for measuring the fair value of investments and derivatives are consistent with those used in measuring the Net Asset
Value for transactions with unitholders. In applying IFRS, these financial statements include estimates and assumptions made by management that affect the reported amounts of assets, liabilities, income, and
expenses during the reporting periods. However, existing circumstances and assumptions may change due to market changes or circumstances arising beyond the control of the Funds. Such changes are reflected
in the assumptions when they occur.
These financial statements have been presented in Canadian dollars, which is the Funds’ functional currency (unless otherwise noted).
a) Financial Instruments
Classification and recognition of financial instruments
Under IFRS 9 Financial Instruments, the Funds classify financial assets into one of three categories based on the entity’s business model for managing financial assets and the contractual cash flow characteristics
of the financial assets. Those categories are:
• Amortized Cost - Assets held within a business model whose objective is to collect cash flows and where the contractual cash flows of the assets are solely payments of principal and interest (referred
to as SPPI criterion). Amortization of the asset is calculated utilizing the Effective Interest Rate Method.
• Fair Value Through Other Comprehensive Income (referred to as FVOCI) - Financial assets such as debt instruments that meet the SPPI criterion and are held within a business model with objectives that
include both collecting the associated contractual cash flows and selling financial assets. Gains and losses are reclassified to profit or loss upon derecognition for debt instruments but remain in other
comprehensive income for equity instruments.
• Fair Value Through Profit or Loss (referred to as FVTPL) - A financial asset is measured at FVTPL unless it is measured at Amortized Cost or FVOCI. Derivative contracts are measured at FVTPL. For all
instruments classified as FVTPL, the gains and losses are recognized in profit or loss.
Financial liabilities are classified at FVTPL when they meet the definition of held-for-trading or when they are designated as FVTPL on initial recognition using the fair value option.
The Manager has assessed the business models of the Funds and has determined that the Funds’ portfolio of financial assets and financial liabilities are managed and performance is evaluated on a fair value
basis in accordance with the Funds’ risk management and investment strategies; therefore, classification and measurement of financial assets is FVTPL.
All Funds have contractual obligations to distribute cash to the unitholders. As a result, each Fund's obligation for net assets attributable to holders of redeemable units represents a financial liability and is
presented at the redemption amount.
b) Risk Management
The Funds’ overall risk management approach includes formal guidelines that govern the extent of exposure to various types of risk, including diversification within asset classes and limits on the exposure to
individual investments and counterparties. In addition, derivative financial instruments may be used to manage certain risk exposures. The Manager also has various internal controls to oversee the Funds’
investment activities, including monitoring compliance with the investment objectives and strategies, internal guidelines, and securities regulations. Please refer to each Fund's Supplemental Schedule to Schedule
of Investment Portfolio for specific risk disclosures.
Fair value of financial instruments by using valuation techniques
Financial instruments are valued at their fair value, which is defined as the price that would be received to sell an asset or paid to transfer a liability in an orderly transaction between market participants at the
measurement date. Refer to note 3a to 3f for valuation of each specific type of financial instrument held by the Funds. The fair value of financial assets and liabilities traded in active markets are based on quoted
market prices at the close of trading on the reporting date. The Funds use the last traded market price for both financial assets and financial liabilities where the last traded price falls within that day’s bid-ask
spread. In circumstances where the last traded price is not within the bid-ask spread, the Manager determines the price that is most representative of fair value based on the specific facts and circumstances.
For financial assets and financial liabilities that are not traded in an active market, fair value is determined using valuation techniques.
The Funds classify fair value measurement within a hierarchy, which gives the highest priority to unadjusted quoted prices in active markets for identical assets or liabilities (referred to as Level 1) and the lowest
priority to unobservable inputs (referred to as Level 3). The three levels of the fair value hierarchy are:
Level 1: Quoted prices (unadjusted) in active markets for identical assets or liabilities that the entity can access at the measurement date;
Level 2: Inputs other than quoted prices included within Level 1 that are observable for the asset or liability, either directly or indirectly; and
Level 3: Inputs are unobservable for the asset or liability.
If inputs are used to measure an asset’s or liability’s fair value, the classification within the hierarchy is based on the lowest level input that is significant to the fair value measurement. Each Fund’s fair value
hierarchy classification of its assets and liabilities is included in the Supplemental Schedule to Schedule of Investment Portfolio.
The carrying values of all non-investment assets and liabilities approximate their fair values due to their short-term nature. Fair values are classified as Level 1 when the related security or derivative is actively
traded and a quoted price is available. If an instrument classified as Level 1 subsequently ceases to be actively traded, it is transferred out of Level 1. In such cases, instruments are reclassified into Level 2, unless
the measurement of its fair value requires the use of significant unobservable inputs, in which case it is classified as Level 3.

p / 2 Notes to Financial Statements
12
The Manager is responsible for performing the fair value measurements included in the financial statements of a Fund, including the Level 3 measurements. The Manager obtains pricing from third-party pricing
vendors and the pricing is reviewed daily. At each financial reporting date, the Manager reviews and approves all Level 3 fair value measurements. The Funds also have a Valuation Committee that meets quarterly
to perform detailed reviews of the valuations of investments held by the Funds, which includes discussion on Level 3 measurements.
Credit risk
Credit risk is the risk that a counterparty to a financial instrument, such as a fixed income security or a derivative contract, will fail to discharge an obligation or commitment that it has entered into with the Funds.
The value of fixed income securities and derivatives as presented on the Schedule of Investment Portfolio includes consideration of the creditworthiness of the issuer and, accordingly, represents the maximum
credit risk exposure of the Funds. Certain Funds may invest in short-term fixed income securities issued or guaranteed primarily by the Government of Canada or any Canadian provincial government, obligations of
Canadian chartered banks or trust companies, and commercial paper with approved credit ratings. The risk of default on these short-term fixed income securities is considered low and these securities primarily
have credit ratings of "A-1 (Low)" or higher (as rated by S&P Global Ratings, a division of S&P Global, or equivalent rating from another rating service).
The bond ratings noted in the Funds’ ‘Financial Instruments Risk’ under sub-section ‘Credit Risk’ represent ratings collected and disseminated by recognized third-party vendors. These ratings utilized by the
Manager, while obtained from vendors skilled and recognized for bond rating services, may not be the same as those used directly by the portfolio advisor or portfolio sub-advisors. Ratings used by the portfolio
advisor or portfolio sub-advisors could be higher or lower than those used for risk disclosure in the financial statements in compliance with their investment policy guidelines.
The Funds may engage in securities lending transactions. The credit risk related to securities lending transactions is limited by the fact that the value of cash or securities held as collateral by the Funds in
connection with these transactions is at least 102% of the fair value of the securities loaned. The collateral and loaned securities are marked to market on each business day. Further information regarding the
collateral and securities on loan can be found in the footnotes to the Statements of Financial Position and in note 2j.
Currency risk
Currency risk is the risk that the value of an investment will fluctuate due to changes in foreign exchange rates. Mutual funds may invest in securities denominated or traded in currencies other than the Funds’
reporting currency.
Interest rate risk
Prices of fixed income securities generally increase when interest rates decline and decrease when interest rates rise. This risk is known as interest rate risk. Prices of longer-term fixed income securities will
generally fluctuate more in response to interest rate changes than would shorter-term securities. Due to the nature of short-term fixed income securities with a remaining term-to-maturity of less than one year,
these investments are not generally exposed to a significant risk that their value will fluctuate in response to changes in the prevailing levels of market interest rates.
Liquidity risk
The Funds are exposed to daily cash redemptions of redeemable units. Generally, the Funds retain sufficient cash and cash equivalent positions to maintain adequate liquidity. However, liquidity risk also involves
the ability to sell an asset for cash easily and at a fair price. Some securities are illiquid due to legal restrictions on their resale, the nature of the investment, or simply a lack of interested buyers for a particular
security or security type. Certain securities may become less liquid due to changes in market conditions, such as interest rate changes or market volatility, which could impair the ability of a Fund to sell such
securities quickly or at a fair price. Difficulty in selling securities could result in a loss or lower return for a Fund.
Other price/market risk
Other price/market risk is the risk that the value of investments will fluctuate as a result of changes in market conditions. Several factors can influence market trends, such as economic developments, changes in
interest rates, political changes, and catastrophic events, such as pandemics or disasters which occur naturally or are exacerbated by climate change. Pandemics such as coronavirus disease 2019 (referred to as
COVID-19) may adversely affect global markets and the performance of the Pools. All investments are exposed to other price/market risk.
c) Investment Transactions, Income Recognition, and Recognition of Realized and Unrealized Gains and Losses
i) Interest for distribution purposes shown on the Statements of Comprehensive Income represents the coupon interest received by the Fund accounted for on an accrual basis. The Funds do not amortize
premiums paid or discounts received on the purchase of fixed income securities except for zero coupon bonds, which are amortized on a straight-line basis.
ii) Dividend income is recorded on the ex-dividend date.
iii) Investment transactions are recorded on a trade date basis. Securities that are exchange-traded are recorded at fair value established by the last traded market price when that price falls within that
day’s bid-ask spread. Debt securities are recorded at fair value, established by the last traded price on the over-the-counter market (referred to as OTC) when that price falls within that day’s bid-ask
spread. In circumstances where the last traded price is not within the bid-ask spread, the Manager determines the price that is most representative of fair value based on the specific facts and
circumstances. Unlisted securities are recorded at fair value using fair valuation techniques established by the Manager in establishing a fair value.
iv) Realized gains and losses on investments and unrealized appreciation or depreciation of investments are calculated using the average cost, excluding transaction costs, of the related investments.
v) Other income is the sum of income, excluding transaction costs, other than that which is separately classified on the Statements of Comprehensive Income.
d) Offsetting
Financial assets and liabilities are offset and the net amount reported in the Statements of Financial Position, if there is a currently enforceable legal right to offset the recognized amounts and there is an intention
to settle on a net basis, or to realize the asset and settle the liability simultaneously.
Where applicable, additional information can be found in the table Offsetting Arrangements as part of the Supplemental Schedule to Schedule of Investment Portfolio. This supplemental schedule discloses the
OTC derivatives which are subject to offsetting.
e) Portfolio Securities
The cost of securities of a Fund is determined in the following manner: securities are purchased and sold at a market-traded price to arrive at a value for the position traded. The total purchased value represents
the total cost of the security to the Fund. When additional units of the same security are purchased, the cost of those additional units is added to the total security cost. When units of the same security are sold,
the proportionate cost of the units of the security sold is deducted from the total security cost. If there is a return of capital paid by a security, the amount of this return of capital is deducted from the total security
cost. This method of tracking security cost is known as “average cost” and the current total for any one security is referred to as the “adjusted cost base” or “ACB” of the security. Transaction costs incurred in
portfolio transactions are excluded from the average cost of investments and are recognized immediately in net income and are presented as a separate expense item in the financial statements.
The difference between the fair value of securities and their average cost, excluding transaction costs, represents the unrealized appreciation (depreciation) in value of the portfolio investments. The applicable
period change in unrealized appreciation (depreciation) of investments is included on the Statements of Comprehensive Income.
Short-term investments on the Schedule of Investment Portfolio are presented at their amortized cost which approximates the fair value. Accrued interest for bonds is disclosed separately on the Statements of
Financial Position.
f) Foreign Exchange
The value of investments and other assets and liabilities denominated in foreign currencies is translated into Canadian dollars, which is the Funds’ functional and presentation currency at the current rates
prevailing on each valuation date (unless otherwise indicated).
Purchases and sales of investments, income, and expenses are translated into Canadian dollars, which is the Funds’ functional and presentation currency at the foreign exchange rates prevailing on the dates of
such transactions. Foreign currency translation gains (losses) on investments and income transactions are included in Net realized gain (loss) on foreign currency on the Statements of Comprehensive Income.
g) Forward Foreign Currency Contracts
The Funds may enter into forward foreign currency contracts for either hedging or non-hedging purposes where such activity is consistent with their investment objectives and as permitted by the Canadian
securities regulatory authorities.
Changes in the fair value of forward foreign currency contracts are included in derivative assets or derivative liabilities on the Statements of Financial Position and are recorded as an Increase (Decrease) in
unrealized appreciation (depreciation) of investments and derivatives during the applicable period on the Statements of Comprehensive Income.
Notes to Financial Statements p / 3
x
x
..
..
..
..
..
..
..
..
..
..
..
..
..
..
..
..
..
..
..
..
13
The gain or loss arising from the difference between the value of the original forward foreign currency contract and the value of such contract at close or delivery is realized and recorded as Net realized gain (loss)
on foreign currency for Funds that use the forward foreign currency contracts for hedging or as Derivative income (loss) for Funds that do not use the forward foreign currency contracts for hedging.
h) Futures Contracts
The Funds may enter into futures contracts for either hedging or non-hedging purposes where such activity is consistent with their investment objectives and as permitted by the Canadian securities regulatory
authorities.
The margin deposits with brokers relating to futures contracts are included in Margin on the Statements of Financial Position. Any change in the margin requirement is settled daily and included in Receivable for
portfolio securities sold or Payable for portfolio securities purchased on the Statements of Financial Position.
Any difference between the settlement value at the close of business on each valuation date and the settlement value at the close of business on the previous valuation date is recorded as Derivative income
(loss) on the Statements of Comprehensive Income.
i) Options
The Funds may enter into options contracts for either hedging or non-hedging purposes where such activity is consistent with their investment objectives and as permitted by the Canadian securities regulatory
authorities.
Premiums paid for purchased call and put options are included in derivative assets and subsequently measured at fair value on the Statements of Financial Position. When a purchased option expires, the Fund will
realize a loss in the amount of the cost of the option. For a closing transaction, the Fund will realize a gain or loss depending on whether the proceeds are greater or less than the premium paid at the time of
purchase. When a purchased call option is exercised, the cost of the security purchased is increased by the premium paid at the time of purchase.
Premiums received from writing options are included in derivative liabilities and subsequently measured at fair value on the Statements of Financial Position as initial reductions in the value of investments.
Premiums received from writing options that expire unexercised are recorded as realized gains and reported as Net gain (loss) on sale of investments and derivatives on the Statements of Comprehensive Income.
For a closing transaction, if the cost of closing the transaction exceeds the premium received, the Fund will record a realized loss or, if the premium received at the time the option was written is greater than the
amount paid, the Fund will record a realized gain and is reported as Net gain (loss) on sale of investments and derivatives. If a written put option is exercised, the cost for the security delivered is reduced by the
premiums received at the time the option was written.
j) Securities Lending
A Fund may lend portfolio securities in order to earn additional revenue, which is disclosed on the Statements of Comprehensive Income. The loaned assets of any one Fund are not permitted to exceed 50% of the
fair value of the assets of that Fund (excluding collateral debt for the loaned securities). The minimum allowable collateral is 102% of the fair value of the loaned securities as per the requirements of National
Instrument 81-102 – Investment Funds. Collateral can consist of the following:
i) Cash.
ii) Qualified securities.
iii) Irrevocable letters of credit issued by a Canadian financial institution that is not the counterparty, or an affiliate counterparty, of the pool in the transaction, if evidences of indebtedness of the Canadian
financial institution that are rated as short-term debt by an approved credit rating organization have an approved credit rating.
iv) Securities that are immediately convertible into securities of the same issuer, class, or type, and the same term, as the securities loaned.
The fair value of the loaned securities is determined on the close of any valuation date and any additional required collateral is delivered to the Pool on the next business day. The securities on loan continue to be
included on the Schedule of Investment Portfolio, and are included in the total value on the Statements of Financial Position in Investments (non-derivative financial assets) at fair value. Where applicable, a Fund’s
securities lending transactions are reported in the footnote Securities Lending on the Statements of Financial Position.
National Instrument 81-106 – Investment Fund Continuous Disclosure requires a reconciliation of the gross income amount generated from the securities lending transactions of the Funds to the revenue from
securities lending disclosed in the Funds’ Statements of Comprehensive Income. The gross amount generated from securities lending includes interest paid on collateral, withholding taxes deducted, the fees paid
to the Funds’ lending agent and the securities lending revenue received by the Funds. Where applicable, the reconciliation can be found in the footnotes to the Funds’ Statements of Comprehensive Income.
k) Multi-Class Structured Funds
The realized and unrealized capital gains or losses, income, and common expenses (other than class-specific operating expenses and management fees) of the Fund are allocated on each valuation date to the
unitholders in proportion to the respective prior day’s net asset value, which includes unitholder trades dated for that day, of each class of units at the date on which the allocation is made. All class-specific
operating expenses and management fees do not require allocation. All class-specific operating expenses are paid by the Manager and are collected from the Funds on a recoverable basis.
l) Loans and Receivables, Other Assets and Liabilities
Loans and receivables, other assets and liabilities are recorded at cost, which approximates their fair value, with the exception of Net Assets Attributable to Holders of Redeemable Units which are presented at
the redemption value.
m) Legend of Abbreviations
The following is a list of abbreviations (foreign currency translation and others) that may be used in the Schedule of Investment Portfolio:
Currency Abbreviations
AED – United Arab Emirates Dirham
ARS – Argentine Peso
AUD – Australian Dollar
BRL – Brazilian Real
CAD – Canadian Dollar
CHF – Swiss Franc
CLP – Chilean Peso
CNY – Chinese Renminbi
COP – Colombian Peso
CZK – Czech Koruna
DKK – Danish Krone
EGP – Egyptian Pound
EUR – Euro
GBP – British Pound
GEL – Georgian Lari
HKD – Hong Kong Dollar
HUF – Hungarian Forint
IDR – Indonesian Rupiah
ILS – Israeli Shekel
INR – Indian Rupee
JPY – Japanese Yen
KES – Kenyan Shilling
KRW – South Korean Won
MAD – Morocco Dirham
MXN – Mexican Peso
MYR – Malaysian Ringgit
NOK – Norwegian Krone
NZD – New Zealand Dollar
PHP – Philippine Peso
PLN – Polish Zloty
RON – Romanian Leu
RUB – Russian Ruble
SEK – Swedish Krona
SGD – Singapore Dollar
THB – Thai Baht
TRY – New Turkish Lira
TWD – Taiwan Dollar
USD – United States Dollar
ZAR – South African Rand

p / 4 Notes to Financial Statements
..
..
..
..
x
x
x
x
x
x
x
x
14
Other Abbreviations
ADR – American Depositary Receipt
CVO – Contingent Value Obligations
ELN – Equity Linked Note
ETF – Exchange-Traded Fund
GDR – Global Depositary Receipt Securities
NVDR – Non-Voting Depositary Receipt
n) Increase (Decrease) in Net Assets Attributable to Holders of Redeemable Units per Unit
Increase (decrease) in net assets attributable to holders of redeemable units per unit of each class is calculated by dividing the Increase (decrease) in net assets attributable to holders of redeemable units
(excluding distributions), as reported on the Statements of Comprehensive Income, by the weighted average number of units in issue during the related period.
3. Valuation of Investments
The valuation date (referred to as Valuation Date) for a Fund is any day when the Manager’s head office is open for business. The Manager may, at its discretion, establish other Valuation Dates.
The fair value of the investments or assets of a Fund is determined as follows:
a) Cash and Other Assets
Cash, accounts receivable, dividends receivable, distributions receivable, and interest receivable are valued at fair value or at their recorded cost, plus or minus any foreign exchange between recognition of the
asset by the Fund and the current Valuation Date, which approximates fair value.
b) Bonds, Debentures, and Other Debt Obligations
Bonds, debentures, and other debt obligations are fair valued using the last traded price provided by a recognized vendor upon the close of trading on a Valuation Date, whereby the last traded price falls within
that day’s bid-ask spread. If the last traded price does not fall within that day’s bid-ask spread, then the Manager will determine the price that is most representative of fair value based on the specific facts and
circumstances.
c) Listed Securities, Unlisted Securities, and Fair Value Pricing of Foreign Securities
Any security that is listed or traded on a securities exchange is fair valued using the last traded price, whereby the last traded price falls within that day’s bid-ask spread or, if there is no traded price on that
exchange or the last traded price does not fall within that day’s bid-ask spread and in the case of securities traded on an OTC market, at the fair value as determined by the Manager as an appropriate basis for
valuation. In such situations, a fair value will be determined by the Manager to establish current value. If any securities are inter-listed or traded on more than one exchange or market, the Manager will use the
principal exchange or market for the fair value of such securities.
Units of each mutual fund in which a Fund invests will be valued at fair value using the most recent net asset value quoted by the Trustee or Manager of the mutual fund on the Valuation Date.
Unlisted securities are fair valued using the last traded price quoted by a recognized dealer, or the Manager may determine a price that more accurately reflects the fair value of these securities if the Manager
feels the last traded price does not reflect fair value.
Fair value pricing is designed to avoid stale prices and to provide a more accurate fair value, and may assist in the deterrence of harmful short-term or excessive trading in the Fund. When securities listed or
traded on markets or exchanges that close prior to North or South American markets or exchanges are valued by the Manager at their fair market value, instead of using quoted or published prices, the prices of
such securities used to calculate the Fund’s net assets or net asset value may differ from quoted or published prices of such securities.
d) Derivatives
Long positions in options, debt-like securities, and listed warrants are valued at fair value using the last traded price as established on either their principal trading exchange or by a recognized dealer in such
securities, whereby the last traded price falls within that day’s bid-ask spread and the credit rating of each counterparty (as rated by S&P Global Ratings, a division of S&P Global) meets or exceeds the minimum
designated rating.
When any option is written by any Fund, the premium received by the Fund will be reflected as a liability that will be valued at an amount equal to the current fair value of the option that would have the effect of
closing the position. Any difference resulting from revaluation shall be treated as an unrealized gain or loss on investment; the liability shall be deducted in arriving at the net assets attributable to holders of
redeemable units of the Fund. The securities that are the subject of a written option, if any, will be valued in the manner described above for listed securities.
Futures contracts, forward contracts, or swaps will be valued at fair value of the gain or loss, if any, that would be realized on the Valuation Date if the position in the futures contracts, forward contracts, or
swaps were to be closed out.
Margin paid or deposited in respect of futures contracts and forward contracts will be reflected as an account receivable and margin consisting of assets other than cash will be noted as held as collateral.
Other derivatives and margin are fair valued in a manner that the Manager determines to represent their fair value.
e) Restricted Securities
Restricted securities purchased by any Fund will be fair valued in a manner that the Manager determines to represent their fair value.
f) Other Investments
All other investments of the Funds will be fair valued in accordance with the laws of the Canadian securities regulatory authorities, where applicable.
The value of any security or other property of a Fund for which a market quotation is not readily available or where the market quotations do not properly reflect the fair value of such securities will be determined
by the Manager by valuing the securities at their fair value. In such situations, fair value will be determined using the fair valuation technique that most accurately reflects the fair value as established by the
Manager.
4. Interest in Underlying Funds
The Funds may invest in other investment funds (Underlying Funds). Each Underlying Fund invests in a portfolio of assets to generate returns in the form of investment income and capital appreciation for its
unitholders. Each Underlying Fund finances its operations primarily through the issuance of redeemable units, which are puttable at the unitholder's option and entitle the unitholder to a proportionate share of
the underlying fund's net assets. The Fund's interests in Underlying Funds held in the form of redeemable units, are reported in its Schedule of Investments at fair value, which represents the Funds’ maximum
exposure on those investments. The Funds' interests in underlying funds as at the prior year period ends are presented in the Financial Instruments Risks - Concentration Risk section in the Supplemental
Schedule to Schedule of Investment Portfolio. Distributions earned from Underlying Funds are included in “Investment Income” in the Statements of Comprehensive Income. The total realized and change in
unrealized gains (losses) arising from Underlying Funds are also included in the Statements of Comprehensive Income. The Funds do not provide any additional significant financial or other support to Underlying
Funds.
Where applicable, the table “Interests in Underlying Funds” presented as part of the Supplemental Schedule to Schedule of Investment Portfolio, provides additional information on the Funds’ investments in
Underlying Funds where the ownership interest exceeds 20% of each Underlying Fund.
5. Redeemable Units Issued and Outstanding
Each Fund is permitted to have an unlimited number of classes of units and may issue an unlimited number of units of each class. The outstanding units represent the capital of a Fund. Each unit has no par value
and the value of each unit is the net assets attributable to holders of redeemable units per unit next determined. Settlement of the cost for units issued is completed as per security regulations in place at the
time of issue. Distributions made by a Fund and reinvested by unitholders in additional units also constitute issued redeemable units of a Fund.
Units are redeemed at the net assets attributable to holders of a redeemable unit per unit of a Fund. A right to redeem units of a Fund may be suspended with the approval of the Canadian securities regulatory
authorities or when normal trading is suspended on a stock, options, or futures exchange within Canada or outside of Canada on which securities or derivatives that make up more than 50% of the value or
underlying exposure of the total assets of a Fund, not including any liabilities of a Fund, are traded and when those securities or derivatives are not traded on any other exchange that represents a reasonably
practical alternative for a Fund. The Fund is not subject to any externally imposed capital requirements.
Notes to Financial Statements p / 5
x
15
The capital received by a Fund is utilized within the respective investment mandate of the Fund. This includes the ability to make liquidity available to satisfy unitholder unit redemption requirements upon the
unitholder’s request.
Changes in issued and outstanding units for the periods ended December 31, 2020 and 2019 can be found on the Statements of Changes in Net Assets Attributable to Holders of Redeemable Units.
x
6. Management Fees and Operating Expenses
Management fees are based on the net asset value of the Funds and are calculated daily. Management fees are paid to the Manager in consideration for providing, or arranging for the provision of, management,
distribution, and portfolio advisory services. The maximum annual management fee expressed as a percentage of the average net asset value that can be charged by a Fund is reported in footnote Maximum
Chargeable Annual Management Fee Rates on the Statements of Comprehensive Income.
In addition to the management fees, the Funds are responsible for all expenses relating to the operation and conduct of the business of the Funds, which may include interest, operating, and administrative costs
(other than advertising and promotional expenses, which are the responsibility of the Manager), brokerage fees, commissions, spreads, regulatory fees, Independent Review Committee fees, taxes, audit and
legal fees and expenses, safekeeping and custodial fees, investor servicing costs, and costs of unitholder reports, prospectuses, and other reports. All such operating expenses are paid by the Manager and
recovered from the Funds. The Funds do not pay a fee to the Trustee.
The Manager may recover less than the actual operating expenses paid by the Manager, resulting in the Manager absorbing expenses. The Manager may also charge to a Fund less than the maximum
management fee in footnote Maximum Chargeable Annual Management Fee Rates on the Statements of Comprehensive Income, resulting in the Manager waiving management fees.
At its sole discretion, the Manager may stop absorbing operating expenses and/or waiving management fees at any time. Operating expenses absorbed and/or management fees waived by the Manager are
disclosed on the Statements of Comprehensive Income.
In some cases, the Manager may charge management fees to a Fund that are less than the management fees the Manager is entitled to charge in respect of certain investors in a Fund. The difference in the
amount of the management fees will be paid out by the Fund to the applicable investors as a distribution of additional units of the Fund (Management Fee Distributions). Management Fee Distributions are
negotiable between the Manager and the investor and are dependent primarily on the size of the investor’s investment in the Fund. Management Fee Distributions paid to qualified investors do not adversely
impact the Fund or any of the Fund’s other investors. The Manager may increase or decrease the amount of Management Fee Distributions to certain investors from time to time.
Where a Fund invests in units of an Underlying Fund, the Fund does not pay duplicate management fees on the portion of its assets that it invests in units of the Underlying Fund. In addition, the Fund will not pay
duplicate sales fees or redemption fees with respect to the purchase or redemption by it of units of the Underlying Fund. Some of the Underlying Funds held by the Funds may offer Management Fee
Distributions. Such Management Fee Distributions of an Underlying Fund will be paid out as required for taxable distribution payments by a Fund. The manager of an Underlying Fund may, in some cases, waive a
portion of an Underlying Fund’s management fee and/or absorb a portion of an Underlying Fund’s operating expenses.
7. Income Taxes and Withholding Taxes
The Funds qualify as mutual fund trusts under the Income Tax Act (Canada). No income tax is payable by the Funds on net income and/or net realized capital gains that are distributed to unitholders. In addition,
income taxes payable on undistributed net realized capital gains are refundable on a formula basis when units of the Funds are redeemed. Sufficient net income and realized capital gains of the Funds have been,
or will be, distributed to the unitholders such that no tax is payable by the Funds and, accordingly, no provision for income taxes has been made in the financial statements. Occasionally, a Fund may pay
distributions in excess of the net income and net realized capital gains of the Fund. This excess distribution is called a return of capital and is non-taxable to the unitholder. However, a return of capital reduces
the average cost of the unitholder’s units for tax purposes, which may result in a capital gain to the unitholder to the extent the average cost becomes less than zero.
Non-capital losses are available to be carried forward for 20 years.
Capital losses for income tax purposes may be carried forward indefinitely and applied against capital gains realized in future years. Where applicable, a Fund’s net capital and non-capital losses are reported in
footnote Net Capital and Non-Capital Losses on the Statements of Changes in Net Assets Attributable to Holders of Redeemable Units.
The Funds have a taxation year-end of December 15 (except Imperial Money Market Pool, which has a taxation year-end of December 31).
The Funds currently incur withholding taxes imposed by certain countries on investment income and capital gains. Such income and gains are recorded on a gross basis and the related withholding taxes are
shown as a separate expense in the Statements of Comprehensive Income.
8. Brokerage Commissions and Fees
The total commissions paid by the Funds to brokers in connection with portfolio transactions are reported in footnote Brokerage Commissions and Fees on the Statements of Comprehensive Income of each Fund
where applicable. In allocating brokerage business to a dealer, consideration may be given by the portfolio advisor or the portfolio sub-advisors of the Funds to the provision of goods and services by the dealer or
a third party, other than order execution (referred to in the industry as “soft dollar” arrangements). These goods and services are paid for with a portion of brokerage commissions and assist the portfolio advisor
and the portfolio sub-advisors with their investment decision-making services to the Funds or relate directly to executing portfolio transactions on behalf of the Funds. The total soft dollar payments paid by the
Funds to brokers are reported in footnote Brokerage Commissions and Fees on the Statements of Comprehensive Income of each Fund. In addition, the Manager may enter into commission recapture
arrangements with certain dealers with respect to the Fund. Any commission recaptured will be paid to the applicable Fund.
Fixed income and certain other securities are transacted in an OTC market, where participants are dealing as principals. Such securities are generally traded on a net basis and do not normally involve brokerage
commissions, but will typically include a “spread” (being the difference between the bid and the offer prices on the security of the applicable marketplace).
Spreads associated with fixed income securities trading and certain other securities are not ascertainable and, for that reason, are not included in the dollar amounts. In addition, the soft dollar amounts only
include the value of research and other services supplied by a third party to CIBC Asset Management Inc. (CAMI or the Portfolio Advisor) and any portfolio sub-advisors, as the value of the services supplied to the
Portfolio Advisor and any portfolio sub-advisors by the dealer is not ascertainable. When these services benefit more than one Fund, the costs are allocated among the Funds based on transaction activity or
some other fair basis as determined by the Portfolio Advisor and any portfolio sub-advisors.
9. Related Party Transactions
CIBC and its affiliates have the following roles and responsibilities with respect to the Funds and receive the fees described below in connection with their roles and responsibilities. The Funds may hold
securities of CIBC. CIBC and its affiliates may also be involved in underwriting or lending to issuers of securities that may be held by the Funds, have purchased or sold securities from or to the Funds while acting
as principal, have purchased or sold securities from or to the Funds on behalf of another investment fund managed by CIBC or an affiliate, and also may have been involved as a counterparty to derivative
transactions. Management fees payable and other accrued expenses on the Statements of Financial Position are amounts generally payable to a related party of the Fund.
Manager, Trustee, Portfolio Advisor, and certain Portfolio Sub-Advisors of the Funds
CIBC is the Manager, CIBC Trust Corporation is the Trustee, and CAMI is the Portfolio Advisor of each of the Funds.
The Manager also arranges for fund administrative services (other than advertising and promotional, which are the responsibility of the Manager), legal, investor servicing, and costs of unitholder reports,
prospectuses, and other reports. The Manager is the registrar and transfer agent for the Funds and provides, or arranges for the provision of, all other administrative services required by the Funds. The dollar
amount (including all applicable taxes) of all fund administrative expenses (net of absorptions) that the Manager recovers from a Fund is reported in footnote Administrative and Other Fund Operating
Expenses on the Statements of Comprehensive Income.
Brokerage Arrangements and Soft Dollars
The Portfolio Advisor generally delegates trading and execution authority to the portfolio sub-advisors. Where applicable, disclosure of the amounts of soft dollars can be found in the Brokerage Commission and
Fees schedule on the Statements of Comprehensive Income for each Fund.
The Portfolio Advisor and portfolio sub-advisors make decisions, including the selection of markets and dealers and the negotiation of commissions, with respect to the purchase and sale of portfolio securities,
certain derivative products and the execution of portfolio transactions. Brokerage business may be allocated by the Portfolio Advisor and portfolio sub-advisors to CIBC World Markets Inc. and or CIBC World
Markets Corp., each a subsidiary of CIBC. The total commissions paid to related brokers in connection with portfolio transactions are reported in footnote Brokerage Commissions and Fees on the Statements of
Comprehensive Income of each Fund.
CIBC World Markets Inc. and CIBC World Markets Corp. may also earn spreads on the sale of fixed income and other securities, and certain derivative products to the Funds. Dealers, including CIBC World
Markets Inc. and CIBC World Markets Corp., may furnish goods and services, other than order execution, to the Portfolio Advisor and portfolio sub-advisors that process trades through them (referred to in the
industry as “soft dollar” arrangements). These goods and services are paid for with a portion of brokerage commissions and assist the Portfolio Advisor and portfolio sub-advisors with their investment
decision-making services to the Fund or relate directly to executing portfolio transactions on behalf of the Fund. As per terms of the portfolio advisory and sub-advisory agreements, such soft dollar arrangements

p / 6 Notes to Financial Statements
x
x
16
are in compliance with applicable laws. Custodial fees directly related to portfolio transactions incurred by a Fund, otherwise payable by the Fund, shall be paid by CAMI, and/or dealer(s) directed by CAMI, up to
the amount of the credits generated under soft dollar arrangements from trading on behalf of the Fund, or a portion of the Fund, during that month. The total soft dollar payments paid by the Fund to related
brokers are reported in footnote Brokerage Commissions and Fees on the Statements of Comprehensive Income of each Fund. In addition, the Manager may enter into commission recapture arrangements with
certain dealers with respect to the Funds. Any commission recaptured will be paid to the relevant Fund.
Custodian
The custodian holds all cash and securities for the Funds and ensures that those assets are kept separate from any other cash or securities that the custodian might be holding. The custodian also provides other
services to the Funds including record keeping and processing of foreign exchange transactions. CIBC Mellon Trust Company is the custodian of the Funds (the Custodian). The Custodian may hire sub-custodians
for the Funds. The fees and spreads for services of the Custodian directly related to the execution of portfolio transactions by a Fund, or a portion of a Fund, are paid by CAMI and/or dealer(s) directed by CAMI up
to the amount of the credits generated under soft dollar arrangements from trading on behalf of the Funds during that month. All other fees for the services of the Custodian are paid by the Manager, and charged
to the Funds on a recoverable basis. CIBC owns a 50% interest in CIBC Mellon Trust Company.
Service Provider
CIBC Mellon Global Securities Services Company (referred to as CIBC GSS) provides certain services to the Funds, including securities lending, fund accounting and reporting, and portfolio valuation. Such
servicing fees are paid by the Manager and charged to the Funds on a recoverable basis. CIBC indirectly owns a 50% interest in CIBC GSS.
The dollar amount paid by the Funds (including all applicable taxes) to CIBC Mellon Trust Company for custodial fees (net of absorptions) and to CIBC GSS for securities lending, fund accounting and reporting,
and portfolio valuation (net of absorptions) for the periods ended December 31, 2020 and 2019 is reported in footnote Service Provider on the Statements of Comprehensive Income.
10. Hedging
Certain foreign currency denominated positions have been hedged, or partially hedged, by forward foreign currency contracts as part of the investment strategies of certain Funds. These hedges are indicated by
a hedging reference number on the Schedule of Investment Portfolio and a corresponding hedging reference number on the Schedule of Derivative Assets and Liabilities Forward Foreign Currency Contracts for
those Funds.
11. Collateral on Specified Derivatives
Short-term investments may be used as collateral for futures contracts outstanding with brokers.

x
x
x
x
x
x
x
x
x
x
x
x
x
x
..
..
..
..
..
..
..
..
..
..
x
x
x
x
x
x
x
x
x
x
x
17
INDEPENDENT AUDITOR'S REPORT
To the Unitholders of
Imperial Money Market Pool
Imperial Short-Term Bond Pool
Imperial Canadian Bond Pool
Imperial Canadian Diversified Income Pool
Imperial International Bond Pool
Imperial Equity High Income Pool
Imperial Canadian Dividend Income Pool
Imperial Global Equity Income Pool
(collectively, the “Funds”)
Imperial Canadian Equity Pool
Imperial U.S. Equity Pool
Imperial International Equity Pool
Imperial Overseas Equity Pool
Imperial Emerging Economies Pool
Conservative Income Portfolio
Balanced Income Portfolio
Enhanced Income Portfolio
Opinion
We have audited the financial statements of the Funds, which comprise the statements of financial position as at December 31, 2020 and 2019, and the statements of comprehensive income, statements of
changes in net assets attributable to holders of redeemable units and statements of cash flows for the periods then ended, and notes to the financial statements, including a summary of significant accounting
policies.
In our opinion, the accompanying financial statements present fairly, in all material respects, the financial position of the Funds as at December 31, 2020 and 2019, and their financial performance and cash flows
for the periods then ended in accordance with International Financial Reporting Standards (referred to as IFRSs).
Basis for Opinion
We conducted our audit in accordance with Canadian generally accepted auditing standards. Our responsibilities under those standards are further described in the Auditor’s Responsibilities for the Audit of the
Financial Statements section of our report. We are independent of the Funds in accordance with the ethical requirements that are relevant to our audit of the financial statements in Canada, and we have fulfilled
our other ethical responsibilities in accordance with these requirements. We believe that the audit evidence we have obtained is sufficient and appropriate to provide a basis for our opinion.
Other Information
Management is responsible for the other information. The other information comprises the Management Report of Fund Performance of the Funds. Our opinion on the financial statements does not cover the other
information and we do not express any form of assurance conclusion thereon.
In connection with our audit of the financial statements, our responsibility is to read the other information, and in doing so, consider whether the other information is materially inconsistent with the financial
statements or our knowledge obtained in the audit or otherwise appears to be materially misstated.
We obtained the Management Report of Fund Performance of the Funds prior to the date of this auditor’s report. If, based on the work we have performed, we conclude that there is a material misstatement of this
other information, we are required to report that fact in this auditor’s report. We have nothing to report in this regard.
Responsibilities of Management and Those Charged with Governance for the Financial Statements
Management is responsible for the preparation and fair presentation of the financial statements in accordance with IFRSs, and for such internal control as management determines is necessary to enable the
preparation of financial statements that are free from material misstatement, whether due to fraud or error.
In preparing the financial statements, management is responsible for assessing each Fund’s ability to continue as a going concern, disclosing, as applicable, matters related to going concern and using the going
concern basis of accounting unless management either intends to liquidate the Funds or to cease operations, or has no realistic alternative but to do so.
Those charged with governance are responsible for overseeing the Funds’ financial reporting process.
Auditor’s Responsibilities for the Audit of the Financial Statements
Our objectives are to obtain reasonable assurance about whether the financial statements as a whole are free from material misstatement, whether due to fraud or error, and to issue an auditor’s report that
includes our opinion. Reasonable assurance is a high level of assurance, but is not a guarantee that an audit conducted in accordance with Canadian generally accepted auditing standards will always detect a
material misstatement when it exists. Misstatements can arise from fraud or error and are considered material if, individually or in the aggregate, they could reasonably be expected to influence the economic
decisions of users taken on the basis of these financial statements.
As part of an audit in accordance with Canadian generally accepted auditing standards, we exercise professional judgment and maintain professional skepticism throughout the audit. We also:
• Identify and assess the risks of material misstatement of the financial statements, whether due to fraud or error, design and perform audit procedures responsive to those risks, and obtain audit
evidence that is sufficient and appropriate to provide a basis for our opinion. The risk of not detecting a material misstatement resulting from fraud is higher than for one resulting from error, as fraud
may involve collusion, forgery, intentional omissions, misrepresentations, or the override of internal control.
• Obtain an understanding of internal control relevant to the audit in order to design audit procedures that are appropriate in the circumstances, but not for the purpose of expressing an opinion on the
effectiveness of the Funds’ internal control.
• Evaluate the appropriateness of accounting policies used and the reasonableness of accounting estimates and related disclosures made by management.
• Conclude on the appropriateness of management’s use of the going concern basis of accounting and, based on the audit evidence obtained, whether a material uncertainty exists related to events or
conditions that may cast significant doubt on the Funds’ ability to continue as a going concern. If we conclude that a material uncertainty exists, we are required to draw attention in our auditor’s report
to the related disclosures in the financial statements or, if such disclosures are inadequate, to modify our opinion. Our conclusions are based on the audit evidence obtained up to the date of our
auditor’s report. However, future events or conditions may cause the Funds to cease to continue as a going concern.
• Evaluate the overall presentation, structure, and content of the financial statements, including the disclosures, and whether the financial statements represent the underlying transactions and events in
a manner that achieves fair presentation.
We communicate with those charged with governance regarding, among other matters, the planned scope and timing of the audit and significant audit findings, including any significant deficiencies in internal
control that we identify during our audit.
Toronto, Canada
March 23, 2021

Imperial Pools
Income Generation Portfolios
CIBC
Brookfield Place, 161 Bay Street, 22nd Floor
Toronto, Ontario
M5J 2S1
1-888-357-8777
Website
www.cibc.com/mutualfunds