ball 2005ar
TRANSCRIPT

Ball Aerospace & Technologies Corp.Celebrates 50th Anniversary 1956 - 2006
Ball Corporation10 Longs Peak DriveBroomfield, CO 80021(303) 469-3131www.ball.com
Ba
ll Co
rp
or
at
ion
| 20
05
An
nu
al R
ep
or
t
Ball Corporation | 2005 Annual Report

Who We AreBall Corporation is a provider of metal and plastic packaging for beverages, foods and household products, and of aerospace and other technologies and services to commercial and governmental customers. Founded in 1880, the company employs more than 13,100 people. Ball Corporation stock is traded on the New York Stock Exchange under the ticker symbol BLL.
Mission and StrategiesTo be the premier provider to our packaging and aerospace and technologies customers of the products and services that we offer as we aggressively manage our business, and to explore and pursue acquisitions, divestitures, strategic alliances and other changes that would benefit Ball’s shareholders.
In packaging, our strategy is to leverage our superior continuous process improvement expertise in order to manufacture, market, sell and service high-quality, value-added products that meet the needs of high-volume and/or growing customer segments of the beverage, food and household product markets.
In aerospace and technologies, our strategy is to provide remote sensing systems and solutions to the aerospace and defense markets through products and services used to collect and interpret information needed to support national missions and scientific discovery.
Core PurposeBall Corporation is in business to add value to all of its stakeholders, whether it is providing quality products and services to customers, an attractive return on investment to shareholders, a meaningful work life for employees or a contribution of time, effort and resources to our communities. In all of our interactions, we ask how we can get better – how we can make it better, be better and do better, for our own good and the good of those who have a stake in our success.
Core ValuesCertain guiding principles and core values have allowed us to prosper. These include:
Integrity Our reputation for integrity is one of our most important assets. We will not compromise our integrity or risk damage to our reputation in return for financial gain or for any reason.
Respect We respect our employees, our customers, our suppliers, our shareholders – indeed, all of our stakeholders. In all of our dealings we strive to show that respect and to treat people with dignity.
Motivation We have a strong desire to be successful and to be measured against the best.
Flexibility We are willing to challenge our own assumptions and adapt to changing circumstances for the long-term good of the corporation.
Innovation We strive to be creative and innovative in our products, our processes and the way we conduct business.
Teamwork We operate as a team. Everyone has his or her job, but it takes all of us working together for the company to succeed.
Five Keys to SuccessWe strive to perpetuate and grow the enterprise while adhering to our core values and following our five keys to success. Those keys are:
Close to Customers We have a total commitment to being close to our customers and understanding their needs and future direction. This commitment extends throughout our organization.
Creativity and Imagination Our employees’ creativity and imagination enable us to deliver innovations in products, process development and the way we conduct business so we can better serve our customers, grow the company and increase the value of the enterprise.
Financial HighlightsBall Corporation and Subsidiaries
($ and amounts in millions, except per share amounts and percentages) 2005 2004
Stock PerformanceAnnual return to common shareholders
(share price appreciation plus assumed reinvested dividends) . . . . . . . . . . . . . . . . . . . . . . . . . . . . . . . . (8.8)% 48.8%Closing market price per share . . . . . . . . . . . . . . . . . . . . . . . . . . . . . . . . . . . . . . . . . . . . . . . . . . . . . . . . . . $ 39.72 $ 43.98 Total market value of common stock . . . . . . . . . . . . . . . . . . . . . . . . . . . . . . . . . . . . . . . . . . . . . . . . . . . . . . $ 4,139 $ 4,956 Shares outstanding at year end. . . . . . . . . . . . . . . . . . . . . . . . . . . . . . . . . . . . . . . . . . . . . . . . . . . . . . . . . . . 104,200 112,691 Shares outstanding assuming dilution (1) . . . . . . . . . . . . . . . . . . . . . . . . . . . . . . . . . . . . . . . . . . . . . . . . . . 106,142 114,742
Operating PerformanceNet sales . . . . . . . . . . . . . . . . . . . . . . . . . . . . . . . . . . . . . . . . . . . . . . . . . . . . . . . . . . . . . . . . . . . . . . . . . . . $ 5,751 $ 5,440 Earnings before taxes (2) . . . . . . . . . . . . . . . . . . . . . . . . . . . . . . . . . . . . . . . . . . . . . . . . . . . . . . . . . . . . . . . . $ 346 $ 435 Earnings before interest and taxes (EBIT) (2)(3) . . . . . . . . . . . . . . . . . . . . . . . . . . . . . . . . . . . . . . . . . . . . . . . $ 463 $ 539 Net earnings (2) . . . . . . . . . . . . . . . . . . . . . . . . . . . . . . . . . . . . . . . . . . . . . . . . . . . . . . . . . . . . . . . . . . . . . . . $ 262 $ 296 Basic earnings per share (2) . . . . . . . . . . . . . . . . . . . . . . . . . . . . . . . . . . . . . . . . . . . . . . . . . . . . . . . . . . . . . . $ 2.43 $ 2.67 Diluted earnings per share (2) . . . . . . . . . . . . . . . . . . . . . . . . . . . . . . . . . . . . . . . . . . . . . . . . . . . . . . . . . . . . $ 2.38 $ 2.60 Cash dividends per share . . . . . . . . . . . . . . . . . . . . . . . . . . . . . . . . . . . . . . . . . . . . . . . . . . . . . . . . . . . . . . . $ 0.40 $ 0.35 Number of employees . . . . . . . . . . . . . . . . . . . . . . . . . . . . . . . . . . . . . . . . . . . . . . . . . . . . . . . . . . . . . . . . . 13,100 13,220
(1) Represents shares outstanding at year end plus the assumed exercise of options that are “in-the-money” at year end, less an estimate of shares that could be repurchased at the year-end market price of Ball stock using the assumed exercise proceeds. This measure is not the same as the diluted weighted average shares outstanding used in the calculation of diluted earnings per share.
(2) Includes expense of $21.2 million ($0.12 cents per diluted share) in 2005 and income of $15.2 million ($0.08 cents per diluted share) in 2004 related to business consolidation and other activities. Also includes expense of $19.3 million ($0.12 cents per diluted share) in 2005 for debt refinancing costs. Additional details are available in the company’s consolidated financial statements.
(3) Management utilizes earnings before interest and taxes (EBIT) as an internal measure for evaluating operating results and for planning purposes. EBIT is shown prior to interest expense of $116.4 million, including $19.3 million for debt refinancing costs, in 2005 and $103.7 million in 2004.
This Summary Annual Report should be read in conjunction with the audited consolidated financial statements and other information contained in Ball Corporation’s Annual Report on 10-K for 2005 furnished with the Company’s Proxy Statement for the 2006 Annual Meeting of Shareholders.
Behave Like Owners By behaving as true owners of the business, our employees deliver superior results and provide the best value in the products and services we supply to our customers.
Attention to Detail By managing our operations with relentless attention to detail we are creating safe workplaces while building a great business that consistently delivers superior value.
Build on Strengths We intend to build on our heritage of ethics, integrity, quality and value in all our dealings by treating all stakeholders the way we would like to be treated.
Additional photo information and credits:
Pages 2 and 12 (Deep Impact): Artwork by Ball Aerospace & Technologies Corp., modified by Tim Cline, U. Maryland.
Page 3 (CALIPSO satellite): © CNES
Page 5 (Golden employees): back row l-r: George Henke, general supervisor, cans; Frank Lodico, general supervisor, cans; Brad Branson, department manager; front row l-r: Dave Demers, millwright supervisor; Todd Hattersley, electrical supervisor; Tim Faber, engineering manager; Allen Terkildsen, engineering project manager; John Schrader, production manager, cans
Page 7 (Bonn Technical Center) l-r: Bert Bast, senior director, special projects; Wilfried Mohr, laboratory technician; Rob Miles, vice president sales & marketing; Bernd Ullmann, manager, new product development; Ralf Lieberz, project engineer measurement technology; Torsten Becker, engineer beverage technology
Page 9 and 12 (Joint Strike Fighter): © Lockheed Martin
Page 9 (Deep Impact team): back row l-r: Mike Renbarger, Nick Taylor, Monte Henderson, Joe Galamback, Tim Torphy, Dave Acton; middle row l-r: Rod Gillard, Dave Herhager, Michelle Goldman, Jim Crane, Stu Gray, Chris Burno; front row l-r: Ken Hutchison, Lorna Hess-Frey, John Mah, Alec Baldwin
Copyright © Ball Corporation 2006Ball and are trademarks of Ball Corporation
Reg. U.S. Pat. & Tm. Office.

Letter To Our Shareholders
Dear Fellow Shareholder:
Ball Corporation’s 125th year was a memorable one.We produced and sold some 56 billion containers
for beverages and foods.Spacecraft and instruments we built performed one
of the most difficult feats ever attempted in deep space.The corporation’s results remained near the record
levels we have established in recent years.And perhaps most significantly, we undertook projects
and programs designed to improve our processes and our products and to position us for continued success in the future.
Our long-term objectiveSales in 2005 were a record $5.8 billion. Earnings were $261.5 million, or $2.38 per diluted share. Our long-term goal is to achieve 10 to 15 percent annual growth in diluted earnings per share. Early in 2005 we said that it would be a challenging year as we dealt with higher costs and commenced a multi-year capital spending program in our beverage can and aerospace operations. Still, since 2002 our annual earnings per diluted share have increased by an average of 20.5 percent per year.
Preparing for future growthBall Corporation continued to be a strong generator of cash in 2005, with $559 million of cash flow from operations. We invested some of that cash back into our operations. We also repurchased more than $350 million worth of our common stock.
We began a multi-year project to upgrade and streamline our process for producing the more than 31 billion beverage can ends
we supply each year in North America. We are consolidating end production into fewer locations and installing new machines to streamline manufacturing in our end manufacturing centers, which will be among the most efficient in the industry when the project is completed.
In our beverage can operations in both Europe and North America, we continue to invest in our capability to produce specialty containers. By “specialty containers” we mean other than standard 12-ounce cans in North America and standard 33- and 50-centilitre cans in Europe. Demand for specialty cans has been growing rapidly, particularly for beer and energy drinks. Our response has been to convert existing lines to the production of specialty cans, giving us the capacity and flexibility to meet the increased demand without adding new lines.
Similarly, in our plastic container operations in the U.S. we are investing primarily in our capability to produce heat-set containers for products that are experiencing growth. The capacity we are adding, all in our existing plants, will go to meet this incremental growth. Results from our plastic container operations in 2005 reached their highest levels in the decade we have been in this business. While that is encouraging, there is need for further
improvement in order for our plastic container opera-tions to earn our cost of capital. We intend to make
only investments that will allow us to do that.
Rendezvous with a cometArguably the most memorable and remarkable
single event for Ball Corporation during its quasquicentennial year came from
our aerospace and technologies segment. On July 4 the Deep Impact spacecraft pair, built entirely by Ball, successfully completed a six-month, 265 million-mile journey. While one of the spacecraft successfully collided with comet Tempel 1, the other spacecraft recorded the
R. David HooverChairman, president and
chief executive officer
Ball Corporation | 2005 Annual Report 1
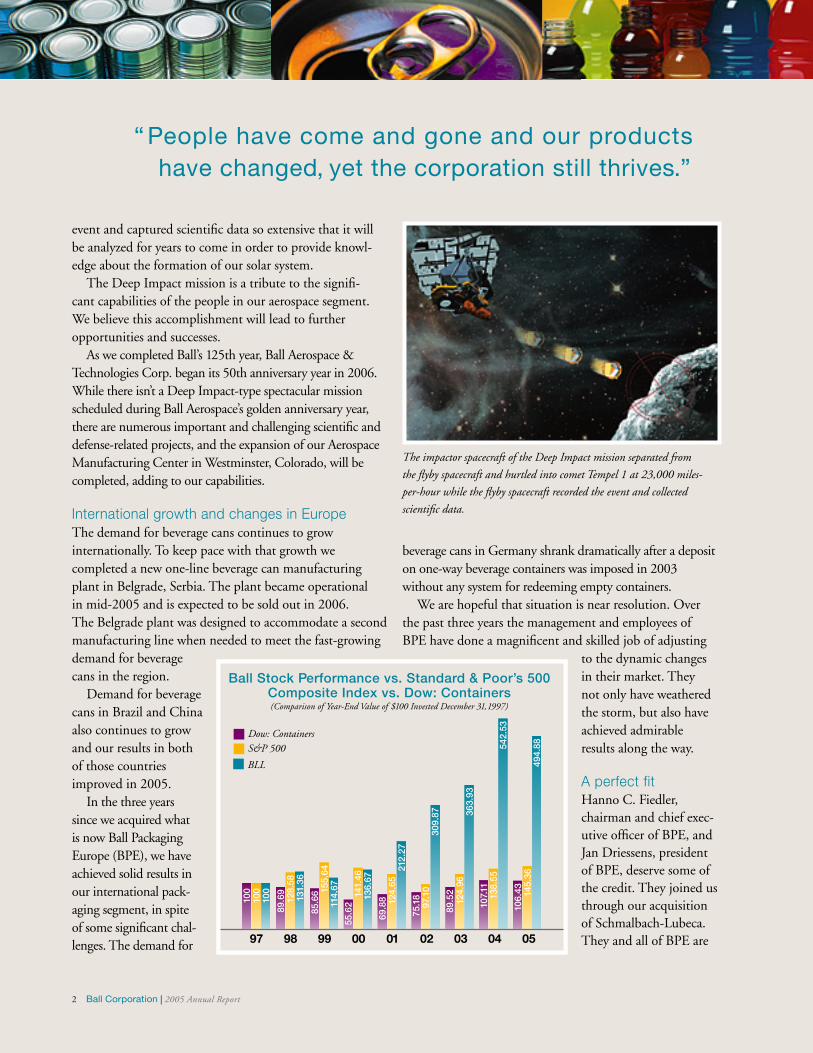
event and captured scientific data so extensive that it will be analyzed for years to come in order to provide knowl-edge about the formation of our solar system.
The Deep Impact mission is a tribute to the signifi-cant capabilities of the people in our aerospace segment. We believe this accomplishment will lead to further opportunities and successes.
As we completed Ball’s 125th year, Ball Aerospace & Technologies Corp. began its 50th anniversary year in 2006. While there isn’t a Deep Impact-type spectacular mission scheduled during Ball Aerospace’s golden anniversary year, there are numerous important and challenging scientific and defense-related projects, and the expansion of our Aerospace Manufacturing Center in Westminster, Colorado, will be completed, adding to our capabilities.
International growth and changes in EuropeThe demand for beverage cans continues to grow internationally. To keep pace with that growth we completed a new one-line beverage can manufacturing plant in Belgrade, Serbia. The plant became operational in mid-2005 and is expected to be sold out in 2006. The Belgrade plant was designed to accommodate a second manufacturing line when needed to meet the fast-growing demand for beverage cans in the region.
Demand for beverage cans in Brazil and China also continues to grow and our results in both of those countries improved in 2005.
In the three years since we acquired what is now Ball Packaging Europe (BPE), we have achieved solid results in our international pack-aging segment, in spite of some significant chal-lenges. The demand for
“ People have come and gone and our products” “have changed, yet the corporation still thrives.”
beverage cans in Germany shrank dramatically after a deposit on one-way beverage containers was imposed in 2003 without any system for redeeming empty containers.
We are hopeful that situation is near resolution. Over the past three years the management and employees of BPE have done a magnificent and skilled job of adjusting
to the dynamic changes in their market. They not only have weathered the storm, but also have achieved admirable results along the way.
A perfect fitHanno C. Fiedler, chairman and chief exec-utive officer of BPE, and Jan Driessens, president of BPE, deserve some of the credit. They joined us through our acquisition of Schmalbach-Lubeca. They and all of BPE are
The impactor spacecraft of the Deep Impact mission separated from
the flyby spacecraft and hurtled into comet Tempel 1 at 23,000 miles-
per-hour while the flyby spacecraft recorded the event and collected
scientific data.
Ball Stock Performance vs. Standard & Poor’s 500 Composite Index vs. Dow: Containers(Comparison of Year-End Value of $100 Invested December 31, 1997)
97
Dow: ContainersS&P 500
BLL
BLL
98 99 00 01 02 03 04
2 Ball Corporation | 2005 Annual Report
05
100
100
100
89.6
912
8.58
131.
36
85.6
6 155.
6411
4.67
75.1
897
.10
309.
87
69.8
8 124.
65
89.5
212
4.96
363.
93
107.
1113
8.55
542.
53
106.
43 145.
3649
4.88
55.6
2
212.
27
141.
4613
6.67

a perfect fit with Ball. They made us a better company while wrestling with issues that were difficult to predict.
Now Hanno and Jan are leaving full time employment with Ball, Hanno at the end of 2005 and Jan in early 2006. Though we have known their plans for some time and are prepared for a transition, they will be missed. Fortunately, Hanno Fiedler will continue on our board of directors, and Jan Driessens will move into a consulting role with Ball, so we will still have access to their considerable knowledge when needed. We thank them and wish them both the very best.
John A. Hayes will become president of BPE. John has been involved with BPE in one way or another since we were in the process of acquiring it, a process which he headed for Ball. He has been executive vice president of BPE since mid-2005. He will continue this business on the successful course charted by Hanno, Jan and all of BPE.
Sustainable performanceHaving just completed our 125th year says a great deal about Ball Corporation. Over the decades people have come and gone and our products have changed, yet the corporation still thrives. With sustainability the latest buzzword, what Ball Corporation has demonstrated
over its long history is sustainable performance. To continue to do so will require our continued flexibility and adaptation as the world around us changes. Along those lines, on February 14, 2006, we announced that we had signed a definitive agreement to acquire the U.S. and Argentinean businesses of U.S. Can Corp., and on February 27, 2006, we announced an agreement to acquire certain of Alcan’s plastic container assets in the U.S. These transactions are expected to close in the first quarter and will complement our existing packaging operations.
We are proud of our past and enthusiastic about our future. We will continue to set challenging goals and then strive to achieve them. We thank our employees, customers, suppliers and certainly our shareholders who make it possible for us to do so.
John A. Hayes (left) moved to Europe in 2005 where he assumes overall
responsibility for Ball Packaging Europe. Hanno C. Fiedler (center)
retired at the end of 2005 and Jan Driessens (right) will retire in 2006.
All three have played key roles in the December 2002 acquisition and
subsequent successful integration of what is now Ball Packaging Europe
into Ball Corporation.
Ball Corporation board members and chairman emeritus John
W. Fisher (with gavel) took part in the closing bell ceremony on the
New York Stock Exchange on April 27, 2005, as part of the company’s
125th anniversary celebration.R. David Hoover
Chairman, president and chief executive officer
Ball Corporation | 2005 Annual Report 3

North American Packaging
For our North American packaging opera-
tions, 2005 represented an opportunity to
invest in our plants while continuing to
provide our beverage and food customers
with the high-quality containers they need.
We converted a high-speed manufac-
turing line in our Golden, Colo., metal
beverage container plant and began
converting a line in our Monticello, Ind.,
beverage can plant from the production
of standard 12-ounce aluminum cans to
specialty sizes. This reflects the continuing
increase in demand for specialty cans that
help our customers’ beverages stand out
on retail shelves.
We also introduced the patented
FreshCan® in the United States. FreshCan
– developed by Ball Packaging Europe –
features an air-tight and water-tight plastic
capsule that keeps sensitive ingredients such
as vitamins dry and fresh until the can is
opened. This ensures that the ingredients
maintain maximum effectiveness.
Our line of Heat-Tek™ polyethylene
terephthalate (PET) bottles continued to
gain new customers, including BooKoo
Beverages, Inc.’s new nutrient-enhanced
water beverages. Ball’s Heat-Tek bottles are
ideal for hot-filled beverages, which are
filled at temperatures up to 185 degrees
Fahrenheit. Heat-Tek bottle sizes include
8, 10, 12, 16, 20 and 64 ounce, and feature
the company’s patented Vac-u-Flex™
vacuum panel technology. Additional
sizes are in development.
Ball also began supplying 187ml PET
bottles to Sutter Home Winery, which
introduced four of its wines in the
single-serve container.
Ball is a founding member of the Canned
Food Alliance – steelmakers, can makers,
food processors and affiliate members that
have joined together to promote the benefits
of canned food – and in 2005 supported
an education program designed to inform
consumers about the nutritional value and
convenience of canned food.
As Ball develops new packaging to meet
the needs of our customers, we continue
to improve our manufacturing processes
to supply cans and bottles more efficiently.
We produced more than 44 billion
recyclable metal and plastic containers
in North America in 2005 and we expect
to make even more in 2006.
Ball’s Heat-Tek™ line of
hot-filled PET bottles
continued to be the choice
of sports drinks and other
functional beverages.
Ball makes more specialty can
sizes than any other can maker.
Demand for specialty cans is
growing rapidly.
4 Ball Corporation | 2005 Annual Report

FreshCan® made its commercial debut
in the United States with Defense, a
vitamin and mineral supplement. It uses
an air-tight and water-tight capsule –
The Wedge™ – to keep vitamins and
other sensitive ingredients dry.
Employees at our Golden, Colo., plant successfully
completed the conversion of a 12-ounce beverage
can production line to a 24-ounce line in 2005,
enabling Ball to better meet the growing
demand for specialty can sizes.
Through organizations like the Canned
Food Alliance and the Can Manufactures
Institute, Ball helps promote the
advantages of high-quality food and
beverage cans to consumers.
Sutter Home Winery introduced four of its
wines in single-serve PET bottles made by Ball.
Ball Corporation | 2005 Annual Report 5

International Packaging
We continue to pursue growth in Europe,
Brazil and China and took significant steps
in 2005 to expand our international
packaging business.
In June, Ball Packaging Europe
completed one of the fastest plant start-
ups in Ball Corporation’s history when
our new metal beverage can plant in
Belgrade, Serbia, opened after only
10 months of construction, installation
and test runs. The one-line plant, one of
the most modern beverage can plants in
Europe, began supplying cans to the
growing central and eastern European
markets. It can produce 650 million cans
annually and will accommodate expansion
to a second production line. The beverage
can market in central and eastern
Europe reported a 27 percent increase
to 1.3 billion units in 2004, according to
Beverage Can Makers Europe. Over the
next few years, double-digit growth rates
are predicted in those regions.
Ball Packaging Europe employees from
Poland and the United Kingdom produced
the first 360-degree debossed can for
Poland’s Zywiec Brewery. The eye-catching
new can enhanced the image of the beer
and of cans as a beverage package.
Our Brazilian joint venture performed
well in a beverage can market that grew
almost 5 percent in 2005. It supplied nearly
20 percent of the close to 10 billion cans
consumed in Brazil last year.
In 2005, Ball’s packaging operations
in China saw double-digit volume growth
while the Chinese can market grew nearly
6 percent. Ball Asia Pacific Ltd. has
successfully focused on opportunities within
the tea and energy sector as well as beer and
carbonated soft drinks. China is the world’s
fastest growing economy with an increase
in its gross domestic product of 9 percent
in both 2004 and 2005. Our operations
there are well-positioned for continued
growth as the market expands.
French trade officials awarded
the La Ciotat, France, plant one
of five 2005 social ethic awards
for its strong ethics charter.
Poland’s Zywiec Brewery
introduced a 360-degree
debossed can developed by
Ball Packaging Europe
employees in Poland and
the United Kingdom.
6 Ball Corporation | 2005 Annual Report

Ball Packaging Europe employees
developed FreshCan®, which was
introduced commercially in 2005.
Ball Packaging Europe’s new Belgrade, Serbia, plant
is supplying beverage cans to the growing central and
eastern European markets.
Demand for beverage cans in China grew
nearly 6 percent in 2005. Ball Asia Pacific
Ltd.’s can plants experienced double-digit
volume growth during the year.
An intelligent can that uses unique pigments in ink
on its surface to tell consumers whether the can’s
contents are at optimal drinking
temperature was displayed at trade
shows by Ball Packaging Europe.
Ball Corporation | 2005 Annual Report 7

8 Ball Corporation | 2005 Annual Report
cutline The HiRISE camera, launched
in August aboard the Mars
Reconnaissance Orbiter, will take
the most detailed images of Mars
ever sent from an orbiting spacecraft.
1959, Employees use temporary test facilities at the Ideal Market parking lot, Boulder, Colo.
1960, Preflight tests on pointing controls
1966, Technicians complete work on OSO-3 (Orbiting Solar Observatory) for NASA
1967, Separable Payload System (SPCS) for sounding rockets
1970, Ball builds the Extreme UV spectroheliograph for use on Skylab
Ball Aerospace Celebrates Its 50th Anniversary
Ball Aerospace continued its tradition
of aerospace “firsts” in 2005. We built the
HiRISE camera, the largest and highest
resolution camera ever sent beyond Earth
orbit. Our work in Measurement and
Signature Intelligence (MASINT)
contributes significantly to U.S. national
security. And we built the spacecraft that
collided with a comet in deep space at a
speed of 23,000 miles-per-hour, a feat our
customers equated in difficulty to landing
a rover on Mars. Helping our customers
achieve that which has never been done
before is the hallmark of Ball Aerospace.
Focusing on core competencies in the
defense and civil aerospace markets, Ball
Aerospace leverages its 50-year heritage
to provide high-quality, high-performance
sensors, spacecraft, communications and
data exploitation solutions for the nation’s
most challenging missions.
During 2006, Ball Aerospace extends
its reach into the solar system, launching
a camera designed to take images of far-away
Pluto. Another spacecraft, CloudSat, and
instruments on a satellite called CALIPSO
will be launched to observe weather patterns
and provide environmental data about our
own planet. Looking to the future, we will
contribute to other impressive aerospace
programs: on-orbit spacecraft servicing for
Orbital Express; the James Webb Space
Telescope, the next generation NASA
telescope; Space-Based Space Surveillance
to track space-borne objects; and Kepler,
a mission to search for habitable planets.
Ball Aerospace celebrates 50 years in
the aerospace business in 2006. While our
commitment to innovation and technology
remains the same, we continue to grow our
capabilities to win important programs.
Upgraded facilities such as a new Detector
Technology Center and a renewed emphasis
on effective processes will help us build on
our reputation as an aerospace leader.
Aerospace and Technologies
The Deep Impact mission
returned unprecedented
data on the composition of
comets. Here, Deep Impact’s
flyby spacecraft returns an
image of the impactor
spacecraft’s Independence
Day collision with comet
Tempel I.

Ball Corporation | 2005 Annual Report 9
A Ball Aerospace engineer examines the testbed
telescope for the James Webb Space Telescope. The
JWST is expected to study objects up to 400 times
more faint than any ground- or space-based telescope.
The Deep Impact team poses
with the spacecraft prior
to the January 2005 launch.
Ball Aerospace engineers complete the NextSat Commodities Spacecraft (NextSat /CSC)
bus for the Defense Advanced Research Projects Agency’s (DARPA) Orbital Express
program. The NextSat bus is part of a dual-satellite demonstration mission with the
goal to robotically refuel, reconfigure and repair spacecraft on orbit.
With more than 30 years of experience in the design, fabrication
and testing of low-observable antennas, Ball Aerospace is providing
an integrated body antenna suite for the F-35 Joint Strike Fighter.
The system provides communications, navigation and identification.
1976, Viking imager cameras are mounted to the scan platform on the Viking mission to Mars
1983, Ball’s IRAS (Infrared Astronomical Satellite) instrument compiles the first detailed map of the infrared sky
1985, ERBS (Earth Radiation Budget Satellite) is deployed by the Space Shuttle’s robotic arm
1994, Sea Sparrow, a low-light camera for NATO ships, is Ball Aerospace’s longest-running program, active since 1972
2005, The CloudSat spacecraft is readied for launch at Vandenberg Air Force Base, Calif.

No organization that reaches the special
milestone of 125 years in existence does
so alone. Ball Corporation owes its success
in large part to its customers, many of
whom have been our customers for decades.
“Getting close to our customers” is one of our
“Keys to Success” as we seek to understand
their changing needs. We are proud to supply
our products to all of our customers and we
thank you for choosing Ball.
It is impossible to acknowledge everyone
who has worked with Ball during our long
history. Suppliers, contractors, the financial
community, government agencies, elected
officials, military personnel – the list of
“Our Quasquicentennial Year”
Ball celebrated its 125th
anniversary in 2005.
10 Ball Corporation | 2005 Annual Report
organizations and individuals who have
played important roles in our success is almost
endless. We thank you all for your support.
Finally, any organization is only as good as
the people who comprise it. The thousands of
Ball Corporation employees who have
operated our plants, run our offices and
represented Ball in a variety of settings drove
this company’s success for 125 years. Our
more than 13,100 employees today continue
to be the heart of Ball and are singularly
passionate, talented and tireless in their efforts
to satisfy our customers and grow our
company. They are Ball, and we couldn’t
be more excited about our future together.

Ball Corporation | 2005 Annual Report 11
Page 10: (top) The La Ciotat, France, plant celebrated Ball’s 125th anniversary by hosting an open house, which included guided tours; (bottom) The Monticello, Ind., plant achieved one million hours of accident-free operation.
Page 11: (top left) Our Guayama, Puerto Rico, plant was recognized for completing 2004 without a recordable or lost-time accident; (top right) Ball Aerospace broke ground for a major expansion of the Aerospace Manufacturing Center in June; (upper middle) Our Conroe, Texas, plant won the Miller Brewing Company’s coveted Partners in Excellence award; (middle left) Our Golden, Colo., plant was designated a Voluntary Protection Program “Merit” site by the U.S. Occupational Safety and Health Administration; (middle right) Ball plants all over the world observed our quasquicentennial celebration at annual picnics and dinners; (bottom left) Our Findlay, Ohio, facility was awarded the Edmund F. Ball Award for Safety for working two million hours without a lost-time accident.

Ball Corporation: An Overview
12 Ball Corporation | 2005 Annual Report
Packaging Products and Services Representative Customers Customer Products
North America
Aerospace and Technologies
Two-piece aluminum beverage cans and easy-open beverage can ends and tabs for a variety of products; two-piece beverage can technology services and support; plastic containers in a variety of shapes and sizes; plastic container technology services and support; two- and three-piece steel food cans in a wide range of heights and diameters using draw-redraw, draw and ironed, and three-piece welded can technology; steel food can services and support
Two-piece aluminum and steel beverage cans and easy-open beverage can ends and tabs for a variety of products; two-piece beverage can technology services and support; plastic containers for oil, household, personal care and dairy products
Allen Canning; Anheuser-Busch; BooKoo Beverages; Brain-Twist; Bush Brothers; Cadbury Schweppes; Canadian Fish Company; Cask Brewing Systems; City Brewery; Coca-Cola; ConAgra Foods; Cott; Eagle Family Foods; Faribault Foods; Go Fast Sports and Beverage; Hansen’s; High Falls Brewing; Hirzel Canning; Hormel Foods; Icicle Seafoods; Kroger; Lakeport Brewing; Lakeside Foods; Masterfoods; Molson Coors; Monarch; Morgan Foods; National Beverage; Niebaum-Coppola; Nitro2Go; O-AT-KA; Pepsi-Cola; Red Gold; Rockstar Energy Drink; SABMiller; Safeway; Seneca Foods; Sleeman Brewing; Strong Brands; Trident Seafoods; Trinchero Winery; XS Energy
A.S. Watson; AmBev; Anheuser-Busch; Bavaria N.V.; Britvic; Carlsberg; Cervejaria Petrópolis S.A.; Coca-Cola; ExxonMobil; Grupo Mahou San Miguel; Guinness; Harbin Brewery; Heineken; InBev; Jianlibao; Kingway Brewery; Molson Coors; Nestlé; Orangina Schweppes; Pepsi-Cola; SABMiller; San Miguel; Scottish & Newcastle; Tingjin; Tsingtao Brewery; Unilever; Wahaha; Yanjing Brewery
Beer; soft drinks; water; energy drinks; sports drinks; juices; nutritional supplements; functional beverages; wine; dairy products; meal replacement drinks; fruits; vegetables; meats; seafood; soups; pastas; pet foods
Beer; soft drinks; water; energy drinks; juices; nutritional supplements; functional beverages; wine; dairy products; household products; personal care products; motor oil products
Spacecraft; sensors; instruments; satellite payloads; laser technologies; electro-optical systems; cameras; data exploitation; antennas; software; systems engineering; tracking systems; cryogenics; space-qualified components; engineering services
BAE Systems; Boeing; Defense Advanced Research Projects Agency; DigitalGlobe; General Dynamics; Jet Propulsion Laboratory; NASA Ames Research Center; NASA Goddard Space Flight Center; NASA Langley Research Center; Lockheed Martin; National Air Intelligence Center; National Geospatial-Intelligence Agency; National Oceanic & Atmospheric Administration; Northrop Grumman; Office of Naval Research; Raytheon; Royal Australian Air Force; U.S. Air Force; U.S. Army; U.S. Coast Guard; U.S. Department of Defense; U.S. Marines; U.S. Navy
Aerospace, defense and scientific missions, products and programs
Please note: These are brief descriptions and not complete lists.
International

Metal beverage ends
Metal beverage containers Metal food containers
Plastic containers
Aerospace
Research facility
Headquarters
Joint venture
Complete listings of our locations can be found on www.ball.com, www.ball-europe.com and www.ballaerospace.com. Locations shown here do not include sales offices.
2005
5,751
2004
5,440
2003
4,977
2002
3,859
2001
3,686
2000
3,665
1999
3,707
Richmond, BC
Kent, WA
Fairfield, CAOakdale, CA
Chino, CA
Torrance, CA
Kapolei, HI
Albuquerque, NM
Westminster, CO
Boulder, COBroomfield, CO
Fort Worth, TX
Conroe, TX
Springdale, AR
Kansas City, MO
Ames, Iowa
DeForest, WIWatertown, WI
Milwaukee, WI
Monticello, IN
Dayton, OH
Warner Robins, GA
Chestnut Hill, TN
Bristol, VA
Burlington, ON
Whitby, ON
Tampa, FL
Findlay, OH
Columbus, OH
Guayama, PR
Washington, D.C.Chantilly, VA
Reidsville, NC
Williamsburg, VAWeirton, WV
Delran, NJ
Wallkill, NY
Saratoga Springs, NY
Baldwinsville, NY
La Ciotat, France
Bierne, France
Rugby, U.K.
Wrexham, U.K.Deeside, U.K.
Oss, the Netherlands
Bonn, Germany
Weissenthurm, Germany
Hassloch, Germany
Ratingen, Germany
Braunschweig, GermanyHermsdorf, Germany
Belgrade, Serbia
Radomsko, PolandZhongfu
Qingdao
HemeiBeijing
Hubei
SanshuiShenzhen
Hong Kong
Jacarei
Salvador
Golden, CO
Manufacturing and Services Locations
North American Metal Beverage
International Packaging
North American Metal Food
North American Plastic ContainersAerospace & Technologies
42%
2005 Net Sales by SegmentNet Sales ($ in millions)
24%
8%
14%
12%
Ball Corporation | 2005 Annual Report 13
North America
Europe China Brazil

($ in millions, except per share amounts) 2005 2004 2003 2002 2001 2000 1999 1998
Net sales . . . . . . . . . . . . . . . . . . . . . . . . . . . $ 5,751.2 $ 5,440.2 $ 4,977.0 $ 3,858.9 $ 3,686.1 $ 3,664.7 $ 3,707.2 $ 2,995.7Net earnings (loss) (1)(2) . . . . . . . . . . . . . . . . 261.5 295.6 229.9 156.1 (99.2) 68.2 104.2 16.6Preferred dividends, net of tax . . . . . . . . . . – – – – (2.0) (2.6) (2.7) (2.8)
Earnings (loss) attributable to common shareholders (1) . . . . . . . . . . . . $ 261.5 $ 295.6 $ 229.9 $ 156.1 $ (101.2) $ 65.6 $ 101.5 $ 13.8
Return on average common shareholders’ equity . . . . . . . . . . . . . . . 27.2% 31.2% 35.4% 31.3% (17.7)% 10.1% 16.2% 2.3%
Basic earnings (loss) per share(1)(2)(3) . . . . . . $ 2.43 $ 2.67 $ 2.06 $ 1.39 $ (0.92) $ 0.56 $ 0.84 $ 0.12
Weighted average common shares outstanding (000s) (3) . . . . . . . . . . . . . . 107,758 110,846 111,710 112,634 109,759 116,160 120,681 121,552
Diluted earnings (loss) per share (1)(2)(3) . . . . $ 2.38 $ 2.60 $ 2.01 $ 1.36 $ (0.92) $ 0.53 $ 0.79 $ 0.11
Diluted weighted average common shares outstanding (000s) (3) . . . . . . . . . 109,732 113,790 114,275 115,076 109,759 124,068 129,798 130,368
Property, plant and equipment additions . . $ 291.7 $ 196.0 $ 137.2 $ 158.4 $ 68.5 $ 98.7 $ 107.0 $ 84.2Depreciation and amortization . . . . . . . . . $ 213.5 $ 215.1 $ 205.5 $ 149.2 $ 152.5 $ 159.1 $ 162.9 $ 145.0Total assets . . . . . . . . . . . . . . . . . . . . . . . . . $ 4,343.4 $ 4,477.7 $ 4,069.6 $ 4,132.4 $ 2,313.6 $ 2,649.8 $ 2,732.1 $ 2,854.8Total interest bearing debt and . . . . . . . . .
capital lease obligations . . . . . . . . . . . . $ 1,589.7 $ 1,660.7 $ 1,686.9 $ 1,981.0 $ 1,064.1 $ 1,137.3 $ 1,196.7 $ 1,356.6Accounts receivable sold at year end . . . . . $ 210.0 $ 174.7 $ 175.0 $ 122.5 $ 122.5 $ 122.5 $ 122.5 $ 122.5Common shareholders’ equity . . . . . . . . . . $ 835.3 $ 1,086.6 $ 807.8 $ 492.9 $ 504.1 $ 639.6 $ 655.2 $ 594.6Market capitalization (4) . . . . . . . . . . . . . . . $ 4,138.8 $ 4,956.2 $ 3,359.1 $ 2,904.8 $ 2,043.8 $ 1,292.0 $ 1,174.0 $ 1,393.3Net debt to market capitalization (4) . . . . . . 36.9% 29.5% 49.1% 59.3% 48.0% 86.0% 98.9% 94.9%Cash dividends (3) . . . . . . . . . . . . . . . . . . . . $ 0.40 $ 0.35 $ 0.24 $ 0.18 $ 0.15 $ 0.15 $ 0.15 $ 0.15Book value per share (3) . . . . . . . . . . . . . . . . $ 8.02 $ 9.64 $ 7.17 $ 4.35 $ 4.36 $ 5.70 $ 5.49 $ 4.88Market value per share (3) . . . . . . . . . . . . . . $ 39.72 $ 43.98 $ 29.785 $ 25.595 $ 17.675 $ 11.515 $ 9.845 $ 11.44Annual return to common shareholders (5) . . (8.8)% 48.8% 17.4% 46.0% 55.3% 19.2% (12.7)% 31.4%Working capital . . . . . . . . . . . . . . . . . . . . . $ 49.8 $ 249.3 $ 62.4 $ 155.6 $ 218.8 $ 310.2 $ 225.7 $ 198.0Current ratio . . . . . . . . . . . . . . . . . . . . . . . 1.04 1.25 1.07 1.15 1.38 1.47 1.34 1.29
(1) Includes business consolidation activities and other items affecting comparability between years of pretax expense of $21.2 million in 2005, pretax income of $15.2 million, $3.7 million and $2.3 million in 2004, 2003 and 2002, respectively, and pretax expense of $271.2 million in 2001. Also includes $19.3 million, $15.2 million and $5.2 million of debt refinancing costs in 2005, 2003 and 2002, respectively, reported as interest expense. Additional details about the 2005, 2004 and 2003 items are available in Notes 4, 9 and 11 to the consolidated financial statements within Item 8 of this report.
(2) Includes after-tax expense in 1998 of $3.3 million ($0.02 per basic share and $0.03 per diluted share) for the cumulative effect of an accounting change.(3) Amounts have been retroactively restated for two-for-one stock splits, which were effected on August 23, 2004, and February 22, 2002.(4) Market capitalization is defined as the number of common shares outstanding at year end, multiplied by the year-end closing price of Ball common stock. Net debt is total debt less cash
and cash equivalents.(5) Change in stock price plus dividend yield assuming reinvestment of dividends.
Eight-Year Review of Selected Financial DataBal l Corporat ion and Subs idiar ie s
14 Ball Corporation | 2005 Annual Report

Corporate Management Teams
North American Packaging Operations
Brian M. Cardno President, metal food containers
Terry D. Davis Senior vice president, manufacturing, metal food containers
Gregory R. Dunn Vice president, manufacturing, metal beverage containers
James A. Fisher Vice president, packaging industry affairs
G. William Gaarder Vice president, business evaluation
Anthony A. Grandinetti Vice president, engineering and development
Larry J. Green President, plastic containers
Thomas F. Hale Senior vice president, sales and marketing, metal food containers
Michael D. Herdman President, metal beverage containers
Michael L. Hranicka Vice president, sales and marketing, metal food containers
Ronald G. Kain Vice president, manufacturing, metal beverage containers
Albert D. Lepper Vice president, manufacturing, plastic containers
John H. Martin Senior vice president, purchasing
John B. “Jack” Pickenbrock Senior vice president, manufacturing, metal beverage containers
Martin A. Ruffalo Senior vice president, sales, metal beverage and plastic containers
Ted L. Schmidt Vice president, packaging logistics
Lawrence J. Scicluna Vice president, human resources
John A. Thiersch Vice president, manufacturing, metal food containers
Michael L. Vaughn Vice president, packaging innovations
Robert N. Warwick Vice president, manufacturing, metal beverage containers
Leroy J. Williams, Jr. Vice president, IS
Aerospace & Technologies Corp.
Jon M. Cerneck Vice president and general manager, defense operations
Mark A. Crouch Vice president, corporate strategies, relations and administration
Frederick J. Doyle Vice president, special programs
Sherrilyn Fike Vice president, mission assurance
Carol M. Hunziker Vice president, information management
Carol S. Lane Vice president, Washington, D.C., office
Cary W. Ludtke Vice president, general manager, operational space
Arthur C. Morrissey Vice president, business development
Douglas C. Neam Vice president, program operations
Jeffrey B. Osterkamp Vice president, program management
James P. Stevens Vice president, human resources
David L. Taylor President and chief executive officer
William F. Townsend Vice president, general manager, civil space systems
William T. Unger Vice president, finance and accounting
Gregory G. Wickline Vice president, finance
Ball Corporation | 2005 Annual Report 15
International Packaging Operations
Bert E. Barkmeijer Vice president, recycling Ball Packaging Europe (BPE)
Klaus Dieckerhoff Vice president, information systems, BPE
Jan Driessens President, BPE
Volker Ehrich Vice president, supply chain, BPE
Joyce L. Genord Vice president, finance Ball Asia-Pacific. Ltd.
Babette Harnisch Vice president, legal affairs, BPE
Gerrit Heske Vice president, manufacturing, BPE
Rob Miles Vice president, sales and marketing, BPE
Gert-Walter Minet Vice president, environment, BPE
Glen L. Opp President, Latapack-Ball
Guenter Schaefer Vice president, RD&E, BPE
Gerd Schildgen Vice president, taxes, BPE
Klaus D. Steingass Vice president, human resources, BPE
Terence P. Voce Chairman and chief executive officer, Ball Asia Pacific Ltd.
Frank Weekers Chief financial officer, BPE

Directors and Officers
16 Ball Corporation | 2005 Annual Report
Directors
Committees
Audit Jan NicholsonGeorge A. SisselTheodore M. SolsoErik H. van der Kaay
FinanceHanno C. FiedlerR. David HooverJohn F. LehmanJan NicholsonGeorge A. SisselErik H. van der Kaay
Human Resources Howard M. DeanGeorge M. SmartTheodore M. SolsoStuart A. Taylor II
Nominating/ Corporate Governance Howard M. DeanJohn F. LehmanGeorge M. SmartStuart A. Taylor II
Director Emeritus
John W. Fisher Chairman of the board emeritus; retired chairman, president and chief executive officer of Ball Corporation
Jan Nicholson President of The Grable Foundation of Pittsburgh
John F. LehmanChairman of J.F. Lehman & Company of New York City
R. David Hoover Chairman of the board, president and chief executive officer of Ball Corporation
Hanno C. Fiedler Retired chairman and chief executive officer of Ball Packaging Europe
Howard M. Dean Retired chairman of the board of Dean Foods Company of Dallas
Erik H. van der Kaay Retired chairman of the board of Symmetricom of San Jose, California
Stuart A. Taylor II Chief executive officer of The Taylor Group L.L.C. of Chicago
Theodore M. Solso Chairman and chief executive officer of Cummins Inc. of Columbus, Indiana
George M. Smart Retired president of Sonoco-Phoenix of Canton, Ohio
George A. Sissel Retired chairman of the board of Ball Corporation
Company Officers
Charles E. Baker Vice president, general counsel and assistant corporate secretary
Douglas K. Bradford Vice president and controller
John R. Friedery Senior vice president, Ball Corporation; chief operating officer, North American packaging
John A. Hayes Vice president, Ball Corporation; executive vice president, Ball Packaging Europe
R. David Hoover Chairman of the board, president and chief executive officer
Scott C. Morrison Vice president and treasurer
Raymond J. Seabrook Senior vice president and chief financial officer
Harold L. Sohn Vice president, corporate relations
David A. Westerlund Senior vice president, administration, and corporate secretary

Quarterly Stock Prices and DividendsQuarterly prices for the company’s common stock, as reported on the composite tape, and quarterly dividends in 2005 and 2004 were:
4th 3rd 2nd 1st 2005 Quarter Quarter Quarter Quarter
High . . . . . . . . . . . . . $ 41.95 $ 39.78 $ 42.70 $ 46.45
Low . . . . . . . . . . . . . . 35.06 35.25 35.80 39.65
Dividends per share . . .10 .10 .10 .10 4th 3rd 2nd 1st2004 Quarter Quarter Quarter Quarter
High . . . . . . . . . . . . . . $ 45.20 $ 38.30 $ 36.23 $ 34.43
Low . . . . . . . . . . . . . . . 35.81 34.12 30.20 28.255
Dividends per share. . . . .10 .10 .075 .075
Amounts have been retroactively restated for a two-for-one stock split, which was effective August 23, 2004, and are presented on a calendar basis.
Quarterly Results and Company InformationQuarterly financial information and company news are posted on www.ball.com. For investor relations call 303-460-3537.
Purchase PlanA dividend reinvestment and voluntary stock purchase plan for Ball Corporation shareholders permits purchase of the company’s common stock without payment of a brokerage commission or service charge. Participants in this plan may have cash dividends on their shares automatically reinvested at a 5 percent discount and, if they choose, invest by making optional cash payments. Additional information on the plan is available by writing Computershare, Dividend Reinvestment Service, P.O. Box 43081, Providence, RI 02940-3081. The toll-free number is 1-800-446-2617, and the Web site is www.equiserve.com. You can access your Ball Corporation common stock account information on the Internet 24 hours a day, 7 days a week through Computershare’s Web site at gateway.equiserve.com. You will need the issue number (3101), your account number, your password and your social security number (if applicable) to gain access to your account. If you need assistance, please call Computershare at 1-877-843-9327.
Annual MeetingThe annual meeting of Ball Corporation shareholders will be held to tabulate the votes cast and to report the results of voting on the matters listed in the proxy statement sent to all shareholders. No other business and no presentations are planned. The meeting to report voting results will be held on Wednesday, April 26, 2006, at 9 a.m. (MDT) at Ball Corporation Headquarters in Broomfield, CO.
Annual Report on Form 10-KCopies of the Annual Report on Form 10-K for 2005, filed by the company with the United States Securities and Exchange Commission, may be obtained by shareholders without charge by writing to the assistant corporate secretary, Ball Corporation, P.O. Box 5000, Broomfield, CO 80038-5000.
CertificationsThe company has filed with the New York Stock Exchange the chief executive officer’s annual certification regarding compliance with the NYSE’s corporate governance listing standards. The company also has filed with the United States Securities and Exchange Commission all required certifications by its chief executive officer and its chief financial officer regarding the quality of the company’s public disclosures.
Transfer AgentsComputershareP.O. Box 43069Providence, RI 02940-3069
RegistrarsComputershareP.O. Box 43069Providence, RI 02940-3069
Investor RelationsAnn T. ScottDirector, Investor RelationsBall CorporationP.O. Box 5000Broomfield, CO 80038-5000(303) 460-3537
Equal OpportunityBall Corporation is an equal opportunity employer.
Shareholder Information
Ball Corporation | 2005 Annual Report 17

Ball Corporation | 2005 Form 10-K

UNITED STATES
SECURITIES AND EXCHANGE COMMISSION Washington, D. C. 20549
FORM 10-K ( X ) ANNUAL REPORT PURSUANT TO SECTION 13 OR 15(d) OF THE
SECURITIES EXCHANGE ACT OF 1934 For the fiscal year ended December 31, 2005
( ) TRANSITION REPORT PURSUANT TO SECTION 13 OR 15(d) OF THE SECURITIES EXCHANGE ACT OF 1934
For the transition period from ________________ to ________________
Commission File Number 1-7349
Ball Corporation State of Indiana 35-0160610 10 Longs Peak Drive, P.O. Box 5000 Broomfield, Colorado 80021-2510
Registrant’s telephone number, including area code: (303) 469-3131 Securities registered pursuant to Section 12(b) of the Act:
Name of each exchange Title of each class on which registered _________________________________ ________________________________
Common Stock, without par value New York Stock Exchange, Inc. Chicago Stock Exchange, Inc. Pacific Exchange, Inc. Securities registered pursuant to Section 12(g) of the Act: NONE Indicate by check mark if the registrant is a well-known seasoned issuer, as defined in Rule 405 of the Securities Act. YES [X] NO [ ] Indicate by check mark if the registrant is not required to file reports pursuant to Section 13 or Section 15(d) of the Act. YES [ ] NO [X] Indicate by check mark whether the registrant (1) has filed all reports required to be filed by Section 13 or 15(d) of the Securities Exchange Act of 1934 during the preceding 12 months (or for such shorter period that the registrant was required to file such reports), and (2) has been subject to such filing requirements for the past 90 days. YES [X] NO [ ] Indicate by check mark if disclosure of delinquent filers pursuant to Item 405 of Regulation S-K is not contained herein, and will not be contained, to the best of registrant's knowledge, in definitive proxy or information statements incorporated by reference in Part III of this Form 10-K or any amendment to this Form 10-K. [ ] Indicate by check mark whether the registrant is a large accelerated filer, an accelerated filer, or a non-accelerated filer. See definition of “accelerated filer and large accelerated filer” in Rule 12b-2 of the Exchange Act. Large accelerated filer [X] Accelerated filer [ ] Non-accelerated filer [ ] Indicate by check mark whether the registrant is a shell company (as defined in Rule 12b-2 of the Act). YES [ ] NO [X] The aggregate market value of voting stock held by non-affiliates of the registrant was $3,881 million based upon the closing market price and common shares outstanding as of July 3, 2005. Number of shares outstanding as of the latest practicable date. ________________Class_____________ __Outstanding at February 3, 2006__ Common Stock, without par value 104,286,147
DOCUMENTS INCORPORATED BY REFERENCE
1. Proxy statement to be filed with the Commission within 120 days after December 31, 2005, to the extent indicated in Part III.

Page 1 of 97
PART I
Item 1. Business
Ball Corporation was organized in 1880 and incorporated in Indiana in 1922. Its principal executive offices are located at 10 Longs Peak Drive, Broomfield, Colorado 80021-2510. The terms "Ball," "the company," "we" and "our" as used herein refer to Ball Corporation and its consolidated subsidiaries. Ball is a manufacturer of metal and plastic packaging, primarily for beverages and foods, and a supplier of aerospace and other technologies and services to government and commercial customers.
Information Pertaining to the Business of the Company The company has determined that it has five reportable segments organized along a combination of product lines and geographic areas: (1) North American metal beverage packaging, (2) North American metal food packaging, (3) North American plastic packaging, (4) international packaging and (5) aerospace and technologies. Prior periods required to be shown in this Annual Report on Form 10-K (Annual Report) have been conformed to the current presentation. A substantial part of our North American and international packaging sales are made directly to companies in packaged beverage and food businesses, including SABMiller and bottlers of Pepsi-Cola and Coca-Cola branded beverages and their affiliates that utilize consolidated purchasing groups. Sales to SABMiller plc and PepsiCo, Inc., represented 11 percent and 10 percent of Ball’s consolidated net sales, respectively, for the year ended December 31, 2005. Additional details about sales to major customers are included in Note 2 to the consolidated financial statements, which can be found in Item 8 of this Annual Report (“Financial Statements and Supplementary Data”). North American Packaging Segments Our principal business in North America is the manufacture and sale of aluminum, steel and polyethylene terephthalate (PET) containers, primarily for beverages and foods. Packaging products are sold in highly competitive markets, primarily based on quality, service and price. The North American packaging business is capital intensive, requiring significant investment in machinery and equipment. Profitability is sensitive to selling prices, production volumes, labor, transportation, utility and warehousing costs, as well as the availability and price of raw materials, such as aluminum, steel, plastic resin and other direct materials. These raw materials are generally available from several sources and we have secured what we consider to be adequate supplies and are not experiencing any shortages. We believe we have limited our exposure related to changes in the costs of aluminum, steel and plastic resin as a result of (1) the inclusion of provisions in most aluminum container sales contracts to pass through aluminum cost changes, as well as the use of derivative instruments, (2) the inclusion of provisions in certain steel container sales contracts to pass through steel cost changes and the existence of certain other steel container sales contracts that incorporate annually negotiated metal costs and (3) the inclusion of provisions in substantially all plastic container sales contracts to pass through resin cost changes. In 2004 and 2005 we were able to pass through the majority of steel surcharges levied by producers and continually attempt to reduce manufacturing and other material costs as much as possible. While raw materials and energy sources, such as natural gas and electricity, may from time to time be in short supply or unavailable due to external factors, and the pass through of steel costs to our customers may be limited in some instances, we cannot predict the timing or effects, if any, of such occurrences on future operations. Research and development (R&D) efforts in the North American packaging segments are directed toward the development of new sizes and types of metal and plastic beverage and food containers, as well as new uses for the current containers. Other research and development efforts in these segments seek to improve manufacturing efficiencies. During 2004 we completed our expansion of the Ball Technology and Innovation Center located near Denver, Colorado. All of our North American R&D activities are now conducted in that facility.

Page 2 of 97
North American Metal Beverage Packaging North American metal beverage packaging represents Ball’s largest segment, accounting for 42 percent of consolidated net sales in 2005. Decorated two-piece aluminum beverage cans are produced at 16 manufacturing facilities in the U.S. and one each in Canada and Puerto Rico. Can ends are produced within four of the U.S. facilities, as well as in a fifth facility that manufactures only ends. Metal beverage containers are primarily sold under multi-year supply contracts to fillers of carbonated soft drinks, beer, energy drinks and other beverages. Sales volumes of metal beverage containers in North America tend to be highest during the period from April through September. Through Rocky Mountain Metal Container, LLC, a 50/50 joint venture, which is accounted for as an equity investment, Ball and Coors Brewing Company (Coors), a wholly owned subsidiary of Molson Coors Brewing Company, operate beverage can and end manufacturing facilities in Golden, Colorado. The joint venture supplies Coors with beverage cans and ends for its Golden, Colorado, and Memphis, Tennessee, breweries and supplies ends to its Shenandoah, Virginia, filling location. Ball receives management fees and technology licensing fees under agreements with the joint venture. In addition to beverage containers supplied to Coors from the joint venture, Ball supplies, from its own facilities, substantially all of Coors’ metal container requirements for its Shenandoah, Virginia, filling location, as well as other containers not manufactured by the joint venture. Based on publicly available industry information, we estimate that our North American metal beverage container shipments in 2005 of approximately 32 billion cans were approximately 31 percent of total U.S. and Canadian shipments of metal beverage containers. Three producers manufacture substantially all of the remaining metal beverage containers. Two of these producers and three other independent producers also manufacture metal beverage containers in Mexico. Available information indicates that North American metal beverage container shipments have been relatively flat during the past several years. Beverage container production capacity in the U.S., Canada and Mexico exceeds demand. In order to more closely balance capacity and demand within our business, from time to time we consolidate our can and end manufacturing capacity into fewer, more efficient facilities. We also attempt to efficiently match capacity with the changes in customer demand for our packaging products. To that end, during the second quarter of 2005 we completed the conversion of a beverage can manufacturing line in our Golden, Colorado, plant from the production of 12-ounce beverage cans to 24-ounce beverage cans. In the fourth quarter of 2005 we began the conversion of a line in our Monticello, Indiana, plant from 12-ounce can manufacturing to a line capable of producing beverage cans in sizes up to 16 ounces. The Monticello conversion was substantially completed during January 2006. During 2005 Ball commenced a project to upgrade and streamline its North American beverage can end manufacturing capabilities, a project expected to result in productivity improvements and reduced manufacturing costs. In connection with these activities, the company recorded a pretax charge of $19.3 million ($11.7 million after tax) in the third quarter of 2005. We have installed the first production module in this multi-year project and the second and third modules are in the installation phase. The project is expected to be completed in 2007. The aluminum beverage container continues to compete aggressively with other packaging materials in the beer and carbonated soft drink industries. The glass bottle has shown resilience in the packaged beer industry, while carbonated soft drink and beer industry use of PET containers has grown. In Canada, metal beverage containers have captured significantly lower percentages of the packaged beverage industry than in the U.S., particularly in the packaged beer industry. North American Metal Food Packaging In addition to metal beverage containers, Ball produces two-piece and three-piece steel food containers for packaging vegetables, fruit, soups, meat, seafood, nutritional products, pet food and other products. These containers are manufactured in 11 plants in the U.S. and Canada and sold primarily to food processors in North America. In 2005 metal food container sales comprised 14 percent of consolidated net sales. Sales volumes of metal food containers in North America tend to be highest from June through October as a result of seasonal vegetable and salmon packs. Approximately 32 billion steel food containers were shipped in the U.S. and Canada in 2005, approximately 20 percent of which we estimate were shipped by Ball.

Page 3 of 97
In 2005 the company recorded a pretax charge of $4.6 million ($3.1 million after tax) related to a reduction in the work force in a metal food container plant in Ontario, Canada. Also in 2005, the company recorded a pretax charge of $6.6 million ($4.4 million after tax) for the closure of a three-piece food can manufacturing plant in Quebec, Canada. The Quebec plant was closed and ceased operations in the third quarter of 2005 and an agreement has been reached to sell the land and building. On March 17, 2004, Ball acquired ConAgra Grocery Products Company’s (ConAgra) interest in Ball Western Can Company LLC (Ball Western Can) located in Oakdale, California, and entered into a multi-year supply contract with ConAgra Foods, Inc. Prior to the acquisition, Ball Western Can was a 50/50 joint venture between Ball and ConAgra and was accounted for under the equity method of accounting. The acquisition of Ball Western Can added approximately one billion units of annual capacity. Competitors in the metal food container product line include two national and a few regional suppliers and self manufacturers. Several producers in Mexico also manufacture steel food containers. Steel food containers also compete with other packaging materials in the food industry including glass, aluminum, plastic, paper and the stand-up pouch. As a result, demand for this product line may be affected during the next few years and we must increasingly focus on product innovation and cost reduction. Service, quality and price are among the key competitive factors. North American Plastic Packaging PET containers represented 8 percent of consolidated net sales in 2005. Demand for containers made of PET has increased in the beverage and food markets, with improved barrier technologies and other advances. This growth in demand should continue, assuming adequate supplies of resin continue to be available. While PET beverage containers compete against metal, glass and paper, the historical increase in the sales of PET containers has come primarily at the expense of glass containers and through new market introductions. We estimate our 2005 shipments of more than 5 billion plastic containers to be approximately 9 percent of total U.S. and Canadian PET container shipments. The company operates five PET facilities in the U.S. Competition in the PET container industry includes several national and regional suppliers and self manufacturers. Service, quality and price are important competitive factors. The ability to produce customized, differentiated plastic containers is becoming a key competitive factor. Most of Ball’s PET containers are sold under long-term contracts to suppliers of bottled water and carbonated soft drinks, including bottlers of Pepsi-Cola branded beverages and their affiliates that utilize consolidated purchasing groups. Our plastic beer containers are being produced for several of our customers and we are manufacturing plastic containers for the single serve juice and wine markets. Our line of Heat-Tek(TM) PET plastic bottles for hot-filled beverages, such as sports drinks and juices, includes sizes from 8 ounces to 64 ounces. International Packaging The international packaging segment, which accounted for 24 percent of Ball’s consolidated net sales in 2005, consists of 10 beverage can plants and two beverage can end plants in Europe, as well as operations in the People’s Republic of China (PRC). Of the 12 European plants, four are located in Germany, three in the United Kingdom, two in France and one each in the Netherlands, Poland and Serbia. In total the European plants produced approximately 12 billion cans in 2005, with approximately 50 percent of those being produced from steel and 50 percent from aluminum. Six of the can plants use aluminum and four use steel. Ball Packaging Europe is the second largest metal beverage container producer in Europe, with an estimated 29 percent of European shipments, and produces two-piece beverage cans and can ends for producers of beer, carbonated soft drinks, mineral water, fruit juices, energy drinks and other beverages. Ball Packaging Europe is the largest metal beverage container manufacturer in Germany, France and the Benelux countries and the second largest metal beverage container manufacturer in the United Kingdom and Poland. Near the end of the second quarter of 2005, Ball completed the construction of a new aluminum beverage can manufacturing plant in Belgrade, Serbia, to serve the growing demand for beverage cans in southern and eastern Europe.

Page 4 of 97
As in North America, the metal beverage container continues to compete aggressively with other packaging materials used by the European beer and carbonated soft drink industries. The glass bottle is heavily utilized in the packaged beer industry, while the PET container is increasingly utilized in the carbonated soft drink, juice and mineral water industries. Due to political and legal uncertainties in Germany, no nationwide system for returning beverage containers was in place at the time a mandatory deposit was imposed in January 2003 and nearly all retailers stopped carrying beverages in non-refillable containers. During 2003 and 2004, we responded to the resulting lower demand for beverage cans by reducing production at our German plants, implementing aggressive cost reduction measures and increasing exports from Germany to other countries in the region served by Ball Packaging Europe. We also closed a plant in the United Kingdom, shut down a production line in Germany, delayed capital investment projects in France and Poland and converted one of our steel can production lines in Germany to aluminum in order to facilitate additional can exports from Germany. In 2004 the German parliament adopted a new packaging ordinance, imposing a 25 eurocent deposit on all one-way glass, PET and metal containers for water, beer and carbonated soft drinks. As of May 1, 2006, all retailers must redeem all returned one-way containers as long as they sell such containers. Major retailers in Germany have begun the process of implementing a returnable system for one-way containers since they, along with fillers, now appear to accept the deposit as permanent. The retailers and the filling and packaging industries have formed a committee to design a nationwide recollection system and several retailers have begun to order reverse vending machines in order to meet the May 1, 2006, deadline. The European beverage can business is capital intensive, requiring significant investments in machinery and equipment. Profitability is sensitive to selling prices, foreign exchange rates, transportation costs, production volumes, labor and the costs and availability of certain raw materials, such as aluminum and steel. The European aluminum and steel industries are highly consolidated with three steel suppliers and three aluminum suppliers providing 95 percent of European requirements. Material supply contracts are generally for a period of one year, although Ball Packaging Europe has negotiated some longer term agreements. Aluminum is purchased primarily in U.S. dollars while the functional currencies of Ball Packaging Europe and its subsidiaries are non-U.S. dollars. This inherently results in a foreign exchange rate risk, which the company minimizes through the use of derivative contracts. In addition, purchase and sales contracts include fixed price, floating and pass-through pricing arrangements. R&D efforts in Europe are directed toward the development of new sizes and types of metal containers, as well as new uses for the current containers. Other research and development objectives in this segment include improving manufacturing efficiencies. The European R&D activities are conducted in a technical center located in Bonn, Germany. Through Ball Asia Pacific Limited, we are one of the largest beverage can manufacturers in the PRC and believe that our facilities are among the most modern in that country. Capacity grew rapidly in the PRC in the late 1990s, resulting in a supply/demand imbalance to which we responded by rationalizing capacity. Demand growth has resumed in the past few years with projected annual growth expected to be in the 5 to 10 percent range in the near term. Ball is also undertaking selected capacity increases in its existing facilities in order to participate in the projected growth. Our current operations include the manufacture of aluminum cans and ends in three plants and high-density plastic containers in two plants. Sales in the PRC represented 3 percent of consolidated net sales. We also participate in three joint ventures that manufacture aluminum cans and ends in Brazil and in the PRC. In the fourth quarter of 2004, we recorded an allowance for doubtful accounts in respect of a receivable of a 35 percent owned joint venture in the PRC. In the first quarter of 2005, the remaining carrying value of the company’s investment in this joint venture was written off. For more information on Ball’s international operations, see Item 2, Properties, and Exhibit 21, Subsidiary List.

Page 5 of 97
Aerospace and Technologies The aerospace and technologies segment includes defense operations, civil space systems and commercial space operations. The defense operations business unit includes defense systems, systems engineering services, advanced antenna and video systems and electro-optics and cryogenic systems and components. Sales in the aerospace and technologies segment accounted for 12 percent of consolidated net sales in 2005. The majority of the aerospace and technologies business involves work under contracts, generally from one to five years in duration, as a prime contractor or subcontractor for the National Aeronautics and Space Administration (NASA), the U.S. Department of Defense (DoD) and other U.S. government agencies. Contracts funded by the various agencies of the federal government represented 87 percent of segment sales in 2005. Geopolitical events and executive and legislative branch priorities have yielded considerable growth opportunities in areas matching our core capabilities. However, there is strong competition for new business. Civil space systems, defense systems and commercial space operations include hardware, software and services sold primarily to U.S. customers, with emphasis on space science and exploration, environmental and Earth sciences, and defense and intelligence applications. Major contractual activities frequently involve the design, manufacture and testing of satellites, remote sensors and ground station control hardware and software, as well as related services such as launch vehicle integration and satellite operations. Other hardware activities include: target identification, warning and attitude control systems and components; cryogenic systems for reactant storage, and sensor cooling devices using either closed-cycle mechanical refrigerators or open-cycle solid and liquid cryogens; star trackers, which are general-purpose stellar attitude sensors; and fast-steering mirrors. Additionally, the aerospace and technologies segment provides diversified technical services and products to government agencies, prime contractors and commercial organizations for a broad range of information warfare, electronic warfare, avionics, intelligence, training and space systems needs. Backlog in the aerospace and technologies segment was $761 million and $694 million at December 31, 2005 and 2004, respectively, and consists of the aggregate contract value of firm orders, excluding amounts previously recognized as revenue. The 2005 backlog includes $458 million expected to be recognized in revenues during 2006, with the remainder expected to be recognized in revenues thereafter. Unfunded amounts included in backlog for certain firm government orders which are subject to annual funding were $500 million and $393 million at December 31, 2005 and 2004, respectively. Year-to-year comparisons of backlog are not necessarily indicative of the trend of future operations. The company’s aerospace and technologies segment has contracts with the U.S. government or its contractors which have standard termination provisions. The government retains the right to terminate contracts at its convenience. However, if contracts are terminated in this manner, Ball is entitled to reimbursement for allowable costs and profits on authorized work performed through the date of termination. U.S. government contracts are also subject to reduction or modification in the event of changes in government requirements or budgetary constraints.
Patents
In the opinion of the company, none of its active patents is essential to the successful operation of its business as a whole.
Research and Development
Note 18, "Research and Development," in the consolidated financial statements within Item 8 of this report, contains information on company research and development activity. Additional information is also included in Item 2, “Properties,” below.

Page 6 of 97
Environment Aluminum, steel and PET containers are recyclable, and significant amounts of used containers are being diverted from the solid waste stream and recycled. Using the most recent data available, in 2004 approximately 51 percent of aluminum containers, 62 percent of steel containers and 22 percent of the PET containers sold in the U.S. were recycled. Recycling rates vary throughout Europe, but generally average 60 percent for aluminum and steel containers, which exceeds the European Union’s goal of 50 percent recycling for metals. Due in part to the intrinsic value of aluminum and steel, metal packaging recycling rates in Europe compare favorably to those of other packaging materials. Compliance with federal, state and local laws relating to protection of the environment has not had a material, adverse effect upon the capital expenditures, earnings or competitive position of the company. As more fully described under Item 3, Legal Proceedings, the U.S. Environmental Protection Agency and various state environmental agencies have designated the company as a potentially responsible party, along with numerous other companies, for the cleanup of several hazardous waste sites. However, the company’s information at this time indicates that these matters will not have a material adverse effect upon the liquidity, results of operations or financial condition of the company. Legislation which would prohibit, tax or restrict the sale or use of certain types of containers, and would require diversion of solid wastes such as packaging materials from disposal in landfills, has been or may be introduced anywhere we operate. While container legislation has been adopted in some jurisdictions, similar legislation has been defeated in public referenda and legislative bodies in numerous others. The company anticipates that continuing efforts will be made to consider and adopt such legislation in many jurisdictions in the future. If such legislation were widely adopted, it potentially could have a material adverse effect on the business of the company, as well as on the container manufacturing industry generally, in view of the company’s substantial global sales and investment in metal and PET container manufacturing. However, the packages we produce are widely used and perform well in U.S. states and Canadian provinces that have deposit systems.
Employees At the end of December 2005 the company employed 13,100 people worldwide, including 9,000 employees in the U.S. and 4,100 in other countries. There are an additional 1,000 employees employed in unconsolidated joint ventures in which Ball participates. Approximately one-third of Ball's North American packaging plant employees are unionized and most of our European plant employees are union workers. Collective bargaining agreements with various unions in the U.S. have terms of three to five years and those in Europe have terms of one to two years. The agreements expire at regular intervals and are customarily renewed in the ordinary course after bargaining between union and company representatives. The company believes that its employee relations are good and that its training, education and retention practices assist in enhancing employee satisfaction levels.

Page 7 of 97
Where to Find More Information Ball Corporation is subject to the reporting and other information requirements of the Securities Exchange Act of 1934, as amended (Exchange Act). Reports and other information filed with the Securities and Exchange Commission (SEC) pursuant to the Exchange Act may be inspected and copied at the public reference facility maintained by the SEC in Washington, D.C. The SEC maintains a website at www.sec.gov containing our reports, proxy materials, information statements and other items. The company also maintains a website at www.ball.com on which it provides a link to access Ball’s SEC reports free of charge. The company has established written Ball Corporation Corporate Governance Guidelines; a Ball Corporation Executive Officers and Board of Directors Business Ethics Statement; a Business Ethics booklet; and Ball Corporation Audit Committee, Nominating/Corporate Governance Committee, Human Resources Committee and Finance Committee charters. These documents are set forth on the company’s website at www.ball.com under the section “Investors,” under the subsection “Financial Information,” and under the link “Corporate Governance.” A copy may also be obtained upon request from the company’s corporate secretary. The company intends to post on its website the nature of any amendments to the company’s codes of ethics that apply to executive officers and directors, including the chief executive officer, chief financial officer or controller, and the nature of any waiver or implied waiver from any code of ethics granted by the company to any executive officer or director. The posting will appear on the company’s website at www.ball.com under the section “Investors,” under the subsection “Financial Information,” and under the link “Corporate Governance.” Item 1A. Risk Factors Any of the following risks could materially and adversely affect our business, financial condition or results of operations. The loss of a key customer could have a significant negative impact on our sales. While we have diversified our customer base, we do sell a majority of our packaging products to relatively few major beverage and packaged food companies, some of which operate in North America, Europe and Asia. Although approximately 70 percent of our customer contracts are long-term, these contracts are terminable under certain circumstances, such as our failure to meet quality or volume requirements. Because we depend on relatively few major customers, our business, financial condition or results of operations could be adversely affected by the loss of any of these customers, a reduction in the purchasing levels of these customers, a strike or work stoppage by a significant number of these customers' employees or an adverse change in the terms of the supply agreements with these customers. The primary customers for our aerospace work are U.S. government agencies or their prime contractors. These sales represented approximately 11 percent of Ball's consolidated 2005 net sales. Our contracts with these customers are subject to, among other things, the following risks:
• unilateral termination for convenience by the customers; • reduction or modification in the scope of the contracts due to changes in the customer's requirements or
budgetary constraints; • under fixed-price contracts, increased or unexpected costs causing losses or reduced profits; and • under cost reimbursement contracts, unallowable costs causing losses or reduced profits.

Page 8 of 97
We face competitive risks from many sources that may negatively impact our profitability. Competition within the packaging industry is intense. Increases in productivity, combined with surplus capacity in the industry, have maintained competitive pricing pressures. The principal methods of competition in the general packaging industry are price, service and quality. Some of our competitors may have greater financial, technical and marketing resources. Our current or potential competitors may offer products at a lower price or products that are deemed superior to ours. We are subject to competition from alternative products which could result in lower profits and reduced cash flows. The metal beverage can is subject to significant competition from substitute products, particularly plastic carbonated soft drink bottles made from PET, single serve beer bottles, and containers made of glass, cardboard or other materials. Competition from plastic carbonated soft drink bottles is particularly intense in the United States and the United Kingdom. There can be no assurance that we will successfully compete against alternative beverage containers which could result in a reduction in our profits or cash flow. We have a narrow product range and our business would suffer if usage of our products decreased. For the 12 months ended December 31, 2005, 42 percent of our consolidated net sales were from the sale of metal beverage cans, and we expect to derive a significant portion of our future revenues from the sale of metal beverage cans. We sell no PET bottles in Europe. Our business would suffer if the use of metal beverage cans decreased. Accordingly, broad acceptance by consumers of aluminum and steel cans for a wide variety of beverages is critical to our future success. If demand for glass and PET bottles increases relative to cans, or the demand for aluminum and steel cans does not develop as expected, our business, financial condition or results of operations could be materially adversely affected. Our business, financial condition and results of operations are subject to risks resulting from increased international operations. We derived 24 percent of our total net sales from outside of North America in the year ended December 31, 2005. The increased scope of international operations may lead to more volatile financial results and make it more difficult for us to manage our business. Reasons for this include, but are not limited to, the following:
• political and economic instability in foreign markets; • foreign governments' restrictive trade policies; • the imposition of duties, taxes or government royalties; • foreign exchange rate risks; • difficulties in enforcement of contractual obligations and intellectual property rights; and • the geographic, time zone, language and cultural differences between personnel in different areas of the
world. Any of these factors could materially adversely affect our business, financial condition or results of operations. We are exposed to exchange rate fluctuations. For the 12 months ended December 31, 2005, 72 percent of our net sales were attributable to operations with U.S. dollars as their functional currency, and 28 percent of our net sales were attributable to operations having other functional currencies, with 12 percent of net sales attributable to the euro. Our reporting currency is the U.S. dollar. Historically, Ball's foreign operations, including assets and liabilities and revenues and expenses, have been denominated in various currencies other than the U.S. dollar, and we expect that our foreign operations will continue to be so denominated. As a result, the U.S. dollar value of Ball's foreign operations have varied, and will continue to vary, with exchange rate fluctuations. In this respect, historically Ball has been primarily exposed to fluctuations in the exchange rate of the euro, British pound, Canadian dollar, Polish zloty, Chinese renminbi, Brazilian real and Serbian dinar.
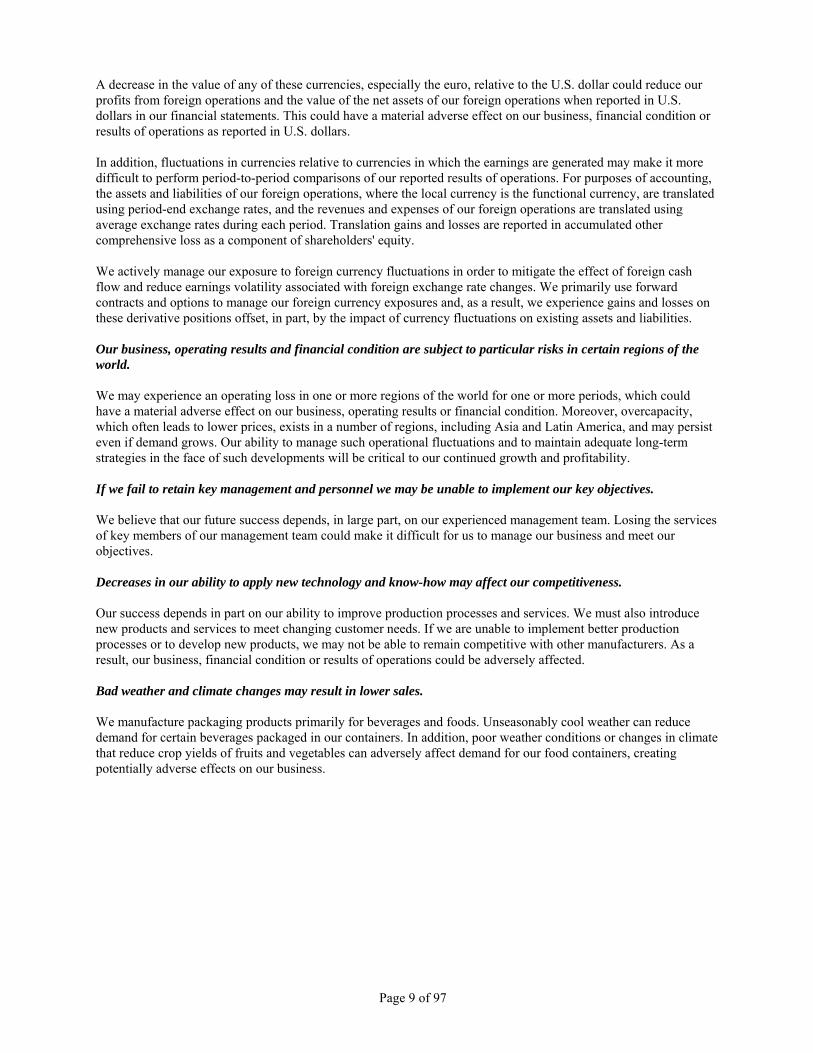
Page 9 of 97
A decrease in the value of any of these currencies, especially the euro, relative to the U.S. dollar could reduce our profits from foreign operations and the value of the net assets of our foreign operations when reported in U.S. dollars in our financial statements. This could have a material adverse effect on our business, financial condition or results of operations as reported in U.S. dollars. In addition, fluctuations in currencies relative to currencies in which the earnings are generated may make it more difficult to perform period-to-period comparisons of our reported results of operations. For purposes of accounting, the assets and liabilities of our foreign operations, where the local currency is the functional currency, are translated using period-end exchange rates, and the revenues and expenses of our foreign operations are translated using average exchange rates during each period. Translation gains and losses are reported in accumulated other comprehensive loss as a component of shareholders' equity. We actively manage our exposure to foreign currency fluctuations in order to mitigate the effect of foreign cash flow and reduce earnings volatility associated with foreign exchange rate changes. We primarily use forward contracts and options to manage our foreign currency exposures and, as a result, we experience gains and losses on these derivative positions offset, in part, by the impact of currency fluctuations on existing assets and liabilities. Our business, operating results and financial condition are subject to particular risks in certain regions of the world. We may experience an operating loss in one or more regions of the world for one or more periods, which could have a material adverse effect on our business, operating results or financial condition. Moreover, overcapacity, which often leads to lower prices, exists in a number of regions, including Asia and Latin America, and may persist even if demand grows. Our ability to manage such operational fluctuations and to maintain adequate long-term strategies in the face of such developments will be critical to our continued growth and profitability. If we fail to retain key management and personnel we may be unable to implement our key objectives. We believe that our future success depends, in large part, on our experienced management team. Losing the services of key members of our management team could make it difficult for us to manage our business and meet our objectives. Decreases in our ability to apply new technology and know-how may affect our competitiveness. Our success depends in part on our ability to improve production processes and services. We must also introduce new products and services to meet changing customer needs. If we are unable to implement better production processes or to develop new products, we may not be able to remain competitive with other manufacturers. As a result, our business, financial condition or results of operations could be adversely affected. Bad weather and climate changes may result in lower sales. We manufacture packaging products primarily for beverages and foods. Unseasonably cool weather can reduce demand for certain beverages packaged in our containers. In addition, poor weather conditions or changes in climate that reduce crop yields of fruits and vegetables can adversely affect demand for our food containers, creating potentially adverse effects on our business.
Page 10 of 97
We are vulnerable to fluctuations in the supply and price of raw materials. We purchase aluminum, steel, plastic resin and other raw materials and packaging supplies from several sources. While all such materials are available from numerous independent suppliers, raw materials are subject to fluctuations in price attributable to a number of factors, including general economic conditions, the demand by other industries for the same raw materials and the availability of complementary and substitute materials. Although we enter into commodities purchase agreements from time to time and use derivative instruments to hedge our risk, we cannot ensure that our current suppliers of raw materials will be able to supply us with sufficient quantities or at reasonable prices. Increases in raw material costs could have a material adverse effect on our business, financial condition or results of operations. Because our North American contracts often pass raw material costs directly on to the customer, increasing raw materials costs may not impact our near-term profitability but could decrease our sales volume over time. In Europe, our contracts do not typically allow us to pass on increased raw material costs and we regularly use derivative agreements to manage this risk; however, our hedging procedures may be insufficient and our results could be materially impacted if materials costs increase suddenly in Europe. Prolonged work stoppages at plants with union employees could jeopardize our financial position. As of December 31, 2005, approximately one-third of our employees in North America and most of our employees in Europe were covered by one or more collective bargaining agreements. These collective bargaining agreements have staggered expirations over the next three years. Although we consider our employee relations to be generally good, a prolonged work stoppage or strike at any facility with union employees could have a material adverse effect on our business, financial condition or results of operations. In addition, we cannot assure you that upon the expiration of existing collective bargaining agreements new agreements will be reached without union action or that any such new agreements will be on terms satisfactory to us. Our business is subject to substantial environmental remediation and compliance costs. Our operations are subject to federal, state and local laws and regulations relating to environmental hazards, such as emissions to air, discharges to water, the handling and disposal of hazardous and solid wastes and the cleanup of hazardous substances. The U.S. Environmental Protection Agency has designated us, along with numerous other companies, as a potentially responsible party for the cleanup of several hazardous waste sites. Based on available information, we do not believe that any costs incurred in connection with such sites will have a material adverse effect on our financial condition, results of operations, capital expenditures or competitive position. If we were required to write down all or part of our goodwill, our net earnings and net worth could be materially adversely affected. We have $1,258.6 million of net goodwill recorded on our consolidated balance sheet as of December 31, 2005. We are required to periodically determine if our goodwill has become impaired, in which case we would write down the impaired portion of our goodwill. If we were required to write down all or part of our goodwill, our net earnings and net worth could be materially adversely affected. If the investments in Ball's pension plans do not perform as expected, we may have to contribute additional amounts to the plans, which would otherwise be available to cover operating expenses. Ball maintains noncontributory, defined benefit pension plans covering substantially all of its U.S. employees, which we fund based on certain actuarial assumptions. The plans' assets consist primarily of common stocks and fixed income securities. If the investments in the plan do not perform at expected levels, then we will have to contribute additional funds to ensure that the program will be able to pay out benefits as scheduled. Such an increase in funding could result in a decrease in our available cash flow and net earnings and the recognition of such an increase could result in a reduction to our shareholders' equity. We recorded an increase in our minimum pension liability in the fourth quarter of 2005 largely as a reduction in the assumed discount rate. This increase in pension liability was reflected as an increase in other liabilities and a corresponding decrease in stockholders' equity.

Page 11 of 97
Our significant debt could adversely affect our financial health and prevent us from fulfilling our obligations under the notes. We have a significant amount of debt. On December 31, 2005, we had total debt of $1,589.7 million. Our ratio of earnings to fixed charges as of that date was 3.4 times (see Exhibit 12 attached to this Annual Report). Our high level of debt could have important consequences, including the following:
• use of a large portion of our cash flow to pay principal and interest on our notes, the new credit facilities and our other debt, which will reduce the availability of our cash flow to fund working capital, capital expenditures, research and development expenditures and other business activities;
• increase our vulnerability to general adverse economic and industry conditions; • limit our flexibility in planning for, or reacting to, changes in our business and the industry in which we
operate; • restrict us from making strategic acquisitions or exploiting business opportunities; • place us at a competitive disadvantage compared to our competitors that have less debt; • limit our ability to make capital expenditures in order to maintain our manufacturing plants in good
working order and repair; and • limit, along with the financial and other restrictive covenants in our debt, among other things, our ability to
borrow additional funds, dispose of assets or pay cash dividends. In addition, a substantial portion of our debt bears interest at variable rates. If market interest rates increase, variable-rate debt will create higher debt service requirements, which would adversely affect our cash flow. While we sometimes enter into agreements limiting our exposure, any such agreements may not offer complete protection from this risk. We will require a significant amount of cash to service our debt. Our ability to generate cash depends on many factors beyond our control. Our ability to make payments on and to refinance our debt, including the notes, and to fund planned capital expenditures and research and development efforts, will depend on our ability to generate cash in the future. This is subject to general economic, financial, competitive, legislative, regulatory and other factors that may be beyond our control. Based on our current level of operations, we believe our cash flow from operations, available cash and available borrowings under our new credit facilities, will be adequate to meet our future liquidity needs for the next several years barring any unforeseen circumstances which are beyond our control. We cannot assure you, however, that our business will generate sufficient cash flow from operations or that future borrowings will be available to us under our new credit facilities or otherwise in an amount sufficient to enable us to pay our debt, including the notes, or to fund our other liquidity needs. We may need to refinance all or a portion of our debt, including the notes, on or before maturity. We cannot assure you that we will be able to refinance any of our debt, including our new credit facilities and our senior notes, on commercially reasonable terms or at all. Item 1B. Unresolved Staff Comments There were no matters required to be reported under this item.

Page 12 of 97
Item 2. Properties The company’s properties described below are well maintained, are considered adequate and are being utilized for their intended purposes. Ball’s corporate headquarters and the Ball Aerospace & Technologies Corp. offices are located in Broomfield, Colorado. The Colorado-based operations of the aerospace and technologies business occupy a variety of company-owned and leased facilities in Broomfield, Boulder and Westminster, which together aggregate 1.4 million square feet of office, laboratory, research and development, engineering and test and manufacturing space. During 2005 the company commenced construction on additional facilities adjacent to existing facilities in Boulder and Westminster. Other aerospace and technologies operations carry on business in company-owned and leased facilities in Georgia, New Mexico, Ohio, Virginia, Washington and Australia. The offices of the company’s North American packaging operations are in Westminster, Colorado, and the offices for the European packaging operations are in Ratingen, Germany. Also located in Westminster is the Ball Technology and Innovation Center, which serves as a research and development facility for the North American metal packaging and plastic container operations. The European Technical Centre, which serves as a research and development facility for the European beverage can manufacturing operations, is located in Bonn, Germany. Information regarding the approximate size of the manufacturing locations for significant packaging operations, which are owned or leased by the company, is set forth below. Facilities in the process of being shut down have been excluded from the list. Where certain locations include multiple facilities, the total approximate size for the location is noted. In addition to the facilities listed, the company leases other warehousing space.

Page 13 of 97
Approximate Floor Space in
Plant Location Square Feet
Metal packaging manufacturing facilities: North America
Springdale, Arkansas 286,000 Richmond, British Columbia 194,000 Fairfield, California 340,000 Oakdale, California 370,000 Torrance, California 478,000 Golden, Colorado 500,000 Tampa, Florida 275,000 Kapolei, Hawaii 132,000 Monticello, Indiana 356,000 Kansas City, Missouri 400,000 Saratoga Springs, New York 358,000 Wallkill, New York 317,000 Reidsville, North Carolina 287,000 Columbus, Ohio 305,000 Findlay, Ohio* 733,000 Burlington, Ontario 308,000 Whitby, Ontario* 200,000 Guayama, Puerto Rico 230,000 Chestnut Hill, Tennessee 315,000 Conroe, Texas 275,000 Fort Worth, Texas 328,000 Bristol, Virginia 241,000 Williamsburg, Virginia 400,000 Kent, Washington 166,000 Weirton, West Virginia (leased) 120,000 DeForest, Wisconsin 360,000 Milwaukee, Wisconsin* 397,000
Europe
Bierne, France 263,000 La Ciotat, France 393,000 Braunschweig, Germany 258,000 Hassloch, Germany 283,000 Hermsdorf, Germany 269,000 Weissenthurm, Germany 260,000 Oss, The Netherlands 231,000 Radomsko, Poland 309,000 Belgrade, Serbia 352,000 Deeside, U.K. 109,000 Rugby, U.K. 175,000 Wrexham, U.K. 222,000
Asia
Beijing, PRC 303,000 Hubei (Wuhan), PRC 237,000 Shenzhen, PRC 404,000
* Includes both metal beverage container and metal food container manufacturing operations.

Page 14 of 97
Approximate Floor Space in
Plant Location Square Feet
Plastic packaging manufacturing facilities: North America
Chino, California (leased) 578,000 Ames, Iowa (including leased warehouse space) 840,000 Delran, New Jersey 450,000 Baldwinsville, New York (leased) 508,000 Watertown, Wisconsin 111,000
Asia
Zhongfu, PRC (leased) (Tianjin) 52,000 Hemei, PRC (Taicang) 47,000
In addition to the consolidated manufacturing facilities, the company has ownership interests of 50 percent or less in packaging affiliates located primarily in the U.S., PRC and Brazil. Item 3. Legal Proceedings
North America As previously reported, the U.S. Environmental Protection Agency (USEPA) considers the company a Potentially Responsible Party (PRP) with respect to the Lowry Landfill site located east of Denver, Colorado. On June 12, 1992, the company was served with a lawsuit filed by the City and County of Denver (Denver) and Waste Management of Colorado, Inc., seeking contributions from the company and approximately 38 other companies. The company filed its answer denying the allegations of the complaint. On July 8, 1992, the company was served with a third-party complaint filed by S.W. Shattuck Chemical Company, Inc., seeking contribution from the company and other companies for the costs associated with cleaning up the Lowry Landfill. The company denied the allegations of the complaints. In July 1992 the company entered into a settlement and indemnification agreement with Chemical Waste Management, Inc., and Waste Management of Colorado, Inc. (collectively Waste Management) and Denver pursuant to which Waste Management and Denver dismissed their lawsuit against the company and Waste Management agreed to defend, indemnify and hold harmless the company from claims and lawsuits brought by governmental agencies and other parties relating to actions seeking contributions or remedial costs from the company for the cleanup of the site. Several other companies, which are defendants in the above-referenced lawsuits, had already entered into the settlement and indemnification agreement with Waste Management and Denver. Waste Management, Inc., has agreed to guarantee the obligations for Chemical Waste Management, Inc., and Waste Management of Colorado, Inc. Waste Management and Denver may seek additional payments from the company if the response costs related to the site exceed $319 million. In 2003 Waste Management, Inc., indicated that the cost of the site might exceed $319 million in 2030, approximately three years before the projected completion of the project. The company might also be responsible for payments (based on 1992 dollars) for any additional wastes which may have been disposed of by the company at the site but which are identified after the execution of the settlement agreement. While remediating the site, contaminants were encountered which could add an additional cleanup cost of approximately $10 million. This additional cleanup cost could, in turn, add approximately $1 million to total site costs for the PRP group. At this time, there are no Lowry Landfill actions in which the company is actively involved. Based on the information available to the company at this time, the company does not believe that this matter will have a material adverse effect upon the liquidity, results of operations or financial condition of the company. The company previously reported that, on August 1, 1997, the USEPA sent notice of potential liability to 19 PRPs concerning past activities at one or more of the four Rocky Flats parcels (including land owned by Precision Chemicals now owned by Great Western Inorganics) at the Rocky Flats Industrial Park site (RFIP) located in Jefferson County, Colorado. The RFIP site also includes the American Ecological Recycling and Research

Page 15 of 97
Company (AERRCO) site and a site owned by Thoro Products Company. Based upon sampling at the site in 1996, the USEPA determined that additional site work would be required to determine the extent of contamination and the possible cleanup of the site. In 1996 the USEPA requested that the PRPs perform certain site work. On December 19, 1997, the USEPA issued an Administrative Order on Consent (AOC) to conduct engineering estimates and cost analyses. The company has funded approximately $70,000 toward these costs. The PRPs have negotiated an agreement and the company contributed $5,000 as an initial group contribution. The company has agreed to pay 12 percent of the costs of cleanup at the AERRCO site and a percentage of the cleanup costs on the Thoro site. On January 8, 2003, and October 9, 2003, the company made additional payments of $97,200 each (total $194,400) toward the cost of cleanup. The company paid $35,355 in 2004 toward the cleanup. The air sparge and soil vapor extraction system was installed at a total cost of $1.1 million and was placed in operation in May 2005. Based on the information, or lack thereof, available to the company at the present time, the company does not believe that this matter will have a material adverse effect upon the liquidity, results of operations or financial condition of the company. As previously reported, in October 2001 representatives of Vauxmont Intermountain Communities (Vauxmont) notified six of the PRPs at the AERRCO site, including the company (AERRCO PRPs), that hazardous materials might have contaminated property owned by Vauxmont. The AERRCO site is contained within the RFIP site. Vauxmont also alleges that it lost $7 million on a contract with a home developer for the purchase of a portion of the land. Vauxmont representatives requested that the AERRCO PRPs study any contamination to the Vauxmont real estate. The AERRCO PRPs agreed to undertake such a study and sought the USEPA’s final approval. The sampling results were made available to all parties. No further claims have been made against the company by Vauxmont to date. Based on the information, or lack thereof, available to the company at the present time, the company does not believe that this matter will have a material adverse effect upon the liquidity, results of operations or financial condition of the company. As previously reported, during July 1992, the company received information that it had been named a PRP with respect to the Solvents Recovery of New England Site (SRSNE) located in Southington, Connecticut. According to the information received, it is alleged that the company contributed approximately 0.08816 percent of the waste contributed to the site on a volumetric basis. The PRP group has been involved in negotiations with the USEPA regarding the remediation of the site. The company has paid approximately $17,500 toward site investigation and remediation efforts. The PRP group spent $15 million through the end of 2001. Approximately $1.5 million more was spent to complete a Remedial Investigation and Feasibility Study and pay for remediation work through 2003. As of December 2001, projected remediation cost estimates for a bioremediation and enhanced oxidation system ranged from $20 million to $30 million. The PRP group offered a $5.5 million settlement to resolve the USEPA claim of $16 million for past costs at the SRSNE site. PRP/USEPA negotiations to resolve the past cost claims from the USEPA have not been resolved and are not being actively pursued by the PRP group. A natural resources damage claim of approximately $3 million is anticipated. USEPA gave final approval for a $29 million remediation plan for the site on October 11, 2005. The company will be responsible for approximately 0.00109 percent of the future site costs. Based on the information, or lack thereof, available to the company at the present time, the company does not believe that this matter will have a material adverse effect upon the liquidity, results of operations or financial condition of the company. On December 30, 2002, the company received a 104(e) letter from the USEPA pursuant to the Comprehensive Environmental Response Compensation and Liability Act (CERCLA) requesting answers to certain questions regarding the waste disposal practices of Heekin Can Company and the relationship between the company and Heekin Can Company. Region 5 of the USEPA is involved in the cleanup of the Jackson Brothers Paint Company site, which consists of four, and possibly five, sites in and around Laurel, Indiana. The Jackson Brothers Paint Company apparently disposed of drums of waste in those sites during the 1960s and 1970s. The USEPA has alleged that some of the waste that has been uncovered was sent to the sites from the Cincinnati plant operated by Heekin Can Company. The Indiana Department of Environmental Management referred this matter to the USEPA for removal of the drums and cleanup. At the present time there are an undetermined number of drums at one or more of the sites that have been initially identified by the USEPA as originating from Heekin Can Company. The USEPA has sent 104(e) letters to seven PRPs including Heekin Can Company. On January 30, 2003, the company responded to the request for information pursuant to Section 104(e) of CERCLA. The USEPA has initially estimated cleanup costs to be between $4 million and $5 million. Based on the information, or lack thereof, available to the company at the present time, the company does not believe that this matter will have a material adverse effect upon the liquidity, results of operations or financial condition of the company.

Page 16 of 97
As previously reported, on October 6, 2005, Ball Metal Beverage Container Corp. (BMBCC), a wholly owned subsidiary of the company, was served with an amended complaint filed by Crown Packaging Technology, Inc. et. al. (Crown), in the U.S. District Court for the Southern District of Ohio, Western Division at Dayton, Ohio. The complaint alleges that the manufacture, sale and use of certain ends by BMBCC and its customers infringes certain claims of Crown’s U.S. patents. The complaint seeks unspecified monetary damages, fees, and declaratory and injunctive relief. BMBCC has formally denied the allegations of the complaint. Based on the information available to the company at the present time, the company does not believe that this matter will have a material adverse effect upon the liquidity, results of operations or financial condition of the company. On November 21, 2005, Ball Plastic Container Corp. (BPCC), a wholly owned subsidiary of the company, was served with a complaint filed by Constar International Inc. (Constar) in the U.S. District Court for the Western District of Wisconsin. The complaint alleges that the manufacture and sale of plastic bottles having oxygen barrier properties infringes certain claims of a Constar U.S. patent. Constar also sued Honeywell International Inc., the supplier of the oxygen barrier material to BPCC. The complaint seeks monetary damages, fees and declaratory and injunctive relief. BPCC has formally denied the allegations of the complaint. Based on the information available to the company at the present time, the company does not believe that this matter will have a material adverse effect upon the liquidity, results of operations or the financial condition of the company. Europe Ball Packaging Europe (BPE), together with other plaintiffs, is contesting in federal and state administrative courts the enactment of a mandatory deposit for non-refillable containers based on the German Packaging Regulation (Verpackungsverordnung). The proceedings in the State Administrative Court are still active in two states (Bavaria and Hamburg), and the proceedings in the other states have been declared inactive or have been retracted. The Federal Constitutional Court in Karsruhe (Bundesverfassungsgericht) has denied the motions of the plaintiffs for judgment. At the federal level, a proceeding with the Administrative Court in Berlin (Verwaltungsgericht Berlin) is still pending. BPE filed a motion for an expedited procedure with the objective of reinstating the suspensive effect of the procedure. The Administrative Court has denied the motion. BPE has filed an appeal against this decision with the Higher Administrative Court in Berlin (Oberverwaltungsgericht Berlin), which also denied the motion. The potential financial risk of legal fees, which BPE may incur in connection with the procedures set out above, amounts to approximately €280,000 and has been accrued by BPE. The European Court of Justice has issued a judgment that confirmed that the German deposit legislation violated, among other European Union (EU) regulations, the principle of free trade of goods within the EU and disadvantaged the importers of beverages versus German beverage producers. Following this judgment, two German law firms have suggested that importers of beverages and possibly even local beverage producers may be able to market beverages in Germany without mandatory deposit until a Germany-wide functioning return system is implemented. The German government does not share this point of view and has indicated that it will continue to apply the mandatory deposit regulations. In December 2004 the German government passed new legislation that imposes a mandatory deposit of 25 eurocents on nonrefillable containers in respect of all beverages except milk, wine, fruit juices and certain alcoholic beverages. Beverages in beverage carton packaging are also excluded from the deposit. The legislation required that the so-called “island solutions” are to be terminated after an interim period of 12 months after the legislation takes effect. The new legislation came into force in May 2005. Island solutions therefore will no longer be permissible as of May 1, 2006. The relevant industries, including BPE and its competitors, are currently setting up a Germany-wide return system planned to be operational in or about May 2006. Based upon the information, or lack thereof, available to the company at the present time, the company does not believe that this matter will have a material adverse effect upon the liquidity, results of operations or financial condition of the company. Item 4. Submission of Matters to Vote of Security Holders There were no matters submitted to the security holders during the fourth quarter of 2005.

Page 17 of 97
Part II Item 5. Market for the Registrant’s Common Stock and Related Stockholder Matters Ball Corporation common stock (BLL) is traded on the New York, Chicago and Pacific Stock Exchanges. There were 5,523 common shareholders of record on February 3, 2006. Common Stock Repurchases The following table summarizes the company’s repurchases of its common stock during the quarter ended December 31, 2005.
Purchases of Securities
($ in millions)
Total Number of Shares Purchased
Average PricePaid per Share
Total Number of Shares Purchased as
Part of Publicly Announced Plans or
Programs
Maximum Number of Shares that May Yet Be Purchased Under the Plans or Programs(b)
October 3 to October 30, 2005 1,111,484 $ 36.67 1,111,484 12,000,000 October 31 to November 27,
2005
3,502
$ 38.83
3,502
11,996,498 November 28 to December 31,
2005
1,504
$ 40.03
1,504
11,994,994 Total 1,116,490(a) $ 36.68 1,116,490
(a) Includes open market purchases and/or shares retained by the company to settle employee withholding tax liabilities. (b) The company has an ongoing repurchase program for which shares are authorized from time to time by Ball’s board of
directors. On October 26, 2005, the board authorized the repurchase of up to 12 million shares of the company’s common stock. This most recent repurchase authorization replaced all previous authorizations.
Quarterly Stock Prices and Dividends Quarterly prices for the company's common stock, as reported on the New York Stock Exchange composite tape, and quarterly dividends in 2005 and 2004 (on a calendar quarter basis) were:
2005 2004 4th 3rd 2nd 1st 4th 3rd 2nd 1st Quarter Quarter Quarter Quarter Quarter Quarter(a) Quarter(a) Quarter(a)
High $ 41.95 $ 39.78 $ 42.70 $ 46.45 $ 45.20 $ 38.30 $ 36.23 $ 34.43 Low 35.06 35.25 35.80 39.65 35.81 34.12 30.20 28.255 Dividends per share 0.10 0.10 0.10 0.10 0.10 0.10 0.075 0.075
(a) Amounts have been retroactively adjusted for a two-for-one stock split, which was effected on August 23, 2004.

Page 18 of 97
Item 6. Selected Financial Data Five-Year Review of Selected Financial Data Ball Corporation and Subsidiaries ($ in millions, except per share amounts) 2005 2004 2003 2002 2001 Net sales $ 5,751.2 $ 5,440.2 $ 4,977.0 $ 3,858.9 $ 3,686.1
Net earnings (loss) (1) 261.5 295.6 229.9 156.1 (99.2) Preferred dividends, net of tax – – – – (2.0) Earnings (loss) attributable to common
shareholders (1)
$ 261.5
$ 295.6
$ 229.9
$ 156.1
$ (101.2) Return on average common
shareholders’ equity
27.2%
31.2%
35.4%
31.3%
(17.7)%
Basic earnings (loss) per share (1) (2) $ 2.43 $ 2.67 $ 2.06 $ 1.39 $ (0.92) Weighted average common shares
outstanding (000s) (2)
107,758
110,846
111,710
112,634
109,759
Diluted earnings (loss) per share (1) (2) $ 2.38 $ 2.60 $ 2.01 $ 1.36 $ (0.92) Diluted weighted average common
shares outstanding (000s) (2)
109,732
113,790
114,275
115,076
109,759 Property, plant and equipment additions $ 291.7 $ 196.0 $ 137.2 $ 158.4 $ 68.5 Depreciation and amortization $ 213.5 $ 215.1 $ 205.5 $ 149.2 $ 152.5 Total assets $ 4,343.4 $ 4,477.7 $ 4,069.6 $ 4,132.4 $ 2,313.6 Total interest bearing debt and capital
lease obligations
$ 1,589.7
$ 1,660.7
$ 1,686.9
$ 1,981.0
$ 1,064.1 Common shareholders’ equity $ 835.3 $ 1,086.6 $ 807.8 $ 492.9 $ 504.1 Market capitalization (3) $ 4,138.8 $ 4,956.2 $ 3,359.1 $ 2,904.8 $ 2,043.8 Net debt to market capitalization (3) 36.9% 29.5% 49.1% 59.3% 48.0% Cash dividends per share (2) $ 0.40 $ 0.35 $ 0.24 $ 0.18 $ 0.15 Book value per share (2) $ 8.02 $ 9.64 $ 7.17 $ 4.35 $ 4.36 Market value per share (2) $ 39.72 $ 43.98 $ 29.785 $ 25.595 $ 17.675 Annual return to common
shareholders (4)
(8.8)%
48.8%
17.4%
46.0%
55.3% Working capital $ 49.8 $ 249.3 $ 62.4 $ 155.6 $ 218.8 Current ratio 1.04 1.25 1.07 1.15 1.38
(1) Includes business consolidation activities and other items affecting comparability between years of pretax expense of $21.2 million
in 2005, pretax income of $15.2 million, $3.7 million and $2.3 million in 2004, 2003 and 2002, respectively, and pretax expense of $271.2 million in 2001. Also includes $19.3 million, $15.2 million and $5.2 million of debt refinancing costs in 2005, 2003 and 2002, respectively, reported as interest expense. Additional details about the 2005, 2004 and 2003 items are available in Notes 4, 9 and 11 to the consolidated financial statements within Item 8 of this report.
(2) Amounts have been retroactively restated for two-for-one stock splits, which were effected on August 23, 2004, and February 22, 2002.
(3) Market capitalization is defined as the number of common shares outstanding at year end, multiplied by the year-end closing price of Ball common stock. Net debt is total debt less cash and cash equivalents.
(4) Change in stock price plus dividend yield assuming reinvestment of all dividends paid.

Page 19 of 97
Item 7. Management’s Discussion and Analysis of Financial Condition and Results of Operations Management’s discussion and analysis should be read in conjunction with the consolidated financial statements and accompanying notes. Ball Corporation and its subsidiaries are referred to collectively as “Ball” or “the company” or “we” and “our” in the following discussion and analysis. BUSINESS OVERVIEW Ball Corporation is one of the world’s leading suppliers of metal and plastic packaging to the beverage and food industries. Our packaging products are produced for a variety of end uses and are currently manufactured in 49 plants around the world. We also supply aerospace and other technologies and services to governmental and commercial customers. We sell our packaging products primarily to major beverage and food producers with which we have developed long-term customer relationships. This is evidenced by our high customer retention and our large number of long-term supply contracts. While we have diversified our customer base, we do sell a majority of our packaging products to relatively few major beverage and food companies in North America, Europe and the People’s Republic of China (PRC), as do our equity joint ventures in Brazil, the U.S. and the PRC. We also purchase raw materials from relatively few suppliers. Because of our customer and supplier concentration, our business, financial condition and results of operations could be adversely affected by the loss of a major customer or supplier or a material change in a supply agreement with a major customer or supplier, although our long-term relationships and contracts mitigate these risks. In the rigid packaging industry, sales and earnings can be improved by reducing costs, developing new products, expanding volume and increasing pricing where possible. We are in the early stages of a project to upgrade and streamline our North American beverage can end manufacturing capabilities, a project that will result in productivity gains and cost reductions. While the U.S. and Canadian beverage container manufacturing industry is relatively mature, the European, PRC and Brazilian beverage can markets are growing (excluding the effects of the German mandatory deposit discussed in Note 21 to the consolidated financial statements) and are expected to continue to grow. We are capitalizing on the European growth by continuing to reconfigure some of our European can manufacturing lines and by opening in 2005 a new beverage can manufacturing plant in Belgrade, Serbia. Ball’s consolidated earnings are exposed to foreign exchange rate fluctuations. We attempt to mitigate this exposure through the use of derivative financial instruments, as discussed in the “Financial Instruments and Risk Management” sections (within Item 7A and Item 8, Note 16, of this report). As part of our packaging strategy, we are focused on developing and marketing new and existing products that meet the ever-expanding needs of our beverage and food customers. These innovations include new shapes, sizes, opening features and other functional benefits of both metal and plastic packaging. This packaging development activity helps us maintain and expand our supply positions with major beverage and food customers. The primary customers for the products and services provided by our aerospace and technologies segment are U.S. government agencies or their prime contractors. It is possible that federal budget reductions and priorities, or changes in agency budgets, could limit future funding and new contract awards or prolong contract performance. We recognize sales under long-term contracts in the aerospace and technologies segment using the cost-to-cost, percentage of completion method of accounting. Our present contract mix consists of approximately two-thirds cost-plus contracts, which are billed at our costs plus an agreed upon profit component, and approximately one-third fixed price contracts. We include time and material contracts in the fixed price category because such contracts typically provide for the sale of engineering labor at fixed hourly rates. Throughout the period of contract performance, we regularly reevaluate and, if necessary, revise our estimates of total contract revenue, total contract cost and progress toward completion. Because of contract payment schedules, limitations on funding and other contract terms, our sales and accounts receivable for this segment include amounts that have been earned but not yet billed.
Page 20 of 97
Management uses various measures to evaluate company performance. The primary financial measures we use are earnings before interest and taxes (EBIT), earnings before interest, taxes, depreciation and amortization (EBITDA), diluted earnings per share, economic value added (operating earnings after tax, as defined by the company, less a capital charge based on invested capital times our cost of capital), operating cash flow and free cash flow (generally defined by the company as cash flow from operating activities less capital expenditures). These financial measures may be adjusted at times for items that affect comparability between periods. Nonfinancial measures in the packaging segments include production spoilage rates, quality control measures, safety statistics and production and shipment volumes. Additional measures used to evaluate performance in the aerospace and technologies segment include contract revenue realization, award and incentive fees realized, proposal win rates and backlog (including awarded, contracted and funded backlog). We recognize that attracting and retaining quality employees is critically important to the success of Ball and, because of this, we strive to pay employees competitively and encourage their prudent ownership of the company’s common stock. For most management employees, a meaningful portion of compensation is at risk as an incentive, dependent upon economic value added operating performance. For more senior positions, more compensation is at risk. Through our employee stock purchase plan and 401(k) plan, which matches employee contributions with Ball common stock, many employees, regardless of organizational level, have opportunities to participate as Ball shareholders. CONSOLIDATED SALES AND EARNINGS The company has determined that it has five reportable segments organized along a combination of product lines and geographic areas – North American metal beverage packaging, North American metal food packaging, North American plastic packaging, international packaging and aerospace and technologies. Prior periods have been conformed to the current presentation. We also have investments in companies in the U.S., the PRC and Brazil, which are accounted for using the equity method of accounting, and accordingly, their results are not included in segment sales or earnings. North American Metal Beverage Packaging The North American metal beverage packaging segment consists of operations located in the U.S., Canada and Puerto Rico, which manufacture metal container products used primarily in beverage packing. This segment accounted for 42 percent of consolidated net sales in 2005 (43 percent in 2004). Sales were slightly higher in 2005 than in 2004 as lower 2005 sales volumes were offset by higher aluminum prices passed through to our customers. Metal beverage container volumes in 2005 were 2.5 percent below the previous year’s levels as a result of poor weather in the first quarter, temporary volume reductions and general softness in the beer and carbonated soft drink markets. Net changes in contracted volumes are expected to result in the restoration of the reduced 2005 volumes during 2006 and beyond. Sales were 3 percent higher in 2004 than in 2003. Contributing to the increase were the pass through of aluminum price increases and higher volumes in our specialty can products, partially offset by declines in standard 12-ounce can volumes. Sales in 2004 improved over 2003 due to the $28 million acquisition in March 2003 of Metal Packaging International, Inc., a small producer of metal beverage can ends. Based on publicly available information, we estimate that our shipments of metal beverage containers were approximately 31 percent of total U.S. and Canadian shipments in 2005. We continue to focus efforts on the growing custom beverage can business, which includes cans of different shapes, diameters and fill volumes, and cans with added functional attributes for new products and product line extensions. The conversion of a manufacturing line in our Golden, Colorado, plant from 12-ounce to 24-ounce cans was completed in the second quarter of 2005. We also announced plans to convert a line in our Monticello, Indiana, plant from 12-ounce can manufacturing to a line capable of producing beverage cans in sizes up to 16 ounces. This conversion was substantially completed in January 2006. Earnings in the segment were $229.8 million in 2005 compared to $279.1 million in 2004 and $250.8 million in 2003. The third quarter of 2005 included a pretax charge of $19.3 million ($11.7 million after tax) related to a project to significantly upgrade and streamline our North American beverage can end manufacturing capabilities. The charge included the write off of obsolete equipment spare parts and tooling, as well as employee termination costs. Over time, this capital project is expected to result in productivity improvements and reduced manufacturing costs.

Page 21 of 97
We have installed the first production module in this multi-year project and the second and third modules are in the installation phase. The project is expected to be completed in 2007. Also contributing to lower segment earnings in 2005 were higher freight costs from fuel surcharges, higher other direct material and utility costs and a $9 million increase in cost of sales due to rising raw material costs under the LIFO (last-in-first-out) method of accounting. Energy, freight and other direct material costs were $32 million higher in 2005 than in 2004, partially offset by efficiency gains, cost controls and lower selling, general and administrative costs in 2005. While pricing pressures continue on our raw materials, other direct materials, and freight and utility costs, we continue to work with both customers and suppliers to maintain our volumes, as well as preserve our margins. The improvement in segment earnings in 2004 versus 2003 was the result of higher sales and production volumes, improved product mix and cost reduction programs. Partially offsetting these 2004 earnings improvements was an increase in cost of sales due to rising raw material costs under the LIFO (last-in-first-out) method of accounting. In the fourth quarter of 2003, a gain of $1.6 million was recorded in connection with the sale of a metal beverage container facility that was shut down in December 2001. North American Metal Food Packaging The North American metal food packaging segment consists of operations located in the U.S. and Canada, which manufacture metal container products used primarily in food packaging. Segment sales in 2005 comprised 14 percent of consolidated net sales (14 percent in 2004) and were 6 percent higher than 2004 sales. Sales in 2005 reflected higher prices from the pass through of higher raw material costs. Sales volumes were flat compared to 2004 levels including, in the first quarter of 2005, the inclusion of a full quarter’s results from our Oakdale, California, facility which was acquired in March 2004 (discussed below). Sales were higher in 2004 than in 2003 due primarily to the acquisition of the Oakdale, California, facility, higher selling prices as a result of the pass through of raw material costs and some pre-buying by customers in the fourth quarter of 2004 ahead of expected 2005 steel price increases. During 2004 and 2005, we were able to pass through the majority of the steel price increases and surcharges levied by steel producers. We estimate our 2005 shipments of 6.7 billion cans to be approximately 20 percent of total U.S. and Canadian metal food container shipments, based on publicly available trade information. On March 17, 2004, we acquired ConAgra Grocery Products Company’s (ConAgra) interest in Ball Western Can Company LLC (Ball Western Can) for $30 million. Ball Western Can, located in Oakdale, California, was established in 2000 as a 50/50 joint venture between Ball and ConAgra and, prior to the acquisition, was accounted for by Ball using the equity method of accounting. Ball and ConAgra’s parent company, ConAgra Foods Inc., signed a long-term agreement under which Ball provides metal food containers to ConAgra food packing locations in California. The acquisition of Ball Western Can added approximately one billion units of annual capacity. Segment earnings were $11.6 million in 2005 compared to $44.3 million in 2004 and $19.8 million in 2003. The fourth quarter of 2005 included a pretax charge of $4.6 million ($3.1 million after tax) for pension, severance and other employee benefit costs related to a reduction in force in our Burlington, Ontario, plant. The second quarter of 2005 included a pretax charge of $8.8 million ($5.9 million after tax) for the closure of a three-piece food can manufacturing plant in Quebec. This action was taken to better match capacity to demand. The Quebec plant was closed and ceased operations in the third quarter of 2005 and an agreement has been reached to sell the land and building, which resulted in the second quarter charge being offset by a $2.2 million gain ($1.5 million after tax) in the fourth quarter to adjust the Quebec plant to net realizable value. Also contributing to lower segment earnings in 2005 were higher freight costs from fuel surcharges, higher other direct material and utility costs and an $8.5 million increase in cost of sales due to rising raw material costs under the LIFO (last-in-first-out) method of accounting. Energy, freight and other direct material costs were $16 million higher in 2005 than in 2004, partially offset by efficiency gains, cost controls and lower selling, general and administrative costs in 2005. While pricing pressures continue on all of our raw materials, other direct materials, and freight and utility costs, we continue to work with both customers and suppliers to maintain our volumes, as well as preserve our margins.

Page 22 of 97
The improvement in earnings in 2004 versus 2003 was the result of strong fourth quarter 2004 food can sales, higher production volumes, improved product mix and cost reduction programs. In addition, 2003 earnings were negatively impacted by $11 million of start-up costs associated with a new two-piece food can manufacturing line in Milwaukee. Partially offsetting these 2004 earnings improvements was an increase in cost of sales due to rising raw material costs under the LIFO (last-in-first-out) method of accounting. In the first quarter of 2003, a net charge of $1.4 million was booked to record the costs of closing a metal food container plant offset by a gain from the sale of a previously closed plant. North American Plastic Packaging The North American plastic packaging segment consists of operations located in the U.S. which manufacture polyethylene terephthalate (PET) plastic container products used mainly in beverage packaging. Segment sales in 2005 comprised 8 percent of consolidated sales (7 percent in 2004) and increased 22 percent compared to 2004. The sales increase was related to the pass through to our customers of higher resin prices, as well as 7.5 percent higher sales volumes in 2005 compared to 2004, related to higher demand for barrier and heat-set containers that provide longer shelf-life for products, combined with strong demand for plastic water bottles. Sales in 2004 were 7 percent higher than in 2003, primarily as a result of several new preform sales contracts secured during 2004 and the pass through of raw material price increases. Carbonated soft drink and water sales volumes in 2004 were lower than expected primarily due to reduced demand on the East Coast, resulting from competitive pressures, and a delay in the commencement of a new customer supply opportunity on the West Coast. Although only a small percentage of our total volume, juice, sports drinks and beer container sales increased in 2005 and are expected to grow considerably in the future as more focus is given to these specialty markets and the development of our Heat-Tek(TM) business. We estimate our 2005 shipments of more than 5 billion bottles to be approximately 9 percent of total U.S. and Canadian PET container shipments. Segment earnings were $17.4 million in 2005 compared to $11.6 million in 2004 and $12.3 million in 2003. The improvement in earnings in 2005 was the result of higher sales and production volumes and growth in specialty products. Partially offsetting these improvements in 2005 were higher utility costs. Segment earnings in 2004 and 2003 included $2 million and $2.7 million, respectively, of costs associated with the relocation of the plastics offices and research and development facility from Atlanta, Georgia, to Colorado. Earnings in 2004 were also negatively impacted by continued pricing pressures on commodity plastic containers for carbonated soft drink customers. Segment earnings in 2004 also included a gain of $0.7 million as costs related to the shut down and relocation of the Atlanta plastics offices were less than expected. International Packaging International packaging includes the production and sale of metal beverage container products manufactured and sold in Europe and Asia as well as plastic containers manufactured and sold in Asia. This segment accounted for 24 percent of consolidated net sales in 2005 (23 percent in 2004). Ball Packaging Europe, which represents an estimated 29 percent of the total European metal beverage container manufacturing capacity, has manufacturing plants located in Germany, the United Kingdom, France, the Netherlands, Poland and Serbia. European sales were 7 percent higher in 2005 than in 2004 primarily as a result of an 8.5 percent increase in sales volumes. The continued weak demand in Germany, as a result of the mandatory deposit legislation previously reported on, is being offset by stronger demand elsewhere in Europe, including southern and eastern Europe. Sales in 2005 were adversely affected by unseasonably cool, wet weather in parts of Europe. European sales were 10 percent higher in 2004 than in 2003 as a result of a stronger euro, higher selling prices and successful export programs from the German plants to other European countries. In response to increased demand for custom cans in Europe, a steel can manufacturing line in the Netherlands was converted to aluminum custom cans during the first quarter of 2005. The construction of a new beverage can plant in Belgrade, Serbia, was completed near the end of the second quarter of 2005 to serve the growing demand for beverage cans in southern and eastern Europe. The plant became fully operational during the third quarter of 2005. The Serbian plant was constructed to accommodate a second can production line and a can end manufacturing module for future growth. In the first quarter of 2004, a steel can manufacturing line in Germany was converted to the production of aluminum cans and, in the first quarter of 2003, one German can manufacturing line was idled.

Page 23 of 97
Sales in the PRC in 2005 increased 21 percent over 2004 levels, which were 18 percent higher than in 2003. The increases were largely the result of higher volumes. The overall beverage can market in the PRC was also strong throughout 2005 with expectations of continued growth into 2006. We expect demand for aluminum beverage cans to grow in the coming years, as both multinational and Chinese beverage fillers expand their markets. International packaging segment earnings of $181.8 million in 2005 decreased 8 percent compared to 2004 earnings of $198 million. The fourth quarter of 2005 included a $9.3 million gain primarily resulting from the final settlement of all tax obligations related to liquidated China operations for amounts less than originally estimated. First quarter 2005 segment earnings included a $3.4 million expense for the write off of the remaining carrying value of an equity investment in the PRC. Earnings in 2004 included income of $13.7 million related to the realization of proceeds on assets in the PRC being in excess of amounts previously estimated, and costs of liquidation being less than anticipated in a business consolidation charge taken in 2001. Higher material, energy and transportation costs, as well as second and third quarter start up costs related to a line conversion in the Netherlands and the new Serbia plant had a negative effect on 2005 segment earnings. Partially offsetting these higher costs were lower selling, general and administrative costs. Earnings improved in 2004 compared to 2003 due to a stronger euro and higher profit margins in both Europe and the PRC due in large part to operational cost reduction programs. Segment earnings in 2004 were also improved over 2003 by the nonrecurrence of purchase accounting adjustments which increased Ball Packaging Europe’s cost of sales in 2003. The stronger euro improved our net earnings per diluted share by $0.08 in 2004 compared to 2003. During the fourth quarter of 2004, Sanshui Jianlibao FTB Packaging Limited (Sanshui JFP), a 35 percent owned PRC joint venture, experienced a greater than customary seasonal production slowdown caused by cash flow difficulties. After discussions with representatives of the local Chinese government, which had temporarily taken control of our joint venture partner’s business, we recorded an allowance for doubtful accounts in respect of Sanshui JFP’s receivable from the joint venture partner. Our share of the bad debt provision amounted to $15.2 million and is included in the 2004 consolidated statement of earnings as equity in results of affiliates. Information learned late in the first quarter of 2005 led the company to record expense of $3.4 million to write off the remaining carrying value of this investment. In June 2001 we announced a plan to exit the general line metal can business in the PRC and reduce our PRC beverage can manufacturing capacity by closing two plants. A $237.7 million pretax charge ($185 million after tax and minority interest impact) was recorded in connection with this reorganization. We recorded earnings of $9.3 million during 2005, $13.7 million in 2004 and $3.3 million in 2003 as restructuring activities were completed, resulting in realization on assets in excess of amounts previously estimated, as well as costs incurred being less than estimated, including settlement of tax matters. All costs and transactions related to the PRC restructuring have been concluded. Aerospace and Technologies Aerospace and technologies segment sales represented 12 percent of 2005 consolidated net sales (12 percent in 2004) and were 6 percent higher than in 2004. Sales in 2004 were 22 percent higher than in 2003. The progressively higher sales resulted from a combination of newly awarded contracts and additions to previously awarded contracts. The aerospace and technologies business won a number of large, strategic contracts and delivered a great deal of sophisticated space and defense instrumentation throughout the three-year period. Earnings of $54.7 million in 2005 were 12 percent higher compared to 2004 despite an expense of $3.8 million in the first quarter of 2005 for the write down to net realizable value of an equity investment in an aerospace company. This investment was sold in October 2005 for approximately its carrying value. The improvement in earnings was primarily the result of higher sales and improved program performance. Net earnings decreased in 2004 by 2 percent compared to 2003 largely due to increased pension costs and higher costs incurred on certain cost-plus contracts without corresponding additional fees as these contracts reached completion. In addition, 2003 margins included $8 million due to successfully achieving milestones in two key programs.

Page 24 of 97
On July 4, 2005, the Deep Impact spacecraft accomplished its goal of collecting data from comet Tempel 1, 83 million miles from Earth, using an impactor spacecraft to strike the comet and recording the results of the impact with a flyby spacecraft. The Deep Impact mission has provided groundbreaking scientific information regarding the origins of the solar system. Some of the segment’s other high-profile contracts include: WorldView, an advanced commercial remote sensing satellite; the James Webb Space Telescope, a successor to the Hubble Space Telescope; the Space-Based Space Surveillance System, which will detect and track space objects such as satellites and orbital debris; NPOESS, the next-generation satellite weather monitoring system; and a number of antennas for the Joint Strike Fighter. Sales to the U.S. government, either directly as a prime contractor or indirectly as a subcontractor, represented 87 percent of segment sales in 2005, 82 percent in 2004 and 96 percent of segment sales in 2003. The percentage representing U.S. government sales has decreased compared to 2003 due to growing revenues related to the WorldView contract. Contracted backlog for the aerospace and technologies segment at December 31, 2005 and 2004, was $761 million and $694 million, respectively. Year-to-year comparisons of backlog are not necessarily indicative of the trend of future operations. For additional information regarding the company’s segments, see the summary of business segment information in Note 2 accompanying the consolidated financial statements within Item 8 of this report. The charges recorded for business consolidation activities were based on estimates by Ball management, actuaries and other independent parties and were developed from information available at the time. If actual outcomes vary from the estimates, the differences will be reflected in current period earnings in the consolidated statement of earnings and identified as business consolidation gains and losses. Additional details about our business consolidation activities and associated costs are provided in Note 4 accompanying the consolidated financial statements within Item 8 of this report. Selling and Administrative Expenses Selling and administrative expenses were $231.6 million, $267.9 million and $234.2 million for 2005, 2004 and 2003, respectively. Expenses in 2005 were lower in all areas of the company due largely to lower employee compensation and benefit costs, including the company’s deposit share program and economic-value-added based incentive compensation plans. In addition, foreign currency hedging gains were higher in 2005 than in 2004. These lower costs were partially offset by higher pension costs, higher accounts receivable securitization fees and the write down of the PRC and aerospace equity investments in the first quarter of 2005. The increase in 2004 compared to 2003 was due to higher costs related to the company’s deposit share program, higher pension and incentive costs, costs associated with Sarbanes-Oxley compliance in 2004, higher research and development costs, the effects of foreign exchange rates and growth in our aerospace and technologies segment. In 2005 we reduced our U.S. pension plan discount rate from 6.25 percent to 6 percent, resulting in $5.4 million higher U.S. pension expense for the year compared to 2004, most of which was included in cost of sales. In 2004 we also reduced our U.S. pension plan discount rate from 6.75 percent to 6.25 percent, resulting in $8.3 million higher U.S. pension expense for the year compared to 2003. For the U.S. pension plans, we intend to maintain our current return on asset assumption at 8.5 percent for 2006 while further reducing the discount rate assumption to 5.75 percent. Based on these assumptions, U.S. pension expense for 2006 is anticipated to increase $10.5 million compared to 2005, most of which will be included in cost of sales. Pension expense in Europe and Canada combined is expected to be slightly lower than the 2005 expense. A reduction of the plan asset return assumption by one quarter of a percentage point would result in additional expense of approximately $1.9 million while a quarter of a percentage point reduction in the discount rate would result in approximately $3.8 million of additional expense. Additional information regarding the company’s pension plans is provided in Note 13 accompanying the consolidated financial statements within Item 8 of this report. On October 26, 2005, Ball’s board of directors approved the accelerated vesting of the out-of-the-money, unvested nonqualified stock options granted in April 2005. The acceleration affects approximately 665,000 options granted to approximately 290 employees at an exercise price of $39.74. The accelerated vesting of these nonqualified options will allow the company to eliminate approximately $5 million of pretax expense (approximately $3 million after tax) over the next four years.

Page 25 of 97
Interest and Taxes Consolidated interest expense was $116.4 million in 2005, including debt refinancing costs of $19.3 million; $103.7 million in 2004 and $141.1 million in 2003, including debt refinancing costs of $15.2 million. The progressively lower expense was due to lower average borrowings and higher capitalized interest. The debt refinancing costs in 2005 of $19.3 million were costs associated with the refinancing of the company’s senior credit facilities and the redemption in the last half of 2005 of the company’s 7.75% senior notes, which were due in August 2006. The debt refinancing costs in 2003 of $15.2 million were associated with the early redemption of the company’s 8.25% senior subordinated notes in August 2003. Ball’s consolidated effective income tax rate for 2005 was 28.7 percent compared to 32 percent in 2004 and 31.3 percent in 2003. The decrease in the effective tax rate is primarily due to the net tax benefit recorded on the repatriation of foreign earnings under the American Jobs Creation Act of 2004 (Jobs Act), the tax benefit on business consolidation costs applied at the marginal tax rate, increased research and development tax credits and the manufacturing deduction effective in 2005 under the Jobs Act. (Further details of the amounts repatriated under the Jobs Act are available in Note 12 accompanying the consolidated financial statements within Item 8 of this report.) These benefits were somewhat offset by the fact that no tax benefit was provided in respect of the equity investment write downs in the first quarter of 2005. The $3.8 million write down of the aerospace investment is not tax deductible while the realization of tax deductibility of the $3.4 million PRC write down, which will be a capital loss, is not reasonably assured as the company does not have, nor does it anticipate, any capital gains to offset the capital losses. Ball’s consolidated effective income tax rate for 2004 was 32 percent compared to 31.3 percent in 2003. The overall 2004 effective rate was slightly higher, primarily due to higher North American earnings than in 2003, but continues to reflect a low consolidated European income tax rate due to lower profits in Germany, reflecting the impact of the refundable mandatory deposit on non-refillable containers imposed on January 1, 2003, and a tax holiday in Poland. Germany has the highest tax rate of the European countries in which Ball has operations. In connection with the Internal Revenue Service’s (IRS) examination of Ball’s consolidated income tax returns for the tax years 2000 through 2003, the IRS has proposed to disallow Ball’s deductions of interest expense incurred on loans under a company-owned life insurance plan that has been in place for more than 19 years. Ball believes that its interest deductions will be sustained as filed and, therefore, no provision for loss has been accrued. The IRS’s proposed adjustments would result in an increase in taxable income for the years 1999 through 2003 of $46.7 million and a corresponding increase in taxable income for subsequent tax years 2004 and 2005 in the amount of $20.2 million with a corresponding increase in tax expense of $26.4 million plus any related penalties and interest expense. The examination reports for the 2000 to 2003 examination have been forwarded to the appeals division of the IRS, and no further action has taken place to change Ball’s position. Results of Equity Affiliates Equity in the earnings of affiliates in 2005 is primarily attributable to our 50 percent ownership in packaging investments in North America and Brazil. Earnings in 2004 included the results of a minority-owned aerospace business, which was sold in October 2005, and a $15.2 million loss representing Ball’s share of a provision for doubtful accounts related to its 35 percent owned interest in Sanshui JFP (discussed above in “International Packaging”). After consideration of the PRC loss, earnings were $15.5 million in 2005 compared to $15.8 million in 2004 and $11.3 million in 2003. The higher earnings since 2003 were primarily due to improved results in our packaging joint ventures in Brazil and North America.

Page 26 of 97
Subsequent Event On February 14, 2006, the company entered into a definitive merger agreement in which Ball will acquire U.S. Can Corporation’s (U.S. Can) U.S. and Argentinean operations for 1.1 million shares of Ball common stock and the assumption of $550 million of U.S. Can’s debt. The transaction is expected to close by the end of the first quarter 2006. U.S. Can is the largest manufacturer of aerosol cans in the U.S. and also manufactures paint cans, plastic containers and custom and specialty cans in 10 plants in the U.S. Aerosol cans are also produced in the two manufacturing plants in Argentina. U.S. Can’s U.S. and Argentinean operations had sales of approximately $600 million (unaudited) in 2005. Upon closing the acquisition of U.S. Can, the company intends to refinance $550 million of existing U.S. Can debt at significantly lower interest rates. The refinancing will be completed with Ball’s issuance of a new series of senior notes and an increase in bank debt under the new senior credit facilities put in place in the fourth quarter of 2005. CRITICAL AND SIGNIFICANT ACCOUNTING POLICIES AND NEW ACCOUNTING PRONOUNCEMENTS For information regarding the company’s critical and significant policies, as well as recent accounting pronouncements, see Note 1 to the consolidated financial statements within Item 8 of this report. FINANCIAL CONDITION, LIQUIDITY AND CAPITAL RESOURCES Cash Flows and Capital Expenditures Cash flows from operating activities were $558.8 million in 2005 compared to $535.9 million in 2004 and $364 million in 2003. The lower amount generated in 2003 included $138.3 million for the payment in January 2003 of an accrued withholding tax obligation related to the acquisition of Ball Packaging Europe (further discussed below) which was funded by the seller at the time of closing by the inclusion of €131 million of additional cash. Management internally uses a free cash flow measure: (1) to evaluate the company’s operating results, (2) for planning purposes, (3) to evaluate strategic investments and (4) to evaluate the company’s ability to incur and service debt. Free cash flow is not a defined term under U.S. generally accepted accounting principles and it should not be inferred that the entire free cash flow amount is available for discretionary expenditures. The company defines free cash flow as cash flow from operating activities less additions to property, plant and equipment (capital spending). Free cash flow is typically derived directly from the company’s cash flow statements; however, it may be adjusted for items that affect comparability between periods. An example of such an item excluded in 2003 is the $138.3 million withholding tax payment liability assumed in the acquisition of Ball Packaging Europe in December 2002 (discussed above). We believe this is not a comparable free cash flow outflow of the company as it was funded by the seller. Based on this, our consolidated free cash flow is summarized as follows: ($ in millions) 2005 2004 2003 Cash flows from operating activities $ 558.8 $ 535.9 $ 364.0 Add back withholding tax payment related to the
acquisition of Ball Packaging Europe
–
–
138.3 Capital spending (291.7) (196.0) (137.2)Free cash flow $ 267.1 $ 339.9 $ 365.1
Cash flows from operating activities in 2005 were negatively impacted by higher cash taxes. This resulted in a decrease in the deferred income taxes payable of $58.5 million in 2005 compared to an estimated increase in deferred taxes of $42.8 million in 2004. The primary causes of the increase in current income taxes and decrease in deferred income taxes are the reduction in 2005 of tax-deductible pension costs versus 2004, the impact in 2005 of the repatriation of foreign earnings and a reduction of tax versus book depreciation expense as tax depreciation was accelerated in prior years, primarily due to bonus tax depreciation permitted in the tax laws after September 11, 2001. Cash flows from operating activities were positively affected in 2005 by lower accounts receivable, higher accounts payable and lower pension contributions.

Page 27 of 97
Cash flow in 2004 compared to 2003 included higher earnings and higher accounts payable, offset by higher accounts receivable and inventories, as well as higher pension plan contributions. Inventories and accounts payable were higher due to increased purchases of raw materials and accounts receivable were higher partially as a result of strong December food can sales. Based on information currently available, we estimate cash flows from operating activities for 2006 to be approximately $550 million, capital spending to be approximately $300 million and free cash flow to be in the $250 million range. Capital spending of $291.7 million in 2005 was above depreciation and amortization expense of $213.5 million as we invested capital in our best performing operations, including projects to increase custom can capabilities, improve beverage can end making productivity, convert lines from steel to aluminum in Europe and complete a new beverage can manufacturing plant in Belgrade, Serbia, as well as expenditures in the aerospace and technologies segment. Debt Facilities and Refinancing Interest-bearing debt at December 31, 2005, decreased $71 million to $1,589.7 million from $1,660.7 million at December 31, 2004. This decrease includes $358.1 million for net repurchases of common stock and $291.7 million of capital spending, partially offset by the effects of the lower euro exchange rate and operating cash flow. On October 13, 2005, Ball refinanced its senior secured credit facilities. The new senior secured facilities extend debt maturities at lower interest rate spreads and provide Ball with additional borrowing capacity for future growth. During the third and fourth quarters of 2005, Ball redeemed its 7.75% senior notes due August 2006 primarily through the drawdown of funds under the new credit facilities. The refinancing and redemption resulted in a pretax debt refinancing charge of $19.3 million ($12.3 million after tax) to reflect the call premium associated with the senior notes and the write off of unamortized debt issuance costs. The new senior credit facilities, which currently bear interest at variable rates and are due in October 2011, are comprised of the following: (1) ₤85 million Term A Loan; (2) €350 million Term B Loan; (3) C$165 million Term C Loan; (4) a multi-currency long-term revolving credit facility which provides the company with up to the equivalent of $715 million; and (5) a Canadian long-term revolving credit facility which provides the company with up to the equivalent of $35 million. At December 31, 2005, $547 million was available under the multi-currency revolving credit facility. The company also had $267 million of short-term uncommitted credit facilities available at the end of the year, of which $106.8 million was outstanding. During the first quarter of 2004, Ball repaid €31 million ($38 million) of its previous euro denominated Term Loan B and reduced the interest rate by 50 basis points. During the fourth quarter of 2003, Ball repaid $160 million of its previous U.S. dollar denominated Term Loan B and €25 million of its previous euro denominated Term Loan B. At the time of the early repayment, the interest rate on the U.S. portion of the Term Loan B was reduced by 50 basis points. Interest expense during the first quarter of 2004 and the fourth quarter of 2003 included $0.5 million and $2.9 million, respectively, for the write off of the unamortized financing costs associated with the repaid loans. On August 8, 2003, Ball refinanced 8.25% Senior Subordinated Notes due in 2008 through the private placement of $250 million of 6.875% Senior Notes due in 2012 issued at a price of 102% (effective yield to maturity of 6.58 percent). In connection with the refinancing of the higher interest debt, in the third quarter of 2003 a pretax charge of $15.2 million was recorded as interest expense, which consisted of the payment of a $10.3 million call premium and the write off of $4.9 million of unamortized financing costs. The company has a receivables sales agreement that provides for the ongoing, revolving sale of a designated pool of trade accounts receivable of Ball’s North American packaging operations, up to $225 million as of December 31, 2005 ($200 million as of December 31, 2004). The agreement qualifies as off-balance sheet financing under the provisions of Statement of Financial Accounting Standards No. 140. Net funds received from the sale of the accounts receivable totaled $210 million and $174.7 million at December 31, 2005 and 2004, respectively, and are reflected as a reduction of accounts receivable in the consolidated balance sheets.

Page 28 of 97
The company was not in default of any loan agreement at December 31, 2005, and has met all payment obligations. The U.S. note agreements, bank credit agreement and industrial development revenue bond agreements contain certain restrictions relating to dividends, investments, financial ratios, guarantees and the incurrence of additional indebtedness. Additional details about the company’s receivables sales agreement and debt are available in Notes 5 and 11, respectively, accompanying the consolidated financial statements within Item 8 of this report. Other Liquidity Items Cash payments required for long-term debt maturities, rental payments under noncancellable operating leases and purchasing obligations in effect at December 31, 2005, are summarized in the following table:
Payments Due By Period ($ in millions)
Total Less than 1 Year
1-3 Years
3-5 Years
More than 5 Years
Long-term debt $ 1,472.4 $ 7.7 $ 105.1 $ 290.4 $ 1,069.2 Capital lease obligations 6.7 1.8 2.4 0.5 2.0 Operating leases 198.0 45.8 60.6 34.8 56.8 Purchase obligations (a) 7,385.4 2,193.8 2,902.6 1,910.7 378.3
Total payments on contractual obligations
$ 9,062.5
$ 2,249.1
$ 3,070.7
$ 2,236.4
$ 1,506.3
(a) The company’s purchase obligations include contracted amounts for aluminum, steel, plastic resin and other direct
materials. Also included are commitments for purchases of natural gas and electricity, aerospace and technologies contracts and other less significant items. In cases where variable prices and/or usage are involved, management’s best estimates have been used. Depending on the circumstances, early termination of the contracts may not result in penalties and, therefore, actual payments could vary significantly.
Contributions to the company’s defined benefit pension plans, not including the unfunded German plans, are expected to be $49 million in 2006. This estimate may change based on plan asset performance. Benefit payments related to these plans are expected to be $43 million, $46 million, $48 million, $51 million and $54 million for the years ending December 31, 2006 through 2010, respectively, and $318 million thereafter. Payments to participants in the unfunded German plans are expected to be $22 million, $22 million, $23 million, $24 million and $24 million for the years 2006 through 2010, respectively, and a total of $131 million thereafter. We increased our share repurchase program in 2005 to $358.1 million, net of issuances, compared to $50 million net repurchases in 2004. On January 31, 2005, in a privately negotiated stock repurchase transaction, Ball entered into a forward purchase agreement to repurchase 3 million of its common shares at an initial price of $42.72 per share using cash on hand and available borrowings. The price per share was subject to a price adjustment based on a weighted average price calculation for the period between the initial purchase date and the settlement date. The company completed its purchase of the 3 million shares at an average price of $41.63 per share and obtained delivery of the shares in early May 2005. On October 26, 2005, the board of directors authorized the repurchase of up to 12 million shares of Ball common stock. This most recent repurchase authorization replaced the previous authorization of up to 12 million shares approved in July 2004, under which approximately 1 million shares remained at October 26, 2005. Annual cash dividends paid on common stock were 40 cents per share in 2005, 35 cents per share in 2004 and 24 cents per share in 2003. Total dividends paid were $42.5 million in 2005, $38.9 million in 2004 and $26.8 million in 2003.

Page 29 of 97
Contingencies The company is subject to various risks and uncertainties in the ordinary course of business due, in part, to the competitive nature of the industries in which we participate, our operations in developing markets outside the U.S., changing commodity prices for the materials used in the manufacture of our products and changing capital markets. Where practicable, we attempt to reduce these risks and uncertainties through the establishment of risk management policies and procedures, including, at times, the use of derivative financial instruments as explained in Item 7A of this report. From time to time, the company is subject to routine litigation incident to its business. Additionally, the U.S. Environmental Protection Agency has designated Ball as a potentially responsible party, along with numerous other companies, for the cleanup of several hazardous waste sites. Our information at this time does not indicate that these matters will have a material adverse effect upon the liquidity, results of operations or financial condition of the company. Due to political and legal uncertainties in Germany, no nationwide system for returning beverage containers was in place at the time a mandatory deposit was imposed in January 2003 and nearly all retailers stopped carrying beverages in non-refillable containers. During 2003 and 2004, we responded to the resulting lower demand for beverage cans by reducing production at our German plants, implementing aggressive cost reduction measures and increasing exports from Germany to other countries in the region served by Ball Packaging Europe. We also closed a plant in the United Kingdom, shut down a production line in Germany, delayed capital investment projects in France and Poland and converted one of our steel can production lines in Germany to aluminum in order to facilitate additional can exports from Germany. In 2004 the German parliament adopted a new packaging ordinance, imposing a 25 eurocent deposit on all one-way glass, PET and metal containers for water, beer and carbonated soft drinks. As of May 1, 2006, all retailers must redeem all returned one-way containers as long as they sell such containers. Major retailers in Germany have begun the process of implementing a returnable system for one-way containers since they, along with fillers, now appear to accept the deposit as permanent. The retailers and the filling and packaging industries have formed a committee to design a nationwide recollection system and several retailers have begun to order reverse vending machines in order to meet the May 1, 2006, deadline. The preparation of financial statements in conformity with U.S. generally accepted accounting principles requires management to make estimates and assumptions that affect the reported amounts of assets and liabilities, the disclosure of contingencies at the date of the financial statements and the reported amounts of revenues and expenses during the reporting period. Future events could affect these estimates. See Note 1 to the consolidated financial statements (within Item 8 of this report) for a summary of the company’s critical and significant accounting policies. The U.S. and European economies and the company have experienced minor general inflation during the past several years. Management believes that evaluation of Ball’s performance during the periods covered by these consolidated financial statements should be based upon historical financial statements.

Page 30 of 97
Forward-Looking Statements The company has made or implied certain forward-looking statements in this report which are made as of the end of the time frame covered by this report. These forward-looking statements represent the company’s goals, and results could vary materially from those expressed or implied. From time to time we also provide oral or written forward-looking statements in other materials we release to the public. As time passes, the relevance and accuracy of forward-looking statements may change. Some factors that could cause the company’s actual results or outcomes to differ materially from those discussed in the forward-looking statements include, but are not limited to: fluctuation in customer and consumer growth and demand; loss of one or more major customers or changes to contracts with one or more customers; insufficient production capacity; overcapacity in foreign and domestic metal and plastic container industry production facilities and its impact on pricing and financial results; failure to achieve anticipated productivity improvements or production cost reductions, including those associated with capital expenditures such as our beverage can end project; changes in climate and weather; fruit, vegetable and fishing yields; power and natural resource costs; difficulty in obtaining supplies and energy, such as gas and electric power; availability and cost of raw materials, as well as the recent significant increases in resin, steel, aluminum and energy costs, and the ability or inability to include or pass on to customers changes in raw material costs; changes in the pricing of the company’s products and services; competition in pricing and the possible decrease in, or loss of, sales resulting therefrom; insufficient or reduced cash flow; transportation costs; the number and timing of the purchases of the company’s common shares; regulatory action or federal and state legislation including mandated corporate governance and financial reporting laws; the German mandatory deposit or other restrictive packaging legislation such as recycling laws; interest rates affecting our debt; labor strikes; increases and trends in various employee benefits and labor costs, including pension, medical and health care costs; rates of return projected and earned on assets and discount rates used to measure future obligations and expenses of the company’s defined benefit retirement plans; boycotts; antitrust, intellectual property, consumer and other litigation; maintenance and capital expenditures; goodwill impairment; the effect of LIFO accounting on earnings; changes in generally accepted accounting principles or their interpretation; local economic conditions; the authorization, funding, availability and returns of contracts for the aerospace and technologies segment and the nature and continuation of those contracts and related services provided thereunder; delays, extensions and technical uncertainties, as well as schedules of performance associated with such segment contracts; international business and market risks such as the devaluation or revaluation of certain currencies and the activities of foreign subsidiaries; international business risks (including foreign exchange rates and activities of foreign subsidiaries) in Europe and particularly in developing countries such as the PRC and Brazil; changes in the foreign exchange rates of the U.S. dollar against the European euro, British pound, Polish zloty, Serbian dinar, Hong Kong dollar, Canadian dollar, Chinese renminbi and Brazilian real, and in the foreign exchange rate of the European euro against the British pound, Polish zloty and Serbian dinar; terrorist activity or war that disrupts the company’s production or supply; regulatory action or laws including tax, environmental and workplace safety; technological developments and innovations; successful or unsuccessful acquisitions, joint ventures or divestitures and the integration activities associated therewith; changes to unaudited results due to statutory audits of our financial statements or management’s evaluation of the company’s internal controls over financial reporting; and loss contingencies related to income and other tax matters, including those arising from audits performed by U.S. and foreign tax authorities. If the company is unable to achieve its goals, then the company’s actual performance could vary materially from those goals expressed or implied in the forward-looking statements. The company currently does not intend to publicly update forward-looking statements except as it deems necessary in quarterly or annual earnings reports. You are advised, however, to consult any further disclosures we make on related subjects in our 10-K, 10-Q and 8-K reports to the Securities and Exchange Commission.

Page 31 of 97
Item 7A. Quantitative and Qualitative Disclosures About Market Risk Financial Instruments and Risk Management In the ordinary course of business, we employ established risk management policies and procedures to reduce our exposure to fluctuations in commodity prices, interest rates, foreign currencies and prices of the company’s common stock in regard to common share repurchases. Although the instruments utilized involve varying degrees of credit, market and interest risk, the counterparties to the agreements are expected to perform fully under the terms of the agreements. We have estimated our market risk exposure using sensitivity analysis. Market risk exposure has been defined as the changes in fair value of derivative instruments, financial instruments and commodity positions. To test the sensitivity of our market risk exposure, we have estimated the changes in fair value of market risk sensitive instruments assuming a hypothetical 10 percent adverse change in market prices or rates. The results of the sensitivity analysis are summarized below. Commodity Price Risk We manage our commodity price risk in connection with market price fluctuations of aluminum primarily by entering into container sales contracts, which generally include aluminum-based pricing terms that consider price fluctuations under our commercial supply contracts for aluminum purchases. Such terms generally include a fixed price or an upper limit to the aluminum component pricing. This matched pricing affects most of our North American metal beverage container net sales. We also, at times, use certain derivative instruments such as option and forward contracts as cash flow and fair value hedges of commodity price risk where there is not a pass-through arrangement in the sales contract. Our North American plastic container sales contracts include provisions to pass through resin cost changes. As a result, we believe we have minimal, if any, exposure related to changes in the cost of plastic resin. Most North American food container sales contracts either include provisions permitting us to pass through some or all steel cost changes we incur or incorporate annually negotiated steel costs. In 2005 and 2004 we were able to pass through the majority of steel surcharges to our customers. In Europe and Asia the company manages aluminum and steel raw material commodity price risks through annual and long-term contracts for the purchase of the materials, as well as certain sales of containers, that reduce the company's exposure to fluctuations in commodity prices within the current year. These purchase and sales contracts include fixed price, floating and pass-through pricing arrangements. The company also uses forward and option contracts as cash flow hedges to minimize the company’s exposure to significant price changes for those sales contracts where there is not a pass-through arrangement. Considering the effects of derivative instruments, the market’s ability to accept price increases and the company’s commodity price exposures, a hypothetical 10 percent adverse change in the company’s metal prices could result in an estimated $5.2 million after-tax reduction of net earnings over a one-year period. Additionally, if foreign currency exchange rates were to change adversely by 10 percent, we estimate there could be an $11.7 million after-tax reduction of net earnings over a one-year period for foreign currency exposures on the metal. Actual results may vary based on actual changes in market prices and rates. Sensitivity to foreign currency exposures related to metal increased over prior years due to an increase in metal purchases and related payables at our foreign operations, which are subject to foreign currency fluctuations. The company is also exposed to fluctuations in prices for utilities such as natural gas and electricity. A hypothetical 10 percent increase in our utility prices could result in an estimated $7.3 million after-tax reduction of net earnings over a one-year period. Actual results may vary based on actual changes in market prices and rates.
Page 32 of 97
Interest Rate Risk Our objective in managing exposure to interest rate changes is to limit the impact of interest rate changes on earnings and cash flows and to lower our overall borrowing costs. To achieve these objectives, we use a variety of interest rate swaps and options to manage our mix of floating and fixed-rate debt. Interest rate instruments held by the company at December 31, 2005 and 2004, included pay-fixed and pay-floating interest rate swaps. Pay-fixed swaps effectively convert variable rate obligations to fixed rate instruments. The majority of the pay-floating swaps, which effectively convert fixed-rate obligations to variable rate instruments, are fair value hedges. Based on our interest rate exposure at December 31, 2005, assumed floating rate debt levels throughout 2006 and the effects of derivative instruments, a 100 basis point increase in interest rates could result in an estimated $5.2 million after-tax reduction of net earnings over a one-year period. Actual results may vary based on actual changes in market prices and rates and the timing of these changes. Foreign Currency Exchange Rate Risk Our objective in managing exposure to foreign currency fluctuations is to protect foreign cash flows and earnings associated with foreign exchange rate changes through the use of cash flow hedges. In addition, we manage foreign earnings translation volatility through the use of foreign currency options. Our foreign currency translation risk results from the European euro, British pound, Canadian dollar, Polish zloty, Chinese renminbi, Brazilian real and Serbian dinar. We face currency exposures in our global operations as a result of purchasing raw materials in U.S. dollars and, to a lesser extent, in other currencies. Sales contracts are negotiated with customers to reflect cost changes and, where there is not a foreign exchange pass-through arrangement, the company uses forward and option contracts to manage foreign currency exposures. Considering the company’s derivative financial instruments outstanding at December 31, 2005, and the currency exposures, a hypothetical 10 percent reduction in foreign currency exchange rates compared to the U.S. dollar could result in an estimated $19.4 million after-tax reduction of net earnings over a one-year period. This amount includes the $11.7 million currency exposure discussed above in the “Commodity Price Risk” section. This hypothetical adverse change in foreign currency exchange rates would also reduce our forecasted average debt balance by $63 million. Actual changes in market prices or rates may differ from hypothetical changes. Sensitivity to foreign currency exposures related to metal increased over prior years due to an increase in metal purchases and related payables at our foreign operations, which are subject to foreign currency fluctuations.

Page 33 of 97
Item 8. Financial Statements and Supplementary Data
Report of Independent Registered Public Accounting Firm To the Board of Directors and Shareholders of Ball Corporation: We have completed integrated audits of Ball Corporation’s 2005 and 2004 consolidated financial statements and of its internal control over financial reporting as of December 31, 2005, and an audit of its 2003 consolidated financial statements in accordance with the standards of the Public Company Accounting Oversight Board (United States). Our opinions, based on our audits, are presented below. Consolidated financial statements In our opinion, the accompanying consolidated financial statements listed in the index appearing under Item 15(a)(1) present fairly, in all material respects, the financial position of Ball Corporation and its subsidiaries at December 31, 2005 and 2004, and the results of their operations and their cash flows for each of the three years in the period ended December 31, 2005 in conformity with accounting principles generally accepted in the United States of America. These financial statements are the responsibility of the Company’s management. Our responsibility is to express an opinion on these financial statements based on our audits. We conducted our audits of these statements in accordance with the standards of the Public Company Accounting Oversight Board (United States). Those standards require that we plan and perform the audit to obtain reasonable assurance about whether the financial statements are free of material misstatement. An audit of financial statements includes examining, on a test basis, evidence supporting the amounts and disclosures in the financial statements, assessing the accounting principles used and significant estimates made by management, and evaluating the overall financial statement presentation. We believe that our audits provide a reasonable basis for our opinion. Internal control over financial reporting Also, in our opinion, management’s assessment, included in Management's Report on Internal Control Over Financial Reporting appearing in Item 9A, that the Company maintained effective internal control over financial reporting as of December 31, 2005 based on criteria established in Internal Control – Integrated Framework issued by the Committee of Sponsoring Organizations of the Treadway Commission (COSO), is fairly stated, in all material respects, based on those criteria. Furthermore, in our opinion, the Company maintained, in all material respects, effective internal control over financial reporting as of December 31, 2005, based on criteria established in Internal Control – Integrated Framework issued by the COSO. The company’s management is responsible for maintaining effective internal control over financial reporting and for its assessment of the effectiveness of internal control over financial reporting. Our responsibility is to express opinions on management’s assessment and on the effectiveness of the Company’s internal control over financial reporting based on our audit. We conducted our audit of internal control over financial reporting in accordance with the standards of the Public Company Accounting Oversight Board (United States). Those standards require that we plan and perform the audit to obtain reasonable assurance about whether effective internal control over financial reporting was maintained in all material respects. An audit of internal control over financial reporting includes obtaining an understanding of internal control over financial reporting, evaluating management’s assessment, testing and evaluating the design and operating effectiveness of internal control, and performing such other procedures as we consider necessary in the circumstances. We believe that our audit provides a reasonable basis for our opinions.

Page 34 of 97
A company’s internal control over financial reporting is a process designed to provide reasonable assurance regarding the reliability of financial reporting and the preparation of financial statements for external purposes in accordance with generally accepted accounting principles. A company’s internal control over financial reporting includes those policies and procedures that (i) pertain to the maintenance of records that, in reasonable detail, accurately and fairly reflect the transactions and dispositions of the assets of the company; (ii) provide reasonable assurance that transactions are recorded as necessary to permit preparation of financial statements in accordance with generally accepted accounting principles, and that receipts and expenditures of the company are being made only in accordance with authorizations of management and directors of the company; and (iii) provide reasonable assurance regarding prevention or timely detection of unauthorized acquisition, use, or disposition of the company’s assets that could have a material effect on the financial statements. Because of its inherent limitations, internal control over financial reporting may not prevent or detect misstatements. Also, projections of any evaluation of effectiveness to future periods are subject to the risk that controls may become inadequate because of changes in conditions, or that the degree of compliance with the policies or procedures may deteriorate. /s/ PricewaterhouseCoopers LLP PricewaterhouseCoopers LLP Denver, Colorado February 22, 2006

Page 35 of 97
Consolidated Statements of Earnings Ball Corporation and Subsidiaries
Years ended December 31,
($ in millions, except per share amounts) 2005 2004 2003
Net sales $ 5,751.2 $ 5,440.2 $ 4,977.0
Costs and expenses
Cost of sales (excluding depreciation and amortization) 4,822.4 4,433.5 4,080.2 Depreciation and amortization (Notes 7 and 9) 213.5 215.1 205.5 Business consolidation costs (gains) (Note 4) 21.2 (15.2) (3.7) Selling, general and administrative 231.6 267.9 234.2
5,288.7 4,901.3 4,516.2
Earnings before interest and taxes 462.5 538.9 460.8
Interest expense (Note 11)
Interest expense before debt refinancing costs 97.1 103.7 125.9 Debt refinancing costs 19.3 – 15.2
Total interest expense 116.4 103.7 141.1
Earnings before taxes 346.1 435.2 319.7 Tax provision (Note 12) (99.3) (139.2) (100.1) Minority interests (0.8) (1.0) (1.0) Equity in results of affiliates (Note 9) 15.5 0.6 11.3
Net earnings $ 261.5 $ 295.6 $ 229.9
Earnings per share (Notes 14 and 15):
Basic $ 2.43 $ 2.67 $ 2.06 (a) Diluted $ 2.38 $ 2.60 $ 2.01 (a)
Weighted average shares outstanding (000s) (Note 15): Basic 107,758 110,846 111,710 (a) Diluted 109,732 113,790 114,275 (a)
Cash dividends declared and paid, per share $ 0.40 $ 0.35 $ 0.24 (a) (a) Per share and share amounts have been retroactively restated for the two-for-one stock split discussed in Note 14. The accompanying notes are an integral part of the consolidated financial statements.

Page 36 of 97
Consolidated Balance Sheets Ball Corporation and Subsidiaries
December 31, ($ in millions) 2005 2004 Assets Current assets
Cash and cash equivalents $ 61.0 $ 198.7 Receivables, net (Note 5) 376.6 346.8 Inventories, net (Note 6) 670.3 629.5 Deferred taxes and prepaid expenses 117.9 70.6
Total current assets 1,225.8 1,245.6
Property, plant and equipment, net (Note 7) 1,556.6 1,532.4 Goodwill (Notes 3, 4 and 8) 1,258.6 1,410.0 Intangibles and other assets, net (Note 9) 302.4 289.7
Total Assets $ 4,343.4 $ 4,477.7
Liabilities and Shareholders’ Equity Current liabilities
Short-term debt and current portion of long-term debt (Note 11) $ 116.4 $ 123.0 Accounts payable 552.4 453.0 Accrued employee costs 198.4 222.2 Income taxes payable 127.5 80.4 Other current liabilities (Note 16) 181.3 117.7
Total current liabilities 1,176.0 996.3 Long-term debt (Note 11) 1,473.3 1,537.7 Employee benefit obligations (Note 13) 784.2 734.3 Deferred taxes and other liabilities 69.5 116.4
Total liabilities 3,503.0 3,384.7
Contingencies (Note 21) Minority interests 5.1 6.4 Shareholders’ equity (Note 14)
Common stock (158,382,813 shares issued – 2005; 157,506,545 shares issued – 2004)
633.6
610.8
Retained earnings 1,227.9 1,007.5 Accumulated other comprehensive earnings (loss) (100.7) 33.2 Treasury stock, at cost (54,182,655 shares – 2005;
44,815,138 shares – 2004)
(925.5)
(564.9)
Total shareholders’ equity 835.3 1,086.6
Total Liabilities and Shareholders’ Equity $ 4,343.4 $ 4,477.7 The accompanying notes are an integral part of the consolidated financial statements.

Page 37 of 97
Consolidated Statements of Cash Flows Ball Corporation and Subsidiaries
Years ended December 31, ($ in millions) 2005 2004 2003 Cash Flows from Operating Activities Net earnings $ 261.5 $ 295.6 $ 229.9 Adjustments to reconcile net earnings to cash provided by
operating activities:
Depreciation and amortization 213.5 215.1 205.5 Business consolidation costs (gains) 19.0 (15.2) (3.3) Deferred taxes (58.5) 42.8 17.8 Contributions to defined benefit pension plans (17.1) (60.6) (34.1) Debt prepayment costs 6.6 – 10.3 Noncash write off of deferred financing costs 12.7 0.5 7.8 Other, net 15.5 50.6 29.2
Working capital changes, excluding effects of acquisitions: Receivables (32.8) (81.3) 55.6 Inventories (54.2) (49.3) 38.5 Accounts payable 113.2 87.1 (112.6) Accrued employee costs (17.2) 39.9 32.8 Income taxes payable 51.2 18.1 46.1 Withholding taxes related to European acquisition (Note 3) – – (138.3) Other, net 45.4 (7.4) (21.2)
Cash provided by operating activities 558.8 535.9 364.0
Cash Flows from Investing Activities Additions to property, plant and equipment (291.7) (196.0) (137.2) Business acquisitions, net of cash acquired (Note 3) − (17.2) (28.0) Purchase price adjustments, net – – 39.8 Other, net 1.7 3.6 1.6
Cash used in investing activities (290.0) (209.6) (123.8)
Cash Flows from Financing Activities Long-term borrowings 882.8 26.3 5.3 Repayments of long-term borrowings (949.7) (107.2) (367.4) Change in short-term borrowings 68.4 2.6 (31.6) Debt prepayment costs (6.6) – (10.3) Debt issuance costs (4.8) – (5.2) Proceeds from issuance of common stock 35.6 35.3 35.5 Acquisitions of treasury stock (393.7) (85.3) (63.4) Common dividends (42.5) (38.9) (26.8) Other, net (0.2) (0.9) –
Cash used in financing activities (410.7) (168.1) (463.9)
Effect of exchange rate changes on cash 4.2 4.0 1.0
Change in cash and cash equivalents (137.7) 162.2 (222.7) Cash and Cash Equivalents – Beginning of Year 198.7 36.5 259.2 Cash and Cash Equivalents – End of Year $ 61.0 $ 198.7 $ 36.5
The accompanying notes are an integral part of the consolidated financial statements.

Page 38 of 97
Consolidated Statements of Shareholders’ Equity and Comprehensive Earnings Ball Corporation and Subsidiaries
($ in millions, except share amounts) Years ended December 31, 2005 2004 2003 Number of Common Shares Outstanding (a) (000s)
Balance, beginning of year 157,506 155,885 154,402 Shares issued for stock options and other stock plans, net of shares
exchanged 877 1,621 1,483 Balance, end of year 158,383 157,506 155,885
Number of Treasury Shares Outstanding (a) (000s) Balance, beginning of year (44,815) (43,106) (40,910) Shares purchased, net of shares reissued (9,368) (1,709) (2,196) Balance, end of year (54,183) (44,815) (43,106)
Common Stock Balance, beginning of year $ 610.8 $ 567.3 $ 530.8 Shares issued for stock options and other stock plans, net of shares
exchanged
15.5
29.8
28.8 Tax benefit from option exercises 7.3 13.7 7.7 Balance, end of year $ 633.6 $ 610.8 $ 567.3
Retained Earnings Balance, beginning of year $ 1,007.5 $ 748.8 $ 545.7 Net earnings 261.5 295.6 229.9 Common dividends, net of tax benefits (41.1) (36.9) (26.8) Balance, end of year $ 1,227.9 $ 1,007.5 $ 748.8
Accumulated Other Comprehensive Earnings (Loss) (Note 14)
Balance, beginning of year $ 33.2 $ (1.4) $ (138.3) Foreign currency translation adjustment (74.3) 68.2 103.6 Change in minimum pension liability, net of tax (43.6) (33.2) 11.8 Effective financial derivatives, net of tax (16.0) (0.4) 21.5
Net other comprehensive earnings adjustments (133.9) 34.6 136.9 Accumulated other comprehensive earnings (loss) $ (100.7) $ 33.2 $ (1.4)
Treasury Stock
Balance, beginning of year $ (564.9) $ (506.9) $ (445.3) Shares purchased, net of shares reissued (360.6) (58.0) (61.6) Balance, end of year $ (925.5) $ (564.9) $ (506.9)
Comprehensive Earnings
Net earnings $ 261.5 $ 295.6 $ 229.9 Net other comprehensive earnings adjustments (see details above) (133.9) 34.6 136.9 Comprehensive earnings $ 127.6 $ 330.2 $ 366.8
(a) Share amounts have been retroactively restated for the two-for-one stock split discussed in Note 14. The accompanying notes are an integral part of the consolidated financial statements.

Page 39 of 97
Notes to Consolidated Financial Statements Ball Corporation and Subsidiaries 1. Critical and Significant Accounting Policies In the application of accounting principles generally accepted in the United States of America, management is required to make estimates and assumptions that affect the reported amounts of assets and liabilities, disclosure of contingencies and reported amounts of revenues and expenses. These estimates are based on historical experience and various other assumptions believed to be reasonable under the circumstances. Actual results could differ from these estimates under different assumptions or conditions. Critical Accounting Policies The company considers certain accounting policies to be critical, as their application requires management’s best judgment in making estimates about the effect of matters that are inherently uncertain. Following is a discussion of the accounting policies we consider critical to our consolidated financial statements. Revenue Recognition in the Aerospace and Technologies Segment Sales under long-term contracts in the aerospace and technologies segment are recognized under the cost-to-cost, percentage-of-completion method. This business segment sells using two types of long-term sales contracts – cost-plus sales contracts, which represent approximately two-thirds of sales, and fixed price sales contracts which account for the remainder. A cost-plus sales contract is an agreement to perform the contract for cost plus an agreed upon profit component, whereas fixed price sales contracts are completed for a fixed price or involve the sale of engineering labor at fixed rates per hour. Cost-plus sales contracts can have different types of fee arrangements, including fixed fee, cost, schedule and performance incentive fees, award fees or a combination thereof. During initial periods of sales contract performance, our estimates of base, incentive and other fees are established at a conservative estimate of profit over the period of contract performance. Throughout the period of contract performance, we regularly reevaluate and, if necessary, revise our estimates of total contract revenue, total contract cost and extent of progress toward completion. Provision for estimated contract losses, if any, is made in the period that such losses are determined to be probable. Because of sales contract payment schedules, limitations on funding and contract terms, our sales and accounts receivable generally include amounts that have been earned but not yet billed. As a prime U.S. government contractor or subcontractor, the aerospace and technologies segment is subject to a high degree of regulation, financial review and oversight by the U.S. government. Goodwill and Other Intangible Assets We evaluate the carrying value of goodwill annually, and we evaluate our other intangible assets whenever there is evidence that certain events or changes in circumstances indicate that the carrying amount of these assets may not be recoverable. Goodwill is tested for impairment using a fair value approach, using discounted cash flows to establish fair values. We recognize an impairment charge for any amount by which the carrying amount of goodwill exceeds its fair value. When available and as appropriate, we use comparative market multiples to corroborate discounted cash flow results. When a business within a reporting unit is disposed of, goodwill is allocated to the gain or loss on disposition using the relative fair value methodology. We amortize the cost of other intangibles over their estimated useful lives unless such lives are deemed indefinite. Amortizable intangible assets are tested for impairment based on undiscounted cash flows and, if impaired, written down to fair value based on either discounted cash flows or appraised values. Intangible assets with indefinite lives are tested annually for impairment and written down to fair value as required.

Page 40 of 97
Notes to Consolidated Financial Statements Ball Corporation and Subsidiaries 1. Critical and Significant Accounting Policies (continued) Defined Benefit Pension Plans and Other Employee Benefits The company has defined benefit plans that cover the majority of its employees, including those at Ball Packaging Europe. We also have postretirement plans that provide medical benefits and life insurance for retirees and eligible dependents. The accounting for these plans is subject to the guidance provided in Statement of Financial Accounting Standards (SFAS) No. 87, "Employers’ Accounting for Pensions," and SFAS No. 106, "Employers' Accounting for Postretirement Benefits Other than Pensions." Both of these statements require that management make certain assumptions relating to the long-term rate of return on plan assets, discount rates used to measure future obligations and expenses, salary scale inflation rates, health care cost trend rates and other assumptions. We believe that the accounting estimates related to our pension and postretirement plans are critical accounting estimates because they are highly susceptible to change from period to period based on the performance of plan assets, actuarial valuations, market conditions and contracted benefit changes. The selection of assumptions is based on historical trends and known economic and market conditions at the time of valuation. However, actual results may differ substantially from these assumptions. Pension plan liabilities are revalued annually based on updated assumptions and information about the individuals covered by the plan. For pension plans, accumulated gains and losses in excess of a 10 percent corridor, the prior service cost and the transition asset are amortized on a straight-line basis from the date recognized over the average remaining service period of active participants. For other postemployment benefits, the 10 percent corridor is not used. In addition to defined benefit and postretirement plans, the company maintains reserves for employee medical claims, up to our insurance stop-loss limit, and workers’ compensation claims. These are regularly evaluated and revised, as needed, based on a variety of information including historical experience, third party actuarial estimates and current employee statistics. Taxes on Income Deferred tax assets, including operating loss, capital loss and tax credit carry forwards, are reduced by a valuation allowance when, in the opinion of management, it is more likely than not that any portion of these tax attributes will not be realized. In addition, from time to time, management must assess the need to accrue or disclose a possible loss contingency for proposed adjustments from various federal, state and foreign tax authorities that regularly audit the company in the normal course of business. In making these assessments, management must often analyze complex tax laws of multiple jurisdictions, including many foreign jurisdictions. Deferred income taxes reflect the future tax consequences of differences between the tax bases of assets and liabilities and their financial reporting amounts at each balance sheet date, based upon enacted income tax laws and tax rates. Income tax expense or benefit is provided based on earnings reported in the financial statements. The provision for income tax expense or benefit differs from the amounts of income taxes currently payable because certain items of income and expense included in the consolidated financial statements are recognized in different time periods by taxing authorities.

Page 41 of 97
Notes to Consolidated Financial Statements Ball Corporation and Subsidiaries 1. Critical and Significant Accounting Policies (continued) Business Consolidation Costs The company estimates its liabilities for business consolidation activities by accumulating detailed estimates of costs and asset sales proceeds, if any, for each business consolidation initiative. This includes the estimated costs of employee severance, pension and related benefits, impairment of property and equipment and other assets, including estimates of realizable value, contract termination payments for leases, contractual obligations and any other qualifying costs related to the exit plan. These estimated costs are grouped by specific projects within the overall exit plan and are then monitored on a monthly basis. Such disclosures represent management's best estimates, but require assumptions about the plans that may change over time. Changes in estimates for individual locations are evaluated periodically to determine if a change in estimate is required for the overall restructuring plan. Subsequent changes to the original estimates are included in current period earnings and identified as business consolidation gains or losses. Significant Accounting Policies Principles of Consolidation and Basis of Presentation The consolidated financial statements include the accounts of Ball Corporation and its controlled subsidiaries (collectively, Ball, the company, we or our). Equity investments in which we exercise significant influence, but do not control and are not the primary beneficiary, are accounted for using the equity method of accounting. Investments in which we do not exercise significant influence over the investee are accounted for using the cost method of accounting. Intercompany transactions are eliminated. Cash Equivalents Cash equivalents have original maturities of three months or less. Inventories Inventories are stated at the lower of cost or market. The cost of the aluminum component of U.S. metal beverage container inventories and substantially all inventories within the U.S. metal food container business are determined using the last-in, first-out (LIFO) method of accounting. The cost of remaining inventories is determined using the first-in, first-out (FIFO) average cost method of accounting. Depreciation and Amortization Property, plant and equipment are carried at the cost of acquisition or construction and depreciated over the estimated useful lives of the assets. Depreciation and amortization are provided using the straight-line method in amounts sufficient to amortize the cost of the assets over their estimated useful lives (buildings and improvements – 15 to 40 years; machinery and equipment – 5 to 15 years; other intangible assets –7.3 years, weighted average). Deferred financing costs are amortized over the life of the related loan facility and are reported as part of interest expense. When debt is repaid prior to its maturity date, the write-off of the remaining unamortized deferred financing costs is also reported as interest expense.

Page 42 of 97
Notes to Consolidated Financial Statements Ball Corporation and Subsidiaries 1. Critical and Significant Accounting Policies (continued) Environmental Reserves We estimate the liability related to environmental matters based on, among other factors, the degree of probability of an unfavorable outcome and the ability to make a reasonable estimate of the amount of loss. We record our best estimate of a loss when the loss is considered probable. As additional information becomes available, we assess the potential liability related to our pending matters and revise our estimates. Revenue Recognition in the Packaging Segments Sales of products in the packaging segments are recognized when delivery has occurred and title has transferred, there is persuasive evidence of an agreement or arrangement, the price is fixed and determinable, and collection is reasonably assured. Stock-Based Compensation Ball has a variety of restricted stock and stock option plans. With the exception of the company’s deposit share program, which through 2005 has been accounted for as a variable plan and is discussed in Note 14, the compensation cost associated with restricted stock grants has been calculated using the fair value at the date of grant and amortized over the restriction period. Expense related to stock options has been calculated using the intrinsic value method under the guidelines of Accounting Principles Board (APB) Opinion No. 25, and has therefore not been included in the consolidated statements of earnings. Ball’s earnings as reported include after-tax stock-based compensation of $6.6 million, $12.5 million and $7.6 million for the years ended December 31, 2005, 2004 and 2003, respectively. If the fair value based method had been used, after-tax stock-based compensation would have been $8.7 million in 2005, $9.3 million in 2004 and $8.8 million in 2003, and diluted earnings per share would have been lower by $0.02 in 2005, higher by $0.03 in 2004 and lower by $0.01 in 2003. Further details regarding the expense calculated under the fair value based method are provided in Note 14. Effective January 1, 2006, the company adopted SFAS No. 123 (revised 2004), “Share-Based Payment” (see the discussion of this new standard in the “New Accounting Pronouncements” section). Foreign Currency Translation Assets and liabilities of foreign operations are translated using period-end exchange rates, and revenues and expenses are translated using average exchange rates during each period. Translation gains and losses are reported in accumulated other comprehensive earnings as a component of shareholders’ equity. Derivative Financial Instruments The company uses derivative financial instruments for the purpose of hedging exposures to fluctuations in interest rates, foreign currency exchange rates, product sales, raw materials purchasing and common share repurchases. The company’s derivative instruments are recorded in the consolidated balance sheets at fair value. For a derivative designated as a fair value hedge of a recognized asset or liability, the gain or loss is recognized in earnings in the period of change together with the offsetting loss or gain on the hedged item attributable to the risk being hedged. For a derivative designated as a cash flow hedge, or a derivative designated as a fair value hedge of a firm commitment not yet recorded on the balance sheet, the effective portion of the derivative's gain or loss is initially reported as a component of accumulated other comprehensive earnings and subsequently reclassified into earnings when the forecasted transaction affects earnings. The ineffective portion of the gain or loss associated with all hedges is reported in earnings immediately.

Page 43 of 97
Notes to Consolidated Financial Statements Ball Corporation and Subsidiaries 1. Critical and Significant Accounting Policies (continued) Realized gains and losses from hedges are classified in the income statement consistent with the accounting treatment of the item being hedged. Gains and losses upon the early termination of effective derivative contracts are deferred in accumulated other comprehensive earnings and amortized to earnings in the same period as the originally hedged items affect earnings. Reclassifications Certain prior year amounts have been reclassified in order to conform to the current year presentation. New Accounting Pronouncements In May 2005 the Financial Accounting Standards Board (FASB) issued SFAS No. 154, “Accounting Changes and Error Corrections – a Replacement of APB Opinion No. 20 and FASB Statement No. 3.” The new standard changes the requirements for the accounting for and reporting of a change in accounting principle and applies to all such voluntary changes. The previous accounting required that most changes in accounting principle be recognized in net earnings by including a cumulative effect of the change in the period of the change. SFAS No. 154, which will be effective for Ball beginning January 1, 2006, requires retroactive application to prior periods’ financial statements. In December 2004 the FASB issued SFAS No. 123 (revised 2004), “Share-Based Payment.” SFAS No. 123 (revised 2004) is a revision of SFAS No. 123, “Accounting for Stock-Based Compensation,” and supersedes APB Opinion No. 25, “Accounting for Stock Issued to Employees.” The new standard, which will be effective for Ball beginning January 1, 2006, establishes accounting standards for transactions in which an entity exchanges its equity instruments for goods or services, including stock option and restricted stock grants. On March 29, 2005, the Securities and Exchange Commission (SEC) issued Staff Accounting Bulletin (SAB) No. 107, which summarizes the views of the SEC staff regarding the interaction between SFAS No. 123 (revised 2004) and certain SEC rules and regulations and provides the SEC staff’s views regarding the valuation of share-based payment arrangements for public companies. Upon adoption of SFAS No. 123 (revised 2004), Ball anticipates using the modified prospective transition method and, at least initially, the Black-Scholes valuation model. The incremental expense associated with the adoption of SFAS No. 123 (revised 2004) for unvested stock option and deposit share program restricted stock grants existing at December 31, 2005, is expected to be insignificant. Actual 2006 expense will vary based on additional grants made during 2006. In November 2004 the FASB issued SFAS No. 151, “Inventory Costs – an amendment of ARB No. 43, Chapter 4.” SFAS No. 151 requires abnormal amounts of idle facility expense, freight, handling costs and wasted material (spoilage) to be recognized as current-period charges. It also requires that the allocation of fixed production overheads to the costs of conversion be based on the normal capacity of the production facilities. SFAS No. 151 will be effective for inventory costs incurred by Ball beginning on January 1, 2006. Ball believes that the potential future impact, if any, of SFAS No. 151 will not be significant to its consolidated financial statements.

Page 44 of 97
Notes to Consolidated Financial Statements Ball Corporation and Subsidiaries 2. Business Segment Information The company has determined that it has five reportable segments organized along a combination of product lines and geographical areas – North American metal beverage packaging, North American metal food packaging, North American plastic packaging, international packaging and aerospace and technologies. Prior periods have been conformed to the current presentation. We also have investments in the packaging segments that are accounted for under the equity method of accounting, and, accordingly, those results are not included in segment sales or earnings. The accounting policies of the segments are the same as those described in the summary of critical and significant accounting policies (Note 1). See also Notes 3 and 4 for information regarding transactions affecting segment results. North American Metal Beverage Packaging The North American metal beverage packaging segment consists of operations in the U.S., Canada and Puerto Rico, which manufacture metal containers primarily for use in beverage packaging. North American Metal Food Packaging The North American metal food packaging segment consists of operations in the U.S. and Canada, which manufacture metal containers primarily for use in food packaging. North American Plastic Packaging The North American plastic packaging segment consists of operations in the U.S. which manufacture polyethylene terephthalate (PET) plastic containers primarily for use in beverage packaging. International Packaging International packaging, with operations in several countries in Europe and the PRC, includes the manufacture and sale of metal beverage container products in Europe and Asia, as well as plastic containers in Asia. Aerospace and Technologies Aerospace and technologies includes the manufacture and sale of aerospace and other related products and services used primarily in the defense, civil space and commercial space industries. Major Customers Following is a summary of Ball’s major customers and their respective percentages of consolidated sales for the years ended December 31:
2005 2004 2003
SABMiller plc 11% 11% 12% PepsiCo, Inc. and affiliates 10% 9% 10% All bottlers of Pepsi-Cola or Coca-Cola branded beverages 27% 28% 29% U.S. government agencies and their prime contractors 11% 10% 10%

Page 45 of 97
Notes to Consolidated Financial Statements Ball Corporation and Subsidiaries 2. Business Segment Information (continued) Summary of Net Sales by Geographic Area ($ in millions) U.S. Other (a) Consolidated
2005 $ 4,133.3 $ 1,617.9 $ 5,751.2 2004 3,898.9 1,541.3 5,440.2 2003 3,567.8 1,409.2 4,977.0 Summary of Long-Lived Assets by Geographic Area (b) ($ in millions) U.S. Germany Other (c) Consolidated
2005 $1,856.1 $1,099.7 $161.8 $3,117.6 2004 2,077.0 1,286.7 (131.6) 3,232.1 2003 2,002.3 1,207.6 (63.8) 3,146.1
(a) Includes the company’s net sales in the PRC, Canada and certain European countries (none of which was significant),
intercompany eliminations and other. (b) Long-lived assets primarily consist of property, plant and equipment, goodwill and other intangible assets. (c) Includes the company’s long-lived assets in the PRC, Canada and certain European countries, not including Germany
(none of which was significant), intercompany eliminations and other.

Page 46 of 97
Notes to Consolidated Financial Statements Ball Corporation and Subsidiaries 2. Business Segment Information (continued) Summary of Business by Segment ($ in millions) 2005 2004 2003
Net Sales
North American metal beverage packaging $ 2,390.4 $ 2,360.6 $ 2,292.2 North American metal food packaging 824.0 777.5 646.2 North American plastic packaging 487.5 401.0 376.0 International packaging 1,354.5 1,248.1 1,127.7 Aerospace and technologies 694.8 653.0 534.9
Net sales $ 5,751.2 $ 5,440.2 $ 4,977.0
Consolidated Earnings North American metal beverage packaging (a) $ 229.8 $ 279.1 $ 250.8 North American metal food packaging (a) 11.6 44.3 19.8 North American plastic packaging (a) 17.4 11.6 12.3 International packaging (a) 181.8 198.0 158.6 Aerospace and technologies (a) 54.7 48.7 49.5
Segment earnings before interest and taxes 495.3 581.7 491.0 Corporate undistributed expenses (32.8) (42.8) (30.2) Earnings before interest and taxes 462.5 538.9 460.8 Interest expense (b) (116.4) (103.7) (141.1) Tax provision (99.3) (139.2) (100.1) Minority interests (0.8) (1.0) (1.0) Equity in results of affiliates (Note 9) 15.5 0.6 11.3
Net earnings $ 261.5 $ 295.6 $ 229.9 Depreciation and Amortization
North American metal beverage packaging $ 69.0 $ 68.4 $ 72.2 North American metal food packaging 16.3 15.6 14.2 North American plastic packaging 36.8 40.0 41.1 International packaging 73.4 74.2 62.5 Aerospace and technologies 14.9 14.6 12.9
Segment depreciation and amortization 210.4 212.8 202.9 Corporate 3.1 2.3 2.6
Depreciation and amortization $ 213.5 $ 215.1 $ 205.5
December 31,
2005 2004 Total Assets
North American metal beverage packaging $ 1,664.4 $ 1,861.1 North American metal food packaging 445.1 429.8 North American plastic packaging 320.9 306.9 International packaging 2,122.6 2,255.8 Aerospace and technologies 253.1 210.3 Segment eliminations (537.5) (767.3)
Segment assets 4,268.6 4,296.6 Corporate assets, net of eliminations 74.8 181.1
Total assets $ 4,343.4 $ 4,477.7

Page 47 of 97
Notes to Consolidated Financial Statements Ball Corporation and Subsidiaries 2. Business Segment Information (continued) ($ in millions) 2005 2004 2003
Investments in Affiliates
North American metal beverage packaging $ 9.5 $ 7.7 $ 5.0 North American metal food packaging − − 0.8 International packaging 48.4 50.0 64.2 Aerospace and technologies 7.5 25.4 22.8
Investments in affiliates $ 65.4 $ 83.1 $ 92.8
Property, Plant and Equipment Additions North American metal beverage packaging $ 109.9 $ 57.0 $ 38.5 North American metal food packaging 16.8 14.3 28.6 North American plastic packaging 27.6 19.2 23.6 International packaging 97.9 73.9 22.1 Aerospace and technologies 33.1 24.0 19.2 Segment property, plant and equipment additions 285.3 188.4 132.0 Corporate 6.4 7.6 5.2
Property, plant and equipment additions $ 291.7 $ 196.0 $ 137.2
(a) Includes the following business consolidation gains (costs) discussed in Note 4:
($ in millions) 2005 2004 2003 North American metal beverage packaging $ (19.3) $ − $ 1.6 North American metal food packaging (11.2) 0.4 (1.4) North American plastic packaging − 0.7 − International packaging 9.3 13.7 3.3 Aerospace and technologies − 0.4 0.2
$ (21.2) $ 15.2 $ 3.7
(b) Includes $19.3 million and $15.2 million of debt refinancing costs in 2005 and 2003, respectively. 3. Acquisitions Ball Western Can Company (Ball Western Can) On March 17, 2004, Ball acquired ConAgra Grocery Products Company’s (ConAgra) interest in Ball Western Can for $30 million. Ball Western Can, located in Oakdale, California, was established in 2000 as a 50/50 joint venture between Ball and ConAgra and, prior to the acquisition, was accounted for by Ball using the equity method of accounting. The acquisition has been accounted for as a purchase, and accordingly, its results have been consolidated in our financial statements from the acquisition date. Contemporaneous with the acquisition, Ball and ConAgra’s parent company, ConAgra Foods Inc., entered into a long-term agreement under which Ball provides metal food containers to ConAgra manufacturing locations in California. The acquisition of Ball Western Can was not significant to the company. Metal Packaging International (MPI) On March 11, 2003, Ball acquired MPI, a manufacturer of ends for aluminum beverage cans, for $28 million. MPI produced just over 2 billion ends per year, primarily for carbonated soft drink companies, and had sales of $42 million in 2002. The MPI plant was closed during the second quarter of 2003 and sold in October 2004, with its manufacturing volumes being consolidated into other Ball facilities. The acquisition of MPI was not significant to the company.

Page 48 of 97
Notes to Consolidated Financial Statements Ball Corporation and Subsidiaries 4. Business Consolidation Activities Following is a summary of business consolidation (costs) and gains included in the consolidated statements of earnings for the years ended December 31, 2005, 2004 and 2003:
($ in millions) 2005 2004 2003 North American metal beverage packaging $ (19.3) $ − $ 1.6 North American metal food packaging (11.2) 0.4 (1.4) North American plastic packaging − 0.7 − International packaging 9.3 13.7 3.3 Aerospace and technologies − 0.4 0.2 $ (21.2) $ 15.2 $ 3.7 2005 North American Metal Beverage Packaging The company announced in July 2005 the commencement of a project to upgrade and streamline its North American beverage can end manufacturing capabilities. The project is expected to be completed in 2007 and will result in productivity gains and cost reductions. A pretax charge of $19.3 million ($11.7 million after tax) was recorded in the third quarter of 2005 in connection with this project. The pretax charge includes $11.7 million for employee severance, pension and other employee benefit costs, $1.6 million for decommissioning costs and $6 million for the write off of obsolete equipment spare parts and tooling. Payments made in 2005 were insignificant. North American Metal Food Packaging The fourth quarter of 2005 included a pretax charge of $4.6 million ($3.1 million after tax) for pension, severance and other employee benefit costs related to a reduction in force in our Burlington, Ontario, plant. Payments made in 2005 were insignificant. A pretax charge of $8.8 million ($5.9 million after tax) was recorded in the second quarter of 2005 in connection with the closure of a three-piece food can manufacturing plant in Quebec, Canada. The Quebec plant was closed and ceased operations in the third quarter of 2005 and an agreement has been reached to sell the land and building which resulted in the second quarter charge being offset by a $2.2 million gain ($1.5 million after tax) in the fourth quarter to adjust the Quebec plant to net realizable value. At December 31, 2005, the resulting reserve had been reduced by $1.9 million of cash payments made. The pretax charge, net of the offsetting gain, included $3.2 million for employee severance, pension and other employee benefit costs and $3.4 million for decommissioning cost and the write-down to net realizable value of fixed assets and other costs. When all assets are disposed of, management expects the plant closure to result in a net cash inflow. A total of 77 employees were terminated in connection with the closure.

Page 49 of 97
Notes to Consolidated Financial Statements Ball Corporation and Subsidiaries 4. Business Consolidation Activities (continued) The following table summarizes the activity in the 2005 North American business consolidation activities: ($ in millions)
Fixed Assets/Spare Parts
Pension Costs
Employee
Costs
Other
Total Charge (earnings) to North American segments:
Second quarter 2005 $ 4.8 $ 0.5 $ 2.6 $ 0.9 $ 8.8 Third quarter 2005 6.0 4.7 7.0 1.6 19.3 Fourth quarter 2005 (2.2) 2.7 1.9 – 2.4
Payments − − (1.7) (0.5) (2.2) Disposal of spare parts (1.4) – – – (1.4) Transfers to assets and liabilities to reflect
estimated realizable values and foreign exchange effects
(1.6)
(7.9)
0.2
–
(9.3) Balance at December 31, 2005 $ 5.6 $ – $ 10.0 $ 2.0 $ 17.6 The remaining carrying value of fixed assets remaining for sale in connection with the 2005 North American business consolidation activities was $5.3 million at December 31, 2005. International Packaging The company recorded $9.3 million of earnings in 2005, primarily related to the final settlement of tax obligations, and an adjustment to reclassify an asset to be put in service previously held for sale, related to a $237.7 million business consolidation charge taken in the second quarter of 2001. Tax clearances from the applicable authorities were required during the formal liquidation process. These matters have been concluded. 2004 North American Metal Food Packaging In the fourth quarter of 2004, a gain of $0.4 million was recorded, as costs were less than estimated for the 2003 closure of a metal food container plant. North American Plastic Packaging In the third quarter, earnings of $0.7 million were recorded as costs related to the shut down and relocation of the Atlanta plastics offices and research and development (R&D) facility were less than expected. The office relocation was completed during 2003 and the R&D facility relocation was completed in 2004. International Packaging The company recorded $13.7 million of earnings in 2004, primarily related to the realization of assets in the PRC in excess of amounts previously estimated, and costs of consolidation and liquidation less than anticipated, related to a $237.7 million business consolidation charge taken in the second quarter of 2001. Aerospace and Technologies Earnings of $0.4 million were recorded in the fourth quarter of 2004 for exit costs that were no longer required due to the sale of a product line whose operations ceased in 2001.

Page 50 of 97
Notes to Consolidated Financial Statements Ball Corporation and Subsidiaries 4. Business Consolidation Activities (continued) 2003 North American Metal Beverage A gain of $1.6 million was recorded in the fourth quarter in connection with the sale, and the completion of the consolidation activities, related to a metal beverage container plant closed in December 2001. North American Metal Food In the first quarter Ball announced plans to close a metal food container plant to address decreased demand for three-piece welded cans. In connection with the closure, a charge of $1.9 million was recorded, partially offset by a $0.5 million gain on the sale of a Canadian plant that was included in a business consolidation charge taken in 2000. The $1.9 million charge included $0.8 million for employee severance and benefit costs and $1.1 million for decommissioning costs and an impairment charge on fixed assets. International Packaging Ball Packaging Europe closed its plant in Runcorn, England, at the end of December 2003. The cost of the plant closure, along with costs associated with a line conversion and a line shut down at other plants, estimated to be €11.9 million in total, was accounted for in the opening acquisition balance sheet. These costs included €8.7 million for employee termination costs and €3.2 million for decommissioning costs, of which €10.5 million was paid and €0.6 million was reversed to goodwill as costs were less than initially estimated. The remaining balance of €0.8 million is for early retirement benefits to be paid under local law in future periods. There are no remaining assets held for sale at December 31, 2005. The company recorded $3.3 million of earnings in 2003, primarily related to the realization of assets in the PRC in excess of amounts previously estimated, and costs of consolidation and liquidation less than anticipated, related to a $237.7 million business consolidation charge taken in the second quarter of 2001. Aerospace and Technologies Earnings of $0.2 million in the third quarter of 2003 for exit costs that were no longer required due to the sale of a product line whose operations ceased in 2001.
5. Accounts Receivable Accounts receivable are net of an allowance for doubtful accounts of $13.4 million at December 31, 2005, and $17.1 million at December 31, 2004. A receivables sales agreement provides for the ongoing, revolving sale of a designated pool of trade accounts receivable of Ball’s North American packaging operations of up to $225 million (increased during the third quarter of 2005 from the previous limit of $200 million). The agreement qualifies as off-balance sheet financing under the provisions of SFAS No. 140. Net funds received from the sale of the accounts receivable totaled $210 million and $174.7 million at December 31, 2005 and 2004, respectively, and are reflected as a reduction of accounts receivable in the consolidated balance sheets. Fees incurred in connection with the sale of accounts receivable, which are reported as part of selling, general and administrative expenses, totaled $7.7 million in 2005, $3.2 million in 2004 and $2.5 million in 2003.

Page 51 of 97
Notes to Consolidated Financial Statements Ball Corporation and Subsidiaries 5. Accounts Receivable (continued) Net accounts receivable under long-term contracts, due primarily from agencies of the U.S. government and their prime contractors, were $121.7 million and $85.8 million at December 31, 2005 and 2004, respectively, and included $70.8 million and $60.6 million, respectively, representing the recognized sales value of performance that had not been billed and were not yet billable to customers. The average length of the long-term contracts is three years and the average length remaining on those contracts at December 31, 2005, was 12 months. Approximately $3 million of unbilled receivables at December 31, 2005, is expected to be collected after one year and is related to customary fees and cost withholdings that will be paid upon milestone or contract completions, as well as final overhead rate settlements. 6. Inventories
December 31, ($ in millions) 2005 2004 Raw materials and supplies $ 277.4 $ 256.5 Work in process and finished goods 392.9 373.0
$ 670.3 $ 629.5 Approximately 34 percent and 32 percent of total inventories at December 31, 2005 and 2004, respectively, were valued using the LIFO method of accounting. Inventories at December 31, 2005 and 2004, would have been $29.6 million and $12.1 million higher, respectively, than the reported amounts if the FIFO method of accounting, which approximates replacement cost, had been used for those inventories. 7. Property, Plant and Equipment
December 31, ($ in millions) 2005 2004 Land $ 81.1 $ 81.7 Buildings 804.3 735.4 Machinery and equipment 2,268.0 2,157.4
3,153.4 2,974.5 Accumulated depreciation (1,596.8) (1,442.1)
$ 1,556.6 $ 1,532.4 Property, plant and equipment are stated at historical cost. Depreciation expense amounted to $202.1 million, $202.8 million and $193 million for the years ended December 31, 2005, 2004 and 2003, respectively. The change in the net property, plant and equipment balance during 2005 is the result of capital spending offset by depreciation and changes in foreign currency exchange rates. During 2003 the company entered into capital leases totaling $6.7 million. The acquisitions of equipment under these capital leases were noncash transactions and, accordingly, have been excluded from the consolidated statement of cash flows.

Page 52 of 97
Notes to Consolidated Financial Statements Ball Corporation and Subsidiaries 8. Goodwill
($ in millions)
North American
Metal BeveragePackaging
North American
Metal Food
Packaging
North
American Plastic
Packaging
International Packaging
Total Balance at December 31, 2004 $ 298.2 $ 28.2 $ 31.8 $ 1,051.8 $ 1,410.0 Purchase accounting and other adjustments (9.5) – 1.4 (4.0) (12.1)Effects of foreign currency exchange rates (9.3) – − (130.0) (139.3)Balance at December 31, 2005 $ 279.4 $ 28.2 $ 33.2 $ 917.8 $ 1,258.6
In accordance with SFAS No. 142, goodwill is tested annually for impairment. There was no impairment of goodwill in 2005, 2004 or 2003. The decrease in goodwill due to purchase accounting adjustments primarily relates to the reduction of the remaining goodwill associated with the deferred taxes on foreign earnings that decreased as a result of the repatriation of the foreign earnings (see Note 12). 9. Intangibles and Other Assets
December 31, ($ in millions) 2005 2004
Intangibles and Other Assets:
Investments in affiliates $ 65.4 $ 83.1 Prepaid pension and related intangible asset 42.3 48.0 Other intangibles (net of accumulated amortization of $52.6
and $44 at December 31, 2005 and 2004, respectively)
43.1
58.2 Deferred tax asset 40.7 – Other 110.9 100.4
$ 302.4 $ 289.7 Total amortization expense of other intangible assets amounted to $11.4 million, $12.3 million and $12.5 million for the years ended December 31, 2005, 2004 and 2003, respectively. Based on intangible assets and foreign currency exchange rates as of December 31, 2005, total annual intangible asset amortization expense is expected to be between $9.7 million and $11.1 million in each of the years 2006 through 2009 and $1.1 million in 2010. In the first quarter of 2005, selling, general and administrative expenses included $3.8 million for the write down to net realizable value of an equity investment in an aerospace company. The remaining carrying amount of $14 million was reclassified to other current assets and was sold in October 2005 for $7 million cash and a $7.2 million interest-bearing note due April 2007. Also included in the first quarter of 2005 was an expense of $3.4 million for the full write off of a PRC equity investment in a joint venture. In the fourth quarter of 2004, the company recorded a $15.2 million equity earnings loss from the same joint venture related to a bad debt provision. Information learned late in the first quarter of 2005 led the company to conclude that it does not expect to recover the remaining carrying value of this investment.

Page 53 of 97
Notes to Consolidated Financial Statements Ball Corporation and Subsidiaries 10. Leases The company leases warehousing and manufacturing space and certain equipment, primarily within the packaging segments, and office and technical space, primarily within the aerospace and technologies segment. During 2005 and 2003 we entered into leases which qualify as operating leases for book purposes and capital leases for tax purposes. Under these lease arrangements, Ball has the option to purchase the leased equipment at the end of the lease term, or if we elect not to do so, to compensate the lessors for the difference between the guaranteed minimum residual values totaling $16.3 million and the fair market value of the assets, if less. Certain of the company’s leases in effect at December 31, 2005, include renewal options and/or escalation clauses for adjusting lease expense based on various factors. Total noncancellable operating leases in effect at December 31, 2005, require rental payments of $45.8 million, $35.3 million, $25.3 million, $19.4 million and $15.4 million for the years 2006 through 2010, respectively, and $56.8 million combined for all years thereafter. Lease expense for all operating leases was $74 million, $71.3 million and $64.8 million in 2005, 2004 and 2003, respectively.

Page 54 of 97
Notes to Consolidated Financial Statements Ball Corporation and Subsidiaries 11. Debt and Interest Costs Short-term debt at December 31, 2005, includes $106.8 million outstanding under uncommitted bank facilities totaling $267 million. At December 31, 2004, $43.7 million was outstanding under uncommitted bank facilities totaling $234 million. The weighted average interest rate of the outstanding short-term facilities was 3.9 percent at December 31, 2005, and 3.26 percent at December 31, 2004. Long-term debt at December 31 consisted of the following:
2005 2004 (in millions) In Local
Currency
In U.S. $ In Local
Currency
In U.S. $ Notes Payable
7.75% Senior Notes, due August 2006 $ − $ − $ 300.0 $ 300.0 6.875% Senior Notes, due December 2012
(excluding issue premium of $3.8 in 2005 and $4.3 in 2004) $ 550.0 550.0 $ 550.0 550.0
Senior Credit Facilities Term A Loan, British sterling denominated, due
October 2011 (2005 – 5.502%)
₤ 85.0
146.2 −
−
Term B Loan, euro denominated, due October 2011 (2005 – 3.184%)
€ 350.0
414.4
− −
Term C Loan, Canadian dollar denominated, due October 2011 (2005 – 4.155% to 4.255%)
C$ 165.0
141.9
− −
U.S. dollar multi-currency revolver borrowings, due October 2011 (2005 – 5.243% to 5.476%)
$ 60.0
60.0
−
−
Euro multi-currency revolver borrowings, due October 2011 (2005 – 3.293% to 3.305%)
€ 50.0
59.2
−
−
British sterling multi-currency revolver borrowings, due October 2011 (2005 – 5.495%)
₤ 22.0
37.9
−
−
Canadian dollar multi-currency revolver borrowings, due October 2011 (2005 – 3.975% to 4.265%)
C$ 14.0
12.0
−
−
Former Senior Credit Facilities Term Loan A, euro denominated, due December 2007
(2004 – 3.93%)
− −
€ 72.0
97.7 Term Loan A, British sterling denominated, due
December 2007 (2004 – 6.64%)
− −
₤ 47.4
90.9 Term Loan B, euro denominated, due December 2009
(2004 – 4.18%)
− −
€ 232.7
315.6 Term Loan B, U.S. dollar denominated, due
December 2009 (2004 – 4.31%)
− −
$ 185.0
185.0 European Bank for Reconstruction and Development
Loans
Floating rates due June 2009 (2005 – 3.727%; 2004 – 3.63%)
€ 20.0
23.7
€ 20.0
27.1
Industrial Development Revenue Bonds Floating rates due through 2011 (2005 – 3.57% to
3.58%; 2004 − 2%)
$ 16.0
16.0 $ 24.0
24.0
Other Various 21.6 Various 26.7 1,482.9 1,617.0
Less: Current portion of long-term debt (9.6) (79.3) $1,473.3 $1,537.7

Page 55 of 97
Notes to Consolidated Financial Statements Ball Corporation and Subsidiaries 11. Debt and Interest Costs (continued) 2005 On October 13, 2005, Ball refinanced its senior secured credit facilities. The new senior secured credit facilities extend debt maturities at lower interest rate spreads and provide Ball with additional borrowing capacity for future growth. During the third and fourth quarters of 2005, Ball redeemed its 7.75% senior notes due in August 2006. The refinancing and senior note redemptions resulted in a debt refinancing charge of $19.3 million ($12.3 million after tax) for the related call premium and unamortized debt issuance costs. The new senior credit facilities bear interest at variable rates and also include (1) a multi-currency, long-term revolving credit facility which provides the company with up to the equivalent of $715 million and (2) a Canadian long-term revolving credit facility which provides the company with up to the equivalent of $35 million. Both revolving credit facilities expire in October 2011. At December 31, 2005, taking into account outstanding letters of credit, $547 million was available under the revolving credit facilities. Maturities of all long-term debt obligations outstanding at December 31, 2005, are $9.5 million, $32.2 million, $75.3 million, $85.2 million and $205.7 million for the years ending December 31, 2006 through 2010, respectively, and $1,071.2 million thereafter. Ball provides letters of credit in the ordinary course of business to secure liabilities recorded in connection with industrial development revenue bonds and certain self-insurance arrangements. Letters of credit outstanding at December 31, 2005 and 2004, were $34 million and $43 million, respectively. The notes payable and senior credit facilities are guaranteed on a full, unconditional and joint and several basis by certain of the company’s domestic wholly owned subsidiaries. Certain foreign denominated tranches of the senior credit facilities are similarly guaranteed by certain of the company’s wholly owned foreign subsidiaries. Note 19 contains further details as well as condensed, consolidating financial information for the company, segregating the guarantor subsidiaries and non-guarantor subsidiaries. The company was not in default of any loan agreement at December 31, 2005, and has met all debt payment obligations. The U.S. note agreements, bank credit agreement and industrial development revenue bond agreements contain certain restrictions relating to dividend payments, share repurchases, investments, financial ratios, guarantees and the incurrence of additional indebtedness. 2004 During the first quarter of 2004, Ball repaid €31 million ($38 million) of its previous euro denominated Term Loan B and reduced the interest rate by 50 basis points. Interest expense during the first quarter of 2004 included $0.5 million for the write off of the unamortized financing costs associated with the repaid loans. 2003 On August 8, 2003, Ball refinanced 8.25% Senior Subordinated Notes due in 2008 through the placement of $250 million of 6.875% Senior Notes due in 2012 issued at a price of 102% (effective yield to maturity of 6.58 percent). In connection with the refinancing of the higher interest debt, in the third quarter of 2003 a pretax charge of $15.2 million was recorded as interest expense, which consisted of the payment of a $10.3 million call premium and the write off of $4.9 million of unamortized financing costs. During the fourth quarter of 2003, Ball repaid $160 million of its previous U.S. dollar denominated Term Loan B and €25 million of the euro denominated Term Loan B. At the time of the early repayment, the interest rate on the U.S. portion of the Term Loan B was reduced by 50 basis points. Interest expense during the fourth quarter of 2003 included $2.9 million for the write off of the unamortized financing costs associated with the repaid loans.

Page 56 of 97
Notes to Consolidated Financial Statements Ball Corporation and Subsidiaries 11. Debt and Interest Costs (continued) A summary of total interest cost paid and accrued follows: ($ in millions) 2005 2004 2003
Interest costs before refinancing costs $ 102.4 $ 105.8 $ 129.0 Debt refinancing costs 19.3 − 15.2
Total interest costs 121.7 105.8 144.2 Amounts capitalized (5.3) (2.1) (3.1) Interest expense $ 116.4 $ 103.7 $ 141.1 Interest paid during the year(a) $ 138.5 $ 102.6 $ 139.2 (a) Includes $6.6 million and $10.3 million of call premiums in 2005 and 2003, respectively, paid in connection with the
redemption of the company’s senior and senior subordinated notes.
12. Taxes on Income The amount of earnings before income taxes is:
($ in millions) 2005 2004 2003 U.S. $ 191.0 $ 254.8 $ 187.8 Foreign 155.1 180.4 131.9
$ 346.1 $ 435.2 $ 319.7 The provision for income tax expense is: ($ in millions) 2005 2004 2003
Current
U.S. $ 75.0 $ 45.2 $ 35.5 State and local 15.3 10.6 7.9 Foreign 51.5 40.6 38.9 Repatriation of foreign earnings 16.0 − −
Total current 157.8 96.4 82.3
Deferred
U.S. (18.4) 41.2 22.9 State and local (3.6) 4.5 2.7 Foreign (17.3) (2.9) (7.8) Repatriation of foreign earnings (19.2) − −
Total deferred (58.5) 42.8 17.8
Provision for income taxes $ 99.3 $ 139.2 $ 100.1

Page 57 of 97
Notes to Consolidated Financial Statements Ball Corporation and Subsidiaries 12. Taxes on Income (continued) The income tax provision recorded within the consolidated statements of earnings differs from the provision determined by applying the U.S. statutory tax rate to pretax earnings as a result of the following: ($ in millions) 2005 2004 2003 Statutory U.S. federal income tax $ 121.1 $ 152.3 $ 111.9 Increase (decrease) due to:
Foreign tax holiday (5.6) (7.0) (8.4) Company-owned life insurance (3.2) (3.5) (4.8) Tax rate differences (3.1) (7.9) (5.5) Research and development tax credits (10.6) (3.7) (1.5) Manufacturing deduction (2.9) − − State and local taxes, net 7.6 9.4 6.9 Equity investment write downs 2.5 − − Repatriation of foreign earnings (3.2) − − Other, net (3.3) (0.4) 1.5
Provision for taxes $ 99.3 $ 139.2 $ 100.1 Effective tax rate expressed as a percentage
of pretax earnings 28.7% 32.0%
31.3% In 1995 Ball Packaging Europe’s Polish subsidiary was granted a tax holiday. Under the terms of the holiday, an exemption was granted on manufacturing earnings for up to €39.5 million of income tax. At December 31, 2005, the remaining tax holiday available to reduce future Polish tax liability was €5.5 million. In 2005 Ball Packaging Europe’s Serbian subsidiary was granted a tax holiday. Under the terms of the holiday, the earnings of this subsidiary will be exempt from income taxation for a period of 10 years beginning with the first year the Serbian subsidiary has taxable earnings. Net income tax payments were $99 million, $72.6 million and $28.4 million for 2005, 2004 and 2003, respectively.

Page 58 of 97
Notes to Consolidated Financial Statements Ball Corporation and Subsidiaries 12. Taxes on Income (continued) The significant components of deferred tax assets and liabilities at December 31 were: ($ in millions) 2005 2004 Deferred tax assets:
Deferred compensation $ (56.2) $ (51.7) Accrued employee benefits (90.6) (73.9) Plant closure costs (18.3) (15.6) Accrued pensions (92.0) (54.5) Unrealized losses from forward purchase contracts (10.1) – Alternative minimum tax credits – (7.0) Net operating losses (14.8) (13.1) Foreign tax credits (5.8) − Other (33.1) (47.8)
Total deferred tax assets (320.9) (263.6) Valuation allowance 8.6 5.4
Net deferred tax assets (312.3) (258.2) Deferred tax liabilities:
Depreciation 229.5 277.8 Goodwill and other intangible assets 45.5 42.9 Other 20.5 26.2
Total deferred tax liabilities 295.5 346.9 Net deferred tax liability (asset) $ (16.8) $ 88.7
The change in deferred taxes during 2005 is primarily attributable to book depreciation exceeding tax depreciation, a reduction in cash pension payments and the effects of foreign currency exchange rates. At December 31, 2005, Ball Packaging Europe and subsidiaries had net operating loss carryforwards, with no expiration date, of $52 million with a related tax benefit of $14.8 million. Due to the uncertainty of ultimate realization, that benefit has been offset by a valuation allowance of $4.8 million. Any realization of the valuation allowance will be recognized as a reduction in goodwill. At December 31, 2005, the company has foreign tax credit carryforwards in the amount of $5.8 million; however, due to the uncertainty of realization of the entire credit, a valuation allowance of $3.8 million has been applied to reduce the carrying value to $2 million. On October 22, 2004, the American Jobs Creation Act of 2004 (Jobs Act) was signed into law. The Jobs Act provides certain domestic companies a temporary opportunity to repatriate previously undistributed earnings of controlled foreign subsidiaries at a reduced federal tax rate, approximating 5.25 percent. The reduced rate is achieved via an 85 percent dividends received deduction on earnings repatriated during a one-year period on or before December 31, 2005. To qualify for the deduction, the repatriated earnings must be reinvested in the United States pursuant to one or more domestic reinvestment plans approved, in advance of distribution, by the company's chief executive officer (CEO) and subsequently approved by the company's board of directors. Certain other criteria in the Jobs Act were satisfied as well.

Page 59 of 97
Notes to Consolidated Financial Statements Ball Corporation and Subsidiaries 12. Taxes on Income (continued) In July 2005 the company’s CEO approved a foreign dividend and capital distribution plan that included the repatriation of undistributed earnings of certain of its foreign subsidiaries during the third and fourth quarters of 2005. The applicable domestic reinvestment plans were approved by the CEO, in advance of distributions, and subsequently approved by the board of directors as required under the Jobs Act. Under the plan, the distribution was $488.4 million, of which approximately $320.3 million is taxable and subject to the provisions of the Jobs Act. The company recorded a current tax payable of $16 million that was more than offset by the release of $19.2 million of accrued taxes on prior year unremitted foreign earnings, resulting in a net decrease in tax expense of $3.2 million. Notwithstanding the 2005 distribution pursuant to the Jobs Act, management’s intention is to indefinitely reinvest foreign earnings. Subsequent to the aforementioned Jobs Act distribution, substantially all of the previously undistributed earnings of Ball’s controlled foreign corporations have been distributed; therefore, no deferred tax provision would be required at December 31, 2005. As previously reported in the company’s 2004 Annual Report on Form 10-K, in connection with the Internal Revenue Service’s examination of Ball’s consolidated income tax returns for the tax years 2000 through 2003, the IRS has proposed to disallow Ball’s deductions of interest expense incurred on loans under a company-owned life insurance plan that has been in place for more than 19 years. Ball believes that its interest deductions will be sustained as filed and, therefore, no provision for loss has been accrued. The IRS’s proposed adjustments would result in an increase in taxable income for the years 1999 through 2003 of $46.7 million and a corresponding increase in taxable income for subsequent tax years 2004 and 2005 in the amount of $20.2 million with a corresponding increase in aggregate tax expense of $26.4 million plus any related interest expense and penalties. The examination reports for the 2000 to 2003 examinations have been forwarded to the appeals division of the IRS, and no further action has taken place to change Ball’s position. 13. Employee Benefit Obligations
December 31, ($ in millions) 2005 2004 Total defined benefit pension liability $ 529.9 $ 488.5 Less current portion (39.2) (29.9)
Long-term defined benefit pension liability 490.7 458.6 Retiree medical and other postemployment benefits 141.1 133.8 Deferred compensation 130.4 117.6 Other 22.0 24.3
$ 784.2 $ 734.3 The company's pension plans cover substantially all U.S., Canadian and European employees meeting certain eligibility requirements. The defined benefit plans for salaried employees, as well as those for hourly employees in Germany and the United Kingdom, provide pension benefits based on employee compensation and years of service. Plans for North American hourly employees provide benefits based on fixed rates for each year of service. The German plans are not funded but the company maintains book reserves and annual additions to the reserves are generally tax deductible. With the exception of the German plans, our policy is to fund the plans on a current basis to the extent deductible under existing tax laws and regulations and in amounts at least sufficient to satisfy statutory funding requirements. We also have defined benefit pension obligations in France and Austria, the assets and liabilities of which are insignificant.

Page 60 of 97
Notes to Consolidated Financial Statements Ball Corporation and Subsidiaries 13. Employment Benefit Obligations (continued) Defined Benefit Pension Plans An analysis of the change in benefit accruals for 2005 and 2004 follows:
($ in millions) 2005 2004 U.S. Foreign Total U.S. Foreign Total
Change in benefit obligation: Benefit obligation at prior year end $ 683.9 $ 601.5 $ 1,285.4 $ 612.8 $ 543.9 $ 1,156.7Service cost 24.2 8.4 32.6 22.1 8.6 30.7Interest cost 40.1 28.1 68.2 37.8 28.8 66.6Benefits paid (30.5) (31.4) (61.9) (28.9) (31.6) (60.5)Net actuarial loss 56.9 42.1 99.0 24.9 14.2 39.1Effect of exchange rates – (57.5) (57.5) – 43.8 43.8Plan amendments and other 3.4 2.4 5.8 15.2 (6.2) 9.0
Benefit obligation at year end
778.0 593.6 1,371.6
683.9 601.5 1,285.4
Change in plan assets: Fair value of assets at prior year
end
558.8
197.6
756.4
488.0
158.4
646.4Actual return on plan assets 35.9 20.8 56.7 57.1 16.4 73.5Employer contributions 6.4 10.7 17.1 42.6 18.0 60.6Contributions to unfunded German
plans(a) – 21.6 21.6 – 21.0 21.0Benefits paid (30.5) (31.4) (61.9) (28.9) (31.6) (60.5)Effect of exchange rates – (7.5) (7.5) – 13.9 13.9Other – 1.9 1.9 – 1.5 1.5Fair value of assets at end of year 570.6 213.7 784.3 558.8 197.6 756.4
Funded status (207.4) (379.9)(a) (587.3) (125.1) (403.9)(a) (529.0)
Unrecognized net actuarial loss 272.5 75.7 348.2 220.6 42.2 262.8Unrecognized prior service cost 40.4 (4.5) 35.9 41.9 (2.8) 39.1Prepaid (accrued) benefit cost $ 105.5 $ (308.7) $ (203.2) $ 137.4 $ (364.5) $ (227.1)
(a) The German plans are unfunded and the liability is included in the company’s balance sheet. Benefits are paid directly by
the company to the participants. The German plans represented $324.8 million and $353.6 million of the total unfunded status at December 31, 2005 and 2004, respectively. The decrease from 2004 to 2005 is partially the result of changes in foreign currency exchange rates.
Page 61 of 97
Notes to Consolidated Financial Statements Ball Corporation and Subsidiaries 13. Employee Benefit Obligations (continued) Amounts recognized in the balance sheet at December 31 consisted of: 2005 2004 ($ in millions) U.S. Foreign Total U.S. Foreign Total Prepaid benefit cost $ – $ – $ – $ – $ 1.3 $ 1.3 Accrued benefit liability (148.5) (381.4) (529.9) (74.3) (414.2) (488.5)Intangible asset 40.4 1.9 42.3 41.9 4.8 46.7 Deferred tax benefit associated with
accumulated other comprehensive loss
84.3 25.2 109.5
67.0 15.2 82.2
Accumulated other comprehensive loss, net of tax 129.3 40.6 169.9 102.8 23.5 126.3
Foreign currency translation − 5.0 5.0 − 4.9 4.9 Net amount recognized $ 105.5 $(308.7) $(203.2) $ 137.4 $(364.5) $(227.1) The accumulated benefit obligation for all U.S. defined benefit pension plans was $719.1 million and $633.1 million at December 31, 2005 and 2004, respectively. The accumulated benefit obligation for all foreign defined benefit pension plans was $559.5 million and $561.5 million at December 31, 2005 and 2004, respectively. Following is the information for defined benefit plans with an accumulated benefit obligation in excess of plan assets at December 31:
2005 2004 ($ in millions) U.S. Foreign Total U.S. Foreign Total Projected benefit obligation $ 778.0 $ 593.6 $1,371.6 $ 683.9 $ 571.1 $1,255.0 Accumulated benefit obligation 719.1 559.5 1,278.6 633.1 531.1 1,164.2 Fair value of plan assets 570.6 213.7(a) 784.3 558.8 166.3(a) 725.1 (a) The German plans are unfunded and, therefore, there are no fair value of plan assets associated with them. The unfunded
status of those plans was $324.8 million and $353.6 million at December 31, 2005 and 2004, respectively. Components of net periodic benefit cost were:
2005 2004 2003 ($ in millions) U.S. Foreign Total U.S. Foreign Total U.S. Foreign Total
Service cost $ 24.2 $ 8.4 $ 32.6 $ 22.1 $ 8.6 $ 30.7 $ 18.8 $ 7.7 $ 26.5 Interest cost 40.1 28.1 68.2 37.8 28.8 66.6 36.3 26.0 62.3 Expected return on
plan assets (46.2) (14.7)
(60.9) (43.8) (12.8)
(56.6)
(42.4)
(10.1)
(52.5)Amortization of
prior service cost
4.8
(0.1)
4.7
4.0
–
4.0
2.9
0.1
3.0
Recognized net actuarial loss
15.5
2.3
17.8
12.9
1.3
14.2
9.1
1.0
10.1
Curtailment loss – 3.0 3.0 – – – – – – Subtotal 38.4 27.0 65.4 33.0 25.9 58.9 24.7 24.7 49.4
Non-company sponsored plan
1.0
–
1.0
0.3
–
0.3
–
–
–
Net periodic benefit cost $ 39.4 $ 27.0 $ 66.4 $ 33.3 $ 25.9 $ 59.2 $ 24.7 $ 24.7 $ 49.4

Page 62 of 97
Notes to Consolidated Financial Statements Ball Corporation and Subsidiaries 13. Employee Benefit Obligations (continued) Weighted average assumptions used to determine benefit obligations for the North American plans at December 31 were: U.S. Canada 2005 2004 2003 2005 2004 2003
Discount rate 5.75% 6.00% 6.25% 5.00% 5.75% 6.20% Rate of compensation increase 3.33% 3.33% 3.33% 3.50% 2.75% 3.50% Weighted average assumptions used to determine benefit obligations for the European plans at December 31 were: United Kingdom Germany 2005 2004 2003 2005 2004 2003
Discount rate 4.90% 5.50% 5.50% 4.01% 4.76% 5.25% Rate of compensation increase 4.00% 4.00% 4.00% 2.75% 2.75% 3.00% Pension increase 2.50% 2.50% 2.50% 1.75% 1.75% 2.00% The discount and compensation increase rates used above to determine the benefit obligations at December 31, 2005, will be used to determine net periodic benefit cost for 2006. Weighted average assumptions used to determine net periodic benefit cost for the North American plans for the years ended December 31 were:
U.S. Canada 2005 2004 2003 2005 2004 2003
Discount rate 6.00% 6.25% 6.75% 5.75% 6.20% 6.37% Rate of compensation increase 3.33% 3.33% 3.33% 3.50% 3.50% 3.50% Expected long-term rate of return on
assets
8.50%
8.50%
8.50%
7.65%
7.64%
7.69% Weighted average assumptions used to determine net periodic benefit cost for the European plans for the years ended December 31 were:
United Kingdom Germany 2005 2004 2003 2005 2004 2003
Discount rate 5.50% 5.50% 5.50% 4.76% 5.25% 5.50% Rate of compensation increase 4.00% 4.00% 4.00% 2.75% 3.00% 3.25% Pension increase 2.50% 2.50% 2.50% 1.75% 2.00% 2.00% Expected long-term rate of return on
assets
7.00%
7.00%
7.00%
N/A
N/A
N/A Current financial accounting standards require that the discount rates used to calculate the actuarial present value of pension and other postretirement benefit obligations reflect the time value of money as of the measurement date of the benefit obligation and reflect the rates of return currently available on high quality fixed income securities whose cash flows (via coupons and maturities) match the timing and amount of future benefit payments of the plan. In addition, changes in the discount rate assumption should reflect changes in the general level of interest rates.

Page 63 of 97
Notes to Consolidated Financial Statements Ball Corporation and Subsidiaries 13. Employee Benefit Obligations (continued) In selecting the U.S. discount rate for December 31, 2005, several benchmarks were considered to provide guidance. These benchmarks included Moody's long-term corporate bond yield for Aa bonds and the Citigroup Pension Liability Index. In addition, the expected cash flows from the plans were modeled relative to the Citigroup Pension Discount Curve and matched to cash flows from a portfolio of bonds rated Aa or better. In Canada the markets for locally denominated high-quality, longer term corporate bonds are relatively thin. As a result, the approach taken in Canada is to use yield curve spot rates to discount the respective benefit cash flows and to compute the underlying constant bond yield equivalent. The Canadian discount rate at December 31, 2005, was selected based on a review of the expected benefit payments for each of the Canadian defined benefit plans over the next 60 years and then discounting the resulting cash flows to the measurement date using the AA corporate bond spot rates to determine the equivalent level discount rate. In the United Kingdom and Germany, the company and its actuarial consultants considered the applicable iBoxx 15+ year AA corporate bond yields for the respective markets and determined a rate in line with those expectations. In all countries, the discount rates selected for December 31, 2005, were based on the range of values obtained from cash flow specific methods, together with the changes in the general level of interest rates reflected by the benchmarks. The assumption related to the expected long-term rate of return on plan assets reflects the average rate of earnings expected on the funds invested to provide for the benefits over the life of the plans. The assumption is based upon Ball’s pension plan asset allocations, investment strategies and the views of investment managers and other large pension plan sponsors. Some reliance was placed on historical asset returns of our plans. An asset-return generation model was used to project future asset returns using simulation and asset class correlation. The analysis includes expected future risk premiums, forward-looking return expectations derived from the yield on long-term bonds and the price earnings ratios of major stock market indexes, expected inflation and real risk-free interest rate assumptions, and the fund’s expected asset allocation. The expected long-term rates of return on assets are calculated by applying the expected rate of return to a market related value of plan assets at the beginning of the year, adjusted for the weighted average expected contributions and benefit payments. For the North American plans, the market related value of plan assets used to calculate expected return was $662.4 million for 2005, $604.4 million for 2004 and $570.4 million for 2003. Included in other comprehensive earnings, net of related tax effect, were increases in the minimum liability of $43.6 million and $33.2 million in 2005 and 2004, respectively, and a decrease of $11.8 million in 2003. For pension plans, accumulated gains and losses in excess of a 10 percent corridor and the prior service cost are being amortized over the average remaining service period of active participants. Defined Benefit Pension Plan Assets Investment policies and strategies for the plan assets in the U.S., Canada and the United Kingdom are established by pension investment committees and include the following common themes: (1) to provide for long-term growth of principal income without undue exposure to risk; (2) to minimize contributions to the plans; (3) to minimize and stabilize pension expense; and (4) to achieve a rate of return which is above the market average for each asset class over the long term. The pension investment committees are required to regularly, but no less frequently than once annually, review asset mix and asset performance, as well as the performance of the investment managers. Based on their reviews, which are generally conducted quarterly, investment policies and strategies are revised as appropriate.

Page 64 of 97
Notes to Consolidated Financial Statements Ball Corporation and Subsidiaries 13. Employee Benefit Obligations (continued) Target asset allocations in the U.S. and Canada are set using a minimum and maximum range for each asset category as a percent of the total funds market value. Assets contributed to the United Kingdom plans are invested using established percentages. Following are the target asset allocations established as of December 31, 2005:
U.S.
Canada
United Kingdom
Cash and cash equivalents 0-10% 0-10% – Equity securities 40-75% (a) 50-75% (c) 82% (d) Fixed income securities 25-60% (b) 25-45% 18% Alternative investments 0-15% – –
(a) Equity securities may consist of: (1) up to 35 percent large cap equities; (2) up to 15 percent mid cap equities; (3) up to
15 percent small cap equities; (4) up to 35 percent foreign equities; and (5) up to 10 percent other equities. (b) Debt securities may include up to 10 percent high yield non-investment grade bonds and up to 15 percent international
bonds. (c) May include between 15 percent and 35 percent non-Canadian equity securities and must remain within the Canadian tax
law for foreign property limits. (d) Equity securities must consist of United Kingdom securities and up to 29 percent foreign securities. The actual weighted average asset allocations for Ball’s defined benefit pension plans, which are within the established targets for each country, were as follows at December 31:
2005 2004 Cash and cash equivalents 1% 1% Equity securities 62% 66% Fixed income securities 32% 31% Other 5% 2% 100% 100% Contributions to the company’s defined benefit pension plans, not including the unfunded German plans, are expected to be $49 million in 2006. This estimate may change based on plan asset performance. Benefit payments related to these plans are expected to be $43 million, $46 million, $48 million, $51 million and $54 million for the years ending December 31, 2006 through 2010, respectively, and $318 million thereafter. Payments to participants in the unfunded German plans are expected to be $22 million in 2006, $22 million, $23 million, $24 million and $24 million in the years 2006 through 2010, respectively, and a total of $131 million thereafter. Other Postemployment Benefits The company sponsors defined benefit and defined contribution postretirement health care and life insurance plans for substantially all U.S. and Canadian employees. Employees may also qualify for long-term disability, medical and life insurance continuation and other postemployment benefits upon termination of active employment prior to retirement. All of the Ball-sponsored postretirement health care and life insurance plans are unfunded and, with the exception of life insurance benefits, are self-insured. In Canada, the company provides supplemental medical and other benefits in conjunction with Canadian provincial health care plans. Most U.S. salaried employees who retired prior to 1993 are covered by noncontributory defined benefit medical plans with capped lifetime benefits. Ball provides a fixed subsidy toward each retiree's future purchase of medical insurance for U.S. salaried and substantially all nonunion hourly employees retiring after January 1, 1993. Life insurance benefits are noncontributory. Ball has no commitments to increase benefits provided by any of the postemployment benefit plans.

Page 65 of 97
Notes to Consolidated Financial Statements Ball Corporation and Subsidiaries 13. Employee Benefit Obligations (continued) An analysis of the change in other postretirement benefit accruals for 2005 and 2004 follows: ($ in millions) 2005 2004
Change in benefit obligation:
Benefit obligation at prior year end $ 170.8 $ 162.6 Service cost 2.6 2.7 Interest cost 9.7 9.7 Benefits paid (9.9) (9.5) Net actuarial loss (gain) 2.0 (5.0) Plan amendment – 8.5 Effect of foreign exchange rates 0.8 1.8 Benefit obligation at year end 176.0 170.8
Change in plan assets: Fair value of assets at prior year end – – Employer contributions 9.9 9.5 Benefits paid (9.9) (9.5) Fair value of assets at end of year – –
Funded status (176.0) (170.8)
Unrecognized net actuarial loss 32.8 32.8 Unrecognized prior service cost 8.5 10.0
Accrued benefit cost $ (134.7) $ (128.0) Components of net periodic benefit cost were: ($ in millions) 2005 2004 2003 Service cost $ 2.6 $ 2.7 $ 2.1 Interest cost 9.7 9.7 9.0 Amortization of prior service cost 1.5 1.5 0.4 Recognized net actuarial loss 2.3 2.7 2.0
Net periodic benefit cost $ 16.1 $ 16.6 $ 13.5 The assumptions used for the determination of benefit obligations and net periodic benefit cost were the same as used for the U.S. and Canadian defined benefit pension plans. For other postemployment benefits, accumulated gains and losses, the prior service cost and the transition asset are being amortized over the average remaining service period of active participants. For the U.S. health care plans at December 31, 2005, a 10 percent health care cost trend rate was used for pre-65 and post-65 benefits, and trend rates were assumed to decrease by 1 percent per year until 2011 when they reach 5 percent and remain level thereafter. For the Canadian plans, a 10 percent health care cost trend rate was used, which was assumed to decrease in one-half percent increments to 5 percent by 2016 and remain at that level in subsequent years. Health care cost trend rates can have an effect on the amounts reported for the health care plan. A one-percentage point change in assumed health care cost trend rates would increase or decrease the total of service and interest cost by approximately $0.5 million and the postemployment benefit obligation by approximately $8 million to $9 million.

Page 66 of 97
Notes to Consolidated Financial Statements Ball Corporation and Subsidiaries 13. Employee Benefit Obligations (continued) Other Benefit Plans The company matches employee contributions to the 401(k) plan with shares of Ball common stock, up to 50 percent of up to 6 percent of a participant’s annual salary. The expense associated with the company match amounted to $14.3 million, $13 million and $11.7 million for 2005, 2004 and 2003, respectively. In addition, substantially all employees within the company’s aerospace and technologies segment who participate in Ball’s 401(k) plan receive a performance-based matching cash contribution of up to 4 percent of base salary. The company recognized $6.3 million, $4.8 million and $6 million of additional compensation expense related to this program for the years 2005, 2004 and 2003, respectively. In 2005 the company’s 401(k) plan matching contributions could not exceed $7,000 per employee due to the 401(k) aggregate limit on employee contributions of $14,000. 14. Shareholders' Equity At December 31, 2005, the company had 550 million shares of common stock and 15 million shares of preferred stock authorized, both without par value. Preferred stock includes 120,000 authorized but unissued shares designated as Series A Junior Participating Preferred Stock. On January 31, 2005, in a privately negotiated stock repurchase transaction, Ball entered into a forward purchase agreement to repurchase 3 million of its common shares at an initial price of $42.72 per share using cash on hand and available borrowings. The price per share was subject to a price adjustment based on a weighted average price calculation for the period between the initial purchase date and the settlement date. The company previously reported in its Annual Report on Form 10-K for the year ended December 31, 2004, within Item 7, “Management’s Discussion and Analysis of Financial Condition and Results of Operations” and Item 8, “Financial Statements and Supplementary Data,” that the purchase of the 3 million shares occurred on January 31, 2005, with the immediate reduction of Ball’s outstanding shares. The reduction of shares was reflected in the number of outstanding shares disclosed on the cover page of the Form 10-K. Subsequent to the close of the first quarter, the company, upon further review of the transaction, concluded that the shares purchased under the contract should not reduce the outstanding shares, nor affect earnings per share, until actual delivery of the shares to the company. The company completed its purchase of the 3 million shares at an average price of $41.63 per share and obtained delivery of the shares in early May 2005. On October 26, 2005, the board of directors authorized the repurchase of up to 12 million shares of Ball common stock. This most recent repurchase authorization replaced the previous authorization of up to 12 million shares approved in July 2004, under which approximately 1 million shares remained at October 26, 2005. On July 28, 2004, the company’s board of directors declared a two-for-one split of Ball’s common stock. The stock split was effective August 23, 2004, for all shareholders of record on August 4, 2004. As a result of the stock split, all amounts prior to the split related to earnings, options and outstanding shares have been retroactively restated as if the split had occurred as of January 1, 2003.
Page 67 of 97
Notes to Consolidated Financial Statements Ball Corporation and Subsidiaries 14. Shareholders’ Equity (continued) Under the company's successor Shareholder Rights Plan, one Preferred Stock Purchase Right (Right) is attached to each outstanding share of Ball Corporation common stock. Subject to adjustment, each Right entitles the registered holder to purchase from the company one one-thousandth of a share of Series A Junior Participating Preferred Stock at an exercise price of $130 per Right. If a person or group acquires 15 percent or more of the company's outstanding common stock (or upon occurrence of certain other events), the Rights (other than those held by the acquiring person) become exercisable and generally entitle the holder to purchase shares of Ball Corporation common stock at a 50 percent discount. The Rights, which expire in 2006, are redeemable by the company at a redemption price of one cent per Right and trade with the common stock. Exercise of such Rights would cause substantial dilution to a person or group attempting to acquire control of the company without the approval of Ball's board of directors. The Rights would not interfere with any merger or other business combinations approved by the board of directors. As a result of the company’s stock split, which was distributed on August 23, 2004, the rights attaching to the shares (pursuant to the Rights agreement dated January 24, 1996) automatically split so that one-quarter of a right attached to each share of Ball Corporation common stock outstanding upon the effective date of the stock split. Ball previously split the company’s common stock on February 22, 2002. In connection with the employee stock purchase plan, the company contributes 20 percent of up to $500 of each participating employee’s monthly payroll deduction toward the purchase of Ball Corporation common stock. Company contributions for this plan were $3.2 million in 2005, $2.7 million in 2004 and $2.5 million in 2003. Accumulated Other Comprehensive Earnings (Loss) The activity related to accumulated other comprehensive earnings (loss) was as follows: ($ in millions)
Foreign
Currency Translation
Minimum Pension
Liability, Net of Tax
Effective Financial
Derivatives, Net of Tax
Accumulated Other
Comprehensive Earnings (Loss)
December 31, 2002 $ (22.9) $ (104.9) $ (10.5) $ (138.3) 2003 change 103.6 11.8 21.5 136.9 December 31, 2003 80.7 (93.1) 11.0 (1.4) 2004 change 68.2 (33.2) (0.4) 34.6 December 31, 2004 148.9 (126.3) 10.6 33.2 2005 change (74.3) (43.6) (16.0) (133.9) December 31, 2005 $ 74.6 $ (169.9) $ (5.4) $ (100.7) Notwithstanding the 2005 distribution pursuant to the Jobs Act, management’s intention is to indefinitely reinvest foreign earnings. Therefore, no taxes have been provided on the foreign currency translation component for any period. The change in the minimum pension liability is presented net of related tax benefit of $27.3 million for 2005, related tax benefit of $20.8 million for 2004 and related tax expense of $7.7 million for 2003. Stock Options and Restricted Shares The company has several stock option plans under which options to purchase shares of common stock have been granted to officers and key employees at the market value of the stock at the date of grant. Payment must be made at the time of exercise in cash or with shares of stock owned by the option holder, which are valued at fair market value on the date exercised. Options issued through December 31, 2005, terminate 10 years from date of grant. Commencing one year from date of grant, options vest in four equal annual amounts.

Page 68 of 97
Notes to Consolidated Financial Statements Ball Corporation and Subsidiaries 14. Shareholders’ Equity (continued) On October 26, 2005, Ball’s board of directors approved the acceleration of the out-of-the-money, unvested nonqualified stock options grants in April 2005. The acceleration affects approximately 665,000 options granted to approximately 290 employees at an exercise price of $39.74. The accelerated vesting of these nonqualified options will allow the company to eliminate approximately $5 million of pretax expense (approximately $3 million after tax) over the next four years. Ball adopted a deposit share program in March 2001 that, by matching purchased shares with restricted shares, encourages certain senior management employees and outside directors to invest in Ball stock. In general, restrictions on the matching shares lapse at the end of four years from date of grant, or earlier if established share ownership guidelines are met, assuming the qualifying purchased shares are not sold or transferred prior to that time. This plan is currently accounted for as a variable plan where compensation expense is recorded based upon the current market price of the company’s common stock until restrictions lapse. The company recorded $7.3 million, $17.5 million and $10.5 million of expense in connection with this program in 2005, 2004 and 2003, respectively. The variances in expense recorded are the result of the timing and vesting of the share grants, as well as the higher price of Ball stock. The deposit share program was amended and restated in April 2004 and further awards have been made. Prior to passage of the Sarbanes-Oxley Act of 2002 (the Act), Ball guaranteed loans made by a third party bank to certain participants in the deposit share program, of which $1.6 million remained outstanding at December 31, 2005. In the event of a participant default, Ball would pursue payment from the participant. The Act provides that companies may no longer guarantee such loans for its executive officers. In accordance with the provisions of the Act, the company has not and will not guarantee any additional loans to its executive officers. A summary of stock option activity for the years ended December 31 follows (retroactively restated for the two-for-one stock split): 2005 2004 2003
Number of Shares
Weighted Average Exercise
Price Number of
Shares
Weighted Average Exercise
Price
Number of Shares
Weighted Average Exercise
Price Outstanding, beginning of year 4,832,207 $ 17.84 5,862,006 $ 14.70 6,417,494 $ 12.28 Exercised (654,130) 12.16 (1,441,745) 10.78 (1,163,302) 9.85 Granted 712,250 39.74 518,900 34.06 754,400 27.60 Canceled (78,725) 28.24 (106,954) 19.60 (146,586) 13.77 Outstanding, end of year 4,811,602 21.68 4,832,207 17.84 5,862,006 14.70
Exercisable, end of year 3,846,157 19.67 2,919,057 13.08 3,226,326 10.99 Reserved for future grants 7,051,104 1,568,780 2,341,840
Additional information regarding options outstanding at December 31, 2005, follows:
Exercise Price Range $6.09-$8.98 $10.61-$13.78 $23.75-$28.16 $32.80-$39.74 Total Number of options outstanding 753,028 1,393,683 1,467,716 1,197,175 4,811,602Weighted average exercise price $8.33 $11.45 $25.41 $37.42 $21.68Weighted average remaining life 3.31 years 4.55 years 6.67 years 8.92 years 6.12 years Number of shares exercisable 753,028 1,393,683 911,691 787,755 3,846,157Weighted average exercise price $8.33 $11.45 $25.04 $38.84 $19.67

Page 69 of 97
Notes to Consolidated Financial Statements Ball Corporation and Subsidiaries 14. Shareholders’ Equity (continued) These options cannot be traded in any equity market. However, based on the Black-Scholes option pricing model, adapted for use in valuing compensatory stock options in accordance with SFAS No. 123, options granted in 2005, 2004 and 2003 have estimated weighted average fair values at the date of grant of $11.65 per share, $10.24 per share and $8.63 per share, respectively. The actual value an employee may realize will depend on the excess of the stock price over the exercise price on the date the option is exercised. Consequently, there is no assurance that the value realized by an employee will be at or near the value estimated. The fair values were estimated using the following weighted average assumptions:
2005 Grants 2004 Grants 2003 Grants
Expected dividend yield 1.01% 1.17% 0.84% Expected stock price volatility 30.09% 32.78% 35.38% Risk-free interest rate 3.89% 3.45% 2.87% Expected life of options 4.75 years 4.75 years 4.75 years
Through December 31, 2005, Ball has accounted for its stock-based employee compensation programs using the intrinsic value method prescribed by APB Opinion No. 25, “Accounting for Stock Issued to Employees.” If we had elected to recognize compensation in accordance with SFAS No. 123, pro forma net earnings and earnings per share would have been:
Years ended December 31, ($ in millions, except per share amounts) 2005 2004 2003
Stock-based compensation as reported, net of tax $ 6.6 $ 12.5 $ 7.6 Pro forma effect of fair value based method 2.1 (3.2) 1.2 Pro forma stock-based compensation $ 8.7 $ 9.3 $ 8.8
Net earnings as reported $ 261.5 $ 295.6 $ 229.9 Pro forma effect of fair value based method (2.1) 3.2 (1.2) Pro forma net earnings $ 259.4 $ 298.8 $ 228.7
Basic earnings per share as reported $ 2.43 $ 2.67 $ 2.06(a)Pro forma basic earnings per share 2.41 2.70 2.05(a) Diluted earnings per share as reported $ 2.38 $ 2.60 $ 2.01(a)Pro forma diluted earnings per share 2.36 2.63 2.00(a) (a) Per share amounts have been retroactively restated for the two-for-one stock split effected August 23, 2004. Effective January 1, 2006, Ball adopted SFAS No. 123 (revised 2004), “Share Based Payment,” which is a revision of SFAS No. 123 and supersedes APB Opinion No. 25. The new standard establishes accounting standards for transactions in which an entity exchanges its equity instruments for goods or services, including stock option and restricted stock grants. On March 29, 2005, the Securities and Exchange Commission (SEC) issued Staff Accounting Bulletin (SAB) No. 107, which summarizes the views of the SEC staff regarding the interaction between SFAS No. 123 (revised 2004) and certain SEC rules and regulations and provides the SEC staff’s views regarding the valuation of share-based payment arrangements for public companies. The major differences for Ball in 2006 and future years includes (1) the fact that there will be expense recorded in the consolidated statement of earnings for the fair value of option grants and (2) the deposit share program will no longer be a variable plan that is marked to current market value each month (the original fair value at date of grant will be used to determine the expense). Upon adoption, Ball has chosen to use the modified prospective transition method and, at least initially, the Black-Scholes valuation model.

Page 70 of 97
Notes to Consolidated Financial Statements Ball Corporation and Subsidiaries 15. Earnings Per Share The following table provides additional information on the computation of earnings per share amounts. Share and per share information have been retroactively restated for the two-for-one stock splits discussed in Note 14.
Years ended December 31,
($ in millions, except per share amounts) 2005 2004 2003
Diluted Earnings per Share: Net earnings $ 261.5 $ 295.6 $ 229.9 Weighted average common shares (000s) 107,758 110,846 111,710 Dilutive effect of stock options and restricted shares 1,974 2,944 2,565 Weighted average shares applicable to diluted earnings
per share
109,732
113,790
114,275
Diluted earnings per share $ 2.38 $ 2.60 $ 2.01
Certain options have been excluded from the computation of the diluted earnings per share calculation since they were anti-dilutive (i.e., the exercise price exceeded the average closing market price of common stock for the year). A total of 709,250 options at an exercise price of $39.74 and 639,400 options at an exercise price of $28.155 were excluded for the years ended December 31, 2005 and 2003, respectively. There were no anti-dilutive options for the year ended December 31, 2004. 16. Financial Instruments and Risk Management Policies and Procedures In the ordinary course of business, we employ established risk management policies and procedures to reduce our exposure to commodity price changes, changes in interest rates, fluctuations in foreign currencies and fluctuations in prices of the company’s common stock in regard to common share repurchases. Although the instruments utilized involve varying degrees of credit, market and interest risk, the counterparties are expected to perform fully under the terms of the agreements. Commodity Price Risk We manage our North American commodity price risk in connection with market price fluctuations of aluminum primarily by entering into container sales contracts, which include aluminum-based pricing terms that consider price fluctuations under our commercial supply contracts for aluminum purchases. The terms include a fixed price or an upper limit to the aluminum component pricing. This matched pricing affects most of our North American metal beverage container net sales. We also, at times, use certain derivative instruments such as option and forward contracts as cash flow and fair value hedges of commodity price risk where there is not a pass-through arrangement in the sales contract. North American plastic container sales contracts include provisions to pass through resin cost changes. As a result, we believe we have minimal, if any, exposure related to changes in the cost of plastic resin. Most North American food container sales contracts either include provisions permitting us to pass through some or all steel cost changes we incur or incorporate annually negotiated steel costs. In 2005 and 2004, we were able to pass through to our customers the majority of steel surcharges.

Page 71 of 97
Notes to Consolidated Financial Statements Ball Corporation and Subsidiaries 16. Financial Instruments and Risk Management (continued) In Europe and Asia, the company manages the aluminum and steel raw commodity price risks through annual and long-term contracts for the purchase of the materials, as well as certain sales of containers, that reduce the company’s exposure to fluctuations in commodity prices within the current year. These purchase and sales contracts include fixed price, floating and pass through pricing arrangements. The company additionally uses forward and option contracts as cash flow hedges to manage future aluminum price risk and foreign exchange exposures for those sales contracts where there is not a pass through arrangement to minimize the company’s exposure to significant price changes. At December 31, 2005, the company had aluminum forward contracts with notional amounts of $406.1 million hedging its aluminum exposure. Cash flow and fair value hedges related to forecasted transactions and firm commitments expire within the next three years. Included in shareholders’ equity at December 31, 2005, within accumulated other comprehensive loss, is a net loss of $5.5 million associated with these contracts, of which a net loss of $19.8 million is expected to be recognized in the consolidated statement of earnings during 2006. All of the loss on these derivative contracts will be offset by higher revenue from sales contracts. The consolidated balance sheet at December 31, 2005, includes $36.6 million in prepaid expenses and $72.9 million in other current liabilities related to unrealized gains/losses on unsettled derivative contracts. At December 31, 2004, the company had aluminum forward and option contracts with notional amounts of $303.4 million hedging its aluminum exposure. Interest Rate Risk Our objective in managing our exposure to interest rate changes is to limit the impact of interest rate changes on earnings and cash flows and to lower our overall borrowing costs. To achieve these objectives, we use a variety of interest rate swaps, collars and options to manage our mix of floating and fixed-rate debt. Interest rate instruments held by the company at December 31, 2005, included pay-floating and pay-fixed interest rate swaps. Pay-fixed swaps effectively convert variable rate obligations to fixed rate instruments. Swap agreements expire at various times up to 11 years. At December 31, 2005, the company had outstanding interest rate swap agreements in Europe of €50 million paying fixed rates. Approximately €0.1 million of net loss associated with these contracts is included in accumulated other comprehensive loss at December 31, 2005. The amount expected to be recognized in the consolidated statement of earnings during the next 12 months is insignificant. In conjunction with the debt refinancing and the retirement of the senior notes during the fourth quarter of 2005 (see Note 11), the company recognized approximately $1 million of net gain related to the termination or deselection of hedges that had been included in accumulated other comprehensive loss. At December 31, 2004, the company had interest rate swap agreements with notional amounts of $220 million paying floating rates and $120 million paying fixed rates, or a net floating position of $100 million. In addition, at December 31, 2004, the company had an interest rate cap on Eurolibor interest rates with a notional amount of €50 million, the fair value of which was insignificant. The fair value of all non-derivative financial instruments approximates their carrying amounts with the exception of long-term debt. Rates currently available to the company for loans with similar terms and maturities are used to estimate the fair value of long-term debt based on discounted cash flows. The fair value of derivatives generally reflects the estimated amounts that we would pay or receive upon termination of the contracts at December 31, 2005, taking into account any unrealized gains and losses on open contracts.
2005 2004 Carrying Fair Carrying Fair
($ in millions) Amount Value Amount Value Long-term debt, including current portion $ 1,482.9 $ 1,496.6 $ 1,617.0 $ 1,673.8 Unrealized loss on derivative contracts – (0.1) – –
Page 72 of 97
Notes to Consolidated Financial Statements Ball Corporation and Subsidiaries 16. Financial Instruments and Risk Management (continued) Foreign Currency Exchange Rate Risk Our objective in managing exposure to foreign currency fluctuations is to protect foreign cash flows and earnings associated with foreign currency exchange rate changes through the use of cash flow hedges. In addition, we manage foreign earnings translation volatility through the use of foreign currency options. Our foreign currency translation risk results from the European euro, British pound, Canadian dollar, Polish zloty, Serbian dinar, Brazilian real and Chinese renminbi. We face currency exposures in our global operations as a result of purchasing raw materials in U.S. dollars and, to a lesser extent, in other currencies. Sales contracts are negotiated with customers to reflect cost changes and, where there is not a foreign exchange pass-through arrangement, the company uses forward and option contracts to manage foreign currency exposures. Contracts outstanding at December 31, 2005, expire within the next three years and there are no amounts included in accumulated other comprehensive loss related to these contracts. 17. Quarterly Results of Operations (Unaudited) The company’s fiscal years end on December 31 and the fiscal quarters generally end on the Sunday nearest the calendar quarter end. 2005 Quarterly Information The second quarter of 2005 included a pretax charge of $8.8 million for the closure of a three-piece food can manufacturing plant in Quebec, Canada. The third quarter of 2005 included a pretax charge of $19.3 million related to the commencement of a project to upgrade and streamline its North American beverage can end manufacturing capabilities. Included in the fourth quarter of 2005 was a pretax charge of $4.6 million for costs associated with a reduction in the work force in a metal food container plant in Ontario, Canada, which was partially offset by a $2.2 million gain to adjust the net realizable value of the Quebec plant closed in the second quarter of 2005. Also included in the third and fourth quarters were $1.3 million and $18 million of debt refinancing charges related to the refinancing of Ball’s senior secured credit facilities and redemption of the company’s senior notes due August 2006. Other than these items, fluctuations in sales and earnings for the quarters in 2005 reflected the number of days in each fiscal quarter, as well as the normal seasonality of the business. 2004 Quarterly Information The third and fourth quarters of 2004 included earnings of $6.7 million and $8.5 million, respectively, related to business consolidation activities for which proceeds on assets were higher than originally estimated and costs of completion were less than anticipated. The fourth quarter also included a $15.2 million loss pertaining to an allowance for doubtful accounts related to a minority-owned PRC joint venture. Other than these items, fluctuations in sales and earnings for the quarters in 2004 reflected the number of days in each fiscal quarter, as well as the normal seasonality of the business.

Page 73 of 97
Notes to Consolidated Financial Statements Ball Corporation and Subsidiaries 17. Quarterly Results of Operations (Unaudited) (continued) ($ in millions, except per share amounts)
First Quarter
Second Quarter
Third Quarter
Fourth Quarter
Total
2005
Net sales $ 1,324.1 $ 1,552.0 $ 1,583.9 $ 1,291.2 $ 5,751.2 Gross profit (a) 179.9 202.5 206.5 150.6 739.5 Net earnings $ 58.6 $ 79.0 $ 79.3 $ 44.6 $ 261.5 Basic earnings per share $ 0.52 $ 0.72 $ 0.74 $ 0.43 $ 2.43 Diluted earnings per share $ 0.51 $ 0.71 $ 0.73 $ 0.42 $ 2.38
2004
Net sales $ 1,231.5 $ 1,467.2 $ 1,478.7 $ 1,262.8 $ 5,440.2 Gross profit (a) 171.1 228.2 231.4 185.0 815.7 Net earnings $ 46.8 $ 90.7 $ 101.7 $ 56.4 $ 295.6 Basic earnings per share $ 0.42(b) $ 0.82(b) $ 0.92 $ 0.51 $ 2.67 Diluted earnings per share $ 0.41(b) $ 0.80(b) $ 0.90 $ 0.50 $ 2.60
(a) Gross profit is shown after depreciation and amortization related to cost of sales of $189.3 million and $191 million for the
years ended December 31, 2005 and 2004, respectively. (b) Per share amounts have been retroactively adjusted for the two-for-one stock split discussed in Note 14. Earnings per share calculations for each quarter are based on the weighted average shares outstanding for that period. As a result, the sum of the quarterly amounts may not equal the annual earnings per share amount. 18. Research and Development Research and development costs are expensed as incurred in connection with the company’s internal programs for the development of products and processes. Costs incurred in connection with these programs, the majority of which are included in cost of sales, amounted to $24.6 million, $25.5 million and $20.5 million for the years ended December 31, 2005, 2004 and 2003, respectively. 19. Subsidiary Guarantees of Debt As discussed in Note 11, the company’s notes payable and senior credit facilities are guaranteed on a full, unconditional and joint and several basis by certain of the company’s domestic wholly owned subsidiaries. Certain foreign denominated tranches of the senior credit facilities are similarly guaranteed by certain of the company’s wholly owned foreign subsidiaries. The senior credit facilities are secured by: (1) a pledge of 100 percent of the stock owned by the company in its material direct and indirect majority-owned domestic subsidiaries and (2) a pledge of the company’s stock, owned directly or indirectly, of certain foreign subsidiaries, which equals 65 percent of the stock of each such foreign subsidiary. The following is condensed, consolidating financial information for the company, segregating the guarantor subsidiaries and non-guarantor subsidiaries, as of December 31, 2005 and 2004, and for the years ended December 31, 2005, 2004 and 2003 (in millions of dollars). Separate financial statements for the guarantor subsidiaries and the non-guarantor subsidiaries are not presented because management has determined that such financial statements would not be material to investors.

Page 74 of 97
CONSOLIDATED BALANCE SHEET December 31, 2005 ($ in millions) Ball Guarantor Non-Guarantor Eliminating Consolidated Corporation Subsidiaries Subsidiaries Adjustments Total ASSETS Current assets
Cash and cash equivalents $ 8.0 $ 1.7 $ 51.3 $ – $ 61.0 Receivables, net 0.8 166.0 209.8 – 376.6 Inventories, net − 439.4 230.9 − 670.3 Deferred taxes and prepaid expenses 340.0 193.0 55.6 (470.7) 117.9
Total current assets 348.8 800.1 547.6 (470.7) 1,225.8 Property, plant and equipment, at cost 45.7 2,081.9 1,025.8 – 3,153.4 Accumulated depreciation (17.0) (1,237.0) (342.8) − (1,596.8)
Total property, plant and equipment, net
28.7
844.9
683.0
–
1,556.6
Investment in subsidiaries 1,988.6 453.8 88.4 (2,530.8) – Investment in affiliates 1.4 17.0 47.0 – 65.4 Goodwill, net – 340.8 917.8 − 1,258.6 Intangibles and other assets 118.3 62.3 56.4 − 237.0 $ 2,485.8 $ 2,518.9 $ 2,340.2 $ (3,001.5) $ 4,343.4 LIABILITIES AND
SHAREHOLDERS’ EQUITY
Current liabilities Short-term debt and current portion of
long-term debt $ 29.1 $ 3.3
$ 84.0
$ −
$ 116.4
Accounts payable 59.5 305.3 187.6 – 552.4 Accrued employee costs 15.8 154.7 27.9 − 198.4 Income taxes payable – 507.1 91.1 (470.7) 127.5 Other current liabilities 18.9 111.4 51.0 – 181.3
Total current liabilities 123.3 1,081.8 441.6 (470.7) 1,176.0
Long-term debt 600.2 20.8 852.3 – 1,473.3 Intercompany borrowings 792.9 (110.0) 16.0 (698.9) − Employee benefit obligations 164.7 218.6 400.9 – 784.2 Deferred taxes and other liabilities (30.6) 45.1 55.0 – 69.5
Total liabilities 1,650.5 1,256.3 1,765.8 (1,169.6) 3,503.0 Minority interests − − 5.1 − 5.1 Shareholders’ equity
Convertible preferred stock − − 179.6 (179.6) − Preferred shareholders’ equity − − 179.6 (179.6) −
Common stock 633.6 804.5 487.0 (1,291.5) 633.6 Retained earnings 1,227.9 649.8 (119.1) (530.7) 1,227.9 Accumulated other comprehensive
earnings (loss)
(100.7)
(191.7)
21.8
169.9
(100.7)Treasury stock, at cost (925.5) − − − (925.5)
Common shareholders’ equity 835.3 1,262.6 389.7 (1,652.3) 835.3 Total shareholders’ equity 835.3 1,262.6 569.3 (1,831.9) 835.3
$ 2,485.8 $ 2,518.9 $ 2,340.2 $ (3,001.5) $ 4,343.4
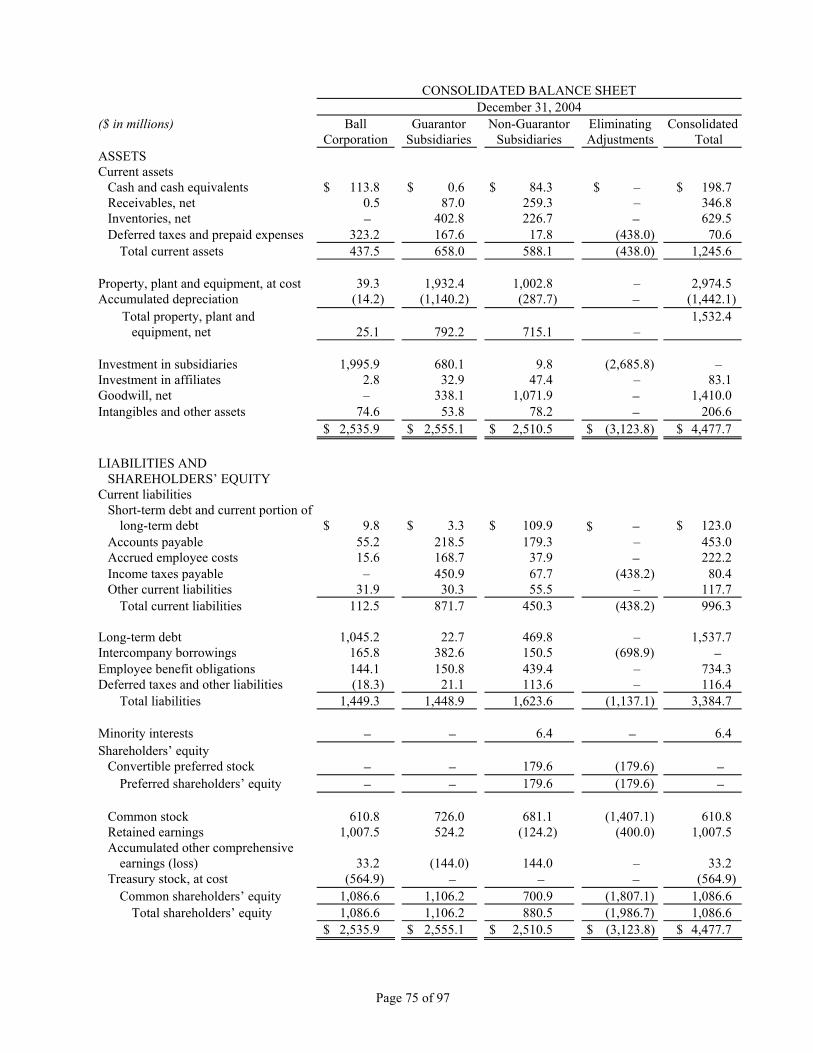
Page 75 of 97
CONSOLIDATED BALANCE SHEET December 31, 2004 ($ in millions) Ball Guarantor Non-Guarantor Eliminating Consolidated Corporation Subsidiaries Subsidiaries Adjustments Total ASSETS Current assets
Cash and cash equivalents $ 113.8 $ 0.6 $ 84.3 $ – $ 198.7 Receivables, net 0.5 87.0 259.3 – 346.8 Inventories, net − 402.8 226.7 − 629.5 Deferred taxes and prepaid expenses 323.2 167.6 17.8 (438.0) 70.6
Total current assets 437.5 658.0 588.1 (438.0) 1,245.6 Property, plant and equipment, at cost 39.3 1,932.4 1,002.8 – 2,974.5 Accumulated depreciation (14.2) (1,140.2) (287.7) − (1,442.1)
Total property, plant and equipment, net
25.1
792.2
715.1
–
1,532.4
Investment in subsidiaries 1,995.9 680.1 9.8 (2,685.8) – Investment in affiliates 2.8 32.9 47.4 – 83.1 Goodwill, net – 338.1 1,071.9 − 1,410.0 Intangibles and other assets 74.6 53.8 78.2 − 206.6 $ 2,535.9 $ 2,555.1 $ 2,510.5 $ (3,123.8) $ 4,477.7 LIABILITIES AND
SHAREHOLDERS’ EQUITY
Current liabilities Short-term debt and current portion of
long-term debt $ 9.8 $ 3.3
$ 109.9
$ −
$ 123.0
Accounts payable 55.2 218.5 179.3 – 453.0 Accrued employee costs 15.6 168.7 37.9 − 222.2 Income taxes payable – 450.9 67.7 (438.2) 80.4 Other current liabilities 31.9 30.3 55.5 – 117.7
Total current liabilities 112.5 871.7 450.3 (438.2) 996.3
Long-term debt 1,045.2 22.7 469.8 – 1,537.7 Intercompany borrowings 165.8 382.6 150.5 (698.9) − Employee benefit obligations 144.1 150.8 439.4 – 734.3 Deferred taxes and other liabilities (18.3) 21.1 113.6 – 116.4
Total liabilities 1,449.3 1,448.9 1,623.6 (1,137.1) 3,384.7 Minority interests − − 6.4 − 6.4 Shareholders’ equity
Convertible preferred stock − − 179.6 (179.6) − Preferred shareholders’ equity − − 179.6 (179.6) −
Common stock 610.8 726.0 681.1 (1,407.1) 610.8 Retained earnings 1,007.5 524.2 (124.2) (400.0) 1,007.5 Accumulated other comprehensive
earnings (loss)
33.2
(144.0)
144.0
–
33.2 Treasury stock, at cost (564.9) − − − (564.9)
Common shareholders’ equity 1,086.6 1,106.2 700.9 (1,807.1) 1,086.6 Total shareholders’ equity 1,086.6 1,106.2 880.5 (1,986.7) 1,086.6
$ 2,535.9 $ 2,555.1 $ 2,510.5 $ (3,123.8) $ 4,477.7

Page 76 of 97
CONSOLIDATED STATEMENT OF EARNINGS For the Year Ended December 31, 2005 Ball Guarantor Non-Guarantor Eliminating Consolidated($ in millions) Corporation Subsidiaries Subsidiaries Adjustments Total Net sales $ − $ 4,396.7 $ 1,582.5 $ (228.0) $ 5,751.2 Costs and expenses
Cost of sales (excluding depreciation and amortization)
–
3,798.6
1,251.8
(228.0)
4,822.4
Depreciation and amortization 3.1 129.2 81.2 – 213.5 Business consolidation costs − 19.3 1.9 – 21.2 Selling, general and administrative 15.5 147.7 68.4 – 231.6 Interest expense 38.5 35.8 42.1 – 116.4 Equity in earnings of subsidiaries (252.4) – – 252.4 – Corporate allocations (74.5) 67.4 7.1 – –
(269.8) 4,198.0 1,452.5 24.4 5,405.1 Earnings (loss) before taxes 269.8 198.7 130.0 (252.4) 346.1 Tax provision (8.3) (75.8) (15.2) – (99.3)Minority interests – – (0.8) – (0.8)Equity in results of affiliates – 2.7 12.8 – 15.5 Net earnings (loss) $ 261.5 $ 125.6 $ 126.8 $ (252.4) $ 261.5
CONSOLIDATED STATEMENT OF EARNINGS For the Year Ended December 31, 2004 Ball Guarantor Non-Guarantor Eliminating Consolidated($ in millions) Corporation Subsidiaries Subsidiaries Adjustments Total Net sales $ − $ 4,192.1 $ 1,512.5 $ (264.4) $ 5,440.2 Costs and expenses
Cost of sales (excluding depreciation and amortization)
–
3,547.4
1,150.5
(264.4)
4,433.5
Depreciation and amortization 2.3 130.6 82.2 – 215.1 Business consolidation gains − (1.5) (13.7) – (15.2)Selling, general and administrative 43.1 154.6 70.2 – 267.9 Interest expense 10.7 51.9 41.1 – 103.7 Equity in earnings of subsidiaries (278.3) – – 278.3 – Corporate allocations (72.4) 65.4 7.0 – –
(294.6) 3,948.4 1,337.3 13.9 5,005.0 Earnings (loss) before taxes 294.6 243.7 175.2 (278.3) 435.2 Tax provision 1.0 (102.5) (37.7) – (139.2)Minority interests – – (1.0) – (1.0)Equity in results of affiliates – 3.9 (3.3) – 0.6 Net earnings (loss) $ 295.6 $ 145.1 $ 133.2 $ (278.3) $ 295.6

Page 77 of 97
CONSOLIDATED STATEMENT OF EARNINGS For the Year Ended December 31, 2003 Ball Guarantor Non-Guarantor Eliminating Consolidated($ in millions) Corporation Subsidiaries Subsidiaries Adjustments Total Net sales $ − $ 3,849.3 $ 1,378.5 $ (250.8) $ 4,977.0 Costs and expenses
Cost of sales (excluding depreciation and amortization)
–
3,272.0
1,059.0
(250.8)
4,080.2
Depreciation and amortization 2.6 131.4 71.5 – 205.5 Business consolidation (gains) costs − 0.1 (3.8) – (3.7)Selling, general and administrative 30.0 129.2 75.0 – 234.2 Interest expense 48.7 47.1 45.3 – 141.1 Equity in earnings of subsidiaries (242.0) – – 242.0 – Corporate allocations (63.1) 57.2 5.9 – –
(223.8) 3,637.0 1,252.9 (8.8) 4,657.3 Earnings (loss) before taxes 223.8 212.3 125.6 (242.0) 319.7 Tax provision 6.1 (75.1) (31.1) – (100.1)Minority interests – – (1.0) – (1.0)Equity in results of affiliates – 1.4 9.9 – 11.3 Net earnings (loss) $ 229.9 $ 138.6 $ 103.4 $ (242.0) $ 229.9

Page 78 of 97
CONSOLIDATED STATEMENT OF CASH FLOWS For the Year Ended December 31, 2005 Ball Guarantor Non-Guarantor Eliminating Consolidated($ in millions) Corporation Subsidiaries Subsidiaries Adjustments Total
Cash flows from operating activities Net earnings (loss) $ 261.5 $ 125.6 $ 126.8 $ (252.4) $ 261.5 Adjustments to reconcile net earnings
to cash provided by operating activities:
Depreciation and amortization 3.1 129.2 81.2 – 213.5 Business consolidation costs (gains) – 19.1 (0.1) – 19.0 Deferred taxes (11.3) (10.7) (36.5) − (58.5)Contributions to defined benefit
pension plans
–
(6.4)
(10.7)
−
(17.1)Equity earnings of subsidiaries (252.4) − – 252.4 – Other, net 30.0 (2.0) 6.8 – 34.8 Working capital changes (40.8) 100.8 45.6 – 105.6
Cash provided by (used in) operating activities
(9.9)
355.6
213.1
−
558.8
Cash flows from investing activities Additions to property, plant and
equipment
(6.4)
(182.9)
(102.4)
–
(291.7)Investments in and advances to
affiliates
734.1
(179.9)
(554.2)
–
− Other, net (9.5) 11.3 (0.1) – 1.7
Cash provided by (used in) investing activities
718.2
(351.5)
(656.7)
–
(290.0)
Cash flows from financing activities Long-term borrowings 60.0 0.4 822.4 – 882.8 Repayments of long-term borrowings (493.0) (3.4) (453.3) – (949.7)Change in short-term borrowings 29.0 – 39.4 – 68.4 Proceeds from issuance of common
stock
35.6
–
–
–
35.6 Acquisitions of treasury stock (393.7) – – – (393.7)Common dividends (42.5) – – – (42.5)Other, net (9.5) – (2.1) – (11.6)
Cash provided by (used in) financing activities
(814.1)
(3.0)
406.4
–
(410.7)
Effect of exchange rate changes on cash – – 4.2 – 4.2 Change in cash and cash equivalents (105.8) 1.1 (33.0) − (137.7)
Cash and cash equivalents − beginning of year
113.8
0.6
84.3
–
198.7
Cash and cash equivalents − end of year
$ 8.0 $ 1.7 $ 51.3 $ −
$ 61.0

Page 79 of 97
CONSOLIDATED STATEMENT OF CASH FLOWS For the Year Ended December 31, 2004 Ball Guarantor Non-Guarantor Eliminating Consolidated($ in millions) Corporation Subsidiaries Subsidiaries Adjustments Total
Cash flows from operating activities Net earnings (loss) $ 295.6 $ 145.1 $ 133.2 $ (278.3) $ 295.6 Adjustments to reconcile net earnings
to cash provided by operating activities:
Depreciation and amortization 2.3 130.6 82.2 – 215.1 Business consolidation gains – (1.5) (13.7) – (15.2)Deferred taxes 16.7 26.9 (0.8) − 42.8 Contributions to defined benefit
pension plans
(21.4)
(21.2)
(18.0)
−
(60.6)Equity earnings of subsidiaries (278.3) − – 278.3 – Other, net 42.9 (7.6) 15.8 – 51.1 Working capital changes (33.4) 152.0 (111.5) – 7.1
Cash provided by operating activities
24.4
424.3
87.2
−
535.9
Cash flows from investing activities Additions to property, plant and
equipment
(7.6)
(111.1)
(77.3)
–
(196.0)Business acquisitions, net of cash
acquired
–
(17.0)
(0.2)
–
(17.2)Investments in and advances to
affiliates
187.8
(296.9)
109.1
–
− Other, net (8.5) 4.8 7.3 – 3.6
Cash provided by (used in) investing activities
171.7
(420.2)
38.9
–
(209.6)
Cash flows from financing activities Long-term borrowings – – 26.3 – 26.3 Repayments of long-term borrowings (1.9) (4.4) (100.9) – (107.2)Change in short-term borrowings − – 2.6 – 2.6 Proceeds from issuance of common
stock
35.3
–
–
–
35.3 Acquisitions of treasury stock (85.3) – – – (85.3)Common dividends (38.9) – – – (38.9)Other, net (0.3) – (0.6) – (0.9)
Cash used in financing activities (91.1) (4.4) (72.6) – (168.1)
Effect of exchange rate changes on cash – – 4.0 – 4.0 Change in cash and cash equivalents 105.0 (0.3) 57.5 − 162.2
Cash and cash equivalents − beginning of year
8.8
0.9
26.8
–
36.5
Cash and cash equivalents − end of year
$ 113.8 $ 0.6 $ 84.3 $ −
$ 198.7

Page 80 of 97
CONSOLIDATED STATEMENT OF CASH FLOWS For the Year Ended December 31, 2003 Ball Guarantor Non-Guarantor Eliminating Consolidated($ in millions Corporation Subsidiaries Subsidiaries Adjustments Total
Cash flows from operating activities Net earnings (loss) $ 229.9 $ 138.6 $ 103.4 $ (242.0) $ 229.9 Adjustments to reconcile net earnings
to cash provided by operating activities:
Depreciation and amortization 2.6 131.4 71.5 – 205.5 Business consolidation gains – – (3.3) – (3.3)Deferred taxes (7.0) 32.6 (7.8) − 17.8 Contributions to defined benefit
pension plans
(5.8)
(20.2)
(8.1)
−
(34.1)Equity earnings of subsidiaries (242.0) − – 242.0 – Other, net 27.8 2.2 7.0 − 37.0 Debt refinancing costs 10.3 – – – 10.3 Withholding tax payment related to
European acquisition
–
–
(138.3)
–
(138.3)Working capital changes
(5.3)
46.2
(1.7)
–
39.2 Cash provided by operating
activities
10.5
330.8
22.7
−
364.0
Cash flows from investing activities Additions to property, plant and
equipment
(5.2)
(108.2)
(23.8)
–
(137.2)Business acquisitions, net of cash
acquired
–
(28.0)
–
–
(28.0)Purchase price adjustments – – 39.8 – 39.8 Investments in and advances to
affiliates
295.0
(199.0)
(96.0)
–
− Other, net (9.6) 5.0 6.2 – 1.6
Cash provided by (used in) investing activities
280.2
(330.2)
(73.8)
–
(123.8)
Cash flows from financing activities Long-term borrowings 4.8 – 0.5 – 5.3 Repayments of long-term borrowings (264.1) – (103.3) – (367.4)Change in short-term borrowings − – (31.6) – (31.6)Debt prepayment costs (10.3) – – – (10.3)Debt issuance costs (5.2) – – – (5.2)Proceeds from issuance of common
stock
35.5
–
–
–
35.5 Acquisitions of treasury stock (63.4) – – – (63.4)Common dividends (26.8) – – – (26.8)
Cash used in financing activities (329.5) – (134.4) – (463.9)
Effect of exchange rate changes on cash – – 1.0 – 1.0 Change in cash and cash equivalents (38.8) 0.6 (184.5) − (222.7)
Cash and cash equivalents − beginning of year
47.6
0.3
211.3
–
259.2
Cash and cash equivalents − end of year
$ 8.8 $ 0.9 $ 26.8 $ −
$ 36.5
Page 81 of 97
Notes to Consolidated Financial Statements Ball Corporation and Subsidiaries 20. Subsequent Event On February 14, 2006, the company entered into a definitive merger agreement in which Ball will acquire U.S. Can Corporation’s (U.S. Can) U.S. and Argentinean operations for 1.1 million shares of Ball common stock and the assumption of $550 million of U.S. Can’s debt. The transaction is expected to close by the end of the first quarter 2006. U.S. Can is the largest manufacturer of aerosol cans in the U.S. and also manufactures paint cans, plastic containers and custom and specialty cans in 10 plants in the U.S. Aerosol cans are also produced in the two manufacturing plants in Argentina. U.S. Can’s U.S. and Argentinean operations had sales of approximately $600 million (unaudited) in 2005. Upon closing the acquisition of U.S. Can, the company intends to refinance $550 million of existing U.S. Can debt at significantly lower interest rates. The refinancing will be completed with Ball’s issuance of a new series of senior notes and an increase in bank debt under the new senior credit facilities put in place in the fourth quarter of 2005. 21. Contingencies The company is subject to various risks and uncertainties in the ordinary course of business due, in part, to the competitive nature of the industries in which we participate, our operations in developing markets, changing commodity prices for the materials used in the manufacture of our products and changing capital markets. Where practicable, we attempt to reduce these risks and uncertainties through the establishment of risk management policies and procedures, including, at times, the use of certain derivative financial instruments. From time to time, the company is subject to routine litigation incident to its business. Additionally, the U.S. Environmental Protection Agency has designated Ball as a potentially responsible party, along with numerous other companies, for the cleanup of several hazardous waste sites. Our information at this time does not indicate that these matters will have a material adverse effect upon the liquidity, results of operations or financial condition of the company. Due to political and legal uncertainties in Germany, no nationwide system for returning beverage containers was in place at the time a mandatory deposit was imposed in January 2003 and nearly all retailers stopped carrying beverages in non-refillable containers. During 2003 and 2004, we responded to the resulting lower demand for beverage cans by reducing production at our German plants, implementing aggressive cost reduction measures and increasing exports from Germany to other countries in the region served by Ball Packaging Europe. We also closed a plant in the United Kingdom, shut down a production line in Germany, delayed capital investment projects in France and Poland and converted one of our steel can production lines in Germany to aluminum in order to facilitate additional can exports from Germany. In 2004 the German parliament adopted a new packaging ordinance, imposing a 25 eurocent deposit on all one-way glass, PET and metal containers for water, beer and carbonated soft drinks. As of May 1, 2006, all retailers must redeem all returned one-way containers as long as they sell such containers. Major retailers in Germany have begun the process of implementing a returnable system for one-way containers since they, along with fillers, now appear to accept the deposit as permanent. The retailers and the filling and packaging industries have formed a committee to design a nationwide recollection system and several retailers have begun to order reverse vending machines in order to meet the May 1, 2006, deadline.

Page 82 of 97
Notes to Consolidated Financial Statements Ball Corporation and Subsidiaries 22. Indemnifications and Guarantees During the normal course of business, the company or the appropriate consolidated direct or indirect subsidiaries have made certain indemnities, commitments and guarantees under which the specified entity may be required to make payments in relation to certain transactions. These indemnities, commitments and guarantees include indemnities to the customers of the subsidiaries in connection with the sales of their packaging and aerospace products and services, guarantees to suppliers of direct or indirect subsidiaries of the company guaranteeing the performance of the respective entity under a purchase agreement, indemnities for liabilities associated with the infringement of third party patents, trademarks or copyrights under various types of agreements, indemnities to various lessors in connection with facility, equipment, furniture, and other personal property leases for certain claims arising from such leases, indemnities pursuant to agreements relating to certain joint ventures, indemnities in connection with the sale of businesses or substantially all of the assets and specified liabilities of businesses, and indemnities to directors, officers and employees of the company to the extent permitted under the laws of the State of Indiana and the United States of America. The duration of these indemnities, commitments and guarantees varies, and in certain cases, is indefinite. In addition, the majority of these indemnities, commitments and guarantees do not provide for any limitation on the maximum potential future payments the company could be obligated to make. As such, the company is unable to reasonably estimate its potential exposure under these items. The company has not recorded any liability for these indemnities, commitments and guarantees in the accompanying consolidated balance sheets. The company does, however, accrue for payments under promissory notes and other evidences of incurred indebtedness and for losses for any known contingent liability, including those that may arise from indemnifications, commitments and guarantees, when future payment is both reasonably determinable and probable. Finally, the company carries specific and general liability insurance policies and has obtained indemnities, commitments and guarantees from third party purchasers, sellers and other contracting parties, which the company believes would, in many circumstances, provide recourse to any claims arising from these indemnifications, commitments and guarantees. The company’s senior notes and senior credit facilities are guaranteed on a full, unconditional and joint and several basis by certain of the company’s wholly owned domestic subsidiaries. Certain foreign denominated tranches of the senior credit facilities are similarly guaranteed by certain of the company’s wholly owned foreign subsidiaries. These guarantees are required in support of the notes and credit facilities referred to above, are co-terminous with the terms of the respective note indentures and credit agreement and would require performance upon certain events of default referred to in the respective guarantees. The maximum potential amounts which could be required to be paid under the guarantees are essentially equal to the then outstanding principal and interest under the respective notes and credit agreement, or under the applicable tranche. The company is not in default under the above notes or credit facilities. Ball Capital Corp. II is a separate, wholly owned corporate entity created for the purchase of receivables from certain of the company’s wholly owned subsidiaries. Ball Capital Corp. II’s assets will be available first and foremost to satisfy the claims of its creditors. The company has provided an undertaking to Ball Capital Corp. II in support of the sale of receivables to a commercial lender or lenders which would require performance upon certain events of default referred to in the undertaking. The maximum potential amount which could be paid is equal to the outstanding amounts due under the accounts receivable financing (see Note 5). The company, the appropriate subsidiaries and Ball Capital Corp. II are not in default under the above credit arrangement. From time to time, the company is subject to claims arising in the ordinary course of business. In the opinion of management, no such matter, individually or in the aggregate, exists which is expected to have a material adverse effect on the company’s consolidated results of operations, financial position or cash flows.

Page 83 of 97
Item 9. Changes in and Disagreements with Accountants on Accounting and Financial Disclosure There were no matters required to be reported under this item. Item 9A. Controls and Procedures Evaluation of Disclosure Controls and Procedures We have established disclosure controls and procedures to ensure that material information relating to the company, including its consolidated subsidiaries, is made known to the officers who certify the company’s financial reports and to other members of senior management and the board of directors. Based on their evaluation as of December 31, 2005, the chief executive officer and chief financial officer of the company have concluded that the company’s disclosure controls and procedures (as defined in Rules 13a-15(e) and 15d-15(e) under the Securities Exchange Act of 1934) are effective to ensure that the information required to be disclosed by the company in the reports that it files or submits under the Securities Exchange Act of 1934 is recorded, processed, summarized and reported within the time periods specified in SEC rules and forms. Management’s Report on Internal Control Over Financial Reporting Our management is responsible for establishing and maintaining adequate internal control over financial reporting, as such term is defined in Exchange Act Rule 13a-15(f). Under the supervision and with the participation of our management, including our chief executive officer and chief financial officer, we conducted an evaluation of the effectiveness of our internal control over financial reporting based on the framework in “Internal Control – Integrated Framework” issued by the Committee of Sponsoring Organizations of the Treadway Commission. Based on our evaluation under the framework in “Internal Control – Integrated Framework,” our management concluded that our internal control over financial reporting was effective as of December 31, 2005. Our management’s assessment of the effectiveness of our internal control over financial reporting as of December 31, 2005, has been audited by PricewaterhouseCoopers LLP, an independent registered public accounting firm, as stated in their report which is included in Item 8, “Financial Statements and Supplementary Data.” Changes in Internal Control The company is in the process of migrating the North American metal beverage manufacturing and inventory system from a legacy system to a fully integrated business system (the new system). To date, we have converted four metal beverage plants to the new system and the migrations will continue into 2006 and 2007. The migration involved changes in systems that included internal controls. We have reviewed the new system and the controls affected by the implementation of the new system and made appropriate changes to affected internal controls. The controls as modified are appropriate and operating effectively. There were no other changes in our internal control over financial reporting during the year ended December 31, 2005, that have materially affected, or are reasonably likely to materially affect, our internal control over financial reporting. Item 9B. Other Information There were no matters required to be reported under this item.

Page 84 of 97
Part III
Item 10. Directors and Executive Officers of the Registrant The executive officers of the company as of December 31, 2005, were as follows: 1. R. David Hoover, 60, Chairman, President and Chief Executive Officer since April 2002 and a director since 1996.
Mr. Hoover was President and Chief Executive Officer from January 2001 until April 2002 and Vice Chairman, President and Chief Operating Officer from April 2000 to January 2001; Vice Chairman, President and Chief Financial Officer from January 2000 to April 2000; Vice Chairman and Chief Financial Officer, 1998-2000; Executive Vice President and Chief Financial Officer, 1997-1998; Executive Vice President, Chief Financial Officer and Treasurer, 1996-1997; Executive Vice President and Chief Financial Officer, 1995-1996; Senior Vice President and Chief Financial Officer, 1992-1995; Vice President and Treasurer, 1988-1992; Assistant Treasurer, 1987-1988; Vice President, Finance and Administration, Technical Products, 1985-1987; Vice President, Finance and Administration, Management Services Division, 1983-1985.
2. Raymond J. Seabrook, 54, Senior Vice President and Chief Financial Officer since April 2000; Senior Vice President,
Finance, April 1998 to April 2000; Vice President, Planning and Control, 1996-1998; Vice President and Treasurer, 1992-1996; Senior Vice President and Chief Financial Officer, Ball Packaging Products Canada, Inc., 1988-1992.
3. John R. Friedery, 49, Senior Vice President and Chief Operating Officer, North American Packaging, since
January 2004; President, Metal Beverage Container, 2000 to January 2004; Senior Vice President, Manufacturing, 1998-2000; Vice President, Manufacturing, 1996-1998; Plant Manager, 1993-1996; Assistant Plant Manager, 1992-1993; Administrative Manager, 1991-1992; General Supervisor, 1989-1991; Production Supervisor, 1988-1989.
4. Hanno C. Fiedler, 60, Director since December 2002; Executive Vice President, Ball Corporation and Chairman and
Chief Executive Officer of Ball’s European packaging business, December 2002 to December 2005. Mr. Fiedler was Chairman of the Board of Management of Schmalbach-Lubeca AG from January 1996 until December 2002 and, prior to that, headed the European activities of TRW Inc. Steering and Suspension Systems.
5. John A. Hayes, 40, Vice President, Ball Corporation, and Executive Vice President of Ball’s European packaging
business since July 2005; Vice President, Corporate Strategy, Marketing and Development, January 2003 to July 2005; Vice President, Corporate Planning and Development, April 2000 to January 2003; Senior Director, Corporate Planning and Development, February 1999 to April 2000; Vice President, Mergers and Acquisitions/Corporate Finance, Lehman Brothers, Chicago, Illinois, April 1993 to February 1999.
6. Charles E. Baker, 48, Vice President, General Counsel and Assistant Corporate Secretary since April 2004; Associate
General Counsel, 1999 to April 2004; Senior Director, Business Development, 1995-1999; Director, Corporate Compliance, 1994-1997; Director, Business Development, 1993-1995.
7. Harold L. Sohn, 59, Vice President, Corporate Relations, since March 1993; Director, Industry Affairs, Packaging
Products, 1988-1993. 8. David A. Westerlund, 55, Senior Vice President, Administration, since April 1998 and Corporate Secretary since
December 2002; Vice President, Administration, 1997-1998; Vice President, Human Resources, 1994-1997; Senior Director, Corporate Human Resources, July 1994-December 1994; Vice President, Human Resources and Administration, Ball Glass Container Corporation, 1988-1994; Vice President, Human Resources, Ball-InCon Glass Packaging Corp., 1987-1988.
9. Scott C. Morrison, 43, Vice President and Treasurer since April 2002; Treasurer, September 2000 to April 2002;
Managing Director/Senior Banker of Corporate Banking, Bank One, Indianapolis, Indiana, 1995 to August 2000. 10. Douglas K. Bradford, 48, Vice President and Controller since April 2003; Controller since April 2002; Assistant
Controller, May 1998 to April 2002; Senior Director, Tax Administration, January 1995 to May 1998; Director, Tax Administration, July 1989 to January 1995.

Page 85 of 97
Other information required by Item 10 appearing under the caption "Director Nominees and Continuing Directors" and "Section 16(a) Beneficial Ownership Reporting Compliance," of the company’s proxy statement to be filed pursuant to Regulation 14A within 120 days after December 31, 2005, is incorporated herein by reference. Item 11. Executive Compensation The following table sets forth information concerning the annual and long-term compensation for services in all capacities to the corporation of the chief executive officer and of the next four most highly compensated executive officers of the Corporation (Named Executive Officers) in office on December 31, 2005:
SUMMARY COMPENSATION TABLE Long-Term Compensation Annual Compensation Awards Payouts Restricted Securities
Name and Principal Other Annual Stock Underlying LTIP (3) All Other Position Year Salary Bonus (1) Compensation Awards (2) Options Payouts Compensation (4) (5)
R. David Hoover 2005 $900,000 $ 1,002,181 $ 1,660,950 $ 1,698,969 $ 135,659 Chairman, President and 2004 $820,000 $ 1,755,809 $ 2,912,280 $ 1,604,980 $ 117,306 Chief Executive Officer 2003 $792,105 $ 1,469,701 $ 1,126,200 $ 1,436,256 $ 113,773 Hanno C. Fiedler (6) 2005 €500,000 € 289,394 $ 924,840 € 692,863 € 960 Executive Vice President 2004 €450,000 € 579,482 € 568,294 € 960 Ball Corporation and 2003 €400,000 € 529,013 $ 1,040,800 € 403,754 Chairman and Chief Executive Officer, Ball Packaging Europe John R. Friedery 2005 $390,000 $ 332,945 $ 432,120 $ 354,298 $ 39,980 Senior Vice President, 2004 $375,000 $ 521,007 $ 696,825 $ 417,611 $ 38,676 Ball Corporation and Chief Operating Officer, North American Packaging Raymond J. Seabrook 2005 $358,500 $ 281,606 $ 387,555 $ 440,424 $ 65,511 Senior Vice President and 2004 $342,500 $ 514,211 $ 620,920 $ 437,791 $ 61,686 Chief Financial Officer 2003 $327,500 $ 439,952 $98,869 $ 225,240 $ 409,866 $ 59,900 David A. Westerlund 2005 $320,000 $ 250,785 $ 387,555 $ 389,889 $ 64,499 Senior Vice President, 2004 $305,000 $ 457,075 $ 620,920 $ 383,769 $ 60,769 Administration, and Corporate 2003 $290,000 $ 359,488 $ 225,240 $ 354,986 $ 57,701 Secretary (1) As noted in the Report of the Human Resources Committee, Ball Corporation uses the term Incentive Compensation rather than Bonus. Also noted in
the Report of the Human Resources Committee is the performance level of the corporation and each of the operating units in relation to incentive targets and the resulting impact on the “Bonus” amounts shown above.
(2) In 2005 “Restricted Stock Awards” for all Named Executive Officers except Mr. Fiedler were awarded pursuant to the Deposit Share Program. Mr. Fiedler was awarded pursuant to the 2005 Stock and Cash Incentive Program.
Mr. Hoover held restricted shares valued at $7,189,320 as of December 31, 2005. Restrictions will lapse on 67,200 shares in 2006, 48,700 shares in 2007 and 47,100 shares in 2008. Dividend equivalents are paid on these shares.
Mr. Fiedler held restricted shares valued at $2,462,640 as of December 31, 2005. Restrictions will lapse on 40,750 shares in 2006, 6,450 shares in 2007 and 6,450 shares in 2008.
Mr. Friedery held restricted shares valued at $2,073,384 as of December 31, 2005. Restrictions will lapse on 20,900 shares in 2006, 13,300 shares in 2007 and 13,200 shares in 2008. Dividend equivalents are paid on these shares.
Mr. Seabrook held restricted shares valued at $1,330,620 as of December 31, 2005. Restrictions will lapse on 7,700 shares in 2006, 10,850 shares in 2007 and 10,750 shares in 2008. Dividend equivalents are paid on these shares.
Mr. Westerlund held restricted shares valued at $1,866,840 as of December 31, 2005. Restrictions will lapse on 21,200 shares in 2006, 10,850 shares in 2007 and 10,750 shares in 2008. Dividend equivalents are paid on these shares.
(3) In 2005 the amounts shown in “LTIP Payouts” consist of the following: Mr. Hoover—LTCIP $1,316,198; Acquisition-Related, Special Incentive Plan $382,771. Mr. Fiedler—LTCIP €371,250; Acquisition-Related, Special Incentive Plan €321,613. Mr. Friedery—LTCIP $276,312; Acquisition-Related, Special Incentive Plan $77,986. Mr. Seabrook—LTCIP $288,263; Acquisition-Related, Special Incentive Plan $152,161. Mr. Westerlund—LTCIP $254,015; Acquisition-Related, Special Incentive Plan $135,874. (4) Compensation deferred prior to 2001 under predecessor deferred compensation plans accrues interest at rates ranging from Moody’s Corporate Bond
rate to Moody’s plus 5%. Above market interest is shown for each individual in the “All Other Compensation” column. (5) The amounts shown in the “All Other Compensation” column for 2005 consist of the following: Mr. Hoover—above-market interest on deferred compensation account, $101,942; company contribution to 401(k) Plan, $6,300; company
contribution to Employee Stock Purchase Plan, $1,200; executive disability premiums, $2,633; company match pursuant to 2005 Deferred Compensation Company Stock Plan, $20,000; personal use of company airplane, $3,584.
Mr. Fiedler—company contribution to Employee Stock Purchase Plan €960. Mr. Friedery—above-market interest on deferred compensation account, $11,015; company contribution to 401(k) Plan, $6,300; company contribution to
Employee Stock Purchase Plan, $1,200; executive disability premiums, $1,465; company match pursuant to 2005 Deferred Compensation Company Stock Plan, $20,000.

Page 86 of 97
Mr. Seabrook—above-market interest on deferred compensation account, $36,222; company contribution to 401(k) Plan, $6,300; company contribution to Employee Stock Purchase Plan, $1,200; executive disability premiums, $1,789; company match pursuant to 2005 Deferred Compensation Company Stock Plan, $20,000.
Mr. Westerlund—above-market interest on deferred compensation account, $35,294; company contribution to 401(k) Plan, $6,300; company contribution to Employee Stock Purchase Plan, $1,200; executive disability premiums, $1,705; company match pursuant to 2005 Deferred Compensation Company Stock Plan, $20,000.
(6) Mr. Fiedler is paid in euros, except stock awards which are U.S. dollar denominated. On December 31, 2005, the exchange rate was 1 euro = 1.184 U.S. dollars.
Long-Term Incentive Compensation Stock Option Grants and Exercises The following tables present certain information for the Named Executive Officers relating to stock option grants and exercises during 2005 and, in addition, information relating to the valuation of unexercised stock options:
STOCK OPTION GRANTS IN 2005
Percentage of Total Options Granted to Options Employees In Exercise Price Expiration Grant Date Name Granted (1) Fiscal 2005 (per share) Date Present Value (2) R. David Hoover 82,000 11.51% 39.74 April 27, 2015 $955,300 Hanno C. Fiedler 0 — N/A N/A N/A John R. Friedery 22,000 3.09% 39.74 April 27, 2015 $256,300 Raymond J. Seabrook 19,500 2.74% 39.74 April 27, 2015 $227,175 David A. Westerlund 19,500 2.74% 39.74 April 27, 2015 $227,175 (1) Stock options were granted on April 27, 2005, and were exercisable beginning one year after the grant and each year thereafter in 25 percent
increments. Effective October 26, 2005, the options became fully exercisable as a result of an acceleration of vesting. (2) Stock options with an expiration date of April 27, 2015, have an estimated value, at date of grant, of $11.65 per share based on the Black-
Scholes option-pricing model adapted for use in valuing employee stock options. The estimated values under the Black-Scholes model are based on weighted average assumptions of volatility of 30.09 percent, a risk-free rate of return of 3.89 percent, a dividend yield of 1.01 percent, an expected option term of 4.75 years, and no adjustment for the risk of forfeiture. The actual value, if any, an executive may realize will depend on the excess of the stock price over the exercise price on the date the option is exercised. Consequently, there is no assurance the value realized by an executive will be at or near the value estimated by the Black-Scholes model.
AGGREGATED STOCK OPTION EXERCISES IN 2005 AND FISCAL YEAR-END OPTION VALUES
Number of Unexercised Value of Unexercised Shares Options Held at In-the-Money Options at Acquired Value December 31, 2005 December 31, 2005 (1)
Name on Exercise Realized Exercisable Unexercisable Exercisable Unexercisable R. David Hoover 102,560 $ 3,025,310 677,944 75,000 $ 15,181,469 $ 1,065,824 Hanno C. Fiedler — — 10,000 10,000 $ 154,200 $ 154,200 John R. Friedery 28,656 $ 747,277 68,344 17,000 $ 841,365 $ 236,295 Raymond J. Seabrook 16,000 $ 490,483 220,772 18,000 $ 5,617,957 $ 252,270 David A. Westerlund 18,000 $ 598,560 249,500 18,000 $ 6,388,382 $ 252,270 (1) Based on the closing price on the New York Stock Exchange—Composite Transactions of the corporation’s common stock on
December 31, 2005, of $39.72.

Page 87 of 97
Long-Term Cash Incentive The following tables present information for the Named Executive Officers concerning the long-term cash incentive programs and, in addition, information relating to the estimated future payouts.
LONG-TERM CASH INCENTIVE PLAN—AWARDS IN LAST FISCAL YEAR
Number of Performance Period Estimated Future Payouts (2) Name Units (1) Until Maturation Threshold Target Maximum R. David Hoover 0 1/1/04–12/31/06 $ 361,629 $ 723,258 $ 1,446,517 Hanno C. Fiedler (3) 0 1/1/04–12/31/06 € 62,700 € 130,625 € 261,250 John R. Friedery 0 1/1/04–12/31/06 $ 76,778 $ 159,954 $ 319,908 Raymond J. Seabrook 0 1/1/04–12/31/06 $ 73,542 $ 153,213 $ 306,425 David A. Westerlund 0 1/1/04–12/31/06 $ 65,758 $ 136,997 $ 273,994 (1) Participants are not awarded a number of units. Awards are expressed as a percentage of average annual salary and “bonus” at target during
the performance period. However, Named Executive Officers whose Ball Corporation stock holdings are below the established guidelines will receive up to one-half of their award in Ball Corporation Restricted Stock.
(2) Estimated future payouts (“earned awards”) are based on Ball Corporation’s total shareholder return performance; i.e., stock price
appreciation plus dividends, over three-year performance cycles which begin at the start of each calendar year, relative to the total shareholder return of companies listed on the S&P Global Industry Classification Standard (“GICS”) which has replaced the S&P Industrials index.
(3) Mr. Fiedler retired at the end of 2005. Estimated future payouts for the performance period are prorated based on his service through 2005. Retirement Plans The following table, for purposes of illustration, indicates the amounts of annual retirement income which would be payable in 2006 to the Named Executive Officers, except Mr. Fiedler, at normal retirement age 65. The calculation of retirement benefits under the plans generally is based upon average earnings (base salary only) for the highest five consecutive years of the ten years preceding retirement.
PENSION PLAN TABLE
Years of Service Average Annual Earnings 15 20 25 30 35 $ 250,000 $ 52,598 $ 70,130 $ 87,663 $ 105,196 $122,728 300,000 63,848 85,130 106,413 127,696 148,978 350,000 75,098 100,130 125,163 150,196 175,228 400,000 86,348 115,130 143,913 172,696 201,478 450,000 97,598 130,130 162,663 195,196 227,728 500,000 108,848 145,130 181,413 217,696 253,978 550,000 120,098 160,130 200,163 240,196 280,228 600,000 131,348 175,130 218,913 262,696 306,478 650,000 142,598 190,130 237,663 285,196 332,728 700,000 153,848 205,130 256,413 307,696 358,978 750,000 165,098 220,130 275,163 330,196 385,228 800,000 176,348 235,130 293,913 352,696 411,478 The corporation’s qualified United States salaried retirement plans provide defined benefits determined by base salary and years of service. The corporation has also adopted a nonqualified Supplemental Executive Retirement Plan that provides benefits otherwise not payable under the qualified pension plan to the extent that the Internal Revenue Code of 1986, as amended (the “Code”), limits the pension to which an executive would be entitled under the qualified pension plan. The benefit amounts shown in the preceding table reflect the amount payable as a straight life annuity and include amounts payable under the Supplemental Executive Retirement Plan. On November 30, 2003, the corporation terminated the Split-Dollar Life Insurance Plan that provided a portion of the nonqualified pension benefit. Mr. Seabrook elected a cash distribution from this plan that will reduce his retirement benefit.

Page 88 of 97
Average annual earnings used under the pension formula to calculate benefits together with years of benefit service, as of December 31, 2005, for the Named Executive Officers are: R. David Hoover, $777,421 (35.54 years); John R. Friedery, $312,500 (17.33 years); Raymond J. Seabrook, $327,200 (13.21 years); and David A. Westerlund, $289,800 (30.32 years) offset by benefits received from a prior employer. Mr. Fiedler’s retirement income benefits are provided by a pension agreement that is part of his employment agreement. The agreement provides a benefit of 60 percent of his last gross base salary provided he is employed on the earlier of December 31, 2005, or reaches age 60 and retires in good standing from the corporation. Mr. Fiedler retired as an employee of the corporation at the end of 2005 and his retirement benefit is €300,000 per year based on his 2005 salary of €500,000. Termination of Employment and Change-in-Control Arrangements The corporation maintains revocable, funded grantor trusts, which, in the event a change in control of the corporation occurs, would become irrevocable with funds thereunder to be available to apply to the corporation’s obligations under its deferred compensation plans covering key employees, including the Named Executive Officers, except Mr. Fiedler. Under the trusts, a “change in control” can occur by virtue, in general terms, of an acquisition by any person of 40 percent or more of the corporation’s voting shares; a merger in which shareholders of the corporation before the merger own less than 60 percent of the corporation’s common stock after the merger; shareholder approval of a plan to sell or dispose of substantially all of the assets of the corporation; a change of a majority of the corporation’s board within a 12-month period unless approved by two-thirds of the directors in office at the beginning of such period; a threatened change in control deemed to exist if there is an agreement which would result in a change in control or public announcement of intentions to cause a change in control; and by the adoption by the board of a resolution to the effect that a change or threatened change in control has occurred for purposes of the trusts. For amounts deferred on or after January 1, 2005, the definition of “change in control” has the meaning set forth in Section 409A of the Code, or any Treasury Department regulations or guidance. The trusts were funded as of December 31, 2005, with approximately $57.0 million of net equity of corporate-owned life insurance policies on the lives of various employees, including participants in the plans, and 1,037,890 shares of the corporation’s common stock and cash equivalents valued at $41.3 million ($39.72 per share) at the close of business on December 31, 2005, to support approximately $171.6 million of current deferred compensation account balances of the beneficiaries of the trusts in the event of a change in control. The corporation has borrowing capacity to fully fund the trusts in advance of a change in control and is required to do so prior to a change in control. If the funds set aside in the trusts would be insufficient to pay amounts due the beneficiaries, then the corporation would remain obligated to pay those amounts. In the event of the insolvency of the corporation, the funds in the trusts would be available to satisfy the claims of the creditors of the corporation. The trusts were not established in response to any effort to acquire control of the corporation, and the board is not aware of any such effort. The corporation intends to establish separate revocable, funded grantor trusts in 2006 which adopt the definition of “change in control” as set forth in the Treasury Department’s guidance and any regulations issued under Section 409A of the Code. The corporation has change-in-control severance agreements with certain key employees, including the Named Executive Officers, except Mr. Fiedler. The agreements are effective on a year-to-year basis and would provide severance benefits in the event of both a change in control of the corporation and an actual or constructive termination of employment within two years after a change in control. Under the agreements, a “change in control” can occur by virtue, in general terms, of an acquisition by any person of 30 percent or more of the corporation’s voting shares; a merger in which the shareholders of the corporation before the merger own 50 percent or less of the corporation’s voting shares after the merger; shareholder approval of a plan of liquidation or a plan to sell or dispose of substantially all of the assets of the corporation; and if, during any two-year period, directors at the beginning of the period fail to constitute a majority of the board. “Actual termination” is any termination other than by death or disability, by the corporation for cause, or by the executive, other than for constructive termination. “Constructive termination” means, in general terms, any significant reduction in duties, compensation or benefits or change of office location from those in effect immediately prior to the change in control, unless agreed to by the executive. The severance benefits payable, in addition to base salary and incentive compensation accrued through

Page 89 of 97
the date of termination, shall include two times current annual base salary and target incentive compensation; the bargain element value of then-outstanding stock options; the present value of the amount by which pension payments would have been larger had the executive accumulated two additional years of benefit service; two years of life, disability, accident and health benefits; outplacement services; and legal fees and expenses reasonably incurred in enforcing the agreements. In the event such benefits, together with other benefits paid because of a change in control, would be subject to the excise tax imposed under Section 280G of the Code, the corporation would reimburse the executive for such excise taxes paid, together with taxes incurred as a result of such reimbursement. The agreements were not entered into in response to any effort to acquire control of the corporation, and the board is not aware of any such effort. The corporation has severance benefit agreements with certain key employees, including the Named Executive Officers, except Mr. Fiedler. The agreements provide severance benefits in the event of an actual or constructive termination of employment. “Actual termination” is any termination other than by death or disability, by the corporation for cause, or by the executive, other than for constructive termination. “Constructive termination” means, in general terms, any significant reduction in compensation or benefits, unless agreed to by the executive. The severance benefits payable, in addition to base salary and incentive compensation accrued through the date of termination, include two times current annual salary and target incentive compensation for Mr. Hoover and one and one-half times current annual salary and target incentive compensation for Messrs. Friedery, Seabrook and Westerlund; the present value of the amount by which pension payments would have been larger had the executive accumulated two additional years of benefit service for Mr. Hoover and one and one-half years of benefit service for Messrs. Friedery, Seabrook and Westerlund; two years of life, disability, accident and health benefits for Mr. Hoover and one and one-half years of life, disability, accident and health benefits for Messrs. Friedery, Seabrook and Westerlund; outplacement services; and legal fees and expenses reasonably incurred in enforcing the agreements. Upon the occurrence of a change in control as defined in the change-in-control severance agreements, the executive is entitled to the greater of each of the benefits provided in this agreement and each of the benefits provided in the change-in-control severance agreement, including reimbursement for excise taxes which may be incurred as a result of such payments. The corporation entered into an employment agreement with Mr. Fiedler negotiated in connection with the acquisition of Schmalbach-Lubeca AG and effective from December 19, 2002, through December 31, 2005. That agreement has expired and Mr. Fiedler retired as an employee of the corporation at the end of 2005. Directors’ Compensation Directors who are not employees of the corporation receive as compensation a total target annual retainer composed of a $30,000 annual fixed retainer, plus an annual incentive retainer based upon the corporation’s actual operating performance for each fiscal (calendar) year. The annual incentive retainer is calculated in accordance with the corporation’s performance-based incentive compensation plan at a rate of 50 percent of the director’s annual fixed retainer. Both annual retainers are paid 50 percent in cash and 50 percent in restricted stock. The restrictions on the stock will lapse upon the director ceasing to serve as a director for any reason other than voluntary resignation, in which case the restrictions will not lapse and the director will forfeit the shares. For federal income tax purposes, the value of the shares will be taxable to the recipient as compensation income in an amount equal to the fair market value of the corporation’s common stock on the date the restrictions lapse. There has been no retirement plan for directors since 1997. Nonemployee directors also receive a fee of $1,500 for attending each board meeting, a fee of $1,250 for attending one or more committee meetings held on any one day and a fee of $1,250 per quarter for serving as a chair of a board committee and a per diem allowance of $750 for special assignments. Directors who are also employees of the corporation receive no additional compensation for their service on the board or on any board committee. Nonemployee directors may elect to defer the payment of a portion or all of their directors’ fees or retainers into the 2005 Deferred Compensation Plan for Directors or a portion or all of their directors’ annual incentive retainer into the 2005 Deferred Compensation Company Stock Plan. These plans replace the directors’ prior deferred compensation plans for fees and retainers earned prior to 2005. Amounts deferred or transferred into the 2005 Deferred Compensation Company Stock Plan receive a 20 percent company match with a maximum match of $20,000 per year. Amounts deferred, transferred or credited to this Plan will be represented in the participant’s account as stock units, with each unit having the value equivalent to one share of Ball Corporation common stock. All distributions of accounts will be made in the form of Ball common stock following termination of each director’s service. Amounts deferred to the 2005

Page 90 of 97
Deferred Compensation Plan for Directors are “invested” among various investment funds available under the Plan. A participant’s amounts are not actually invested in the investment funds for the account, but the return on a participant’s account is determined as if the amounts were notionally invested in those funds. Each nonemployee director will receive a 4,000-share restricted stock award upon reelection for a three-year term. Each newly eligible nonemployee director will receive a 4,000-share restricted stock award upon election or appointment for an initial term (except initial terms of less than one year), and upon reelection for a three-year term. The restrictions against disposal of the stock will lapse upon the termination of the director’s service to the corporation as a director, for whatever reason other than voluntary resignation during a term, in which case the restrictions will not lapse and the director will forfeit the shares. For federal income tax purposes, the value of the stock will be taxable to the director as compensation income in an amount equal to the fair market value of the common stock on the date the restrictions lapse. Messrs. Smart, Solso and Taylor each received a 4,000-share restricted stock award upon reelection as directors on April 27, 2005, under the terms of the 2005 Stock and Cash Incentive Plan. The corporation has established a 10,000 share stock ownership guideline for each non-management director. In 2001 the corporation implemented a Deposit Share Program for its nonemployee directors. The program is intended to increase share ownership by directors who must make additional investments in the corporation’s common stock to participate in the program. Under this program, each director receives one share of restricted stock for every share acquired by the director. Restricted stock is granted pursuant to the shareholder approved Ball Corporation 2005 Stock and Cash Incentive Plan or its successor. Under the terms of the Deposit Share Program for Directors, which was amended and restated in April 2004, future awards have share acquisition periods and restricted stock lapse provisions established at the time of the award. On January 26, 2005, Mr. Smart was granted the opportunity to participate in the program up to a maximum of 6,000 shares that must be acquired during a two-year period beginning on the grant date. No other deposit share grants were made to nonemployee directors pursuant to the Amended and Restated Deposit Share Program during 2005. Other information required by Item 11 appearing under the caption "Executive Compensation" in the company’s proxy statement, to be filed pursuant to Regulation 14A within 120 days after December 31, 2005, is incorporated herein by reference. Item 12. Security Ownership of Certain Beneficial Owners and Management The information required by Item 12 appearing under the caption "Voting Securities and Principal Shareholders," in the company’s proxy statement to be filed pursuant to Regulation 14A within 120 days after December 31, 2005, is incorporated herein by reference. Securities authorized for issuance under equity compensation plans are summarized below:
Equity Compensation Plan Information Plan category
Number of Securities to be Issued Upon Exercise of Outstanding Options,
Warrants and Rights (a)
Weighted-average Exercise Price of
Outstanding Options, Warrants and Rights
(b)
Number of Securities Remaining Available for Future Issuance Under Equity Compensation
Plans (Excluding Securities Reflected in Column (a))
(c) Equity compensation plans
approved by security holders
4,811,602
$ 21.68
7,051,104 Equity compensation plans not
approved by security holders –
–
–
Total 4,811,602 $ 21.68 7,051,104

Page 91 of 97
Item 13. Certain Relationships and Related Transactions The information required by Item 13 appearing under the caption "Ratification of the Appointment of Independent Registered Public Accounting Firm," in the company’s proxy statement to be filed pursuant to Regulation 14A within 120 days after December 31, 2005, is incorporated herein by reference. Item 14. Principal Accountant Fees and Services The information required by Item 14 appearing under the caption "Certain Committees of the Board," in the company’s proxy statement to be filed pursuant to Regulation 14A within 120 days after December 31, 2005, is incorporated herein by reference.
Part IV
Item 15. Exhibits, Financial Statement Schedules
(a) (1) Financial Statements:
The following documents are included in Part II, Item 8:
Report of independent registered public accounting firm
Consolidated statements of earnings – Years ended December 31, 2005, 2004 and 2003
Consolidated balance sheets – December 31, 2005 and 2004
Consolidated statements of cash flows – Years ended December 31, 2005, 2004 and 2003
Consolidated statements of shareholders’ equity and comprehensive earnings – Years ended December 31, 2005, 2004 and 2003
Notes to consolidated financial statements
(2) Financial Statement Schedules:
Financial statement schedules have been omitted as they are either not applicable, are considered insignificant or the required information is included in the consolidated financial statements or notes thereto.
(3) Exhibits:
See the Index to Exhibits which appears at the end of this document and which is incorporated by reference herein.

Page 92 of 97
SIGNATURES
Pursuant to the requirements of Section 13 or 15(d) of the Securities Exchange Act of 1934, the registrant has duly caused this report to be signed on its behalf by the undersigned, thereunto duly authorized.
BALL CORPORATION (Registrant) By: /s/ R. David Hoover R. David Hoover Chairman, President and Chief Executive Officer February 22, 2006
Pursuant to the requirements of the Securities Exchange Act of 1934, this report has been signed below by the following persons on behalf of the registrant and in the capacities and on the dates indicated.
(1) Principal Executive Officer:
/s/ R. David Hoover
Chairman, President and Chief Executive Officer
R. David Hoover February 22, 2006 (2) Principal Financial Accounting Officer:
/s/ Raymond J. Seabrook
Sr. Vice President and Chief Financial Officer
Raymond J. Seabrook February 22, 2006 (3) Controller:
/s/ Douglas K. Bradford
Vice President and Controller
Douglas K. Bradford February 22, 2006 (4) A Majority of the Board of Directors:
/s/ Howard M. Dean * Director Howard M. Dean February 22, 2006 /s/ Hanno C. Fiedler * Director Hanno C. Fiedler February 22, 2006 /s/ R. David Hoover * Chairman of the Board and Director R. David Hoover February 22, 2006 /s/ John F. Lehman * Director John F. Lehman February 22, 2006 /s/ Jan Nicholson * Director Jan Nicholson February 22, 2006 /s/ George A. Sissel * Director George A. Sissel February 22, 2006 /s/ George M. Smart * Director George Smart February 22, 2006

Page 93 of 97
/s/ Theodore M. Solso * Director Theodore M. Solso February 22, 2006 /s/ Stuart A. Taylor II * Director Stuart A. Taylor II February 22, 2006 /s/ Erik H. van der Kaay * Director Erik H. van der Kaay February 22, 2006
*By R. David Hoover as Attorney-in-Fact pursuant to a Limited Power of Attorney executed by the directors listed above, which Power of Attorney has been filed with the Securities and Exchange Commission.
By:/s/ R. David Hoover R. David Hoover As Attorney-in-Fact February 22, 2006

Page 94 of 97
Ball Corporation and Subsidiaries Annual Report on Form 10-K
For the year ended December 31, 2005
Index to Exhibits
Exhibit Number Description of Exhibit _____________________________________________________________________________________________
2.1 Share Sale and Transfer Agreement dated August 29/30, 2002, among Schmalbach-Lubeca Holding
GmbH, AV Packaging GmbH, Ball Pan-European Holdings, Inc. and Ball Corporation (filed by incorporation by reference to Ball Corporation’s Quarterly Report on Form 10-Q for the quarter ended September 29, 2002) filed November 14, 2002.
2.2 Amendment Agreement, dated December 18, 2002, among Schmalbach-Lubeca Holding GmbH, AV Packaging GmbH, Ball Pan-European Holdings, Inc., Ball Corporation and Ball (Germany) Acquisition GmbH, amending the Share Sale and Transfer Agreement, dated August 29/30, 2002, among Schmalbach-Lubeca Holding GmbH, AV Packaging GmbH, Ball Pan-European Holdings, Inc. and Ball Corporation (filed by incorporation by reference to the Current Report on Form 8-K, dated December 19, 2002) filed December 31, 2002.
3.i Amended Articles of Incorporation as of June 24, 2005. (filed by incorporation by reference to the Quarterly Report on Form 10-Q dated July 3, 2005) filed August 9, 2005.
3.ii Bylaws of Ball Corporation as amended January 25, 2005 (filed by incorporation by reference to the Annual Report on Form 10-K dated December 31, 2004) filed February 23, 2005.
4.1 Dividend distribution payable to shareholders of record on August 4, 1996, of one preferred stock purchase right for each outstanding share of common stock under the Rights Agreement dated as of July 24, 1996, between the company and The First Chicago Trust company of New York (filed by incorporation by reference to the Form 8-A Registration Statement, No. 1-7349, dated August 1, 1996, and filed August 2, 1996, and to the company's Form 8-K Report dated February 13, 1996, and filed February 14, 1996).
4.2(a) Registration Rights Agreement, dated as of December 19, 2002, by and among Ball Corporation, Lehman Brothers, Inc., Deutsche Bank Securities Inc., Banc of America Securities LLC, Banc One Capital Markets, Inc., BNP Paribas Securities Corp., Dresdner Kleinwort Wasserstein-Grantchester, Inc., McDonald Investments Inc., Sun Trust Capital Markets, Inc. and Wells Fargo Brokerage Services, LLC and certain subsidiary guarantors of Ball Corporation (filed by incorporation by reference to Exhibit 4.1 of the Current Report on Form 8-K, dated December 19, 2002) filed December 31, 2002.
4.2(b) Senior Note Indenture, dated as of December 19, 2002, by and among Ball Corporation, certain
subsidiary guarantors of Ball Corporation and The Bank of New York, as Trustee (filed by incorporation by reference to the Current Report on Form 8-K dated December 19, 2002) filed December 31, 2002.
10.1 1988 Restricted Stock Plan and 1988 Stock Option and Stock Appreciation Rights Plan (filed by
incorporation by reference to the Form S-8 Registration Statement, No. 33-21506) filed April 27, 1988.
10.2 Ball Corporation Deferred Incentive Compensation Plan (filed by incorporation by reference to the Annual Report on Form 10-K for the year ended December 31, 1987) filed March 25, 1988.
10.3 Ball Corporation 1986 Deferred Compensation Plan, as amended July 1, 1994 (filed by incorporation by reference to the Quarterly Report on Form 10-Q for the quarter ended July 3, 1994) filed August 17, 1994.
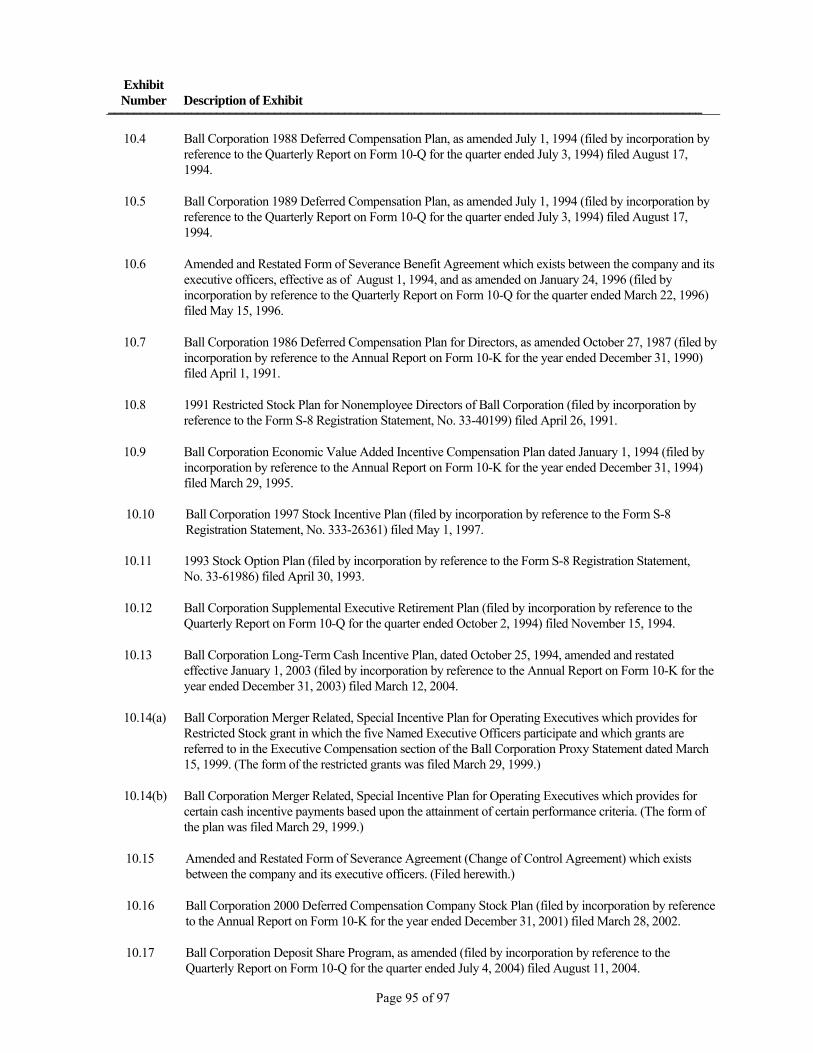
Page 95 of 97
Exhibit Number Description of Exhibit _____________________________________________________________________________________________
10.4 Ball Corporation 1988 Deferred Compensation Plan, as amended July 1, 1994 (filed by incorporation by
reference to the Quarterly Report on Form 10-Q for the quarter ended July 3, 1994) filed August 17, 1994.
10.5 Ball Corporation 1989 Deferred Compensation Plan, as amended July 1, 1994 (filed by incorporation by reference to the Quarterly Report on Form 10-Q for the quarter ended July 3, 1994) filed August 17, 1994.
10.6 Amended and Restated Form of Severance Benefit Agreement which exists between the company and its executive officers, effective as of August 1, 1994, and as amended on January 24, 1996 (filed by incorporation by reference to the Quarterly Report on Form 10-Q for the quarter ended March 22, 1996) filed May 15, 1996.
10.7 Ball Corporation 1986 Deferred Compensation Plan for Directors, as amended October 27, 1987 (filed by incorporation by reference to the Annual Report on Form 10-K for the year ended December 31, 1990) filed April 1, 1991.
10.8 1991 Restricted Stock Plan for Nonemployee Directors of Ball Corporation (filed by incorporation by reference to the Form S-8 Registration Statement, No. 33-40199) filed April 26, 1991.
10.9 Ball Corporation Economic Value Added Incentive Compensation Plan dated January 1, 1994 (filed by incorporation by reference to the Annual Report on Form 10-K for the year ended December 31, 1994) filed March 29, 1995.
10.10 Ball Corporation 1997 Stock Incentive Plan (filed by incorporation by reference to the Form S-8
Registration Statement, No. 333-26361) filed May 1, 1997. 10.11 1993 Stock Option Plan (filed by incorporation by reference to the Form S-8 Registration Statement,
No. 33-61986) filed April 30, 1993.
10.12 Ball Corporation Supplemental Executive Retirement Plan (filed by incorporation by reference to the Quarterly Report on Form 10-Q for the quarter ended October 2, 1994) filed November 15, 1994.
10.13 Ball Corporation Long-Term Cash Incentive Plan, dated October 25, 1994, amended and restated effective January 1, 2003 (filed by incorporation by reference to the Annual Report on Form 10-K for the year ended December 31, 2003) filed March 12, 2004.
10.14(a) Ball Corporation Merger Related, Special Incentive Plan for Operating Executives which provides for Restricted Stock grant in which the five Named Executive Officers participate and which grants are referred to in the Executive Compensation section of the Ball Corporation Proxy Statement dated March 15, 1999. (The form of the restricted grants was filed March 29, 1999.)
10.14(b) Ball Corporation Merger Related, Special Incentive Plan for Operating Executives which provides for certain cash incentive payments based upon the attainment of certain performance criteria. (The form of the plan was filed March 29, 1999.)
10.15 Amended and Restated Form of Severance Agreement (Change of Control Agreement) which exists between the company and its executive officers. (Filed herewith.)
10.16 Ball Corporation 2000 Deferred Compensation Company Stock Plan (filed by incorporation by reference to the Annual Report on Form 10-K for the year ended December 31, 2001) filed March 28, 2002.
10.17 Ball Corporation Deposit Share Program, as amended (filed by incorporation by reference to the Quarterly Report on Form 10-Q for the quarter ended July 4, 2004) filed August 11, 2004.

Page 96 of 97
Exhibit Number Description of Exhibit _____________________________________________________________________________________________
10.18 Ball Corporation Directors Deposit Share Program, as amended. This plan is referred to in Item 11, the
Executive Compensation section of this Form 10-K (filed by incorporation by reference to the Quarterly Report on Form 10-Q for the quarter ended July 4, 2004) filed August 11, 2004.
10.19 Acquisition Related, Special Incentive Plan for selected executives and senior managers which provides for cash incentive payments based upon the attainment of certain performance criteria (filed by incorporation by reference to the Annual Report on Form 10-K for the year ended December 31, 2002) filed March 27, 2003.
10.20 Ball Corporation 2005 Deferred Compensation Plan, effective January 1, 2005 (filed by incorporation by
reference to the Current Report on Form 8-K dated December 23, 2005) filed December 23, 2005.
10.21 Ball Corporation 2005 Deferred Compensation Company Stock Plan, effective January 1, 2005 (filed by incorporation by reference to the Current Report on Form 8-K dated December 23, 2005) filed December 23, 2005.
10.22 Ball Corporation 2005 Deferred Compensation Plan for Directors, effective January 1, 2005 (filed by incorporation by reference to the Current Report on Form 8-K dated December 23, 2005) filed December 23, 2005.
10.23 Credit agreement dated October 13, 2005, among Ball Corporation, Ball European Holdings S.ar.l., Ball Packaging Products Canada Corp. and each Other Subsidiary Borrower, Deutsche Bank AG, New York Branch, as a Lender, Administrative Agent and Collateral Agent and The Bank of Nova Scotia, as the Canadian Administrative Agent (filed by incorporation by reference to the Current Report on Form 8-K dated October 17, 2005) filed October 17, 2005.
10.24 Subsidiary Guaranty Agreement dated as of October 13, 2005, among certain Domestic subsidiaries listed therein as Guarantors, and Deutsche Bank AG, New York Branch, as Administrative Agent (filed by incorporation by reference to the Current Report on Form 8-K dated October 17, 2005) filed October 17, 2005.
11 Statement re: Computation of Earnings per Share (filed by incorporation by reference to the notes to the consolidated financial statements in Item 8, “Financial Statements and Supplementary Data”).
12 Statement re: Computation of Ratio of Earnings to Fixed Charges. (Filed herewith.)
14 Ball Corporation Executive Officers and Board of Directors Business Ethics Statement. (Filed herewith.)
18 Letter re: Change in Accounting Principles regarding change in pension plan valuation measurement date (filed by incorporation by reference to the Annual Report on Form 10-K for the year ended December 31, 2002) filed March 27, 2003.
21 List of Subsidiaries of Ball Corporation. (Filed herewith.)
23 Consent of Independent Registered Public Accounting Firm. (Filed herewith.)
24 Limited Power of Attorney. (Filed herewith.)
31 Certifications pursuant to Rule 13a-14(a) or Rule 15d-14(a), by R. David Hoover, Chairman of the Board, President and Chief Executive Officer of Ball Corporation, and by Raymond J. Seabrook, Senior Vice President and Chief Financial Officer of Ball Corporation. (Filed herewith.)

Page 97 of 97
Exhibit Number Description of Exhibit _____________________________________________________________________________________________
32 Certifications pursuant to Rule 13a-14(b) or Rule 15d-14(b) and Section 1350 of Chapter 63 of
Title 18 of the United States Code, by R. David Hoover, Chairman of the Board, President and Chief Executive Officer of Ball Corporation, and by Raymond J. Seabrook, Senior Vice President and Chief Financial Officer of Ball Corporation. (Furnished herewith.)
99.1 Specimen Certificate of Common Stock (filed by incorporation by reference to the Annual Report on Form 10-K for the year ended December 31, 1979) filed March 24, 1980.
99.2 Cautionary statement for purposes of the "safe harbor" provisions of the Private Securities Litigation Reform Act of 1995, as amended. (Filed herewith.)

The exhibits fi led with the 2005 Ball Corporation 10-K are available on theSecurities and Exchange Commission’s (SEC) Web site at www.sec.gov.
The company also maintains a Web site at www.ball.com onwhich it provides a link to access Ball’s SEC reports free of charge.
Who We AreBall Corporation is a provider of metal and plastic packaging for beverages, foods and household products, and of aerospace and other technologies and services to commercial and governmental customers. Founded in 1880, the company employs more than 13,100 people. Ball Corporation stock is traded on the New York Stock Exchange under the ticker symbol BLL.
Mission and StrategiesTo be the premier provider to our packaging and aerospace and technologies customers of the products and services that we offer as we aggressively manage our business, and to explore and pursue acquisitions, divestitures, strategic alliances and other changes that would benefit Ball’s shareholders.
In packaging, our strategy is to leverage our superior continuous process improvement expertise in order to manufacture, market, sell and service high-quality, value-added products that meet the needs of high-volume and/or growing customer segments of the beverage, food and household product markets.
In aerospace and technologies, our strategy is to provide remote sensing systems and solutions to the aerospace and defense markets through products and services used to collect and interpret information needed to support national missions and scientific discovery.
Core PurposeBall Corporation is in business to add value to all of its stakeholders, whether it is providing quality products and services to customers, an attractive return on investment to shareholders, a meaningful work life for employees or a contribution of time, effort and resources to our communities. In all of our interactions, we ask how we can get better – how we can make it better, be better and do better, for our own good and the good of those who have a stake in our success.
Core ValuesCertain guiding principles and core values have allowed us to prosper. These include:
Integrity Our reputation for integrity is one of our most important assets. We will not compromise our integrity or risk damage to our reputation in return for financial gain or for any reason.
Respect We respect our employees, our customers, our suppliers, our shareholders – indeed, all of our stakeholders. In all of our dealings we strive to show that respect and to treat people with dignity.
Motivation We have a strong desire to be successful and to be measured against the best.
Flexibility We are willing to challenge our own assumptions and adapt to changing circumstances for the long-term good of the corporation.
Innovation We strive to be creative and innovative in our products, our processes and the way we conduct business.
Teamwork We operate as a team. Everyone has his or her job, but it takes all of us working together for the company to succeed.
Five Keys to SuccessWe strive to perpetuate and grow the enterprise while adhering to our core values and following our five keys to success. Those keys are:
Close to Customers We have a total commitment to being close to our customers and understanding their needs and future direction. This commitment extends throughout our organization.
Creativity and Imagination Our employees’ creativity and imagination enable us to deliver innovations in products, process development and the way we conduct business so we can better serve our customers, grow the company and increase the value of the enterprise.
Financial HighlightsBall Corporation and Subsidiaries
($ and amounts in millions, except per share amounts and percentages) 2005 2004
Stock PerformanceAnnual return to common shareholders
(share price appreciation plus assumed reinvested dividends) . . . . . . . . . . . . . . . . . . . . . . . . . . . . . . . . (8.8)% 48.8%Closing market price per share . . . . . . . . . . . . . . . . . . . . . . . . . . . . . . . . . . . . . . . . . . . . . . . . . . . . . . . . . . $ 39.72 $ 43.98 Total market value of common stock . . . . . . . . . . . . . . . . . . . . . . . . . . . . . . . . . . . . . . . . . . . . . . . . . . . . . . $ 4,139 $ 4,956 Shares outstanding at year end. . . . . . . . . . . . . . . . . . . . . . . . . . . . . . . . . . . . . . . . . . . . . . . . . . . . . . . . . . . 104,200 112,691 Shares outstanding assuming dilution (1) . . . . . . . . . . . . . . . . . . . . . . . . . . . . . . . . . . . . . . . . . . . . . . . . . . 106,142 114,742
Operating PerformanceNet sales . . . . . . . . . . . . . . . . . . . . . . . . . . . . . . . . . . . . . . . . . . . . . . . . . . . . . . . . . . . . . . . . . . . . . . . . . . . $ 5,751 $ 5,440 Earnings before taxes (2) . . . . . . . . . . . . . . . . . . . . . . . . . . . . . . . . . . . . . . . . . . . . . . . . . . . . . . . . . . . . . . . . $ 346 $ 435 Earnings before interest and taxes (EBIT) (2)(3) . . . . . . . . . . . . . . . . . . . . . . . . . . . . . . . . . . . . . . . . . . . . . . . $ 463 $ 539 Net earnings (2) . . . . . . . . . . . . . . . . . . . . . . . . . . . . . . . . . . . . . . . . . . . . . . . . . . . . . . . . . . . . . . . . . . . . . . . $ 262 $ 296 Basic earnings per share (2) . . . . . . . . . . . . . . . . . . . . . . . . . . . . . . . . . . . . . . . . . . . . . . . . . . . . . . . . . . . . . . $ 2.43 $ 2.67 Diluted earnings per share (2) . . . . . . . . . . . . . . . . . . . . . . . . . . . . . . . . . . . . . . . . . . . . . . . . . . . . . . . . . . . . $ 2.38 $ 2.60 Cash dividends per share . . . . . . . . . . . . . . . . . . . . . . . . . . . . . . . . . . . . . . . . . . . . . . . . . . . . . . . . . . . . . . . $ 0.40 $ 0.35 Number of employees . . . . . . . . . . . . . . . . . . . . . . . . . . . . . . . . . . . . . . . . . . . . . . . . . . . . . . . . . . . . . . . . . 13,100 13,220
(1) Represents shares outstanding at year end plus the assumed exercise of options that are “in-the-money” at year end, less an estimate of shares that could be repurchased at the year-end market price of Ball stock using the assumed exercise proceeds. This measure is not the same as the diluted weighted average shares outstanding used in the calculation of diluted earnings per share.
(2) Includes expense of $21.2 million ($0.12 cents per diluted share) in 2005 and income of $15.2 million ($0.08 cents per diluted share) in 2004 related to business consolidation and other activities. Also includes expense of $19.3 million ($0.12 cents per diluted share) in 2005 for debt refinancing costs. Additional details are available in the company’s consolidated financial statements.
(3) Management utilizes earnings before interest and taxes (EBIT) as an internal measure for evaluating operating results and for planning purposes. EBIT is shown prior to interest expense of $116.4 million, including $19.3 million for debt refinancing costs, in 2005 and $103.7 million in 2004.
This Summary Annual Report should be read in conjunction with the audited consolidated financial statements and other information contained in Ball Corporation’s Annual Report on 10-K for 2005 furnished with the Company’s Proxy Statement for the 2006 Annual Meeting of Shareholders.
Behave Like Owners By behaving as true owners of the business, our employees deliver superior results and provide the best value in the products and services we supply to our customers.
Attention to Detail By managing our operations with relentless attention to detail we are creating safe workplaces while building a great business that consistently delivers superior value.
Build on Strengths We intend to build on our heritage of ethics, integrity, quality and value in all our dealings by treating all stakeholders the way we would like to be treated.
Additional photo information and credits:
Pages 2 and 12 (Deep Impact): Artwork by Ball Aerospace & Technologies Corp., modified by Tim Cline, U. Maryland.
Page 3 (CALIPSO satellite): © CNES
Page 5 (Golden employees): back row l-r: George Henke, general supervisor, cans; Frank Lodico, general supervisor, cans; Brad Branson, department manager; front row l-r: Dave Demers, millwright supervisor; Todd Hattersley, electrical supervisor; Tim Faber, engineering manager; Allen Terkildsen, engineering project manager; John Schrader, production manager, cans
Page 7 (Bonn Technical Center) l-r: Bert Bast, senior director, special projects; Wilfried Mohr, laboratory technician; Rob Miles, vice president sales & marketing; Bernd Ullmann, manager, new product development; Ralf Lieberz, project engineer measurement technology; Torsten Becker, engineer beverage technology
Page 9 and 12 (Joint Strike Fighter): © Lockheed Martin
Page 9 (Deep Impact team): back row l-r: Mike Renbarger, Nick Taylor, Monte Henderson, Joe Galamback, Tim Torphy, Dave Acton; middle row l-r: Rod Gillard, Dave Herhager, Michelle Goldman, Jim Crane, Stu Gray, Chris Burno; front row l-r: Ken Hutchison, Lorna Hess-Frey, John Mah, Alec Baldwin
Copyright © Ball Corporation 2006Ball and are trademarks of Ball Corporation
Reg. U.S. Pat. & Tm. Office.

Ball Aerospace & Technologies Corp.Celebrates 50th Anniversary 1956 - 2006
Ball Corporation10 Longs Peak DriveBroomfield, CO 80021(303) 469-3131www.ball.com
Ba
ll Co
rp
or
at
ion
| 20
05
An
nu
al R
ep
or
t
Ball Corporation | 2005 Annual Report