banca comerciala romana s.a. - bcr.ro · credit loss allowances 929651 96 722 currency translation...
TRANSCRIPT

F
Banca Comerciala Romana S.A. Interim Condensed Financial Statements
Consolidated and Separate
30 June 2019
Prepared in accordance with Ias 34 �Interim Financial Reporting�
and unaudited

CONTENTS
Administrators report
Statement of profit or loss .............................................................................................................................................. 1
Statement of financial position ....................................................................................................................................... 2
Statement of changes in equity ..................................................................................................................................... 3
Statement of cashflow ................................................................................................................................................... 5
1. Bank and Group information .............................................................................................................................. 6
2. Basis of Preparation and Presentation of the financial statements .................................................................... 7
3. Cash and cash balances.................................................................................................................................... 9
4. Financial assets at fair value through other comprehensive income ................................................................ 10
5. Financial assets at amortised cost ................................................................................................................... 14
6. Deposits from banks ........................................................................................................................................ 22
7. Deposits from customers ................................................................................................................................. 22
8. Debt securities issued ...................................................................................................................................... 23
9. Provisions ........................................................................................................................................................ 23
10. Net interest income .......................................................................................................................................... 24
11. Net fees and commissions income .................................................................................................................. 25
12. Net trading and fair value result ....................................................................................................................... 25
13. General administrative expenses ..................................................................................................................... 26
14. Net impairment loss on financial assets ........................................................................................................... 27
15. Other operating results .................................................................................................................................... 27
16. Taxes on income ............................................................................................................................................. 28
17. Dividends paid ................................................................................................................................................. 28
18. Segment reporting ........................................................................................................................................... 29
19. Related-party transactions and principal shareholders .................................................................................... 40
20. Fair value of financial assets and liabilities ...................................................................................................... 43
21. Legal claims and contingent liabilities .............................................................................................................. 51
22. Subsequent events .......................................................................................................................................... 53

1
STATEMENT
Regarding the Administrators Report for the first semester of 2019
In accordance with the provisions of ASF Regulation no. 5/2018 art. 223, with subsequent amendments, we, Sergiu Manea, as Executive President of Banca Comerciala Romana SA and Elke Meier, as Executive Vice-President of Banca Comerciala Romana SA, state that:
a) To the best of our knowledge, the interim consolidated and separate financial statements drawn up in accordance with applicable financial reporting standards provide for a correct and accurate image of the assets, liabilities, statement of financial position and statement of comprehensive income of Banca Comerciala Romana SA and its subsidiaries included in the consolidation perimeter.
b) The consolidated and separate report of the Supervisory Board reflects in a correct and accurate manner the information on Banca Comerciala Romana SA and its subsidiaries included in the consolidation perimeter.

STATEMENT OF PROFIT OR LOSS AND OTHER COMPREHENSIVE INCOME Consolidated and Separate As at 30 June 2019
1
Stant of comprehenisve income
Statement of profit or loss Statement of income Notes
in RON thousands 30.06.2019 30.06.2018 30.06.2019 30.06.2018
Net interest income 10 1,110,156 962,331 1,058,954 916,680
Interest income 1,347,054 1,186,623 1,273,090 1,112,271
Other similar income 16,592 22,111 16,034 21,081
Interest expense (230,387) (235,186) (208,363) (205,959)
Other similar expense (23,103) (11,217) (21,807) (10,713)
Net fee and commission income 11 368,873 349,442 354,128 327,028
Fee and commission income 453,786 426,033 433,116 397,247
Fee and commission expense (84,913) (76,591) (78,988) (70,219)
Dividend income 2,359 3,657 15,784 11,609
Net trading result 12 165,213 186,073 163,785 183,203
Gains/losses from financial instruments measured at fair value through profit
or loss(2,285) 1,751 (2,285) 1,751
Net result from equity method investments (1,555) 2,526 - -
Rental income from investment properties & other operating leases 47,484 35,840 5,588 5,166
Personnel expenses 13 (395,724) (378,340) (344,850) (334,255)
Other administrative expenses 13 (347,046) (330,571) (358,518) (333,934)
Depreciation and amortisation 13 (125,444) (91,778) (100,637) (64,231)
Gains/losses from derecognition of financial assets measured at amortised
cost (505) - (505) -
Other gains/losses from derecognition of financial instruments not measured
at fair value through profit or loss (29,436) 2,221 (29,436) 2,221
Net impairment loss on financial instruments 14 88,774 30,131 (189,906) 23,670
Other operating result 15 (769,520) 39,336 (436,981) 32,953
Pre-tax result from continuing operations 111,344 812,619 135,121 771,861
Net profit of the year 111,344 812,619 135,121 771,861
Taxes on income 16 (132,187) (115,618) (123,771) (114,976)
Net result for the period (20,843) 697,001 11,350 656,885
Net result attributable to non-controlling interests 6 4 - -
Net result attributable to owners of the parent (20,849) 696,997 11,350 656,885
Group Bank
Statement of other comprehensive income Statement of Comprehensive Income
in RON thousands 30.06.2019 30.06.2018 30.06.2019 30.06.2018
Net result for the period (20,843) 697,001 11,350 656,885
Remeasurement of net liability of defined pension plans - (44) - -
Other equity instruments 13,457 (180,166) 13,457 (180,166)
Deferred taxes relating to items that may not be reclassified (2,153) 28,834 (2,153) 28,827
Total items that cannot be reclassified to profit or loss 11,304 (151,376) 11,304 (151,339)
Items that may be reclassified to profit or loss
Debt instruments at fair value through other comprehensive income 17,114 (70,978) 16,604 (71,186)
Gains/losses during the period 15,736 (69,686) 15,781 (69,687)
Reclassification adjustments 727 (2,221) 727 (2,221)
Credit loss allowances 651 929 96 722
Currency translation (4,443) 4,712 - -
Deferred taxes relating to items that may be reclassified (3,259) 11,744 (3,012) 11,737
Total items that may be reclassified to profit or loss 9,412 (54,522) 13,592 (59,449)
Total other comprehensive income 20,716 (205,898) 24,896 (210,788)
Total comprehensive income (127) 491,103 36,246 446,097
Total comprehensive income attributable to non-controlling interests 6 4 - -
Total comprehensive income attributable to owners of the parent (133) 491,099 36,246 446,097
Group Bank
The interim condensed separate and consolidated financial statements were approved by the Executive Committee on 30 July 2019.

STATEMENT OF FINANCIAL POSITION Consolidated and Separate As at 30 June 2019
2
Statement of financial position Statement of financial position
in RON thousands Notes 30.06.2019 31.12.2018 30.06.2019 31.12.2018
Assets
Cash and cash balances 3 10,346,352 11,123,191 10,179,024 10,862,852
Financial assets held for trading 160,703 213,965 161,298 214,092
Derivatives 59,543 31,062 60,138 31,189
Other financial assets held for trading 101,160 182,903 101,160 182,903
thereof pledged as collateral 4,181 - 4,181 -
Non-trading financial assets at fair value through profit or loss 37,263 39,395 37,030 39,152
Equity instruments 33,048 33,475 32,815 33,232
Loans and advances to customers 4,215 5,920 4,215 5,920
Financial assets at fair value through other comprehensive income 4 5,458,119 5,222,081 5,412,021 5,187,019
Equity investments 54,178 40,721 54,178 40,721
Debt securities 5,403,941 5,181,360 5,357,843 5,146,298
thereof pledged as collateral 25,399 - 25,399 41,748
Financial assets at amortised cost 5 51,798,643 50,843,219 49,738,874 48,732,568
thereof pledged as collateral 806,426 690,952 2,097,320 1,693,280
Debt securities 15,299,100 15,879,108 14,066,921 14,297,905
Loans and advances to banks 269,108 123,840 280,364 388,848
Loans and advances to customers 36,230,435 34,840,271 35,391,590 34,045,815
Finance lease receivables 1,062,774 990,868 3,241 -
Property and equipment 1,077,677 1,169,260 974,754 760,646
Investment property 147,977 162,806 147,977 162,806
Intangible assets 345,856 361,898 339,630 354,020
Investments in joint ventures and associates 23,388 20,027 17,035 7,509
Current tax assets 200,258 181,800 197,295 178,822
Deferred tax assets 173,874 202,165 164,713 197,061
Assets held for sale 548,626 161,114 106,337 117,699
Trade and other receivables 490,654 563,014 480,201 543,179
Investments in subsidiaries - - 403,152 403,152
Other assets 346,768 275,502 185,649 148,677
Total assets 72,218,932 71,530,305 68,548,231 67,909,254
Group Bank
Statement of financial position
in RON thousands 30.06.2019 31.12.2018 30.06.2019 31.12.2018
Liabilities and Equity
Financial liabilities held for trading 83,128 32,988 83,128 32,988
Derivatives 83,128 32,988 83,128 32,988
Financial liabilities measured at amortised cost 61,890,320 61,618,808 58,881,083 58,326,984
Deposits from banks 6 5,294,492 5,578,080 4,562,358 4,791,204
Deposits from customers 7 55,427,344 55,098,959 53,150,871 52,593,690
Debt securities in issue 8 269,613 349,153 269,613 349,153
Other financial liabilities 898,871 592,616 898,241 592,937
Finance lease liabilities 249,912 - 245,567 -
Provisions 9 1,753,037 1,151,688 1,400,326 1,120,255
Current tax liabilities 4,051 97,782 - 97,110
Deferred tax liabilities 6,791 - - -
Liabilities associated with assets held for sale 35,499 15,438 - -
Other liabilities 319,411 246,887 248,902 193,842
Total equity 7,876,783 8,366,714 7,689,225 8,138,075
Share capital 2,952,565 2,952,565 2,952,565 2,952,565
Retained earnings 3,255,783 3,766,482 3,051,869 3,525,615
Other reserves 1,668,435 1,647,667 1,684,791 1,659,895
attributable to non-controlling interest 52 46 - -
attributable to owners of the parent 7,876,731 8,366,668 - -
Total liabilities and equity 72,218,932 71,530,305 68,548,231 67,909,254
Group Bank
The interim condensed separate and consolidated financial statements were approved by the Executive Committee on 30 July 2019.
STATEMENT OF CHANGES IN EQUITY Consolidated and Separate As at 30 June 2019
3
Statement of changes in equity 30.06.2019 Group
in RON thousandsSubscribed
capitalShare premium
Retained
earningsOther reserves
Fair value
reserve
Currency
translation
reserve
Remeasurement of net
liability of defined
pension plans
Deferred tax
Equity
attributable to
owners of the
parent
Equity
attributable to
non-controlling
interests
Total
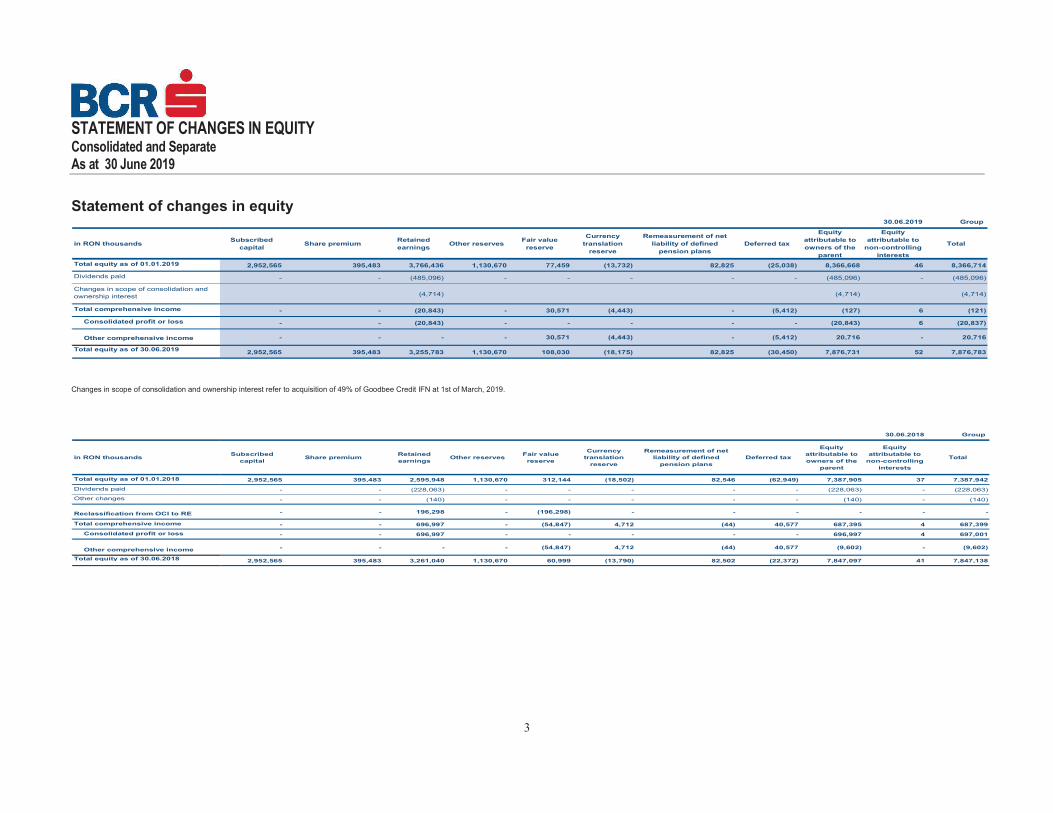
Total equity as of 01.01.2019 2,952,565 395,483 3,766,436 1,130,670 77,459 (13,732) 82,825 (25,038) 8,366,668 46 8,366,714
Dividends paid - - (485,096) - - - - - (485,096) - (485,096)
Changes in scope of consolidation and
ownership interest (4,714) (4,714) (4,714)
Total comprehensive income - - (20,843) - 30,571 (4,443) - (5,412) (127) 6 (121)
Consolidated profit or loss - - (20,843) - - - - - (20,843) 6 (20,837)
Other comprehensive income - - - - 30,571 (4,443) - (5,412) 20,716 - 20,716
Total equity as of 30.06.2019 2,952,565 395,483 3,255,783 1,130,670 108,030 (18,175) 82,825 (30,450) 7,876,731 52 7,876,783
Changes in scope of consolidation and ownership interest refer to acquisition of 49% of Goodbee Credit IFN at 1st of March, 2019.
30.06.2018 Group
in RON thousandsSubscribed
capitalShare premium
Retained
earningsOther reserves
Fair value
reserve
Currency
translation
reserve
Remeasurement of net
liability of defined
pension plans
Deferred tax
Equity
attributable to
owners of the
parent
Equity
attributable to
non-controlling
interests
Total
Total equity as of 01.01.2018 2,952,565 395,483 2,595,948 1,130,670 312,144 (18,502) 82,546 (62,949) 7,387,905 37 7,387,942
Dividends paid - - (228,063) - - - - - (228,063) - (228,063)
Other changes - - (140) - - - - - (140) - (140)
Reclassification from OCI to RE - - 196,298 - (196,298) - - - - - -
Total comprehensive income - - 696,997 - (54,847) 4,712 (44) 40,577 687,395 4 687,399
Consolidated profit or loss - - 696,997 - - - - - 696,997 4 697,001
Other comprehensive income - - - - (54,847) 4,712 (44) 40,577 (9,602) - (9,602)
Total equity as of 30.06.2018 2,952,565 395,483 3,261,040 1,130,670 60,999 (13,790) 82,502 (22,372) 7,847,097 41 7,847,138
Statement of changes in equity

STATEMENT OF CHANGES IN EQUITY Consolidated and Separate As at 30 June 2019
4
Statement of Changes in Equity (continued) 30.06.2019 Bank
in RON thousandsSubscribed
capitalShare premium
Retained
earningsOther reserves
Fair value
reserve
Currency
translation
reserve
Remeasurement of net
liability of defined
pension plans
Deferred tax
Equity
attributable to
owners of the
parent
Equity
attributable to
non-controlling
interests
Total
Total equity as of 01.01.2019 2,952,565 395,483 3,525,615 1,130,670 75,909 - 82,883 (25,050) 8,138,075 - 8,138,075
Dividends paid - - (485,096) - - - - - (485,096) - (485,096)
Total comprehensive income - - 11,350 - 30,061 - - (5,165) 36,246 - 36,246
Net profit of the year - - 11,350 - - - - - 11,350 - 11,350
Other comprehensive income - - - - 30,061 - - 40,564 70,625 - 70,625
Total equity as of 30.06.2019 2,952,565 395,483 3,051,869 1,130,670 105,970 - 82,883 (30,215) 7,689,225 - 7,689,225
30.06.2018 Bank
in RON thousandsSubscribed
capitalShare premium
Retained
earningsOther reserves
Fair value
reserve
Currency
translation
reserve
Remeasurement of net
liability of defined
pension plans
Deferred tax
Equity
attributable to
owners of the
parent
Equity
attributable to
non-controlling
interests
Total
Total equity as of 01.01.2018 2,952,565 395,483 2,586,933 1,130,670 310,856 - 82,546 (62,943) 7,396,110 - 7,396,110
Dividends paid - - (228,063) - - - - - (228,063) - (228,063)
Reclassification from OCI to RE - 196,298 - (196,298) - - - - - -
Total comprehensive income - - 656,885 - (55,055) - - 40,564 642,394 - 642,394
Consolidated profit or loss 656,885 - - - - - 656,885 - 656,885
Other comprehensive income - - - - (55,055) - - 40,564 (14,491) - (14,491)
Total equity as of 30.06.2018 2,952,565 395,483 3,212,053 1,130,670 59,503 - 82,546 (22,379) 7,810,441 - 7,810,441

STATEMENT OF CASH FLOW Consolidated and Separate As at 30 June 2019
5
Statement of cash flows
in RON thousands 30.06.2019 30.06.2018 30.06.2019 30.06.2018
Net result for the period (20,843) 697,001 11,350 656,885
Non-cash adjustments for items in net profit/(loss) for the year
Depreciation, amortisation of assets 125,444 91,778 100,637 64,231
Allocation to and release of impairment of loans 38,758 (39,935) 304,938 (50,443)
Gains/(losses) from the sale of tangible and intangible assets 20,602 (10,829) 18,105 (9,749)
Other provisions 601,350 (52,618) 280,071 (38,883)
Impairment tangible and intangible assets 13,220 (3,193) - 7
Interest income reiceived from investing activities (332,240) (328,289) (309,479) (299,839)
Interest expense paid for financing activities (29,682) 82,006 (29,682) 75,068
Dividend income from investing activities - - (13,464) (7,953)
Other adjustments (63,501) (39,104) (68,869) (41,499)
Changes in assets and liabilities from operating activities after adjustment for non-cash
components
Financial assets - held for trading 81,743 (107,829) 81,743 (107,832)
Non-trading financial assets at fair value through profit or loss - 25,847 - 25,869
Financial assets at fair value through other comprehensive income (205,466) - (195,037) -
Financial assets at amortised cost - - - -
Loans and advances to banks (145,268) 912,021 (169,470) 909,288
Loans and advances to customers (1,430,879) (1,530,728) (1,310,610) (1,395,383)
Other assets from operating activities (68,855) (6,918) (36,947) (46,146)
Financial liabilities - held for trading - 514 - 514
Deposits from banks (264,192) (561,805) (93,586) (685,062)
Deposits from customers 328,385 (13,050) 557,181 113,625
Other financial liabilities 260,076 15,932 275,382 5,000
Other liabilities from operating activities 72,531 (12,893) 55,060 4,004
Cash flow from operating activities (1,018,819) (882,092) (542,678) (828,298)
Proceeds of disposal - - - -
Financial assets - held to maturity - - - -
Financial assets at fair value through other comprehensive income (727) 305,373 (727) 305,373
Property and equipment, intangible assets and investment properties 49,758 46,971 49,757 30,816
Acquisition of - - - -
Financial assets - held to maturity - - - -
Debt securities at amortised cost 582,939 (564,412) 223,629 (519,862)
Financial assets at fair value through other comprehensive income - (5,835) - -
Property and equipment, intangible assets and investment properties (177,990) (140,395) (66,538) (55,570)
Contribution to increase in share capital of subsidiaries - - - (30,000)
Interest received from investing activities 332,223 679,425 309,479 630,067
Dividends received from investing activities - - 13,464 7,953
Cash flow from investing activities 786,203 321,127 529,065 368,776
Dividends paid to equity holders of the parent (484,630) (213,476) (484,630) (213,476)
Dividends paid to non-controlling interests (466) (14,587) (466) (14,587)
Debt securities issued (91,061) (90,661) (91,061) (90,661)
Inflows from other financing activities 364,106 326,277 - -
Outflows from other financing activities (285,525) (816,169) (56,917) (641,284)
Interest expense paid for financing activities (46,647) (84,286) (37,140) (77,724)
Other financing activities (23,033) (32,308) (13,526) (25,746)
Subordinated loans (23,614) (51,978) (23,614) (51,978)
Cash flow from financing activities (544,223) (892,902) (670,214) (1,037,732)
Cash and cash equivalents at beginning of period 11,123,191 11,367,313 10,862,852 11,244,649
Cash flow from operating activities (1,018,819) (882,092) (542,678) (828,299)
Cash flow from investing activities 786,203 321,127 529,065 368,777
Cash flow from financing activities (544,223) (892,902) (670,214) (1,037,732)
Cash and cash equivalents at end of period 10,346,352 9,913,446 10,179,024 9,747,395
Group Bank

Notes to Financial Statements Consolidated and Separate As at 30 June 2019
6
1. Bank and Group information
Banca Comerciala Romana S.A, (hereinafter called the �Bank�) was established on 1 December 1990. The Bank is a Romanian legal entity and is licensed by the National Bank of Romania (�NBR�) to conduct banking activities with both retail and corporate customers. The main services provided to customers include: loans, deposits, domestic and international payments, foreign exchange transactions, bank guarantees, letters of credit, etc.
As a result of the privatization process organized by the government of Romania, Erste Bank der oesterreichischen Sparkassen AG (�Erste Bank�) purchased 61.88% of the share capital of the Bank pursuant to a share purchase agreement dated 21 December 2005. Until December 2018, Erste Bank purchased further 37.9976% from employees and other shareholders of the Bank, adding up to 99,8776%. Erste Bank der oesterreichschen Sparkassen AG (�Erste bank�) is owned 100% by Erste Group Bank AG. The ultimate parent of the Group is Erste Group Bank AG.
At 30 June 2019, the Bank�s shareholders were the following:
30.06.2019 31.12.2018
in RON thousands Number of sharesPercentage holding
(%)Number of shares Percentage holding (%)
Erste Group Bank AG 16,233,523,442 99.8776% 16,233,523,442 99.8776%
Societatea de Investitii Financiare (�SIF�) �Banat Crisana� 1 0.0000% 1 0.0000%
Societatea de Investitii Financiare (�SIF�) �Muntenia� 1 0.0000% 1 0.0000%
SC Actinvest SA 226,802 0.0014% 226,802 0.0014%
FDI Certinvest Dinamic 13,699 0.0001% 13,699 0.0001%
BCR Leasing 109 0.0000% 109 0.0000%
Individuals 19,652,200 0.1209% 19,652,200 0.1209%
Total 16,253,416,254 100.0000% 16,253,416,254 100.0000%
The current registered office is located in Bucharest, Romania, No.15, Calea Victoriei.
The Bank operates through the Head Office located in Bucharest and through its territorial units, as
follows:
• Retail grouped into 12 geographical locations, including 482 branches;
• Corporate grouped into 10 geographical areas, including 21 Commercial Centres and Area Centres, 22 Mobile Teams and International Clients Department that support small and medium-sized customers (SMEs).
The Bank has the following subsidiaries as at 30 June 2019 and 31 December 2018:
30.06.2019 31.12.2018
BCR Chisinau SA Moldova Banking 100.00% 100.00% 200,064 51,174 148,890
BCR Leasing IFN SA Romania Financial leasing 99.97% 99.97% 389,492 190,273 199,219
BCR Pensii, Societate de
Administrare a Fondurilor de
Pensii Private SA
Romania Pension Fund 99.99% 99.99% 269,820 159,805 110,015
BCR Banca pentru Locuinte SA Romania Housing loans 99.99% 99.99% 108,078 - 108,078
Suport Colect SRL Romania Workout 99.99% 99.99% 983,047 - 983,047
CIT One SRL RomaniaCash processing
and storing100.00% 100.00% 13,308 7,255 6,053
BCR Payments Services SRL RomaniaPayments
transactions99.99% 99.99% 1,900 1,900 -
BCR Fleet Management SRL* Romania Operational leasing 99.97% 99.97% - - -
Net Book Value ImpaimentCompany's nameCountry of
incorporation
Nature of the
business
Shareholding Gross Book
Value
*Company held indirectly by BCR through BCR Leasing SA
The participation held in CIT One was maintained as asset held for sale and the participation in BCR Fleet Management SRL was
reclassified as asset held for sale at 31st of March,2019.

Notes to Financial Statements Consolidated and Separate As at 30 June 2019
7
2. Basis of Preparation and Presentation of the financial statements
a) Statement of compliance
These interim condensed financial statements have been prepared in accordance with International Financial Reporting Standards (�IFRS�), IAS 34 � Interim Financial Reporting.
These financial statements do not include all of the information required for full annual financial statements and should be read in conjuction with the consolidated and separate financial statements as at and for the year ended 31 December 2018.
b) Functional and presentation currency
The functional currency of the financial statements is the Romanian leu (�RON�). All figures are shown in RON thousands, rounded to the nearest RON thousands.
The exchange rates of major foreign currencies, published by National Bank of Romania, were:
Currencies Change
Euro (EUR) 1 : RON 4.7351 1 : RON 4.6639 1.53%
US Dollar (USD) 1 : RON 4.1587 1 : RON 4.0736 2.09%
30.06.2019 31.12.2018
c) Significant accounting policies
The individual and consolidated financial statements have been prepared on a going concern basis, except for BpL where the basis of preparation is gone concern. The financial impact of applying this principle is RON 4mn as of 30th of June 2019 booked as impairment of non financial assets.
The accounting policies applied by the Bank and the Group in these interim condensed financial statements are the same as those applied in the annual consolidated financial statements as at 31 December 2018, except for the accounting policies related to IFRS 16 (applied by the Bank and the Group since 1st of January 2019). Where necessary, comparative figures have been reclassified to conform to changes in presentation in the current period.
Apart from the first application of IFRS 16 �Leases�, there have been no significant changes in accounting policies since 31 December 2018 resulting from the application of new or amended standards. Starting with January 2019, BCR Group has adopted IFRS 16 �Leases� as issued by IASB in January 2016. IFRS 16 replaced existing guidance for accounting for leases in IAS 17 �Leases�, IFRIC 4 �Determining whether an Arrangement contains a lease�, SIC-15 �Operating leases � Incentives� and SIC-27 �Evaluation the Substance of Transactions Involving the Legal Form of a lease�. IFRS 16 introduced a single, on-balance sheet lease accounting model for lessees. A lessee recognizes a right-of-use asset representing its right to use the underlying asset and a lease liability representing its obligation to make lease payments. There are recognition exemptions for short-term leases (less than 12 months) and leases of low-value items (5000 USD). At inception date of a contract, the contract is assessed for whether it contains a lease, i.e. whether the contract conveys the right to control the use of an identified asset for a period of time in exchange for a consideration. A right-of-use asset and a lease liability are recognized at the lease commencement date. It is initially measured at cost and subsequently depreciated from the commencement date to the earlier of the end of its useful life or the end of the lease term. BCR Group uses the straight-line method of depreciation. The lease liability is initially measured at the present value of the lease payments that are not paid at the commencement date, discounted using the interest rate implicit in the lease or, if the rate cannot be readily determined, the lessee�s incremental borrowing rate. Lease payments comprise fixed lease payments, variable lease payments that depend on an index or a rate, amounts expected to be payable under a residual value guarantee, the exercise price under a purchase option and lease payments in an optional renewal period if the lessee is reasonably certain to exercise the options and penalties for early termination if the lease term reflects the lessee exercising the termination option.

Notes to Financial Statements Consolidated and Separate As at 30 June 2019
8
2. Basis of Preparation and Presentation of the financial statements (continued)
Subsequently, the carrying amount of the lease liability is increased by interest using the applicable discount rate, reduced by lease payments made and remeasured to reflect any reassessment or lease modification. The determination of the incremental borrowing rate for property leases is generally based on a rate that is readily observable. Such a rate might be the property yield reflecting the annual return expected on the property. Further, an adjustment to the property yield is necessary to reflect specific features of the lease agreement. Lessor accounting remains similar to the IAS 17 standard, i.e. the lessor continues to classify leases as finance or operating leases. BCR Group applied IFRS 16 using the modified retrospective approach in accordance to IFRS 16.C5 (b) whereby comparative information was not restated. On adoption of IFRS 16, BCR Group recognized lease liabilities in relation to leases which had previously been classified as �operating leases� under the principles of IAS 17 and IFRIC 4. These liabilities were measured at the present value of the remaining lease payments, discounted using the lessee�s incremental borrowing rate as of 1 January 2019. The right-of-use asset was recognized at an amount equal to the lease liability (IFRS 16.C8 (b)(ii)). Subsequently the right-of-use asset was adjusted for prepayments and accruals relating to leases recognized in the balance sheet as at 31 December 2018. BCR Group did not have any impact on the equity at initial application. All contracts which were previously identified as leases applying IAS 17 and IFRIC 4 are taken over into IFRS 16. BCR Group does not apply IFRS 16 to any leases on intangible assets. BCR Group uses the exemption for short term leases and leases of low value whereby the right-of-use-asset is not recognized. In the statement of financial position, right-of-use assets have been included in the property, plant and equipment, except those meeting the definition of investment property.
In the context of transition to IFRS 16, The Group recognised a right of use asset of RON 296,090
thousands against a corresponding lease liability on 1 January 2019:
Group Bank
in RON thousands
Undiscounted Future fixed lease payments 387,432 362,265
Effect of discounting to present value ��������������������������������������� ������������������������������������
Future fixed lease payments �� � ������������������������������� �����������������������������������
31 December 2018 / 1 January 2019
Under IFRS 16, a lessor continues to classify leases as either finance leases or operating leases. Whenever the terms of the lease transfer substantially all the risks and rewards of ownership to the lessee, the contract is classified as a finance lease. All other leases are classified as operating leases. When BCR Group is an intermediate lessor, it accounts for the head lease and the sublease as two separate contracts. The sublease is classified as a finance or operating lease by reference to the right-of-use assets arising from the head lease, not with reference to the underlying asset. BCR Group, as a lessor, has reclassified certain of its sublease agreements as finance lease. The lease assets have been derecognized and finance lease asset receivables amounting to RON 3 million recognized.
d) Use of estimates and judgements
The preparation of these interim condensed separate and consolidated financial statements requires judgements, estimates and assumptions by Management and together with the application of accounting policies determines the amounts of assets and liablities, income and expenses.
In preparing the interim condensed separate and consolidated financial statements the significant judgements made by management in appying the Bank�s accounting policies and the key sources of estimation uncertainty were the same as those that applied to the separate and consolidated financial statements for the year ended 31.12.2018.
Notes to Financial Statements Consolidated and Separate As at 30 June 2019
9
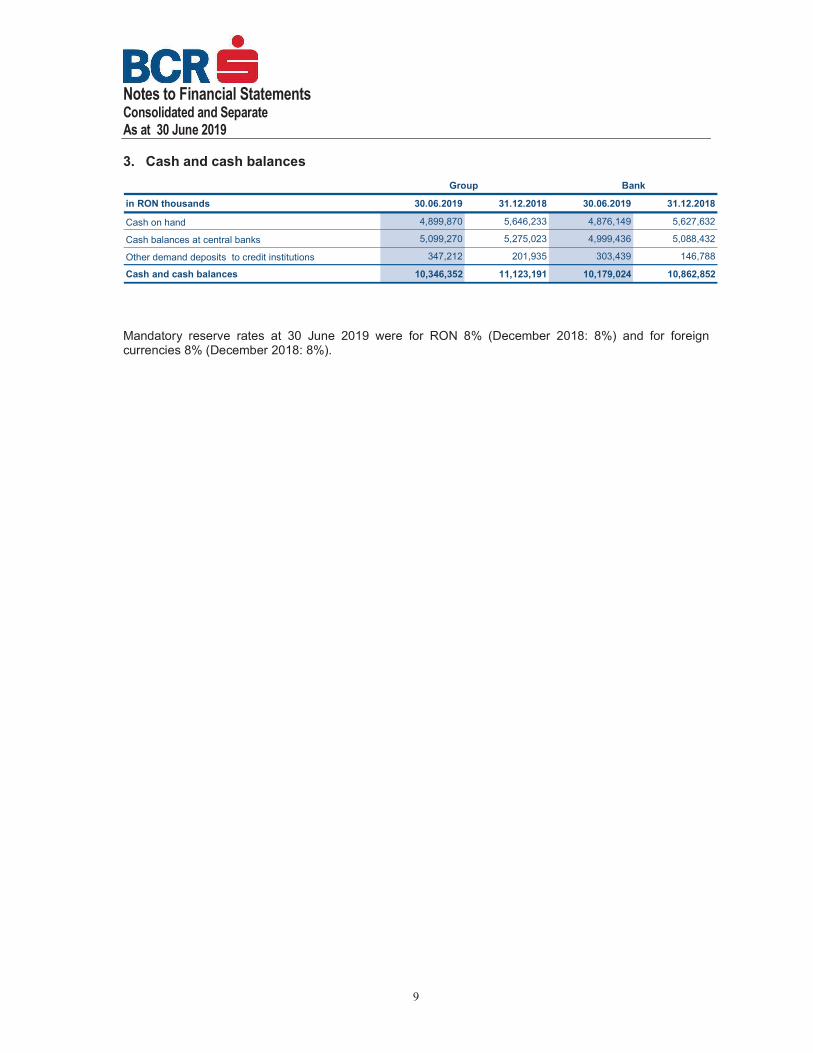
3. Cash and cash balances
in RON thousands 30.06.2019 31.12.2018 30.06.2019 31.12.2018
Cash on hand 4,899,870 5,646,233 4,876,149 5,627,632
Cash balances at central banks 5,099,270 5,275,023 4,999,436 5,088,432
Other demand deposits to credit institutions 347,212 201,935 303,439 146,788
Cash and cash balances 10,346,352 11,123,191 10,179,024 10,862,852
Group Bank
Mandatory reserve rates at 30 June 2019 were for RON 8% (December 2018: 8%) and for foreign currencies 8% (December 2018: 8%).

Notes to Financial Statements Consolidated and Separate As at 30 June 2019
10
4. Financial assets at fair value through other comprehensive income 30.06.2019 Group
in RON thousandsAccumulated other
fair value changesCarrying amount
Stage 1 Stage 2 Stage 3 Total Stage 1 Stage 2 Stage 3 Total
Debt securities 5,330,753 - - 5,330,753 (4,377) - - (4,377) 73,188 5,403,941
Central banks 43,518 - - 43,518 (1,944) - - (1,944) 43,518
General governments 5,282,004 - - 5,282,004 (2,377) - - (2,377) 71,545 5,353,549
Non-financial corporations 5,231 - - 5,231 (56) - - (56) 1,643 6,874
Total 5,330,753 - - 5,330,753 (4,377) - - (4,377) 73,188 5,403,941
Gross carrying amount Credit loss allowances
Allowances for financial assets at fair value through other comprehensive income 30.06.2019 Group
in RON thousandsOpening
balance
Increases due
to origination
and acquisition
Decreases due to
derecognition
Net changes
due to change
in credit risk
Transfers
between Stage
1 and Stages
2/3
Net changes due
to modifications
without
derecognition
Decrease in
allowance
account due to
write-offs
Exchange-rate and
other changes (+/-)Closing balance
Debt securities
Stage 1 (3,789) (4,399) 513 3,223 - - - 75 (4,377)
Central banks (960) (3,504) - 2,436 - - - 84 (1,944)
General governments (2,775) (895) 513 789 - - - (9) (2,377)
Non-financial corporations (54) - - (2) - - - - (56)
Total (3,789) (4,399) 513 3,223 - - - 75 (4,377)

Notes to Financial Statements Consolidated and Separate As at 30 June 2019
11
4. Financial assets at fair value through other comprehensive income (continued)
31.12.2018 Group
in RON thousandsAccumulated other
fair value changes
Carrying
amount
Stage 1 Stage 2 Stage 3 Total Stage 1 Stage 2 Stage 3 Total
Debt securities 5,124,698 - - 5,124,698 (3,789) - - (3,789) 56,662 5,181,360
Central banks 21,490 - - 21,490 (960) - - (960) - 21,490
General governments 5,098,203 - - 5,098,203 (2,775) - - (2,775) 55,650 5,153,853
Non-financial corporations 5,005 - - 5,005 (54) - - (54) 1,012 6,017
Total 5,124,698 - - 5,124,698 (3,789) - - (3,789) 56,662 5,181,360
Gross carrying amount Credit loss allowances
Allowances for financial assets at fair value through other comprehensive income 31.12.2018 Group
in RON thousandsOpening
balance
Increases due
to origination
and acquisition
Decreases due to
derecognition
Net changes
due to change
in credit risk
Transfers
between Stage
1 and Stages
2/3
Net changes due
to modifications
without
derecognition
Decrease in
allowance
account due to
write-offs
Exchange-rate and
other changes (+/-)Closing balance
Debt securities
Stage 1 (2,683) (2,659) 842 - - 775 - (64) (3,789)
Central banks - (943) - - - - - (17) (960)
General governments (2,683) (1,662) 842 - - 775 - (47) (2,775)
Non-financial corporations - (54) - - - - - - (54)
Total (2,683) (2,659) 842 - - 775 - (64) (3,789)

Notes to Financial Statements Consolidated and Separate As at 30 June 2019
12
4. Financial assets at fair value through other comprehensive income (continued)
30.06.2019 Bank
in RON thousandsAccumulated other
fair value changes
Carrying
amount
Stage 1 Stage 2 Stage 3 Total Stage 1 Stage 2 Stage 3 Total
Debt securities 5,284,657 - - 5,284,657 (2,319) - - (2,319) 73,186 5,357,843
Central banks - - - - - - - - - -
General governments 5,279,426 - - 5,279,426 (2,263) - - (2,263) 71,543 5,350,969
Non-financial corporations 5,231 - - 5,231 (56) - - (56) 1,643 6,874
Total 5,284,657 - - 5,284,657 (2,319) - - (2,319) 73,186 5,357,843
Gross carrying amount Credit loss allowances
Allowances for financial assets at fair value through other comprehensive income 30.06.2019 Bank
in RON thousandsOpening
balance
Increases due
to origination
and acquisition
Decreases due to
derecognition
Net changes
due to change
in credit risk
Transfers
between Stage
1 and Stages
2/3
Net changes due
to modifications
without
derecognition
Decrease in
allowance
account due to
write-offs
Exchange-rate and
other changes (+/-)Closing balance
Debt securities
Stage 1 (2,223) (521) 513 (74) - - - (14) (2,319)
General governments (2,169) (521) 513 (72) - - (14) (2,263)
Non-financial corporations (54) - - (2) - - - - (56)
Total (2,223) (521) 513 (74) - - - (14) (2,319)

Notes to Financial Statements Consolidated and Separate As at 30 June 2019
13
4. Financial assets at fair value through other comprehensive income (continued)
31.12.2018 Bank
in RON thousandsAccumulated other
fair value changes
Carrying
amount
Stage 1 Stage 2 Stage 3 Total Stage 1 Stage 2 Stage 3 Total
Debt securities 5,089,620 - - 5,089,620 (2,223) - - (2,223) 56,678 5,146,298
Central banks - - - - - - - - - -
General governments 5,084,615 - - 5,084,615 (2,169) - - (2,169) 55,666 5,140,281
Non-financial corporations 5,005 - - 5,005 (54) - - (54) 1,012 6,017
Total 5,089,620 - - 5,089,620 (2,223) - - (2,223) 56,678 5,146,298
Gross carrying amount Credit loss allowances
Allowances for financial assets at fair value through other comprehensive income 31.12.2018 Bank
in RON thousandsOpening
balance
Increases due
to origination
and acquisition
Decreases due to
derecognition
Net changes
due to change
in credit risk
Transfers
between Stage
1 and Stages
2/3
Net changes due
to modifications
without
derecognition
Decrease in
allowance
account due to
write-offs
Exchange-rate and
other changes (+/-)Closing balance
Debt securities
Stage 1 (1,450) (1,122) 842 - - (491) - (2) (2,223)
General governments (1,450) (1,068) 842 - - (491) - (2) (2,169)
Non-financial corporations - (54) - - - - - - (54)
Total (1,450) (1,122) 842 - - (491) - (2) (2,223)

Notes to Financial Statements Consolidated and Separate As at 30 June 2019
14
5. Financial assets at amortised cost
30.06.2019 Group
Total Carrying amount
Stage 1 Stage 2 Stage 3 POCI Total Stage 1 Stage 2 Stage 3 POCI TotalDebt securities 15,249,768 57,542 2,169 - 15,309,479 (9,189) (539) (651) - (10,379) 15,299,100
General governments 15,198,961 57,542 2,169 - 15,258,672 (9,186) (539) (651) - (10,376) 15,248,296
Credit institutions 50,807 - - - 50,807 (3) - - - (3) 50,804Loans and advances to banks 269,391 - - - 269,391 (283) - - - (283) 269,108
Central banks 663 - - - 663 - - - - - 663Credit institutions 268,728 - - - 268,728 (283) - - - (283) 268,445
Loans and advances to customers 32,009,330 4,133,871 1,704,202 515,092 38,362,495 (131,602) (453,860) (1,379,673) (166,925) (2,132,060) 36,230,435General governments 1,989,316 724,769 12,410 13,800 2,740,295 (2,407) (20,141) (9,861) (223) (32,632) 2,707,663Other financial corporations 188,490 14 16,796 - 205,300 (1,302) - (12,558) - (13,860) 191,440Non-financial corporations 9,039,819 2,009,467 676,969 240,814 11,967,069 (86,388) (266,398) (535,796) (43,965) (932,547) 11,034,522Households 20,791,705 1,399,621 998,027 260,478 23,449,831 (41,505) (167,321) (821,458) (122,737) (1,153,021) 22,296,810
Total 47,528,489 4,191,413 1,706,371 515,092 53,941,365 (141,074) (454,399) (1,380,324) (166,925) (2,142,722) 51,798,643
in RON thousandsGross carrying amount Credit loss allowances
The movements in allowances for financial assets at amortised cost � debt securities are presented below: 30.06.2019 Group
in RON thousands Opening balance
Increases due to
origination and
acquisition
Decreases due to
derecognition
Net changes due
to change in
credit risk
Transfers
between Stage 1
and Stages 2/3
Net changes due
to modifications
without
derecognition
Decrease in
allowance
account due to
write-offs
Exchange-rate
and other
changes (+/-)
Closing balance
Debt securitiesStage 1 (9,596) (3,251) 630 2,931 6 - - 91 (9,189)
Central banks - - - - - - - - -General governments (9,596) (3,241) 630 2,924 6 - - 91 (9,186)
Credit institutions - (10) - 7 - - - - (3)Stage 2 (1,025) - - 523 (32) - - (5) (539)
General governments (1,025) - - 523 (32) - - (5) (539)Stage 3 (1,593) - - 942 - - - - (651)
General governments (1,593) - - 942 - - - - (651)Total (12,214) (3,251) 630 4,396 (26) - - 86 (10,379)

Notes to Financial Statements Consolidated and Separate As at 30 June 2019
15
5. Financial assets at amortised cost (continued)
The movements in allowances for financial assets at amortised cost � loans and advances to banks are presented below: 30.06.2019 Group
in RON thousands Opening balance
Increases due to
origination and
acquisition
Decreases due to
derecognition
Net changes due
to change in
credit risk
Transfers
between Stage 1
and Stages 2/3
Net changes due
to modifications
without
derecognition
Decrease in
allowance
account due to
write-offs
Exchange-rate
and other
changes (+/-)
Closing balance
Loans and advances to banks
Stage 1 (283) (1,829) - 1,346 509 1 - (27) (283)
Central banks - - -
Credit institutions (283) (1,829) - 1,346 509 1 - (27) (283)
Total (283) (1,829) - 1,346 509 1 - (27) (283)
The movements in allowances for financial assets at amortised cost � loans and advances to customers are presented below:
30.06.2019 Group
in RON thousands Opening balance
Increases due to
origination and
acquisition
Decreases due to
derecognition
Net changes due
to change in
credit risk
Transfers
between Stage 1
and Stages 2/3
Net changes due
to modifications
without
derecognition
Decrease in
allowance
account due to
write-offs
Exchange-rate
and other
changes (+/-)
Closing balance
Loans and advances to customers
Stage 1 (123,855) (34,363) 19,595 (5,024) 12,929 (164) 12 (732) (131,602)
General governments (2,297) (60) 4 (95) 48 (2) - (5) (2,407)
Other financial corporations (896) (6) 5 (672) 271 - - (4) (1,302)
Non-financial corporations (76,474) (27,190) 18,022 (6,343) 6,122 (7) - (518) (86,388)
Households (44,188) (7,107) 1,564 2,086 6,488 (155) 12 (205) (41,505)
Stage 2 (450,029) (3,375) 14,673 (2,284) (6,943) (1,610) - (4,292) (453,860)
General governments (38,058) (1) 1 18,183 (147) (65) - (54) (20,141)
Other financial corporations - - - 150 (150) - - - -
Non-financial corporations (238,381) (3,190) 9,844 (30,157) (2,107) 504 - (2,911) (266,398)
Households (173,590) (184) 4,828 9,540 (4,539) (2,049) - (1,327) (167,321)
Stage 3 (1,283,665) (1,434) 26,685 (147,154) (2,700) 1,431 37,529 (10,365) (1,379,673)
General governments (8,783) - 1 (1,075) - (6) - 2 (9,861)
Other financial corporations (12,745) - - (628) - (8) 1,033 (210) (12,558)
Non-financial corporations (514,926) (328) 4,611 (26,999) (2,401) 653 7,565 (3,971) (535,796)
Households (747,211) (1,106) 22,073 (118,452) (299) 792 28,931 (6,186) (821,458)
POCI (213,530) - 26,434 6,605 - 10,329 6,832 (3,595) (166,925)
General governments (485) - - 262 - - - - (223)
Non-financial corporations (61,202) - 13,541 (4,586) - 9,064 9 (791) (43,965)
Households (151,843) - 12,893 10,929 - 1,265 6,823 (2,804) (122,737)
Total (2,071,079) (39,172) 87,387 (147,857) 3,286 9,986 44,373 (18,984) (2,132,060)

Notes to Financial Statements Consolidated and Separate As at 30 June 2019
16
5. Financial assets at amortised cost (continued)
31.12.2018 Group
Total Carrying amount
Stage 1 Stage 2 Stage 3 POCI Total Stage 1 Stage 2 Stage 3 POCI Total
Debt securities 15,802,370 86,578 2,374 - 15,891,322 (9,596) (1,025) (1,593) - (12,214) 15,879,108
General governments 15,802,370 86,578 2,374 - 15,891,322 (9,596) (1,025) (1,593) - (12,214) 15,879,108
Loans and advances to banks 124,123 - - - 124,123 (283) - - - (283) 123,840
Central banks 510 - - - 510 - - - - - 510
Credit institutions 123,613 - - - 123,613 (283) - - - (283) 123,330
Loans and advances to customers 30,897,939 3,820,603 1,600,067 592,741 36,911,350 (123,855) (450,029) (1,283,665) (213,530) (2,071,079) 34,840,271
General governments 1,879,753 918,712 11,020 14,912 2,824,397 (2,297) (38,058) (8,783) (485) (49,623) 2,774,774
Other financial corporations 156,886 19 17,986 - 174,891 (896) - (12,745) - (13,641) 161,250
Non-financial corporations 8,649,694 1,651,253 676,176 291,980 11,269,103 (76,474) (238,381) (514,926) (61,202) (890,983) 10,378,120
Households 20,211,606 1,250,619 894,885 285,849 22,642,959 (44,188) (173,590) (747,211) (151,843) (1,116,832) 21,526,127
Total 46,824,432 3,907,181 1,602,441 592,741 52,926,795 (133,734) (451,054) (1,285,258) (213,530) (2,083,576) 50,843,219
in RON thousandsGross carrying amount Credit loss allowances
The movements in allowances for financial assets at amortised cost � debt securities are presented below:
31.12.2018 Group
in RON thousands Opening balance
Increases due to
origination and
acquisition
Decreases due to
derecognition
Net changes due
to change in
credit risk
Transfers
between Stage 1
and Stages 2/3
Net changes due
to modifications
without
derecognition
Decrease in
allowance
account due to
write-offs
Exchange-rate
and other
changes (+/-)
Closing balance
Debt securities
Stage 1 (6,644) (2,842) 295 (345) 45 - - (105) (9,596)
Central banks (610) - - - - - - 610 -
General governments (6,034) (2,842) 295 (345) 45 - - (715) (9,596)
Stage 2 (1,245) - - 583 (365) - - 2 (1,025)
General governments (1,245) - - 583 (365) - - 2 (1,025)
Stage 3 (1,493) - - (100) - - - - (1,593)
General governments (1,493) - - (100) - - - - (1,593)
Total (9,382) (2,842) 295 138 (320) - - (103) (12,214)

Notes to Financial Statements Consolidated and Separate As at 30 June 2019
17
5. Financial assets at amortised cost (continued)
The movements in allowances for financial assets at amortised cost � loans and advances to banks are presented below:
31.12.2018 Group
in RON thousands Opening balance
Increases due to
origination and
acquisition
Decreases due to
derecognition
Net changes due
to change in
credit risk
Transfers
between Stage 1
and Stages 2/3
Net changes due to
modifications
without
derecognition
Decrease in
allowance
account due to
write-offs
Exchange-rate
and other
changes (+/-)
Closing balance
Loans and advances to banksStage 1 (3,066) (3,806) 5,389 (1,842) 2,163 4 - 875 (283)
Central banks (407) - - (1) 419 - - (11) -Credit institutions (2,659) (3,806) 5,389 (1,841) 1,744 4 - 886 (283)
Total (3,066) (3,806) 5,389 (1,842) 2,163 4 - 875 (283)
The movements in allowances for financial assets at amortised cost � loans and advances to customers are presented below:
31.12.2018 Group
in RON thousands Opening balance
Increases due to
origination and
acquisition
Decreases due to
derecognition
Net changes due
to change in
credit risk
Transfers
between Stage 1
and Stages 2/3
Net changes due to
modifications
without
derecognition
Decrease in
allowance
account due to
write-offs
Exchange-rate
and other
changes (+/-)
Closing balance
Loans and advances to customersStage 1 (126,872) (63,669) 26,390 12,018 27,993 298 - (13) (123,855)
General governments (1,878) (645) 132 (326) 422 (2) - - (2,297)Other financial corporations (648) (48) 87 (287) - - - - (896)Non-financial corporations (74,560) (36,997) 22,675 (5,927) 17,970 321 - 44 (76,474)Households (49,786) (25,979) 3,496 18,558 9,601 (21) - (57) (44,188)
Stage 2 (474,531) (2,771) 87,923 (45,565) (15,527) 1,067 - (625) (450,029)General governments (85,479) - 38,359 9,354 (129) (163) - - (38,058)Other financial corporations (2) - 2 - - - - - -Non-financial corporations (197,061) (1,979) 38,977 (70,836) (7,754) 729 - (457) (238,381)Households (191,989) (792) 10,585 15,917 (7,644) 501 - (168) (173,590)
Stage 3 (1,526,590) (1,651) 277,197 (318,183) (1,392) (1,700) 290,337 (1,683) (1,283,665)General governments (4,788) - 683 (4,652) - (26) - - (8,783)Other financial corporations (15,304) - 3 2,570 - - - (14) (12,745)Non-financial corporations (689,750) (426) 188,180 (190,454) (399) (160) 179,267 (1,184) (514,926)Households (816,748) (1,225) 88,331 (125,647) (993) (1,514) 111,070 (485) (747,211)
POCI (283,203) - 93,667 (58,515) - 3,268 33,034 (1,781) (213,530)General governments (2,041) - - 1,556 - - - - (485)Non-financial corporations (97,920) - 83,963 (47,416) - 70 1,690 (1,589) (61,202)Households (183,242) - 9,704 (12,655) - 3,198 31,344 (192) (151,843)
Total (2,411,196) (68,091) 485,177 (410,245) 11,074 2,933 323,371 (4,102) (2,071,079)

Notes to Financial Statements Consolidated and Separate As at 30 June 2019
18
5. Financial assets at amortised cost (continued)
30.06.2019 Bank
Total Carrying amountStage 1 Stage 2 Stage 3 POCI Total Stage 1 Stage 2 Stage 3 POCI Total
Debt securities 14,014,689 57,418 2,169 - 14,074,276 (6,174) (530) (651) - (7,355) 14,066,921Central banks - - - - - - - - - - -General governments 13,963,882 57,418 2,169 - 14,023,469 (6,171) (530) (651) - (7,352) 14,016,117
Credit institutions 50,807 - - - 50,807 (3) - - - (3) 50,804
Other financial corporations - - - - - - - - - - -
Non-financial corporations - - - - - - - - - - -Loans and advances to banks 265,267 16,295 277,955 - 559,517 (410) (788) (277,955) - (279,153) 280,364
Central banks 663 - - - 663 - - - - - 663Credit institutions 264,604 16,295 277,955 - 558,854 (410) (788) (277,955) - (279,153) 279,701
Loans and advances to customers 31,243,755 4,062,153 1,615,365 515,062 37,436,335 (123,176) (451,914) (1,302,760) (166,895) (2,044,745) 35,391,590General governments 1,989,317 724,769 12,410 13,800 2,740,296 (2,407) (20,141) (9,861) (223) (32,632) 2,707,664Other financial corporations 456,448 6 16,796 - 473,250 (1,657) - (12,558) - (14,215) 459,035Non-financial corporations 8,251,965 1,941,148 649,160 240,814 11,083,087 (78,329) (264,597) (518,006) (43,965) (904,897) 10,178,190Households 20,546,025 1,396,230 936,999 260,448 23,139,702 (40,783) (167,176) (762,335) (122,707) (1,093,001) 22,046,701
Total 45,523,711 4,135,866 1,895,489 515,062 52,070,128 (129,760) (453,232) (1,581,366) (166,895) (2,331,253) 49,738,875
in RON thousandsGross carrying amount Credit loss allowances
The movements in allowances for financial assets at amortised cost � debt securities are presented below: 30.06.2019 Bank
in RON thousands Opening balance
Increases due to
origination and
acquisition
Decreases due to
derecognition
Net changes due
to change in
credit risk
Transfers
between Stage 1
and Stages 2/3
Net changes due
to modifications
without
derecognition
Decrease in
allowance
account due to
write-offs
Exchange-rate
and other
changes (+/-)
Closing balance
Debt securities
Stage 1 (6,290) (1,120) 630 619 6 - - (19) (6,174)
General governments (6,290) (1,110) 630 612 6 - - (19) (6,171)Credit institutions - (10) - 7 - - - - (3)
Stage 2 (1,025) - - 523 (28) - - - (530)General governments (1,025) - - 523 (28) - - - (530)
Stage 3 (1,593) - - 942 - - - - (651)General governments (1,593) - - 942 - - - - (651)
Total (8,908) (1,120) 630 2,084 (22) - - (19) (7,355)

Notes to Financial Statements Consolidated and Separate As at 30 June 2019
19
5. Financial assets at amortised cost (continued)
The movements in allowances for financial assets at amortised cost � loans and advances to banks are presented below: 30.06.2019 Bank
in RON thousands Opening balance
Increases due to
origination and
acquisition
Decreases due to
derecognition
Net changes due
to change in
credit risk
Transfers
between Stage 1
and Stages 2/3
Net changes due
to modifications
without
derecognition
Decrease in
allowance
account due to
write-offs
Exchange-rate
and other
changes (+/-)
Closing balance
Loans and advances to banksStage 1 (1,598) (1,829) - 2,526 509 1 - (19) (410)
Credit institutions (1,598) (1,829) - 2,526 509 1 - (19) (410)Stage 2 (1,365) - - 579 - 16 - (18) (788)
Credit institutions (1,365) - - 579 - 16 - (18) (788)
Stage 3 - - - (277,955) - - - - (277,955)
Central banks - - - - - - - - -
Credit institutions - - - (277,955) - - - - (277,955)
Total (2,963) (1,829) - (274,850) 509 17 - (37) (279,153)
The movements in allowances for financial assets at amortised cost � loans and advances to customers are presented below: 30.06.2019 Bank
in RON thousands Opening balance
Increases due to
origination and
acquisition
Decreases due to
derecognition
Net changes due
to change in
credit risk
Transfers
between Stage 1
and Stages 2/3
Net changes due
to modifications
without
derecognition
Decrease in
allowance
account due to
write-offs
Exchange-rate
and other
changes (+/-)
Closing balance
Loans and advances to customersStage 1 (117,897) (31,680) 19,535 (4,708) 12,425 (171) 12 (692) (123,176)
General governments (2,297) (60) 4 (95) 48 (2) - (5) (2,407)
Other financial corporations (1,390) - 5 (269) - - - (3) (1,657)
Non-financial corporations (70,740) (24,609) 18,013 (6,404) 5,897 (7) - (479) (78,329)
Households (43,470) (7,011) 1,513 2,060 6,480 (162) 12 (205) (40,783)
Stage 2 (447,583) (3,375) 14,669 (3,256) (6,421) (1,612) - (4,336) (451,914)
General governments (38,058) (1) 1 18,183 (147) (65) - (54) (20,141)
Other financial corporations - - - - - - - - -
Non-financial corporations (236,063) (3,190) 9,843 (30,951) (1,784) 504 - (2,956) (264,597)
Households (173,462) (184) 4,825 9,512 (4,490) (2,051) - (1,326) (167,176)
Stage 3 (1,201,883) (1,434) 26,685 (147,461) (299) 1,431 30,059 (9,858) (1,302,760)
General governments (8,783) - 1 (1,075) - (6) - 2 (9,861)Other financial corporations (12,745) - - (628) - (8) 1,033 (210) (12,558)Non-financial corporations (496,007) (328) 4,611 (26,318) - 653 2,832 (3,449) (518,006)Households (684,348) (1,106) 22,073 (119,440) (299) 792 26,194 (6,201) (762,335)
POCI (213,498) - 26,434 6,602 - 10,329 6,832 (3,594) (166,895)General governments (485) - - 262 - - - - (223)Non-financial corporations (61,202) - 13,541 (4,586) - 9,064 9 (791) (43,965)Households (151,811) - 12,893 10,926 - 1,265 6,823 (2,803) (122,707)
Total (1,980,861) (36,489) 87,323 (148,823) 5,705 9,977 36,903 (18,480) (2,044,745)

Notes to Financial Statements Consolidated and Separate As at 30 June 2019
20
5. Financial assets at amortised cost (continued)
31.12.2018 BankTotal Carrying amount
Stage 1 Stage 2 Stage 3 POCI Total Stage 1 Stage 2 Stage 3 POCI TotalDebt securities 14,217,864 86,575 2,374 - 14,306,813 (6,290) (1,025) (1,593) - (8,908) 14,297,905
Central banks - - - - - - - - - - -General governments 14,217,864 86,575 2,374 - 14,306,813 (6,290) (1,025) (1,593) - (8,908) 14,297,905
Loans and advances to banks 364,221 27,590 - - 391,811 (1,598) (1,365) - - (2,963) 388,848Central banks 510 - - - 510 - - - - - 510Credit institutions 363,711 27,590 - - 391,301 (1,598) (1,365) - - (2,963) 388,338
Loans and advances to customers 30,189,068 3,739,743 1,505,154 592,710 36,026,675 (117,897) (447,583) (1,201,882) (213,498) (1,980,860) 34,045,815General governments 1,879,751 918,712 11,020 14,912 2,824,395 (2,297) (38,058) (8,783) (485) (49,623) 2,774,772Other financial corporations 418,470 4 17,986 - 436,460 (1,390) - (12,745) - (14,135) 422,325Non-financial corporations 7,918,371 1,574,387 646,113 291,980 10,430,851 (70,740) (236,063) (496,006) (61,202) (864,011) 9,566,840Households 19,972,476 1,246,640 830,035 285,818 22,334,969 (43,470) (173,462) (684,348) (151,811) (1,053,091) 21,281,878
Total 44,771,153 3,853,908 1,507,528 592,710 50,725,299 (125,785) (449,973) (1,203,475) (213,498) (1,992,731) 48,732,568
in RON thousandsGross carrying amount Credit loss allowances
The movements in allowances for financial assets at amortised cost � debt securities are presented below:
31.12.2018 Bank
in RON thousands Opening balance
Increases due to
origination and
acquisition
Decreases due to
derecognition
Net changes due
to change in
credit risk
Transfers
between Stage 1
and Stages 2/3
Net changes due
to modifications
without
derecognition
Decrease in
allowance
account due to
write-offs
Exchange-rate
and other
changes (+/-)
Closing balance
Debt securities
Stage 1 (4,132) (309) 295 (2,186) 44 - - (2) (6,290)
General governments (4,132) (309) 295 (2,186) 44 - - (2) (6,290)
Stage 2 (1,241) - - 581 (365) - - - (1,025)
General governments (1,241) - - 581 (365) - - - (1,025)
Stage 3 (1,493) - - (100) - - - - (1,593)
General governments (1,493) - - (100) - - - - (1,593)
Total (6,866) (309) 295 (1,705) (321) - - (2) (8,908)

Notes to Financial Statements Consolidated and Separate As at 30 June 2019
21
5. Financial assets at amortised cost (continued)
The movements in allowances for financial assets at amortised cost � loans and advances to banks are presented below: 31.12.2018 Bank
in RON thousands Opening balance
Increases due to
origination and
acquisition
Decreases due to
derecognition
Net changes due
to change in
credit risk
Transfers
between Stage 1
and Stages 2/3
Net changes due
to modifications
without
derecognition
Decrease in
allowance
account due to
write-offs
Exchange-rate
and other
changes (+/-)
Closing balance
Loans and advances to banksStage 1 (1,773) (3,806) 5,389 (3,121) 1,744 4 - (35) (1,598)
Credit institutions (1,773) (3,806) 5,389 (3,121) 1,744 4 - (35) (1,598)Stage 2 - - 5 (1,376) - - - 6 (1,365)
Credit institutions - - 5 (1,376) - - - 6 (1,365)
Total (1,773) (3,806) 5,394 (4,497) 1,744 4 - (29) (2,963)
The movements in allowances for financial assets at amortised cost � loans and advances to customers are presented below: 31.12.2018 Bank
in RON thousands Opening balance
Increases due to
origination and
acquisition
Decreases due to
derecognition
Net changes due
to change in
credit risk
Transfers
between Stage 1
and Stages 2/3
Net changes due
to modifications
without
derecognition
Decrease in
allowance
account due to
write-offs
Exchange-rate
and other
changes (+/-)
Closing balance
Loans and advances to customersStage 1 (118,779) (56,761) 26,386 6,869 24,391 159 - (162) (117,897)
General governments (1,878) (645) 132 (326) 422 (2) - - (2,297)
Other financial corporations (644) (43) 87 (790) - - - - (1,390)
Non-financial corporations (67,181) (30,516) 22,671 (10,346) 14,453 321 - (142) (70,740)
Households (49,076) (25,557) 3,496 18,331 9,516 (160) - (20) (43,470)
Stage 2 (473,009) (2,572) 87,921 (49,873) (10,771) 1,064 - (343) (447,583)
General governments (85,479) - 38,359 9,354 (129) (163) - - (38,058)
Other financial corporations (2) - 2 - - - - - -
Non-financial corporations (195,829) (1,781) 38,975 (74,944) (3,059) 729 - (154) (236,063)
Households (191,699) (791) 10,585 15,717 (7,583) 498 - (189) (173,462)
Stage 3 (1,396,909) (1,518) 277,197 (319,389) (514) (1,895) 242,698 (1,552) (1,201,882)
General governments (4,788) - 683 (4,652) - (26) - - (8,783)Other financial corporations (15,304) - 3 2,570 (1) - - (13) (12,745)Non-financial corporations (654,938) (426) 188,180 (184,935) (2) (159) 157,360 (1,086) (496,006)Households (721,879) (1,092) 88,331 (132,372) (511) (1,710) 85,338 (453) (684,348)
POCI (283,182) - 93,667 (58,504) - 3,268 33,034 (1,781) (213,498)General governments (2,041) - - 1,556 - - - - (485)Non-financial corporations (97,920) - 83,963 (47,416) - 70 1,690 (1,589) (61,202)Households (183,221) - 9,704 (12,644) - 3,198 31,344 (192) (151,811)
Total (2,271,879) (60,851) 485,171 (420,897) 13,106 2,596 275,732 (3,838) (1,980,860)

Notes to Financial Statements Consolidated and Separate As at 30 June 2019
22
6. Deposits from banks
in RON thousands 30.06.2019 31.12.2018 30.06.2019 31.12.2018
Current accounts / overnight deposits 723,972 516,812 649,093 435,631
Term deposits from other banks 3,316,079 4,019,286 1,488,627 2,364,447
Repurchase agreements 196,424 - 1,366,621 949,144
Deposits from banks 4,236,475 4,536,098 3,504,341 3,749,222
Subordinated loans 1,058,017 1,041,982 1,058,017 1,041,982
Deposits from banks 5,294,492 5,578,080 4,562,358 4,791,204
Group Bank
Long term deposits of EUR 311 million were repaid before maturity during first half of 2019 by the Bank.
7. Deposits from customers
in RON thousands 30.06.2019 31.12.2018 30.06.2019 31.12.2018
Overnight deposits 26.770.960 26.962.305 26.632.366 26.847.416
Savings deposits 2.160 2.291 - -
Households 2.160 2.291 - -
Non-savings deposits 26.768.800 26.960.014 26.632.366 26.847.416
General governments 1.213.073 1.267.448 1.213.073 1.267.448
Other financial corporations 832.569 1.331.707 859.997 1.344.829
Non-financial corporations 9.559.620 10.242.954 9.440.934 10.150.350
Households 15.163.538 14.117.905 15.118.362 14.084.789
Term deposits 28.656.384 28.136.654 26.518.505 25.746.274
Savings deposits 2.134.720 2.493.030 - -
Households 2.134.720 2.493.030 - -
Non-savings deposits 26.521.664 25.643.624 26.518.505 25.746.274
General governments 1.947.647 2.320.084 1.947.647 2.320.084
Other financial corporations 1.604.122 1.036.206 1.705.490 1.148.908
Non-financial corporations 5.719.114 5.190.779 5.706.970 5.180.727
Households 17.250.781 17.096.555 17.158.398 17.096.555
Deposits from customers 55.427.344 55.098.959 53.150.871 52.593.690
General governments 3.160.720 3.587.532 3.160.720 3.587.532
Other financial corporations 2.436.691 2.367.913 2.565.487 2.493.737
Non-financial corporations 15.278.734 15.433.733 15.147.904 15.331.077
Households 34.551.199 33.709.781 32.276.760 31.181.344
Group Bank

Notes to Financial Statements Consolidated and Separate As at 30 June 2019
23
8. Debt securities issued
in RON thousands 30.06.2019 31.12.2018 30.06.2019 31.12.2018
Other debt securities issued 269,613 349,153 269,613 349,153
Bonds 269,613 349,153 269,613 349,153
Debt securities issued 269,613 349,153 269,613 349,153
Group Bank
As of 30 June 2019, the outstanding nominal amount of subordinated bonds issued by the Bank decreased due to matured bonds.
9. Provisions
in RON thousands 30.06.2019 31.12.2018 30.06.2019 31.12.2018
Long-term employee provisions 45,896 43,702 45,782 43,588
Pending legal issues 648,750 679,672 601,494 647,077
Commitments and guarantees given 333,330 417,102 336,215 418,827
Provisions for commitments and financial guarantees in Stage 1 32,972 24,435 32,968 25,731
Provisions for commitments and financial guarantees in Stage 2 37,039 58,420 39,928 58,849
Provisions for commitments and financial guarantees in Stage 3 259,564 329,660 259,564 329,660
Provisions for commitments and financial guarantees - POCI 3,755 4,587 3,755 4,587
Other provisions 725,061 11,212 416,835 10,763
Restructuring 16,777 - 16,777 -
Other* 708,285 14,641 400,058 14,641
Provisions 1,753,037 1,151,688 1,400,326 1,120,255
Group Bank
*As at 30 June 2019, BCR booked a credit risk provision in amount of RON 278 mn for the existing loans to BpL and a provision in accordance with IAS 37 in amount of RON 395mn for the upcoming increase of share capital in BpL. The amounts are eliminated in the consolidation.
The BCR Group�s profit or loss was negatively impacted as at 30th of June 2019, due to booking of a provision in amount of RON 718mn. The litigation is described in Note 21 � Legal claims.

Notes to Financial Statements Consolidated and Separate As at 30 June 2019
24
10. Net interest income
in RON thousands 30.06.2019 30.06.2018 30.06.2019 30.06.2018
Interest and other similar income
Financial assets at amortised cost 1,268,705 1,115,123 1,195,864 1,041,821
Financial assets measured at fair value through other
comprehensive income78,349 71,500 77,226 70,450
Interest income 1,347,054 1,186,623 1,273,090 1,112,271
Non-trading financial assets at fair value through profit or loss 147 393 147 393
Financial assets - held for trading 11,093 16,005 11,093 16,005
Other assets and negative interest from financial liabilities 5,352 5,713 4,794 4,683
Other similar income 16,592 22,111 16,034 21,081
Total interest and other similar income 1,363,646 1,208,734 1,289,124 1,133,352
Interest and other similar expense
Financial liabilities measured at amortised cost* (230,387) (235,186) (208,363) (205,959)
Interest expenses (230,387) (235,186) (208,363) (205,959)
Financial liabilities - held for trading (5,075) (7,519) (5,075) (7,519)
Other liabilities (17,757) (3,657) (16,461) (3,153)
Negative Interest from financial assets (271) (41) (271) (41)
Other similar expenses (23,103) (11,217) (21,807) (10,713)
Total Interest and other similar expense (253,490) (246,403) (230,170) (216,672)
Net interest income 1,110,156 962,331 1,058,954 916,680
Thereof: interest-income on credit impaired financial
assets 19,161 18,009 18,425 17,974
Group Bank
*The application of IFRS 16 has negatively impacted the interest expense by RON 12,4mn at Group level, while the impact at Bank level is RON 11,1mn.

Notes to Financial Statements Consolidated and Separate As at 30 June 2019
25
11. Net fees and commissions income
in RON thousands
Income Expenses Income Expenses Income Expenses Income Expenses
Securities 15,177 (1,644) 4,627 (1,832) 15,177 (1,644) 4,627 (1,832)
Transfer orders 15,177 (1,644) 4,627 (1,832) 15,177 (1,644) 4,627 (1,832)
Clearing and settlement 2,925 (6,288) 3,122 (6,184) 2,929 (6,229) 3,124 (6,127)
Asset management 13,500 - 19,169 - - - - -
Custody 6,814 (2,293) 8,040 (2,210) 6,814 (1,498) 8,040 (1,418)
Payment services 288,543 (59,410) 264,167 (42,660) 286,682 (58,437) 262,112 (41,899)
Card business 87,493 (38,252) 51,892 (26,156) 86,214 (37,498) 50,829 (25,606)
Other 201,050 (21,158) 212,275 (16,504) 200,468 (20,939) 211,283 (16,293)
Customer resources distributed but not
managed 65,864 (1,785) 68,782 (5,703) 65,434 (1,785) 67,088 (5,703)
Collective investment 14,608 - - - 14,608 - - -
Insurance products 38,681 - 33,776 - 35,665 - 29,486 -
Foreign exchange transactions 12,430 (1,785) 10,694 (962) 12,431 (1,785) 10,694 (962)
Other 145 - 24,312 (4,741) 2,730 26,908 (4,741)
Lending business 51,306 (11,885) 47,000 (8,629) 51,288 (8,401) 47,081 (5,033)
Guarantees given, guarantees received 12,653 (3,734) 14,465 (1,972) 12,631 (1,250) 14,348 (274)
Loan commitments given, loan
commitments received 9,241 (1) 8,869 (52) 9,241 - 8,869 -
Other lending business 29,412 (8,150) 23,666 (6,605) 29,416 (7,151) 23,864 (4,759)
Other 9,657 (1,608) 11,126 (9,373) 4,792 (994) 5,175 (8,207)
Net fee and commission income 453,786 (84,913) 426,033 (76,591) 433,116 (78,988) 397,247 (70,219)
Group Bank
30.06.2019 30.06.2018 30.06.2019 30.06.2018
12. Net trading and fair value result
in RON thousands 30.06.2019 30.06.2018 30.06.2019 30.06.2018
Net Trading Result
Securities and derivatives trading 33,637 44,959 33,637 44,959
Foreign exchange transactions 138,474 120,445 134,740 140,872
Foreign currency transaltion (6,898) 20,669 (4,592) (2,628)
Net Trading Result 165,213 186,073 163,785 183,203
Group Bank

Notes to Financial Statements Consolidated and Separate As at 30 June 2019
26
13. General administrative expenses
in RON thousands 30.06.2019 30.06.2018 30.06.2019 30.06.2018
Personnel expenses (395,725) (378,340) (344,850) (334,255)
Wages and salaries (356,433) (347,733) (310,875) (308,200)
Compulsory social security (12,967) (11,158) (10,832) (9,349)
Long-term employee provisions (1,484) (2,188) (1,342) (2,069)
Other personnel expenses (24,841) (17,261) (21,801) (14,637)
Other administrative expenses (347,045) (330,571) (358,518) (333,934)
Deposit insurance contribution (60,207) (20,194) (55,221) (16,808)
IT expenses (109,082) (107,951) (105,599) (104,755)
Expenses for office space* (47,729) (81,496) (45,313) (77,117)
Office operating expenses (49,423) (46,579) (82,549) (69,591)
Advertising/marketing (26,241) (26,749) (25,568) (25,811)
Legal and consulting costs (33,344) (20,977) (31,790) (18,892)
Sundry administrative expenses (21,019) (26,625) (12,478) (20,960)
Depreciation and amortisation (125,444) (91,778) (100,637) (64,231)
Software and other intangible assets (42,571) (27,505) (40,876) (25,954)
Owner occupied real estate* (35,034) (17,483) (34,190) (17,109)
Investment properties (2,651) (1,887) (2,651) (1,887)
Office furniture and equipment and sundry property and
equipment (45,188) (44,903) (22,920) (19,281)
General administrative expenses (868,214) (800,689) (804,005) (732,420)
Group Bank
*The expenses for office space decreased versus 2018 as opposed to expenses with depreciation and amortization which increased due to application of IFRS 16.
The Group number of emplyees at 30 June 2019 was 6,962 (31 December 2018: 7,237).

Notes to Financial Statements Consolidated and Separate As at 30 June 2019
27
14. Net impairment loss on financial assets
in RON thousands 30.06.2019 30.06.2018 30.06.2019 30.06.2018
Financial assets at fair value through other comprehensive
income (758) (921) (178) (722)
Financial assets at amortised cost (798) 71,149 (278,791) 69,097
Net allocation to risk provisions * (18,029) 70,144 (286,102) 64,414
Direct write-offs (19,025) (28,358) (17,237) (12,122)
Recoveries recorded directly to the income statement 51,901 31,214 34,971 18,654
Modification gains or losses (10,423) (1,851) (10,424) (1,849)
Finance lease (5,222) - - -
Net allocation of provisions for commitments and guarantees given (i)90,330 (40,097) 89,064 (44,705)
Net impairment loss on financial instruments 88,774 30,131 (189,905) 23,670
Group Bank
*The increase in net allocation to risk provision is due to the depreciation of the loan granted to BpL following the event regarding the control of the Court of Accounts described in Note 21 � Litigations. Being an intragroup transaction is eliminated in consolidation.
15. Other operating results
in RON thousands 30.06.2019 30.06.2018 30.06.2019 30.06.2018
Other income, of which: 224,944 243,788 161,821 186,077
Other provisions - release 86,844 101,136 84,878 90,782
Gains on other assets 76,235 73,959 48,820 49,834
Other income 61,865 68,693 28,123 45,461
Other expense, of which: (994,464) (204,452) (598,802) (153,124)
Other provisions - allocation* (768,345) - (443,727) -
Losses on other assets (47,865) (56,480) (24,556) (30,817)
Impairment of tangible and intangible assets** (13,220) 3,193 - (7)
Recovery and resolution fund (31,362) (25,403) (31,357) (25,403)
Other taxes (11,233) (14,451) (9,424) (7,690)
Other expenses (122,439) (111,311) (89,738) (89,207)
Total (769,520) 39,336 (436,981) 32,953
Group Bank
*The increase of allocation of other provisions at Group and Bank level is mainlye due to the event regarding the control of Court of Accounts at BpL described in Note 21 � Litigations. **Includes the impairment of the tangible and intangible assets held by BpL following the application of the gone concern basis, in amount of RON 4 mn.

Notes to Financial Statements Consolidated and Separate As at 30 June 2019
28
16. Taxes on income
in RON thousands 30.06.2019 30.06.2018 30.06.2019 30.06.2018
Current tax expense/income (102,531) (103,032) (96,588) (102,703)
Current period (59,461) (103,032) (53,517) (102,703)
Prior period (43,070) - (43,070) -
Deferred tax expense/income (29,656) (12,586) (27,183) (12,273)
Current period (29,656) (12,586) (27,183) (12,273)
Taxes on income (132,187) (115,618) (123,771) (114,976)
in RON thousands 30.06.2019 30.06.2018 30.06.2019 30.06.2018
Pre-tax profit/(loss) 111,344 812,619 135,121 771,861
Income tax expense for the financial year at the domestic
statutory tax rate (16%) (17,815) (123,970) (21,619) (123,498)
Impact of tax-exempt earnings of investments and other
tax-exempt income 87,567 79,829 87,567 79,625
Tax increases due to non-deductible expenses, additional
business tax and similar elements (143,722) (64,499) (131,502) (64,391)
Impact of other elements and deferred tax income/
(expense) (15,147) (12,586) (15,147) (12,273)
Tax expense not atributable to the reporting period (43,070) 5,608 (43,070) 5,561
Income tax (expense) / release reported in the income
statement(132,187) (115,618) (123,771) (114,976)
The effective tax rate* 118.72% 14.23% 91.60% 14.90%
Group Bank
Group Bank
*The effective tax rate was impacted by the increase of non-deductible expenses as a result of the allocation of the provision for BPL case (RON 395 mn) and of the additional withholding tax (RON 43mn) as result of Tax Inspection Report and Tax Decision for which the explanations are presented in Note 21 � Litigations.
17. Dividends paid
During 2019, dividends in amount of RON 485,096 thousands were paid, out of which RON 484,629 thousands to equity holders and RON 467 thousands to non controlling interests.

Notes to Financial Statements Consolidated and Separate As at 30 June 2019
29
18. Segment reporting
The segment reporting format is determined to be business segments as the Group�s risks and rates of
return are affected predominantly by differences in the products and services produced. The operating
businesses are organized and managed separately according to the nature of the products and services
provided, with each segment representing a strategic business unit that offers different products and
serves different markets.
For management purposes, the Bank is organized into the following business segments:
A. Retail
The Group provides individuals and micro clients with a range of financial products and services,
including lending (consumer loans, vehicles purchase, personal needs, mortgages, overdrafts, credit
cards facilities and funds transfer facilities), savings and deposit taking business, payment services and
securities business.
B. Corporate
Within corporate banking, the Group provides corporations, real estate and large corporate clients with a
range of financial products and services, including lending and deposit taking, providing cash
management, foreign commercial business, leasing, investment advices, financial planning, securities
business, project and structured finance transactions, syndicated loans and asset backed transactions.
Principal activity is of handling loans, other credit facilities, deposits, and current accounts for corporate
and institutional customers, investment banking services and financial products and services provided by
the leasing, insurance, brokerage, asset management, real estate services and financial consultancy
services operations of the Group.
The main Corporate segments are:
a. SME, comprising:
• Companies with yearly turnover between EUR 1 mio - EUR 50 mio and a consolidated T/O < EUR
500 mio
• Companies part of a domestic group with at least one company with individual yearly turnover
between EUR 1 mio - EUR 50 mio
• Companies part of an international group with at least one company with individual yearly turnover
between EUR 1 mio - EUR 500 mio
• Companies with real estate financing for which total project value (including land acquisition,
excluding VAT) is less than EUR 8 mio
• Companies with consolidated T/O between EUR 1 mio - EUR 3 mio, segmented as Small SME
• International clients with more than 50% foreign capital participation, turnover between EUR10 mio -
EUR 50 mio, or part of a group with consolidated T/O<EUR 500 mio.
• Companies having individual / consolidated turnover below EUR 1 mio.
b. Public Sector (PS):
Public Sector comprises Public sector, Public corporations clients and Non Profit sector, including
municipalities representing local authorities and companies managed by local authorities, central
authorities and companies owned by state and public funds.
Public sector includes the following institutions:
• Central ministries and state funded funds and agencies
• Non-profit entities established by or under control of central government entities, state funded
organizations, state universities or R&D institutions
• Regional governments and organizations funded by them
• State capitals including city halls, regional capitals and other municipals and organizations funded by
them. Exceptions: elementary and primary schools, high schools, kindergartens, small hospitals and
libraries, which are segmented as Micro
• Public health and social insurance companies

Notes to Financial Statements Consolidated and Separate As at 30 June 2019
30
18. SEGMENT REPORTING (continued)
Public Corporations include:
• All non-financial state companies and corporations with more than 50% share of state or regional
governments or municipals excluding stock exchange listed companies and State Owned Companies
acting in Energy & Utilities industry with T/O > 50 mio EUR
c. Local Large Corporates (LLC)
• Companies with an yearly individual turnover above EUR 50 mio;
• Companies part of a local group with at least one company having yearly turnover above EUR 50
mio;
• Energy & Utilities State Owned Companies who meet the above described criteria, are independent
of state subsidies and do not make the subject to public intervention in business stability
d. Group Large Corporates (GLC)
GLC clients are large corporate clients or client groups with an indicative consolidated annual turnover of
at least EUR 500 mio.
GLC clients cover following clients� types in principle:
• Companies with an yearly individual turnover above EUR 500 mio;
• Companies part of a group with a consolidated yearly turnover above EUR 500 mio (regardless of the
company�s individual turnover listed and to be listed state owned companies
e. Commercial Real Estate (CRE)
• Companies that request financing of real estate projects with total project value > EUR 8 mio
(including land acquisition, excluding VAT)
• All RE existing and targeted clients by Group and local RE business, regardless project value
• Investors in RE for the purpose of generating income from the rental of individual properties or
portfolios of properties
• Developers of individual properties or portfolios of properties for the purpose of generating capital
gains through sale.
• Asset management services
• Own development for business purpose
• Commercial Real Estate operating leasing and rental contracts, independently of the tenant (client).
Other corporate includes activities related to investment banking services and financial products and services
Other banking segments:
f. ALM & Local Corporate Center:
• Balance sheet management - principally providing assets and liabilities management, funding and
derivative transactions, investments and issuance of bonds operations;
• Local Corporate Center - unallocated items, items which do not belong to business lines and Free
Capital.
g. Treasury (GMT): - principally providing money market and treasury operations, syndicated loans and
structured financing transactions, foreign currency and derivative transactions, financial instruments
trading.
h. Financial institutions (GMFI): - companies that provide financial services for their clients or
members and act as professional and active participant on financial markets for the purpose of
proprietary trading or on behalf of their clients (banks, central banks, investment banks, investments
funds, brokerages, insurance companies, pension funds, credit unions).
The business segment reporting format is the Group�s basis of segment reporting. Transactions between
business segments are conducted at arm�s length.

Notes to Financial Statements Consolidated and Separate As at 30 June 2019
31
18. SEGMENT REPORTING (continued)
Segment assets and liabilities include items directly attributable to a segment as well as those that can be
allocated on a reasonable basis. Unallocated items mainly comprise property and equipment, intangible
assets, other assets and other liabilities and taxation.
The mapping of individual accounts by main line items of income and expenses, respectively assets and
liabilities and equity, for purposes of segment reporting is done on an internal management approach,
rather than an external financial reporting approach.
In order to split the Group results on business lines the following subsidiaries are allocated entirely on
Retail segment: BCR Pensii SAFPP, Banca pentru Locuinte, Suport Colect and some of the consolidation
adjustments; BCR Leasing and BCR Chisinau are allocated on Corporate. Intragroup eliminations and the
rest of the consolidation adjustments are allocated on Corporate Center.
In geographical segmentation Erste Group shows BCR entirely under geographical area Romania.
Furthermore, the only business done outside Romania is performed by BCR Chisinau, but the
contribution to Balance Sheet and P&L is not material. There is no other geographical steering
information used by BCR management.
Throughout the following tables related to Segment Reporting the net trading result includes the following positions presented in the statement of income:
• Net trading result
• Result from financial assets and liabilities designated at fair value through profit or loss
• Foreign currency translation

Notes to Financial Statements Consolidated and Separate As at 30 June 2019
32
18. Segment reporting (continued)
Income statement Group Retail CorporatesALM & Local
Corporate CenterGM
in RON thousands 30.06.2019
Net interest income 1,110,156 745,868 307,123 52,655 4,510 Net fee and commission income 368,873 251,923 104,520 (3,550) 15,979 Dividend income 2,359 14,086 40 (11,767) - Net trading and fair value result 165,213 48,612 48,543 18,118 49,941 Gains/losses from financial instruments measured at fair value through profit or loss (2,285) (863) (1,856) 434 - Net result from equity method investments (1,555) - - (1,555) - Rental income from investment properties & other operating leases 47,484 - 44,660 2,824 - General administrative expenses (868,214) (621,019) (174,605) (60,807) (11,782)Gains/losses from derecognition of financial assets measured at amortised cost (505) - - (505) - Other gains/losses from derecognition of financial instruments not measured at fair value through profit or loss (29,436) - - (29,436) - Net impairment loss on financial instruments 88,774 (41,530) 119,884 8,615 1,805 Other operating result (769,520) (703,839) (36,346) (26,541) (2,794)Pre-tax profit from continuing operations 111,344 (306,761) 411,961 (51,515) 57,659 Profit from discontinued operations net of tax - Net profit of the year 111,344 (306,761) 411,961 (51,515) 57,659 Taxes on income (132,187) (66,002) (67,265) 10,306 (9,225)Net result for the period (20,843) (372,763) 344,696 (41,210) 48,434 Net result attributable to non-controlling interests 6 - 6 - Net result attributable to owners of the parent (20,849) (372,763) 344,696 (41,216) 48,434
Operating Income 1,690,245 1,059,627 503,029 57,159 70,430
Operating Expenses (868,214) (621,019) (174,605) (60,807) (11,782)
Operating Result 822,031 438,608 328,423 (3,648) 58,648
Cost Income Ratio 51.4% 58.6% 34.7% 106.4% 16.7%

Notes to Financial Statements Consolidated and Separate As at 30 June 2019
33
18. Segment reporting (continued)
Income statement Group Retail CorporatesALM & Local Corporate
CenterGM
in RON thousands 30.06.2018
Net interest income 962,332 664,603 284,144 7,013 6,572
Net fee and commission income 349,442 276,552 91,793 (33,479) 14,576
Dividend income 3,657 - - 3,657 -
Net trading and fair value result 186,073 66,704 47,140 16,930 55,300
Gains/losses from financial instruments measured at fair value through profit or loss 1,751 - (880) 2,631 -
Net result from equity method investments 2,526 - - 2,526 -
Rental income from investment properties & other operating leases 35,840 - 33,358 2,482 -
General administrative expenses (800,689) (601,704) (174,626) (11,561) (12,798)
Other gains/losses from derecognition of financial instruments not measured at fair value through profit or loss 2,221 - - 2,221 -
Net impairment loss on financial instruments 30,131 3,012 19,194 9,327 (1,402)
Other operating result 39,336 1,573 (18,777) 58,571 (2,031)
Pre-tax profit from continuing operations 812,620 410,740 281,346 60,316 60,218
Profit from discontinued operations net of tax -
Net profit of the year 812,620 410,740 281,346 60,316 60,218
Taxes on income (115,618) (55,751) (43,228) (7,004) (9,635)
Net result for the period 697,002 354,989 238,118 53,312 50,583
Net result attributable to non-controlling interests 10 - 10 -
Net result attributable to owners of the parent 696,992 354,989 238,118 53,302 50,583
Operating Income 1,541,621 1,007,859 455,555 1,759 76,448
Operating Expenses (800,689) (601,704) (174,626) (11,561) (12,798)
Operating Result 740,932 406,155 280,929 (9,803) 63,650
Cost Income Ratio 51.9% 59.7% 38.3% 657.3% 16.7%

Notes to Financial Statements Consolidated and Separate As at 30 June 2019
34
18. Segment reporting (continued)
Income statement Bank Retail Corporates
ALM & Local
Corporate
Center
GM
in RON thousands 30.06.2019
Net interest income 1,058,954 733,386 267,850 53,208 4,510 Net fee and commission income 354,128 237,646 103,658 (3,155) 15,979 Dividend income 15,784 14,086 - 1,698 - Net trading and fair value result 163,785 48,734 46,656 18,454 49,941 Gains/losses from financial instruments measured at fair value through profit or loss (2,285) (863) (1,856) 434 - Rental income from investment properties & other operating leases 5,588 - - 5,588 - General administrative expenses (804,005) (598,745) (132,268) (61,210) (11,782)Gains/losses from derecognition of financial assets measured at amortised cost (505) - - (505) - Other gains/losses from derecognition of financial instruments not measured at fair value through profit or loss (29,436) - - (29,436) - Net impairment loss on financial instruments (189,906) (46,275) 124,209 (269,645) 1,805 Other operating result (436,981) 20,147 (27,006) (427,328) (2,794)Pre-tax profit from continuing operations 135,121 408,117 381,242 (711,898) 57,659 Profit from discontinued operations net of tax - - Net profit of the year 135,121 408,117 381,242 (711,898) 57,659 Taxes on income (123,771) (65,299) (60,999) 11,752 (9,225)Net result for the period 11,350 342,818 320,244 (700,146) 48,434 Net result attributable to non-controlling interests - - - - - Net result attributable to owners of the parent 11,350 342,818 320,244 (700,146) 48,434
Operating Income 1,595,954 1,032,990 416,307 76,227 70,430
Operating Expenses (804,005) (598,745) (132,268) (61,210) (11,782)
Operating Result 791,949 434,246 284,040 15,016 58,648
Cost Income Ratio 50.4% 58.0% 31.8% 80.3% 16.7%

Notes to Financial Statements Consolidated and Separate As at 30 June 2019
35
18. Segment reporting (continued)
Income statement Bank Retail CorporatesALM & Local
Corporate CenterGM
in RON thousands 30.06.2018
Net interest income 916,680 656,821 246,209 7,078 6,572
Net fee and commission income 327,028 255,733 90,159 (33,440) 14,576
Dividend income 11,609 - - 11,609 -
Net trading and fair value result 183,203 66,956 43,983 16,964 55,300
Gains/losses from financial instruments measured at fair value through profit or loss 1,751 - (880) 2,631 -
Rental income from investment properties & other operating leases 5,166 - - 5,166 -
General administrative expenses (732,420) (581,887) (133,532) (4,204) (12,798)
Other gains/losses from derecognition of financial instruments not measured at fair value through profit or loss 2,221 - - 2,221 -
Net impairment loss on financial instruments 23,670 (1,346) 26,002 415 (1,402)
Other operating result 32,953 (3,816) (12,453) 51,253 (2,031)
Pre-tax profit from continuing operations 771,861 392,462 259,489 59,693 60,218
Profit from discontinued operations net of tax - -
Net profit of the year 771,861 392,462 259,489 59,693 60,218
Taxes on income (114,976) (56,045) (41,518) (7,778) (9,635)
Net result for the period 656,885 336,417 217,970 51,914 50,583
Net result attributable to non-controlling interests - - - - -
Net result attributable to owners of the parent 656,885 336,417 217,970 51,914 50,583
Operating Income 1,445,437 979,510 379,471 10,007 76,448
Operating Expenses (732,420) (581,887) (133,532) (4,204) (12,798)
Operating Result 713,017 397,624 245,939 5,804 63,650
Cost Income Ratio 50.7% 59.4% 35.2% 42.0% 16.7%
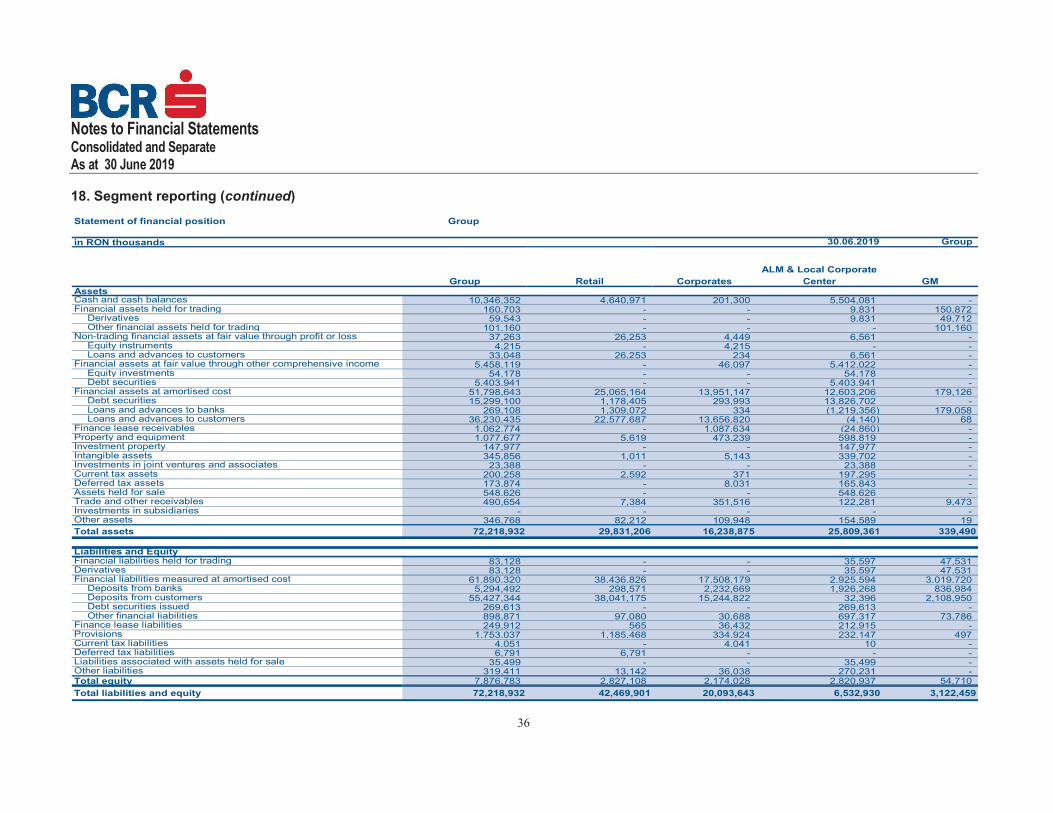
Notes to Financial Statements Consolidated and Separate As at 30 June 2019
36
18. Segment reporting (continued)
Statement of financial position Group
in RON thousands 30.06.2019 Group
Group Retail Corporates
ALM & Local Corporate
Center GMAssetsCash and cash balances 10,346,352 4,640,971 201,300 5,504,081 - Financial assets held for trading 160,703 - - 9,831 150,872
Derivatives 59,543 - - 9,831 49,712 Other financial assets held for trading 101,160 - - - 101,160
Non-trading financial assets at fair value through profit or loss 37,263 26,253 4,449 6,561 - Equity instruments 4,215 - 4,215 - - Loans and advances to customers 33,048 26,253 234 6,561 -
Financial assets at fair value through other comprehensive income 5,458,119 - 46,097 5,412,022 - Equity investments 54,178 - - 54,178 - Debt securities 5,403,941 - - 5,403,941 -
Financial assets at amortised cost 51,798,643 25,065,164 13,951,147 12,603,206 179,126 Debt securities 15,299,100 1,178,405 293,993 13,826,702 - Loans and advances to banks 269,108 1,309,072 334 (1,219,356) 179,058 Loans and advances to customers 36,230,435 22,577,687 13,656,820 (4,140) 68
Finance lease receivables 1,062,774 - 1,087,634 (24,860) - Property and equipment 1,077,677 5,619 473,239 598,819 - Investment property 147,977 - - 147,977 - Intangible assets 345,856 1,011 5,143 339,702 - Investments in joint ventures and associates 23,388 - - 23,388 - Current tax assets 200,258 2,592 371 197,295 - Deferred tax assets 173,874 - 8,031 165,843 - Assets held for sale 548,626 - - 548,626 - Trade and other receivables 490,654 7,384 351,516 122,281 9,473 Investments in subsidiaries - - - - - Other assets 346,768 82,212 109,948 154,589 19
Total assets 72,218,932 29,831,206 16,238,875 25,809,361 339,490
Liabilities and EquityFinancial liabilities held for trading 83,128 - - 35,597 47,531 Derivatives 83,128 - - 35,597 47,531 Financial liabilities measured at amortised cost 61,890,320 38,436,826 17,508,179 2,925,594 3,019,720
Deposits from banks 5,294,492 298,571 2,232,669 1,926,268 836,984 Deposits from customers 55,427,344 38,041,175 15,244,822 32,396 2,108,950 Debt securities issued 269,613 - - 269,613 - Other financial liabilities 898,871 97,080 30,688 697,317 73,786
Finance lease liabilities 249,912 565 36,432 212,915 - Provisions 1,753,037 1,185,468 334,924 232,147 497 Current tax liabilities 4,051 - 4,041 10 - Deferred tax liabilities 6,791 6,791 - - - Liabilities associated with assets held for sale 35,499 - - 35,499 - Other liabilities 319,411 13,142 36,038 270,231 - Total equity 7,876,783 2,827,108 2,174,028 2,820,937 54,710
Total liabilities and equity 72,218,932 42,469,901 20,093,643 6,532,930 3,122,459

Notes to Financial Statements Consolidated and Separate As at 30 June 2019
37
18. Segment reporting (continued)
in RON thousands 31.12.2018 Group
Group Retail Corporates
ALM & Local Corporate
Center* GMAssetsCash and cash balances 11,123,191 5,517,931 159,153 5,446,107 - Financial assets held for trading 213,965 - (1,692) 27,832 187,825
Derivatives 31,062 - (1,692) 27,832 4,922 Other financial assets held for trading 182,903 - - - 182,903
Non-trading financial assets at fair value through profit or loss 39,395 - 6,162 33,233 - Equity instruments 33,475 - 243 33,232 - Loans and advances to customers 5,920 - 5,919 1 -
Financial assets at fair value through other comprehensive income 5,222,081 - 41,079 5,181,002 - Equity investments 40,721 - - 40,721 - Debt securities 5,181,360 - 41,079 5,140,281 -
Financial assets at amortised cost 50,843,219 24,293,222 13,280,180 13,186,757 83,060 Debt securities 15,879,108 1,524,360 307,348 14,047,400 - Loans and advances to banks 123,840 1,094,050 334 (1,050,781) 80,237 Loans and advances to customers 34,840,271 21,674,812 12,972,498 190,138 2,823
Finance lease receivables 990,868 - 1,020,428 (29,560) - Property and equipment 1,169,260 1,408 407,102 760,750 - Investment property 162,806 - - 162,806 - Intangible assets 361,898 3,055 4,736 354,107 - Investments in joint ventures and associates 20,027 - - 20,027 - Current tax assets 181,800 2,592 386 178,822 - Deferred tax assets 202,165 704 8,728 192,733 - Assets held for sale 161,114 - - 161,114 - Trade and other receivables 563,014 19,361 379,842 116,470 47,341 Other assets 275,502 57,530 82,413 135,559 -
Total assets 71,530,305 29,895,803 15,388,517 25,927,759 318,226
Liabilities and EquityFinancial liabilities held for trading 32,988 - 254 27,790 4,944 Derivatives 32,988 - 254 27,790 4,944 Financial liabilities measured at amortised cost 61,618,808 37,499,591 18,140,605 3,536,211 2,442,401
Deposits from banks 5,578,080 228,431 2,083,200 2,672,959 593,490 Deposits from customers 55,098,959 37,205,424 16,013,604 46,881 1,833,050 Debt securities issued 349,153 - - 349,153 - Other financial liabilities 592,616 65,736 43,801 467,218 15,861
Provisions 1,151,688 497,061 411,704 242,457 466 Current tax liabilities 97,782 - 662 97,120 - Liabilities associated with assets held for sale 15,438 - - 15,438 - Other liabilities 246,887 17,570 29,799 199,518 - Total equity 8,366,714 2,631,708 2,111,887 3,561,444 61,675
Total liabilities and equity 71,530,305 40,645,930 20,694,911 7,679,978 2,509,486

Notes to Financial Statements Consolidated and Separate As at 30 June 2019
38
18. Segment reporting (continued)
Statement of financial position
in RON thousands 30.06.2019 Bank
Bank Retail Corporates
ALM & Local Corporate
CenterGM
AssetsCash and cash balances 10,179,024 4,608,299 - 5,570,725 - Financial assets held for trading 161,298 - - 10,426 150,872
Derivatives 60,138 - - 10,426 49,712 Other financial assets held for trading 101,160 - - - 101,160
Non-trading financial assets at fair value through profit or loss 37,030 26,253 4,216 6,561 - Equity instruments 32,815 26,253 - 6,562 - Loans and advances to customers 4,215 - 4,215 - -
Financial assets at fair value through other comprehensive income 5,412,021 - - 5,412,021 - Equity investments 54,178 - - 54,178 - Debt securities 5,357,843 - - 5,357,843 -
Financial assets at amortised cost 49,738,874 22,358,373 12,891,242 14,310,133 179,126 Debt securities 14,066,921 - 240,219 13,826,702 - Loans and advances to banks 280,364 - - 101,306 179,058 Loans and advances to customers 35,391,590 22,358,373 12,651,023 382,126 68
Finance lease receivables 3,241 - - 3,241 - Property and equipment 974,754 - - 974,754 - Investment property 147,977 - - 147,977 - Intangible assets 339,630 - - 339,630 - Investments in joint ventures and associates 17,035 - - 17,035 - Current tax assets 197,295 - - 197,295 - Deferred tax assets 164,713 - - 164,713 - Assets held for sale 106,337 7,255 - 99,082 - Trade and other receivables 480,201 5,962 329,735 135,031 9,473 Investments in subsidiaries 403,152 152,550 - 250,602 - Other assets 185,649 25,144 281 160,205 19 Total assets 68,548,231 27,183,836 13,225,474 27,799,431 339,490
Liabilities and EquityFinancial liabilities held for trading 83,128 - - 35,597 47,531 Derivatives 83,128 - - 35,597 47,531 Financial liabilities measured at amortised cost 58,881,083 36,001,968 14,908,861 4,950,534 3,019,720
Deposits from banks 4,562,358 592 175 3,724,607 836,984 Deposits from customers 53,150,871 35,904,296 14,877,998 259,627 2,108,950 Debt securities issued 269,613 - - 269,613 - Other financial liabilities 898,241 97,080 30,688 696,687 73,786
Finance lease liabilities 245,567 - - 245,567 -
Fair value changes of the hedged items in portfolio hedge of interest rate risk - - - - -
Provisions 1,400,326 441,408 328,279 630,142 497 Current tax liabilities - - - - - Deferred tax liabilities - - - - - Liabilities associated with assets held for sale - - - - - Other liabilities 248,902 - - 248,902 - Total equity 7,689,225 2,750,024 1,921,968 2,962,523 54,710
Total liabilities and equity 68,548,231 39,193,400 17,159,108 9,073,265 3,122,458

Notes to Financial Statements Consolidated and Separate As at 30 June 2019
39
18. Segment reporting (continued)
in RON thousands 31.12.2018 Bank
Bank Retail Corporates
ALM & Local Corporate
Center GMAssetsCash and cash balances 10,862,852 5,380,922 - 5,481,930 - Financial assets held for trading 214,092 - (1,692) 27,959 187,825
Derivatives 31,189 - (1,692) 27,959 4,922 Other financial assets held for trading 182,903 - - - 182,903
Non-trading financial assets at fair value through profit or loss 39,152 - 5,919 33,233 - Equity instruments 33,232 - - 33,232 - Loans and advances to customers 5,920 - 5,919 1 -
Financial assets at fair value through other comprehensive income 5,187,019 - 6,017 5,181,002 - Equity investments 40,721 - - 40,721 - Debt securities 5,146,298 - 6,017 5,140,281 - Debt securities 41,748 - - 41,748 -
Financial assets at amortised cost 48,732,568 21,459,697 12,315,535 14,874,276 83,060 Debt securities 14,297,905 - 250,504 14,047,401 - Loans and advances to banks 388,848 - - 308,611 80,237 Loans and advances to customers 34,045,815 21,459,697 12,065,031 518,264 2,823
Property and equipment 760,646 - - 760,646 - Investment property 162,806 - - 162,806 - Intangible assets 354,020 - - 354,020 - Investments in joint ventures and associates 7,509 - - 7,509 - Current tax assets 178,822 - - 178,822 - Deferred tax assets 197,061 - - 197,061 - Assets held for sale 117,699 - - 117,699 - Trade and other receivables 543,179 17,165 361,554 117,119 47,341 Investments in subsidiaries 403,152 - - 403,152 - Other assets 148,677 - - 148,677 -
Total assets 67,909,254 26,857,784 12,687,333 28,045,911 318,226
Liabilities and EquityFinancial liabilities held for trading 32,988 - (18) 28,062 4,944 Derivatives 32,988 - (18) 28,062 4,944 Financial liabilities measured at amortised cost 58,326,984 34,844,050 15,798,007 5,242,526 2,442,401 Deposits from banks 4,791,204 600 163 4,196,951 593,490 Deposits from customers 52,593,690 34,781,169 15,759,764 219,707 1,833,050 Debt securities issued 349,153 - - 349,153 - Other financial liabilities 592,937 62,281 38,080 476,715 15,861 Provisions 1,120,255 465,661 409,905 244,223 466 Current tax liabilities 97,110 - - 97,110 - Other liabilities 193,842 - - 193,842 - Total equity 8,138,075 2,555,461 1,846,141 3,674,421 62,052
Total liabilities and equity 67,909,254 37,865,172 18,054,035 9,480,184 2,509,863

Notes to Financial Statements Consolidated and Separate As at 30 June 2019
40
19. Related-party transactions and principal shareholders
Parties are considered to be related if one party has the ability to control the other party or exercise significant influence over the other party in making financial or operational decisions. In considering each possible related party relationship, attention is directed to the substance of the relationship, not merely the legal form.
The nature of the related party relationships for those related parties with whom the Group entered into significant transactions or had significant balances outstanding at 30 June 2019 and 31 December 2018 are detailed below. Transactions were entered into with related parties during the course of business at market rates.
Transactions with parent
When establishing the transfer prices in intra-group transactions, BCR takes into account the provisions of the national tax legislation, as well as the OECD transfer pricing guidelines
Transactions with management
The Group entered into a number of banking transactions with the management in the normal course of business.
Key management personnel are those persons having authority and responsibility for planning, directing and controlling the activities of the Group. This includes the members of the Supervisory Board , Executive Committee and executive management. These transactions were carried out on commercial terms and conditions and at market rates.
Remuneration paid related to key management personnel is presented in note 13.
Transactions with subsidiaries
The Bank holds investments in subsidiaries with whom it entered into a number of banking transactions in the normal course of business. These transactions were carried out on commercial terms and conditions and at market rates.
The following transactions were carried out with related parties:

Notes to Financial Statements Consolidated and Separate As at 30 June 2019
41
19. Related-party transactions and principal shareholders (continued)
Group
in RON thousands Parent Associates Key management
personnelOther related parties Parent Associates
Key management
personnelOther related parties
Total assets 268,400 23,388 13,027 32,267 264,000 20,027 10,778 70,534
Cash and cash equivalents 175,852 - - - 104,060 - - -
Derivative financial instruments 12,725 - - - 11,979 - - -
Financial assets at fair value through other comprehensive income - - - - - - - -
Equity investments - 23,388 - 11,635 - 20,027 - 25,113
Loans and advances 79,823 - 13,027 20,632 147,961 - 10,778 45,421
Loans and advances with credit institutions 79,823 - - - 147,961 - - -
Loans and advances with customers - - 13,027 20,632 - - 10,778 45,421
Total liabilities 3,649,039 38,590 10,706 155,528 4,069,091 18,899 8,503 136,934
Deposits 3,571,623 38,590 10,706 155,528 4,037,234 18,899 8,503 136,934
Deposits by banks 3,571,623 - - - 4,037,234 - - 4,590
Deposits by customers - 38,590 10,706 155,528 - 18,899 8,503 132,344
Derivative financial instruments 77,416 - - - 31,857 - - -
Loans commitments, financial guarantees and other commitments given -Irrevocable [notional amount] 10,285 - 412 20,463 14,184 - 412 20,463
Loans commitments, financial guarantees and other commitments given -Revocabile [notional amount] - - - 147,736 - - - 147,736
Loan commitments, financial guarantees and other commitments received 236,755 - - - 947,638 - - -
Derivatives [notional amount] 6,930,712 - - - 5,961,350 - - -
2019 2018
Group
in RON thousands Parent Associates Key management
personnelOther related parties Parent Associates
Key management
personnelOther related parties
Interest income 21,493 - 243 401 29,528 - 197 1,248
Interest expenses (46,283) (316) (9) (2,206) (103,892) (244) (4) (473)
Dividend income - 926 - 1,009 - - - 1,971
Fee and commission income 2,265 1 18 49,534 2,866 1 23 46,784
Fee and commission expenses (5,361) - - (81) (4,910) - - (4,318)
Profit before tax income/(expense) (27,886) 611 252 48,657 (76,408) (243) 216 45,212
2019 2018

Notes to Financial Statements Consolidated and Separate As at 30 June 2019
42
19. Related-party transactions and principal shareholders (continued)
Bank
in RON thousands Parent Subsidiaries Associates Key management
personnelOther related parties Parent Subsidiaries Associates
Key management
personnelOther related parties
Total assets 228,476 757,652 17,035 13,027 32,267 212,633 1,010,341 7,509 10,778 70,534
Cash and cash equivalents 135,928 - - - - 52,693 - - - -
Derivative financial instruments 12,725 - - - - 11,979 127 - - -
Equity investments - 410,408 17,035 - 11,635 - 410,408 7,509 - 25,113
Loans and advances 79,823 347,244 - 13,027 20,632 147,961 599,806 - 10,778 45,421
Loans and advances with credit institutions 79,823 18,361 - - - 147,961 271,512 - - -
Loans and advances with customers - 328,883 - 13,027 20,632 - 328,294 - 10,778 45,421
Total liabilities 2,546,827 1,371,367 38,590 10,706 155,528 2,908,103 1,126,375 18,899 8,503 136,934
Deposits 2,469,411 1,371,367 38,590 10,706 155,528 2,876,246 1,126,375 18,899 8,503 136,934
Deposits by banks 2,469,411 1,200,828 - - - 2,876,246 953,549 - - 4,590
Deposits by customers - 170,539 38,590 10,706 155,528 - 172,826 18,899 8,503 132,344
Derivative financial instruments 77,416 - - - - 31,857 - - - -
Loans commitments, financial guarantees and other commitments given -
Irrevocable [notional amount]10,285 - - 412 20,463 14,184 19,763 - 412 20,463
Loans commitments, financial guarantees and other commitments given -
Revocabile [notional amount]- - - - 147,736 - 296,120 - - 147,736
Loan commitments, financial guarantees and other commitments received 236,755 - - - - 233,195 - - - -
Derivatives [notional amount] 6,930,712 200,295 - - - 5,961,350 74,156 - - -
2019 2018
Bank
in RON thousands Parent Subsidiaries Associates Key management
personnelOther related parties Parent Subsidiaries Associates
Key management
personnelOther related parties
Interest income 21,493 12,895 - 243 401 29,468 7,284 - 197 1,248
Interest expenses (39,962) (14,690) (316) (9) (2,206) (97,524) (8,914) (244) (4) (473)
Dividend income - 12,538 926 - 1,009 - 7,953 - - 1,971
Fee and commission income 2,257 3,378 1 18 49,534 2,862 2,187 1 23 46,784
Fee and commission expenses (2,846) - - - 81 (2,949) (1) - - (4,318)
Profit before tax income/(expense) (19,058) 14,121 611 252 48,819 (68,143) 8,509 (243) 216 45,212
2019 2018

Notes to Financial Statements Consolidated and Separate As at 30 June 2019
43
20. Fair value of financial assets and liabilities
Fair value is the price that would be received to sell an asset or paid to transfer a liability in an orderly
transaction between market participants at the measurement date. The fair value is best evidenced by a
quoted market price, if such exists. Credit Value Adjustment/Debt Value Adjustment is included in the fair
value of derivatives both at 31 December 2018 and 30 June 2019.
Level 1 of the fair value hierarchy
The fair value of financial instruments assigned to level 1 of the fair value hierarchy is determined based
on quoted prices in active markets for identical financial assets and liabilities. More particular, the
evaluated fair value can qualify as a level 1 input if transactions occur with sufficient frequency, volume
and pricing consistency on an ongoing basis.
These include exchange traded derivatives (futures, options), shares, government bonds as well as other
bonds and funds, which are traded in highly liquid and active markets.
Level 2 of the fair value hierarchy
In case a market quote is used for valuation but due to restricted liquidity the market does not qualify as
active (derived from available market liquidity indicators) the instrument is classified as level 2. If no
market prices are available the fair value is measured by using valuation models which are based on
observable market data. If all the significant inputs in the valuation model are observable the instrument is
classified as level 2 of the fair value hierarchy.
For level 2 valuations typically yield curves, credit spreads and implied volatilities are used as observable
market parameters. These include over-the-counter (OTC) derivatives, less liquid shares, bonds and
funds as well as and own issues.
Level 3 of the fair value hierarchy
In some cases, the fair value can be determined neither on the basis of sufficiently frequent quoted market prices nor of valuation models that rely entirely on observable market data. In these cases individual valuation parameters not observable in the market are estimated on the basis of reasonable assumptions.
If any unobservable input in the valuation model is significant or the price quote used is updated infrequently the instrument is classified as level 3 of the fair value hierarchy. For level 3 valuations besides observable parameters typically credit spreads derived from internally calculated historical probability of default (PD) and loss given default (LGD) measures are used as unobservable parameters.
20.1. Financial instruments whose fair value is disclosed in the notes
The following table shows fair values and fair value hierarchy of financial instruments whose fair value is disclosed in the notes for the half year:

Notes to Financial Statements Consolidated and Separate As at 30 June 2019
44
20. Fair value of financial assets and liabilities (continued)
20.1. Financial instruments whose fair value is disclosed in the notes (continued)
30.06.2019
Level 1 Level 2 Level 3 Level 1 Level 2 Level 3
Assets
Cash and cash balances 10,346,352 10,346,352 10,346,352 - - 10,179,024 10,179,024 10,179,024 - -
Financial assets at amortised cost 51,798,643 53,959,376 14,875,682 306,344 38,777,349 49,738,874 51,917,709 13,711,837 262,582 37,943,290
Loans and advances to banks 269,108 271,236 - - 271,236 280,364 282,492 - - 282,492
Loans and advances to customers 36,230,435 38,460,824 - - 38,460,824 35,391,590 37,628,037 - - 37,628,037
Debt securities 15,299,100 15,227,316 14,875,682 306,344 45,290 14,066,921 14,007,180 13,711,837 262,582 32,761
Finance lease receivables 1,062,774 1,062,680 - - 1,062,680 3,241 3,241 - - 3,241
Trade and other receivables 493,065 515,924 - - 515,924 477,790 500,706 - - 500,706
Liabilities
Financial liabilities measured at amortised
cost61,890,320 61,646,348 - 279,822 61,366,526 58,881,083 58,647,643 - 279,822 58,367,821
Deposits from banks 5,294,492 5,324,754 - - 5,324,754 4,562,358 4,603,196 - - 4,603,196
Deposits from customers 55,427,344 55,142,904 - - 55,142,904 53,150,871 52,866,384 - - 52,866,384
Debt securities in issue 269,613 279,822 - 279,822 - 269,613 279,822 - 279,822 -
Other financial liabilities 898,871 898,868 - - 898,868 898,241 898,241 - - 898,241
in RON thousands
Group Bank
Fair value hierarhyCarrying
amountFair value Carrying amount Fair value
Fair value hierarhy

Notes to Financial Statements Consolidated and Separate As at 30 June 2019
45
20. Fair value of financial assets and liabilities (continued)
20.1 Financial instruments whose fair value is disclosed in the notes (continued)
31.12.2018
Level 1 Level 2 Level 3 Level 1 Level 2 Level 3
Assets
Cash and cash balances 11,123,191 11,123,191 11,123,191 - - 10,862,852 10,862,852 10,862,852 - -
Financial assets at amortised cost 50,843,219 52,621,067 15,315,789 217,006 37,088,272 48,732,568 50,539,773 13,816,377 158,127 36,565,269
Loans and advances to banks 123,840 125,628 - - 125,628 388,848 391,703 - - 391,703
Loans and advances to customers 34,840,271 36,861,031 - - 36,861,031 34,045,815 36,072,575 - - 36,072,575
Debt securities 15,879,108 15,634,408 15,315,789 217,006 101,613 14,297,905 14,075,495 13,816,377 158,127 100,991
Finance lease receivables 990,868 990,769 - - 990,769 - - - - -
Trade and other receivables 563,014 563,014 - - 563,014 543,179 543,179 - - 543,179
Liabilities
Financial liabilities measured at amortised cost 61,618,808 61,321,312 - 365,027 60,956,285 58,326,984 58,038,801 - 365,027 57,673,774
Deposits from banks 5,578,080 5,621,747 - - 5,621,747 4,791,204 4,844,361 - - 4,844,361
Deposits from customers 55,098,959 54,741,917 - - 54,741,917 52,593,690 52,236,476 - - 52,236,476
Debt securities in issue 349,153 365,027 - 365,027 - 349,153 365,027 - 365,027 -
Other financial liabilities 592,616 592,621 - - 592,621 592,937 592,937 - - 592,937
in RON thousands
Group Bank
Fair value hierarhyCarrying
amountFair value
Carrying
amountFair value
Fair value hierarhy

Notes to Financial Statements Consolidated and Separate As at 30 June 2019
46
20. Fair value of financial assets and liabilities (continued)
20.1. Financial instruments whose fair value is disclosed in the notes (continued)
The fair value of loans and advances to customers and credit institutions has been calculated by
discounting future cash flows while taking into consideration interest and credit spread effects. The
interest rate impact is based on the movements of market rates, while credit spread changes are derived
from PD�s used for internal risk calculations. For the calculation of fair value loans and advances were
grouped into homogeneous portfolios based on rating method, rating grade, maturity and the country
where they were granted.
The fair values of financial assets held to maturity are either taken directly from the market or they are
determined by directly observable input parameters (i.e. yield curves).
The fair value of issued securities and subordinated liabilities measured at amortized cost is based on
market prices or on observable market parameters, if these are available, otherwise it is estimated by
taking into consideration the actual interest rate environment and in this case they are allocated to Level
2.
The fair value of deposits and other financial liabilities measured at amortized cost is estimated by taking into consideration the actual interest rate environment and own credit spreads, and these are allocated to Level 3.

Notes to Financial Statements Consolidated and Separate As at 30 June 2019
47
20. Fair value of financial assets and liabilities (continued)
20.2. Financial instruments measured at fair value in the statement of financial position
Group
in RON thousands
Assets 30.06.2019 31.12.2018 30.06.2019 31.12.2018 30.06.2019 31.12.2018 30.06.2019 31.12.2018Financial assets - held for trading 101,160 178,095 57,355 33,738 2,188 2,132 160,703 213,965
Derivatives - - 57,355 28,930 2,188 2,132 59,543 31,062Other financial assets held for trading 101,160 178,095 4,808 - - 101,160 182,903
Non-trading financial assets at fair value through
profit or loss- 2,400 2,548 - 34,715 36,995 37,263 39,395
Equity instruments 2,400 2,548 - 30,500 31,075 33,048 33,475Loans and advances - - - - 4,215 5,920 4,215 5,920
Financial assets at fair value through other
comprehensive income5,350,969 5,031,042 45,627 144,301 61,523 46,738 5,458,119 5,222,081
Equity instruments - - - - 54,178 40,721 54,178 40,721Debt securities 5,350,969 5,031,042 45,627 144,301 7,345 6,017 5,403,941 5,181,360
Total assets 5,452,129 5,211,537 105,530 178,039 98,426 85,865 5,656,085 5,475,441
LiabilitiesFinancial liabilities - held for trading - - 83,128 32,988 - - 83,128 32,988
Derivatives - - 83,128 32,988 - - 83,128 32,988Total liabilities - - 83,128 32,988 - - 83,128 32,988
Quoted market prices in active
markets Level 1
Marked to model based on
observable market data Level 2
Marked to model based on
non-observable inputs
Level 3
Total
Bank
in RON thousands
Assets 30.06.2019 31.12.2018 30.06.2019 31.12.2018 30.06.2019 31.12.2018 30.06.2019 31.12.2018Financial assets - held for trading 101,160 178,095 57,950 33,864 2,188 2,133 161,298 214,092
Derivatives - - 57,950 29,056 2,188 2,133 60,138 31,189Other financial assets held for trading 101,160 178,095 4,808 - - 101,160 182,903
Non-trading financial assets at fair value through
profit or loss- 2,400 2,549 - 34,481 36,752 37,030 39,152
Equity instruments 2,400 2,549 - 30,266 30,832 32,815 33,232Loans and advances - - - 4,215 5,920 4,215 5,920
Financial assets at fair value through other
comprehensive income5,350,969 5,031,042 - 109,239 61,052 46,738 5,412,021 5,187,019
Equity instruments - - - - 54,178 40,721 54,178 40,721Debt securities 5,350,969 5,031,042 - 109,239 6,874 6,017 5,357,843 5,146,298
Total assets 5,452,129 5,211,537 60,499 143,103 97,721 85,623 5,610,349 5,440,263
LiabilitiesFinancial liabilities - held for trading - - 83,128 32,988 - - 83,128 32,988
Derivatives - - 83,128 32,988 - - 83,128 32,988Total liabilities - - 83,128 32,988 - - 83,128 32,988
Quoted market prices in active
markets Level 1
Marked to model based on
observable market data Level 2
Marked to model based on
non-observable inputs
Level 3
Total
Non-trading financial assets at fair value position includes:
- loans and advances to customers classified at fair value through profit and loss according to IFRS 9 due to failure to pass the SPPI (solely payments of principal and interest) test.
The methodology to compute the fair value of these assets corresponds to the basic present value technique where expected cash flows of assets are discounted by the full rate including credit risk, market risk and cost components. The credit risk is incorporated in the assessment of cash flows in order to come to expected cash flows accounting for customer�s probability of default. These cash flows are then adjusted with the discount rate.
- equity instruments, in principal minority interests classified as level 3 instruments for which the fair value is determined based on internal assessment. The most common valuation methods used in the evaluation of minority interest are: Quoted price in active markets, Expert opinion or Recent transaction value, Discounted Cash Flow Method / Dividend Discount Model, the adjusted Net Asset Value, Simplified income approach.
Notes to Financial Statements Consolidated and Separate As at 30 June 2019
48
20. Fair value of financial assets and liabilities (continued)
20.3. Valuation of level 3 financial instruments
Financial assets at fair value through other comprehensive income includes:
- Debt securities issued by Ministry of Finance which are actively traded classified on level 1 and 2.- Visa INC Preferred Share equity for which fair value is computed based on internal assessment
and one corporative bond which is theoretically priced are presented on level 3.
The volume of level 3 financial assets can be allocated to the following two categories:
� Market values of derivatives where the credit value adjustment (CVA) has a material impact and is calculated based on unobservable parameters (i.e. internal estimates of PDs and LGDs);
� Illiquid bonds, shares and funds not quoted in an active market where either valuation models with non-observable parameters have been used (e.g. credit spreads) or broker quotes have been used that cannot be allocated to Level 1 or Level 2.
The unobservable inputs from CVA calculation are the probability of default (PD) and loss given default (LGD). The probabilities of default are the result of the rating models development internally (at ERSTE Group level) and are used to evaluate the credit risk including CVA.
According to the allocated rating, each counterparty has assigned a probability of default. The value of LGD parameter for the calculation of CVA is 60%.
In order to mark to market the municipal bonds in Fair Value Hierarchy, the bank proceeds as follows:
� Municipal bonds evaluated in Calypso application using market data stored (yield curves)
� To the yield curve, a margin which incorporates the credit risk of each debt issuer is added
As at June 2019, the fair valuation of VISA Inc preferred shares was based on reasonable assumptions and estimations and was consequently classified in level 3.
The shares cannot be sold before a minimum holding period of 12 years and are limited to certain conditions which may restrict the conversion of preferred shares into tradable VISA Inc shares.
Due to these limiting conditions the fair value of the preferred shares was capped based on assumptions compared to free tradable VISA Inc. class A common shares.
The price of class C common shares was determined based on the conversion ratio of 1:13,952 and an additional haircut of 15%.

Notes to Financial Statements Consolidated and Separate As at 30 June 2019
49
20. Fair value of financial assets and liabilities (continued)
20.3. Valuation of level 3 financial instruments (continued)
Movements in Level 3 of financial instruments carried at fair value
Group
in RON thousands
Gain/loss in
profit or
loss
Gain/loss in
other
comprehen
sive income
SalesCurrency
translation
Assets 01.01.2019 - - - - 30.06.2019
Financial assets - held for trading 2,133 55 - - - 2,188
Derivatives 2,133 55 - - - 2,188
Non-trading financial assets at fair value through
profit or loss36,995 (2,280) - - - 34,715
Equity instruments 31,075 (575) - - 30,500
Loans and advances 5,920 (1,705) - - - 4,215
Financial assets at fair value through other
comprehensive income46,738 - 14,785 - - 61,523
Equity instruments 40,721 - 13,457 - - 54,178
Debt securities 6,017 - 1,328 - - 7,345
Total assets 85,866 (2,225) 14,785 - - 98,426
Group
in RON thousands
Gain/loss in
profit or
loss
Gain/loss in
other
comprehen
sive income
SalesCurrency
translation
Assets 01.01.2018 30.06.2018
Financial assets - held for trading 2,875 (281) - - - 2,594
Derivatives 2,875 (281) - - - 2,594
Non-trading financial assets at fair value through
profit or loss39,118 2,060 - (3,628) 10 37,560
Equity instruments 18,509 2,480 - - 10 20,999
Loans and advances 20,609 (420) - (3,628) - 16,561
Financial assets at fair value through other
comprehensive income33,846 - 6,748 - - 40,594
Equity instruments 33,846 - 6,748 - - 40,594
Total assets 75,839 1,779 6,748 (3,628) 10 80,748

Notes to Financial Statements Consolidated and Separate As at 30 June 2019
50
20. Fair value of financial assets and liabilities (continued)
20.3. Valuation of level 3 financial instruments (continued)
Bank
in RON thousands
Gain/loss in
profit or
loss
Gain/loss in
other
comprehen
sive income
SalesCurrency
translation
Assets 01.01.2019 30.06.2019
Financial assets - held for trading 2,133 55 - - - 2,188
Derivatives 2,133 55 - - - 2,188
Other financial assets held for trading - - - - -
Non-trading financial assets at fair value through
profit or loss38,885 2,060 - - 34,481
Equity instruments 30,832 (566) - - - 30,266
Debt securities - - - - -
Loans and advances 5,920 (1,705) - - 4,215
Financial assets at fair value through other
comprehensive income46,738 - 14,314 - - 61,052
Equity instruments 40,721 - 13,457 - - 54,178
Debt securities 6,017 - 858 - - 6,874Loans and advances - - - - -
Total assets 87,756 2,115 14,314 - - 97,721
Bank
in RON thousands
Gain/loss in
profit or
loss
Gain/loss in
other
comprehen
sive income
SalesCurrency
translation
Assets 01.01.2018 30.06.2018
Financial assets - held for trading 2,875 (281) - - - 2,594
Derivatives 2,875 (281) - - - 2,594
Non-trading financial assets at fair value through
profit or loss38,885 2,060 - (3,628) - 37,317
Equity instruments 18,276 2,480 - - - 20,756
Loans and advances 20,609 (420) - (3,628) - 16,561
Financial assets at fair value through other
comprehensive income33,846 - 6,748 - - 40,594
Equity instruments 33,846 - 6,748 - - 40,594Total assets 75,606 1,779 6,748 (3,628) - 80,505

Notes to Financial Statements Consolidated and Separate As at 30 June 2019
51
21. Legal claims and contingent liabilities
As at 30 June 2019, the Bank was involved in the normal course of its business in a number of 3,482
other litigation as defendant.
In the opinion of management, after taking appropriate legal advice from Legal Department/external
lawyers/consultants, by case, the outcome of these legal claims will not give rise to any significant loss
beyond the amount provided at 30 June 2019.
The audit mission of the Romanian Court of Accounts � BCR Banca pentru Locuinte (BpL)
In 2015, the Romanian Court of Accounts (hereinafter referred to as �the CoA�) conducted a control at the
BpL. Following the mission, the CoA claims that several deficiencies were identified, the vast majority
grounded on a different interpretation of the applicable legal provisions.
On 15 December 2015, the CoA issued the Decision no. 17, maintaining all the claims included in their
initial report and requested BpL to establish exactly the amount of the prejudice. On December 23, 2015,
BpL appealed the Decision no. 17 of the CoA, appeal that was rejected by the Commission for Solving
Claims of the CoA through Decision No 2/29 February 2016, maintaining as such the Decision no. 17.
BpL submitted to the Court of Appeal an action for annulment of the decision of CoA.
Court of Appeal pronounced its resolution on March 1st 2017 and decided in favour of BCR Bpl for 5 out
of 8 claims. Both BpL and CoA filed second appeal against this decision and, on June 24, 2019 High
Court of Justice (HCJ) decided as follows:
- Both second appeals were admitted and the decision of the first court was annulled; as a consequence, the HCJ re-judged the request of BCR BpL and annulled only two measures, maintaing 6 of them.
- The maintained measures regard the incorrect calculation of State premium by BpL.
- As a consequence, BPL will need to establish all the amounts that should be returned to the
State, in accordance with the Court of Justice final decision (consisting of state premiums,
interest and penalties). The most probable future outflow of resources was estimated and booked
as a provision as of 30.06.2019, in accordance with IAS 37 requirements.Moreover, consideration
was given as to whether other payment obligations could arise in connection with this fact,
including possible withholding tax on the amounts already released to the clients as state
premiums. For the latter, BpL Management concluded that the information available is
insufficient, no reliable estimate of the amount required to settle the obligation could be
computed out of it and , therefore, no related provision was booked as of 30.06.2019.
The financial impact is described in Note 9 � Provisions and Note 16 � Taxes on Income.
Tax litigations
Transfer pricing
During the period May 3rd 2016 � July 9th 2017, BCR was subject to a tax audit regarding Corporate Income Tax and VAT for the period January 1st 2012 � December 31st 2015. The main aspect verified by the Romanian Tax authorities were the intragroup transactions performed by BCR with its related parties during the analyzed period, mainly the financial transactions.
Based on the fiscal audit performed, the Romanian tax authorities established an additional corporate income tax expense of RON 102.581.852 as at 30th of June 2017, for the entire audited period 2012 � 2015. The additional corporate income tax due was added to the existing amounts as at 30th of June 2017.

Notes to Financial Statements Consolidated and Separate As at 30 June 2019
52
21. Legal claims and contingent liabilities (continued)
During the period April 10th 2019 � April 22nd 2019, BCR was subject to a partial tax audit in respect of withholding tax due for incomes obtained by nonresidents in Romania, for the period January 1st 2014 � December 31st 2015. On May 15th 2019, BCR received the Tax Audit report and the Fiscal decision, issued based on the Tax audit performed. Thus, the Romanian tax authorities established an additional withholding tax due in respect of RON 43,070,398, representing withholding tax on incomes obtained by nonresidents in Romania, in relation to interest revenues of RON 226,119,588 paid by BCR to Erste and considered by the Romanian tax authorities as being overpriced, according to the transfer pricing adjustments made by the Romanian tax authorities during the tax audit closed on 2017.
Regarding the part of the tax authorities� findings in the tax audit report closed in 2017 regarding the transfer prices used in transactions performed by BCR and Erste, BCR initiated the MAP procedure within the EUAC, considering that the adjustment of the transfer prices set by Romanian tax authorities for 2012 � 2015 has generated double taxation in Austria and Romania.
Considering the Romanian tax authorities decision to adjust the taxable base of corporate income tax, respectively to impose an additional corporate income tax for the period 2012 � 2015, the Bank has analyzed the necessity of booking a provision for a potential obligation regarding additional corporate income tax for the period 2016 � 2018.
According to IAS 37 �Provisions, contingent assets and liabilities�, a provision is recognized if the following conditions are meet: � The company has a current obligation resulting from past events; � It is probable that an outflow of economic resources to be necessary in order to close this obligation; � The value of the obligation can be adequately estimated.
According to the external consultants and lawyers� opinion and based on the available information and analysis, the Bank�s Management appreciates that there are more likely than not chances for a favorable solution against the Romanian tax authorities.
Considering the results of the analyzed performed by the Bank�s Management as mentioned above, based on which it is not probable that an outflow of economic resources to occur in the future, and based on the provisions of IAS 37 �Provisions, contingent assets and liabilities�, it was concluded that as at June 30th 2019, the conditions necessary for booking a provision in relation to a possible obligation resulted from the fiscal treatment of the intragroup transactions applied by the Bank during 2016 � 2018, are not met.
Impairment of subsidiaries
In 2017 during the tax audit performed by the tax authorities, the Management of the Bank requested deductibility in relation to expenses generated by depreciation of shares in subsidiaries booked for the period 2012 � 2015, considering the provisions of the Fiscal code applicable for these periods.
In accordance with the legal provisions in force, during the analyzed period it is mentioned that the impairment on the financial assets are deductible for fiscal purposes. The fiscal legislation did not contain any restriction in this case, this interpretation being sustained by the substantiation note of the changes to the fiscal code and by the fiscal guide for the transition to IFRS.
The tax authorities challenged the arguments of the Bank�s Management and considered that the impairment allowances booked are nondeductible. The Bank�s Management has retained the aforementioned position and included the related amounts in the appeal submitted to the tax authorities.

Notes to Financial Statements Consolidated and Separate As at 30 June 2019
53
21. Legal claims and contingent liabilities (continued)
According to the external consultants and lawyers� opinion and based on the available information and analysis, the Bank�s Management appreciates that there are more likely than not chances for a favorable solution against the Romanian tax authorities. Thus, an asset of the nature of the profit tax, in relation to expenses with the depreciation of shares in subsidiaries booked for the period 2012 � 2015, considered deductible expenses according to the Fiscal code provisions in force for that period, was recognized in 2017. This asset was subject to independent successive evaluations in the period that followed, being maintained both at the end of 2018 and on June 30th 2019. We mention that until the final settlement of the dispute, the Bank did not reclassify these expenses as deductible.
The Management of the Bank challenged the tax audit results, using all the existing legal ways, the tax appeals being ongoing.
BFP Litigation
On 23 December 2016, BFP received a request filed by City Hall Bucharest to the International Court of Arbitration of the International Chamber of Commerce; the claim consisting in the amounts resulted from the joint venture contract, for the period from 2001 to 2013. The lawyers� assessment is that there are over 50% chances for BFP to obtain a favourable solution. In April 2019, in Bucharest, took place the hearings in this case. On July 01, 2019 the parties filed the closing statements. The Court didn�t set a date for the final decision.
Up to the date of publishing these financial statements, there were no other significant updates related to the cases presented in the financial statements for the year ended 31 December 2018.
22. Subsequent events
On 9th of July 2019, BCR paid the amount of RON 673 million to BPL for capital needs. Subsequently, capital increase provided to BpL was fully impaired and BpL repaid to BCR an amount of RON 191 million of the existing loan.
BCR BpL received on 18th of July 2019 the motivation of the High Court of Justice decision. Currently the Bank is reviewing it in order to assess what will be the next steps. Most likely, extraordinary appeal(s) and international legal actions will follow in due time.
The Bank does not due the tax on financial assets in the first semester of 2019, considering the conditions of reducing the tax due according to GEO 19/2019, article 87, para 5. Considering that the indicator �loan granted to households and non financial corporations growth� exceeds half of the yearly target of 4% in accordance with the above mentioned article, the tax is not due and declared in the first semester of 2019.