banco de oro universal bank provides a · banco de oro universal bank provides a wide range of...
TRANSCRIPT

Banco de Oro Universal Bank provides a wide range of commercial and investment banking services in the Philippines. These services include the traditional loan and deposit products, as well as treasury, trust, capital markets, cash management, insurance, and credit card services.
The Bank’s strategic focus is on becoming the preferred bank in its chosen markets in the Philippines. The Bank’s principal markets consist of a select group of large corporations and financial institutions, and geographic niches in the middle-market banking segment (consisting of mid-size corporations and small- and medium-sized enterprises), and the retail/consumer market. The Bank plans to pursue its growth strategy through selective acquisition and/or organic growth. BDO will continue to maintain its focused approach in seeking new markets and developing products for those markets.

B A N C O D E O R O2
C o r e Va l u e s
Commitment to Customers
We are committed to deliver products andservices that surpass customer expectations
in value and every aspect of customer service,while remaining to be prudent and
trustworthy stewards of their wealth.
Commitment to aDynamic and Efficient Organization
We are committed to creating an organizationthat is flexible, responds to change andencourages innovation and creativity.
We are committed to the process of continuous improvement in everything we do.
Commitment to Employees
We are committed to our employees’growth and development and we will nurture them
in an environment where excellence, integrity, teamwork, professionalism and performance are
valued above all else.
Commitment to Shareholders
We are committed to provideour shareholders with superior returns
over the long term.
C o r p o r a t e M i s s i o n
To be the preferred bank in every market we serve by consistently providing innovative products and flawless delivery of services, proactively reinventing
ourselves to meet market demands, creating shareholders value through superior returns, cultivating in our people a sense of pride and ownership, and
striving to be always better than what we are today... tomorrow.
M a n a g e m e n t D i r e c t o r yA s o f D e c e m b e r 3 1 , 2 0 0 5
in ‘000
2 0 0 5 A N N U A L R E P O RT 3
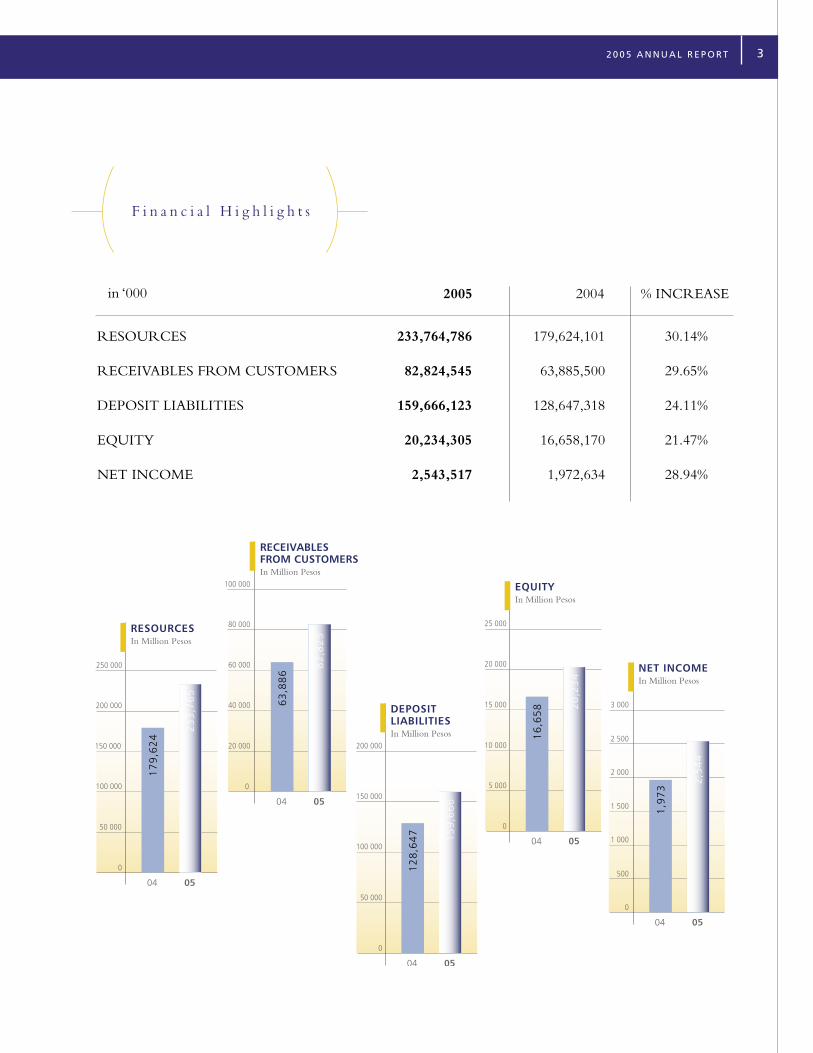
F i n a n c i a l H i g h l i g h t s
2005 2004 % INCREASE
RESOURCES 233,764,786 179,624,101 30.14%
RECEIVABLES FROM CUSTOMERS 82,824,545 63,885,500 29.65%
DEPOSIT LIABILITIES 159,666,123 128,647,318 24.11%
EQUITY 20,234,305 16,658,170 21.47%
NET INCOME 2,543,517 1,972,634 28.94%

B A N C O D E O R O4
M e s s a g e f r o mt h e C h a i r m a n
M e s s a g e f r o m t h e C h a i r m a n E m e r i t u s
Over the past years, we have made significant progress
in developing Banco de Oro into one of the best
banks in the Philippines. This year marks another
milestone in the development of Banco de Oro.
We registered record profits of P2.54 billion and, based on
resources, Banco de Oro is now the fifth largest bank in the
country. Despite the rapid growth, the balance sheet remains
among the strongest. It boasts of a high capital ratio and the
lowest non-performing asset level among universal banks. We
continue to build on our programs for Corporate Governance.
I have often said that success does not happen overnight,
and Banco de Oro’s success is no different. Its performance has
been marked with consistent growth and quality profits, earning
it recognitions from the international investing community.
Asiamoney awarded it as the Best Managed Company - Medium
Cap category and Euromoney awarded it as the Commercial Bank
of the Year in the Philippines. Most recently, Finance Asia cited it
as among the best managed companies in the Philippines.
Let me take this opportunity to say thank you to all the
people who have made this success possible. To our customers,
thank you for your continued support and patronage, to our
officers and staff, thank you for your commitment, dedication and
contributions, and to my fellow shareholders, thank you for your
trust. Together, we are on our way to making Banco de Oro the
best bank in the country.
Henry Sy, Sr.Chairman Emeritus

2 0 0 5 A N N U A L R E P O RT 5
M e s s a g e f r o mt h e C h a i r m a n
M e s s a g e f r o m t h e C h a i r m a n E m e r i t u s
I t has always been our goal to make Banco de Oro the best
bank in the Philippines. While we still have a long way to go,
we are certainly making good strides in that direction. 2005
was another banner performance for the Bank with profits of
2.54 bn, continuing the earnings momentum that has been building
up the last few years. In terms of resources, the Bank is now among
the top five in the industry. Asset quality and balance sheet remains
strong. In terms of business mix, we have been able to build business
lines that now rank among the leaders in their respective fields. No
less than three prestigious publications – Asiamoney, Euromoney and
Finance Asia – recognize it as among the best managed institution in
the country, an honor we all should be proud of.
The Bank’s performance notwithstanding, we also realize that
the financial services industry is changing rapidly. New international
reporting standards, BASEL 2, and the fast-paced development of
products and technology are all pushing banks to make adjustments
in order to survive. At SM Investments Inc. (SMIC), we are cognizant
of the implications of these changes. While we have made substantial
progress through organic growth, we cannot turn away opportunities
that may present themselves along the way. It is for this reason that
we seized the opportunity to take a strategic stake in Equitable PCI
(EPCI) last year. We view the potential partnership between BDO
and EPCI as transformational for both and will create an institution
that can vie for leadership in the Philippine banking industry.
Whether this develops or not however, BDO will not wait idly for
things to unfold. With the United Overseas Bank Philippines acquisition
and the developments in its business lines, BDO will not run out of
opportunities to cover. It will continue to create its own growth path
with or without the EPCI merger. In the meantime, I am delighted that
the Bank moves from strength to strength with the passage of time.
To the officers and staff of BDO, congratulations on a job
well done. Rest assured that whichever direction BDO takes,
SMIC will be there to support it. Teresita T. SyChairman*
*until August 5, 2005

B A N C O D E O R O6
Nestor V. TanPresident
“The Bank has been judged among the best managed companies for 2005 by three prestigious publications- Asiamoney, Euromoney and Finance Asia. Their consensus view is the best recognition of our performance for 2005. For that, we thank you - our shareholders, customers, officers and staff - for your continued support and trust.”

Asia Money 2006 Awards for“Best Managed Company(Medium-Cap Category)”
EuroMoney 2005 Real Estate Awards for“Commercial Banking in the Philippines”
2 0 0 5 A N N U A L R E P O RT 7
M e s s a g e f r o m t h e P r e s i d e n t
The year 2005 was another banner year for Banco de Oro (BDO). We
recorded a net income of Php 2.54bn, the highest in the Bank’s history and
an increase of 29% over 2004 figures. Resources likewise increased by 30%
to Php 233.7bn, enough to make the Bank the fifth largest in the country.
Beyond the headline numbers is also a strong performance by the Bank across all
business lines. Despite the uncertain economic environment, we have been able to keep
our growth and development targets on track. Loans and deposits have grown 36% and
24% respectively, outpacing the industry in a big way. Consumer lending now comprises
a meaningful share of our loan portfolio. Our fee generating businesses continue to
be strong. Our trust, transaction banking, and investment banking businesses are now
considered among the leaders in the industry and making major contributions to profit.
Remittances and bancassurance are starting to achieve critical mass. Our balance sheet is
among the strongest in the industry .
Beyond organic growth, we also made strategic moves to further fuel our long-term
growth. We acquired the 66-strong retail branch network of United Overseas Bank
Philippines to strengthen our distribution network. Together with SM Investments
Corporation, we took a strategic stake in Equitable PCI Bank (EPCI) and Equitable
Card Network Inc., paving the way for future cooperation and partnership between
the two banks. A merger of BDO and EPCI would create a dominant industry player
with market leadership in a number of business lines. On the capital markets side, we
made preparations and had a successful issue in 2006 of our Global Depository Receipts
(GDRs). These GDRs are listed in the London Stock Exchange, creating another venue
for capital raising should the need arise.
Our progress has not gone unnoticed. The Bank has been judged among the best
managed companies for 2005 by three prestigious publications- Asiamoney, Euromoney
and Finance Asia. Their consensus view is the best recognition of our performance for
2005. For that, we thank you - our shareholders, customers, officers and staff - for your
continued support and trust.
Accolades however, reward what we have accomplished. It is by no means a guarantee
of good performance in the future. We should and will continue to build on our success.
There is still a lot of room for us to improve and we remain committed to making
Banco de Oro Universal Bank the best bank in the country.
B A N C O D E O R O8
R e v i e w o f 2 0 0 5 O p e r a t i o n s
Despite the political and economic uncertainties in the local and global markets, the
Philippines registered a respectable performance in 2005, proof of the economy’s resilience
and sustainability. Gross Domestic Product expanded by 5.1%, much higher than what most
economists and analysts had expected. The fiscal deficit, targeted to reach P180 billion
or 3.4% of GDP, amounted to only P146.5 billion or just 2.7%. The Balance of Payments
turned in a huge surplus of $2.4 billion, much higher than the optimistic estimates of
government and a huge reversal of the $280 million deficit in 2004. Gross International
Reserves hit a record high of $18.5 billion, boosted by the record-breaking $10.7 billion
in OFW remittances. The negative factors were the slowdown in agriculture, as the El
Nino hit the country last summer, and the weak performance of exports, particularly of
electronics components.
Foreign Exchange Rate
The peso broke below the P53.00 level as early as the first quarter of 2005, but the
political crisis and the delay in the passage of the EVAT dragged down the peso back to
the P56.00 level by the third quarter. However, the peso still
managed to recover strongly in the last two months, closing
the year at P53.090. Robust inflows of OFW remittances and
net foreign investments, coupled with the overall mending of
confidence in the economy’s prospects, provided additional
strength. These inflows also contributed to the hefty surplus
in the country’s balance of payments. All in all, these
developments resulted in the peso being the best performing
currency in the region last year.
Interest Rates
Domestic interest rates followed a steep downward trend in
2005, attributable to high system liquidity and the BSP’s prudent but still relatively
loose monetary policy. The banking system was awash with money on the back
of the double-digit expansion rate in domestic liquidity (M3) as of the third
quarter and continued weak private sector demand for credit. Moreover, banks bid
aggressively for the limited supply of government debt papers after the scheduled
auctions in December were cancelled due to the improved fiscal position. Likewise,
2 0 0 5 A N N U A L R E P O RT 9
with inflation easing in December, the peso appreciating, and the US Fed perceived
to be ending its tightening cycle, the BSP considered it unnecessary to raise its own
policy rates any further.
Prices
Inflation was on a mild downturn starting in the second half of
2005 after staying at 8.5% for most of the first semester. This
downturn can be largely attributed to the high-base effect in
2004 and, to a certain extent, the delayed implementation of the
EVAT law, which finally took effect in November. By then, world
oil prices, initially feared to be the main source of inflationary
pressure, were already falling after peaking in August-September,
thereby mitigating the impact of the EVAT.
P ro s p e c t s f o r 2 0 0 6
The Philippine economy is off to a good start this 2006: the peso is expected to
continue regaining lost ground, fuelled by the resurgence of investor and creditor
confidence in the country while interest rates are seen to remain low, stable, and thus
conducive to heightened business activity. The upbeat mood on the country rests
largely on expectations that the government will remain on-track in solving its fiscal
problems, not only with the effective implementation of the revised Value Added
Tax system starting last February, but more importantly by way of improved revenue
collection in general.
Foreign Exchange Rate
For 2006, the following factors will essentially dictate the peso’s direction: the Federal
Reserve’s actions on US interest rates, BSP’s own interest rate policy, magnitude of inflows
from OFW remittances and investments vis import payment requirements, perceptions on
the sustainability of fiscal reforms, and the political backdrop.
B A N C O D E O R O10
Interest Rates
For this year, the dominant variable affecting the short-term direction of interest rates is
once again market liquidity. Given this, a soft interest rate environment is expected for
most of the year especially if the government meets its fiscal objectives. A mild upward
correction may be seen though once the BSP steps in to raise interest rates slightly,
possibly in the second semester should consecutive hikes in US Fed rates occur, along
with the expected weakening of the peso in the third quarter due to the import season.
The main caveat would be a fiscal downturn, as well as external shocks such as the threat
of renewed political volatility or another spike in world oil prices resulting in the build-up
of inflationary pressures.
Prices
For 2006, inflation is expected to remain high, around the same average posted in 2005.
The biggest upside risk comes from the cost-push effects generated by the higher VAT
rate imposed last February, and speculation governing world crude oil prices. Together,
these two will likely raise inflationary expectations in the near term. However, inflation
should subside in the second semester, again due to the high computational base during
the same period last year. Likewise expected to temper price pressures is the improved
outlook on food prices with the end of the El Nino. The strong peso can also help ease
inflationary pressures as the costs of imported inputs decline.
B a n c o D e O ro O p e r a t i o n a l H i g h l i g h t s
Banco de Oro had another banner year in 2005, posting a 29% increase in Net Income
to P2.54B. This translates to a Return on Average Equity (ROE) of 13.8% compared
to 12.4% the previous year. The Bank experienced good performance from all of its
business lines, fuelled by exceptionally strong loan and deposit growth, substantial
gains from fee-based services, new products launched and increased market coverage.
Significant growth was seen while the overall quality of the balance sheet was
2 0 0 5 A N N U A L R E P O RT 11
maintained. The implementation of new, more stringent financial reporting standards
did not adversely affect the Bank’s balance sheet, and non-performing loans (NPL)
and non-performing assets (NPA) ratios still remain among the best in the industry.
Capital Adequacy Ratio was still comfortable at 18.3% despite the exceptional loan
growth in 2005.
The Bank likewise embarked on a number of strategic initiatives in 2005:
• Acquisition of the banking business of United Overseas Bank Philippines
(UOBP). This comprised 66 branch licenses and approximately P11B in
deposits. This transaction also creates opportunities for strategic partnerships
in the areas of trade finance, private banking and consumer lending.
• Acquisition of stakes in Equitable PCI Bank (EPCI) & Equitable Card Network
Inc. (ECNI) in partnership with SM Investments Corporation (SMIC). This
gives BDO and the SM Group a foothold in an
institution that could provide significant synergies for
BDO’s major businesses. A merger with EPCI would
transform BDO into a dominant industry player,
possessing market leadership and operational scale
while enhancing shareholder value through a potential
re-rating in the share price and reduced funding
cost.
• Opening of the first BDO Onsite outlet, which
provides clients an additional venue to access ancillary
services even beyond the regular banking hours. These
services include foreign exchange, remittances, acceptance of bills payment,
inquiries on consumer loans, and application drop-off for consumer loans and
insurance products.
• Launch of BDO Rewards, the first multi-product bank loyalty program that
aims to reward customers for maintaining a banking relationship with BDO.
BDO Rewards aims to provide the best loyalty program in the country with its
superior and flexible features.

B A N C O D E O R O12

2 0 0 5 A N N U A L R E P O RT 13
Account Management
Corporate Banking implemented organizational initiatives in 2005 aimed at transforming
the Group into industry specialists, and further bolstering their relationship management
role. Corbank was able to grow its portfolio by 38%, with an increase in its client base and
expanded banking relationships with existing clients.
Commercial Banking on the other hand, registered a portfolio growth of 16% in 2005.
The increased branch network, coupled with the establishment of additional Regional
Lending Offices, provided more opportunities for identifying and tapping potential loan
clients specially in areas outside Metro Manila.
Consumer Lending
Consumer Lending, composed of the mortgage, auto finance,
credit card and personal loan businesses, established a major
presence in the retail market, as portfolio levels almost tripled in
2005. Consumer Loans, which accounted for less than 3% of
total loans in 2004, now comprises approximately 7% of total,
with rapid growth experienced across all product segments.
Credit Cards outstanding more than doubled to over 140,000
with the launch of new credit card variants, designed for specific market segments. Home
Mastercard, a co-branded credit card with Meralco, was launched in October 2005
targeting homemakers and meant to be used for household expenses such as utility bills
as well as other home essentials and needs. BDO Gold Mastercard was launched in
November 2005 and is aimed at the up and coming young professionals on their way up
the corporate ladder, as well as senior executives and established entrepreneurs.
Branch Banking
Branch Banking posted growth rates of over 20% in low-cost deposits and fee-based
services. This was achieved through a continued thrust to make banking more convenient
and accessible to clients, through an increase in both the branch and ATM networks,
repositioning of branch sites to more attractive areas, and new product launches. The
integration of the additional 66 branch licenses from UOBP in 2006 will further
enhance the Bank’s market reach, increase the client base and increase the potential for
cross-selling other products.
B A N C O D E O R O14

2 0 0 5 A N N U A L R E P O RT 15
Treasury
For 2005 Treasury focused on the diversification and re-alignment of the Bank’s investment
and trading portfolios to take into account the new, more stringent reporting requirements
as well as the expected changes in interest rates locally and globally. Treasury registered
a 46% improvement in net interest income from its investing activities, while trading
produced a combined income of P1.57B, a 58% improvement over the previous year.
New products were also launched, including the first local issue of long-term negotiable
certificates of deposit (LTNCDs), meant to increase the Bank’s product array, and provide
more stable funding sources at lower cost.
F e e - B a s e d A c t i v i t i e s
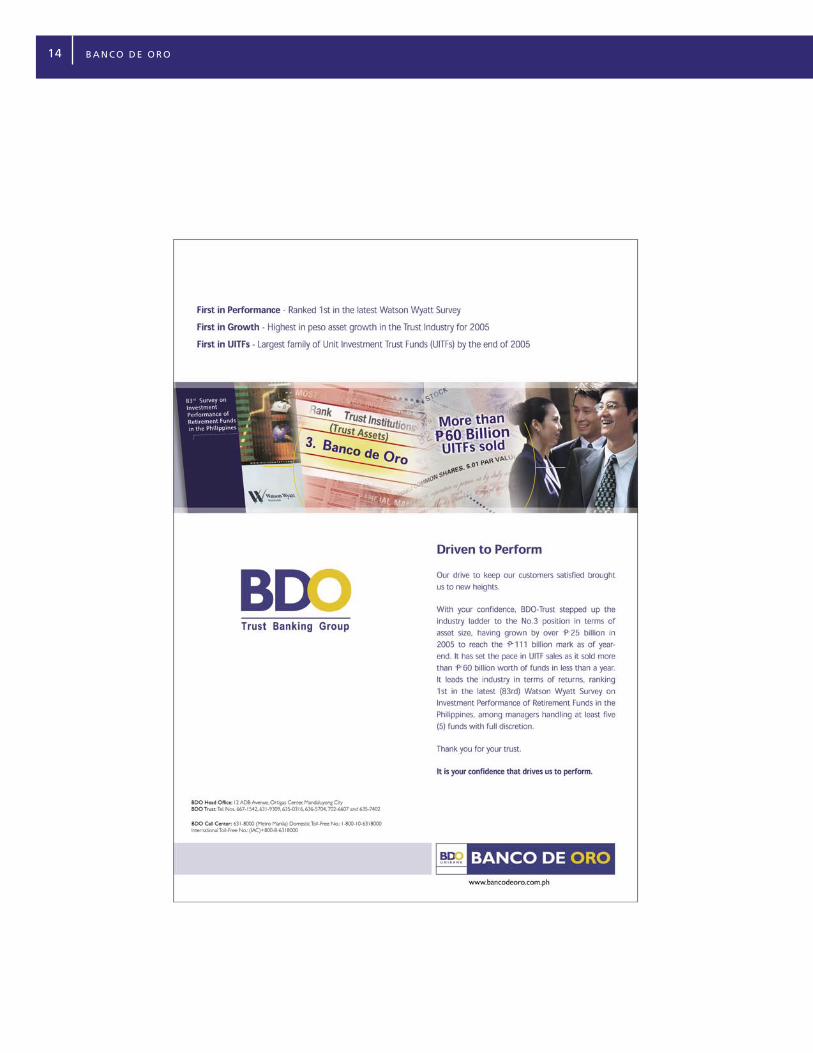
Trust
Trust achieved new milestones in 2005, reaching the P111.8B mark in funds under
management and attaining the #3 rank in the industry. Total Trust Funds grew by 26%,
while Fee Income increased by 13%. Intensified business development efforts brought
in new institutional and individual accounts. The Group also launched last year its Peso
and US Dollar-denominated Unit Investment Trust Funds (UITFs), which proved
highly successful endeavors as fund levels reached over P60B since its launch in June
2005. Trust Banking likewise led the industry in terms of
return on investment based on the latest (83rd) Watson Wyatt
survey on Investment Performance of retirement funds in the
Philippines.
Transaction Banking
Transaction Banking realized a 50% growth in revenues, with
the retail business contributing 143% revenue improvement
while the corporate sector grew at a respectable 34%. This
strong performance was boosted by a 86% increase in consumer
clients, a 200% increase in POS terminals, and a 22% increase
B A N C O D E O R O16
2 0 0 5 A N N U A L R E P O RT 17
in off-site ATMs. Consumer clients numbered close to 4 million, while alternative
distribution channels such as internet and phonebanking, call center, and offsite ATMs
provided customers with remote access to various services.
BDO launched the BDO International ATM card, the first MasterCard Electronic
Branded Debit Card in the country. This product allows access to ExpressNet and
Megalink ATMs and BDO and ExpressNet EPS POS. In addition, the BDO International
ATM cardholders can use millions of Cirrus ATMs and MasterCard Electronic and
Maestro point-of-sale terminals worldwide. This is especially valuable for clients who
are after convenience, reliability and innovation. Transaction Banking likewise enhanced
the functionalities of internet and phonebanking to support a growing client base and
adopt to clients’ changing needs.
Private Banking
BDO Private Bank likewise had a banner year, registering
substantial improvements in both Net Income and funds
managed. Net Income stood at P477.6M, representing an
increase of 35% over 2004, while funds under management
increased 106% to P25.7B. The client base likewise improved
36% from 2004. Total Resources increased to P15.3B while
Capital stood at P3.4B. With this performance, the Private
Bank registered a Return on average Equity of 14.7%,
allowing Private Bank to declare and pay a cash dividend
amounting to P250M in 2005.
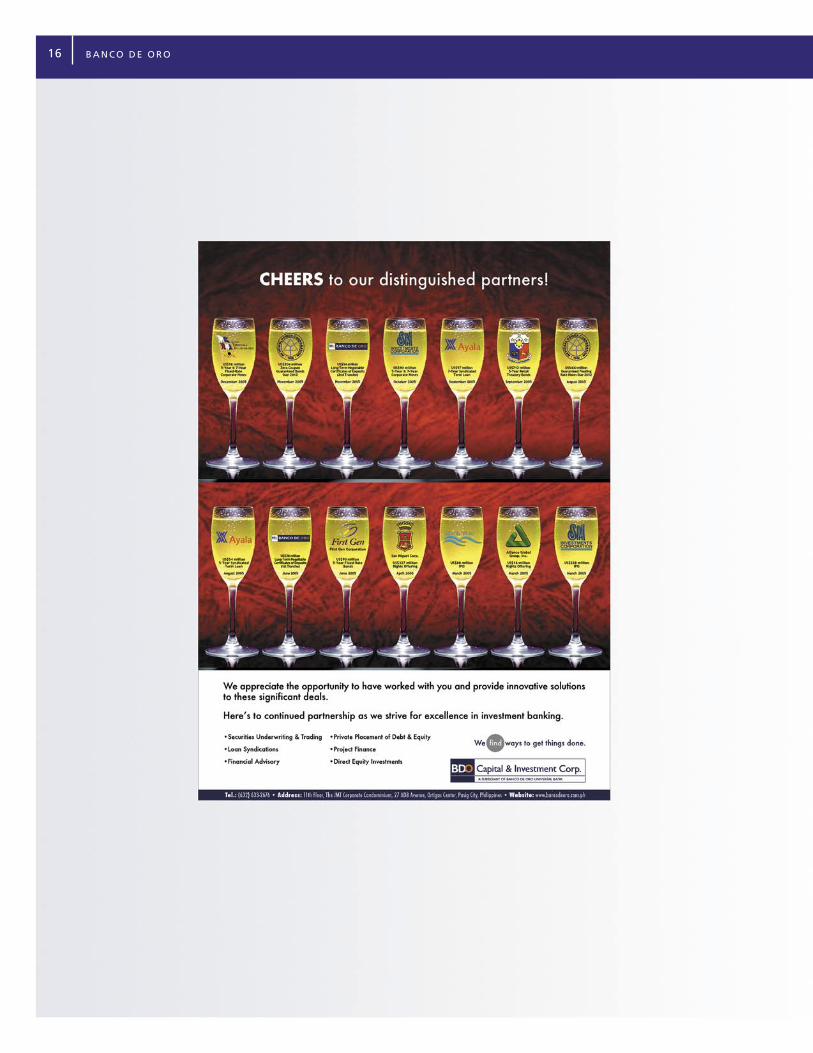
Investment Banking
BDO Capital & Investment Corp. (BCIC) maintained an active presence in the capital
markets, with participations in the major equity and fixed income issues for 2005.
BCIC acted as Financial Advisor, Domestic Lead Manager or participating Underwriter
for P52.4B worth of equity offerings for SM Investments Corporation, (the largest
IPO in the country to date), San Miguel Corporation (the largest rights offering to
date), Manila Water Company, and Alliance Global Group. BCIC also participated as
Issue Manager, Bookrunner, Arranger, Underwriter or Selling Agent in over P96B

B A N C O D E O R O18
2 0 0 5 A N N U A L R E P O RT 19
worth of fixed-income securities issued by government and private sector entities.
Net Income was at P106M, bringing Total Resources and Capital to P1.2B and P1.1B,
respectively.
Insurance
The Bank’s insurance business, through Generali Pilipinas and BDO Insurance Brokers
Inc. (BDOI), posted significant gains last year. BDOI registered over 50% growth in
insurance premiums, on the back of a 300% increase from the bancassurance segment.
Generali Pilipinas likewise posted an industry-leading 97%
growth in premiums, with bancassurance growing at a more
rapid pace of 234%. Total premiums generated in 2005
reached P1.3B, and represented a new record achievement for
the company. The company’s performance so far has been in
accordance with long-term strategic plans.
Remittance
The Bank’s Remittance business is starting to reap the
benefits from its expanded network of overseas partners, as
remittance volumes increased by over 70% and the number of
transactions almost doubled compared to 2004. Net Income of the unit consequently
increased by over 200% during the year. Remittance added 20 new overseas partners,
spanning a total of 26 countries. The Unit also expanded its domestic distribution
system by partnering with SM department stores, a rural bank and other non-
traditional channels to further improve accessibility and convenience to its clients.
Remittance likewise developed a web-based, on-line tracking system to help both
remitters and beneficiaries monitor the status of their remittance transaction.
Risk Management
Credit & Risk Management focused its efforts on remedial management and strengthening
the risk management function. Problem accounts were contained despite the exceptional
increase in the loan and investment portfolios. Working with the Board Risk Management
Committee, the group implemented a series of policy and reporting changes that allowed
B A N C O D E O R O20
the bank to exert tighter risk control and closer monitoring over its increasingly diversified
asset portfolio.
Information Technology
The Information Technology Group (ITG) completed a number of major projects in
2005. First was the upgrade of the Bank’s hardware, now three times more powerful than
the previous version. The new hardware offers flexibility in handling mixed workloads,
provides faster transaction processing, allows increased transaction volumes, and enhanced
user and product capability. In addition, the Bank’s core system was upgraded to provide
24/7 processing capability. This was complemented by a hardware upgrade in the BDO
Contingency Site. Together these changes provide the Bank
with mirroring capability for its Core System allowing immediate
resumption of operations in the event of any disruption in its
main system.
Human Resource Management
The Bank’s manpower count continues to rise due to the Bank’s
intrinsic growth whether organic or through acquisitions. The
Employee’s Integration Program was put into place to allow
new joiners to get immersed into the Bank’s culture, core values,
work processes and system in an organized manner, ensuring their seamless integration
into the organization.
The Training Team has likewise partnered with key business lines to ensure that
new products launched are given the appropriate training support. This was clearly
demonstrated in the successful launch of the Bank’s UITF products and On Site
outlets.
HRM shall continue to be a strategic partner to the Bank’s support and
business groups and shall ensure that the human factor continue to be BDO’s crucial
competitive edge.
2 0 0 5 A N N U A L R E P O RT 21
Asset Quality
The level of non-performing loans in 2005 increased slightly from P4.3B to P4.4B, despite
the substantial loan growth experienced during the period. This was achieved through
aggressive collection efforts and a continuing thrust to implement reasonable settlement
arrangements. The Bank set aside total provisions of P1.1B in 2005, bringing the NPL
coverage ratio to 97% from 83% the previous year.
Acquired assets on the other hand decreased from P5.9B to P5.7B, due to continuing
efforts to reduce non-earning assets. The Bank has undertaken auction sales as an
alternative means of facilitating ROPOA sales. The Bank also partnered with a number
of leading property developers to derive best value out of its portfolio of acquired assets.
BDO entered into development arrangements with major property developers covering
approximately 35% of it’s total acquired assets located in and around Metro Manila. The
projects are under various stages of development, and the Bank expects these activities
to be major contributors to income over the coming years.
Corporate Governance
After instituting changes in 2004, the Bank implemented initiatives to further strengthen
the governance structure. The charters and memberships of the various committees
were reviewed, updated and approved by the Board of Directors. A new committee, the
Corporate Governance Committee was established to assist the Board of Directors in
shaping the Bank’s governance policies and practices, and maintain oversight over the
Bank’s governance structure.
Among the Corporate Governance Committee’s duties and responsibilities are the
review and assessment of the Bank’s Corporate Governance Manual and the oversight
over the Bank’s compliance with Corporate Governance Regulations.
Members of the Bank’s Board of Directors likewise attended a training program
sponsored by the International Finance Corporation (IFC), and conducted by
McKinsey & Co., as part of the Board’s continuing education. The seminar covered
topics such as risk management, governance and value enhancement.

B A N C O D E O R O22
1
2
3
4 5
6
Left to right: Henry Sy, Sr., Teresita T. Sy., Ismael M. Estella, Senen T. Mendiola, Jose T. Sio
B o a r d o f D i r e c t o r s
Henry Sy, Sr.Chairman Emeritus
Henry Sy, Sr. is the Founder and Chairman of the SM Group of Companies.
He remains active in the SM Group of Companies as Chairman of its key businesses: SM Prime Holdings, the country’s leading owner and developer of shopping centers; SM Investments Corporation, the Group’s holding company; and SM Development Corporation, its real estate and leisure development arm.
Teresita T. SyChairmanBoard Advisor
Teresita T. Sy was the Bank’s Chairperson until August 5, 2005. Currently she is a Director and Vice-Chairperson of Equitable-PCI Bank. She is presently the President and Chairman of Shoemart Inc. and Supervalue Inc., respectively. She is also a Director of SM Investments Corp., Multi-Realty Development Corp, First Asia Realty Development, SM Prime Holdings, SM Keppel Land, Inc.,
and Philippine Long Distance Telephone Company. Ms. Sy is a graduate of AB-BSC in Management from the Assumption College.
Jesus A. Jacinto, Jr.Vice Chairman
Jesus A. Jacinto, Jr. , was elected Vice Chairman of the Bank in May 1996. He is concurrently the Chairman and President of BDO Insurance Brokers, Inc., Director and Treasurer of BDO Realty Corp. and Director of BDO Private Bank, Inc. He also holds various directorships in different companies. He was formerly a Director and Executive Vice-President of Citytrust Banking Corp.; Director of Citytrust Investments Phil. and Citytrust Finance Corp.; and Vice-President and Managing Partner of Citibank N.A. He holds a Bachelor’s degree in Business Administration from Fordham University in New York City and acquired his MBA (International Business) from Columbia University, New York.
Nestor V. TanDirector and President
Nestor V. Tan, was elected President of the Bank in July 1998. He concurrently holds directorships in the following subsidiaries of the Bank: BDO Capital & Investments Corp., BDO Realty Corp., Generali Pilipinas Insurance Corp. and Generali Pilipinas Life Insurance Corp. He was formerly connected with the Mellon Bank, the Bankers Trust Company in New York and the Barclays Group in New York and London. Prior to joining the Bank, he was the Chief Operating Officer for the Financial Institution Services Group of BZW, the investment banking subsidiary of the Barclays Group. He holds a Bachelor’s degree in Commerce from De La Salle University and received his MBA from Wharton School, University of Pennsylvania.
Violeta O. LuYmDirector
Violeta O. LuYm was appointed as Director in 1987. She is currently a Director and Chair of BDO Financial Services, Inc. and Director of BDO Capital & Investments Corp. She also served as BDO’s Executive Vice President from 1995 to 1997. She was formerly connected with Security Bank, Bancom Development Corp., Bancom Finance and International Corp. Bank. She holds a Bachelor’s degree in Commerce from Assumption College and received her MBA from the University of California in Los Angeles.
Senen T. MendiolaDirector
Senen T. Mendiola has served as a
Director since 1977. He is also presently the Vice Chairman and Director of Shoemart, Inc.; Executive Vice President and Director of Beach Rubber Co., Inc.; Vice President and Director of SM Appliance Center; and Director of Multi Realty Development Corp. He holds a Bachelor’s degree in Commerce from San Beda College.

2 0 0 5 A N N U A L R E P O RT 23
7
8
9 10
11
12
13
Seated left to right: Violeta O. LuYm, Nestor V. Tan, Josefina N. Tan Christopher A. Bell-Knight, Jesus A. Jacinto, Jr. Standing left to right: Jimmy T. Tang, Antonio C. Pacis, Teodoro B. Montecillo
Jimmy T. TangIndependent Director
Jimmy T. Tang served as a Director of the Bank since 1984. He is also currently the President of Avesco Marketing Corporation. He was formerly the President of the Federation of Filipino-Chinese Chamber of Commerce and Industry. He holds a Bachelor’s degree in Electrical Engineering from Mapua Institute of Techonology.
Teodoro B. MontecilloIndependent Director
Teodoro B. Montecillo was appointed BDO’s Independent Director in August 2004. He is also currently an Independent Director of various companies and professional organizations. He was appointed member of the Monetary Board of Bangko Sentral (1996 to 2002), and Chairman of the Central Bank Board of Liquidators (1999 to 2002). He holds a Bachelor of Science in Education degree from University of the East, Bachelor of Science degree in Business Administration from the University of the Philippines and an MBA from Northwestern University, Chicago.
Josefina N. TanDirector (until August 27, 2005)Board Advisor
Josefina N. Tan holds a Bachelor of Arts degree in Communication Arts from Maryknoll College. She acquired her MBA from the Ateneo Graduate School of Business. Ms. Tan was formerly Executive Vice President of Far East Bank and Trust Company (1976 - 2000) and an Assistant Vice President at Associated Banking Corporation (1974 - 1976). She was also Chairperson and Registrar of the Department of Business Administration of Maryknoll College from 1971 to 1973 and Director of Research and Publications of Ateneo Graduate School of Business from 1969 to 1971. Presently, Ms. Tan is Vice Chairman of the Board of Trustees of Miriam College (formerly Maryknoll College). Ms. Tan joined BDO as Director on February 3, 2001.
Ismael M. EstellaDirector
Ismael M. Estella, has served as a Director of the Bank since 1981. He is also presently a partner of Estella & Virtudazo Law Office and President of Olympia Philippines, Inc. He obtained his Bachelor of Laws degree from the Francisco Law School after completing his pre-law course at the Ateneo de Manila University.
Antonio C. PacisDirector and Corporate Secretary
Antonio C. Pacis was elected as the bank’s Corporate Secretary in March 2005. He currently holds various directorships in various companies. He was formerly the Corporate Secretary and a Drector of Security Banking Corp. until 2004 and 2001, respectively. He holds a Bachelor’s degree from Ateneo de Manila University. He also received his Bachelor of Laws from Ateneo de Manila University and obtained his Master of Laws at Harvard Law School.
Jose T. Sio
Board Advisor
Jose T. Sio was appointed to the Bank’s Board by SM Investment Corporation. He is a certified public accountant and holds a Bachelor of Science degree in Commerce from the University of San Agustin. He obtained his MBA at the New York University.
He is currently connected with SM Investments Corp. as Second Executive Vice President and Chief Finance Officer and its various subsidiaries and affiliates as Director.
Christopher A. Bell-KnightIndependent Director
Christopher A. Bell-Knight, was appointed as Director of the Bank last May 2005. He was formerly a Director of Solidbank Corp. from 1990 to 1998 and Vice President and Country Head of the Bank of Nova Scotia. He has had over 40 years of banking experience in England, Canada and Asia. He studied at Frome Grammar School, Somerset, England.
Statement of Management Responsibi l i ty
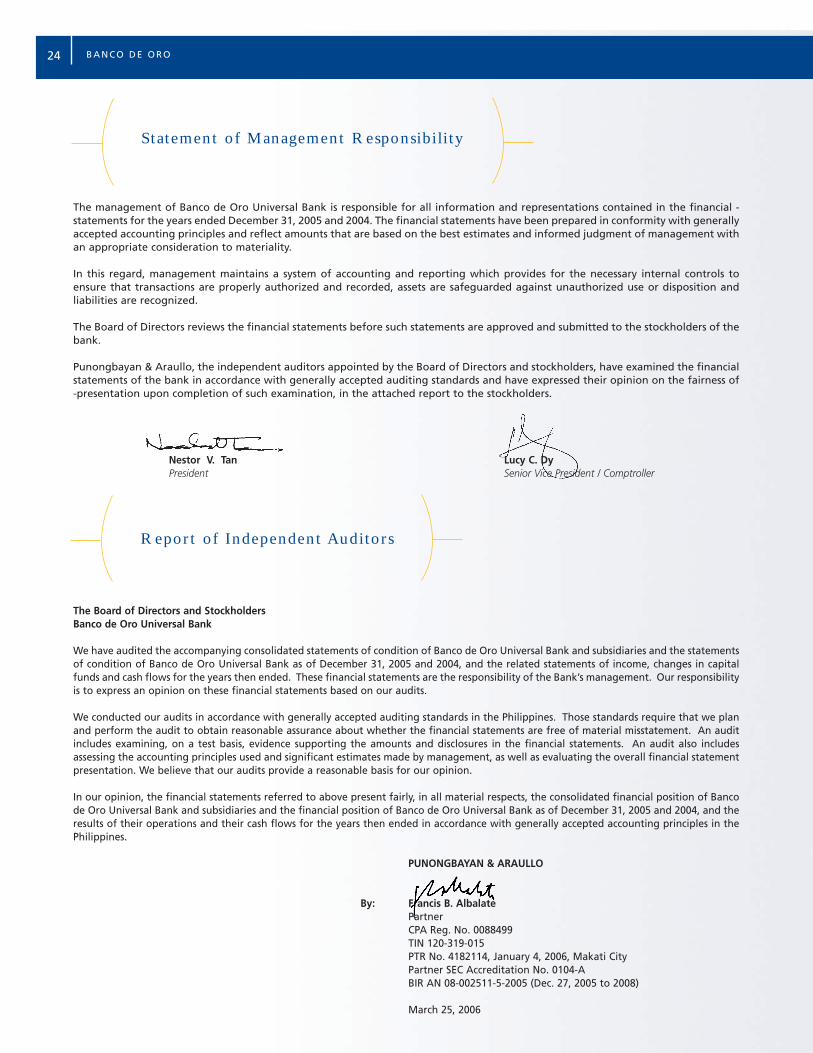
The management of Banco de Oro Universal Bank is responsible for all information and representations contained in the financial -statements for the years ended December 31, 2005 and 2004. The financial statements have been prepared in conformity with generallyaccepted accounting principles and reflect amounts that are based on the best estimates and informed judgment of management withan appropriate consideration to materiality.
In this regard, management maintains a system of accounting and reporting which provides for the necessary internal controls toensure that transactions are properly authorized and recorded, assets are safeguarded against unauthorized use or disposition andliabilities are recognized.
The Board of Directors reviews the financial statements before such statements are approved and submitted to the stockholders of thebank.
Punongbayan & Araullo, the independent auditors appointed by the Board of Directors and stockholders, have examined the financialstatements of the bank in accordance with generally accepted auditing standards and have expressed their opinion on the fairness of-presentation upon completion of such examination, in the attached report to the stockholders.
Nestor V. Tan Lucy C. DyPresident Senior Vice President / Comptroller
The Board of Directors and StockholdersBanco de Oro Universal Bank
We have audited the accompanying consolidated statements of condition of Banco de Oro Universal Bank and subsidiaries and the statementsof condition of Banco de Oro Universal Bank as of December 31, 2005 and 2004, and the related statements of income, changes in capitalfunds and cash flows for the years then ended. These financial statements are the responsibility of the Bank’s management. Our responsibilityis to express an opinion on these financial statements based on our audits.
We conducted our audits in accordance with generally accepted auditing standards in the Philippines. Those standards require that we planand perform the audit to obtain reasonable assurance about whether the financial statements are free of material misstatement. An auditincludes examining, on a test basis, evidence supporting the amounts and disclosures in the financial statements. An audit also includesassessing the accounting principles used and significant estimates made by management, as well as evaluating the overall financial statementpresentation. We believe that our audits provide a reasonable basis for our opinion.
In our opinion, the financial statements referred to above present fairly, in all material respects, the consolidated financial position of Bancode Oro Universal Bank and subsidiaries and the financial position of Banco de Oro Universal Bank as of December 31, 2005 and 2004, and theresults of their operations and their cash flows for the years then ended in accordance with generally accepted accounting principles in thePhilippines.
PUNONGBAYAN & ARAULLO
By: Francis B. AlbalatePartnerCPA Reg. No. 0088499TIN 120-319-015PTR No. 4182114, January 4, 2006, Makati CityPartner SEC Accreditation No. 0104-ABIR AN 08-002511-5-2005 (Dec. 27, 2005 to 2008)
March 25, 2006
24 BANCO DE ORO
Repor t of Independent Auditor s
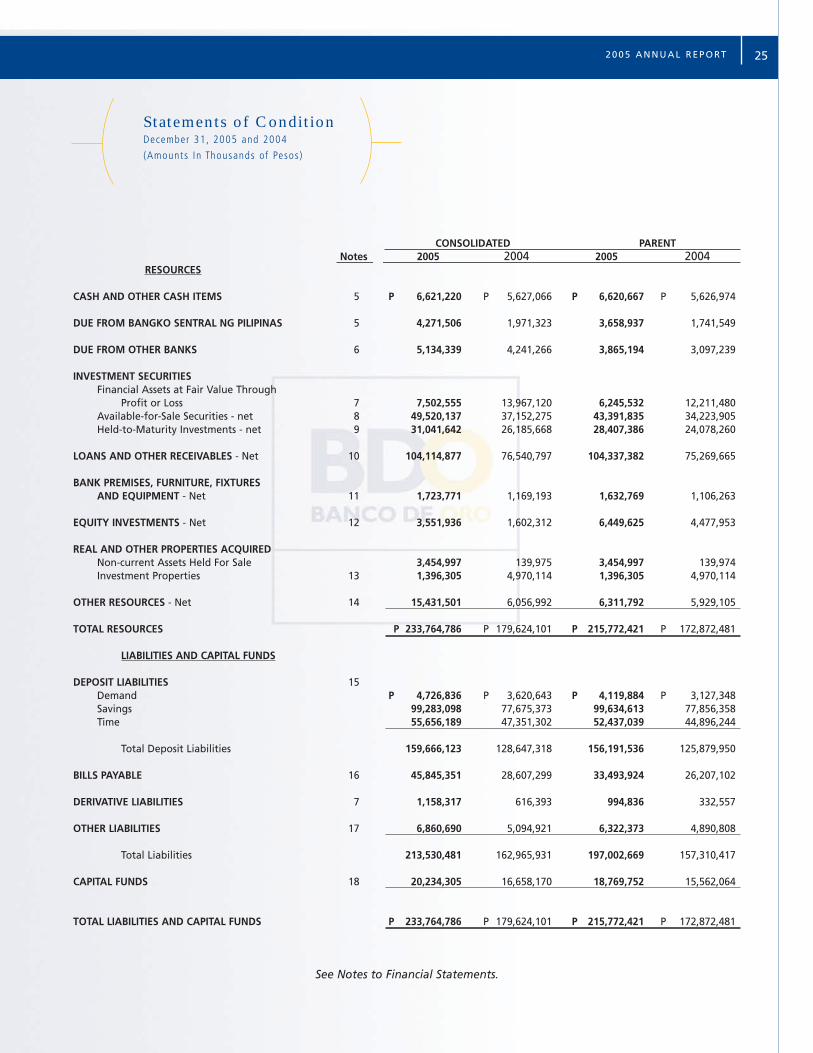
Statements of Condit ionDecember 31, 2005 and 2004
(Amounts In Thousands of Pesos)
252005 ANNUAL REPORT
CONSOLIDATED PARENTNotes 2005 2004 2005 2004
RESOURCES
CASH AND OTHER CASH ITEMS 5 P 6,621,220 P 5,627,066 P 6,620,667 P 5,626,974
DUE FROM BANGKO SENTRAL NG PILIPINAS 5 4,271,506 1,971,323 3,658,937 1,741,549
DUE FROM OTHER BANKS 6 5,134,339 4,241,266 3,865,194 3,097,239
INVESTMENT SECURITIESFinancial Assets at Fair Value Through
Profit or Loss 7 7,502,555 13,967,120 6,245,532 12,211,480 Available-for-Sale Securities - net 8 49,520,137 37,152,275 43,391,835 34,223,905 Held-to-Maturity Investments - net 9 31,041,642 26,185,668 28,407,386 24,078,260
LOANS AND OTHER RECEIVABLES - Net 10 104,114,877 76,540,797 104,337,382 75,269,665
BANK PREMISES, FURNITURE, FIXTURESAND EQUIPMENT - Net 11 1,723,771 1,169,193 1,632,769 1,106,263
EQUITY INVESTMENTS - Net 12 3,551,936 1,602,312 6,449,625 4,477,953
REAL AND OTHER PROPERTIES ACQUIREDNon-current Assets Held For Sale 3,454,997 139,975 3,454,997 139,974 Investment Properties 13 1,396,305 4,970,114 1,396,305 4,970,114
OTHER RESOURCES - Net 14 15,431,501 6,056,992 6,311,792 5,929,105
TOTAL RESOURCES P 233,764,786 P 179,624,101 P 215,772,421 P 172,872,481
LIABILITIES AND CAPITAL FUNDS
DEPOSIT LIABILITIES 15Demand P 4,726,836 P 3,620,643 P 4,119,884 P 3,127,348Savings 99,283,098 77,675,373 99,634,613 77,856,358 Time 55,656,189 47,351,302 52,437,039 44,896,244
Total Deposit Liabilities 159,666,123 128,647,318 156,191,536 125,879,950
BILLS PAYABLE 16 45,845,351 28,607,299 33,493,924 26,207,102
DERIVATIVE LIABILITIES 7 1,158,317 616,393 994,836 332,557
OTHER LIABILITIES 17 6,860,690 5,094,921 6,322,373 4,890,808
Total Liabilities 213,530,481 162,965,931 197,002,669 157,310,417
CAPITAL FUNDS 18 20,234,305 16,658,170 18,769,752 15,562,064
TOTAL LIABILITIES AND CAPITAL FUNDS P 233,764,786 P 179,624,101 P 215,772,421 P 172,872,481
See Notes to Financial Statements.

Statements of IncomeFor the Years Ended December 31, 2005 and 2004
(Amounts In Thousands of Pesos Except per Share Data)
26 BANCO DE ORO
CONSOLIDATED PARENTNotes 2005 2004 2005 2004
INTEREST INCOME ONLoans and Receivables P 7,267,168 P 6,140,974 P 7,033,709 P 6,074,071Investment Securities 7,184,121 4,694,303 6,344,406 4,171,076Due from Other Banks 257,405 154,812 219,589 137,860Others 76,112 157,483 70,935 72,829
14,784,806 11,147,572 13,668,639 10,455,836
INTEREST EXPENSE ONDeposit Liabilities 15 5,998,459 4,702,297 5,853,457 4,598,718Bills Payable and Others 16 1,943,639 1,484,261 1,613,042 1,410,367
7,942,098 6,186,558 7,466,499 6,009,085
NET INTEREST INCOME 6,842,708 4,961,014 6,202,140 4,446,751
IMPAIRMENT LOSSES 1,167,379 783,555 1,176,431 950,210
NET INTEREST INCOME AFTERIMPAIRMENT LOSSES 5,675,329 4,177,459 5,025,709 3,496,541
OTHER INCOME Trading Gain 1,575,117 994,964 1,446,700 900,496Service Charges and Fees 1,499,830 1,005,220 991,141 810,228 Trust Fees 22 422,777 375,516 422,777 375,516 Foreign Exchange Gain - net 402,331 331 368,075 - Dividend Income - - 367,750 8,999 Miscellaneous - net 19 48,753 38,585 131,716 71,266
3,948,808 2,414,616 3,728,159 2,166,505
OTHER EXPENSESEmployee Benefits 20 2,108,975 1,680,008 1,934,489 1,541,205 Occupancy 27 748,779 576,636 693,410 538,327 Taxes and Licenses 721,995 419,715 627,497 369,347 Insurance 282,429 223,600 282,408 218,924 Documentary Stamps Used 252,919 128,828 252,919 128,828 Security, Clerical, Messengerial and Janitorial 252,884 209,515 241,844 200,790 Litigation/Assets Acquired 240,489 162,013 239,286 162,013 Information Technology 181,450 198,927 181,451 148,368 Foreign Exchange Loss - net - - - 58,783 Others 19 1,759,413 1,059,329 1,395,443 871,916
6,549,333 4,658,571 5,848,747 4,238,501
INCOME BEFORE TAX 3,074,804 1,933,504 2,905,121 1,424,545
TAX EXPENSE (INCOME) 21 531,287 ( 39,130) 434,759 ( 90,116)
NET INCOME P 2,543,517 P 1,972,634 P 2,470,362 P 1,514,661
ATTRIBUTABLE TO: Equity holders of the parent P 2,586,191 P 2,021,038 Minority interest ( 42,674) ( 48,404)
P 2,543,517 P 1,972,634
Earnings Per ShareBasic 25 P 2.76 P 2.23 P 2.64 P 1.67 Diluted 25 P 2.70 P 2.16 P 2.58 P 1.62
See Notes to Financial Statements.

Statements of Changes in Capita l FundsFor the Years Ended December 31, 2005 and 2004
(Amounts In Thousands of Pesos)
272005 ANNUAL REPORT
CONSOLIDATED PARENTNotes 2005 2004 2005 2004
CAPITAL STOCK 18Common Stock - P10 par value
Authorized - 1,015,000,000 sharesIssued and outstanding - 939,593,142 shares in 2005
and 908,189,550 shares in 2004Balance at beginning of year P 9,081,895 P 9,081,895 P 9,081,895 P 9,081,895 Issuance of additional shares during the year 314,036 - 314,036 -
Balance at end of year 9,395,931 9,081,895 9,395,931 9,081,895
COMMON STOCK OPTIONBalance at Beginning of Year
As previously stated - - - - Effects of transition to PFRS 2 27,268 27,268 27,268 27,268 As restated 27,268 27,268 27,268 27,268
Conversion of common stock option 16 ( 13,634) - ( 13,634) -
Balance at End of Year 13,634 27,268 13,634 27,268
TREASURY SHARES - At Cost 2 ( 31,967) ( 45,731) - -
ADDITIONAL PAID-IN CAPITALBalance at Beginning of Year
As previously stated 4,418,063 1,850,013 4,418,063 1,850,013 Effects of transition to PFRS 2 ( 2,568,050) - ( 2,568,050) - As restated 1,850,013 1,850,013 1,850,013 1,850,013
Additional Paid in Capital on Common Stock Subscription During the Year 214,264 - 214,264 -
Balance at End of Year 2,064,277 1,850,013 2,064,277 1,850,013
SURPLUS RESERVESBalance at Beginning of Year
As previously stated 104,063 66,511 104,063 66,511 Effects of transition to PFRS 2 5,143 5,143 - - As restated 109,206 71,654 104,063 66,511
Transfer from Surplus Free 31,662 37,552 31,661 37,552
Balance at End of Year 140,868 109,206 135,724 104,063
SURPLUS FREEBalance at Beginning of Year
As previously stated 5,458,993 3,934,970 5,458,993 3,934,970 Effects of transition to PFRS 2 ( 103,237) ( 59,675) ( 1,214,235) ( 712,700)As restated 5,355,756 3,875,295 4,244,758 3,222,270
Net Income 2,543,517 1,972,634 2,470,362 1,514,661 Cash Dividends 16, 18 ( 611,549) ( 454,621) ( 611,550) ( 454,621)Transfer to Surplus Reserves ( 31,662) ( 37,552) ( 31,661) ( 37,552)
Balance at End of Year 7,256,062 5,355,756 6,071,909 4,244,758
FAIR VALUE GAIN (LOSS) ONAVAILABLE-FOR-SALE SECURITIES Balance at Beginning of Year
As previously stated ( 24,570) ( 33,664) ( 24,570) ( 33,664)Effects of transition to PFRS 2 333,168 34,476 278,637 ( 7,085)As restated 308,598 812 254,067 ( 40,749)
Recovery in Value of Securities 1,158,411 307,786 834,210 294,816
Balance at End of Year 1,467,009 308,598 1,088,277 254,067
MINORITY INTERESTBalance at Beginning of Year
As previously stated - - - - Effects of transition to PFRS 2 ( 28,835) 19,569 - - As restated ( 28,835) 19,569 - -
Share in net loss for the year ( 42,674) ( 48,404) - -
Balance at End of Year ( 71,509) ( 28,835) - -
TOTAL CAPITAL FUNDS P 20,234,305 P 16,658,170 P 18,769,752 P 15,562,064
Net Gains Directly Recognized in Capital Funds P 1,158,411 P 307,786 P 834,210 P 294,816
See Notes to Financial Statements.
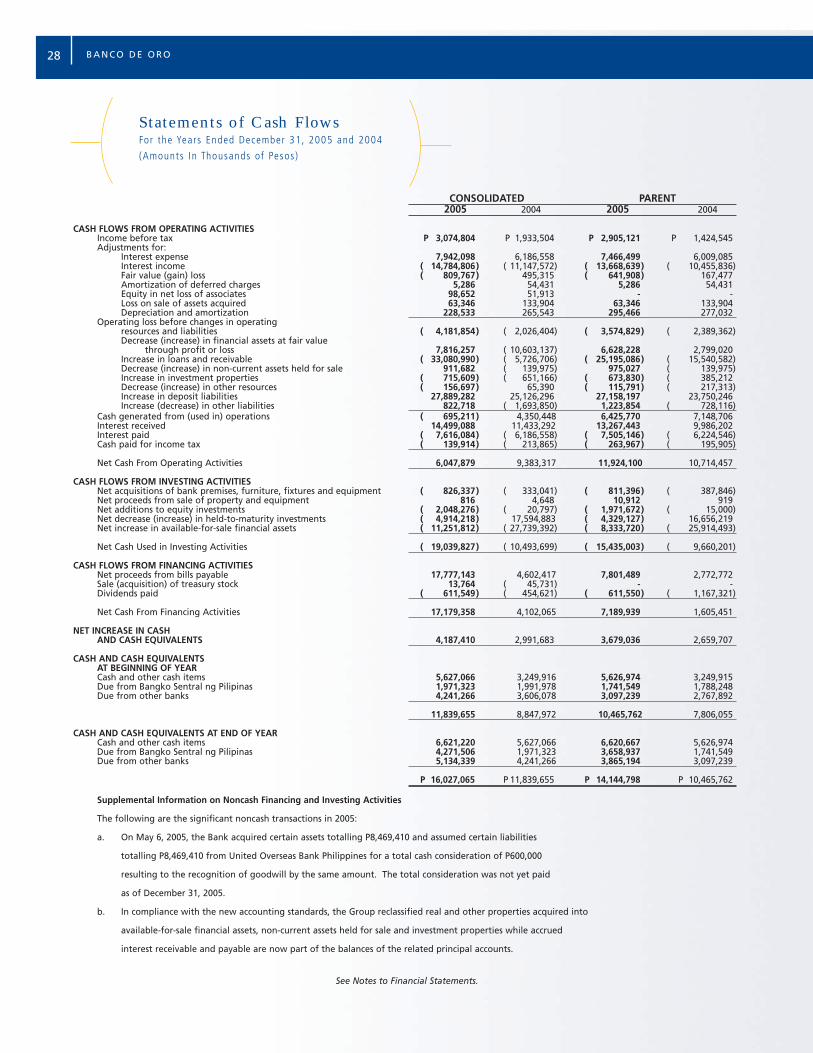
Statements of Cash FlowsFor the Years Ended December 31, 2005 and 2004
(Amounts In Thousands of Pesos)
CONSOLIDATED PARENT2005 2004 2005 2004
CASH FLOWS FROM OPERATING ACTIVITIESIncome before tax P 3,074,804 P 1,933,504 P 2,905,121 P 1,424,545 Adjustments for:
Interest expense 7,942,098 6,186,558 7,466,499 6,009,085 Interest income ( 14,784,806) ( 11,147,572) ( 13,668,639) ( 10,455,836)Fair value (gain) loss ( 809,767) 495,315 ( 641,908) 167,477 Amortization of deferred charges 5,286 54,431 5,286 54,431 Equity in net loss of associates 98,652 51,913 - -Loss on sale of assets acquired 63,346 133,904 63,346 133,904 Depreciation and amortization 228,533 265,543 295,466 277,032
Operating loss before changes in operatingresources and liabilities ( 4,181,854) ( 2,026,404) ( 3,574,829) ( 2,389,362)Decrease (increase) in financial assets at fair value
through profit or loss 7,816,257 ( 10,603,137) 6,628,228 2,799,020 Increase in loans and receivable ( 33,080,990) ( 5,726,706) ( 25,195,086) ( 15,540,582)Decrease (increase) in non-current assets held for sale 911,682 ( 139,975) 975,027 ( 139,975)Increase in investment properties ( 715,609) ( 651,166) ( 673,830) ( 385,212Decrease (increase) in other resources ( 156,697) 65,390 ( 115,791) ( 217,313)Increase in deposit liabilities 27,889,282 25,126,296 27,158,197 23,750,246 Increase (decrease) in other liabilities 822,718 ( 1,693,850) 1,223,854 ( 728,116)
Cash generated from (used in) operations ( 695,211) 4,350,448 6,425,770 7,148,706 Interest received 14,499,088 11,433,292 13,267,443 9,986,202 Interest paid ( 7,616,084) ( 6,186,558) ( 7,505,146) ( 6,224,546)Cash paid for income tax ( 139,914) ( 213,865) ( 263,967) ( 195,905)
Net Cash From Operating Activities 6,047,879 9,383,317 11,924,100 10,714,457
CASH FLOWS FROM INVESTING ACTIVITIESNet acquisitions of bank premises, furniture, fixtures and equipment ( 826,337) ( 333,041) ( 811,396) ( 387,846)Net proceeds from sale of property and equipment 816 4,648 10,912 919 Net additions to equity investments ( 2,048,276) ( 20,797) ( 1,971,672) ( 15,000)Net decrease (increase) in held-to-maturity investments ( 4,914,218) 17,594,883 ( 4,329,127) 16,656,219 Net increase in available-for-sale financial assets ( 11,251,812) ( 27,739,392) ( 8,333,720) ( 25,914,493)
Net Cash Used in Investing Activities ( 19,039,827) ( 10,493,699) ( 15,435,003) ( 9,660,201)
CASH FLOWS FROM FINANCING ACTIVITIESNet proceeds from bills payable 17,777,143 4,602,417 7,801,489 2,772,772 Sale (acquisition) of treasury stock 13,764 ( 45,731) - - Dividends paid ( 611,549) ( 454,621) ( 611,550) ( 1,167,321)
Net Cash From Financing Activities 17,179,358 4,102,065 7,189,939 1,605,451
NET INCREASE IN CASHAND CASH EQUIVALENTS 4,187,410 2,991,683 3,679,036 2,659,707
CASH AND CASH EQUIVALENTSAT BEGINNING OF YEARCash and other cash items 5,627,066 3,249,916 5,626,974 3,249,915 Due from Bangko Sentral ng Pilipinas 1,971,323 1,991,978 1,741,549 1,788,248 Due from other banks 4,241,266 3,606,078 3,097,239 2,767,892
11,839,655 8,847,972 10,465,762 7,806,055
CASH AND CASH EQUIVALENTS AT END OF YEARCash and other cash items 6,621,220 5,627,066 6,620,667 5,626,974 Due from Bangko Sentral ng Pilipinas 4,271,506 1,971,323 3,658,937 1,741,549 Due from other banks 5,134,339 4,241,266 3,865,194 3,097,239
P 16,027,065 P 11,839,655 P 14,144,798 P 10,465,762
Supplemental Information on Noncash Financing and Investing Activities
The following are the significant noncash transactions in 2005:
a. On May 6, 2005, the Bank acquired certain assets totalling P8,469,410 and assumed certain liabilities
totalling P8,469,410 from United Overseas Bank Philippines for a total cash consideration of P600,000
resulting to the recognition of goodwill by the same amount. The total consideration was not yet paid
as of December 31, 2005.
b. In compliance with the new accounting standards, the Group reclassified real and other properties acquired into
available-for-sale financial assets, non-current assets held for sale and investment properties while accrued
interest receivable and payable are now part of the balances of the related principal accounts.
See Notes to Financial Statements.
28 BANCO DE ORO
Notes to Financia l StatementsDecember 31, 2005 and 2004
(Amounts in Thousands of Pesos Except Per Share Data)
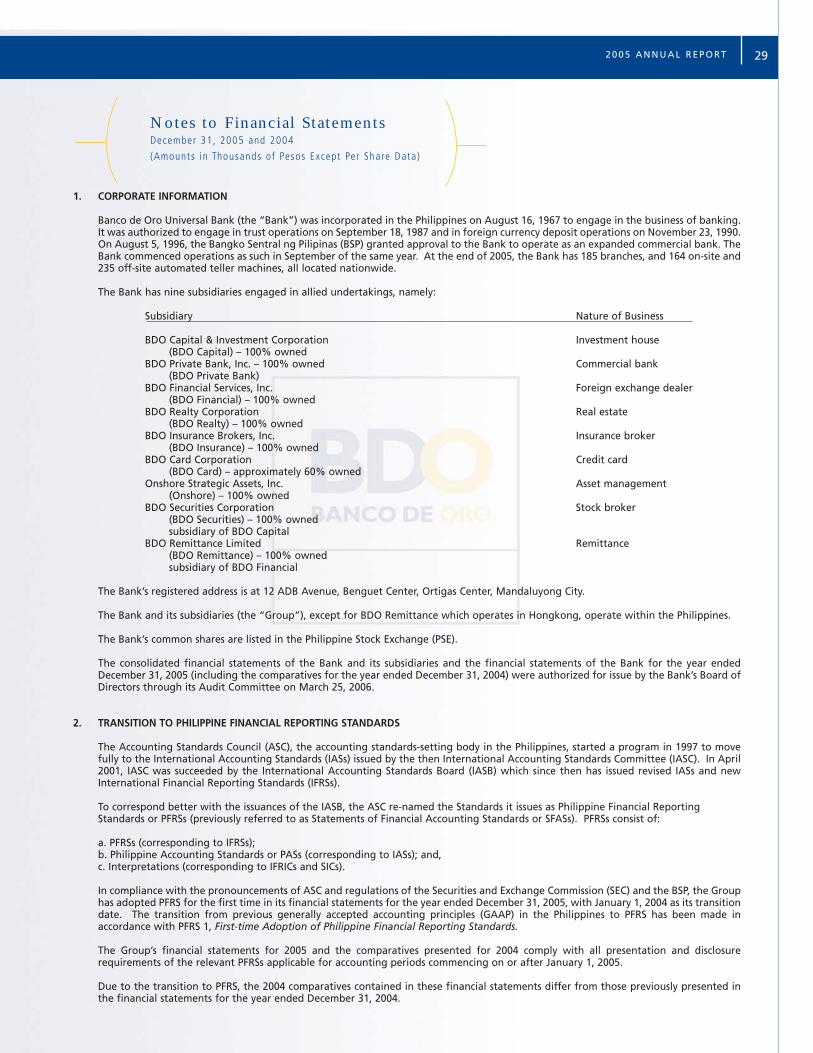
1. CORPORATE INFORMATION
Banco de Oro Universal Bank (the “Bank”) was incorporated in the Philippines on August 16, 1967 to engage in the business of banking.It was authorized to engage in trust operations on September 18, 1987 and in foreign currency deposit operations on November 23, 1990.On August 5, 1996, the Bangko Sentral ng Pilipinas (BSP) granted approval to the Bank to operate as an expanded commercial bank. TheBank commenced operations as such in September of the same year. At the end of 2005, the Bank has 185 branches, and 164 on-site and235 off-site automated teller machines, all located nationwide.
The Bank has nine subsidiaries engaged in allied undertakings, namely:
Subsidiary Nature of Business
BDO Capital & Investment Corporation Investment house(BDO Capital) – 100% owned
BDO Private Bank, Inc. – 100% owned Commercial bank(BDO Private Bank)
BDO Financial Services, Inc. Foreign exchange dealer(BDO Financial) – 100% owned
BDO Realty Corporation Real estate(BDO Realty) – 100% owned
BDO Insurance Brokers, Inc. Insurance broker(BDO Insurance) – 100% owned
BDO Card Corporation Credit card(BDO Card) – approximately 60% owned
Onshore Strategic Assets, Inc. Asset management(Onshore) – 100% owned
BDO Securities Corporation Stock broker(BDO Securities) – 100% owned subsidiary of BDO Capital
BDO Remittance Limited Remittance(BDO Remittance) – 100% ownedsubsidiary of BDO Financial
The Bank’s registered address is at 12 ADB Avenue, Benguet Center, Ortigas Center, Mandaluyong City.
The Bank and its subsidiaries (the “Group”), except for BDO Remittance which operates in Hongkong, operate within the Philippines.
The Bank’s common shares are listed in the Philippine Stock Exchange (PSE).
The consolidated financial statements of the Bank and its subsidiaries and the financial statements of the Bank for the year ended December 31, 2005 (including the comparatives for the year ended December 31, 2004) were authorized for issue by the Bank’s Board ofDirectors through its Audit Committee on March 25, 2006.
2. TRANSITION TO PHILIPPINE FINANCIAL REPORTING STANDARDS
The Accounting Standards Council (ASC), the accounting standards-setting body in the Philippines, started a program in 1997 to movefully to the International Accounting Standards (IASs) issued by the then International Accounting Standards Committee (IASC). In April2001, IASC was succeeded by the International Accounting Standards Board (IASB) which since then has issued revised IASs and newInternational Financial Reporting Standards (IFRSs).
To correspond better with the issuances of the IASB, the ASC re-named the Standards it issues as Philippine Financial Reporting Standards or PFRSs (previously referred to as Statements of Financial Accounting Standards or SFASs). PFRSs consist of:
a. PFRSs (corresponding to IFRSs);b. Philippine Accounting Standards or PASs (corresponding to IASs); and,c. Interpretations (corresponding to IFRICs and SICs).
In compliance with the pronouncements of ASC and regulations of the Securities and Exchange Commission (SEC) and the BSP, the Grouphas adopted PFRS for the first time in its financial statements for the year ended December 31, 2005, with January 1, 2004 as its transitiondate. The transition from previous generally accepted accounting principles (GAAP) in the Philippines to PFRS has been made inaccordance with PFRS 1, First-time Adoption of Philippine Financial Reporting Standards.
The Group’s financial statements for 2005 and the comparatives presented for 2004 comply with all presentation and disclosurerequirements of the relevant PFRSs applicable for accounting periods commencing on or after January 1, 2005.
Due to the transition to PFRS, the 2004 comparatives contained in these financial statements differ from those previously presented inthe financial statements for the year ended December 31, 2004.
292005 ANNUAL REPORT

The following reconciliations and explanatory notes thereto describe the effects of the transition on the Group’s opening PFRS statementof condition as of January 1, 2004 and for the financial year 2004. All explanations should be read in conjunction with the PFRSsaccounting policies of the Group as disclosed in Note 3.
Adjustments on the comparatives prepared for the year ended December 31, 2005 and 2004 on the preferred shares and additional paid-in capital were necessary to comply with the provisions of PAS 32, Financial Instruments: Disclosure and Presentation and PAS 39, FinancialInstruments: Recognition and Measurement.
2.1 Reconciliations
a. The reconciliation of the capital funds reported under previous GAAP to capital funds under PFRS are summarized as follows:
CONSOLIDATED PARENTDecember 31, January 1, December 31, January 1,
Notes 2004 2004 2004 2004
Capital Stock under previous GAAP P 9,331,895 P 9,081,895 P 9,331,895 P 9,081,895Reclassification of mandatory
redeemable preferred shares to bills payable 2.2, 2.3 ( 250,000) - ( 250,000) -
Capital Stock under PFRS 9,081,895 9,081,895 9,081,895 9,081,895
Common Stock Optionunder previous GAAPSegregation of equity portion of - - - -
convertible unsecured subordinated debt 2.4 27,268 27,268 27,268 27,268
Common Stock Option under PFRS 27,268 27,268 27,268 27,268
Additional Paid-in Capitalunder previous GAAP 4,418,063 1,850,013 4,418,063 1,850,013Reclassification of premium on issuance
of mandatory redeemable preferredshares to bills payable 2.2, 2.3 ( 2,568,050) - ( 2,568,050) -
Additional Paid-in Capital under PFRS 1,850,013 1,850,013 1,850,013 1,850,013
Treasury Shares under previous GAAP - - - -Recognition as treasury shares Bank
shares held by a subsidiary 2.5 ( 45,731) - - -
Treasury Shares under PFRS ( 45,731) - - -
Fair Value Gain (Loss) on Available-for-Sale Securities under previous GAAP ( 24,570) ( 33,664) ( 24,570) ( 33,664)Reversal of fair value gain of an investee
accounted for at cost 2.6 - - 7,172 5,069Recognition of permanent impairment of
available-for-sale financial assets 2.9 2,230 2,120 - -Fair value change related to reclassification of
held-to-maturity investments toto available-for-sale securities 2.7 330,938 32,356 271,465 ( 12,154)Total adjustments to fair value gain (loss)
on available-for-sale securities 333,168 34,476 278,637 ( 7,085)
Fair Value Gain (Loss) of Available-for-SaleSecurities under PFRS 308,598 812 254,067 ( 40,749)
Equity Share in Reserve for Foreign Exchange Fluctuation of an Investee under previous GAAP 6,536 4,418 6,536 4,418Reversal due to application of PAS 39 2.6 ( 6,536) ( 4,418 ) ( 6,536) ( 4,418)
Equity Share in Reserve for Foreign Exchange Fluctuation of an Investee under PFRS P - P - P - P -
30 BANCO DE ORO

CONSOLIDATED PARENTDecember 31, January 1, December 31, January 1,
Notes 2004 2004 2004 2004
Surplus reserves under previous GAAP P 104,063 P 66,511 P 104,063 P 66,511Appropriation for general banking risk 2.12 5,143 5,143 - -
Surplus reserves under PFRS 109,206 71,654 104,063 66,511
Minority interest under previous GAAP - - - -Recognition of minority interest
during the year 2.2 ( 28,835) 19,569 - -
Minority interest under PFRS ( 28,835) 19,569 - -
Surplus Free under previous GAAP 5,458,993 3,934,970 5,458,993 3,934,970
Reversal of equity in net earnings ofsubsidiaries and associates 2.6 - - ( 1,057,517) ( 734,291)
Recognition of dividends from equityinvestments as income 2.6 - - 34,499 25,500
Recognition of impairment on equityinvestments 2.6 - - ( 207,186) -
Recognition of dividends on preferred sharesas interest expense 2.3 ( 37,589) - ( 37,589) -
Recognition of transitional asset (liability)and reduction (increase) in definedbenefit expense 2.16 157,744 3,394 158,661 ( 191)
Recognition of impairment loss on available-for-sale financial assets 2.9 ( 2,230) ( 2,120) - -
Amortization of discount on IFC Loan 2.4 ( 9,048) ( 3,718) ( 9,048) ( 3,718)Adjustment on the amortization of
auto loans 2.8 ( 2,719) - ( 2,719) -Adjustment on the amortization of
investments from straight line methodto effective interest method 2.8 ( 20,484) - ( 20,484) -
Adjustment on the amortization of transaction costs on the issuanceof Senior Notes 2.8 2,632 - 2,632 -
Recognition of embedded creditdefault swaps 2.10 ( 43,585) - - -
Reversal of amortization of trading right 2.13 264 - - -Recognition of previously unrecognized
results of operations of BDO Remittance 2.14 ( 22,276) - - -Revaluation of derivatives 2.11 ( 16,290) ( 88,084) - -Reversal of allowance on ROPA 2.15 605,264 742,090 605,264 742,090Depreciation on investment properties 2.15 ( 265,543) ( 174,444) ( 265,543) ( 174,444)Impairment loss on investment properties
and non-current assets held for sale 2.15 ( 339,721) ( 567,646) ( 339,721) ( 567,646)Reversal of allowance for general loan losses 2.12 5,143 5,143 - -Appropriation for general banking risk 2.12 ( 5,143) ( 5,143) - -Derecognition of deferred tax assets 2.17 ( 109,656) 30,853 ( 75,484) -
Total adjustments to surplus free ( 103,237) ( 59,675) ( 1,214,235) ( 712,700)
Surplus Free under PFRS 5,355,756 3,875,295 4,244,758 3,222,270
Total adjustments to Capital Funds ( 2,636,810) 22,363 ( 3,732,916) ( 696,935)Capital Funds under previous GAAP 19,294,980 14,904,143 19,294,980 14,904,143
Capital Funds under PFRS P 16,658,170 P 14,926,506 P 15,562,064 P 14,207,208
312005 ANNUAL REPORT
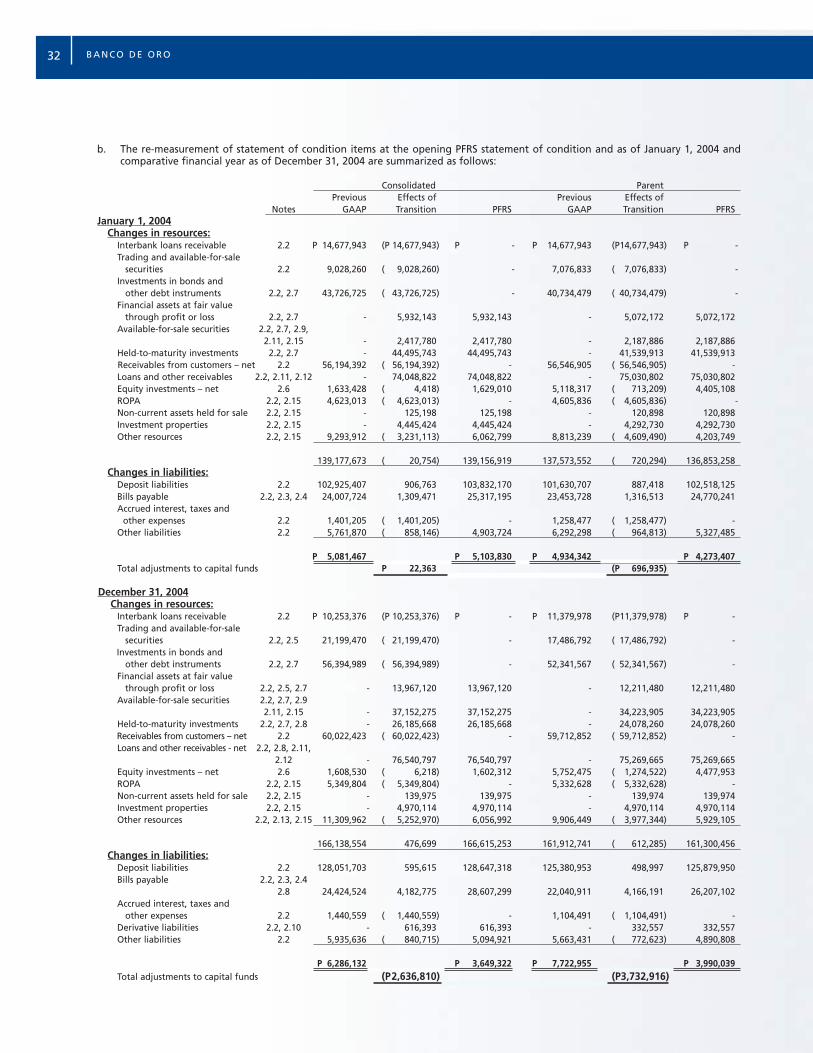
b. The re-measurement of statement of condition items at the opening PFRS statement of condition and as of January 1, 2004 andcomparative financial year as of December 31, 2004 are summarized as follows:
Consolidated ParentPrevious Effects of Previous Effects of
Notes GAAP Transition PFRS GAAP Transition PFRSJanuary 1, 2004
Changes in resources:Interbank loans receivable 2.2 P 14,677,943 (P 14,677,943) P - P 14,677,943 (P14,677,943) P -Trading and available-for-sale
securities 2.2 9,028,260 ( 9,028,260) - 7,076,833 ( 7,076,833) -Investments in bonds and
other debt instruments 2.2, 2.7 43,726,725 ( 43,726,725) - 40,734,479 ( 40,734,479) -Financial assets at fair value
through profit or loss 2.2, 2.7 - 5,932,143 5,932,143 - 5,072,172 5,072,172Available-for-sale securities 2.2, 2.7, 2.9,
2.11, 2.15 - 2,417,780 2,417,780 - 2,187,886 2,187,886Held-to-maturity investments 2.2, 2.7 - 44,495,743 44,495,743 - 41,539,913 41,539,913Receivables from customers – net 2.2 56,194,392 ( 56,194,392) - 56,546,905 ( 56,546,905) -Loans and other receivables 2.2, 2.11, 2.12 - 74,048,822 74,048,822 - 75,030,802 75,030,802Equity investments – net 2.6 1,633,428 ( 4,418) 1,629,010 5,118,317 ( 713,209) 4,405,108ROPA 2.2, 2.15 4,623,013 ( 4,623,013) - 4,605,836 ( 4,605,836) -Non-current assets held for sale 2.2, 2.15 - 125,198 125,198 - 120,898 120,898Investment properties 2.2, 2.15 - 4,445,424 4,445,424 - 4,292,730 4,292,730Other resources 2.2, 2.15 9,293,912 ( 3,231,113) 6,062,799 8,813,239 ( 4,609,490) 4,203,749
139,177,673 ( 20,754) 139,156,919 137,573,552 ( 720,294) 136,853,258Changes in liabilities:
Deposit liabilities 2.2 102,925,407 906,763 103,832,170 101,630,707 887,418 102,518,125Bills payable 2.2, 2.3, 2.4 24,007,724 1,309,471 25,317,195 23,453,728 1,316,513 24,770,241Accrued interest, taxes and
other expenses 2.2 1,401,205 ( 1,401,205) - 1,258,477 ( 1,258,477) -Other liabilities 2.2 5,761,870 ( 858,146) 4,903,724 6,292,298 ( 964,813) 5,327,485
P 5,081,467 P 5,103,830 P 4,934,342 P 4,273,407Total adjustments to capital funds P 22,363 (P 696,935)
December 31, 2004Changes in resources:
Interbank loans receivable 2.2 P 10,253,376 (P 10,253,376) P - P 11,379,978 (P11,379,978) P -Trading and available-for-sale
securities 2.2, 2.5 21,199,470 ( 21,199,470) - 17,486,792 ( 17,486,792) -Investments in bonds and
other debt instruments 2.2, 2.7 56,394,989 ( 56,394,989) - 52,341,567 ( 52,341,567) -Financial assets at fair value
through profit or loss 2.2, 2.5, 2.7 - 13,967,120 13,967,120 - 12,211,480 12,211,480Available-for-sale securities 2.2, 2.7, 2.9
2.11, 2.15 - 37,152,275 37,152,275 - 34,223,905 34,223,905Held-to-maturity investments 2.2, 2.7, 2.8 - 26,185,668 26,185,668 - 24,078,260 24,078,260Receivables from customers – net 2.2 60,022,423 ( 60,022,423) - 59,712,852 ( 59,712,852) -Loans and other receivables - net 2.2, 2.8, 2.11,
2.12 - 76,540,797 76,540,797 - 75,269,665 75,269,665Equity investments – net 2.6 1,608,530 ( 6,218) 1,602,312 5,752,475 ( 1,274,522) 4,477,953ROPA 2.2, 2.15 5,349,804 ( 5,349,804) - 5,332,628 ( 5,332,628) -Non-current assets held for sale 2.2, 2.15 - 139,975 139,975 - 139,974 139,974Investment properties 2.2, 2.15 - 4,970,114 4,970,114 - 4,970,114 4,970,114Other resources 2.2, 2.13, 2.15 11,309,962 ( 5,252,970) 6,056,992 9,906,449 ( 3,977,344) 5,929,105
166,138,554 476,699 166,615,253 161,912,741 ( 612,285) 161,300,456Changes in liabilities:
Deposit liabilities 2.2 128,051,703 595,615 128,647,318 125,380,953 498,997 125,879,950Bills payable 2.2, 2.3, 2.4
2.8 24,424,524 4,182,775 28,607,299 22,040,911 4,166,191 26,207,102Accrued interest, taxes and
other expenses 2.2 1,440,559 ( 1,440,559) - 1,104,491 ( 1,104,491) -Derivative liabilities 2.2, 2.10 - 616,393 616,393 - 332,557 332,557Other liabilities 2.2 5,935,636 ( 840,715) 5,094,921 5,663,431 ( 772,623) 4,890,808
P 6,286,132 P 3,649,322 P 7,722,955 P 3,990,039Total adjustments to capital funds (P2,636,810) (P3,732,916)
32 BANCO DE ORO
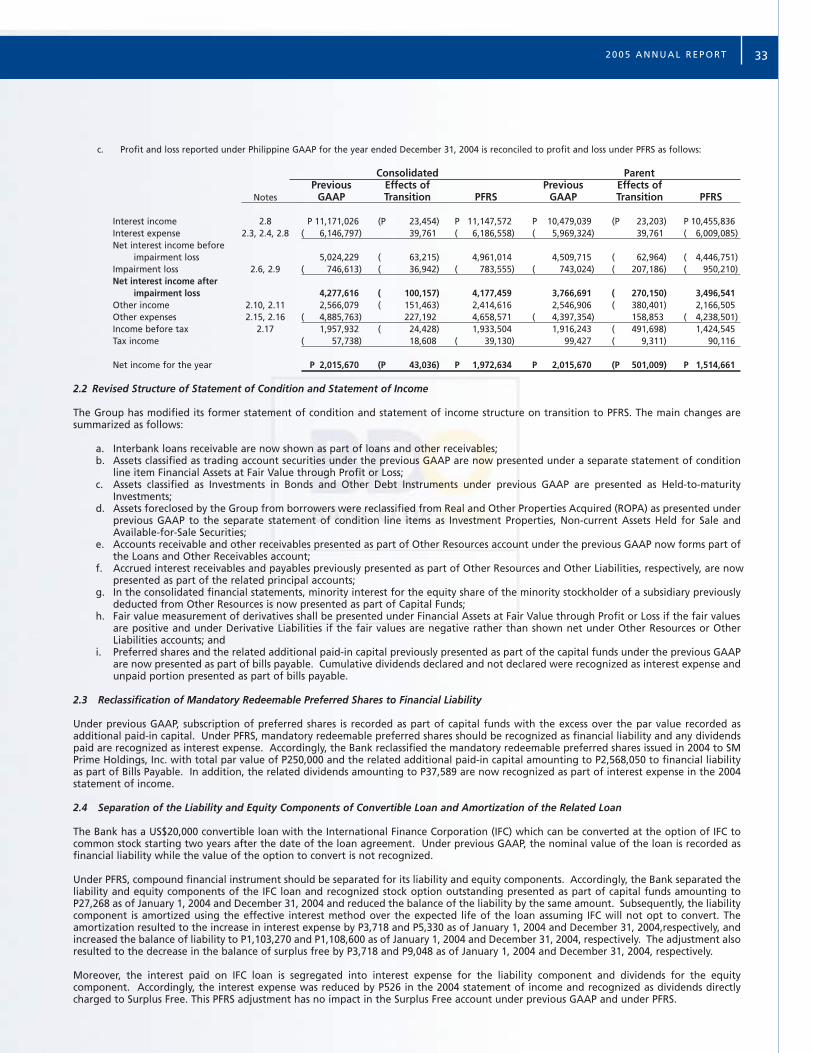
c. Profit and loss reported under Philippine GAAP for the year ended December 31, 2004 is reconciled to profit and loss under PFRS as follows:
Consolidated ParentPrevious Effects of Previous Effects of
Notes GAAP Transition PFRS GAAP Transition PFRS
Interest income 2.8 P 11,171,026 (P 23,454) P 11,147,572 P 10,479,039 (P 23,203) P 10,455,836Interest expense 2.3, 2.4, 2.8 ( 6,146,797) 39,761 ( 6,186,558) ( 5,969,324) 39,761 ( 6,009,085)Net interest income before
impairment loss 5,024,229 ( 63,215) 4,961,014 4,509,715 ( 62,964) ( 4,446,751)Impairment loss 2.6, 2.9 ( 746,613) ( 36,942) ( 783,555) ( 743,024) ( 207,186) ( 950,210)Net interest income after
impairment loss 4,277,616 ( 100,157) 4,177,459 3,766,691 ( 270,150) 3,496,541Other income 2.10, 2.11 2,566,079 ( 151,463) 2,414,616 2,546,906 ( 380,401) 2,166,505Other expenses 2.15, 2.16 ( 4,885,763) 227,192 4,658,571 ( 4,397,354) 158,853 ( 4,238,501)Income before tax 2.17 1,957,932 ( 24,428) 1,933,504 1,916,243 ( 491,698) 1,424,545Tax income ( 57,738) 18,608 ( 39,130) 99,427 ( 9,311) 90,116
Net income for the year P 2,015,670 (P 43,036) P 1,972,634 P 2,015,670 (P 501,009) P 1,514,661
2.2 Revised Structure of Statement of Condition and Statement of Income
The Group has modified its former statement of condition and statement of income structure on transition to PFRS. The main changes aresummarized as follows:
a. Interbank loans receivable are now shown as part of loans and other receivables;b. Assets classified as trading account securities under the previous GAAP are now presented under a separate statement of condition
line item Financial Assets at Fair Value through Profit or Loss;c. Assets classified as Investments in Bonds and Other Debt Instruments under previous GAAP are presented as Held-to-maturity
Investments;d. Assets foreclosed by the Group from borrowers were reclassified from Real and Other Properties Acquired (ROPA) as presented under
previous GAAP to the separate statement of condition line items as Investment Properties, Non-current Assets Held for Sale andAvailable-for-Sale Securities;
e. Accounts receivable and other receivables presented as part of Other Resources account under the previous GAAP now forms part ofthe Loans and Other Receivables account;
f. Accrued interest receivables and payables previously presented as part of Other Resources and Other Liabilities, respectively, are now presented as part of the related principal accounts;
g. In the consolidated financial statements, minority interest for the equity share of the minority stockholder of a subsidiary previouslydeducted from Other Resources is now presented as part of Capital Funds;
h. Fair value measurement of derivatives shall be presented under Financial Assets at Fair Value through Profit or Loss if the fair values are positive and under Derivative Liabilities if the fair values are negative rather than shown net under Other Resources or OtherLiabilities accounts; and
i. Preferred shares and the related additional paid-in capital previously presented as part of the capital funds under the previous GAAPare now presented as part of bills payable. Cumulative dividends declared and not declared were recognized as interest expense andunpaid portion presented as part of bills payable.
2.3 Reclassification of Mandatory Redeemable Preferred Shares to Financial Liability
Under previous GAAP, subscription of preferred shares is recorded as part of capital funds with the excess over the par value recorded asadditional paid-in capital. Under PFRS, mandatory redeemable preferred shares should be recognized as financial liability and any dividendspaid are recognized as interest expense. Accordingly, the Bank reclassified the mandatory redeemable preferred shares issued in 2004 to SMPrime Holdings, Inc. with total par value of P250,000 and the related additional paid-in capital amounting to P2,568,050 to financial liabilityas part of Bills Payable. In addition, the related dividends amounting to P37,589 are now recognized as part of interest expense in the 2004statement of income.
2.4 Separation of the Liability and Equity Components of Convertible Loan and Amortization of the Related Loan
The Bank has a US$20,000 convertible loan with the International Finance Corporation (IFC) which can be converted at the option of IFC tocommon stock starting two years after the date of the loan agreement. Under previous GAAP, the nominal value of the loan is recorded asfinancial liability while the value of the option to convert is not recognized.
Under PFRS, compound financial instrument should be separated for its liability and equity components. Accordingly, the Bank separated theliability and equity components of the IFC loan and recognized stock option outstanding presented as part of capital funds amounting toP27,268 as of January 1, 2004 and December 31, 2004 and reduced the balance of the liability by the same amount. Subsequently, the liabilitycomponent is amortized using the effective interest method over the expected life of the loan assuming IFC will not opt to convert. Theamortization resulted to the increase in interest expense by P3,718 and P5,330 as of January 1, 2004 and December 31, 2004,respectively, andincreased the balance of liability to P1,103,270 and P1,108,600 as of January 1, 2004 and December 31, 2004, respectively. The adjustment alsoresulted to the decrease in the balance of surplus free by P3,718 and P9,048 as of January 1, 2004 and December 31, 2004, respectively.
Moreover, the interest paid on IFC loan is segregated into interest expense for the liability component and dividends for the equitycomponent. Accordingly, the interest expense was reduced by P526 in the 2004 statement of income and recognized as dividends directlycharged to Surplus Free. This PFRS adjustment has no impact in the Surplus Free account under previous GAAP and under PFRS.
332005 ANNUAL REPORT
2.5 Recognition as Treasury Shares the Bank’s Common Stock Held by a Subsidiary
Under the previous GAAP, the shares of stock of the Bank held by a subsidiary, where the intention of the subsidiary is to hold the shares fortrading, was accounted for as trading account securities in the statements of condition instead of treasury shares in the consolidated financialstatements. Under PFRS, the shares of stock of the Bank should be accounted for as treasury stock in the consolidated statements of condition.Accordingly, in the consolidated financial statements, this resulted to the recognition of treasury shares in 2004 amounting to P45,731representing the acquisition cost of the unsold shares of stock of the Bank held by the subsidiary. No adjustment in the opening PFRSstatement of condition has been made since there was no outstanding shares of the Bank held by a subsidiary as of transition date.
2.6 Remeasurement of Investments in Subsidiaries and Associates at Cost, Recognition of Dividend Income and Test of Impairment of Investments
Under the previous GAAP in the parent company financial statements, investments in subsidiaries and associates were accounted for at cost,plus the Bank’s equity in net earnings or losses and other changes in its share in net assets of the investees from date of acquisition, less anyimpairment in value. These investments are now accounted for by the Bank at cost in the parent company financial statements as allowedunder PFRS. This resulted in the reversal of the previously recognized equity in net earnings of the subsidiaries and associates against theBank’s surplus free as of January 1, 2004 and December 31, 2004 amounting to P734,291 and P1,057,517, respectively. This also reduced thereported net income in 2004 by P323,226.
Also under previous GAAP in the parent company financial statements, the Bank recognizes its proportionate share on the fair value gain orloss directly recognized to capital funds in the books of its subsidiaries and associates. Under PFRS, the Bank’s investments in subsidiaries andassociates should be accounted for at cost. Accordingly, the equity share on the fair value loss recognized in the books of its subsidiaries andassociates that were also taken up by the Bank in its books amounting to P5,069 and P7,172 as of January 1, 2004 and December 31, 2004,respectively, were reversed by the Bank. Moreover, the Bank also recognized equity share in reserve for foreign exchange fluctuationrecognized directly to capital funds in the books of its subsidiaries. Accordingly, such equity share in reserve for foreign fluctuation carrieddirectly to capital funds in the books of its subsidiaries amounting to P4,418 and P6,536 as of January 1, 2004 and December 31, 2004,respectively, was reversed both in the parent company and consolidated financial statements.
Under the previous GAAP, dividends declared by the subsidiaries and associates are recognized as return of investments and deducted fromthe carrying amount of investments in the parent company financial statements. Under PFRS, in the parent company financial statements ofthe Bank, dividends received from the subsidiaries and associates are recognized as dividend income. Accordingly, the Bank recognizedP34,499 and P25,500 for the dividends declared by certain subsidiaries in December 31, 2004 and January 1, 2004, respectively. This alsoincreased the reported net income in 2004 by P8,999.
In the parent company financial statements, investments in subsidiaries and associates under PFRS are carried at cost less impairment losses, ifany. The Bank is required to test for impairment if there is an indication that the carrying amount of the Bank’s investment is impaired.Accordingly, the Bank recognized impairment amounting to P207,186 in 2004 as a result of the decline in value of an associate. The carryingamount of investment was reduced by P207,186 and the surplus free was reduced by the same amount.
2.7 Mark-to-Market Valuation of Available-for-Sale Financial Assets Previously Classified as Held-to-Maturity
The Group reclassified a portion of its held-to-maturity investments as available-for-sale as allowed under PAS 39 and by BSP to designate itsfinancial assets on the initial adoption of PFRS. Accordingly, these investments were re-measured at mark-to-market with changes d i r e c t l yrecognized to capital funds under Fair Value Gain (Loss) of Available-for-Sale Financial Asset account. The re-measurement of Available-For-Sale Financial Assets resulted to a loss of P12,154 as of January 1, 2004 and gain of P271,465 as of December 31, 2004 in the parent companyfinancial statements and a gain of P32,356 as of January 1, 2004 and P330,938 as of December 31, 2004 in the consolidated financialstatements.
2.8 Remeasurement of Certain Financial Assets Using the Effective Interest Method
Under the previous GAAP, the Group’s held-to-maturity investments previously classified as investments in bonds and other debt instrumentswere amortized using the straight-line method of accounting. Under PFRS, the Bank shall use the effective interest method in calculating theamortized cost and in allocating the related interest income over the relevant period covered. This resulted to the decrease in interest incomeamounting to P20,484 for the year ended December 31, 2004 and decline in the balance of held-to-maturity investments by P20,484 as ofDecember 31, 2004 both in the parent company and consolidated financial statements. The Bank did not adjust the opening PFRS statementof condition as of January 1, 2004 as it is impracticable to determine the effect as of January 1, 2004 due to system limitation.
Also, under the previous GAAP, certain consumer loans of the Bank (e.g., auto loans) were amortized using the rule of 78 method. Under thePFRS, the Group shall use the effective interest method in calculating the amortized cost and in allocating the related interest income over therelevant period covered. This resulted to the decrease in interest income amounting to P2,719 for the year ended December 31, 2004 anddecrease in the balance of loans and receivables by P2,719 as of December 31, 2004 both in the parent company and consolidated financialstatements. The Bank did not adjust the opening PFRS statement of condition as of January 1, 2004 due to immateriality of the relevantoutstanding consumer loans at such date.
Also, under the previous GAAP, transaction costs incurred on the issuance of Senior Notes were amortized on the straight-line basis. Underthe PFRS, the Bank shall use the effective interest method in amortizing transaction costs. Accordingly, this resulted to the decrease in interestexpense amounting to P2,632 for the year ended December 31, 2004 and increase in the balance of Bills Payable for Senior Notes by P2,632as of December 31, 2004 both in the parent company and consolidated financial statements. The Bank did not adjust the opening PFRSstatement of condition as of January 1, 2004 due to immateriality of the amount involved.
34 BANCO DE ORO
2.9 Impairment of Investment in Shares
Under the previous GAAP, the decline in value of the Group’s investment in club shares designated as available-for-sale financial assetsrecorded as part of Other Non-current Assets, was reported as a direct reduction to capital funds. Under PFRS, however, any decline in valueof available-for-sale financial assets, which are deemed as other-than-temporary, are recognized in profit or loss. Thus, in the consolidatedfinancial statements, the beginning balance of Fair Value Gain (Loss) of Available-for-Sale Financial Assets (previously presented as netunrealized decline in value of available-for-sale financial assets) in 2004 amounting to P2,120, previously reported as a component of capitalfunds in the 2004 statement of changes in capital funds, was charged against Surplus Free in the Group’s opening PFRS financial statements.Additional impairment of P110 incurred in 2004 was likewise reclassified and charged to Other Operating Expenses account in the 2004statement of income in the consolidated financial statements. In the consolidated financial statements, total adjustments in the beginningSurplus Free as of December 31, 2004 amounted to P2,230.
2.10 Revaluation of Derivatives
Under previous accounting practice, amounts contracted for derivatives are recorded as contingent accounts and are not included in thestatements of condition. Unrealized gains and losses on forward contracts designated as hedges are deferred and recognized as income orexpense over the term of the contract. Realized gains and losses on contracts that are not designated as hedges are credited or charged tocurrent operations. Under PFRS, derivatives are initially recognized at fair value on the date on which a derivative contract is entered into andare subsequently measured at fair value. All derivatives are carried as assets when the fair value is positive and as liabilities when fair valueis negative.
In the consolidated financial statements, this resulted in the recognition of P43,585 losses from the revaluation of the Group’s derivatives asof December 31, 2004. These were recorded as part of Trading Gain account in the statements of income. As of January 1, 2004, thesederivatives (foreign currency forwards) qualified for hedge accounting and had the approval of the BSP to apply hedge accounting.Accordingly, no adjustment on revaluation of derivatives was made as of January 1, 2004.
2.11 Recognition and Fair Value Measurement of Embedded Derivatives
Under PFRS, derivatives embedded in other financial instruments are treated as separate derivatives when their economic characteristics andrisks are not closely related to those of the host contract and the host contract is not carried at fair value through profit or loss. Theseembedded derivatives are measured at fair value with changes in fair value recognized in the statements of income.
Credit default swaps embedded in the credit linked notes (shown as part of Available-for-Sale Financial Assets account) or credit linkeddeposits (shown as part of Interbank Loans Receivable under Loans and Other Receivables account) qualified to be bifurcated and recognizedas separate derivatives. In the consolidated financial statements, this resulted in the recognition of losses on changes in fair value amountingto P88,084 in the January 1, 2004 opening PFRS statement of condition and loss on changes in fair value amounting to P16,290 as of December 31, 2004. This resulted to gain on change in fair value amounting to P71,794 in the 2004 statement of income.
2.12 Appropriation for General Loan Losses
As required under PAS 30, banks and similar financial institutions are required to record any amount set-up as general provision for loan lossesas an appropriation of Surplus Free rather than as part of profit or loss. Accordingly, the allowance for probable losses of a subsidiaryamounting to P5,143 both as of December 31, 2004 and January 1, 2004 have been reversed and recognized as appropriation for loan lossespresented under Surplus Reserves account in the statements of changes in capital funds in the consolidated financial statements.
2.13 Classification and Measurement of Intangible Asset with Indefinite Useful Life
As a result of the adoption of PAS 38, Intangibles Assets, the trading right of a subsidiary was presented as intangibles under Other Resourcesin the statements of condition in the consolidated financial statements. Also, the Group assessed that the life of the trading right is indefiniteas long as the subsidiary continues on its trading activities, thus, the trading right is carried at cost less impairment losses, if any. Accordingly,the amortization amounting to P264 charged in 2004 was reversed in the consolidated financial statements.
2.14 Recognition of Previously Unrecognized Results of Operations of BDO Remittance
The Group did not recognize income or loss of BDO Remittance starting from the time the Group acquired control over the operating andfinancial decision of BDO Remittance as the acquisition was completed near the statement of condition date. Under PFRS, business acquisitionshould be accounted for under purchase method and the Group should recognize income or loss from a subsidiary from the time of acquisition.Accordingly, the Group recognized the results of operations of BDO Remittance in 2004 starting from the time the Group had significantcontrol on the operations of BDO Remittance. Total loss recognized in 2004 amounted to P22,276 in the consolidated financial statements.
2.15 Classification of Real and Other Properties Acquired, Reversal of Allowance on ROPA and Measurement of Investment Properties and Non-current Assets Held for Sale
Under the previous GAAP, real and other properties acquired from borrowers through foreclosure or repossession are stated at cost (which isthe lower of the outstanding loan balance and bid price), less allowance for impairment. Under PFRS, the Group is required to classify its ROPAinto the following: investment property, non-current assets held for sale or financial assets. ROPA classified as investment property is carriedat cost less accumulated depreciation while non-current assets held for sale is carried at the lower of cost or fair value less costs to sell. As aresult of the adoption of the new standard, the Bank classified its ROPA as of January 1, 2004 and December 31, 2004 to investment properties,non-current assets held for sale, available-for-sale financial assets and other resources (for personal properties not saleable within one year).Moreover, previous allowance on ROPA amounting to P742,090 and P605,264 as of January 1, 2004 and December 31, 2004, respectively, bothin the parent company and consolidated financial statements was reversed.
352005 ANNUAL REPORT
With regard to investment property, the Group adopted the cost model and recognized cumulative depreciation on depreciable investmentproperties amounting to P174,444 and P265,543 as of January 1, 2004 and December 31, 2004, respectively, both in the parent company andconsolidated financial statements. In addition, the Bank recognized impairment on investment properties amounting to P567,646 andP329,140 as of January 1, 2004 and December 31, 2004, respectively, both in the parent company and consolidated financial statements.
On the other hand, non-current assets held for sale are measured at the lower of their carrying amount and fair value less costs to sell.Accordingly, the Bank recognized impairment loss due to the decline in the fair value of non-current assets held for sale amounting to P10,581as of December 31, 2004 both in the parent company and consolidated financial statements.
2.16 Full Recognition of Defined Benefit Obligation
Under PFRS, the Group’s obligation under post-employment defined benefit plan should be determined using projected unit credit method.The adoption of this new standard resulted in the recognition of transitional liability amounting to P191 in the parent company financialstatements and net additional transitional asset amounting to P3,394 in the consolidated financial statements as of January 1, 2004 afterconsidering the previously set-up accrued retirement liability. This transitional asset was recognized retrospectively in the Group’s openingPFRS statement of condition. This also resulted in the reversal of excess defined benefit expense in 2004 amounting to P158,852 in the parentcompany financial statements and P154,330 in the consolidated financial statements and recognition of transitional asset amounting to P4,198in the parent company financial statements and transitional liability amounting to P36,407 in the consolidated financial statements. The totaladjustments resulted to increase of the surplus free account by P158,661 and decrease by P191 as of December 31, 2004 and January 1, 2004,respectively, in the parent company financial statements and increase by P157,744 and P3,394 as of January 1, 2005 and 2004, respectively, inthe consolidated financial statements.
2.17 Deferred Tax Adjustments
The deferred tax expense recognized and reversed by the Group relates to derecognition of certain deferred tax assets totaling P75,484 in theparent company financial statements and P109,656 in the consolidated financial statements arising from net operating loss carryover and othertemporary differences as of December 31, 2004, and reversal of deferred tax assets of P30,853 as of January 1, 2004 in the consolidatedfinancial statements.
3. SUMMARY OF SIGNIFICANT ACCOUNTING POLICIES
The significant accounting policies that have been used in the preparation of these financial statements are summarized below. The policieshave been consistently applied to all years presented, unless otherwise stated.
3.1 Basis of Preparation
The financial statements of Banco de Oro Universal Bank and its subsidiaries have been prepared in accordance with generally acceptedaccounting principles in the Philippines as set forth in PFRSs.
The financial statements have been prepared on a historical cost basis, except for the valuation at fair value of certain financial assets. Themeasurement bases are more fully described in the accounting policies below.
Accounting estimates and assumptions are used in preparing the financial statements. Although these estimates are based on management'sbest knowledge of current events and actions, actual results may ultimately differ from those estimates.
The financial statements are presented in Philippine pesos, the Group’s functional currency, and all values represent absolute amounts exceptwhen otherwise indicated.
3.2 Impact of New and Revised Accounting Standards Effective Subsequent to 2005
There are new and revised accounting standards, amendments and interpretations to existing standards that have been published by IASB andadopted by the ASC which are mandatory for accounting periods beginning on or after January 1, 2006. The applicable standards, which theGroup has not opted to adopt early, are as follows:
2006PAS 19 (Amendment) : Employee BenefitsPAS 39 (Amendment) : Cash Flow Hedge Accounting of Forecast Intra-group TransactionPAS 39 (Amendment) : The Fair Value OptionPAS 39 and PFRS 4
(Amendment) : Financial Guarantee ContractsPFRS 1 (Amendment) : First-time Adoption of Philippine Financial Reporting StandardsIFRIC 4 : Determination Whether an Arrangement Contains a LeaseIFRIC 6 : Liabilities Arising from Participating in a Specific Market
2007PAS 1 (Amendment) : Presentation of Financial StatementsPFRS 7 : Financial Instruments: Disclosures
36 BANCO DE ORO
The Group will apply the relevant new accounting standards in 2006 and 2007 in accordance with their transitional provisions. It is currentlyevaluating the impact of those standards on its financial statements and has initially determined that the following new standards may havesignificant effects on the financial statements for 2006, as well as for prior and future periods:
• PAS 19 (Amended), Employee Benefits. This amendment introduces the option of an alternative recognition approach for actuarialgains and losses. It may impose additional recognition requirements for multi-employer plans where insufficient information isavailable to apply defined benefit accounting. It also adds new disclosure requirements. As the Group does not intend to changethe accounting policy adopted for recognition of actuarial gains and losses and does not participate in any multi-employer plans,adoption of this amendment will only impact the format and extent of disclosures presented in the accounts. The Group will applythis amendment from annual periods beginning January 1, 2006.
• PAS 39 (Amended), Cash Flow Hedge Accounting of Forecast Intra-group Transactions. The amendment allows the foreign currencyrisk of highly probable forecast intra-group transaction to qualify as a hedged item in the financial statements, provided that: (a) the transaction is denominated in a currency other than the functional currency of the entity entering into that transaction; and(b) the foreign currency risk will affect profit or loss. The Group is currently evaluating if this amendment will be relevant to itsoperations and reviewing if there are intra-group transactions that would qualify as hedged item in the financial statements as ofDecember 31, 2005 and 2004.
• PAS 39 (Amended), The Fair Value Option. This amendment changes the definition of financial instruments classified at fair valuethrough profit or loss and restricts the ability to designate financial instruments as part of this category. The Group believes thatthis amendment should not have a significant impact on the classification of financial instruments, as the Group should be able to comply with the amended criteria for the designation of financial instruments at fair value through profit and loss. The Group willapply this amendment from annual periods beginning January 1, 2006.
• PAS 39 and PFRS 4 (Amendment), Financial Guarantee Contracts. This amendment requires issued financial guarantees, other thanthose previously asserted by the entity to be insurance contracts, to be initially recognized at their fair value and subsequentlymeasured at the higher of: (a) the unamortized balance of the related fees received and deferred, and (b) the expenditure requiredto settle the commitment at the statement of condition date. Management considered this amendment to PAS 39 and is currently evaluating the impact to the Group’s financial statements.
• PFRS 7, Financial Instruments: Disclosures and complementary amendment to PAS 1. PFRS 7 introduces new disclosures to improvethe information about financial instruments. It requires the disclosure of qualitative and quantitative information about exposureto risks arising from financial instruments, including specified minimum disclosures about credit risk, liquidity risk and market risk,including sensitivity analysis to market risk. It replaces PAS 30, Disclosures in the Financial Statements of Banks and Similar FinancialInstitutions, and disclosure requirements in PAS 32, Financial Instruments: Disclosure and Presentation. It is applicable to all entitiesthat report under PFRS. The amendment to PAS 1 introduces disclosures about the level of an entity’s capital and how it managescapital. The Group assessed the impact of PFRS 7 and the amendment to PAS 1 and concluded that the main additional disclosureswill be the sensitivity analysis to market risk and the capital disclosures required by the amendment of PAS 1. The Group will applyPFRS 7 and the amendment to PAS 1 from annual periods beginning January 1, 2007.
• IFRIC 4, Determining whether an Arrangement Contains a Lease. IFRIC 4 requires the determination of whether an arrangement is or contains a lease to be based on the substance of the arrangement. It requires an assessment of whether: (a) fulfillment of thearrangement is dependent on the use of a specific asset or assets (the asset); and (b) the arrangement conveys a right to use theasset. Management is currently assessing the impact of IFRIC 4 on the Group’s operations.
As for the other new accounting standards, the Group has initially assessed that they will not result in significant changes to the amounts ordisclosures in its financial statements.
3.3 Principles of Consolidation
The consolidated financial statements comprise the accounts of the Bank (parent company) and its subsidiaries (BDO Capital, BDO Private Bank,BDO Financial, BDO Realty, BDO Insurance, BDO Card, Onshore, BDO Securities and BDO Remittance), referred to herein as the “Group”, afterelimination of material intercompany transactions.
Subsidiaries are fully consolidated from the date on which the Group obtains control. They are de-consolidated from the date that controlceases.
The purchase method of accounting is used to account for the acquisition of subsidiaries by the Group. The cost of the acquisition is measuredas the fair value of the assets given, equity instruments issued and liabilities incurred or assumed at the date of exchange, plus costs directlyattributable to the acquisition. Identifiable assets acquired and liabilities and contingent liabilities assumed in a business combination aremeasured initially at their fair values at the acquisition date, irrespective of the extent of any minority interest. The excess of the cost ofacquisition over the fair value of the Group’s share of the identifiable net assets acquired, is recorded as goodwill. If the cost of acquisition isless than the fair value of the net assets of the subsidiary acquired, the difference is recognized directly in the statements of income (see Note 3.12).
Inter-company transactions, balances and unrealized gains on transactions between group companies are eliminated. Unrealized losses arealso eliminated unless the transaction provides evidence of impairment of the asset transferred. Accounting policies of subsidiaries have beenchanged where necessary to ensure consistency with the policies adopted by the Group.
372005 ANNUAL REPORT
The financial statements of subsidiaries are prepared, except for BDO Remittance, for the same reporting period as the parent company, usingconsistent accounting principles. BDO Remittance, however, has prepared financial statements using the same accounting period as theparent for consolidation purposes.
In the consolidated financial statements, the minority interest component in the 2005 and 2004 financial statements are shown in thestatements of changes in capital funds.
3.4 Segment Reporting
A business segment is a group of assets and operations engaged in providing products or services that are subject to risks and returns that aredifferent from those of other business segments. A geographical segment is engaged in providing products or services within a particulareconomic environment that is subject to risks and returns that are different from those of segments operating in other economic environments.
3.5 Cash and Cash Equivalents
For purposes of the cash flows statement, cash and cash equivalents comprise balances with less than three months’ maturity from the dateof acquisition, including: cash and non-restricted balances with the BSP and amounts due from other banks. Cash and cash equivalents areinitially and subsequently measured at fair value.
3.6 Financial Assets
Financial assets include cash and financial instruments. The Group classifies its financial assets, other than hedging instruments, into thefollowing categories: financial assets at fair value through profit or loss, loans and receivables, held-to-maturity investments and available-for-sale financial assets. Financial assets are assigned to the different categories by management on initial recognition, depending on the purposefor which the investments were acquired. The designation of financial assets is re-evaluated at every reporting date at which date a choiceof classification or accounting treatment is available, subject to compliance with specific provisions of applicable accounting standards.
All financial assets that are not classified as at fair value through profit or loss are initially recognized at fair value, plus transaction costs.
• Financial Assets at Fair Value Through Profit or Loss. This category includes derivative financial instruments and financial assets thatare either classified as held for trading or are designated by the entity to be carried at fair value through profit or loss upon initialrecognition. A financial asset is classified in this category if acquired principally for the purpose of selling in the short term or if sodesignated by management. Derivatives are also categorized as “held for trading” unless they are designated as hedges.
Subsequent to initial recognition, the financial assets included in this category are measured at fair value with changes in fair valuerecognized in profit or loss. Financial assets originally designated as financial assets at fair value through profit or loss may notsubsequently be reclassified.
• Loans and Receivables. Loans and receivables are non-derivative financial assets with fixed or determinable payments that are notquoted in an active market. They arise when the Group provides money, goods or services directly to the debtor with no intentionof trading the receivables. Included in this category are those arising from direct loans to customers, interbank loans, sales contractreceivables, and all receivables from customers and other banks.
Loans and receivables are subsequently measured at amortized cost using the effective interest method, less impairment losses.
Securities Purchases Under Reverse Repurchase Agreement wherein the Bank and a subsidiary enter into short-term purchases ofsecurities under reverse repurchase agreements of substantially identical securities with the BSP, are included in this category. Thedifference between the sale and repurchase price is treated as interest and accrued over the life of the agreements using theeffective interest method.
Impairment losses is the estimated amount of losses in the Group’s loan portfolio, based on the evaluation of the future cash flowsdiscounted at the loan’s original effective interest rates or the last repricing rate for loans issued at variable rates (see Note 3.18). Itis established through an allowance account which is charged to expense. Loans and receivables are written off against theallowance for impairment losses when management believes that the collectibility of the principal is unlikely, subject to BSPregulations.
• Held-to-maturity Investments. This includes non-derivative financial assets with fixed or determinable payments and a fixed date ofmaturity. Investments are classified as held-to maturity if the Group has the positive intention and ability to hold them untilmaturity. Investments intended to be held for an undefined period are not included in this classification.
Held-to-maturity investments consist of government and private debt securities. Should the Group sell other than an insignificantamount of held-to-maturity assets, the entire category would be tainted and reclassified as available-for-sale financial assets.
Held-to-maturity investments are subsequently measured at amortized cost using the effective interest method. In addition, if thereis objective evidence that the investment has been impaired, the financial asset is measured at the present value of estimated cashflows (see Note 3.18). Any changes to the carrying amount of the investment due to impairment are recognized in profit or loss.
38 BANCO DE ORO
• Available-for-sale Financial Assets. This includes non-derivative financial assets that are either designated to this category or do notqualify for inclusion in any of the other categories of financial assets.All financial assets within this category are subsequently measured at fair value, unless otherwise disclosed, with changes in valuerecognized in capital funds, net of any effects arising from income taxes. Gains and losses arising from securities classified asavailable-for-sale are recognized in the statements of income when they are sold or when the investment is impaired.
In the case of impairment, any loss previously recognized in capital funds is transferred to the statements of income (see Note 3.18).Losses recognized in the statements of income on equity investments are not reversed through the statements of income. Lossesrecognized in prior period statements of income resulting from the impairment of debt instruments are reversed through thestatements of income, when there is recovery in the amount of previously recognized impairment losses.
The fair values of quoted investments in active markets are based on current bid prices. If the market for a financial asset is not active (andfor unlisted securities), the Group establishes fair value by using valuation techniques, which include the use of recent arm’s lengthtransactions, discounted cash flow analysis, option pricing models and other valuation techniques commonly used by market participants.
Gains and losses arising from changes in the fair value of the financial assets at fair value through profit or loss category are included in Tradingand Securities Gain – net account in the statements of income in the period in which they arise. Gains and losses arising from changes in thefair value of available-for-sale financial assets are recognized directly in capital funds, until the financial asset is derecognized or impaired atwhich time the cumulative gain or loss previously recognized in capital funds shall be recognized in profit or loss. However, interest calculatedusing the effective interest method is recognized in the statements of income. Dividends on available-for-sale equity instruments arerecognized in the statement of income when the entity’s right to receive payment is established.
Non-compounding interest and other cash flows resulting from holding financial assets are recognized in profit or loss when received,regardless of how the related carrying amount of financial assets is measured.
Derecognition of financial assets occurs when the rights to receive cash flows from the financial instruments expire or are transferred andsubstantially all of the risks and rewards of ownership have been transferred.
3.7 Derivative Financial Instruments and Hedge Accounting
The Group is a party to various foreign currency forward and swap contracts and cross-currency and interest rate swaps. These contracts areentered into as a service to customers and as a means of reducing or managing the Group’s foreign exchange and interest rate exposures aswell as for trading purposes.
Derivatives are initially recognized at fair value on the date on which derivative contract is entered into and are subsequently measured attheir fair value. Fair values are obtained from quoted market prices in active markets, including recent market transactions, and valuationtechniques, including discounted cash flow models and option pricing models, as appropriate. All derivatives are carried as assets when fairvalue is positive and as liabilities when fair value is negative.
The best evidence of the fair value of a derivative at initial recognition is the transaction price (the fair value of the consideration given orreceived) unless the fair value of that instrument is evidenced by comparison with other observable current market transactions in the sameinstrument or based on a valuation technique whose variables include only data from observable markets. When such evidence exists, theGroup recognizes profits at initial recognition.
Certain derivatives embedded in other financial instruments, such as the conversion option in a convertible bond and credit default swap in acredit linked note, are considered as separate derivatives when their economic characteristics and risks are not closely related to those of thehost contract and the host contract is not carried at fair value through profit or loss. These embedded derivatives are measured at fair valuewith changes in fair value recognized in the statements of income.
Except for derivatives that qualify as a hedging instrument, change in the fair value of derivatives are recognized in profit or loss. The methodof recognizing the resulting fair value gain or loss on derivatives that qualify as hedging instrument depends on the hedging relationshipdesignated by the Group. The Group designates certain derivatives as either: (1) hedges of the fair value of recognized assets or liabilities orfirm commitments (fair value hedge); or (2) hedges of highly probable future cash flows attributable to a recognized asset or liability, or aforecasted transaction (cash flow hedge). Hedge accounting is used for derivatives designated in this way provided certain criteria are met.
The Group documents, at the inception of the transaction, the relationship between hedging instruments and hedged items, as well as its riskmanagement objective and strategy for undertaking various hedge transactions. The Group also documents its assessment, both at hedgeinception and on an ongoing basis, of whether the derivatives that are used in hedging transactions are highly effective in offsetting changesin fair values or cash flows of hedged items.
• Fair value hedge. Changes in the fair value of derivatives that are designated and qualify as fair value hedges are recorded in thestatements of income, together with any changes in the fair value of the hedged asset or liability that are attributable to the hedgedrisk.
If the hedge no longer meets the criteria for hedge accounting, the adjustment to the carrying amount of a hedged item for whichthe effective interest method is used is amortized to profit or loss over the period to maturity. The adjustment to the carryingamount of a hedged equity security remains as part of capital funds until the disposal of the equity security.
• Cash flow hedge. The effective portion of changes in the fair value of derivatives that are designated and qualify as cash flowhedges are recognized in capital funds. The gain or loss relating to the ineffective portion is recognized immediately in thestatements of income.
392005 ANNUAL REPORT
Amounts accumulated in capital funds are recycled to the statements of income in the periods in which the hedged item will affectprofit or loss (for example, when the forecast sale that is hedged takes place).
When a hedging instrument expires or is sold, or when a hedge no longer meets the criteria for hedge accounting, any cumulativegain or loss existing in capital funds at that time remains in capital funds and is recognized when the forecast transaction isultimately recognized in the statements of income. When a forecast transaction is no longer expected to occur, the cumulative gainor loss that was reported in equity is immediately transferred to the statements of income.
• Derivatives that do not qualify for hedge accounting. Certain derivative instruments do not qualify for hedge accounting. Changesin the fair value of any derivative instrument which do not qualify for hedge accounting are recognized immediately in thestatements of income.
3.8 Bank Premises, Furniture, Fixtures and Equipment
Bank premises, furniture, fixtures and equipment are carried at acquisition cost less accumulated depreciation and amortization andimpairment in value.
The cost of an asset comprises its purchase price and directly attributable costs of bringing the asset to working condition for its intended use.Expenditures for additions, major improvements and renewals are capitalized; expenditures for repairs and maintenance are charged toexpense as incurred. When assets are sold, retired or otherwise disposed of, their cost and related accumulated depreciation and amortizationand impairment losses are removed from the accounts and any resulting gain or loss is reflected in income for the period.
Depreciation is computed on the straight-line method over the estimated useful lives of the depreciable assets as follows:
Buildings 10 - 25 yearsFurniture, fixtures and equipment 5 years
Leasehold rights and improvements are amortized over the term of the lease or the estimated useful lives of the improvements, whichever isshorter.
An asset’s carrying amount is written down immediately to its recoverable amount if the asset’s carrying amount is greater than its estimated recoverable amount (see Note 3.19).
The residual values and estimated useful lives of bank premises, furniture, fixtures and equipment are reviewed, and adjusted if appropriate, at each statement of condition date.
An item of bank premises, furniture, fixtures and equipment is derecognized upon disposal or when no future economic benefits are expectedto arise from the continued use of the asset. Any gain or loss arising on derecognition of the asset (calculated as the difference between thenet disposal proceeds and the carrying amount of the item) is included in the statements of income in the year the item is derecognized.
3.9 Equity Investments
In the parent company financial statements, the Bank’s investments in subsidiaries and associates are accounted for at cost, less any impairmentloss. If there is objective evidence that the investments in subsidiaries and associates will not be recovered, an impairment loss is provided.Impairment loss is measured as the difference between the carrying amount of the investment and the present value of the estimated cashflows discounted at the current market rate of return for similar financial asset. The amount of the impairment loss is recognized in the profitor loss. Impairment losses recognized are not reversed.
Subsidiaries are all entities (including special purpose entities) over which the Bank has the power to govern the financial reporting policiesgenerally accompanying a shareholding of more than one half of the voting rights. The Bank obtains and exercises control through votingrights. The existence and effect of potential voting rights that are currently exercisable and convertible are considered when assessingwhether the Bank controls another entity.
Associates are those entities over which the Bank is able to exert significant influence but which are neither subsidiaries nor interests in a jointventure.
In the consolidated financial statements, investments in associates are accounted for under equity method of accounting and are initiallyrecognized at cost. The Group’s investment in associates includes goodwill, if any, (net of any accumulated impairment loss) identified onacquisition. The Group’s share of its associates’ post-acquisition profits or losses is recognized in the statements of income, and its share ofpost-acquisition movements in reserves is recognized in reserves. The cumulative post-acquisition movements are adjusted against the carryingamount of investment. When the Group’s share of losses in an associate equals or exceeds its interest in the associate, including any otherunsecured receivables, the Group does not recognize further losses, unless it has incurred obligations or made payments on behalf of theassociate.
In the consolidated financial statements, unrealized gains on transactions between the Group and its associates, if any, are eliminated to theextent of the Group’s interest in the associates. Unrealized losses are also eliminated unless the transaction provides evidence of animpairment of the asset transferred. Accounting policies have been changed where necessary to ensure consistency with the policies adoptedby the Group.
40 BANCO DE ORO
3.10 Investment Properties
Investment properties are stated at cost. The cost of an investment property comprises its purchase price and directly attributable costincurred. This also includes land and building acquired by the Bank from defaulting borrowers not held for sale in the next twelve months.For these assets, the cost is recognized initially at the lower of the outstanding loan balance or bid price, which should not be higher than theappraised value of the property. Investment properties are depreciated over a period of five years.
3.11 Non-current Assets Held for Sale
Assets held-for-sale include real and other properties acquired through repossession or foreclosure that the Bank intends to sell within oneyear from the date of classification as held for sale.
Assets classified as held-for-sale are measured at the lower of their carrying amounts, immediately prior to their classification as held for saleand their fair value less costs to sell. Assets classified as held-for-sale are not subject to depreciation or amortization. The profit or loss arisingfrom the sale or revaluation of held-for-sale assets is included in the Other Income (Expenses) account in the statements of income.
3.12 Intangible Assets
Goodwill represents the excess of the cost of acquisition over the fair value of the Bank’s acquisition of certain assets and liabilities of UnitedOverseas Bank Philippines and branch licenses at the date of acquisition. Goodwill is classified as intangible asset with indefinite useful life,and thus, not subject to amortization but would require an annual test for impairment. Goodwill is subsequently carried at cost lessaccumulated impairment losses.
Goodwill is allocated to cash generating units for the purpose of impairment testing. Each of those cash generating units is represented byeach primary reporting segment (see Note 3.19).
Acquired computer software licenses are capitalized on the basis of the costs incurred to acquire and install the specific software. These costsare amortized on the basis of the expected useful lives five years. Costs associated with maintaining computer software are expensed asincurred.
The cost of acquired branch license is capitalized as part of deferred charges and amortized over a period of five years.
3.13 Financial Liabilities
Financial liabilities of the Group include deposit liabilities, bills payable, derivative liabilities and other liabilities.
Financial liabilities are recognized when the Group becomes a party to the contractual agreements of the instrument. All interest relatedcharges are recognized as an expense in the statements of income.
Deposit liabilities and other liabilities are recognized initially at their fair value and subsequently measured at amortized cost less settlementpayments.
Bills payable are recognized initially at fair value, which is the issue proceeds (fair value of consideration received) net of direct issue costs.Bills payable are subsequently stated at amortized cost; any difference between proceeds net of transaction costs and the redemption valueis recognized in the statements of income over the period of the borrowings using the effective interest method.
Preferred shares, which carry a mandatory coupon or are redeemable on a specific date or at the option of the shareholder, are classified asfinancial liabilities and are presented as part of Bills Payable in the statements of condition. The dividends on these preferred sharesrecognized in the statements of income as interest expense on an amortized cost basis using the effective interest method.
The fair value of the liability portion of a convertible bond is determined using a market interest rate for an equivalent non-convertible bond.This amount is recorded as a liability on an amortized cost basis until extinguished on conversion or maturity of the bond. The remainder ofthe proceeds is allocated to the conversion option. This is recognized and included in capital funds, net of income tax effects.
Derivative liabilities are recognized initially at fair value and subsequently measured at fair value with changes in fair value recognized in thestatements of income.
Dividend distributions to shareholders are recognized as financial liabilities when the dividends are approved by the shareholders.
Financial liabilities are derecognized in the statements of condition only when the obligations are extinguished either through discharge,cancellation or expiration.
3.14 Offsetting Financial Instruments
Financial assets and liabilities are offset and the net amount reported in the statements of condition when there is a legally enforceable rightto offset the recognized amounts and there is an intention to settle on a net basis or realize the asset and settle the liability simultaneously.
412005 ANNUAL REPORT
3.15 Provisions
Provisions are recognized when present obligations will probably lead to an outflow of economic resources and they can be estimated reliablyeven if the timing or amount of the outflow may still be uncertain. A present obligation arises from the presence of a legal or constructivecommitment that has resulted from past events, for example, legal disputes or onerous contracts.
Provisions are measured at the estimated expenditure required to settle the present obligation, based on the most reliable evidence availableat the statement of condition date, including the risks and uncertainties associated with the present obligation. Any reimbursement expectedto be received in the course of settlement of the present obligation is recognized, if virtually certain as a separate asset, not exceeding theamount of the related provision. Where there are a number of similar obligations, the likelihood that an outflow will be required in settlementis determined by considering the class of obligations as a whole. In addition, long-term provisions are discounted to their present values, wheretime value of money is material.
Provisions are reviewed at each statement of condition date and adjusted to reflect the current best estimate.
In those cases where the possible outflow of economic resource as a result of present obligations is considered improbable or remote, or theamount to be provided for cannot be measured reliably, no liability is recognized in the financial statements.
Probable inflows of economic benefits that do not yet meet the recognition criteria of an asset are considered contingent assets, hence, arenot recognized in the financial statements.
3.16 Revenue and Cost Recognition
Revenue is recognized to the extent that it is probable that the economic benefits will flow to the Group and the revenue can be reliablymeasured. The following specific recognition criteria of income and expenses must also be met before revenue is recognized:
• Interest income and expenses are recognized in the statements of income for all instruments measured at amortized cost using the effective interest method.
The effective interest method is a method of calculating the amortized cost of a financial asset or a financial liability and ofallocating the interest income or interest expense over the relevant period. The effective interest rate is the rate that exactlydiscounts estimated future cash payments or receipts through the expected life of the financial instrument or, when appropriate, a shorter period to the net carrying amount of the financial asset or financial liability. When calculating the effective interest rate,the Group estimates cash flows considering all contractual terms of the financial instrument but does not consider future creditlosses. The calculation includes all fees and points paid or received between parties to the contract that are an integral part of the effective interest rate, transaction costs and all other premiums or discounts.
Once a financial asset or a group of similar financial assets has been written down as a result of an impairment loss, interest incomeis recognized using the rate of interest used to discount the future cash flows for the purpose of measuring the impairment loss.
• Trading Gain – when the ownership of the securities is transferred to the buyer (at an amount equal to the excess of the selling priceover the carrying amount of securities) and as a result of the mark-to-market valuation of the securities at year end.
• Service charges, fees and commissions are generally recognized when the service has been provided. Loan commitment fees for loansthat are likely to be drawn down are deferred (together with related direct costs) and recognized as an adjustment to the effectiveinterest rate on the loan. Loan syndication fees are recognized as revenue when the syndication has been completed and the Groupretained no part of the loan package for itself or retained a part at the same effective interest rate for the other participants.Commission and fees arising from negotiating, or participating in the negotiation of a transaction for a third party – such as thearrangement of the acquisition of shares or other securities or the purchase or sale of businesses- are recognized on the completionof the underlying transaction. Portfolio and other management advisory and service fees are recognized based on the applicableservice contracts, usually on a time-proportionate basis. Asset management fees related to investment funds are recognized ratablyover the period the service is provided. The same principle is applied for wealth management, financial planning and custody servicesthat are continuously provided over an extended period of time.
• Profit from assets sold or exchanged – when the title to the assets is transferred to the buyer or as gross profit is realized in the caseof sale accounted for as installment sale, or when the collectibility of the entire sales price is reasonably assured. This is included inthe Trading Gain account in the statements of income.
Cost and expenses are recognized in the statements of income upon utilization of the assets or services or at the date they are incurred.
3.17 Leases
Group as Lessee – Leases, which do not transfer to the Group substantially all the risks and benefits of ownership of the asset, are classified asoperating leases. Operating lease payments are recognized as expense in the statements of income on a straight-line basis over the lease term.
Group as Lessor – Leases, which do not transfer to the lessee substantially all the risks and benefits of ownership of the asset, are classified asoperating leases. Operating lease collections are recognized as income in the statements of income on a straight-line basis over the lease term.
42 BANCO DE ORO
3.18 Impairment of financial assets
The Group assesses at each statement of condition date whether there is objective evidence that a financial asset or group of financial assetsis impaired. A financial asset or a group of financial assets is impaired and impairment losses are incurred if, and only if, there is objectiveevidence of impairment as a result of one or more events that occurred after the initial recognition of the asset (a loss event) and that lossevent has an impact on the estimated future cash flows of the financial asset or group of financial assets that can be reliably estimated.Objective evidence that a financial asset or group of assets is impaired includes observable data that comes to the attention of the Groupabout certain loss events, including, among others: significant financial difficulty of the issuer or debtor; a breach of contract, such as a defaultor delinquency in interest or principal payments; it is probable that the borrower will enter bankruptcy or other financial reorganization; thedisappearance of an active market for that financial asset because of financial difficulties; or observable data indicating that there is ameasurable decrease in the estimated future cash flows from a group of financial assets since the initial recognition of those assets, althoughthe decrease cannot yet be identified with the individual financial assets in the group.
• Assets carried at amortized cost. The Group first assesses whether objective evidence of impairment exists individually for financialassets that are individually significant and individually or collectively for financial assets that are not individually significant. If theGroup determines that no objective evidence of impairment exists for an individually assessed financial asset, whether significant ornot, the Group includes the asset in a group of financial assets with similar credit risk characteristics and collectively assesses themfor impairment. Assets that are individually assessed for impairment and for which an impairment loss is or continues to berecognized are not included in a collective assessment of impairment.
If there is objective evidence that an impairment loss on loans and receivable or held-to-maturity investments carried at amortizedcost has been incurred, the amount of the loss is measured as the difference between the asset’s carrying amount and the presentvalue of estimated future cash flows (excluding future credit losses that have not been incurred) discounted at the financial asset’soriginal effective interest rate. The carrying amount of the asset is reduced through the use of an allowance account and theamount of the loss is recognized in the statements of income. If a loan or held-to-maturity investment has a variable interest rate,the discount rate for measuring any impairment loss is the current effective interest rate determined under the contract. Whenpracticable, the Group may measure impairment on the basis of an instrument’s fair value using an observable market price.
The calculation of the present value of the estimated future cash flows of a collateralized financial asset reflects the cash flows thatmay result from foreclosure less costs for obtaining and selling the collateral, whether or not foreclosure is probable.
For the purpose of a collective evaluation of impairment, financial assets are grouped on the basis of similar credit risk characteristics(i.e., on the basis of the Group’s or BSP’s grading process that considers asset type, industry, geographical location, collateral type,past-due status and other relevant factors). Those characteristics are relevant to the estimation of future cash flows for groups ofsuch assets by being indicative of the debtors’ ability to pay all amounts due according to the contractual terms of the assets beingevaluated.
Future cash flows in a group of financial assets that are collectively evaluated for impairment are estimated on the basis of thecontractual cash flows of the assets and historical loss experience for assets with credit risk characteristics similar to those in thegroup. Historical loss experience is adjusted on the basis of current observable data to reflect the effects of current conditions thatdid not affect the period on which the historical loss experience is based and to remove the effects of conditions in the historicalperiod that do not exist currently.
Estimates of changes in future cash flows for groups of assets should reflect and be consistent with changes in related observabledata from period to period. The methodology and assumptions used for estimating future cash flows are reviewed regularly by theGroup to reduce any differences between loss estimates and actual loss experience.
When a loan is uncollectible and subject to BSP guidelines, it is written off against the related allowance for loan impairment. Suchloans are written off after all the necessary procedures including approval from the management have been completed and theamount of the loss has been determined. Subsequent recoveries of amounts previously written off decrease the amount of theimpairment loss in the statements of income.
If, in a subsequent period, the amount of the impairment loss decrease and the decrease can be related objectively to an eventoccurring after the impairment was recognized (such as an improvement in the debtor’s credit rating), the previously recognizedimpairment loss is reversed by adjusting the allowance account. The amount of the reversal is recognized in the statements ofincome.
• Assets carried at fair value with changes charged to capital funds. In the case of equity investments classified as available-for-salefinancial assets, a significant or prolonged decline in the fair value of the security below its cost is considered in determining whetherthe assets are impaired. If any such evidence exists for available-for-sale financial assets, the cumulative loss – measured as thedifference between the acquisition cost and the current fair value, less any impairment loss on that financial asset previouslyrecognized in profit or loss – is removed from capital funds and recognized in the statements of income. Impairment lossesrecognized in the statements of income on equity instruments are not reversed through the statements of income. If, in asubsequent period, the fair value of a debt instrument classified as available-for-sale increases and the increase can be objectivelyrelated to an event occurring after the impairment loss was recognized in profit or loss, the impairment loss is reversed through thestatements of income.
• Assets carried at cost. The Group assesses at each statement of condition date whether there is objective evidence that any of theunquoted equity securities and derivative assets linked to and required to be settled in such unquoted equity instruments, which arecarried at cost and for which objective evidence of impairment exist. The amount of impairment loss is the difference between thecarrying amount of the equity security and the present value of the estimated future cash flows discounted at the current marketrate of return of a similar asset. Impairment losses on assets carried at cost cannot be reversed.
432005 ANNUAL REPORT
3.19 Impairment of Non-financial Assets
The Group’s equity investments, intangible assets (recorded as part of Other Resources), bank premises, furniture, fixtures and equipment andinvestment properties are subject to impairment testing. Intangible assets with an indefinite useful life or those not yet available for use aretested for impairment at least annually. All other individual assets or cash-generating units are tested for impairment whenever events orchanges in circumstances indicate that the carrying amount may not be recoverable.
For purposes of assessing impairment, assets are grouped at the lowest levels for which there are separately identifiable cash flows (cash-generating units). As a result, some assets are tested individually for impairment and some are tested at cash-generating unit level.
An impairment loss is recognized for the amount by which the asset or cash-generating unit’s carrying amount exceeds its recoverable amount.The recoverable amount is the higher of fair value, reflecting market conditions less costs to sell and value in use, based on an internaldiscounted cash flow evaluation. Impairment loss is charged pro rata to the other assets in the cash generating unit.
All assets are subsequently reassessed for indications that an impairment loss previously recognized may no longer exist and the carryingamount of the asset is adjusted to the recoverable amount resulting in the reversal of the impairment loss.
3.20 Functional Currency and Foreign Currency Transactions
• Functional and presentation currency
Items included in the financial statements of the Group are measured using the currency of the primary economic environment inwhich the entity operates (the “functional currency”). The financial statements are presented in Philippine peso, which is also theGroup’s functional currency. The financial statements of the foreign currency deposit units (FCDUs) of the Bank and a subsidiary,which are expressed in United States (US) dollars as their functional currency, and of BDO Remittance, which is expressed inHongkong dollars, are translated at the prevailing current exchange rates for statement of condition accounts and averageexchange rate during the year for profit or loss accounts.
• Transactions and balances
The accounting records of the Group are maintained in Philippine pesos except for the FCDUs and BDO Remittance which aremaintained in US and Hongkong dollars, respectively. Foreign currency transactions during the period are translated into thefunctional currency at exchange rates which approximate those prevailing on transaction dates.
Foreign exchange gains and losses resulting from the settlement of such transactions and from the translation at year-end exchangerates of monetary assets and liabilities denominated in foreign currencies are recognized in the statements of income.
3.21 Employee Benefits
• Retirement Benefit Obligations
Pension benefits are provided to employees through a defined benefit plan, as well as defined contribution plan.
A defined benefit plan is a pension plan that defines an amount of pension benefit that an employee will receive on retirement,usually dependent on one or more factors such as age, years of service and salary. The legal obligation for any benefits from thiskind of pension plan remains with the Group, even if plan assets for funding the defined benefit plan have been acquired. Planassets may include assets specifically designated to a long-term benefit fund, as well as qualifying insurance policies. The Group’sdefined benefit pension plan covers all regular full-time employees. The pension plan is tax-qualified, noncontributory andadministered by a trustee.
The liability recognized in the statements of condition for defined benefit pension plans is the present value of the defined benefitobligation (DBO) at the statement of condition date less the fair value of plan assets, together with adjustments for unrecognizedactuarial gains or losses and past service costs. The DBO is calculated by independent actuaries using the projected unit creditmethod. The present value of the DBO is determined by discounting the estimated future cash outflows using interest rates of highquality corporate bonds that are denominated in the currency in which the benefits will be paid and that have terms to maturityapproximating to the terms of the related pension liability.
Actuarial gains and losses are not recognized as an expense unless the total unrecognized gain or loss exceeds 10% of the greaterof the obligation and related plan assets. The amount exceeding this 10% corridor is charged or credited to profit or loss over the employees’ expected average remaining working lives. Actuarial gains and losses within the 10% corridor are disclosed separately. Past-service costs are recognized immediately in the statements of income, unless the changes to the pension plan are conditionalon the employees remaining in service for a specified period of time (the vesting period). In this case, the past service costs areamortized on a straight-line basis over the vesting period.
A defined contribution plan is a pension plan under which the Group pays fixed contributions into an independent entity. TheGroup has no legal or constructive obligations to pay further contributions after payment of the fixed contribution. Thecontributions recognized in respect of defined contribution plans are expensed as they fall due. Liabilities and assets may berecognized if underpayment or prepayment has occurred and are included in current liabilities or current assets as they are normallyof a short term nature.
44 BANCO DE ORO
• Termination Benefits
Termination benefits are payable when employment is terminated by the Group before the normal retirement date, or wheneveran employee accepts voluntary redundancy in exchange for these benefits. The Group recognizes termination benefits when it isdemonstrably committed to either: (a) terminating the employment of current employees according to a detailed formal planwithout possibility of withdrawal; or (b) providing termination benefits as a result of an offer made to encourage voluntaryredundancy. Benefits falling due more than 12 months after the statement of condition date are discounted to present value.
• Bonus Plans
The Group recognizes a liability and an expense for bonuses based on the Group’s bonus policy. The Group recognizes a provision where it is contractually obliged to pay the benefits.
• Compensated Absences
Compensated absences are recognized for the number of paid leave days (including holiday entitlement) remaining at the statementof condition date. They are included in Other Liabilities account at the undiscounted amount that the Group expects to pay as aresult of the unused entitlement.
3.22 Income Taxes
Current income tax assets or liabilities comprise those claims from, or obligations to, fiscal authorities relating to the current or prior reportingperiod, that are uncollected or unpaid at the statement of condition date. They are calculated according to the tax rates and tax lawsapplicable to the fiscal periods to which they relate, based on the taxable profit for the year. All changes to current tax assets or liabilities arerecognized as a component of tax expense in the statements of income.
Deferred tax is provided, using the balance sheet liability method, on temporary differences at the statement of condition date between thetax base of assets and liabilities and their carrying amounts for financial reporting purposes.
Under the balance sheet liability method, with certain exceptions, deferred tax liabilities are recognized for all taxable temporary differencesand deferred tax assets are recognized for all deductible temporary differences and the carryforward of unused tax losses and unused taxcredits to the extent that it is probable that taxable profit will be available against which the deferred tax asset can be utilized.
The carrying amount of deferred tax assets is reviewed at each statement of condition date and reduced to the extent that it is probable thatsufficient taxable profit will be available to allow all or part of the deferred tax asset to be utilized.
Deferred tax assets and liabilities are measured at the tax rates that are expected to apply to the period when the asset is realized or theliability is settled, based on tax rates and tax laws that have been enacted or substantively enacted at the statement of condition date.
Most changes in deferred tax assets or liabilities are recognized as a component of tax expense in the statements of income. Only changes indeferred tax assets or liabilities that relate to a change in value of assets or liabilities that is charged directly to capital funds.
3.23 Capital Funds
Common stock is determined using the nominal value of shares that have been issued.
Common stock option pertains to the value of the segregated equity component of the convertible loan as required under PAS 32: FinancialInstruments: Disclosures and Presentation.
Treasury shares include the cost of the parent company’s shares of stock which were acquired by a subsidiary.
Additional paid-in capital includes any premiums received on the issuance of capital stock. Any transaction costs associated with the issuanceof shares are deducted from additional paid-in capital.
Surplus reserves pertain to a portion of the Bank’s income from trust operations set-up on a yearly basis in compliance with BSP regulations and appropriation for general banking risks.
Surplus free includes all current and prior period results as disclosed in the statements of income.
Fair value gain (loss) on available-for-sale financial assets pertains to cumulative mark-to-market valuation of available-for-sale financial assets.
3.24 Earnings Per Share (EPS)
Basic earnings per common share is determined by dividing net income by the weighted average number of common shares subscribed andissued during the period, after retroactive adjustment for any stock dividend declared in the current period.
Diluted earnings per common share is also computed by dividing net income by the weighted average number of common shares subscribedand issued during the period. However, net income attributable to common shares and the weighted average number of common sharesoutstanding are adjusted to reflect the effects of potentially dilutive convertible loan. Convertible loan is deemed to have been convertedinto common shares at the start of the conversion period.
452005 ANNUAL REPORT
3.25 Trust Activities
The Group commonly acts as trustees and in other fiduciary capacities that result in the holding or placing of assets on behalf of individuals,trusts, retirement benefit plans and other institutions. These assets and income arising thereon are excluded from these financial statements,as they are not assets of the Group.
3.26 Critical Accounting Estimates and Assumptions
The Group makes estimates and assumptions concerning the future. The resulting accounting estimates will, by definition, seldom equal therelated actual results. The estimates and assumptions that have a significant risk of causing a material adjustment to the carrying amounts ofassets and liabilities within the next financial year are discussed below.
• Impairment losses on receivables from customers and held-to-maturity investments. The Group reviews its loan and held-to-maturityinvestments portfolios to assess impairment at least on a quarterly basis. In determining whether an impairment loss should berecorded in the statements of income, the Group makes judgments as to whether there is any observable data indicating that thereis a measurable decrease in the estimated future cash flows from the portfolio before the decrease can be identified with anindividual item in that portfolio. This evidence may include observable data indicating that there has been an adverse change in thepayment status of borrowers or issuers in a group, or national or local economic conditions that correlate with defaults on assets inthe group. Management uses estimates based on historical loss experience for assets with credit risk characteristics and objectiveevidence of impairment similar to those in the portfolio when scheduling its future cash flows. The methodology and assumptionsused for estimating both the amount and timing of future cash flows are reviewed regularly to reduce any differences between lossestimates and actual loss experience.
• Fair value of financial assets and liabilities. The following table summarizes the carrying amounts and fair values of those financialassets and liabilities in 2005 not presented on the statements of condition at their fair value.
Consolidated ParentCost Fair Value Cost Fair Value
Due from Other Banks and BSP P 9,405,845 P 9,405,845 P 7,524,131 P 7,524,131Held-to-Maturity Investments 31,041,642 32,702,334 28,407,386 30,020,275Available-for-Sale Securities – Unquoted 2,288,413 2,288,413 39,672 39,672Loans and Other Receivables - Net 104,114,877 104,114,877 104,337,382 104,331,382Deposit Liabilities 159,666,123 159,666,123 156,191,536 156,191,536Bills Payable 45,845,351 45,845,351 33,493,924 33,493,924
a) Due from other Banks and BSP
Due from BSP pertains to deposits made by the Group to BSP for clearing and reserve requirements. Due from other banksincludes interbank placements and items in the course of collection. The fair value of floating rate placements and overnightdeposits is their carrying amount. The estimated fair value of fixed interest bearing deposits is based on discounted cash flowsusing prevailing money-market interest rates for debts with similar credit risk and remaining maturity, which for short termdeposits approximates the nominal value.
b) Held-to-maturity investments
Fair value for held to maturity assets is based on market prices. Where this information is not available, fair value has beenestimated using quoted market prices for securities with similar credit, maturity and yield characteristics.
c) Available-for-sale securities
The fair value of available-for-sale securities is determined by direct reference to published price quoted in an active market fortraded securities. On the other hand, non-quoted available-for-sale securities are carried at cost because the fair value cannotbe reliably determined either by reference to similar financial instruments or through valuation technique.
d) Loans and receivables
Loans and receivables are net of provisions for impairment. The estimated fair value of loans and receivables represents thediscounted amount of estimated future cash flows expected to be received. Expected cash flows are discounted at currentmarket rates to determine fair value.
e) Deposits and borrowings
The estimated fair value of demand deposits with no stated maturity, which includes non-interest-bearing deposits, is theamount repayable on demand. The estimated fair value of long-term fixed interest-bearing deposits and other borrowingswithout quoted market price is based on discounted cash flows using interest rates for new debts with similar remainingmaturity. The carrying amounts of deposits and borrowings already approximate their fair values.
• Fair value of derivatives
The fair value of derivative financial instruments that are not quoted in an active market are determined through valuationtechniques using the net present value computation.
46 BANCO DE ORO
Valuation techniques are used to determine fair values which are validated and periodically reviewed. To the extent practicable,models use observable data, however, areas such as credit risk (both own and counterparty), volatilities and correlations requiremanagement to make estimates. Changes in assumptions could affect reported fair value of financial instruments. The Group usesjudgment to select a variety of methods and make assumptions that are mainly based on market conditions existing at each balancesheet date.
3.27 Critical Accounting Judgments
The following critical accounting judgments may be applicable, among many other possible areas not presented in the financial statements.
• Held-to-maturity investments. The Group follows the guidance of PAS 39, Financial Instruments: Recognition and Measurement, onclassifying non-derivative financial assets with fixed or determinable payments and fixed maturity as held-to-maturity. Thisclassification requires significant judgment. In making this judgment, the Group evaluates its intention and ability to hold suchinvestments to maturity. If the Group fails to keep these investments at maturity other than for the allowed specific circumstances– for example, selling an insignificant amount close to maturity – it will be required to reclassify the entire class to available-for-sale.The investments would therefore be measured at fair value not amortized cost. If the entire class of held-to-maturity investmentsis tainted, the fair value would increase by P1,612,889 in the parent company financial statements and P1,660,692 in the consolidatedfinancial statements, with a corresponding entry in the Fair Value Gain on Available-for-Sale Securities account in the statements ofchanges in capital funds.
• Impairment of available-for sale financial assets. The Group follows the guidance of PAS 39, Financial Instruments: Recognition andMeasurement on determining when an investment is permanently impaired. This determination requires significant judgment. Inmaking this judgment, the Group evaluates, among other factors, the duration and extent to which the fair value of an investmentis less than its cost; and the financial health of and near-term business outlook for the investee, including factors such as industryand sector performance, changes in technology and operational and financing cash flow.
3.28 Risk Management
By their nature, the Group’s activities are principally related to the use of financial instruments including derivatives. The Group acceptsdeposits from customers at fixed and floating rates, and for various periods, and seeks to earn above-average interest margins by investingthese funds in high-quality assets. The Group seeks to increase these margins by consolidating short-term funds and lending for longer periodsat higher rates, while maintaining sufficient liquidity to meet all claims that might fall due.
The Group also trades in financial instruments where it takes positions in traded and over-the-counter instruments, including derivatives, totake advantage of short-term market movements in equities and bonds and in currency and interest rate prices.
To manage the financial risk for holding financial assets and liabilities, the Group operates an integrated risk management system to addressthe risks it faces in its banking activities, including liquidity, interest rate, credit and market risks. The Group’s risk management objective isto adequately and consistently evaluate, manage, control, and monitor the risk profile of the Group’s statement of condition to optimize therisk-reward balance and maximize return on the Group’s capital. The Group’s Risk Management Committee has overall responsibility for theGroup’s risk management systems and sets risks management policies across the full range of risks to which the Group is exposed. Specifically,the Group’s RMC places trading limits on the level of exposure that can be taken in relation to both overnight and intra-day market positions.With the exception of specific hedging arrangements, foreign exchange and interest rate exposures associated with these derivatives arenormally offset by entering into counterbalancing positions, thereby controlling the variability in the net cash amounts required to liquidatemarket positions.
Within the Group’s overall risk management system, Assets and Liabilities Committee (ALCO) is responsible for managing the Group’sstatement of condition, including the Group’s liquidity, interest rate and foreign exchange related risks. In addition, ALCO formulatesinvestment and financial policies by determining the asset allocation and funding mix strategies that are likely to yield the targeted statementof condition results.
Separately, the Credit and Risk Management Group (CRMG) is tasked with managing the credit risk, which is the risk that the counterpart ina transaction may default, and market risk, which is the risk of future loss from changes in the pricing of financial instruments.
3.28.1 Market Risk
The Group’s exposure to market risk, the risk of future loss from changes in the price of a financial instrument, relates primarily to its holdingsin foreign exchange instruments, debt securities and derivatives. The Group manages its risk by identifying, analyzing and measuring relevantor likely market risks. It recommends various limits based on activity indicators to the Group’s Risk Management Committee. The RiskManagement Committee in turn passes its recommendations to the Board, which reviews and approves these limits on a daily basis.
The Group’s market risk management limits are generally categorized as limits on:
• Value-at-risk – the CRMG computes the value-at-risk benchmarked at a level which is 20% of projected earnings. The Group usesthe value at risk (VaR) model to estimate the daily potential loss that the Group can incur from its trading book, based on a numberof assumptions with a confidence level of 99%. The measurement is designed such that exceptions over dealing limits should only arise in very exceptional circumstances.
• Stop loss – the CRMG sets the amount of each risk-bearing activity at a percentage of the budgeted annual income for such activity.• Nominal position – the CRMG sets the nominal amount of U.S. dollar denominated instruments at the BSP-mandated U.S. dollar
overbought position limit.• Trading volume – the CRMG sets the volume of transactions that any employee may execute at various levels based on the rank of
the personnel making the risk-bearing decision.• Earnings-at-risk – the CRMG computes the earnings-at-risk based on 20% of projected earnings.
472005 ANNUAL REPORT
The CRMG is also responsible for conducting stress tests (based on the value-at-risk model) on the Group’s portfolio of financial instrumentsand reporting the results to the Board for a more concrete assessment of the risks. The CRMG ensures that all policies as approved by theBoard are properly communicated to, and adopted by, the risk-taking personnel. The CRMG also conducts market risk analysis before newproducts are introduced.
In 2005, the Group applied a 99% confidence level and a 260-day observation period.
During the year, the average value-at-risk for the Group’s trading portfolio for a one-day holding period was P202 million. The maximum andminimum values were P69 million (January 24, 2005) and P341 million (February 8, 2005), respectively.
For December 31, 2004, the respective items are as follows:
• Average value-at-risk for 260 days, P15 million; and• Maximum and minimum values P84 million (December 28, 2004) and P3 million (October 14, 2004), respectively.
3.28.2 Liquidity Risk
Liquidity risk is the risk that there are insufficient funds available to adequately meet the credit demands of the Group’s customers and repaydeposits on maturity. The Group manages liquidity risk by holding sufficient liquid assets of appropriate quality to ensure short-term fundingrequirements are met and by maintaining a balanced loan portfolio which is repriced on a regular basis. In addition, the Group seeks tomaintain sufficient liquidity to take advantage of interest rate and exchange rate opportunities when they arise.
The analysis of the concentration of assets, liabilities and off-statement of condition items as of December 31, 2005 and 2004 are presented below (amounts in millions):
Consolidated 2005One to Three One to More
three months to three than threemonths one year years years Total
Resources:Cash P 1,197 P 22 P - P 5,402 P 6,621Loans 12,358 20,588 23,233 22,308 78,487Investments 23,680 6,113 19,506 38,765 88,064Placements 18,783 439 2,153 5,273 26,648Other assets 9,083 2,708 1,215 20,939 33,945
Total Resources 65,101 29,870 46,107 92,687 233,765
Liabilities and Capital Funds:Customer’s deposits 32,678 1,092 17,900 107,996 159,666Bills payable 22,850 10,045 4,029 8,921 45,845Other liabilities 473 5,901 1,115 531 8,020
Total liabilities 56,001 17,038 23,044 117,448 213,531Capital Funds - 2,771 - 17,463 20,234
Total Liabilities and Capital Funds 56,001 19,809 23,044 134,911 233,765
On-book gap 9,100 10,061 23,063 ( 42,224) -Cumulative on-book gap 9,100 19,161 42,224 - -
Contingent assets 13,510 6,588 4,663 2,505 27,266Contingent liabilities 11,311 21,437 4,592 3,622 40,962Total gap P 11,299 (P 4,788) P 23,134 (P 43,341) (P 13,696)
Cumulative total gap P 11,299 P 6,511 P 29,645 (P 13,696) (P 13,696)
48 BANCO DE ORO
Consolidated2004
One to Three One to Morethree months to three than three
months one year years years TotalResources:
Cash P 1,299 P 5 P - P 4,323 P 5,627Loans 10,518 17,705 14,329 17,728 60,280Investments 27,461 1,993 16,183 31,610 77,247Placements 8,768 648 6,409 2,499 18,324Other assets 5,479 1,899 1,268 9,500 18,146
Total Resources 53,525 22,250 38,189 65,660 179,624
Liabilities and Capital Funds:Customer’s deposits 36,396 1,420 18,762 72,069 128,647Bills payable 10,491 6,736 8,824 2,556 28,607Other liabilities 370 3,386 829 1,127 5,712
Total liabilities 47,257 11,542 28,415 75,752 162,966Capital - 1,298 - 15,360 16,658
Total Liabilities and Capital Funds: 47,257 12,840 28,415 91,112 179,624
On-book gap 6,268 9,410 9,774 ( 25,452) -Cumulative on-book gap 6,268 15,678 25,452 - -
Contingent assets 16,405 2,857 8,752 958 28,972Contingent liabilities 12,346 17,150 8,827 958 39,281Total gap P 10,327 (P 4,883) P 9,699 (P 25,452) (P 10,309)
Cumulative total gap P 10,327 P 5,444 P 15,143 (P 10,309) (P 10,309)
Parent Company2005
One to Three One to Morethree months to three than three
months one year years years TotalResources:
Cash P 1,197 P 22 P - P 5,402 P 6,621Loans 20,736 20,250 22,750 17,599 81,335Investments 19,001 5,895 14,719 38,430 78,045Placements 18,056 349 2,153 5,265 25,823Other resources 639 2,701 1,119 19,489 23,948
Total Resources 59,629 29,217 40,741 86,185 215,772
Liabilities and Capital Funds:Deposits liabilities 31,049 614 16,114 108,414 156,191Bills payable 13,112 9,724 1,737 8,921 33,494Other liabilities 469 5,367 950 531 7,317
Total Liabilities 44,630 15,705 18,801 117,866 197,002Capital Funds - 2,843 - 15,927 18,770
Total Liabilities and Capital Funds 44,630 18,548 18,801 133,793 215,772
On-book gap 14,999 10,669 21,940 ( 47,608) -
Cumulative on-book gap 14,999 25,668 47,608 - -
Contingent assets 10,715 1,274 89 2,505 14,583Contingent liabilities 8,544 16,129 112 3,622 28,407Total gap P 17,170 (P 4,186) P 21,917 (P 48,725) (P 13,824)
Cumulative total gap P 17,170 P 12,984 P 34,901 (P 13,824) (P 13,824)
492005 ANNUAL REPORT
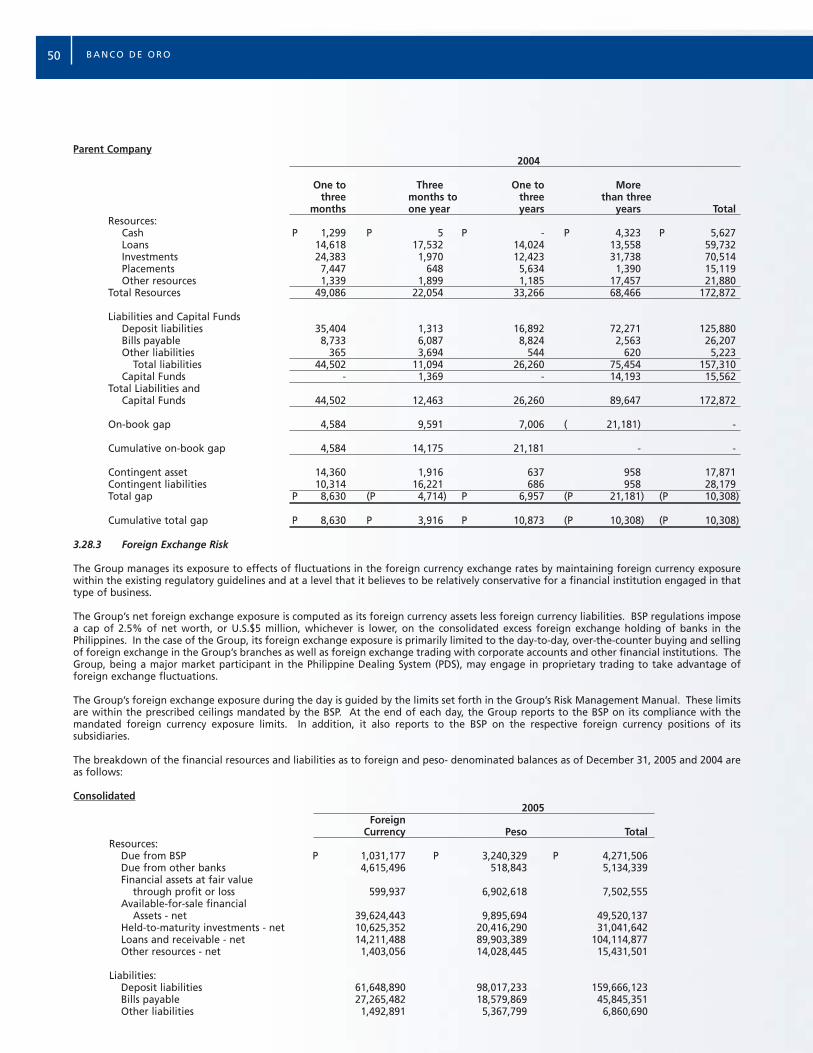
Parent Company2004
One to Three One to Morethree months to three than three
months one year years years TotalResources:
Cash P 1,299 P 5 P - P 4,323 P 5,627Loans 14,618 17,532 14,024 13,558 59,732Investments 24,383 1,970 12,423 31,738 70,514Placements 7,447 648 5,634 1,390 15,119Other resources 1,339 1,899 1,185 17,457 21,880
Total Resources 49,086 22,054 33,266 68,466 172,872
Liabilities and Capital FundsDeposit liabilities 35,404 1,313 16,892 72,271 125,880Bills payable 8,733 6,087 8,824 2,563 26,207Other liabilities 365 3,694 544 620 5,223
Total liabilities 44,502 11,094 26,260 75,454 157,310Capital Funds - 1,369 - 14,193 15,562
Total Liabilities and Capital Funds 44,502 12,463 26,260 89,647 172,872
On-book gap 4,584 9,591 7,006 ( 21,181) -
Cumulative on-book gap 4,584 14,175 21,181 - -
Contingent asset 14,360 1,916 637 958 17,871Contingent liabilities 10,314 16,221 686 958 28,179Total gap P 8,630 (P 4,714) P 6,957 (P 21,181) (P 10,308)
Cumulative total gap P 8,630 P 3,916 P 10,873 (P 10,308) (P 10,308)
3.28.3 Foreign Exchange Risk
The Group manages its exposure to effects of fluctuations in the foreign currency exchange rates by maintaining foreign currency exposurewithin the existing regulatory guidelines and at a level that it believes to be relatively conservative for a financial institution engaged in thattype of business.
The Group’s net foreign exchange exposure is computed as its foreign currency assets less foreign currency liabilities. BSP regulations imposea cap of 2.5% of net worth, or U.S.$5 million, whichever is lower, on the consolidated excess foreign exchange holding of banks in thePhilippines. In the case of the Group, its foreign exchange exposure is primarily limited to the day-to-day, over-the-counter buying and sellingof foreign exchange in the Group’s branches as well as foreign exchange trading with corporate accounts and other financial institutions. TheGroup, being a major market participant in the Philippine Dealing System (PDS), may engage in proprietary trading to take advantage offoreign exchange fluctuations.
The Group’s foreign exchange exposure during the day is guided by the limits set forth in the Group’s Risk Management Manual. These limitsare within the prescribed ceilings mandated by the BSP. At the end of each day, the Group reports to the BSP on its compliance with themandated foreign currency exposure limits. In addition, it also reports to the BSP on the respective foreign currency positions of itssubsidiaries.
The breakdown of the financial resources and liabilities as to foreign and peso- denominated balances as of December 31, 2005 and 2004 areas follows:
Consolidated2005
ForeignCurrency Peso Total
Resources:Due from BSP P 1,031,177 P 3,240,329 P 4,271,506Due from other banks 4,615,496 518,843 5,134,339Financial assets at fair value
through profit or loss 599,937 6,902,618 7,502,555Available-for-sale financial
Assets - net 39,624,443 9,895,694 49,520,137Held-to-maturity investments - net 10,625,352 20,416,290 31,041,642Loans and receivable - net 14,211,488 89,903,389 104,114,877Other resources - net 1,403,056 14,028,445 15,431,501
Liabilities:Deposit liabilities 61,648,890 98,017,233 159,666,123Bills payable 27,265,482 18,579,869 45,845,351Other liabilities 1,492,891 5,367,799 6,860,690
50 BANCO DE ORO
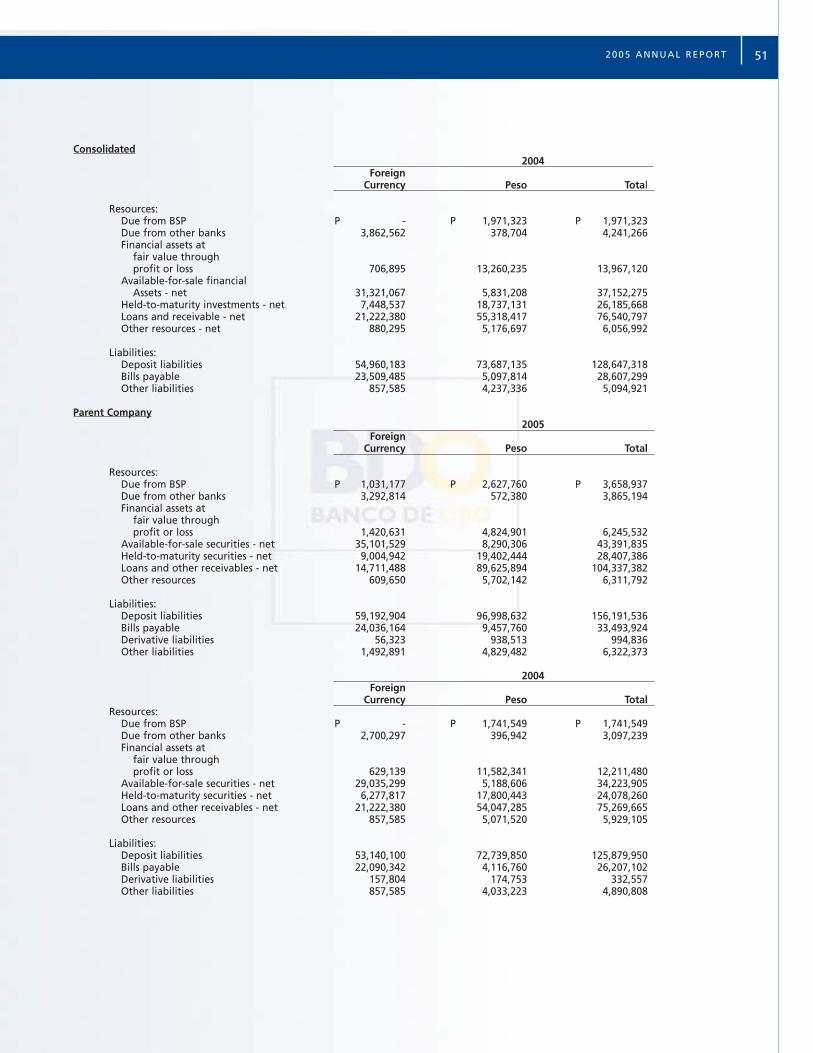
Consolidated2004
ForeignCurrency Peso Total
Resources:Due from BSP P - P 1,971,323 P 1,971,323Due from other banks 3,862,562 378,704 4,241,266Financial assets at
fair value throughprofit or loss 706,895 13,260,235 13,967,120
Available-for-sale financialAssets - net 31,321,067 5,831,208 37,152,275
Held-to-maturity investments - net 7,448,537 18,737,131 26,185,668Loans and receivable - net 21,222,380 55,318,417 76,540,797Other resources - net 880,295 5,176,697 6,056,992
Liabilities:Deposit liabilities 54,960,183 73,687,135 128,647,318Bills payable 23,509,485 5,097,814 28,607,299Other liabilities 857,585 4,237,336 5,094,921
Parent Company2005
ForeignCurrency Peso Total
Resources:Due from BSP P 1,031,177 P 2,627,760 P 3,658,937Due from other banks 3,292,814 572,380 3,865,194Financial assets at
fair value throughprofit or loss 1,420,631 4,824,901 6,245,532
Available-for-sale securities - net 35,101,529 8,290,306 43,391,835Held-to-maturity securities - net 9,004,942 19,402,444 28,407,386Loans and other receivables - net 14,711,488 89,625,894 104,337,382Other resources 609,650 5,702,142 6,311,792
Liabilities:Deposit liabilities 59,192,904 96,998,632 156,191,536Bills payable 24,036,164 9,457,760 33,493,924Derivative liabilities 56,323 938,513 994,836Other liabilities 1,492,891 4,829,482 6,322,373
2004Foreign
Currency Peso TotalResources:
Due from BSP P - P 1,741,549 P 1,741,549Due from other banks 2,700,297 396,942 3,097,239Financial assets at
fair value throughprofit or loss 629,139 11,582,341 12,211,480
Available-for-sale securities - net 29,035,299 5,188,606 34,223,905Held-to-maturity securities - net 6,277,817 17,800,443 24,078,260Loans and other receivables - net 21,222,380 54,047,285 75,269,665Other resources 857,585 5,071,520 5,929,105
Liabilities:Deposit liabilities 53,140,100 72,739,850 125,879,950Bills payable 22,090,342 4,116,760 26,207,102Derivative liabilities 157,804 174,753 332,557Other liabilities 857,585 4,033,223 4,890,808
512005 ANNUAL REPORT
3.28.4 Credit Risk
Credit risk is the risk that the counterpart in a transaction may default and arises from lending, trade finance, treasury, derivatives and otheractivities undertaken by the Group. The Group manages its credit risk and loan portfolio through the CRMG, which undertakes severalfunctions with respect to credit risk management.
The CRMG undertakes credit analysis and review to ensure consistency in the Group’s risk assessment process. The CRMG performs risk ratingsfor corporate accounts and risk scoring for consumer accounts. It also ensures that the Group’s credit policies and procedures are adequate tomeet the demands of the business. The CRMG is also responsible for developing procedures to streamline and expedite the processing of creditapplications.
The CRMG also undertakes portfolio management by reviewing the Group’s loan portfolio, including the portfolio risks associated withparticular industry sectors, regions, loan size and maturity, and development of a strategy for the Group to achieve its desired portfolio mixand risk profile.
The Group structures the levels of credit risk it undertakes by placing limits on the amount of risk accepted in relation to one borrower, orgroups of borrowers, and to geographical and industry segments. Such risks are monitored on a revolving basis and subject to an annual ormore frequent review. Limits on the level of credit risk by product, industry sector and by country are approved quarterly by the RMC.
Exposure to credit risk is managed through regular analysis of the ability of borrowers and potential borrowers to meet interest and capitalrepayment obligations and by changing these lending limits when appropriate. Exposure to credit risk is also managed in part by obtainingcollateral and corporate and personal guarantees.
The CRM reviews the Group’s loan portfolio in line with the Group’s policy of not having significant unwarranted concentrations of exposureto individual counterparties, in accordance with the BSP’s prohibitions on maintaining a financial exposure to any single person or group ofconnected persons in excess of 25% of its Net Worth.
3.28.5 Cash Flow Interest Rate Risk
The Bank prepares gap analysis to measure the sensitivity of its resources, liabilities and off-statement of condition positions to interest ratefluctuations. The focus of analysis is the impact of changes in interest rates on accrual or reported earnings. This analysis would givemanagement a glimpse of maturity and re-pricing profile of its interest sensitive resources and liabilities. An interest rate gap report isprepared by classifying all assets and liabilities into various time buckets according to contracted maturities or anticipated repricing dates, andother applicable behavioral assumptions. The difference in the amount of resources and liabilities maturing or being repriced in any timeperiod category would then give the Group an indication of the extent to which it is exposed to the risk of potential changes in net interestincome.
4. BUSINESS SEGMENTS
In the consolidated financial statements, the Group is organized into the following business segments:
1) Commercial banking – handles the entire lending, trade financing and cash management services for corporate and retail customers;
2) Investment banking – provides services to corporate clients outside the traditional loan and deposit products. These services includeloan syndications, underwriting and placing of debt and equity securities, and financial advisory services.
3) Private banking – provides traditional and non-traditional investment and structured products to high net worth individuals andinstitutional accounts.
4) Others – includes asset management, credit card operations, insurance, securities brokerage and realty management, none of whichconstitutes a separately reportable segment.
Transactions between the business segments are on normal commercial terms and conditions.
Funds are ordinarily allocated between segments, resulting in funding cost transfers disclosed in operating income. Interest charged forthese funds is based on the Group’s cost of capital. There are no other material items of income or expense between the businesssegments.
Segment assets and liabilities comprise operating assets and liabilities including items such as taxation and borrowings.
Internal charges and transfer pricing adjustments have been reflected in the performance of each business. Revenue sharing agreementsare used to allocate external customer revenues to a business segment on a reasonable basis.
52 BANCO DE ORO

Primary segment information (by business segment) as of and for the years ended December 31, 2005 and 2004 follow:
ConsolidatedCommercial Investment Private
Banking Banking Banking Others Eliminations Consolidated
December 31, 2005
Interest IncomeExternal P 13,612,319 P 69,804 P 885,000 P 217,683 P - P 14,784,806Inter-segment 56,321 917 948 7,323 ( 65,509) -Total interest income 13,668,640 70,721 885,948 225,006 ( 65,509) 14,784,806
Interest ExpenseExternal 7,458,072 - 371,665 112,361 - 7,942,098Inter-segment 8,428 2,535 40,113 14,433 ( 65,509) -Total interest expense 7,466,500 2,535 411,778 126,794 ( 65,509) 7,942,098
Net Interest Income P 6,202,140 P 68,186 P 474,170 P 98,212 P - P 6,842,708
Profit for the Year P 2,470,362 P 106,287 P 477,611 (P 103,524) (P 407,219) P 2,543,517
Statement of ConditionTotal resources P 215,772,422 P 1,207,216 P 15,339,287 P 10,838,472 (P 9,392,611) P233,764,786
Total liabilities P 197,040,259 P 118,571 P 11,931,605 P 10,814,221 (P 6,374,175) P213,530,481
December 31, 2004
Interest IncomeExternal P 10,422,044 P 88,662 P 581,219 P 55,647 P - P 11,147,572Inter-segment 33,792 6,481 306 790 ( 41,369) -Total interest income 10,455,836 95,143 581,525 56,437 ( 41,369) 11,147,572
Interest ExpenseExternal 6,001,935 3,431 156,080 25,112 - 6,186,558Inter-segment 7,150 - 32,747 1,472 ( 41,369) -Total interest expense 6,009,085 3,431 188,827 26,584 ( 41,369) 6,186,558
Net Interest Income P 4,446,751 P 91,712 P 392,698 P 29,853 P - P 4,961,014
Profit for the Year P 1,514,661 P 100,916 P 352,555 (P 123,431) P 127,933 P 1,972,634
Statement of ConditionTotal resources P 173,484,766 P 1,370,602 P 9,304,366 P 813,574 ( P5,349,207) P179,624,101
Total liabilities P 157,310,417 P 68,664 P 6,284,139 P 5,991,905 ( P6,689,194) P162,965,931
5. CASH AND BALANCES WITH THE BSP
These accounts are composed of the following:
Consolidated Parent2005 2004 2005 2004
Cash and other cash items P 6,621,220 P 5,627,066 P 6,620,667 P 5,626,974Due from BSP
Mandatory reserves 2,329,825 1,606,534 1,329,113 135,015Other than mandatory reserves 1,941,681 364,789 2,329,824 1,606,534
4,271,506 1,971,323 3,658,937 1,741,549
P 10,892,726 P 7,598,389 P 10,279,604 P 7,368,523
Mandatory reserves represent the balance of the deposit account maintained with the BSP to meet reserve requirements and to serve asclearing account for interbank claims. Due from BSP bears annual interest rate of 4% for 2005 and 2004. Total interest income earnedamounted to P118,793 and P85,431 for 2005 and 2004, respectively, both in parent company and consolidated financial statements.
532005 ANNUAL REPORT
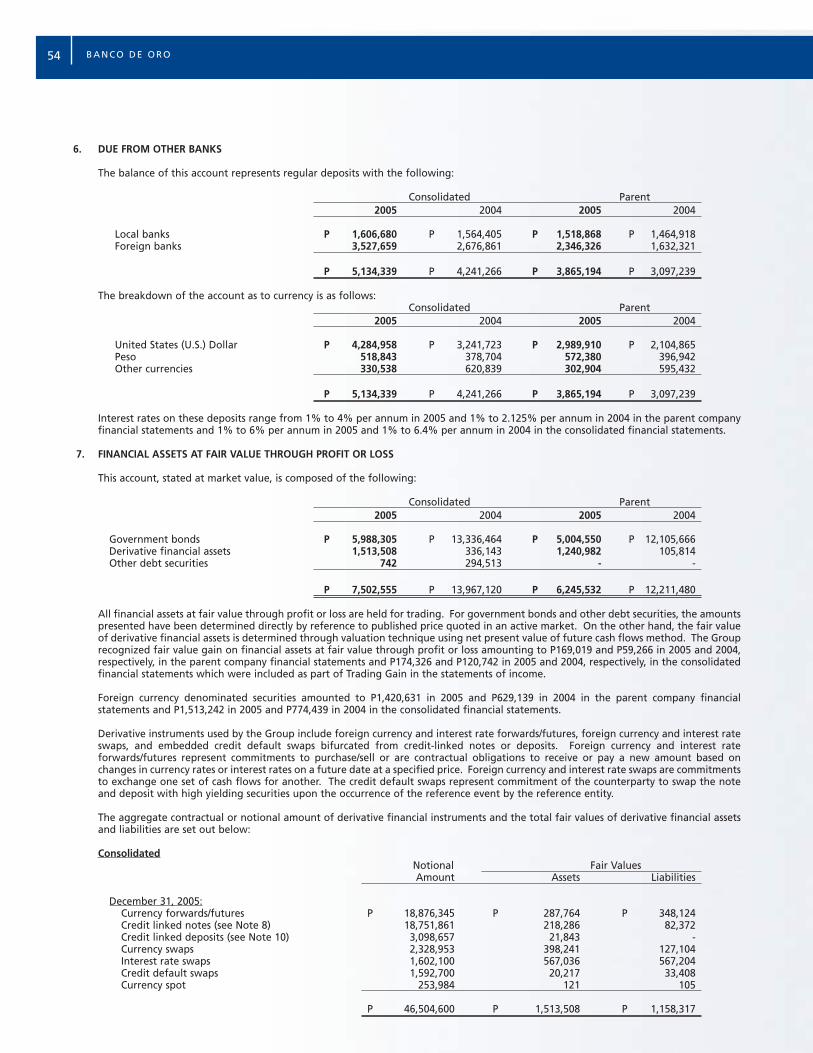
6. DUE FROM OTHER BANKS
The balance of this account represents regular deposits with the following:
Consolidated Parent2005 2004 2005 2004
Local banks P 1,606,680 P 1,564,405 P 1,518,868 P 1,464,918Foreign banks 3,527,659 2,676,861 2,346,326 1,632,321
P 5,134,339 P 4,241,266 P 3,865,194 P 3,097,239
The breakdown of the account as to currency is as follows:Consolidated Parent
2005 2004 2005 2004
United States (U.S.) Dollar P 4,284,958 P 3,241,723 P 2,989,910 P 2,104,865Peso 518,843 378,704 572,380 396,942Other currencies 330,538 620,839 302,904 595,432
P 5,134,339 P 4,241,266 P 3,865,194 P 3,097,239
Interest rates on these deposits range from 1% to 4% per annum in 2005 and 1% to 2.125% per annum in 2004 in the parent companyfinancial statements and 1% to 6% per annum in 2005 and 1% to 6.4% per annum in 2004 in the consolidated financial statements.
7. FINANCIAL ASSETS AT FAIR VALUE THROUGH PROFIT OR LOSS
This account, stated at market value, is composed of the following:
Consolidated Parent2005 2004 2005 2004
Government bonds P 5,988,305 P 13,336,464 P 5,004,550 P 12,105,666Derivative financial assets 1,513,508 336,143 1,240,982 105,814Other debt securities 742 294,513 - -
P 7,502,555 P 13,967,120 P 6,245,532 P 12,211,480
All financial assets at fair value through profit or loss are held for trading. For government bonds and other debt securities, the amountspresented have been determined directly by reference to published price quoted in an active market. On the other hand, the fair valueof derivative financial assets is determined through valuation technique using net present value of future cash flows method. The Grouprecognized fair value gain on financial assets at fair value through profit or loss amounting to P169,019 and P59,266 in 2005 and 2004,respectively, in the parent company financial statements and P174,326 and P120,742 in 2005 and 2004, respectively, in the consolidatedfinancial statements which were included as part of Trading Gain in the statements of income.
Foreign currency denominated securities amounted to P1,420,631 in 2005 and P629,139 in 2004 in the parent company financialstatements and P1,513,242 in 2005 and P774,439 in 2004 in the consolidated financial statements.
Derivative instruments used by the Group include foreign currency and interest rate forwards/futures, foreign currency and interest rateswaps, and embedded credit default swaps bifurcated from credit-linked notes or deposits. Foreign currency and interest rateforwards/futures represent commitments to purchase/sell or are contractual obligations to receive or pay a new amount based onchanges in currency rates or interest rates on a future date at a specified price. Foreign currency and interest rate swaps are commitmentsto exchange one set of cash flows for another. The credit default swaps represent commitment of the counterparty to swap the noteand deposit with high yielding securities upon the occurrence of the reference event by the reference entity.
The aggregate contractual or notional amount of derivative financial instruments and the total fair values of derivative financial assetsand liabilities are set out below:
ConsolidatedNotional Fair ValuesAmount Assets Liabilities
December 31, 2005:Currency forwards/futures P 18,876,345 P 287,764 P 348,124Credit linked notes (see Note 8) 18,751,861 218,286 82,372Credit linked deposits (see Note 10) 3,098,657 21,843 -Currency swaps 2,328,953 398,241 127,104Interest rate swaps 1,602,100 567,036 567,204Credit default swaps 1,592,700 20,217 33,408Currency spot 253,984 121 105
P 46,504,600 P 1,513,508 P 1,158,317
54 BANCO DE ORO
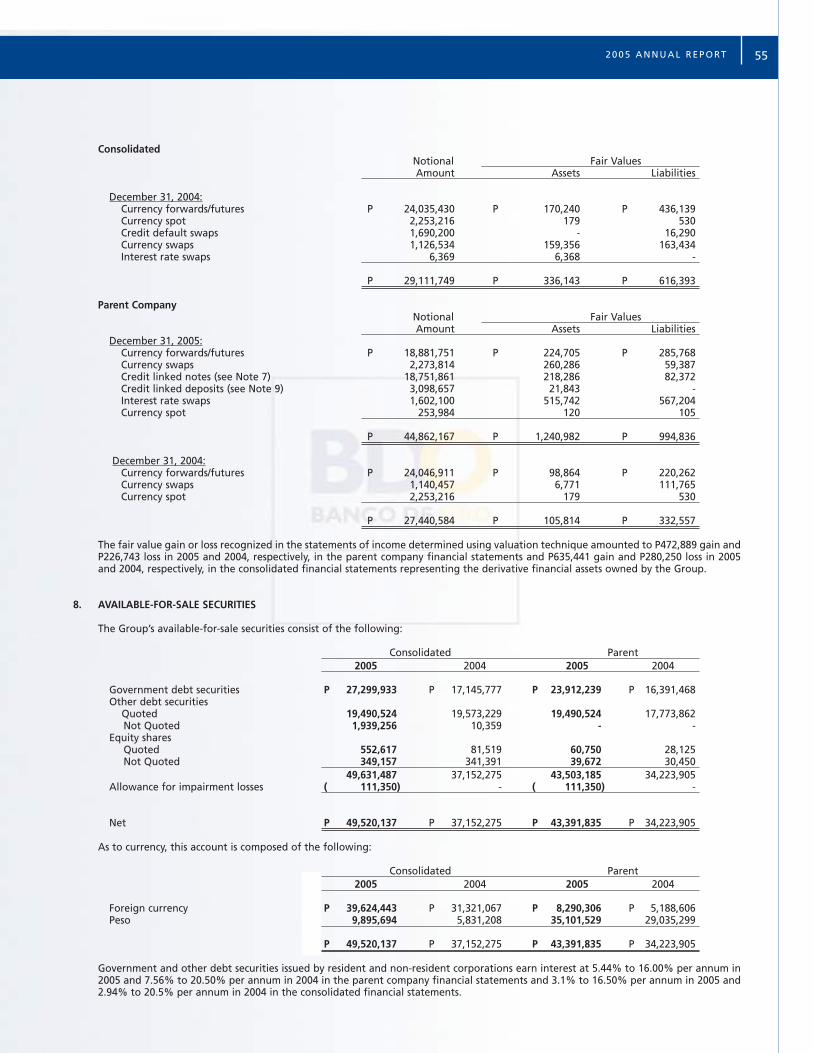
ConsolidatedNotional Fair ValuesAmount Assets Liabilities
December 31, 2004:Currency forwards/futures P 24,035,430 P 170,240 P 436,139Currency spot 2,253,216 179 530Credit default swaps 1,690,200 - 16,290Currency swaps 1,126,534 159,356 163,434Interest rate swaps 6,369 6,368 -
P 29,111,749 P 336,143 P 616,393
Parent CompanyNotional Fair ValuesAmount Assets Liabilities
December 31, 2005:Currency forwards/futures P 18,881,751 P 224,705 P 285,768Currency swaps 2,273,814 260,286 59,387Credit linked notes (see Note 7) 18,751,861 218,286 82,372Credit linked deposits (see Note 9) 3,098,657 21,843 -Interest rate swaps 1,602,100 515,742 567,204Currency spot 253,984 120 105
P 44,862,167 P 1,240,982 P 994,836
December 31, 2004:Currency forwards/futures P 24,046,911 P 98,864 P 220,262Currency swaps 1,140,457 6,771 111,765Currency spot 2,253,216 179 530
P 27,440,584 P 105,814 P 332,557
The fair value gain or loss recognized in the statements of income determined using valuation technique amounted to P472,889 gain andP226,743 loss in 2005 and 2004, respectively, in the parent company financial statements and P635,441 gain and P280,250 loss in 2005and 2004, respectively, in the consolidated financial statements representing the derivative financial assets owned by the Group.
8. AVAILABLE-FOR-SALE SECURITIES
The Group’s available-for-sale securities consist of the following:
Consolidated Parent2005 2004 2005 2004
Government debt securities P 27,299,933 P 17,145,777 P 23,912,239 P 16,391,468Other debt securities
Quoted 19,490,524 19,573,229 19,490,524 17,773,862Not Quoted 1,939,256 10,359 - -
Equity sharesQuoted 552,617 81,519 60,750 28,125Not Quoted 349,157 341,391 39,672 30,450
49,631,487 37,152,275 43,503,185 34,223,905Allowance for impairment losses ( 111,350) - ( 111,350) -
Net P 49,520,137 P 37,152,275 P 43,391,835 P 34,223,905
As to currency, this account is composed of the following:
Consolidated Parent2005 2004 2005 2004
Foreign currency P 39,624,443 P 31,321,067 P 8,290,306 P 5,188,606Peso 9,895,694 5,831,208 35,101,529 29,035,299
P 49,520,137 P 37,152,275 P 43,391,835 P 34,223,905
Government and other debt securities issued by resident and non-resident corporations earn interest at 5.44% to 16.00% per annum in2005 and 7.56% to 20.50% per annum in 2004 in the parent company financial statements and 3.1% to 16.50% per annum in 2005 and2.94% to 20.5% per annum in 2004 in the consolidated financial statements.
552005 ANNUAL REPORT
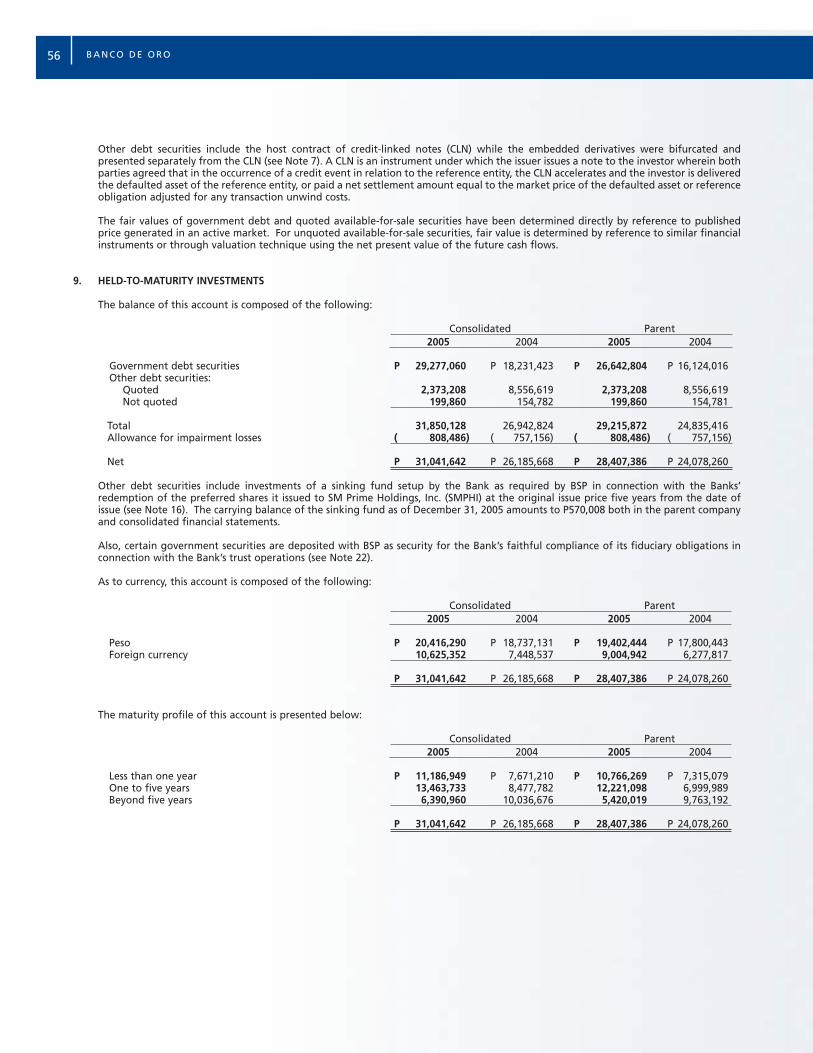
Other debt securities include the host contract of credit-linked notes (CLN) while the embedded derivatives were bifurcated andpresented separately from the CLN (see Note 7). A CLN is an instrument under which the issuer issues a note to the investor wherein bothparties agreed that in the occurrence of a credit event in relation to the reference entity, the CLN accelerates and the investor is deliveredthe defaulted asset of the reference entity, or paid a net settlement amount equal to the market price of the defaulted asset or referenceobligation adjusted for any transaction unwind costs.
The fair values of government debt and quoted available-for-sale securities have been determined directly by reference to publishedprice generated in an active market. For unquoted available-for-sale securities, fair value is determined by reference to similar financialinstruments or through valuation technique using the net present value of the future cash flows.
9. HELD-TO-MATURITY INVESTMENTS
The balance of this account is composed of the following:
Consolidated Parent2005 2004 2005 2004
Government debt securities P 29,277,060 P 18,231,423 P 26,642,804 P 16,124,016Other debt securities:
Quoted 2,373,208 8,556,619 2,373,208 8,556,619Not quoted 199,860 154,782 199,860 154,781
Total 31,850,128 26,942,824 29,215,872 24,835,416Allowance for impairment losses ( 808,486) ( 757,156) ( 808,486) ( 757,156)
Net P 31,041,642 P 26,185,668 P 28,407,386 P 24,078,260
Other debt securities include investments of a sinking fund setup by the Bank as required by BSP in connection with the Banks’redemption of the preferred shares it issued to SM Prime Holdings, Inc. (SMPHI) at the original issue price five years from the date ofissue (see Note 16). The carrying balance of the sinking fund as of December 31, 2005 amounts to P570,008 both in the parent companyand consolidated financial statements.
Also, certain government securities are deposited with BSP as security for the Bank’s faithful compliance of its fiduciary obligations inconnection with the Bank’s trust operations (see Note 22).
As to currency, this account is composed of the following:
Consolidated Parent2005 2004 2005 2004
Peso P 20,416,290 P 18,737,131 P 19,402,444 P 17,800,443Foreign currency 10,625,352 7,448,537 9,004,942 6,277,817
P 31,041,642 P 26,185,668 P 28,407,386 P 24,078,260
The maturity profile of this account is presented below:
Consolidated Parent2005 2004 2005 2004
Less than one year P 11,186,949 P 7,671,210 P 10,766,269 P 7,315,079One to five years 13,463,733 8,477,782 12,221,098 6,999,989Beyond five years 6,390,960 10,036,676 5,420,019 9,763,192
P 31,041,642 P 26,185,668 P 28,407,386 P 24,078,260
56 BANCO DE ORO

Changes in the held-to-maturity account are summarized below:
Consolidated Parent2005 2004 2005 2004
Balance at beginning of year P 26,185,668 P 43,569,302 P 24,078,260 P 41,025,729Additions 95,241,443 31,194,832 91,775,399 29,507,430Maturity ( 89,746,344) ( 48,597,181) ( 86,832,687) ( 46,449,617)Foreign currency revaluation ( 587,795) 621,090 ( 562,256) 597,092Impairment during the year ( 51,330) ( 602,375) ( 51,330) ( 602,374)
Balance at end of year P 31,041,642 P 26,185,668 P 28,407,386 P 24,078,260
The fair values of the held-to-maturity investments are as follows:
Consolidated Parent2005 2004 2005 2004
Government debt securities P 30,658,079 P 17,969,644 P 27,976,020 P 15,934,141Other debt securities 2,044,255 6,180,189 2,044,255 6,180,189
P 32,702,334 P 24,149,833 P 30,020,275 P 22,114,330
The fair value is determined through valuation techniques by determining the net present value of estimated future cash flows. Interestrates on these investments range from 4% to 16.50% per annum in 2005 and 3.44% to 18% per annum in 2004.
10. LOANS AND OTHER RECEIVABLES
This account consists of the following:
Consolidated Parent2005 2004 2005 2004
Receivables from customers:Loans and discounts P 69,360,516 P 53,938,850 P 73,674,314 P 53,941,594Customers’ liabilities under letters of credit and
trust receipts 10,047,366 7,422,671 10,047,367 7,422,670Bills purchased 1,893,204 1,958,434 1,893,204 1,958,434Others 1,523,459 565,545 - -
82,824,545 63,885,500 85,614,885 63,322,698Allowance for impairment losses ( 4,337,917) ( 3,605,076 ) ( 4,279,222) ( 3,590,435)
Net 78,486,628 60,280,424 81,335,663 59,732,263
Other receivables:Interbank loans receivables 17,237,492 9,153,376 18,299,086 10,279,978Securities purchased under reverse repurchase
agreements 4,325,000 2,396,000 975,000 1,100,000Accrued interest receivable 2,893,241 2,431,155 2,585,330 2,431,155Accounts receivable 1,383,885 2,167,185 1,353,661 1,613,610Sales contract receivables 352,311 483,461 352,321 483,463
26,191,929 16,631,177 23,565,398 15,908,206Allowance for impairment losses ( 563,680) ( 370,804 ) ( 563,679) ( 370,804)
Net 25,628,249 16,260,373 23,001,719 15,537,402
P 104,114,877 P 76,540,797 P 104,337,382 P 75,269,665
Interbank loans receivables include the host contract of credit-linked deposits (CLD) while the embedded credit default swaps werebifurcated and presented separately from the CLD (see Note 7). A CLD is an instrument under which the issuer/deposit-taker issues acertificate of deposit to the investor wherein both parties agreed that in the occurrence of a credit event in relation to the referenceentity, the CLD accelerates and the depositor is delivered the defaulted asset of the reference entity, or paid a net settlement amountequal to the market price of the defaulted asset or reference obligation adjusted for any transaction unwind costs.
572005 ANNUAL REPORT
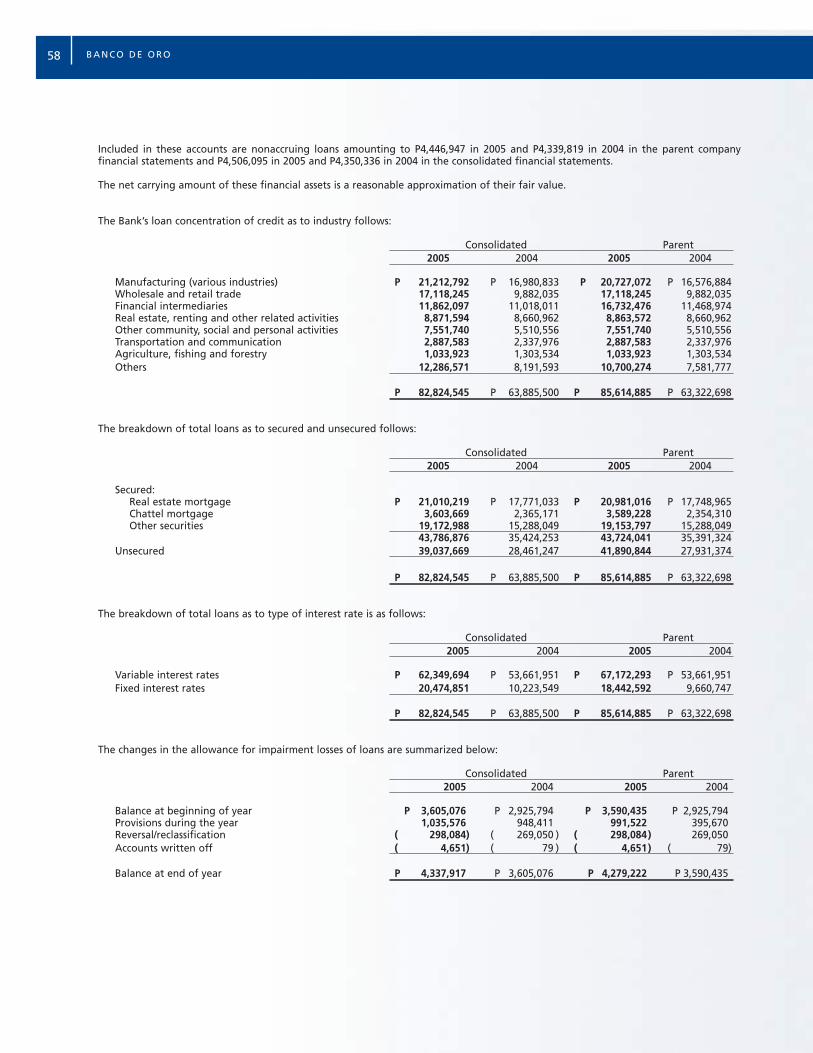
Included in these accounts are nonaccruing loans amounting to P4,446,947 in 2005 and P4,339,819 in 2004 in the parent companyfinancial statements and P4,506,095 in 2005 and P4,350,336 in 2004 in the consolidated financial statements.
The net carrying amount of these financial assets is a reasonable approximation of their fair value.
The Bank’s loan concentration of credit as to industry follows:
Consolidated Parent2005 2004 2005 2004
Manufacturing (various industries) P 21,212,792 P 16,980,833 P 20,727,072 P 16,576,884Wholesale and retail trade 17,118,245 9,882,035 17,118,245 9,882,035Financial intermediaries 11,862,097 11,018,011 16,732,476 11,468,974Real estate, renting and other related activities 8,871,594 8,660,962 8,863,572 8,660,962Other community, social and personal activities 7,551,740 5,510,556 7,551,740 5,510,556Transportation and communication 2,887,583 2,337,976 2,887,583 2,337,976Agriculture, fishing and forestry 1,033,923 1,303,534 1,033,923 1,303,534Others 12,286,571 8,191,593 10,700,274 7,581,777
P 82,824,545 P 63,885,500 P 85,614,885 P 63,322,698
The breakdown of total loans as to secured and unsecured follows:
Consolidated Parent2005 2004 2005 2004
Secured: Real estate mortgage P 21,010,219 P 17,771,033 P 20,981,016 P 17,748,965Chattel mortgage 3,603,669 2,365,171 3,589,228 2,354,310Other securities 19,172,988 15,288,049 19,153,797 15,288,049
43,786,876 35,424,253 43,724,041 35,391,324Unsecured 39,037,669 28,461,247 41,890,844 27,931,374
P 82,824,545 P 63,885,500 P 85,614,885 P 63,322,698
The breakdown of total loans as to type of interest rate is as follows:
Consolidated Parent2005 2004 2005 2004
Variable interest rates P 62,349,694 P 53,661,951 P 67,172,293 P 53,661,951Fixed interest rates 20,474,851 10,223,549 18,442,592 9,660,747
P 82,824,545 P 63,885,500 P 85,614,885 P 63,322,698
The changes in the allowance for impairment losses of loans are summarized below:
Consolidated Parent2005 2004 2005 2004
Balance at beginning of year P 3,605,076 P 2,925,794 P 3,590,435 P 2,925,794Provisions during the year 1,035,576 948,411 991,522 395,670Reversal/reclassification ( 298,084) ( 269,050 ) ( 298,084) 269,050Accounts written off ( 4,651) ( 79 ) ( 4,651) ( 79)
Balance at end of year P 4,337,917 P 3,605,076 P 4,279,222 P 3,590,435
58 BANCO DE ORO
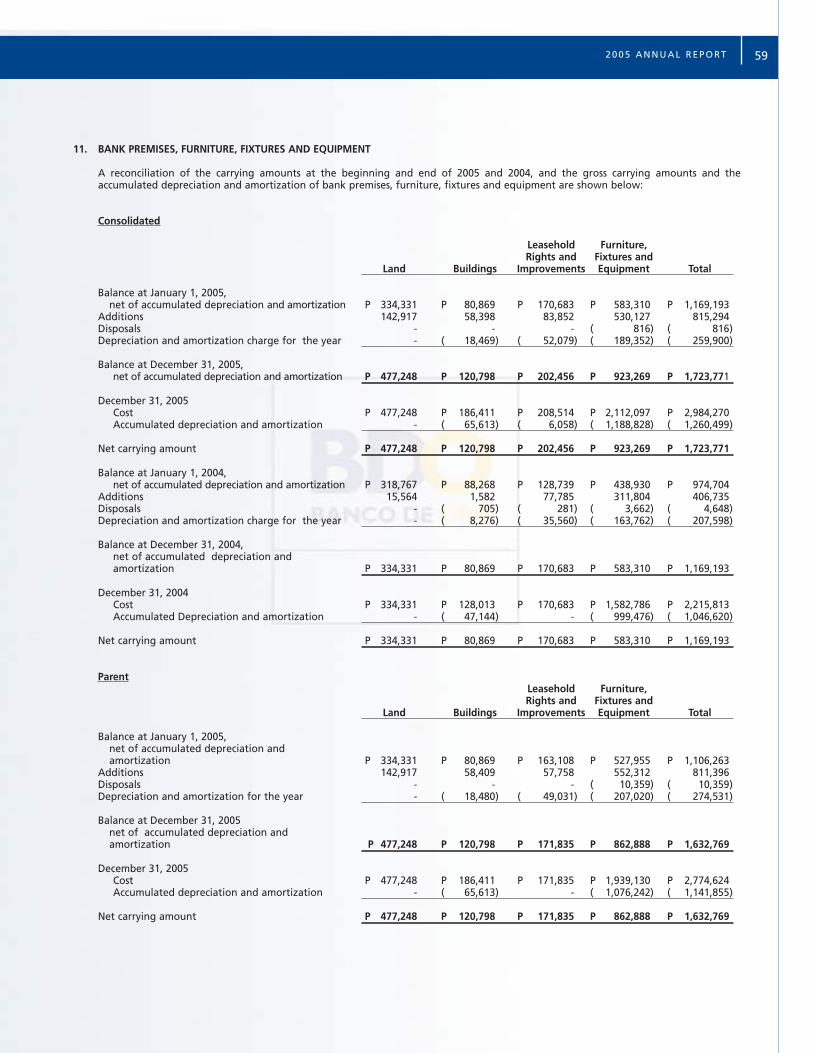
11. BANK PREMISES, FURNITURE, FIXTURES AND EQUIPMENT
A reconciliation of the carrying amounts at the beginning and end of 2005 and 2004, and the gross carrying amounts and theaccumulated depreciation and amortization of bank premises, furniture, fixtures and equipment are shown below:
Consolidated
Leasehold Furniture,Rights and Fixtures and
Land Buildings Improvements Equipment Total
Balance at January 1, 2005,net of accumulated depreciation and amortization P 334,331 P 80,869 P 170,683 P 583,310 P 1,169,193
Additions 142,917 58,398 83,852 530,127 815,294Disposals - - - ( 816) ( 816)Depreciation and amortization charge for the year - ( 18,469) ( 52,079) ( 189,352) ( 259,900)
Balance at December 31, 2005,net of accumulated depreciation and amortization P 477,248 P 120,798 P 202,456 P 923,269 P 1,723,771
December 31, 2005Cost P 477,248 P 186,411 P 208,514 P 2,112,097 P 2,984,270Accumulated depreciation and amortization - ( 65,613) ( 6,058) ( 1,188,828) ( 1,260,499)
Net carrying amount P 477,248 P 120,798 P 202,456 P 923,269 P 1,723,771
Balance at January 1, 2004,net of accumulated depreciation and amortization P 318,767 P 88,268 P 128,739 P 438,930 P 974,704
Additions 15,564 1,582 77,785 311,804 406,735Disposals - ( 705) ( 281) ( 3,662) ( 4,648)Depreciation and amortization charge for the year - ( 8,276) ( 35,560) ( 163,762) ( 207,598)
Balance at December 31, 2004,net of accumulated depreciation and amortization P 334,331 P 80,869 P 170,683 P 583,310 P 1,169,193
December 31, 2004Cost P 334,331 P 128,013 P 170,683 P 1,582,786 P 2,215,813Accumulated Depreciation and amortization - ( 47,144) - ( 999,476) ( 1,046,620)
Net carrying amount P 334,331 P 80,869 P 170,683 P 583,310 P 1,169,193
ParentLeasehold Furniture,Rights and Fixtures and
Land Buildings Improvements Equipment Total
Balance at January 1, 2005,net of accumulated depreciation andamortization P 334,331 P 80,869 P 163,108 P 527,955 P 1,106,263
Additions 142,917 58,409 57,758 552,312 811,396Disposals - - - ( 10,359) ( 10,359)Depreciation and amortization for the year - ( 18,480) ( 49,031) ( 207,020) ( 274,531)
Balance at December 31, 2005 net of accumulated depreciation andamortization P 477,248 P 120,798 P 171,835 P 862,888 P 1,632,769
December 31, 2005Cost P 477,248 P 186,411 P 171,835 P 1,939,130 P 2,774,624Accumulated depreciation and amortization - ( 65,613) - ( 1,076,242) ( 1,141,855)
Net carrying amount P 477,248 P 120,798 P 171,835 P 862,888 P 1,632,769
592005 ANNUAL REPORT
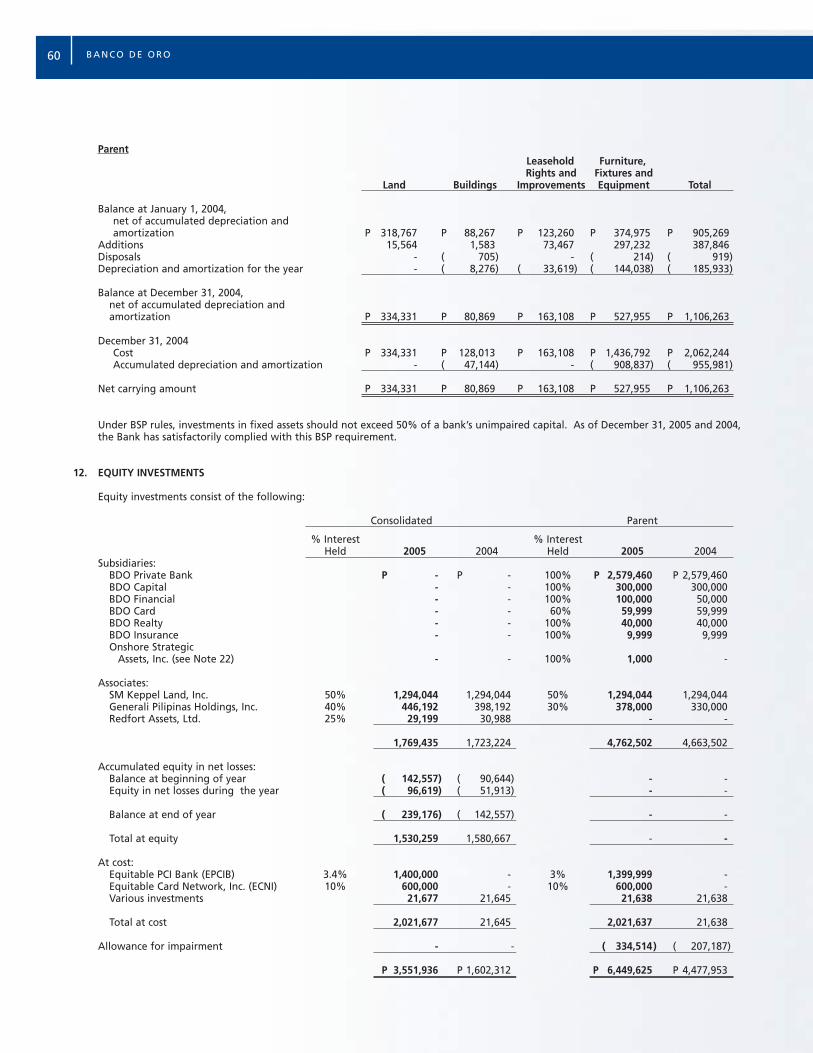
ParentLeasehold Furniture,Rights and Fixtures and
Land Buildings Improvements Equipment Total
Balance at January 1, 2004,net of accumulated depreciation andamortization P 318,767 P 88,267 P 123,260 P 374,975 P 905,269
Additions 15,564 1,583 73,467 297,232 387,846Disposals - ( 705) - ( 214) ( 919)Depreciation and amortization for the year - ( 8,276) ( 33,619) ( 144,038) ( 185,933)
Balance at December 31, 2004, net of accumulated depreciation andamortization P 334,331 P 80,869 P 163,108 P 527,955 P 1,106,263
December 31, 2004Cost P 334,331 P 128,013 P 163,108 P 1,436,792 P 2,062,244Accumulated depreciation and amortization - ( 47,144) - ( 908,837) ( 955,981)
Net carrying amount P 334,331 P 80,869 P 163,108 P 527,955 P 1,106,263
Under BSP rules, investments in fixed assets should not exceed 50% of a bank’s unimpaired capital. As of December 31, 2005 and 2004,the Bank has satisfactorily complied with this BSP requirement.
12. EQUITY INVESTMENTS
Equity investments consist of the following:
Consolidated Parent
% Interest % Interest Held 2005 2004 Held 2005 2004
Subsidiaries:BDO Private Bank P - P - 100% P 2,579,460 P 2,579,460BDO Capital - - 100% 300,000 300,000BDO Financial - - 100% 100,000 50,000BDO Card - - 60% 59,999 59,999BDO Realty - - 100% 40,000 40,000BDO Insurance - - 100% 9,999 9,999Onshore Strategic
Assets, Inc. (see Note 22) - - 100% 1,000 -
Associates:SM Keppel Land, Inc. 50% 1,294,044 1,294,044 50% 1,294,044 1,294,044Generali Pilipinas Holdings, Inc. 40% 446,192 398,192 30% 378,000 330,000Redfort Assets, Ltd. 25% 29,199 30,988 - -
1,769,435 1,723,224 4,762,502 4,663,502
Accumulated equity in net losses:Balance at beginning of year ( 142,557) ( 90,644) - -Equity in net losses during the year ( 96,619) ( 51,913) - -
Balance at end of year ( 239,176) ( 142,557) - -
Total at equity 1,530,259 1,580,667 - -
At cost:Equitable PCI Bank (EPCIB) 3.4% 1,400,000 - 3% 1,399,999 -Equitable Card Network, Inc. (ECNI) 10% 600,000 - 10% 600,000 -Various investments 21,677 21,645 21,638 21,638
Total at cost 2,021,677 21,645 2,021,637 21,638
Allowance for impairment - - ( 334,514) ( 207,187)
P 3,551,936 P 1,602,312 P 6,449,625 P 4,477,953
60 BANCO DE ORO
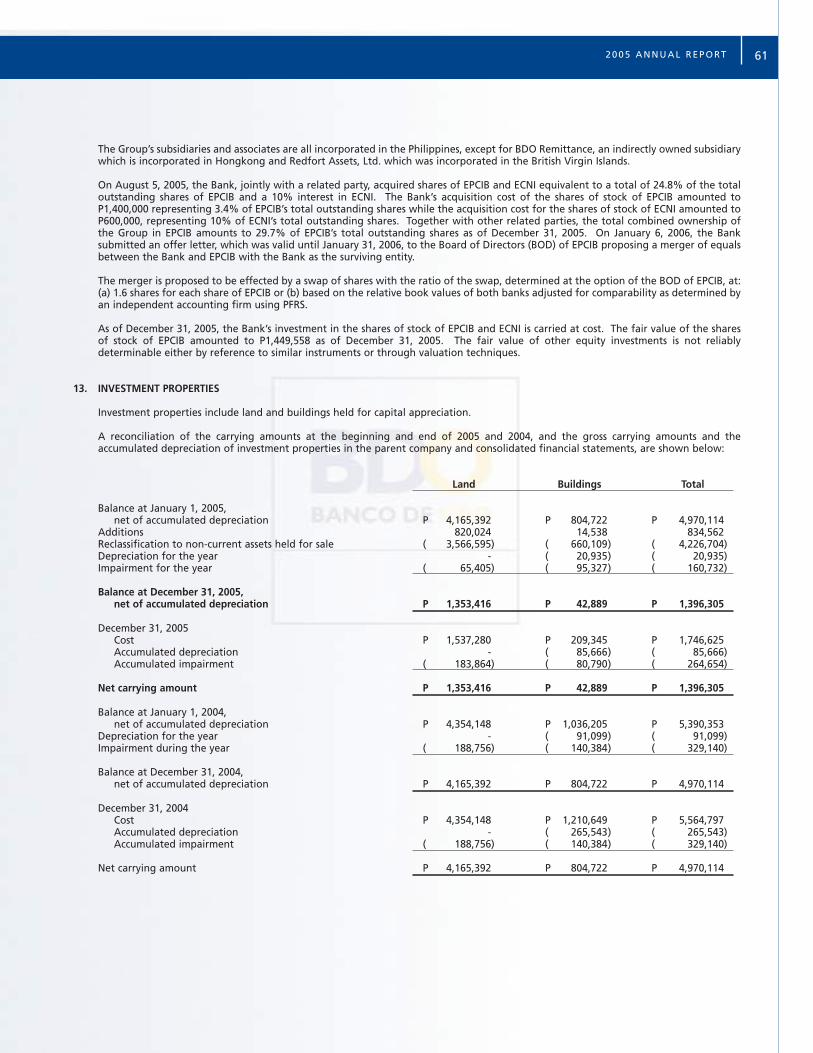
The Group’s subsidiaries and associates are all incorporated in the Philippines, except for BDO Remittance, an indirectly owned subsidiarywhich is incorporated in Hongkong and Redfort Assets, Ltd. which was incorporated in the British Virgin Islands.
On August 5, 2005, the Bank, jointly with a related party, acquired shares of EPCIB and ECNI equivalent to a total of 24.8% of the totaloutstanding shares of EPCIB and a 10% interest in ECNI. The Bank’s acquisition cost of the shares of stock of EPCIB amounted toP1,400,000 representing 3.4% of EPCIB’s total outstanding shares while the acquisition cost for the shares of stock of ECNI amounted toP600,000, representing 10% of ECNI’s total outstanding shares. Together with other related parties, the total combined ownership ofthe Group in EPCIB amounts to 29.7% of EPCIB’s total outstanding shares as of December 31, 2005. On January 6, 2006, the Banksubmitted an offer letter, which was valid until January 31, 2006, to the Board of Directors (BOD) of EPCIB proposing a merger of equalsbetween the Bank and EPCIB with the Bank as the surviving entity.
The merger is proposed to be effected by a swap of shares with the ratio of the swap, determined at the option of the BOD of EPCIB, at:(a) 1.6 shares for each share of EPCIB or (b) based on the relative book values of both banks adjusted for comparability as determined byan independent accounting firm using PFRS.
As of December 31, 2005, the Bank’s investment in the shares of stock of EPCIB and ECNI is carried at cost. The fair value of the sharesof stock of EPCIB amounted to P1,449,558 as of December 31, 2005. The fair value of other equity investments is not reliablydeterminable either by reference to similar instruments or through valuation techniques.
13. INVESTMENT PROPERTIES
Investment properties include land and buildings held for capital appreciation.
A reconciliation of the carrying amounts at the beginning and end of 2005 and 2004, and the gross carrying amounts and theaccumulated depreciation of investment properties in the parent company and consolidated financial statements, are shown below:
Land Buildings Total
Balance at January 1, 2005,net of accumulated depreciation P 4,165,392 P 804,722 P 4,970,114
Additions 820,024 14,538 834,562Reclassification to non-current assets held for sale ( 3,566,595) ( 660,109) ( 4,226,704)Depreciation for the year - ( 20,935) ( 20,935)Impairment for the year ( 65,405) ( 95,327) ( 160,732)
Balance at December 31, 2005, net of accumulated depreciation P 1,353,416 P 42,889 P 1,396,305
December 31, 2005Cost P 1,537,280 P 209,345 P 1,746,625Accumulated depreciation - ( 85,666) ( 85,666)Accumulated impairment ( 183,864) ( 80,790) ( 264,654)
Net carrying amount P 1,353,416 P 42,889 P 1,396,305
Balance at January 1, 2004,net of accumulated depreciation P 4,354,148 P 1,036,205 P 5,390,353
Depreciation for the year - ( 91,099) ( 91,099)Impairment during the year ( 188,756) ( 140,384) ( 329,140)
Balance at December 31, 2004,net of accumulated depreciation P 4,165,392 P 804,722 P 4,970,114
December 31, 2004Cost P 4,354,148 P 1,210,649 P 5,564,797Accumulated depreciation - ( 265,543) ( 265,543)Accumulated impairment ( 188,756) ( 140,384) ( 329,140)
Net carrying amount P 4,165,392 P 804,722 P 4,970,114
612005 ANNUAL REPORT

14. OTHER RESOURCES
Other resources consist of the following:
Consolidated Parent2005 2004 2005 2004
Noncurrent assets held by Onshore (see Note 23) P 8,931,622 P - P - P -Deposits under escrow (see Note 23) 2,931,054 2,931,400 2,931,054 2,931,400Deferred tax assets (see Note 21) 1,414,276 1,609,933 1,388,425 1,559,217Foreign currency notes and coins on hand 715,093 834,345 715,093 834,345Goodwill (see Note 23) 600,000 - 600,000 -Retirement benefit asset (see Note 20) 185,232 22,967 166,103 4,198Deferred charges - net of amortization 183,664 261,561 170,487 246,962Documentary stamps tax 122,521 52,438 122,521 52,438Returned checks and other cash items 84,915 88,010 84,915 88,010Others 263,124 256,338 133,194 212,535
P 15,431,501 P 6,056,992 P 6,311,792 P 5,929,105
In the consolidated financial statements, non-current assets held by Onshore pertain to non-performing assets acquired by Onshore fromUnited Overseas Bank of the Philippines (UOBP) in relation to the Group’s acquisition of certain assets and branch licenses and assumptionof certain liabilities of UOBP (see Note 23). This is presented under Other Resources as approved by the BSP.
Deposits under escrow amounting to P2,931,054 and P2,931,400 as of December 31, 2005 and 2004, respectively, pertain to the portion ofthe cash received by the Bank in consideration for its assumption of First e-Bank Corporation’s deposits and other liabilities (see Note 23).
Amortization expense on deferred charges (mostly branch licenses and computer software) amounted to P5,286 in 2005 and P54,431 andare included in Other Expenses in the statements of income (see Note 18).
15. DEPOSIT LIABILITIES
This account is composed of the following:
Consolidated Parent2005 2004 2005 2004
Due to banks:Demand P 758,533 P 594,765 P 106,959 P 80,615Savings 346,820 255,591 427,392 255,591Time 4,306,829 2,457,625 1,064,778 1,665
5,412,182 3,307,981 1,599,129 337,871Due to customers:
Demand 3,968,303 3,025,878 4,012,925 3,046,733Savings 98,936,278 77,419,782 99,207,221 77,600,767Time 51,349,360 44,893,677 51,372,261 44,894,579
154,253,941 125,339,337 154,592,407 125,542,079
Total P 159,666,123 P 128,647,318 P 156,191,536 P 125,879,950
The breakdown of this account, as to currency, is as follows:
Consolidated Parent2005 2004 2005 2004
Foreign currency P 61,648,890 P 54,960,183 P 59,192,904 P 53,140,100Peso 98,017,233 73,687,135 96,998,632 72,739,850
P 159,666,123 P 128,647,318 P 156,191,536 P 125,879,950
62 BANCO DE ORO
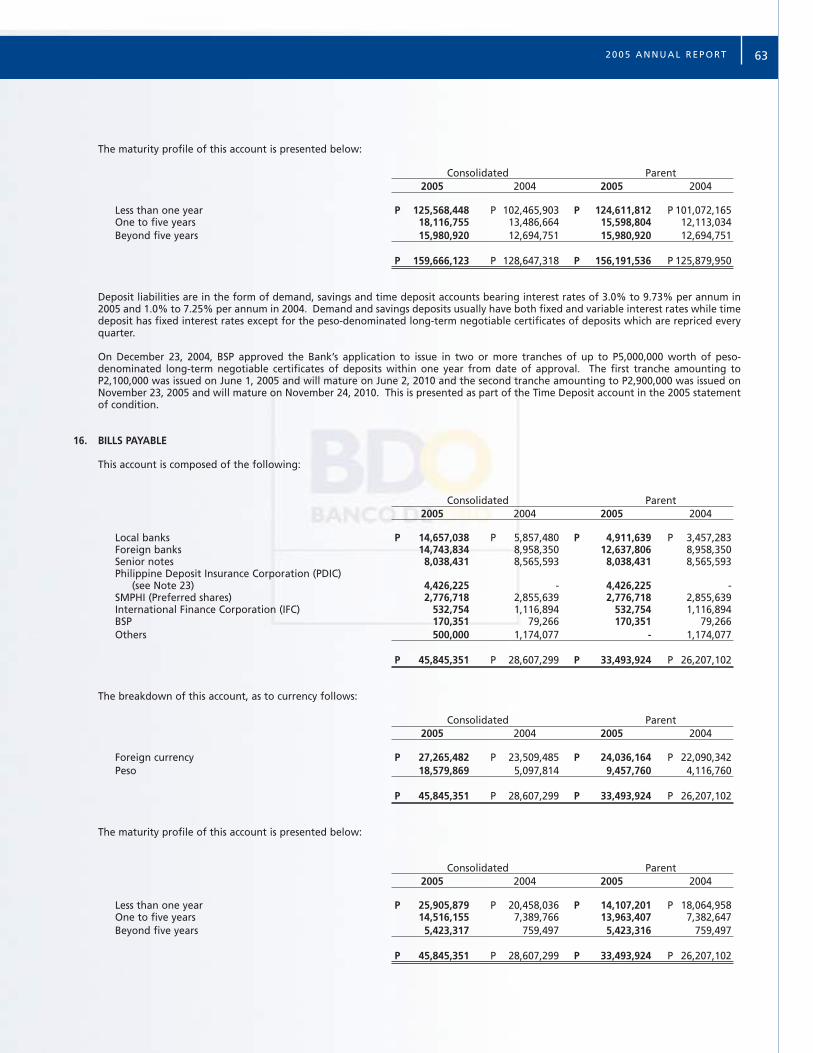
The maturity profile of this account is presented below:
Consolidated Parent2005 2004 2005 2004
Less than one year P 125,568,448 P 102,465,903 P 124,611,812 P 101,072,165One to five years 18,116,755 13,486,664 15,598,804 12,113,034 Beyond five years 15,980,920 12,694,751 15,980,920 12,694,751
P 159,666,123 P 128,647,318 P 156,191,536 P 125,879,950
Deposit liabilities are in the form of demand, savings and time deposit accounts bearing interest rates of 3.0% to 9.73% per annum in2005 and 1.0% to 7.25% per annum in 2004. Demand and savings deposits usually have both fixed and variable interest rates while timedeposit has fixed interest rates except for the peso-denominated long-term negotiable certificates of deposits which are repriced everyquarter.
On December 23, 2004, BSP approved the Bank’s application to issue in two or more tranches of up to P5,000,000 worth of peso-denominated long-term negotiable certificates of deposits within one year from date of approval. The first tranche amounting toP2,100,000 was issued on June 1, 2005 and will mature on June 2, 2010 and the second tranche amounting to P2,900,000 was issued onNovember 23, 2005 and will mature on November 24, 2010. This is presented as part of the Time Deposit account in the 2005 statementof condition.
16. BILLS PAYABLE
This account is composed of the following:
Consolidated Parent2005 2004 2005 2004
Local banks P 14,657,038 P 5,857,480 P 4,911,639 P 3,457,283Foreign banks 14,743,834 8,958,350 12,637,806 8,958,350Senior notes 8,038,431 8,565,593 8,038,431 8,565,593Philippine Deposit Insurance Corporation (PDIC)
(see Note 23) 4,426,225 - 4,426,225 -SMPHI (Preferred shares) 2,776,718 2,855,639 2,776,718 2,855,639International Finance Corporation (IFC) 532,754 1,116,894 532,754 1,116,894BSP 170,351 79,266 170,351 79,266Others 500,000 1,174,077 - 1,174,077
P 45,845,351 P 28,607,299 P 33,493,924 P 26,207,102
The breakdown of this account, as to currency follows:
Consolidated Parent2005 2004 2005 2004
Foreign currency P 27,265,482 P 23,509,485 P 24,036,164 P 22,090,342Peso 18,579,869 5,097,814 9,457,760 4,116,760
P 45,845,351 P 28,607,299 P 33,493,924 P 26,207,102
The maturity profile of this account is presented below:
Consolidated Parent2005 2004 2005 2004
Less than one year P 25,905,879 P 20,458,036 P 14,107,201 P 18,064,958One to five years 14,516,155 7,389,766 13,963,407 7,382,647Beyond five years 5,423,317 759,497 5,423,316 759,497
P 45,845,351 P 28,607,299 P 33,493,924 P 26,207,102
632005 ANNUAL REPORT

Bills payable bears interest rates of 3.9% to 13.70% per annum in 2005 and 1.89% to 13.70% per annum in 2004.
On October 16, 2003, the Bank listed 6.5% US$150,000 senior notes in the Singapore Stock Exchange which will mature on October 16,2008. The net proceeds from the issuance of the senior notes amounted to US$146,621 or about P8,890,000. Interest expense incurredby the Bank on these senior notes amounted to P538,975 in 2005 and P546,841 in 2004 (shown under Interest Expense on Bills Payableand Other Borrowings in the statements of income).
As required under PAS 32, Financial Instruments: Disclosures and Presentation, the Bank recognized as financial liability 25,000,000 sharesof redeemable, cumulative and non-participating preferred shares with a par value of P10 per share issued to SMPHI on October 18,2004. The preferred shares were issued at US$2 per share or an aggregate subscription price of US$50,000. The preferred shares entitleSMPHI to cumulative dividends, payable in US dollars semi-annually in arrears, equal to 6.5% of the issue price per annum. The Bank isalso required to redeem the preferred shares from SMPHI at the original issue price five years from the date of issue. As required by BSP,the Bank setup a sinking fund on October 17, 2005 for the redemption of the preferred shares. The balance of the sinking fund as ofDecember 31, 2005 amounts to P570,008 and is invested in debt securities, shown as part of Held-to-Maturity Investments in thestatements of condition (see Note 9). Dividends in arrears (recognized as interest expense) as of December 31, 2005 and 2004 amountedto P122,218 and P37,589 computed using the exchange rate at year end and are presented as part of Bills Payable account in thestatements of condition.
On June 27, 2002, the Bank entered into a US$20,000 convertible loan agreement with IFC. IFC has the option to convert a portion ofthe loan into common shares of the Bank commencing two years after the date of the agreement for P16.70 per share. Total proceedsof the loan amounted to P1,111,720. In compliance with PAS 32, Financial Instruments: Disclosure and Presentation and PAS 39, FinancialInstruments: Recognition and Measurement, the Bank separated the equity component of the conversion option and unsecured loanwith IFC. The balance of common stock option outstanding as of December 31, 2005 and 2004 amounted to P13,634 and P27,268,respectively. The loan bears interest at a rate of 4.03% per annum and will mature in 2008. Total interest paid by the Bank amountedto P31,710 in 2005 and P20,490 in 2004, of which P30,896 and P19,964, respectively, are charged to income and shown under InterestExpense on Bills Payable and Other Borrowings in the statements of income while P814 and P526, respectively, are recognized asdividends which were directly charged to capital funds.
Upon approval by the Bank’s Board of Directors on February 11, 2005, the Bank converted US$10,000 convertible loan from IFC, qualifiedas Tier 2 capital, and issued 31,403,592 common shares of the Bank based on the conversion price of P16.70 per share and exchange rateof P52.44 to a dollar. The BSP subsequently approved the conversion on May 3, 2005.
17. OTHER LIABILITIES
Other liabilities consist of the following:
Consolidated Parent2005 2004 2005 2004
Accounts payable P 1,857,805 P 808,144 P 1,673,718 P 744,590Sundry credits 1,756,415 1,846,057 1,756,415 1,846,057Due to UOBP (see Note 23) 600,000 - 600,000 -Outstanding acceptances payable 525,093 557,961 525,093 557,961Manager’s checks 469,268 365,437 469,269 365,438Accrued other taxes and licenses 254,488 244,159 250,639 241,950Capitalized interest and other charges 179,022 126,817 119,012 126,817Due to BSP 110,553 87,984 110,553 87,984Due to insurance companies/Treasurer of the Philippines 38,747 45,993 68,115 17,697Others 1,069,299 1,012,369 749,559 902,314
P 6,860,690 P 5,094,921 P 6,322,373 P 4,890,808
Sundry credits pertain to bills purchase line availments which are settled on the third day from the transaction date.
Capitalized interests and other charges represent interest on restructured receivables from customers. These are recognized as incomeonly upon collection.
18. CAPITAL FUNDS
18.1 Issuance of Global Depositary Receipts by Primebridge
On January 25, 2006 and February 14, 2006, Primebridge Holdings, Inc. (Primebridge), a stockholder owning 22.08% of the Bank’s totaloutstanding shares as of December 31, 2005, offered and sold 9,056,000 global depositary receipts (GDRs) each representing 20 shares ofthe Bank’s common stock with a par value of P10 per share. The GDRs constitute an offering in the United States only to qualifiedinstitutional buyers in reliance on Rule 144A under the U.S. Securities Act of 1993 (the “Securities Act”) and an offering outside theUnited States in reliance on Regulation S under the Securities Act. The offered price for each GDR is US$12.70.
64 BANCO DE ORO
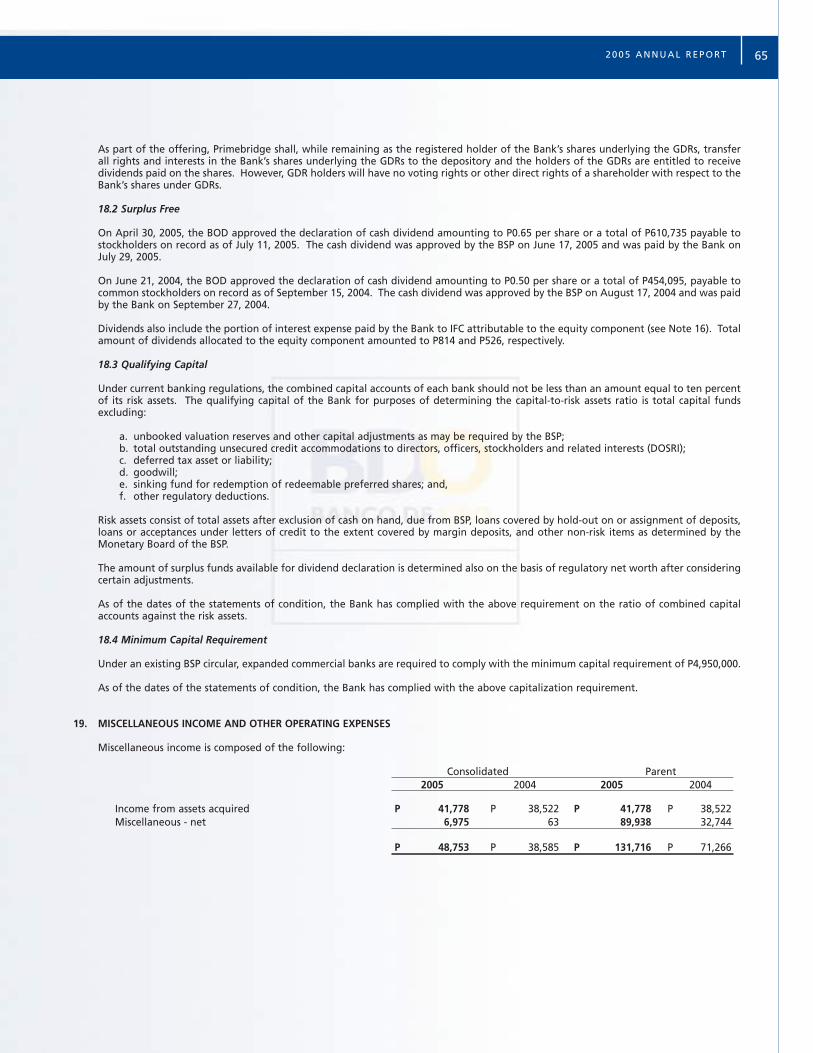
As part of the offering, Primebridge shall, while remaining as the registered holder of the Bank’s shares underlying the GDRs, transferall rights and interests in the Bank’s shares underlying the GDRs to the depository and the holders of the GDRs are entitled to receivedividends paid on the shares. However, GDR holders will have no voting rights or other direct rights of a shareholder with respect to theBank’s shares under GDRs.
18.2 Surplus Free
On April 30, 2005, the BOD approved the declaration of cash dividend amounting to P0.65 per share or a total of P610,735 payable tostockholders on record as of July 11, 2005. The cash dividend was approved by the BSP on June 17, 2005 and was paid by the Bank onJuly 29, 2005.
On June 21, 2004, the BOD approved the declaration of cash dividend amounting to P0.50 per share or a total of P454,095, payable tocommon stockholders on record as of September 15, 2004. The cash dividend was approved by the BSP on August 17, 2004 and was paidby the Bank on September 27, 2004.
Dividends also include the portion of interest expense paid by the Bank to IFC attributable to the equity component (see Note 16). Totalamount of dividends allocated to the equity component amounted to P814 and P526, respectively.
18.3 Qualifying Capital
Under current banking regulations, the combined capital accounts of each bank should not be less than an amount equal to ten percentof its risk assets. The qualifying capital of the Bank for purposes of determining the capital-to-risk assets ratio is total capital fundsexcluding:
a. unbooked valuation reserves and other capital adjustments as may be required by the BSP;b. total outstanding unsecured credit accommodations to directors, officers, stockholders and related interests (DOSRI); c. deferred tax asset or liability; d. goodwill; e. sinking fund for redemption of redeemable preferred shares; and,f. other regulatory deductions.
Risk assets consist of total assets after exclusion of cash on hand, due from BSP, loans covered by hold-out on or assignment of deposits,loans or acceptances under letters of credit to the extent covered by margin deposits, and other non-risk items as determined by theMonetary Board of the BSP.
The amount of surplus funds available for dividend declaration is determined also on the basis of regulatory net worth after consideringcertain adjustments.
As of the dates of the statements of condition, the Bank has complied with the above requirement on the ratio of combined capitalaccounts against the risk assets.
18.4 Minimum Capital Requirement
Under an existing BSP circular, expanded commercial banks are required to comply with the minimum capital requirement of P4,950,000.
As of the dates of the statements of condition, the Bank has complied with the above capitalization requirement.
19. MISCELLANEOUS INCOME AND OTHER OPERATING EXPENSES
Miscellaneous income is composed of the following:
Consolidated Parent2005 2004 2005 2004
Income from assets acquired P 41,778 P 38,522 P 41,778 P 38,522Miscellaneous - net 6,975 63 89,938 32,744
P 48,753 P 38,585 P 131,716 P 71,266
652005 ANNUAL REPORT

Other operating expenses consist of the following:
Consolidated Parent2005 2004 2005 2004
Advertising P 269,074 P 87,000 P 157,868 P 29,982Representation and entertainment 190,483 159,470 150,928 134,741Management and other professional fees 134,114 46,508 123,682 32,669Repairs and maintenance 133,045 130,761 123,222 117,995Power, light and water 116,616 93,481 91,437 72,624Banking fees 106,504 88,000 102,000 88,000Travelling 100,928 79,923 91,443 72,413Supplies 94,966 94,387 71,222 66,298Amortization of deferred charges 5,286 54,431 5,286 54,431Miscellaneous 608,397 225,368 478,355 202,763
P 1,759,413 P 1,059,329 P 1,395,443 P 871,916
20. EMPLOYEES BENEFITS
Expenses recognized for employee benefits are presented below:
Consolidated Parent2005 2004 2005 2004
Salaries and wages P 1,505,471 P 1,193,265 P 1,363,928 P 1,079,829Bonuses 384,066 311,539 371,329 303,745Retirement - defined benefit plan 70,846 66,608 66,958 61,611Social security costs 58,728 46,033 56,545 44,471Other benefits 89,864 62,563 75,729 51,549
P 2,108,975 P 1,680,008 P 1,934,489 P 1,541,205
The Group maintains a tax-qualified, noncontributory retirement plan that is being administered by a trustee covering all regular full-time employees.
The Group obtained an updated actuarial valuation as of January 1, 2004 to ascertain its transitional liability as of that date in accordancewith PAS 19, Employee Benefits. The Group’s transition to PAS 19 is discussed in Note 2. Actuarial valuations are made every two yearsto update the retirement benefit costs and the amount of contributions.
The amounts of retirement benefit asset recognized and recorded as part of Other Resources account in the statements of condition aredetermined as follows:
Consolidated Parent2005 2004 2005 2004
Present value of the obligation (P 645,394) (P 473,755 ) (P 607,021) (P 450,205)Fair value of plan assets 796,356 510,203 750,005 471,177Excess of plan assets 150,962 36,448 142,984 20,972Unrecognized actuarial losses (gains) 34,270 ( 13,481 ) 23,119 ( 16,774)
Retirement benefit asset P 185,232 P 22,967 P 166,103 P 4,198
The amounts of retirement benefits recognized in the statements of income are as follows:
Consolidated Parent2005 2004 2005 2004
Current service costs P 53,499 P 53,306 P 49,246 P 50,181Interest costs 68,220 51,666 64,830 49,794Expected return on plan assets ( 51,020) ( 38,364 ) ( 47,118) ( 38,364)Net actuarial losses recognized 147 - - -
Retirement benefits P 70,846 P 66,608 P 66,958 P 61,611
66 BANCO DE ORO
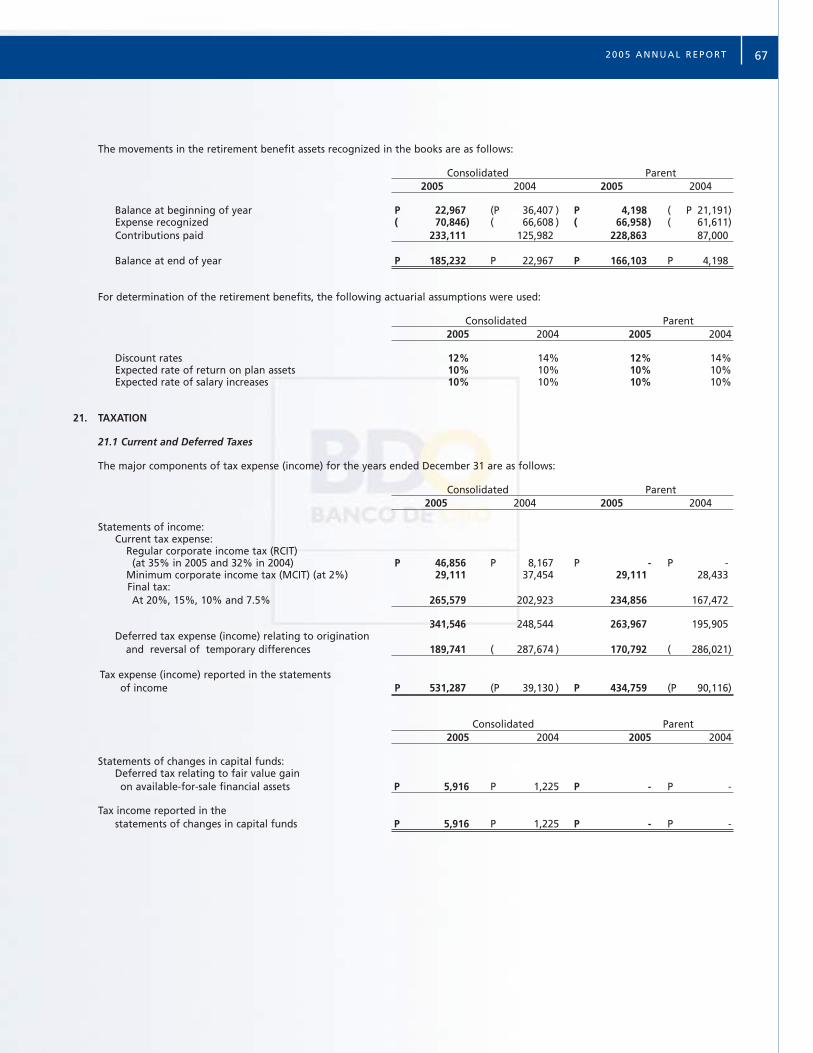
The movements in the retirement benefit assets recognized in the books are as follows:
Consolidated Parent2005 2004 2005 2004
Balance at beginning of year P 22,967 (P 36,407 ) P 4,198 ( P 21,191)Expense recognized ( 70,846) ( 66,608 ) ( 66,958) ( 61,611)Contributions paid 233,111 125,982 228,863 87,000
Balance at end of year P 185,232 P 22,967 P 166,103 P 4,198
For determination of the retirement benefits, the following actuarial assumptions were used:
Consolidated Parent2005 2004 2005 2004
Discount rates 12% 14% 12% 14%Expected rate of return on plan assets 10% 10% 10% 10%Expected rate of salary increases 10% 10% 10% 10%
21. TAXATION
21.1 Current and Deferred Taxes
The major components of tax expense (income) for the years ended December 31 are as follows:
Consolidated Parent2005 2004 2005 2004
Statements of income:Current tax expense:
Regular corporate income tax (RCIT) (at 35% in 2005 and 32% in 2004) P 46,856 P 8,167 P - P -
Minimum corporate income tax (MCIT) (at 2%) 29,111 37,454 29,111 28,433Final tax:At 20%, 15%, 10% and 7.5% 265,579 202,923 234,856 167,472
341,546 248,544 263,967 195,905Deferred tax expense (income) relating to origination
and reversal of temporary differences 189,741 ( 287,674 ) 170,792 ( 286,021)
Tax expense (income) reported in the statements of income P 531,287 (P 39,130 ) P 434,759 (P 90,116)
Consolidated Parent2005 2004 2005 2004
Statements of changes in capital funds:Deferred tax relating to fair value gainon available-for-sale financial assets P 5,916 P 1,225 P - P -
Tax income reported in the statements of changes in capital funds P 5,916 P 1,225 P - P -
672005 ANNUAL REPORT
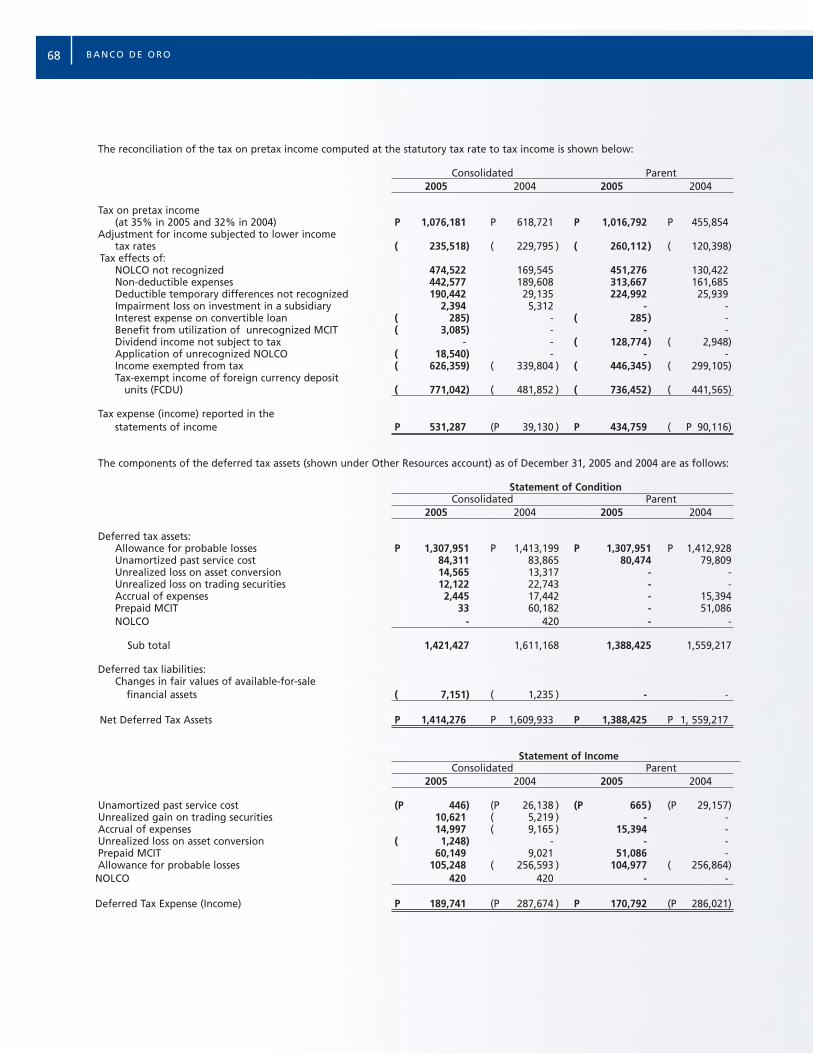
The reconciliation of the tax on pretax income computed at the statutory tax rate to tax income is shown below:
Consolidated Parent2005 2004 2005 2004
Tax on pretax income(at 35% in 2005 and 32% in 2004) P 1,076,181 P 618,721 P 1,016,792 P 455,854
Adjustment for income subjected to lower income tax rates ( 235,518) ( 229,795 ) ( 260,112) ( 120,398)
Tax effects of:NOLCO not recognized 474,522 169,545 451,276 130,422Non-deductible expenses 442,577 189,608 313,667 161,685Deductible temporary differences not recognized 190,442 29,135 224,992 25,939Impairment loss on investment in a subsidiary 2,394 5,312 - -Interest expense on convertible loan ( 285) - ( 285) -Benefit from utilization of unrecognized MCIT ( 3,085) - - -Dividend income not subject to tax - - ( 128,774) ( 2,948)Application of unrecognized NOLCO ( 18,540) - - -Income exempted from tax ( 626,359) ( 339,804 ) ( 446,345) ( 299,105)Tax-exempt income of foreign currency deposit
units (FCDU) ( 771,042) ( 481,852 ) ( 736,452) ( 441,565)
Tax expense (income) reported in thestatements of income P 531,287 (P 39,130 ) P 434,759 ( P 90,116)
The components of the deferred tax assets (shown under Other Resources account) as of December 31, 2005 and 2004 are as follows:
Statement of ConditionConsolidated Parent
2005 2004 2005 2004
Deferred tax assets:Allowance for probable losses P 1,307,951 P 1,413,199 P 1,307,951 P 1,412,928Unamortized past service cost 84,311 83,865 80,474 79,809Unrealized loss on asset conversion 14,565 13,317 - -Unrealized loss on trading securities 12,122 22,743 - -Accrual of expenses 2,445 17,442 - 15,394Prepaid MCIT 33 60,182 - 51,086NOLCO - 420 - -
Sub total 1,421,427 1,611,168 1,388,425 1,559,217
Deferred tax liabilities:Changes in fair values of available-for-sale
financial assets ( 7,151) ( 1,235 ) - -
Net Deferred Tax Assets P 1,414,276 P 1,609,933 P 1,388,425 P 1, 559,217
Statement of IncomeConsolidated Parent
2005 2004 2005 2004
Unamortized past service cost (P 446) (P 26,138 ) (P 665) (P 29,157)Unrealized gain on trading securities 10,621 ( 5,219 ) - -Accrual of expenses 14,997 ( 9,165 ) 15,394 -Unrealized loss on asset conversion ( 1,248) - - -Prepaid MCIT 60,149 9,021 51,086 -Allowance for probable losses 105,248 ( 256,593 ) 104,977 ( 256,864)NOLCO 420 420 - -
Deferred Tax Expense (Income) P 189,741 (P 287,674 ) P 170,792 (P 286,021)
68 BANCO DE ORO
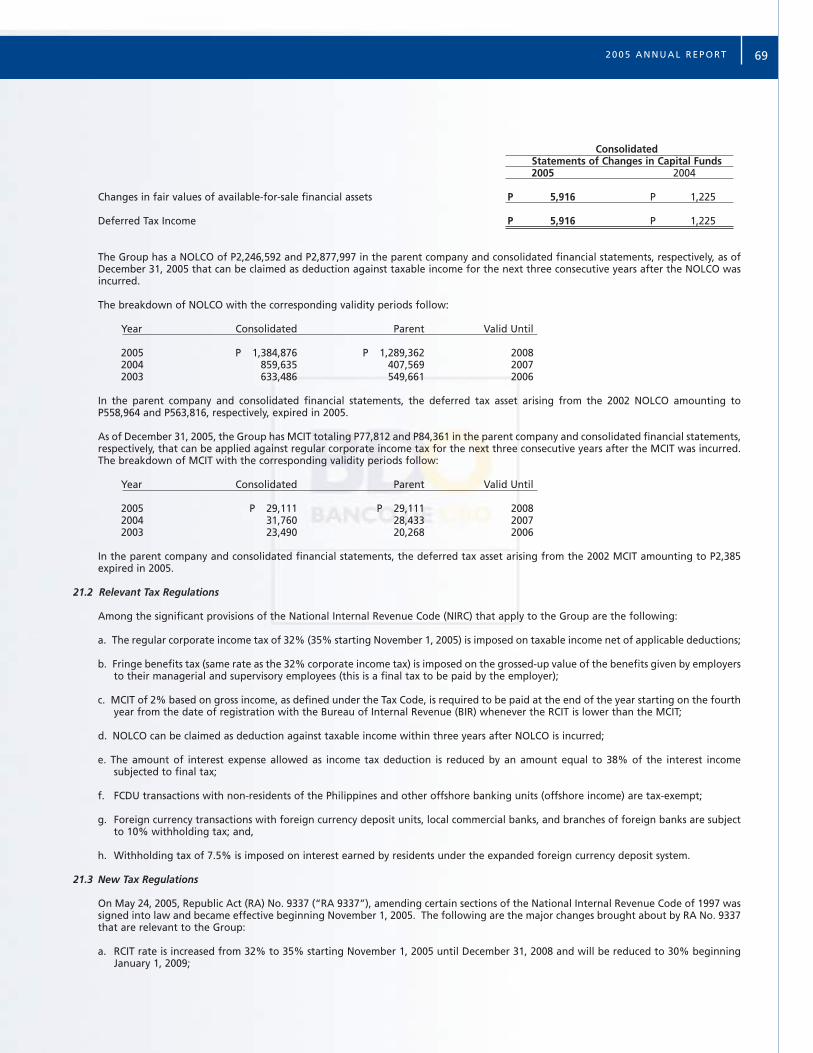
ConsolidatedStatements of Changes in Capital Funds2005 2004
Changes in fair values of available-for-sale financial assets P 5,916 P 1,225
Deferred Tax Income P 5,916 P 1,225
The Group has a NOLCO of P2,246,592 and P2,877,997 in the parent company and consolidated financial statements, respectively, as ofDecember 31, 2005 that can be claimed as deduction against taxable income for the next three consecutive years after the NOLCO wasincurred.
The breakdown of NOLCO with the corresponding validity periods follow:
Year Consolidated Parent Valid Until
2005 P 1,384,876 P 1,289,362 20082004 859,635 407,569 20072003 633,486 549,661 2006
In the parent company and consolidated financial statements, the deferred tax asset arising from the 2002 NOLCO amounting toP558,964 and P563,816, respectively, expired in 2005.
As of December 31, 2005, the Group has MCIT totaling P77,812 and P84,361 in the parent company and consolidated financial statements,respectively, that can be applied against regular corporate income tax for the next three consecutive years after the MCIT was incurred.The breakdown of MCIT with the corresponding validity periods follow:
Year Consolidated Parent Valid Until
2005 P 29,111 P 29,111 20082004 31,760 28,433 20072003 23,490 20,268 2006
In the parent company and consolidated financial statements, the deferred tax asset arising from the 2002 MCIT amounting to P2,385expired in 2005.
21.2 Relevant Tax Regulations
Among the significant provisions of the National Internal Revenue Code (NIRC) that apply to the Group are the following:
a. The regular corporate income tax of 32% (35% starting November 1, 2005) is imposed on taxable income net of applicable deductions;
b. Fringe benefits tax (same rate as the 32% corporate income tax) is imposed on the grossed-up value of the benefits given by employersto their managerial and supervisory employees (this is a final tax to be paid by the employer);
c. MCIT of 2% based on gross income, as defined under the Tax Code, is required to be paid at the end of the year starting on the fourthyear from the date of registration with the Bureau of Internal Revenue (BIR) whenever the RCIT is lower than the MCIT;
d. NOLCO can be claimed as deduction against taxable income within three years after NOLCO is incurred;
e. The amount of interest expense allowed as income tax deduction is reduced by an amount equal to 38% of the interest incomesubjected to final tax;
f. FCDU transactions with non-residents of the Philippines and other offshore banking units (offshore income) are tax-exempt;
g. Foreign currency transactions with foreign currency deposit units, local commercial banks, and branches of foreign banks are subjectto 10% withholding tax; and,
h. Withholding tax of 7.5% is imposed on interest earned by residents under the expanded foreign currency deposit system.
21.3 New Tax Regulations
On May 24, 2005, Republic Act (RA) No. 9337 (“RA 9337”), amending certain sections of the National Internal Revenue Code of 1997 wassigned into law and became effective beginning November 1, 2005. The following are the major changes brought about by RA No. 9337that are relevant to the Group:
a. RCIT rate is increased from 32% to 35% starting November 1, 2005 until December 31, 2008 and will be reduced to 30% beginningJanuary 1, 2009;
692005 ANNUAL REPORT
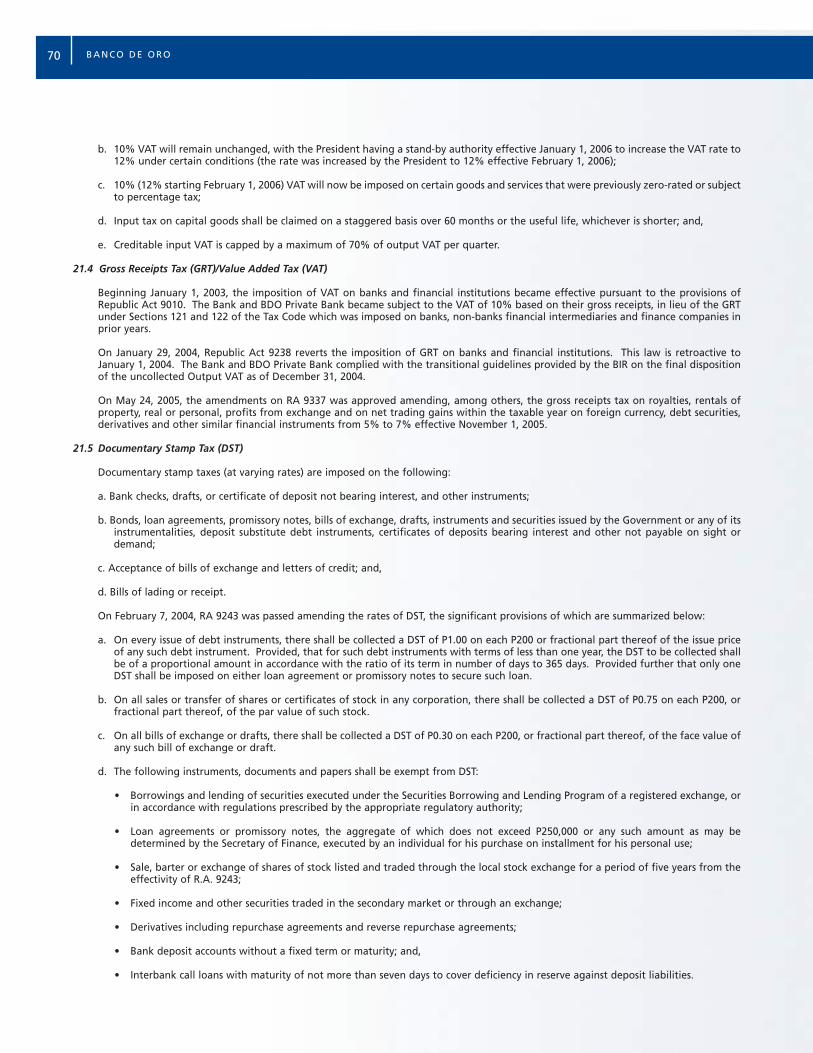
b. 10% VAT will remain unchanged, with the President having a stand-by authority effective January 1, 2006 to increase the VAT rate to12% under certain conditions (the rate was increased by the President to 12% effective February 1, 2006);
c. 10% (12% starting February 1, 2006) VAT will now be imposed on certain goods and services that were previously zero-rated or subjectto percentage tax;
d. Input tax on capital goods shall be claimed on a staggered basis over 60 months or the useful life, whichever is shorter; and,
e. Creditable input VAT is capped by a maximum of 70% of output VAT per quarter.
21.4 Gross Receipts Tax (GRT)/Value Added Tax (VAT)
Beginning January 1, 2003, the imposition of VAT on banks and financial institutions became effective pursuant to the provisions ofRepublic Act 9010. The Bank and BDO Private Bank became subject to the VAT of 10% based on their gross receipts, in lieu of the GRTunder Sections 121 and 122 of the Tax Code which was imposed on banks, non-banks financial intermediaries and finance companies inprior years.
On January 29, 2004, Republic Act 9238 reverts the imposition of GRT on banks and financial institutions. This law is retroactive toJanuary 1, 2004. The Bank and BDO Private Bank complied with the transitional guidelines provided by the BIR on the final dispositionof the uncollected Output VAT as of December 31, 2004.
On May 24, 2005, the amendments on RA 9337 was approved amending, among others, the gross receipts tax on royalties, rentals ofproperty, real or personal, profits from exchange and on net trading gains within the taxable year on foreign currency, debt securities,derivatives and other similar financial instruments from 5% to 7% effective November 1, 2005.
21.5 Documentary Stamp Tax (DST)
Documentary stamp taxes (at varying rates) are imposed on the following:
a. Bank checks, drafts, or certificate of deposit not bearing interest, and other instruments;
b. Bonds, loan agreements, promissory notes, bills of exchange, drafts, instruments and securities issued by the Government or any of itsinstrumentalities, deposit substitute debt instruments, certificates of deposits bearing interest and other not payable on sight ordemand;
c. Acceptance of bills of exchange and letters of credit; and,
d. Bills of lading or receipt.
On February 7, 2004, RA 9243 was passed amending the rates of DST, the significant provisions of which are summarized below:
a. On every issue of debt instruments, there shall be collected a DST of P1.00 on each P200 or fractional part thereof of the issue priceof any such debt instrument. Provided, that for such debt instruments with terms of less than one year, the DST to be collected shallbe of a proportional amount in accordance with the ratio of its term in number of days to 365 days. Provided further that only oneDST shall be imposed on either loan agreement or promissory notes to secure such loan.
b. On all sales or transfer of shares or certificates of stock in any corporation, there shall be collected a DST of P0.75 on each P200, orfractional part thereof, of the par value of such stock.
c. On all bills of exchange or drafts, there shall be collected a DST of P0.30 on each P200, or fractional part thereof, of the face value ofany such bill of exchange or draft.
d. The following instruments, documents and papers shall be exempt from DST:
• Borrowings and lending of securities executed under the Securities Borrowing and Lending Program of a registered exchange, orin accordance with regulations prescribed by the appropriate regulatory authority;
• Loan agreements or promissory notes, the aggregate of which does not exceed P250,000 or any such amount as may bedetermined by the Secretary of Finance, executed by an individual for his purchase on installment for his personal use;
• Sale, barter or exchange of shares of stock listed and traded through the local stock exchange for a period of five years from theeffectivity of R.A. 9243;
• Fixed income and other securities traded in the secondary market or through an exchange;
• Derivatives including repurchase agreements and reverse repurchase agreements;
• Bank deposit accounts without a fixed term or maturity; and,
• Interbank call loans with maturity of not more than seven days to cover deficiency in reserve against deposit liabilities.
70 BANCO DE ORO
22. TRUST OPERATIONS
The following securities and other properties held by the Bank in fiduciary or agency capacity (for a fee) for its customers are not includedin the accompanying statements of condition since these are not properties of the Bank (see Note 27).
Consolidated Parent2005 2004 2005 2004
Investments P 89,485,077 P 69,380,206 P 89,485,077 P 69,380,206Others 22,298,065 19,085,798 22,297,995 19,085,798
P 111,783,142 P 88,466,004 P 111,783,072 P 88,466,004
In compliance with the requirements of the General Banking Act relative to the Bank’s trust functions:
a. Investment in government securities (shown as part of Held-to-Maturity Investments) with a total face value of P889,400 as ofDecember 31, 2005 and P837,310 as of December 31, 2004 are deposited with BSP as security for the Bank’s faithful compliance withits fiduciary obligations (see Note 9); and
b. A certain percentage of the Bank’s trust income is transferred to surplus reserve. This yearly transfer is required until the surplusreserve for trust function is equivalent to 20% of the Bank’s authorized capital stock. As of December 31, 2005, the reserve for trustfunctions amounted to P135,725 and is shown as Surplus Reserves in the statements of changes in capital funds.
Income from trust operations is reported net of the related expenses and amounted to P422,777 and P375,516 for the years endedDecember 31, 2005 and 2004, respectively, and shown under Trust Fees in the statements of income.
23. MERGERS AND ACQUISITIONS
23.1 United Overseas Bank Philippines
On May 6, 2005, the Bank and United Overseas Bank Philippines (UOBP) and United Overseas Bank Limited (UOBL) signed a Memorandumof Agreement (MOA) whereby the Bank acquired the 66 branches of UOBP for a total cash consideration of P600,000. As part of theMOA, the Bank assumed the deposit liabilities of UOBP in consideration of an equivalent amount of related assets of UOBP, includingcash payment in case the assets would be lower than the assumed liabilities. Also under the MOA, the P600,000 payment of the Bankwill be used by UOBL to subscribe for the Bank’s shares of common stock valued at P26.75 per share, or equivalent to 22,429,906 shares.On December 19, 2005, the transfer of the assets including cash payment made by UOBP to fully offset the assumed liabilities by the Bankwas carried out.
The accounts assumed by the Bank and the resulting goodwill are determined as follows:
Cash consideration P 600,000
Assets acquired and liabilities assumed:Assets acquired:
Cash 279,960Due from other banks 10,649Held-to-maturity investments 693,768Loans and receivables 5,418,411Bank premises, furniture, fixtures and equipment 209,400Other resources 1,857,222
Total assets acquired 8,469,410
Liabilities assumed:Deposit liabilities 8,414,278Other liabilities 55,132
Total liabilities assumed 8,469,410
Net assets acquired over liabilities assumed -
Goodwill P 600,000
The goodwill amounting to P600,000 is presented as part of Other Resources in the 2005 statement of condition (see Note 14) while theBank’s liability to UOBL relating to the acquisition amounting to P600,000 is presented as part of Other Liabilities in the 2005 statementof condition (see Note 17).
The UOBP acquisition was approved by the BSP on September 8, 2005 while the shares to be subscribed by UOBL were subsequently issuedin February 2006.
712005 ANNUAL REPORT
As part of the MOA, a special purpose entity is created to acquire the non-performing assets (loans and real and other propertiesacquired) of UOBP (excluded in the net assets acquired by the Bank above). Accordingly, on November 21, 2005, Onshore, a wholly-owned subsidiary of the Bank, was incorporated to acquire and subsequently dispose of the non-performing assets of UOBP (see Note14). To effect the acquisition of Onshore of the non-performing assets of UOBP, the Bank and UOBL provided a loan to Onshoreamounting to P4,822,598 and P3,955,845, respectively. Moreover, UOBL guaranteed to compensate any losses incurred by Onshoreincluding the satisfaction of Bank’s loan to Onshore.
Also as part of the MOA, the Bank received financial assistance from Philippine Deposit Insurance Corporation (PDIC) amounting toP4,420,000 (see Note 16). The financial assistance which is recorded as part of Bills Payable in the 2005 statement of condition will matureon December 19, 2012 and bears annual interest rate of 3.90%. The related interest expense amounted to P6,225 in 2005 is shown aspart of Interest Expense in the 2005 consolidated statement of income. As of December 31, 2005, the proceeds of the financial assistancefrom PDIC are invested in government securities as provided for in the MOA.
23.2 BDO Private Bank
On July 14, 2003, the Bank acquired 100% of the shares of stock of Banco Santander Philippines, Inc. (BSPI) from Santander CentralHispano, S.A. (BSCH) and certain minority shareholders at P2,579,460 representing BSPI’s adjusted net book value as of July 31, 2003. Thetotal assets and total liabilities of BDO Private Bank as of July 31, 2003 amounted to P5,038,599 and P2,459,139, respectively.
Simultaneous with the acquisition, the Bank executed an Escrow Agreement with BSCH whereby 10% of the purchase price and 10% ofBSPI’s shares were held by an escrow agent to be acquired by the Bank on a date mutually agreed upon by and between the Bank andBSCH which shall not exceed a period of nine months from the first closing date.
The amount and the 10% BSPI shares were subsequently released from escrow on February 26, 2004.
The change in the name of BSPI to BDO Private Bank was approved by the SEC on February 27, 2004.
23.3 First e-Bank
In a Memorandum of Agreement (MOA) dated October 22, 2002, the Bank assumed the deposit and other liabilities of First e-BankCorporation (1st e-Bank), up to a maximum of P10,000,000 effective October 23, 2002. The breakdown of these liabilities follows:
Deposit liabilities P 9,010,000Bills payable 203,000Overnight clearing line 779,000Other liabilities 8,000
P 10,000,000
In consideration for the assumption of 1st e-Bank’s deposit and other liabilities, the Bank received from the former P10,000,000 inOctober 2002; of this amount, P2,931,054 and P2,931,400 remains in escrow as of December 31, 2005 and 2004, respectively, pendingcompliance by the Bank with certain terms and conditions as stipulated in the MOA (see Note 14).
24. RELATED PARTY TRANSACTIONS
In the ordinary course of business, the Group has loan, deposits and other transactions with its related parties and with certain DOSRI.
a. Under existing policies of the Group, these loans are made on substantially the same terms as loans granted to other individuals andbusinesses of comparable risks. The General Banking Act and BSP regulations limit the amount of the loans granted by a Group to asingle borrower to 25% of capital funds. The amount of individual loans to DOSRI, of which 70% must be secured, should not exceedthe amount of the deposit and book value of their investment in the Group. In the aggregate, loans to DOSRI generally should notexceed the total capital funds or 15% of the total loan portfolio of the Group, whichever is lower.
The following additional information are presented relative to the DOSRI loans:
Consolidated Parent2005 2004 2005 2004
Total outstanding DOSRI loans P 7,200,342 P 7,748,643 P 7,179,460 P 7,721,419Unsecured DOSRI loans P 20,846 P 39,004 P 20,256 P 38,133% to total loan portfolio 8.69% 12.13% 8.39% 12.19%% of unsecured DOSRI loans to
total DOSRI loans 0.29% 0.5% 0.28% 0.5%
In the parent company financial statements, the Bank extended a single purpose accommodation of P4,822,598 to Onshore as arequisite to completing its acquisition of the sixty-six (66) branches of UOBP and their corresponding deposit liabilities. The Banksubmitted to the BSP its Memorandum of Agreement dated May 6, 2005 with UOBP and UOBL covering said branch networkacquisition, including exemption of the aforesaid accommodation from the Bank’s DOSRI limits.
72 BANCO DE ORO
In 2005, the Group has a past due DOSRI loan amounting to P4,437 (P4,439 in 2004) which represents 0.06% of the total DOSRI loansas of December 31, 2005 both in the parent company and consolidated financial statements.
b. As of December 31, 2005 and 2004, total deposit made by the related parties to the Group amounted to P137,696,576 andP14,852,118, respectively. The related interest expense from deposits amounted to P123,717 and P3,280 in 2005 and 2004,respectively.
c. The Group leased from related parties space for its branch operations. For the years ended December 31, 2005 and 2004, total rentexpense paid to related parties amounted to P137,918 and P120,204, respectively, and is included as part of Occupancy in thestatements of income.
d. The salaries and other compensation given to the Group’s key management personnel amounted to P109,092 and P79,623 in 2005and 2004, respectively, in the parent company financial statements and P164,863 and P132,936 in 2005 and 2004, respectively, in theconsolidated financial statements.
25. EARNINGS PER SHARE
Basic earnings per share were computed as follows:
Consolidated Parent2005 2004 2005 2004
Net income attributable to equity holders of the parent P 2,586,191 P 2,021,038 P 2,470,362 P 1,514,661
Divided by the weighted average number of outstanding common shares (in thousands) 935,808 908,189 935,808 908,189
Basic earnings per share P 2.76 P 2.23 P 2.64 P 1.67
Diluted earnings per share is computed as follows:
Net income attributable to equity holders of the parent P 2,586,191 P 2,021,038 P 2,470,362 P 1,514,661Interest expense on convertible loan, net of tax 20,854 13,575 20,854 13,575
Total diluted net income 2,607,045 2,034,613 2,491,216 1,528,236
Divided by the weighted average number of outstanding common shares (in thousands):Outstanding common shares 935,808 908,189 935,808 908,189Potential common shares from assumed conversion
of convertible loans 31,407 34,010 31,407 34,010
Total weighted average common shares after conversion 967,215 942,199 967,215 942,199
Diluted earnings per share P 2.70 P 2.16 P 2.58 P 1.62
26. SELECTED FINANCIAL PERFORMANCE INDICATORS
a. The following are some measures of the Group and the Bank’s financial performance:
Consolidated Parent2005 2004 2005 2004
Return on average equity:
Net income 13.9% 12.9% 13.6% 12.9%Average total capital accounts
Return on average assets:
Net income 1.2% 1.2% 1.3% 1.3%Average total assets
Net interest margin:
Net interest income 3.8% 3.5% 3.6% 3.3%Average interest earning assets
Capital to risk assets ratio:
Total capital 18.3% 24.5% 15.4% 20.8%Risk assets
732005 ANNUAL REPORT
Consolidated Parent2005 2004 2005 2004
b. Secured Liabilities and Assets Pledged as Security
Aggregate amount of secured liabilities P 10,755,711 P 1,504,259 P 10,755,711 P 1,504,259
Aggregate amount of assets pledged as security P 12,527,906 P 5,107,256 P 12,527,906 P 5,107,256
Government securities purchased amounting to P2,932,493 in 2004 (shown as part of Financial Assets at Fair Value Through Profit or Lossaccount in the 2004 statement of condition) were pledged as security to EPCIB for the loans granted to SMIC, a stockholder. On April 20,2005, said loans with EPCIB matured and a notice of release of the government securities pledged was issued by EPCIB.
27. COMMITMENTS AND CONTINGENT LIABILITIES
27.1 Agreement with Social Security System (SSS)
The Bank signed a letter agreement dated December 30, 2003 with SSS regarding the sale of the latter’s investment in 187,847,891common shares of stock in Equitable PCI Bank, Inc. (EPCI), a local universal bank, with a par value of P10 per share constitutingapproximately 25.8% ownership in EPCI. The stated consideration consists of (a) 6 1/2 year, zero-coupon, non-amortizing note to beissued by the Bank with a face value of P12,935,842 and (b) a cash payment of P1,000,000. The market value of EPCI’s shares as ofDecember 31, 2003 amounted to P33.50 per share. The note shall be secured by any combination of the following: (a) cash, (b) PhilippineGovernment Securities, (c) mutually acceptable securities of highly-rated Philippine corporations, (d) shares at 90% valuation at market,and (e) any other mutually acceptable securities.
The Bank and SSS committed to execute a final Purchase Agreement under which the Bank will issue the note and remit the cash paymentand SSS will transfer all the rights, title and interest in and to the shares to the Bank on or before September 30, 2004. The SSS failed toexecute the Share Purchase Agreement within the prescribed period and the Bank has filed an action for specific performance with theRegional Trial Court of Mandaluyong to compel SSS to comply with its obligations under the letter agreement with the Bank dated December 30, 2003.
SSS announced that the EPCI shares would be subjected to a public auction scheduled on October 30, 2004 under the terms of a SwissChallenge whereby the Bank will be given the right to match the highest bid price. The auction has been put on hold by the SupremeCourt following a petition by certain parties.
As of December 31, 2005, the Bank has not issued a note nor remitted cash payment to SSS.
27.2 Leases
The Group leases the premises for its head office and most of its branch offices for periods ranging from 1 to 15 years from the date ofthe contracts, which terms are renewable upon the mutual agreement of the parties. Rent expense amounted to P339,273 in 2005 andP294,555 in 2004 in the parent company financial statements and P365,738 in 2005 and P318,023 in 2004 in the consolidated financialstatements (included under Occupancy account in the statements of income).
The estimated minimum future annual rentals for the next five years follow:
Consolidated Parent
2006 P 397,423 P 368,3202007 448,983 416,9602008 505,688 470,4632009 568,065 529,3172010 636,678 594,056
74 BANCO DE ORO
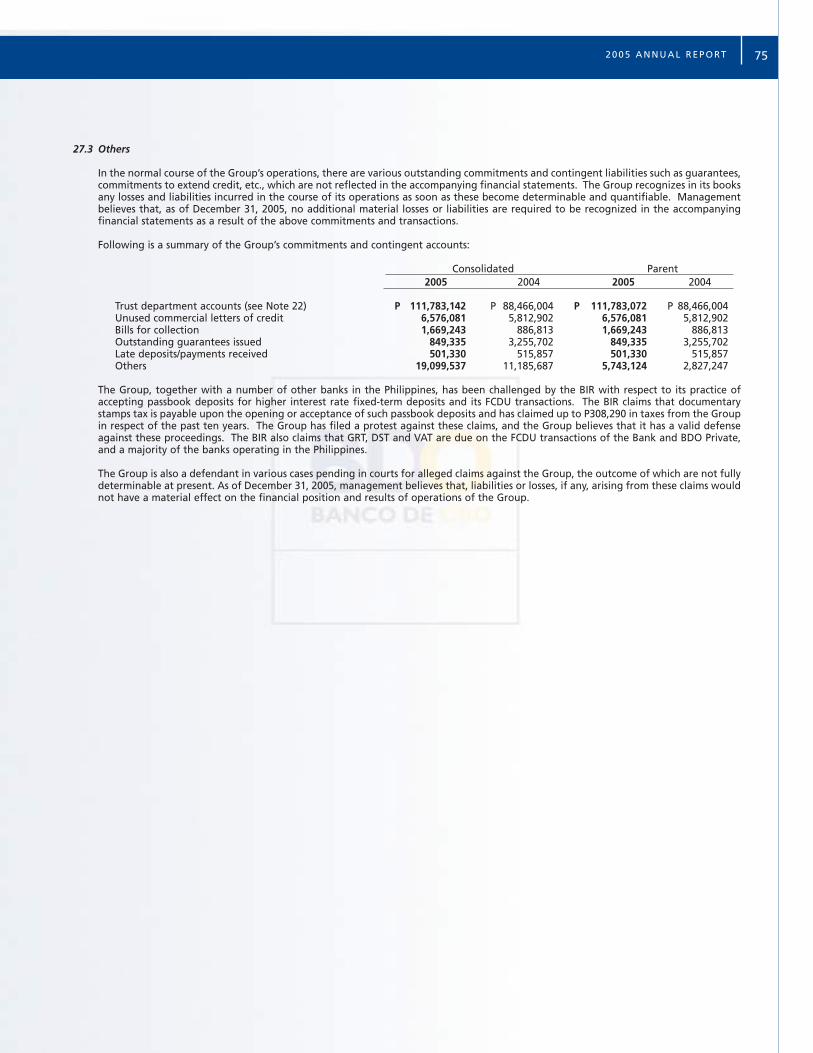
27.3 Others
In the normal course of the Group’s operations, there are various outstanding commitments and contingent liabilities such as guarantees,commitments to extend credit, etc., which are not reflected in the accompanying financial statements. The Group recognizes in its booksany losses and liabilities incurred in the course of its operations as soon as these become determinable and quantifiable. Managementbelieves that, as of December 31, 2005, no additional material losses or liabilities are required to be recognized in the accompanyingfinancial statements as a result of the above commitments and transactions.
Following is a summary of the Group’s commitments and contingent accounts:
Consolidated Parent2005 2004 2005 2004
Trust department accounts (see Note 22) P 111,783,142 P 88,466,004 P 111,783,072 P 88,466,004Unused commercial letters of credit 6,576,081 5,812,902 6,576,081 5,812,902Bills for collection 1,669,243 886,813 1,669,243 886,813Outstanding guarantees issued 849,335 3,255,702 849,335 3,255,702Late deposits/payments received 501,330 515,857 501,330 515,857Others 19,099,537 11,185,687 5,743,124 2,827,247
The Group, together with a number of other banks in the Philippines, has been challenged by the BIR with respect to its practice ofaccepting passbook deposits for higher interest rate fixed-term deposits and its FCDU transactions. The BIR claims that documentarystamps tax is payable upon the opening or acceptance of such passbook deposits and has claimed up to P308,290 in taxes from the Groupin respect of the past ten years. The Group has filed a protest against these claims, and the Group believes that it has a valid defenseagainst these proceedings. The BIR also claims that GRT, DST and VAT are due on the FCDU transactions of the Bank and BDO Private,and a majority of the banks operating in the Philippines.
The Group is also a defendant in various cases pending in courts for alleged claims against the Group, the outcome of which are not fullydeterminable at present. As of December 31, 2005, management believes that, liabilities or losses, if any, arising from these claims wouldnot have a material effect on the financial position and results of operations of the Group.
752005 ANNUAL REPORT

B A N C O D E O R O76
LIST OF OFFICERS
AFD & HRMSenior Vice PresidentPerla F. Toledo
Vice PresidentsFrancisco T. GasparYolanda M. GoAurea Imelda S. Montejo
Senior Asst. Vice PresidentsEugenio D. ChuaRosemarie M. Espinosa
Asst. Vice PresidentEmilio B. Naraval III
BRANCH BANKING GROUPExecutive Vice PresidentJaime C. Yu
Senior Vice PresidentsBeatriz L. BagsitGeronimo D. DiazRuby G. LimMaria Corazon A. Mallillin Ramon T. Militar
First Vice PresidentLorna A. Tan
Vice PresidentsLily C. HuangYolanda A. PilapilJudy C. Tan
Senior Asst. Vice PresidentsWilma N. BeriosoEugenio R. ConcepcionCezar G. DomingoCrispin G. DomingoEmmanuel Antonio R. GomezBenjamin A. Larin, Jr.Ma. Dolores A. LiwanagWilhelmino R. MendozaFelicitas C. NonatoRita Y. PoaEster A. RecioTeresita C. SiyWendeline Therese M. TumolvaMaria Dolores C. UyliapcoDandy T. Yap
Asst. Vice PresidentsJocelyn A. AngFelina M. ArellanoJimmy A. BelarminoRose R. BeltranRegina G. CaynapPacita O. ChamIris Susan F. De GuzmanPriscilla R. De VillaMa. Juanita B. Delos SantosFe R. FelixFlorencio Aquillo V. FlorendoPerlita S. Flores
Ma. Dolores P. MagsalinGaudencio F. MendozaChristina T. NakanishiEdna T. RogandoMerlita T. RubioMa. Margaret N. TanZenaida A. Triunfante
CARD PRODUCTION CENTERSenior Asst. Vice PresidentLolita A. Valdez
COMMERCIAL BANKING GROUPSenior Vice PresidentsJulie Y. ChuaErnesto T. Uy
Vice PresidentSusan C. Ong
Senior Asst. Vice PresidentsEdelwina Victoria E. MillanAgnes C. Tuason
Asst. Vice PresidentsDory C. ApacibleHelen T. ChuaJane N. CuaJohn Emmanuel M. LizaresEmily T. Oquias
COMPLIANCEVice PresidentMario D. Rabanal
COMPTROLLERSHIPSenior Vice PresidentLucy C. Dy
Vice PresidentMa. Lucila C. Cruz
Senior Asst. Vice PresidentsVictoriano F. Inocentes, Jr.Cristina G. NgoLarry G. Ong
Asst. Vice PresidentsLolita L. DamascoNormita DJ. LisingEdilberto A. MalapitanThelma DR. MazoAnita U. MusteraNelia T. ResolMa. Theresa F. RosalesAniana A. Timbre
CONSUMER LENDING GROUPExecutive Vice President Rolando C. Tanchanco
Vice PresidentsAntonio O. PeñaAnna Lissa U. Yap
Senior Asst. Vice PresidentDulce Amor E. Alimbuyuguen
Asst. Vice PresidentsAngela Juvy C. BandongGwyneth M. EntaoGrace G. Lastimosa
CORPORATE BANKINGSenior Vice PresidentEdmundo S. Soriano
First Vice PresidentRaymundo Martin M. Escalona
Vice PresidentsJose O. GarciaManuel Z. Locsin, Jr.Charles M. RodriguezReynaldo A. Tanjangco, Jr.
Asst. Vice PresidentsAnna Marie M. BenipayoJoseph Rhoderick B. LledoCarla Sherrylyn C. PapaMaria Natividad A. PobreAlbert Henry G. Rios
CREDIT & RISK MANAGEMENTExecutive Vice PresidentEvelyn L. Villanueva
First Vice PresidentLilia E. Lising
Vice PresidentsAmelia Caridad C. CasteloMaria Pia L. MacedaJesus A. Mañego, Jr.
Senior Asst. Vice PresidentsMaria Cecilia M. AvilaRodolfo M. Carlos, Jr.David M. Dela CruzMa. Martha B. Roxas
Asst. Vice PresidentsPeter Blair S. AgustinMa. Teresa E. FloresMilton Joseph C. Tiburcio, Jr.
INTERNATIONAL BANKING UNITFirst Vice PresidentLilia B. Palines
Asst. Vice PresidentsRolando S. San DiegoMarissa F. Tomas
INTERNAL AUDITSenior Vice PresidentShirley M. Sangalang
Senior Asst. Vice PresidentRonald M. Manalastas
Asst. Vice PresidentsGiovanni M. BautistaJanet S. CahiligManuel S. Lim, Jr.Raul N. Natividad
INVESTOR RELATIONS & CORPORATE PLANNINGSenior Vice PresidentLuis S. Reyes, Jr.
First Vice PresidentRosalina J. Pascual
Senior Asst. Vice PresidentAnthony R. Milan
INFORMATION TECHNOLOGY GROUPSenior Vice PresidentJudy S. Tan
First Vice PresidentsLydia C. KingArthur L. Tan
Vice PresidentBernardina T. Chiu
Asst. Vice PresidentsPonciano D. Adriano, Jr.Rolino C. Bucao, Jr.Rommel L. ParongFernando P. Rima, Jr.Isidro G. Sanvictores, Jr.
LEGAL DEPARTMENTAsst. Vice PresidentIrene C. Ishiwata
MARKETING COMMUNICATIONS GROUPVice PresidentEdith D. Dychiao
OFFICE OF THE PRESIDENTFirst Vice PresidentAngelita O. Cortez
PROPERTY MANAGEMENT DEPARTMENTSenior Asst. Vice PresidentMa. Victoria F. Dela Cruz
Asst. Vice PresidentMary C. Go
SYSTEMS & METHODSSenior Asst. Vice PresidentPeter S. Lo, Jr.
TRANSACTION BANKING GROUPSenior Vice PresidentIsmael G. Estela, Jr.
M a n a g e m e n t D i r e c t o r yA s o f D e c e m b e r 3 1 , 2 0 0 5
Chairman EmeritusHenry Sy, Sr.
BOARD OF DIRECTORS
Chairman (until August 5, 2005)Teresita T. Sy
Vice-ChairmanJesus A. Jacinto, Jr.
PresidentNestor V. Tan
MEMBERS
Ismael M. EstellaVioleta O. LuYmAntonio C. Pacis (Corporate Secretary)Senen T. Mendiola
Teodoro B. Montecillo (Independent Director)Nestor V. TanJimmy T. Tang (Independent Director)Christopher A. Bell-Knight (Independent Director)Josefina N. Tan (until August 27, 2005)
BOARD ADVISORS
Teresita T. SyJosefina N. TanJose T. Sio

2 0 0 5 A N N U A L R E P O RT 77
BDO CAPITAL & INVESTMENT CORP.PresidentRogelio R. Cabuñag
Executive Vice PresidentEduardo V. Francisco
First Vice PresidentsLynette O. De LeonLazaro Jerome C. Guevarra
Asst. Vice PresidentMichael R. Cahigas
BDO CARD CORPORATIONVice PresidentsSusan Audrey C. PunsalangMaria Nannette R. Regala
Senior Asst. Vice PresidentsSarah Jessica M. NavarroMyla R. Untalan
BDO PRIVATE BANK, INC.PresidentJosefina N. Tan
Executive Vice PresidentAndrew D. Alcid
Senior Vice PresidentJose Emmanuel U. Hilado
First Vice PresidentStella L. Cabalatungan
Vice PresidentsGamalielh Ariel O. BenavidesMartin B. OrdoñezAgnes B. SantosFederico P. Tancongco
Senior Asst. Vice PresidentsRita V. CoronelEnrico R. HernandezMa. Remedios B. LapuzJuan Sabino P. Lizares
Asst. Vice PresidentsManuel R. Bengson, Jr.Cheryll B. GaviñoPaul Alexis T. GolezMary Grace O. LojoMa. Ramona T. TorresBeatriz Y. Zalazar
BDO REALTY CORP.PresidentDanilo A. Antonio
Vice PresidentJoseph Ramil B. Lombos
Senior Asst. Vice PresidentMary Ann C. Guerra
Asst. Vice PresidentAntonio M. Cruz
BDO SECURITIES CORP.PresidentEduardo V. Francisco
Vice PresidentsJonathan T. CuaJose Noel M. Mendoza
Asst. Vice PresidentJose Rene C. Carlos
BDO FINANCIAL SERVICES, INC.PresidentVirginia A. Yap
Vice PresidentImelda I. Elido
Asst. Vice PresidentDennis Anthony B. Zamora
BDO REMITTANCE LTD.DirectorsMarilyn K. GoLucy C. Dy
Managing DirectorGeneva T. Gloria
BDO INSURANCE BROKERS, INC.PresidentJesus A. Jacinto, Jr.
Senior Vice PresidentPeter Roy R. Locsin
Senior Asst. Vice PresidentLaarni C. Santos
Asst. Vice PresidentsHelen L. GochuicoRacquel Lourdes L. MendozaAna Liza C. Tan
MEMBERSHIP OF THE BOARD COMMITTEESExecutive CommitteeJesus A. Jacinto, Jr.Nestor V. Tan
AUDIT COMMITTEETeodoro B. Montecillo - Chairman (Independent Director)Violeta O. LuYmIsmael M. EstellaAntonio C. Pacis Christopher Bell-Knight (Independent Director)
RISK MANAGEMENT COMMITTEENestor V. Tan - ChairmanTeodoro B. Montecillo (Independent Director)Antonio C. Pacis Christopher Bell-Knight (Independent Director)
CORPORATE GOVERNANCE COMMITTEETeodoro B. Montecillo - Chairman (Independent Director)Jesus A. Jacinto, Jr.Violeta O. LuYm Christopher Bell-Knight (Independent Director)
TRUST COMMITTEEJesus A. Jacinto, Jr.Nestor V. TanAdor A. Abrogena NOMINATIONS COMMITTEEVioleta O. LuYmIsmael M. Estella
COMPENSATION COMMITTEEVioleta O. LuYm Antonio C. Pacis
OTHER BOARD CREATED COMMITTEES
CREDIT COMMITTEEJesus A. Jacinto, Jr. - ChairmanNestor V. TanEvelyn L. VillanuevaTeodoro B. Montecillo - ChairmanIsmael M. Estella
MANAGEMENT COMMITTEENestor V. Tan - ChairmanBusiness Unit HeadsService Unit Heads
ANTI-MONEY LAUNDERINGCOMMITTEEJesus A. Jacinto, Jr. - ChairmanJaime C. YuEvelyn L. VillanuevaLucy C. DyShirley M. SangalangMario D. RabanalAtty. Ray Gatmaytan
First Vice PresidentsJaime M. NasolOphelia S. Salva
Vice PresidentJonathan C. Diokno
Senior Asst. Vice PresidentMa. Mercedes P. Tioseco
Asst. Vice PresidentsMa. Dina B. DesembranaEdith T. LeeTomas Victor A. MendozaLeocente G. Reyes
TREASURY GROUPExecutive Vice PresidentPedro M. Florescio III
Senior Vice PresidentMarilyn K. Go
First Vice PresidentMontiel H. Delos Santos
Vice PresidentsRuby A. ChuaLilian T. KhuLuisito S. SalazarNoel B. Sugay
Senior Asst. Vice PresidentsBernard M. FlorencioGeneva T. GloriaEduardo C. RamosJonathan L. RavelasMarylou D. SonkengpoEdna R. TarrozaAlice O. Teh
Asst. Vice PresidentsMa. Ana Elena R. ReyesMaria Teresa C. VelascoJay S. Wong
TRUST BANKINGExecutive Vice PresidentsAdor A. Abrogena
First Vice PresidentMa. Lourdes T. De Vera
Vice PresidentNoel L. Andrada
Senior Asst. Vice PresidentProceso Z. Mendoza, Jr.
Asst. Vice PresidentsArmina C. EmpeñoFlorencia Ma. Carina P. EsguerraSharon Mae S. Vicente
B D O S u b s i d i a r i e sA s o f D e c e m b e r 3 1 , 2 0 0 5
B a n kC o m m i t t e e s
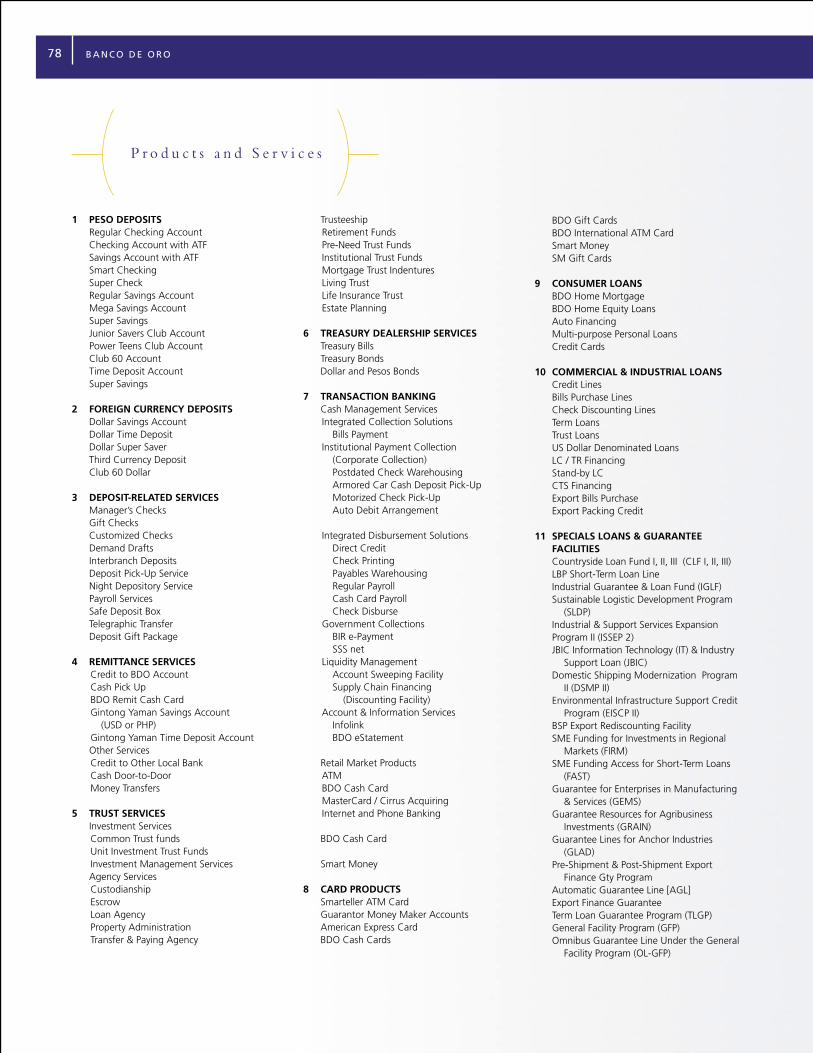
B A N C O D E O R O78
1 PESO DEPOSITS Regular Checking Account Checking Account with ATF Savings Account with ATF Smart Checking Super Check Regular Savings Account Mega Savings Account Super Savings Junior Savers Club Account Power Teens Club Account Club 60 Account Time Deposit Account Super Savings
2 FOREIGN CURRENCY DEPOSITS Dollar Savings Account Dollar Time Deposit Dollar Super Saver Third Currency Deposit Club 60 Dollar
3 DEPOSIT-RELATED SERVICES Manager’s Checks Gift Checks Customized Checks Demand Drafts Interbranch Deposits Deposit Pick-Up Service Night Depository Service Payroll Services Safe Deposit Box Telegraphic Transfer Deposit Gift Package 4 REMITTANCE SERVICES Credit to BDO Account Cash Pick Up BDO Remit Cash Card Gintong Yaman Savings Account (USD or PHP) Gintong Yaman Time Deposit Account Other Services Credit to Other Local Bank Cash Door-to-Door Money Transfers 5 TRUST SERVICES Investment Services Common Trust funds Unit Investment Trust Funds Investment Management Services Agency Services Custodianship Escrow Loan Agency Property Administration Transfer & Paying Agency
Trusteeship Retirement Funds Pre-Need Trust Funds Institutional Trust Funds Mortgage Trust Indentures Living Trust Life Insurance Trust Estate Planning
6 TREASURY DEALERSHIP SERVICES Treasury Bills Treasury Bonds Dollar and Pesos Bonds
7 TRANSACTION BANKING Cash Management Services Integrated Collection Solutions Bills Payment Institutional Payment Collection
(Corporate Collection) Postdated Check Warehousing Armored Car Cash Deposit Pick-Up Motorized Check Pick-Up Auto Debit Arrangement
Integrated Disbursement Solutions Direct Credit Check Printing Payables Warehousing Regular Payroll Cash Card Payroll Check Disburse Government Collections BIR e-Payment SSS net Liquidity Management Account Sweeping Facility Supply Chain Financing
(Discounting Facility) Account & Information Services Infolink BDO eStatement
Retail Market Products ATM BDO Cash Card MasterCard / Cirrus Acquiring Internet and Phone Banking BDO Cash Card Smart Money
8 CARD PRODUCTS Smarteller ATM Card Guarantor Money Maker Accounts American Express Card BDO Cash Cards
BDO Gift Cards BDO International ATM Card Smart Money SM Gift Cards
9 CONSUMER LOANS BDO Home Mortgage BDO Home Equity Loans Auto Financing Multi-purpose Personal Loans Credit Cards
10 COMMERCIAL & INDUSTRIAL LOANS Credit Lines Bills Purchase Lines Check Discounting Lines Term Loans Trust Loans US Dollar Denominated Loans LC / TR Financing Stand-by LC CTS Financing Export Bills Purchase Export Packing Credit
11 SPECIALS LOANS & GUARANTEE FACILITIES
Countryside Loan Fund I, II, III (CLF I, II, III) LBP Short-Term Loan Line Industrial Guarantee & Loan Fund (IGLF) Sustainable Logistic Development Program
(SLDP) Industrial & Support Services Expansion
Program II (ISSEP 2) JBIC Information Technology (IT) & Industry
Support Loan (JBIC) Domestic Shipping Modernization Program
II (DSMP II) Environmental Infrastructure Support Credit
Program (EISCP II) BSP Export Rediscounting Facility SME Funding for Investments in Regional
Markets (FIRM) SME Funding Access for Short-Term Loans
(FAST) Guarantee for Enterprises in Manufacturing
& Services (GEMS) Guarantee Resources for Agribusiness
Investments (GRAIN) Guarantee Lines for Anchor Industries
(GLAD) Pre-Shipment & Post-Shipment Export
Finance Gty Program Automatic Guarantee Line [AGL] Export Finance Guarantee Term Loan Guarantee Program (TLGP) General Facility Program (GFP) Omnibus Guarantee Line Under the General
Facility Program (OL-GFP)
P r o d u c t s a n d S e r v i c e s

2 0 0 5 A N N U A L R E P O RT 79
12 FOREIGN EXCHANGE Over-the-Counter Purchase / sale of FX Purchase / Sale of Traveller’s Checks FX Forwards and Swaps 13 BDO CAPITAL & INVESTMENT CORP. Debt Underwriting & Distribution Loan Syndication Equity Underwriting & Distribution Financial Advisory Mergers & Acquisitions Project Financing Trading & Portfolio Management
14 BDO INSURANCE BROKERS, INC. Whole / Group Life / Individual Life Insurance Mortgage Redemption Insurance Personal / Group Accident Insurance Travel Accident Insurance Industrial / Commercial All Risks Insurance Bonds / Surety (Construction Bonds, Heirs
Bond, etc.) Fire & Lighting with Allied Perils (Residential / Commercial) Engineering Insurance Motor Vehicle Insurance - Electronic
Equipment Insurance Business Interruption Insurance Marine Cargo Insurance / Marine Hull
/ Aviation Liability Insurance (Personal / Comprehensive
/ General Product) Group Health/Hospitalization / HMO Money Insurance (Fidelity Guarantee, MSPR, BBB)
15 INTERNATIONAL BANKING Import / Export Letters of Credit Domestic Letters of Credit Standby Letters of Credit Documents Against Payment Documents Against Acceptance Open Account Arrangements Export Negotiations Shipping Guarantee Trust Receipt Inward Remittance Outward Remittance
16 BDO PRIVATE BANK Wealth Management Asset Management Trust Services
17 BDO SECURITIES Equity and Fixed Income Securities Dealership & Brokering
18 MISCELLANEOUS SERVICES Collections Aboitiz AIG AMEX Asianlife General & Assurance Corp. Bankard Bayantel BDO Credit Card BDO Insurance BIR (Over-the Counter or Electronic
Payment) Bisaya Cable TV, Inc. Bonifacio Cable Bonifacio Gas CHC Dev’t Consortium Inc. Caritas Health Shield Cebu Cable TV, Inc. Central CATV Central Water System Citibank Citifinancial Davao Cableworld Network, Inc. Directory Philippines Corp. East-West Bank EDSA Mail Fort Bonifacio Devt. Corp. G-Exchange Generali Pilipinas Insurance Globe HSBC Ideal Optical Infocom Innove Mactan Cable TV, Inc. Manila North Tollways Corp. Mega Cellular Meralco Meridian Moonsat Cable TV, Inc. Pacific CATV, Inc. Pacific Internet PDIC Phil. Home Cable Holdings, Inc. Philam Pilipino Cable Pioneer Life PLDT Prudentialife
QC Sports Club SCA Hygience Prod. San Bruno San Fernando Electric Light & Power Corp. Singer Philippines SM Bills Payment Smart SSS Net Standard Chartered Sun Cable Systems Davao, Inc. Tagaytay Country Club at Tagaytay Highlands Tagaytay Highlands International Golf Club, Inc. Tagaytay Midlands Gold Club, Inc. The Highland Prime Community Condo Toyota Financial Services Tri-Sys Internet

B A N C O D E O R O80
AIRPORT ROADG/F Velasco Bldg. Airport Road corner Quirino Ave. Parañaque854-1898; 854-5285
ALABANG387 East Service Road South Super Highway Alabang, Muntinlupa850-1338; 850-1565; 850-1339; 850-6905
ALFAROG/F PDCP Bank Center LP Leviste corner Herrera Sts. Salcedo Village, Makati City815-1217; 815-1228; 815-1216
AMORSOLOG/F Queensway Bldg.No. 118 Amorsolo St., Legaspi VillageMakati City819-2984; 810-2202
ANONASManahan Bldg., Aurora Blvd.corner Anonas Ave., Quezon City421-3814; 421-3816
ANTIPOLO MASINAGTripolee Bldg., Marcos Highway near corner Sumulong Highway, Mayamot, Antipolo645-6041; 682-4654
ANTIPOLO PLAZAGatsby Bldg. II, M.L. Quezon St. Antipolo650-8233; 696-0021
ARRANQUE1359-1361 Soler St. Sta. Cruz, Manila734-2550; 733-0934; 733-3538; 733-0916
AURORA BLVD.Aurora Blvd. corner Yale St.Cubao, Quezon City912-2720; 912-2715; 438-6505
AYALA-ALABANGG/F Cond. C Unioil Center Bldg. Acacia Ave. corner Commerce Ave. Ayala Alabang, Muntinlupa772-2722; 772-2919; 772-2932; 772-2893
AYALA AVE. G/F People Support Center Amorsolo St. corner Ayala Avenue, Makati City889-7552; 889-7554
BACLARAN2987 Taft Ave. Ext., Pasay City854-5401; 832-5030
BACOLOD ARANETACineplex Complex, Araneta St. Bacolod City(034) 433-5754; 433-5610; 432-0978
BACOLOD GONZAGAGonzaga-Lopez Ent. Bldg. Gonzaga Street, Bacolod City(034) 434-4964; 433-7910
BACOLOD-LOCSINLocsin St., Bacolod City(034) 434-5216; 434-2372
BACOORFRC Mall, Gen. Evangelista St. near corner Zapote Rotonda, Bacoor, Cavite(046) 417-3446; 417-3496; 417-3314
BAGUIOLuneta Drive corner Gov. Pack RoadBaguio City(074) 442-2889; 442-8250; 442-825442-8252
BAGUIO-SESSION ROADPuso ng Baguio Bldg.Session Road, Baguio City(074) 442-4063; 443-8720; 442-5638
BALIUAGCorner Rizal and Tagle St., Baliuag, Bulacan(044) 673-0063; 766-1423
BANAWEG/F SKS Bldg. 647 Banawe St., Quezon City743-4952; 741-0114; 741-0015
BANAWE-AGNOG/F Prosperity Bldg., 395 Banawe St.Sta. Mesa Heights, Quezon City743-7570; 743-7571
BANAWE-KITANLAD2321 Banawe corner KitanladQuezon City740-3285; 732-9620
BATANGAS-P. BURGOSCM Ilagan Bldg., P. Burgos St. Batangas City(043) 723-1408; 723-3138
BEL-AIRG/F Executive Building Center Sen. Gil Puyat Avenue, Makati City895-1512; 895-1579; 895-1428 896-8245; 899-4087
BIÑANA. Bonifacio St. Bo. Canlalay, Biñan, Laguna(049) 411-4030; 411-4031
BINONDO411 Quintin Paredes St. Binondo, Manila241-3055; 247-4278
BLUMENTRITT2325 Rizal Avenue corner Antipolo St.Sta. Cruz, Manila254-1945; 251-8135; 255-6260; 256-5009
BONI AVENUE74 Maysilo Circle corner Boni Ave. Mandaluyong City531-3694; 532-5206
BONIFACIO GLOBAL CITYSpace No. 101, Market MarketBonifacio Global City, Fort BonifacioTaguig, Metro Manila886-6476; 886-6477; 886-6479; 886-6480
BUENDIA317 Sen. Gil Puyat Ave., Pasay City831-9334; 551-0243
BUTUAND & V Plaza II Bldg., J. C. Aquino Ave.Butuan City(085) 815-1303; 225-6192
C.M. RECTOC.M. Recto Ave.corner Nicanor Reyes St., Manila735-2554; 735-5686
CABANATUANMelencio corner Paco Roman Sts.Cabanatuan City(044) 463-0476; 600-2581
CAGAYAN DE ORO-COGONJ.R. Borja St., Cogon Cagayan de Oro City(088) 857-7960 to 62(08822) 725-203; 725-269; 725-249
CAGAYAN DE ORO-XAVIERLibrary Annex Bldg., Corrales Ave.Cagayan de Oro City(08822) 722-544; 729-423; 725-471(088) 857-3796; 857-4108
CAINTAHipolito Bldg. Ortigas Ave. Ext.Cainta Junction, Cainta, Rizal655-8022; 240-3145; 240-3182
CALAMBAJ.Alcasid Business Center Bldg. National Highway CrossingBarrio Real, Calamba, Laguna(049) 545-7214
CALAMBA-PARIANOld National Highway, Sta. Cecilia VillageParian, Calamba(049) 545-2171; 545-2177
CALOOCANG/F Victoria Bldg., 538 Rizal Ave. Ext.corner E.de Mazenod St., Caloocan City366-0948; 366-0949; 363-7402364-3749; 365-5184
CALOOCAN-A. MABINIA. Mabini St., Poblacion, Caloocan City285-4364; 287-4208
CARMEN PLANAS812 O'Racca Bldg., Carmen Planas St. Divisoria, Manila242-6712; 242-6704
B r a n c h D i r e c t o r y

2 0 0 5 A N N U A L R E P O RT 81
CEBU-A. S. FORTUNAG/F, Tanaka Bldg., 869 A. S. Fortuna St.Banilad, Mandaue City, Cebu(032) 343-3497 to 98
CEBU CUENCONSLC Bldg., M. J. Cuenco Ave., Cebu City(032) 256-2474; 256-2469
CEBU ELIZABETH MALLGF Elizabeth Mall, Leon Kilatcorner South Expressway, Cebu City(032) 255-9769; 255-9971417-7900; 255-9970
CEBU ESCARIOBF Bldg., Escario St., Cebu City(032) 254-0482; 254-0408
CEBU-FUENTEJ. Rodriguez St., Fuente Osmena RotondaCebu City(032)253-5686; 253-8920
CEBU GULLASMagallanes corner Gullas Sts., Cebu City(032) 254-6723; 254-5601; 254-6721
CEBU LEGASPILegaspi corner Zamora St., Cebu City(032) 256-2709; 256-2507
CEBU MAGALLANESPlaridel St. corner Magallanes St. Cebu City(032) 255-6792; 256-1200; 253-0486
CEBU MANDAUEDayzon Bldg., PSO 246 (490) Lopez Jaena St., Mandaue City(032) 343-6531; 343-6535
CEBU OSMENAOsmena Blvd. corner Urgello St., Cebu City(032) 253-5277; 253-8052254-5041; 253-3250
CEBU TABUNOKPBS Bldg., 2688 National Highway Tabunok Talisay, Cebu City(032) 273-6643; 273-6644; 273-7732
COMMONWEALTHG/F Teresita Bldg., Holy Spirit Dr.Don Antonio Heights, Quezon City932-4717; 932-8764
CONGRESSIONAL AVENUEThe Excelland System ICongressional Ave., Quezon City920-5613; 454-9560
CUBAO SMShoemart Arcade, Cubao, Quezon City911-0558; 911-3538; 912-6687 911-8410; 912-5632; 912-6687
DAGUPAN386 Perez Blvd., Dagupan City(075) 523-4002; 522-2055 DASMARINAS-CAVITEE.L. Toledo Bldg., Sampaloc IDasmarinas, Cavite(046) 416-0954; 416-0955
DAVAO JP LAURELLandco-PDCP Corporate CenterJP Laurel Ave., Bajada, Davao City(082) 221-4553; 221-4556
DAVAO MAGSAYSAYR. Magsaysay Ave. Davao City(082) 221-6964
DAVAO-MONTEVERDEGF Sequoia Inn, Monteverde Ave., Davao City(082) 225-4345; 225-4346; 225-4348
DEL MONTE AVE.420 Del Monte Ave., Quezon City749-1711; 749-1678; 749-1651
DIVISORIA744-746 Ylaya St., Tondo, Manila241-8607; 241-4158; 241-8617
DR. A. SANTOS AVE.LT Bldg., Dr. A. Santos Ave., Parañaque825-1381; 820-6792; 820-1855; 820-6439
E. RODRIGUEZ1162 E. Rodriguez Sr. Blvd., Quezon City724-4203; 724-3977; 722-1009; 725-2408
ECHAGUEG/F Manila Royal Bldg. C. Palancacorner Hidalgo St., Quiapo, Manila733-7436; 733-7437; 733-7434
EDSA CUBAO596 Simeon Medalla Bldg. cornerGen. McArthur Ave., EDSA, Quezon City911-1235; 912-1750
EDSA-TAFTEDSA corner Zamora St., Pasay City833-1505; 833-0996
EDSA-MONUMENTONear General Tinio St. corner EDSACaloocan City364-1208; 367-5745
ELCANOSHC Tower, 619 Elcano St.San Nicolas, Manila247-1958; 247-1960
EMERALD AVE.G/F Unit 101 Taipan Place Emerald Ave., Ortigas Center, Pasig914-3544; 637-7329
ESPAÑACarmen Bldg. España corner G. Tolentino St., Sampaloc, Manila735-6698; 735-6573
ESPAÑA-INSTRUCCIONEspaña corner Instruccion St. Sampaloc, Manila741-7869
FAIRVIEWDon Mariano Marcos Ave.Fairview, Quezon City427-8289; 938-2503; 938-2712; 937-8436
GANDARA811-813 Gandara St., Sta. Cruz, Manila733-1342 734-3255; 734-4574 733-3705; 733-8079
GEN. LUIS297 Gen. Luis St., Bo. Kaybiga, Caloocan937-3355
GEN. SANTOSSantiago Blvd. corner JP Laurel St.Gen. Santos City(083) 553-3874; 553-3875
GIL J. PUYATUnion Ajinomoto Bldg.Sen. Gil Puyat Ave. Makati Ave.890-6546; 895-0471
GRACE PARKG/F A&R Bldg., 213 Rizal Ave. Ext.Grace Park, Caloocan City365-5805; 364-6125; 365-5166
GREENHILLSGreenhills Shopping Complex Ortigas Ave., San Juan721-4211; 721-2750; 721-2761
GREENHILLS-WEST101 Limketkai Bldg., Ortigas Ave.San Juan, Metro Manila721-4414; 726-3660
HARRISON PLAZAUnit R-5 URDI Bldg. Harrison Plaza Shopping Complex F.B. Harrison, Malate, Manila524-4308; 525-2954; 524-6533
HEAD OFFICE12 ADB Ave., Ortigas CenterMandaluyong City702-6000 loc. 5276; 5277; 5278702-6276; 702-6277; 702-6278
HERRERAG/F YL Bldg., V.A. Rufino corner Sotto St., Legaspi Village, Makati City812-3074; 810-0303; 812-7054
ILAYA1049-1051 Ilaya St., Divisoria, Manila245-5508; 245-5510; 242-1686
ILIGANQuezon Ave., Iligan CityTel. Nos. (063) 221-2781; 221-5108
ILOILO- JM BASAJ.M. Basa St., Iloilo City(033) 335-0967; 337-8382
ILOILO-LEDESMAG/F Esther Bldg., Ledesma St., Iloilo City(033) 337-8244; 335-0866
IMUSGen. Aguinaldo corner Ambrosia Road Anabu I, Imus, Cavite(046) 515-9950; 515-9951; 529-8612
IMUS-NUENO AVE.358 Exodus Bldg., Nueno Ave., Imus, Cavite(046) 970-8733; 471-4065
IZNARTJohn A. Tan Bldg., Iznart St., Iloilo City(033) 337-5584; 337-5585

B A N C O D E O R O82
JOSE ABAD SANTOSG/F Ching Leong TempleJ. Abad Santos Avenue, Tondo, Manila252-2140; 252-2141
JARO-ILOILONB Bldg., Lopez Jaena St., Jaro, Iloilo(033) 329-2132; 329-6971
JAS-ANTIPOLOG/F Intercast Corp. TowerJ.A.Santos Ave., Tondo, Manila253-6544; 253-6566; 256-6606
JAS - RECTO1174 J. Abad Santos Ave., Tondo, Manila251-7584; 256-6572
J.P. RIZAL872 J.P. Rizal St., Barangay PoblacionMakati City899-8690; 899-8673
JULIA VARGASIBP Bldg., Julia Vargas Ave.Ortigas, Pasig City638-7770; 914-8762
KALENTONGMRDC Bldg., Shaw Blvd.corner Gen. Kalentong St., Mandaluyong City531-6984; 531-9146; 532-8953
KALOOKAN-10TH AVE.371 Rizal Ave. Ext., Caloocan City361-1074; 361-1272; 361-1249
KAMAGONG2567 P. Ocampo (Vito Cruz Ext.)corner Madre Perla St., Manila563-0504; 563-2736; 563-1895; 564-2870
KATIPUNANG/F Olalia Bldg.No. 327 Katipunan Ave. corner F. dela Rosa St., Loyola HeightsQuezon City928-2713; 928-2715
LA UNIONRizal Ave. corner Ortega St. San Fernando, La Union(072) 888-3316
LAOAGRizal St. corner Abadilla St.Laoag City(077) 771-4032
LAVEZARES321-325 Garden City Condominiumcorner Lavezares & Camba Sts. San Nicolas, Manila242-4244; 242-4249;242-4250; 242-4251
LEGASPI CITYRizal corner Gov. Imperial Sts., Legaspi City(052) 481-4481; 481-4482
LEGASPI VILLAGEGolden Rock Bldg., 168 Salcedo St. Legaspi Village, Makati City816-1467; 816-1478; 816-1489
LIBISMagnitude Commercial Arcade E. Rodriguez Jr. Ave., BagumbayanQuezon City421-6914; 421-6915
LIPACasa Esperanza Bldg. Pres. J.P. Laurel HighwayBrgy. Mataas na Lupa, Lipa City(043) 757-3981 to 84
LUCENAMerchan St. corner San Fernando St.Lucena City(042) 660-3760; 373-4927
MABINIA. Mabini corner Soldado Sts. Ermita, Manila524-6001; 450-1693
MAGALLANES VILLAGEUnit 104, The Gateway Centre Paseo de Magallanes Vill., Makati City852-9640; 852-9643; 853-4620
MAKATI AVE.Unit 191 Shangri-la Hotel ManilaAyala Center, Makati City813-5004 to 07; 813-4788; 817-0295
MAKATI SMSM Annex Bldg., Ayala CenterMakati City893-3241; 813-3975; 812-6838; 817-0856
MAKRO-CUBAOEDSA corner Main Street, CubaoQuezon City912-6173; 421-1689
MALABON685 J.P. Rizal St., Malabon281-9254; 281-9252; 281-5603
MALOLOS570 Paseo del Congreso St. Liang, Malolos, Bulacan(044) 791-3125; 662-3363; 791-3123(02) 732-6839
MANGGAHANAmang Rodriguez Ave.Manggahan, Pasig City646-3177; 681-1842
MARCOS HIGHWAYTown & Country Commercial ArcadeMarcos Highway corner Narra St. Cainta, Rizal668-1197; 668-1199; 668-123668-1983; 668-1976
MARCOS HIGHWAY-STA. LUCIASta. Lucia East Grand Mall, Marcos Highway corner Felix Avenue, Cainta, Rizal681-7328; 681-5287
MARIKINA17 Bayan-Bayanan Ave. Concepcion, Marikina933-6395; 941-1888; 941-5851
MARIKINA-STA. ELENA314 J.P. Rizal St., Sta. Elena, Marikina City646-1793; 681-1672
MASANGKAYLun Hong Townmates Association Bldg.1226 Masangkay St., Sta. Cruz, Manila255-2002; 255-2065; 255-2080
MAYONG/F Alpha Bldg., 174 Mayon St. La Loma, Quezon City414-3606; 414-3607; 740-9164 742-7679; 742-7675
METROPOLITAN AVE.G/F, Metropolitan Terraces CondominiumMetropolitan Ave. corner Sacred Heart St., Makati City899-6618; 899-6693; 899-6631; 890-5437
MEYCAUAYANLiberty Bldg., MacArthur Highway Calvario Meycauayan, Bulacan(044) 721-0820; 443-7323
MOLO-ILOILOEscoto-Natividad Bldg. M.H. del Pilar St. corner Lopez Jaena St., Molo, Iloilo(033) 336-8950; 336-8951
MONUMENTOMacArthur Highwaycorner Calle Uno, Caloocan City362-0295; 330-5683; 365-5470
NAGABrgy. San FranciscoPeñafrancia Ave., Naga City(054) 472-6602; 811-8861
NAIANinoy Aquino, International AirportArrival Lobby, Pasay City879-5195; 877-3568
NOVALICHES-BAYAN233 Karen Bldg., General Luis St.Novaliches, Quezon City938-2432; 938-8082
NAVOTASSeafront Commercial Center North Bay Blvd., Navotas282-7369; 282-7368; 283-8352
NOVALICHES1016 Quirino Hi-way Town ProperBgy. Monica, Novaliches, Quezon City939-8468; 939-8590; 938-0225
ONGPINUnit ABC Imperial Sky Garden Ongpin St. corner T. Pinpin St., Binondo, Manila244-3738; 243-5516
ONGPIN-TOMAS MAPUA1004-1006 Ongpin St.Sta. Cruz, Manila734-2944; 734-2524
ORTIGAS AVE.209 Ortigas Ave., Greenhills, San Juan724-7114; 724-7091; 724-9156

2 0 0 5 A N N U A L R E P O RT 83
PACO1050 Pedro Gil St., Paco, Manila536-6448; 536-6449
PADRE RADAGosiupo Bldg., 480-482 Padre Radacorner Elcano Sts. Tondo, Manila245-0176; 245-0249
PAMPLONAZapote Alabang Rd.Pamplona, Las Piñas872-2563; 872-0824
PASAY ROADUnit 102, 845 One Corporate Plaza Condominium Antonio S. Arnaiz Ave. (formerly Pasay Road) Makati City894-1732; 817-6113; 810-9382; 818-1783
PASAYLibertad corner Colayco St.Pasay City831-0593; 551-2513;551-6876; 551-6877
PASEO DE ROXASG/F Philcom Bldg.Paseo de Roxas, Makati City843-4421; 843-5464; 815-2204
PASEO DE ROXAS 28737 Paseo de Roxas St. ,Makati City818-3587; 892-7333; 892- 5703; 840-3633840-3366; 892-9796 818-3527
PASIGMariposa Arcade A. Mabini corner Dr. Pilapil St., Pasig641-0557; 640-1633; 640-1643
PASIG-KAPITOLYOA.B. Sandoval Bldg.corner Oranbo Drive, Pasig City638-2129; 638-2132
PATEROSEast Mansion Homes, Phase I, Elisco RoadSto. Rosario East, Pateros, Metro Manila641-4729; 641-3542
POTRERO110 MacArthur Highwaycorner Riverside St., Potrero, Malabon447-4554; 447-4555; 367-9806
QUEZON AVE.-ROCESDNE Bldg., 1050 Quezon Ave.near corner Roces Ave., Quezon City374-6836; 374-6834
QUEZON AVE.103 Aries Bldg., Quezon Ave.Quezon City712-3411; 731-2354; 410-2884
QUINTIN PAREDES524 Enterprise Bldg., Quintin Paredes St.corner Carvajal St., Binondo, Manila243-9689; 243-9687; 243-4041 to 44245-5948
QUIRINO PACOCRS Tower, Pres. Quirino Ave.corner Perdigon St., Paco, Manila561-7305; 562-2153
RIZAL AVENUE2502-2504 Rizal Ave. corner Cavite St.Sta. Cruz, Manila781-9976; 732-7483; 732-7451; 732-9848
ROCKWELLG/F Power Plant Mall, Rockwell CenterAmapola cor. Estrella S., Makati City899-1488; 899-1250
ROOSEVELT-MANGA325 Roosevelt Ave. corner Manga St.Quezon City373-9691; 414-3092
SALCEDO3 Salcedo Place, Tordesillas St. Salcedo Village, Makati City751-6087; 887-7734
SAMSON ROADG/F Ma.Cristina Bldg. Samson Road corner UE Tech., Caloocan City362-8140; 361-0602; 361-2538
SAN ANDRESSan Andres corner Linao Sts., Malate, Manila525-6658; 525-6633
SAN JOSE-NUEVA ECIJAMokara Bldg., Maharlika Highway, Abar 1stSan Jose City, Nueva Ecija(044) 947-0457; 947-0458
SAN JUAN88 N. Domingo Street, San Juan725-5019; 724-8036
SAN FERNANDO-PAMPANGAGen. Hizon ExtensionSan FernandoPampanga(045) 860-6379; 961-5196
SAN PABLOMary Grace Bldg., Colago Ave.corner M.L. Quezon St., San Pablo City(049) 562-1026; 562-1027; 800-0322
SAN PEDROTayao Bus.Ctr. Bldg., A. Mabini St. San Pedro, Laguna868-0352; 868-0353; 847-3699; 847-2688
SAN PEDRO-NATIONAL HIGHWAYTayao Business Center Bldg, A. Mabini St.San Pedro, Laguna868-0353; 868-0352
SHAW BLVD.555 Shaw Blvd., Mandaluyong City722-7572; 722-6677; 722-7584
SHAW BLVD.-YULO285 A. Shaw Blvd. corner L. Cruz St.Mandaluyong City533-6518; 533-5424
SM CITY BACOORUGF SM Bacoor, Gen. Aguinaldo Hi-way corner Tirona Hi-way, Bacoor, Cavite(046) 970-5700; 970-5701; 417-7719(02) 886-4668
SM CITY BAGUIOUGF SM City BaguioUpper Session Road, Baguio City(074) 619-7625 to 28; 619-7623
SM CITY BATANGASGF SM City BatangasBrgy. Paloocan West, Batangas City(043) 722-2556, 722-2557
SM CITY BICUTANLGF SM City Bicutan Doña Soledad Ave.corner West Service Road, Parañaque City777-9262; 777-9263; 777-9264
SM CITY CAGAYAN DE OROG/F SM City Cagayan de Oro Pueblo de Oro Business ParkUpper Canituan, Cagayan de OroMisamis Oriental(088) 859-2633; 859-2632
SM CITY CEBUSM City Cebu North Reclamation Area, Cebu City(032) 232-0774; 231-2082; 231-4053
SM CITY DASMARIÑASSM City Dasmariñas, Barrio Pala-PalaDasmariñas, Cavite(046) 432-3020; 432-3080; 432-3040
SM CITY DAVAOUGF SM City Davao, Brgy. Matina Davao City(082) 297-4371; 299-2618297-4341; 299-2921
SM CITY ISM City Annex Bldg., EDSA cornerNorth Ave., Quezon City928-4329; 928-3243; 929-2173
SM CITY IIEDSA corner North Ave., Quezon City426-3909; 456-6580; 925-5604
SM CITY ILOILOUGF SM City Iloilo, Benigno Aquino Ave.Mandurriao, Iloilo(033) 320-9465; 320-9470320-9490; 320-9433
SM CITY LUCENAG/F SM City Lucena Pagbilao National Road, Lucena City(042) 710-6108; 710-6723; 710-7296(02) 889-6790
SM CITY MANILALGF SM City Manila Concepcion corner Arroceros and San Marcelino Sts., Manila524-7788; 524-7787; 524-7978; 524-7801
SM CITY MARILAOGF SM City Marilao, McArthur HighwayMarilao, Bulacan(044) 238-8001; 933-2002 to 04; 299-6835

B A N C O D E O R O84
SM CITY PAMPANGAGF SM City Pampanga San Fernando, Mexico, Pampanga(045) 921-2236; 961-2304961-2327; 875-1877
SM CORPORATE OFFICESBldg. 104 Bay Boulevard SM Central Business Park, Bay City, Pasay833-6710; 833-7378; 833-8702
SM DELGADOG/F SM Delgado, Valeria corner Delgado Sts. Iloilo City(033) 337-8973; 337-0854337-4931; 337-4925
SM CITY FAIRVIEWQuirino Highway corner Regalado St.Fairview, Quezon City935-0042; 939-5015; 937-8925
SM CITY SAN LAZAROFelix Huertas corner A.H. Lacson St.Sta. Cruz, Manila741-5603; 731-5682
SM CITY STA. ROSAG/F SM City Sta. Rosa, Barrio TagapoSta. Rosa, Laguna(049) 534-9824; 534-9823
SM CITY SUCAT AG/F SM Supercenter Sucat, Parañaque City825-6224; 825-6862
SM CITY SUCAT BG/F Annex Bldg. B, SM City SucatDr. A. Santos Ave., Parañaque City820-6737; 825-3739
SM CITY VALENZUELAG/F SM City Valenzuela, McArthur HighwayValenzuela City292-4354; 292-9704
SM MEGAMALL AG/F SM Megamall Bldg. A Ortigas Center, Mandaluyong City633-1785; 633-1786; 635-2358; 631-9813
SM MEGAMALL BUpper & Lower Grd. Flrs.SM Megamall Bldg. B, Julia Vargascorner EDSA, Ortigas Center, Mandaluyong City632-7425; 631-2956; 631-9843 631-9806; 633-4969
STA. MESA SMSM Centerpoint Annex Bldg. Aurora Blvd., Quezon City715-0537; 715-0547; 715-0559 716-0343; 716-0344; 716-0619
SM SUPERCENTER MOLINOG/F SM Supercenter Molino, Molino RoadBacoor, Cavite(046) 474-3041; 474-3042
SOLERG/F Gracetown Bldg. 1120 Soler St., Binondo, Manila243-7819; 243-6915
SOUTHMALL IUGF SM Southmall, Alabang-Zapote RoadLas Piñas City800-0471; 806-4383; 806-4389; 800-1648
SOUTHMALL 2UGF SM Southmall, Alabang-Zapote RoadLas Piñas City800-6798; 800-9122; 800-0590
STO. CRISTOKim Siu Ching Foundation Bldg. Sto. Cristo St., Binondo, Manila242-4247; 242-2589; 242-2687; 242-0498
STO. CRISTO-COMMERCIO686 Sto. Cristo St., Binondo, Manila242-5380; 242-5383
STO. DOMINGO6 Sto. Domingo Ave., Quezon City732-2934; 732-6219; 742-6448; 732-2917
SUCAT8260 Dr. A. Santos Ave., Parañaque829-1630; 825-6861; 825-5374
SUMULONG HIGHWAY39 Sumulong Highway Brgy. Sto. Nino, Markina City948-4200; 941-3044; 948-4500
TABORA859-861 L&J Bldg., Tabora St.Divisoria, Manila243-2148; 243-0419; 241-9441
TACLOBANChan Bldg. P. Zamora St.Tacloban City(053) 321-2881; 325-9967
TAFT AVE.- J. NAKPIL1747 Taft Ave. corner J. Nakpil St., Manila521-1226; 522-0902
TALON, LAS PIÑASG/F Motiontrade Bldg., Alabang-Zapote RoadTalon, Las Piñas City800-9559; 805-1922
TANDANG SORAG/F FB Bldg., 13 Tandang Sora Ave.Quezon City938-7786; 456-3724
TARLAC27F Tanedo St., Tarlac City(045) 982-3826; 982-0056
TAYUMANG/F Delton Bldg., 1808 Rizal Ave.Sta. Cruz, Manila732-9052; 749-5078; 732-9866
TIMOG26 Cedar Executive Bldg., Timog Ave.corner Sct. Tobias St., Quezon City372-6648; 414-8347
TIMOG-ROTONDAStore 102 Imperial Palace SuitesTomas Morato corner Timog Ave.Quezon City928-3168; 920-7875
TOMAS MORATO17 Atherton Place, Tomas Morato Ave.corner Roces Ave., Quezon City371-8601; 410-3751; 410-3752
TUTUBANDS 17-18 Tutuban Prime BlockTutuban Center, CM Recto, Manila254-0768; 251-1601; 254-3404 251-1676; 251-1602
UN AVENUEPuso ng Maynila Bldg., UN Ave.corner A. Mabini St., Ermita, Manila524-1734; 524-1783; 524-0306
URDANETA182 LIS Bldg., McArthur HighwaySan Vicente, Urdaneta(075) 568-4225
VALENZUELAKm.15 MacArthur HighwayDalandanan, Valenzuela292-1959; 292-3974
VALEROG/F Pearl Center, 146 Valero St.Salcedo Village, Makati City817-9675; 817-9586; 817-9678
VIGANQuezon Ave., Vigan, Ilocos Sur(077) 722-2057
VISAYAS AVE.M & L Bldg. Visayas Ave. corner Road 1, Brgy. Vasra, Quezon City927-6151; 453-6173426-7701; 926-9302
V-MALLG/F New V-Mall, Greenhills Shopping Center San Juan, Metro Manila725-9085; 726-6752
WEST AVE.-EAST MAYA160 West Ave. corner East Maya DriveQuezon City410-7611; 411-5426
WEST AVE.68 Carbal Bldg., West Ave., Quezon City371-4689; 412-1063; 371-8786
WEST AVE.-BALER118 Jafer Bldg., West Ave., Quezon City928-7286; 928-3626
ZAMBOANGAGov. Lim Ave. corner Saavedra St. Zamboanga(062) 991-1542; 992-0341
ZURBARANRizal Ave. cor. Fugoso St., Sta. Cruz, Manila734-1544; 734-1563
This 2005 Annual Report is published byBanco de Oro Universal BankConcept and design byOP Communications, Inc.