banfora (wahgnion) project...
TRANSCRIPT

PDACMarch 6, 2018TSX:TGZ / OTCQX:TGCDF
Paul Chawrun, Chief Operating OfficerStephen Ling, Manager, Mine Technical Services
Banfora (Wahgnion) ProjectFeasibility Study Optimization and De-risking

Forward-Looking Statements
2
This presentation contains certain statements that constitute forward-looking information within the meaning of applicable securities laws (“forward-looking statements”), whichreflects management’s expectations regarding Teranga Gold Corporation’s (“Teranga” or the “Company”) future growth, results of operations (including, without limitation, futureproduction and capital expenditures), performance (both operational and financial) and business prospects (including the timing and development of new deposits and thesuccess of exploration activities) and opportunities. Wherever possible, words such as “plans”, “expects”, “does not expect”, “budget”, “scheduled”, “trends”, “indications”,“potential”, “estimates”, “predicts”, “forecasts”, “focused on”, “anticipate” or “does not anticipate”, “believe”, “intend”, “ability to”, “intended to”, “objective to” and similar expressionsor statements that certain actions, events or results “may”, “could”, “would”, “might”, “will”, or are “likely” to be taken, occur or be achieved, have been used to identify such forwardlooking information. Specific forward-looking statements in this presentation include the commencement of expected drill programs, net present value, anticipated future cashflows, anticipated construction readiness activities for the Company’s Wahgnion gold project in Burkina Faso as well as the anticipated completion of construction of the Wahgnionproject - including the first gold pour, the anticipated discovery of reserves at the Wahgnion project, and Teranga’s estimated full year financial and operating totals, as well asanticipated 2017 and 2018 operating results. Although the forward-looking information contained in this presentation reflect management’s current beliefs based upon informationcurrently available to management and based upon what management believes to be reasonable assumptions, Teranga cannot be certain that actual results will be consistent withsuch forward looking information. Such forward-looking statements are based upon assumptions, opinions and analysis made by management in light of its experience, currentconditions and its expectations of future developments that management believe to be reasonable and relevant but that may prove to be incorrect. These assumptions include,among other things, the ability to obtain any requisite governmental approvals, the accuracy of mineral reserve and mineral resource estimates, gold price, exchange rates, fueland energy costs, future economic conditions, anticipated future estimates of free cash flow, and courses of action. Teranga cautions you not to place undue reliance upon anysuch forward-looking statements.
The risks and uncertainties that may affect forward-looking statements include, among others: the inherent risks involved in exploration and development of mineral properties,including government approvals and permitting, changes in economic conditions, changes in the worldwide price of gold and other key inputs, changes in mine plans and otherfactors, such as project execution delays, many of which are beyond the control of Teranga, as well as other risks and uncertainties which are more fully described in Teranga’sAnnual Information Form dated March 29, 2017, and in other filings of Teranga with securities and regulatory authorities which are available at www.sedar.com. Teranga does notundertake any obligation to update forward-looking statements should assumptions related to these plans, estimates, projections, beliefs and opinions change. Nothing in thisreport should be construed as either an offer to sell or a solicitation to buy or sell Teranga securities.
This presentation is as of March 6, 2018 All references to Teranga include its subsidiaries unless the context requires otherwise. This presentation contains references to Terangausing the words “we”, “us”, “our” and similar words and the reader is referred to using the words “you”, “your” and similar words. All dollar amounts stated are denominated in U.S.dollars unless specified otherwise.

Agenda
3
Teranga Introduction
Wahgnion Overview
Mineral Resources
Mining Optimization
Process Plant
Infrastructure
Appendix

Teranga Gold CorporationIntroduction

Senegal
Côte d’Ivoire
Burkina Faso
Mali
Guinea
Guinea-Bisseau
The Gambia
GhanaBenin
Niger
Sierra Leone
Liberia
Togo
Sabodala Gold Mine1.4Moz production since IPO in late 2010
5
Wahgnion Development Project Expect to close financing and commence construction in Q2 2018
Golden Hill Exploration JV
GourmaExploration JV
Guitry
Dianra
Mahepleu
Tiassale
Sangaredougou
Building The Next Multi-Asset Mid-Tier West African Gold Producer
Teranga has nearly 4.0 million ounces of
gold reserves from its Sabodala Gold Mine
and its WahgnionDevelopment Project(1)(2)
Afema
Refer to Appendix – Endnotes (1) and (2)

Wahgnion Project
Strategically Achieving Our Vision
Sabodala
Organic GrowthLong-life potential, minimum 1Moz
reserves AISC of ≤ $900/oz
Vision To Be the Next
Multi-Asset Mid-Tier West African Gold Producer
Annual Production*300Koz – 350Koz
Growth Strategy Underpinned by Prudent & Disciplined Allocation of Capital
Maximize shareholder value by focusing on increasing long-term sustainable cash flows through diversification and growth
To achieve growth objectives we are focused on:
(i) optimizing our existing assets
(ii) building new mines
(iii) carrying out targeted exploration in West Africa
(iv) continued cost and productivity improvements
(v) maintaining balance sheet strength
6*Refer to Appendix – Endnote

Garnering International Recognition for Corporate Social Responsibility
PDAC 2017 Environmental & Social Responsibility Award
United Nations Global CompactNetwork Canada Sustainability Award
Corporate Knights Future 40 Responsible Corporate Leaders in Canada
Capital Finance International: Best ESG-Responsible Mining Management West Africa Award
7

Wahgnion Project OverviewBurkina Faso
8

9
Mali
Ghana
Benin
Niger
Togo
Burkina Faso
Côte d’Ivoire
Tongon
Bobo-Dioulasso
Strategic Pillar of Teranga’s Growth Plan: Wahgnion
Ideally Situated on a Prolific Gold Belt• Permitted mining license that covers 89 km2
• Exploration licenses covering +1,000 km2
Initial Feasibility Study • Includes only 4 deposits: Nogbele, Stinger, Samavogo and Fourkoura
• Proven and probable reserves of 1.2Moz
• Measured and indicated resources of 1.8Moz
• Inferred resources of 0.7Moz
Senegal
Samavogo
Stinger
Wahgnion Project
Nogbele
Fourkoura
Wahgnion
Proposed Plant Site
Life of Mine Summary 5.5 years LOM (9 years)
Annual production(1) 131koz 119koz
All-in sustaining costs* $807/oz $843/oz
Total free cash flow* $302M $409M
Pre-production capital ($232M)
Net cash flow $176M
*Refer to Appendix – Non-IFRS Performance MeasuresRefer to Appendix – Endnote (1)

Significant Advantages to Modeling the Sabodala Mine
10
TailingsStorage Facility
Camp
Water Harvesting
Dam
Nogbele Pits
Stinger Pits
SamavogoPits
FourkouraPits
Process Plant
Matches Teranga’s Strength & Experience• Similarities between Sabodala design and
proposed design at Wahgnion will help to ensure a smooth build and operation
• Conventional open pit mining techniques• Same type of ore recovery as Sabodala• Multi-pit, central mill type of operation – Teranga
uses this operating flexibility to its advantage at Sabodala
Deposits Located Close to Proposed Plant Site• Largest deposit, Nogbele is adjacent to proposed
plant site – other deposits within close proximity– Fourkoura 6 km– Stinger 15 km– Samavogo 25 km
• Trucks selection to potentially haul ore directly from pit face to plant ROM

De-Risking and Optimizing the Project Since July 2016
11
Trade-Off Studies & Optimization• Plant production rates & mill sizing• Tailings design options• Power source options• Mine equipment selection• Construction housing
Feasibility Study (Technical Report)• Full reconstruct of resource models, reserves
estimate & detailed LOM plan• Process design criteria & flowsheet, capital &
operating cost estimates• Revised water balance & tailings design• Revised closure plan, site investigation• Construction schedule
Drilling Campaign • Four initial deposits• Infill and confirmation drilling with
more than 1,000 holes drilled
Early Works• Site infrastructure• Vendor selection• EPCM/construction plan• Detailed Engineering• Execution Plan
Community Relations• Resettlement action plan• Livelihood restoration
July2016
Jan 2018
Metallurgical Test Work & Flowsheet Optimization

Mineral Resources

13
Wahgnion Project: Mineral Resource Estimate
Updated Mineral Resource Estimate Completed by RPA• The previous resource models used broad grade shell boundaries, MIK probabilistic estimation directions, did not follow the variable
geological trends and included all dilution• Current resource models:
‒ 20,000m RC and DD drilled June – Dec 2016 to infill and confirm geological trends‒ 440 updated discreet individual mineralization wireframes generated, used as hard boundaries‒ OK and ID3 grade estimation methods used (previously OK and MIK)‒ Smaller block sizes to correspond to narrow mineralized zones and allow more discrete mining selectivity
Modeling Approach Maintains Integrity• 7 months required to complete remodeling, estimation and mineral resource models• Modeling approach maintains the integrity of the geological and structural trends for better reliability and confidence for the mine plan• Wireframe delineation effort provides for inferred resource conversion opportunity
Infill Drilling of Inferred Resources• 73,000 metre infill drilling program completed Dec-17 designed to upgrade Inferred Resources located adjacent and near to the
current reserve pits – updated resources and reserves by mid-2018

Comparison: Nogbele Central Historical vs. 2017 Modelling
14

Upside Expected with Targeted Infill Drill Program
15
Extensive 2017 Infill Drill Program• Infill drill program is targeting inferred resources
located near to the current reserve pits • Objective is to increase drill hole density within the
existing inferred resources • A total of 73,000 meter (1,664 DD and RC holes) drill
program has been completed
Aiming for a Conversion Rate of 25%-50% of Inferred• Given demonstrated continuity of mineralization of the
inferred resources, 25%-50% of inferred resources is targeted to be converted to indicated
Near-Term Upside Expected to Improve Economics• Reserves update expected mid year 2018
Target Area Along Strike
Target Area at Depth
$1,450 Resource Pit Limit
$1,200Reserves Pit Limit

Mining

Haul Truck: Selection and Optimization – Scenarios
17
Operating Scenario• 4 mining zones
• Long distance hauls• 40+ Pits
• Various sizes• Multiple zones ore body
• Selective mining
Total Costs (Opex + Capex)
Considerations• Payload capacity• Long haul component
• Mix fleet or single truck solution
• Narrow truck body to limit stripping
• Optionality in solution
Solution (Feasibility Study)• Modified highway tippers
with payload capacity of 50t• Single fleet solution for in-
pit and long distance haul components
• Fall back solutions identified for uncertainties

Haul Truck: Selection and Optimization – Base Case
18
Cost Comparison: Modified Highway Tipper (MHT) vs. Traditional Mining Truck (TMT)• LOM costing was completed assuming same material movement• Assumed additional road maintenance for MHT• MHT was lower capital and operating costsMaterial Movement Comparison• MHT’s narrow body width allows for narrow haul roads• Pit design comparison resulted in same ore and TMT had ~20% additional wasteNon-Quantified Benefits• Social benefits and community relations• Training and development of the personnel
Modified Highway TipperTypical Mining Truck
Less Waste Stripping
Lower LOM Costing

Ore Delivery: Mining Rate Optimized
19
YR1
YR5
YR3Stress test the mine delivery of ore at various points in the LOM• Simulated all mining activities• Short term planning• Advancement rates
Optimizing mining rate• Number of digging units• Amount to high grade mill feed• Low grade stockpile capacity
Determine minimum active areas to provide mill feed• Satellite zones in operation
Mill Feed Summary
Optimized Equipment Fleet and Material Movement

Process Plant

Plant Design Optimization: Mill Sizing Analysis
21
At a nominal 2Mtpa rate determined from the mine plan:• Phase 1 – Oxide and transition feed only for first several years of operations • Phase 2 – Oxide, Transition and Fresh for LOM Blend

Detailed Grind Circuit Optimization
22
Conclusion: Duplicating Sabodala circuit design is optimal• Equal capital, higher throughput, simplified commissioning

Plant Design Basis
23
Design Criteria Summary• Conventional Carbon in Leach Circuit• Primary Jaw Crusher (Metso C140 200kW)• Live Stockpile – Ore Reclaim Feeders• SAG and Ball Milling with Pebble Crushing (SABC)
• 7.3m dia 4000 kW SAG• 5.5m dia 4000 kW Ball • 338 dry tpoh oxide ore; 250 dry tpoh primary ore
• Target grind P80 106 micron• Leach times: 36 hours primary, 24 hours oxide (low
cyanide and lime consumption); oxygen addition• Standard elution, electrowinning and carbon recovery
Composite CompositeAvg Au g/t
LaboratoryGold
Extraction %
Predicted Plant
Recovery %
Previous Avg
Recovery %
Oxide 1.83 96.5 95.8 92.5
Primary- granitic 1.29 90.0 89.5 87.8
Nogbelé North
primary2.03 93.5 92.5 89.3
Nogbelé Central, West
primary1.72 92.8 91.8 -
Fourkoura Primary 1.59 91.5 91.0 88.7
LOM Average 92.7
Metallurgy
Metallurgical Testwork• Used discrete, orebody representative composites from DD core• Isolated potentially low recovery areas, revealed overall better recovery• Optimized leach time and grind size relationship• Flexibility for varying ore feed blends in the design

Primary Crushing
OreStorage Pebble Crushing Grinding
Gold Room
ElectrowinningElution
Thickening
Tailings Storage
Plant Water Storage
Raw Water Supply
Cyanide Leach & Adsorption Carbon Regeneration Kiln
Emergency Reclaim
Intensive Cyanidation
Trash Screen
Sag Mill Ball Mill
Cyclones
24
Flexible and Robust Flow Sheet – Replicates Sabodala

Infrastructure
25
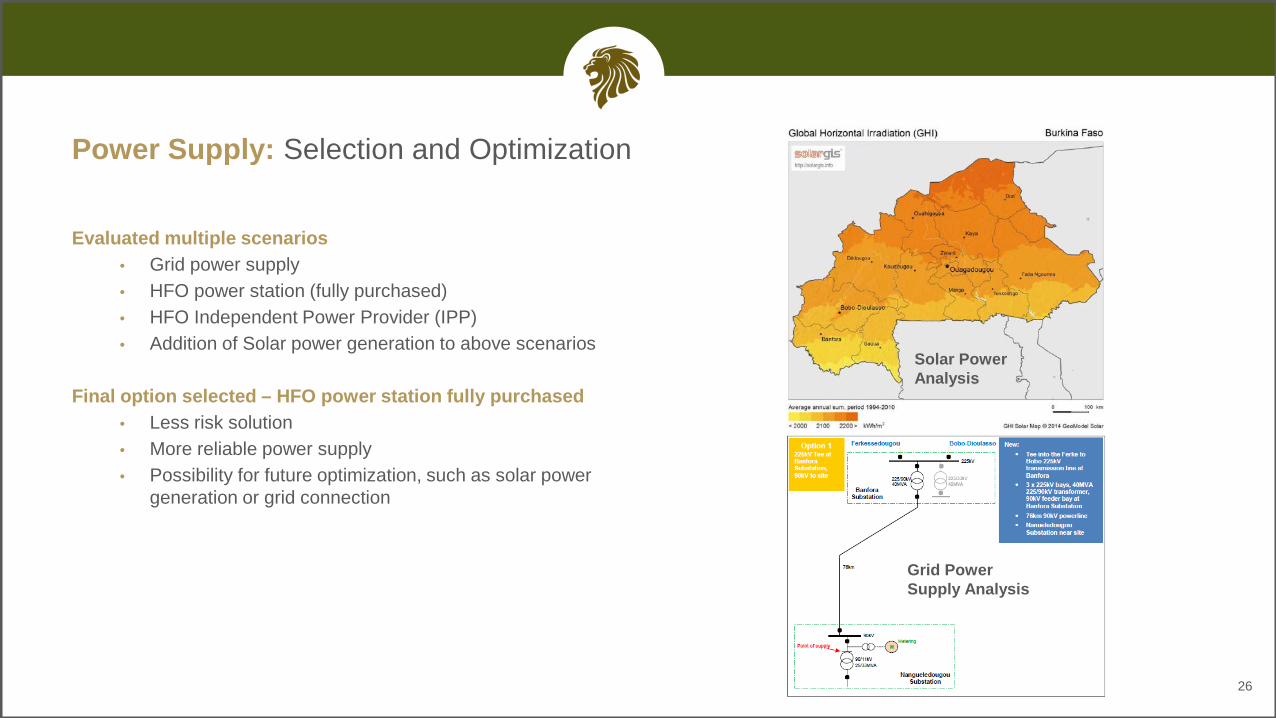
Power Supply: Selection and Optimization
26
Evaluated multiple scenarios• Grid power supply• HFO power station (fully purchased)• HFO Independent Power Provider (IPP)• Addition of Solar power generation to above scenarios
Final option selected – HFO power station fully purchased • Less risk solution• More reliable power supply• Possibility for future optimization, such as solar power
generation or grid connection
Solar Power Analysis
Grid Power Supply Analysis

Tailings Water Management: Selection and Optimization
27
Cell 1, Stage 1 Cell 1, Stage 3 Cell 2, Stage 4 Cell 2, Stage 7
HDPE geomembrane lined paddock type storage facility• Deposition plan to optimize water recovery in early stage.• Location and design selected to maximize dyke to fill ratio; without risk of water
treatmentSite water balance model optimized
• Maximize water recovery to minimize water harvest dam and costs

Community Relations: Optimization for Less Impact to Community
28
Compact Footprint• Resettlement action plan developed with community support
and involvement• Minimize community relocation and livelihood restorationOngoing Optimization• Phased relocation approach• In-pit waste back filling

Next Steps at Wahgnion
29
Q12018
Q22018
Mid2018
YE2019
• Close project debt financing• Commence plant construction
• Announce details of committed financing
• Update reserves• Update NI 43-101
• Anticipated first gold pour at Wahgnion

TSX:TGZ / OTCQX:TGCDF
Trish MoranHead of Investor Relations77 King Street West, Suite 2110 Toronto, ON M5K 2A1
T: +1.416.607.4507E: [email protected]: terangagold.com
PDAC Booth: 3328

Appendix

32
Notes for Mineral Reserves Estimate
1. CIM definitions were followed for Mineral Reserves.2. Mineral Reserve cut-off grades range from 0.39 g/t to 0.53 g/t Au for oxide and 0.51 g/t to 0.64 g/t Au for fresh rock based on a $1,200/oz gold price.3. Dry bulk density was estimated in the Mineral Resource models; values for ore range from 1.61 t/m3 to 2.22 t/m3 for oxide and 2.50 t/m3 to 2.80 t/m3 for fresh rock. 4. Mineral Reserves account for mining dilution and mining ore loss.5. A minimum mining width of 2.5 m was used.6. Proven Mineral Reserves are based on Measured Mineral Resources only.7. Probable Mineral Reserves are based on Indicated Mineral Resources and diluting material.8. Sum of individual amounts may not equal due to rounding.
Wahgnion Project: Open Pit Mineral Reserves Summary(as at June 30, 2017)
Proven Reserves Probable Reserves 2P Reserves
Deposit MTonnes Grade (Au g/t) Moz MTonnes Grade
(Au g/t) Moz MTonnes Grade (Au g/t) Moz
Nogbele 1.09 1.45 0.05 10.38 1.56 0.52 11.48 1.55 0.57
Fourkoura 0.31 1.64 0.02 2.10 1.73 0.12 2.41 1.71 0.13
Samavogo 0.00 0.00 0.00 4.43 2.02 0.29 4.43 2.02 0.29
Stinger 0.15 2.09 0.01 2.95 1.72 0.16 3.10 1.74 0.17
Total 1.55 1.55 0.08 19.87 1.70 1.09 21.42 1.69 1.16

Wahgnion Project: Feasibility Study Technical Report Contributions
33
The mineral resource and mineral reserve estimates in this presentation have been classified in accordance with Canadian Institute of MiningMetallurgy and Petroleum's "CIM Definition Standards - For Mineral Resources and Mineral Reserves" 2014, as required by National Instrument 43-101- Standards of Disclosure for Mineral Projects (“NI 43-101”). Roscoe Postle Associates Inc., an independent consultant prepared the resource andreserve estimates and the report with the assistance of a number of independent experts or firms.
Lycopodium Limited (ASX:LYL), an Australian headquartered engineering and project management consultancy that has successfully completed theconstruction of a dozen gold development projects in West Africa since 2009, completed the process design, capital estimate and execution plan for theprocess facilities and associated infrastructure.
Knight Piésold Consulting completed the tailings management facility design, surface geotechnical engineering and site water balance, ECGEngineering completed the Power Supply solution, BBA/Aurifex completed the metallurgical test work supporting the process design, and MBSEnvironmental completed the ESIA summary and Closure Plan.

Wahgnion Project: Competent & Qualified Persons Statement
34
The technical information contained in this document relating to the open pit mineral reserve estimates is based on, and fairly represents, informationcompiled by Glen Ehasoo, P. Eng., who is a member of the Association of Professional Engineers and Geoscientists of British Columbia, which iscurrently included as a "Recognized Overseas Professional Organization" in a list promulgated by the ASX from time to time. Mr. Ehasoo isindependent of Teranga and is a "Qualified Person" as defined in National Instrument 43-101 and a "competent person" as defined in the 2012 Editionof the JORC Code. Mr. Ehasoo has sufficient experience relevant to the style of mineralisation and type of deposit under consideration and to theactivity he is undertaking to qualify as a Competent Person as defined in the 2012 Edition of the "Australasian Code for Reporting of ExplorationResults, Mineral Resources and Ore Reserves". Mr. Ehasoo has verified the technical data in this news release related to mineral reserves estimation,and has reviewed and approved the information in this news release relevant to mineral reserves estimation.
The technical information contained in this document relating to open pit mineral resource estimates is based on, and fairly represents, informationcompiled by Mr. David Ross. Mr. Ross, P. Geo., is a Member of the Association of Professional Geoscientists of Ontario, which is currently included asa "Recognized Overseas Professional Organization" in a list promulgated by the ASX from time to time. Mr. Ross is independent of Teranga and is a"Qualified Person" as defined in National Instrument 43-101. Mr. Ross has sufficient experience which is relevant to the style of mineralisation and typeof deposit under consideration and to the activity which he is undertaking to qualify as a Competent Person as defined in the 2012 Edition of the"Australasian Code for Reporting of Exploration Results, Mineral Resources and Ore Reserves". Mr. Ross has verified the technical data in this newsrelease related to mineral resources estimation, and has reviewed and approved the information in this news release relevant to mineral resourceestimation.

35
Non-IFRS Performance MeasuresThe Company has included non-IFRS measures in this document, including “total cash cost per ounce of gold sold”, “all-in sustaining costs per ounce”, “free cash flowfrom operations” and “EBITDA”. The Company believes that these measures, in addition to conventional measures prepared in accordance with IFRS, provide investorsan improved ability to evaluate the underlying performance of the Company. The non-IFRS measures are intended to provide additional information and should not beconsidered in isolation or as a substitute for measures of performance prepared in accordance with IFRS. These measures do not have any standardized meaningprescribed under IFRS, and therefore may not be comparable to other issuers.
Total cash costs figures are calculated in accordance with a standard developed by The Gold Institute, which was a worldwide association of suppliers of gold and goldproducts and included leading North American gold producers. The Gold Institute ceased operations in 2002, but the standard is considered the accepted standard ofreporting cash cost of production in North America. Adoption of the standard is voluntary and the cost measures presented may not be comparable to other similarly titledmeasure of other companies. The World Gold Council (“WGC”) definition of all-in sustaining costs seeks to extend the definition of total cash costs by adding corporategeneral and administrative costs, reclamation and remediation costs (including accretion and amortization), exploration and study costs (capital and expensed),capitalized stripping costs and sustaining capital expenditures and represents the total costs of producing gold from current operations. All-in sustaining cost excludesincome tax payments, interest costs, costs related to business acquisitions and items needed to normalize earnings. Consequently, this measure is not representative ofall of the Company’s cash expenditures. In addition, the calculation of all-in sustaining costs does not include depreciation expense as it does not reflect the impact ofexpenditures incurred in prior periods. Therefore, it is not indicative of the Company’s overall profitability. For Sabodala and Wahgnion, life of mine total cash costs andall-in sustaining costs figures used in this presentation are before cash/non-cash inventory movements and exclude any allocation of corporate overheads. Total cashcosts and all-in sustaining costs figures for Sabodala further excludes amortized advanced royalty costs. Other companies may calculate this measure differently.Consolidated total cash costs and all-in sustaining cost figures add corporate overhead costs. Other companies may calculate this measure differently. The Companycalculates free cash flow from operations as net cash flow provided by operating activities less sustaining capital expenditures. The Company believes this to be a usefulindicator of its ability to generate cash for growth initiatives. “Earnings before interest, taxes, depreciation and amortization” (“EBITDA”) is a non-IFRS financial measure,which excludes income tax, finance costs (before unwinding of discounts), interest income, depreciation and amortization, and non-cash impairment charges from netearnings. EBITDA is intended to provide additional information to investors and analysts and do not have any standardized definition under IFRS and should not beconsidered in isolation or as a substitute for measures of performance prepared in accordance with IFRS. Management believes that EBITDA is a valuable indicator ofour ability to generate liquidity by producing operating cash flow to: fund working capital needs, service debt obligations, and fund capital expenditures.
For more information regarding these measures, please refer to the Company’s Management’s Discussion and Analysis accessible on the Company’s website atwww.terangagold.com.

Endnotes
36
1. Production targets are based only on proven and probable ore reserves for the Wahgnion Project.
2. Teranga’s consolidated cash and cash equivalents as of June 30, 2017.
3. This forecasted financial information is based on the updated life of mine plan and reserve estimate for the Sabodala project as disclosed in a technicalreport pursuant to NI 43-101 dated August 30, 2017.
4. Pre-production capital costs of $232 million excludes $12 million in construction readiness activities spent prior to major construction.
5. LOM assumptions include:Gold Price of $1,250 per ounceHeavy Fuel Oil (HFO): $0.59 per litre (Wahgnion) and $0.46 per litre (Sabodala)Light Fuel Oil (LFO): $1.04 per litre ($0.88 per litre during the construction period) (Wahgnion) and $0.81 per litre (Sabodala)Euro to USD Exchange Rate: $1.10
6. This production target is based on proven and probable reserves only from the Sabodala project as at June 30, 2017 as disclosed on the Company’swebsite at www.terangagold.com and on SEDAR at www.sedar.com. The estimated ore reserves underpinning this production target have been preparedby a competent person or persons (see Competent Persons Statements in the Company’s Management’s Discussion & Analysis for the three and sixmonths ended June 30, 2017 available on the Company’s website at www.terangagold.com).
7. This LOM production plan assumes Wahgnion project plant construction to commence in Q1 2018. With plant construction moved to Q2 2018, LOMproduction plan may shift by several months.