bangko sentral ng pilipinas’ (bsp) - oecd.org rcgonzaga_oecd... · oecd-bsp asian seminar on...
TRANSCRIPT
OECD-BSP Asian Seminar on Financial Inclusion
11 September 2012 • Mactan, Cebu
Bangko Sentral ng
Pilipinas’ (BSP)
Financial Learning
Campaign (FLC)
Ruth C. Gonzaga
Department of Economic Statistics
2
Outline
1. Trends on global and overseas Filipino
remittances
2. BSP’s initiatives on advocacies for overseas
Filipinos and remittances
1
Trends on Global and Overseas Filipino Remittances
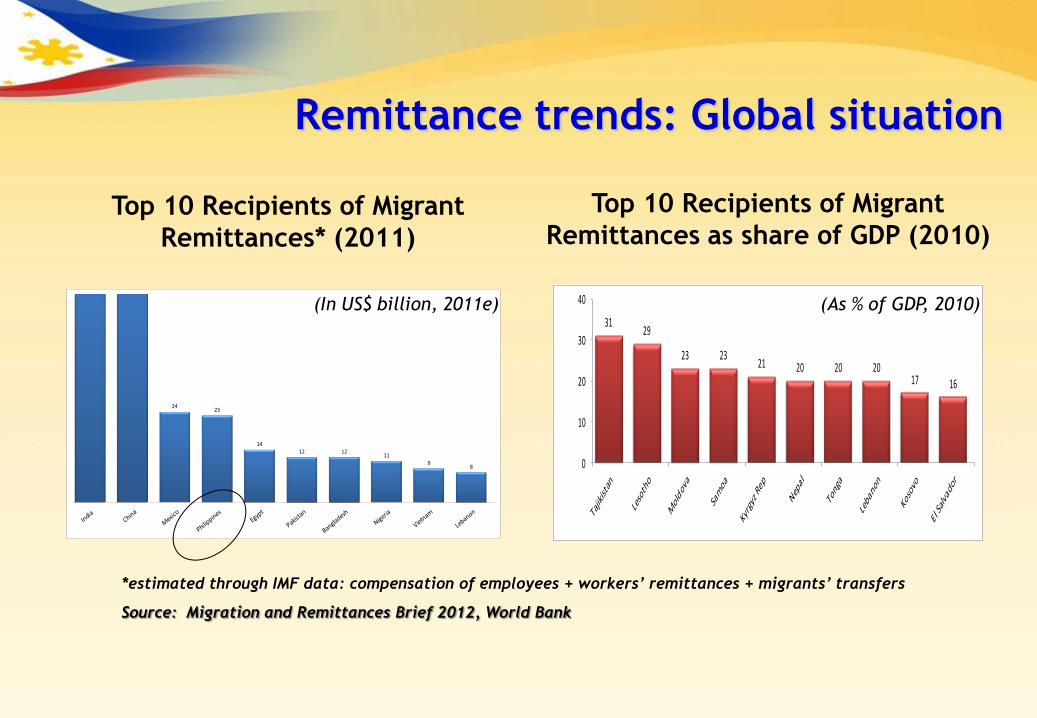
Remittance trends: Global situation
2423
1412 12
119
8
*estimated through IMF data: compensation of employees + workers’ remittances + migrants’ transfers
Source: Migration and Remittances Brief 2012, World Bank
Top 10 Recipients of Migrant
Remittances* (2011)
(In US$ billion, 2011e)
Top 10 Recipients of Migrant
Remittances as share of GDP (2010)
3129
23 2321 20 20 20
17 16
0
10
20
30
40 (As % of GDP, 2010)

Overseas Filipinos’ remittances provide cushion against external shocks
-30
-20
-10
0
10
20
30
40
0
5
10
15
20
25
80 90 91 92 93 94 95 96 97 98 99 00 01 02 03 04 05 06 07 08 09 10 11 J-Jun 11
J-Jun 12 p/
Remittances (RHS) Growth Rate (LHS)
Cash Remittances
1980 – June 2012 (in billion US$) Cash Remittances by source
Asia14%
Americas*53%
Oceania1%
Europe16%
Middle East15%
Africa0%
Others0%
Jan-Jun 2012
* Americas include Canada, USA, Commonwealth of
Northern Marianas Island, and Guam
Source: Bangko Sentral ng Pilipinas (BSP)
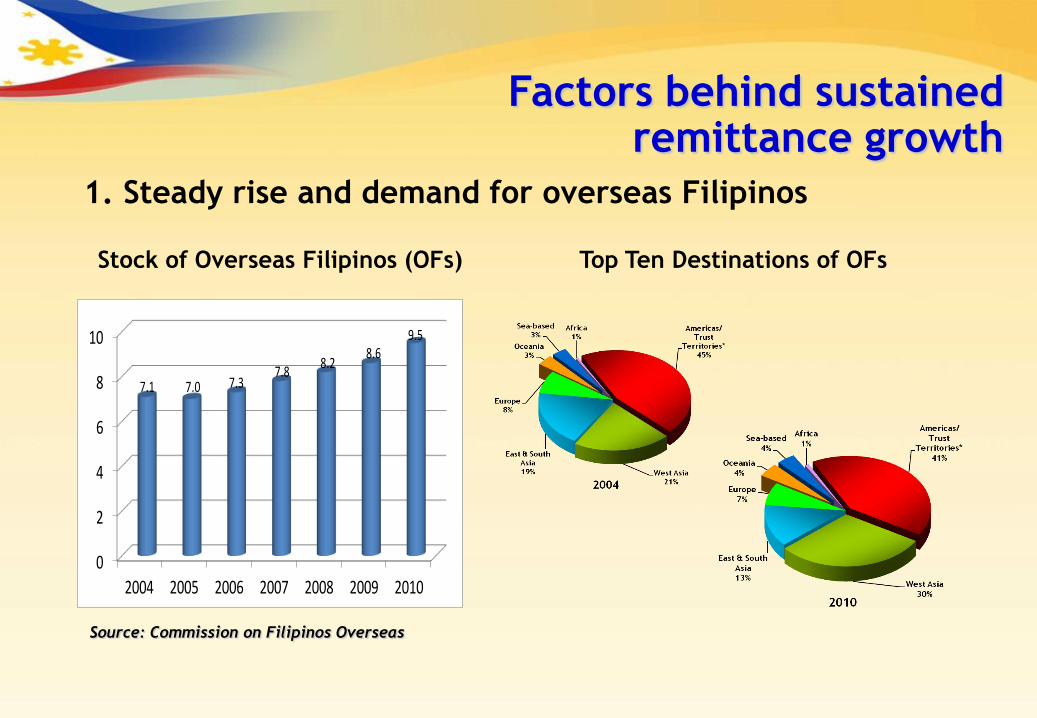
Factors behind sustained remittance growth
Source: Commission on Filipinos Overseas
0
2
4
6
8
10
2004 2005 2006 2007 2008 2009 2010
7.1 7.0 7.37.8
8.28.6
9.5
1. Steady rise and demand for overseas Filipinos
Stock of Overseas Filipinos (OFs) Top Ten Destinations of OFs

No. of Bank Branches, Correspondent
Banks, Remittance Centers and Tie-ups
with OF Remittances
-
1,000
2,000
3,000
4,000
5,000
2007 2008 2009 2010 2011 Mar-2012
1,183
3,015
4,192 4,581 4,723 4,732
Source: Bangko Sentral ng Pilipinas (BSP)
Factors behind sustained remittance growth
2. Expanded, more efficient and accessible financial services
Deposit-taking function (e.g.,
electronic banking)
Servicing of household bills (utilities,
communication)
Direct payment of housing loan
amortizations
Customized services to cover life
insurance, educ. plans, tuition fees
More efficient payments and
settlements system
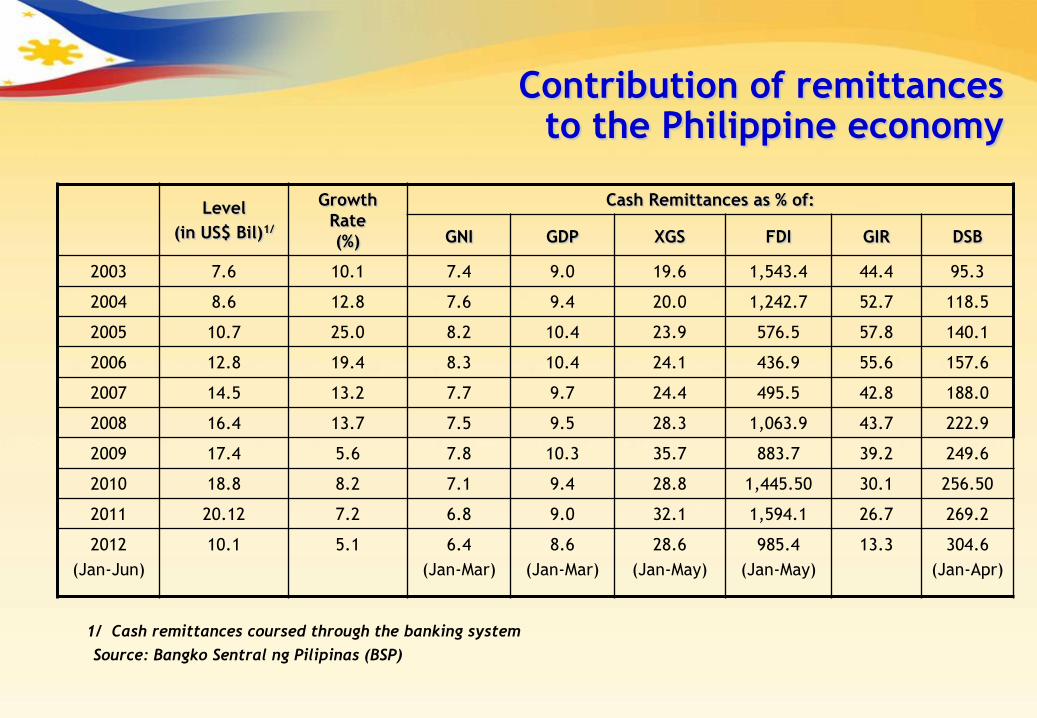
Contribution of remittances to the Philippine economy
Level
(in US$ Bil)1/
Growth
Rate
(%)
Cash Remittances as % of:
GNI GDP XGS FDI GIR DSB
2003 7.6 10.1 7.4 9.0 19.6 1,543.4 44.4 95.3
2004 8.6 12.8 7.6 9.4 20.0 1,242.7 52.7 118.5
2005 10.7 25.0 8.2 10.4 23.9 576.5 57.8 140.1
2006 12.8 19.4 8.3 10.4 24.1 436.9 55.6 157.6
2007 14.5 13.2 7.7 9.7 24.4 495.5 42.8 188.0
2008 16.4 13.7 7.5 9.5 28.3 1,063.9 43.7 222.9
2009 17.4 5.6 7.8 10.3 35.7 883.7 39.2 249.6
2010 18.8 8.2 7.1 9.4 28.8 1,445.50 30.1 256.50
2011 20.12 7.2 6.8 9.0 32.1 1,594.1 26.7 269.2
2012
(Jan-Jun)
10.1 5.1 6.4
(Jan-Mar)
8.6
(Jan-Mar)
28.6
(Jan-May)
985.4
(Jan-May)
13.3 304.6
(Jan-Apr)
1/ Cash remittances coursed through the banking system
Source: Bangko Sentral ng Pilipinas (BSP)

2
BSP Advocacies for Overseas Filipinos

Dual Planks
A. Encourage continued flow of remittances
B. Mobilize remittances to fund productive activities
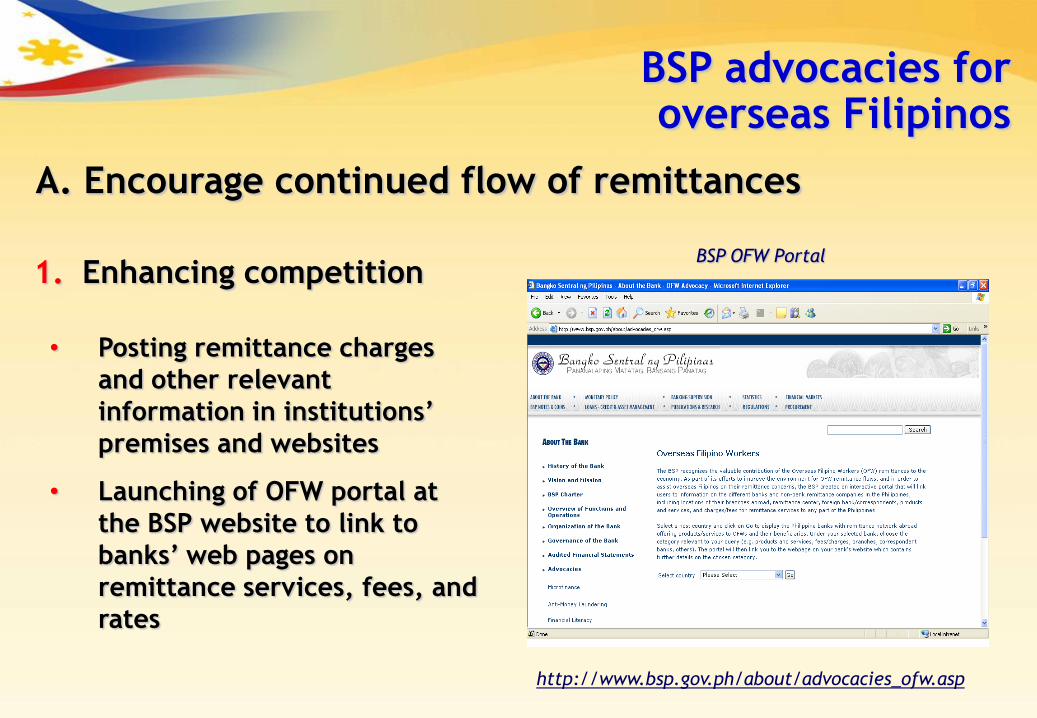
A. Encourage continued flow of remittances
• Posting remittance charges
and other relevant
information in institutions’
premises and websites
• Launching of OFW portal at
the BSP website to link to
banks’ web pages on
remittance services, fees, and
rates
1. Enhancing competition
BSP OFW Portal
http://www.bsp.gov.ph/about/advocacies_ofw.asp
BSP advocacies for overseas Filipinos
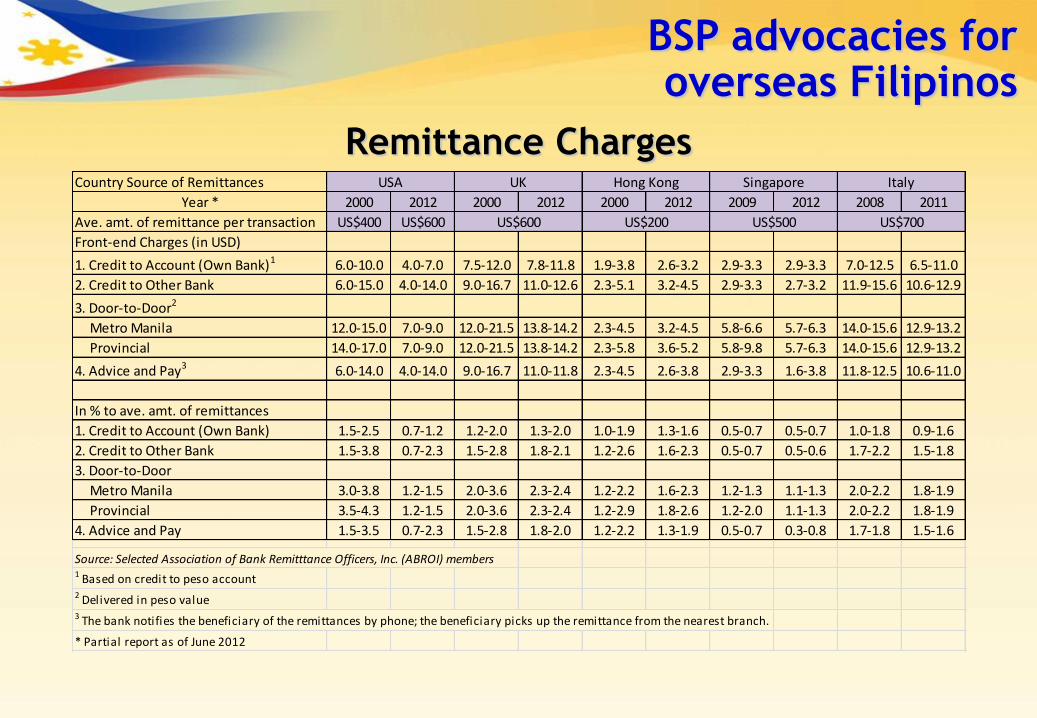
Remittance Charges
BSP advocacies for overseas Filipinos
Country Source of Remittances
Year * 2000 2012 2000 2012 2000 2012 2009 2012 2008 2011
Ave. amt. of remittance per transaction US$400 US$600
Front-end Charges (in USD)
1. Credit to Account (Own Bank)1 6.0-10.0 4.0-7.0 7.5-12.0 7.8-11.8 1.9-3.8 2.6-3.2 2.9-3.3 2.9-3.3 7.0-12.5 6.5-11.0
2. Credit to Other Bank 6.0-15.0 4.0-14.0 9.0-16.7 11.0-12.6 2.3-5.1 3.2-4.5 2.9-3.3 2.7-3.2 11.9-15.6 10.6-12.9
3. Door-to-Door2
Metro Manila 12.0-15.0 7.0-9.0 12.0-21.5 13.8-14.2 2.3-4.5 3.2-4.5 5.8-6.6 5.7-6.3 14.0-15.6 12.9-13.2
Provincial 14.0-17.0 7.0-9.0 12.0-21.5 13.8-14.2 2.3-5.8 3.6-5.2 5.8-9.8 5.7-6.3 14.0-15.6 12.9-13.2
4. Advice and Pay3 6.0-14.0 4.0-14.0 9.0-16.7 11.0-11.8 2.3-4.5 2.6-3.8 2.9-3.3 1.6-3.8 11.8-12.5 10.6-11.0
In % to ave. amt. of remittances
1. Credit to Account (Own Bank) 1.5-2.5 0.7-1.2 1.2-2.0 1.3-2.0 1.0-1.9 1.3-1.6 0.5-0.7 0.5-0.7 1.0-1.8 0.9-1.6
2. Credit to Other Bank 1.5-3.8 0.7-2.3 1.5-2.8 1.8-2.1 1.2-2.6 1.6-2.3 0.5-0.7 0.5-0.6 1.7-2.2 1.5-1.8
3. Door-to-Door
Metro Manila 3.0-3.8 1.2-1.5 2.0-3.6 2.3-2.4 1.2-2.2 1.6-2.3 1.2-1.3 1.1-1.3 2.0-2.2 1.8-1.9
Provincial 3.5-4.3 1.2-1.5 2.0-3.6 2.3-2.4 1.2-2.9 1.8-2.6 1.2-2.0 1.1-1.3 2.0-2.2 1.8-1.9
4. Advice and Pay 1.5-3.5 0.7-2.3 1.5-2.8 1.8-2.0 1.2-2.2 1.3-1.9 0.5-0.7 0.3-0.8 1.7-1.8 1.5-1.6
Source: Selected Association of Bank Remitttance Officers, Inc. (ABROI) members1 Based on credit to peso account2 Delivered in peso value3 The bank notifies the beneficiary of the remittances by phone; the beneficiary picks up the remittance from the nearest branch.
* Partial report as of June 2012
USA UK Hong Kong Singapore Italy
US$600 US$200 US$500 US$700

2. Improving channels of remittances
• Interconnection of ATM networks
• Grant of FCDU license to rural and cooperative banks
• Lower remittance fees charged by remittance
companies by 90% for credit-to-other bank transfers
through the BSP PhilPaSS
• Approval of new technologies in remittance transfers
(mobile phones, internet, cash cards)
BSP advocacies for overseas Filipinos
A. Encourage continued flow of remittances

1. Facilitating access to financial services/products
• Simplified regulations on acceptable IDs for financial
transactions to one valid ID issued by official authority
• Granted commercial banks authority to offer investment
products of OFs and their families (hedging instrument, long-
term bonds)
• Promoted market-based lending to micro, small and medium
enterprises (MSMEs)
BSP advocacies for overseas Filipinos
B. Mobilize remittances to fund productive activities
Dec-2004 Dec-2011 % Change Dec-2004 Dec-2011 % Change
Microfinance-
Oriented Banks 336 2,112 529 63,306 370,594 485
Regular Banks
with Microfinance
Operations 2,985 5,097 71 486,672 610,930 26
Total 3,321 7,209 117 549,978 981,524 78
Source: BSP
Amount (in million Php) No. of Borrowers
Microfinance loans and number of borrowers
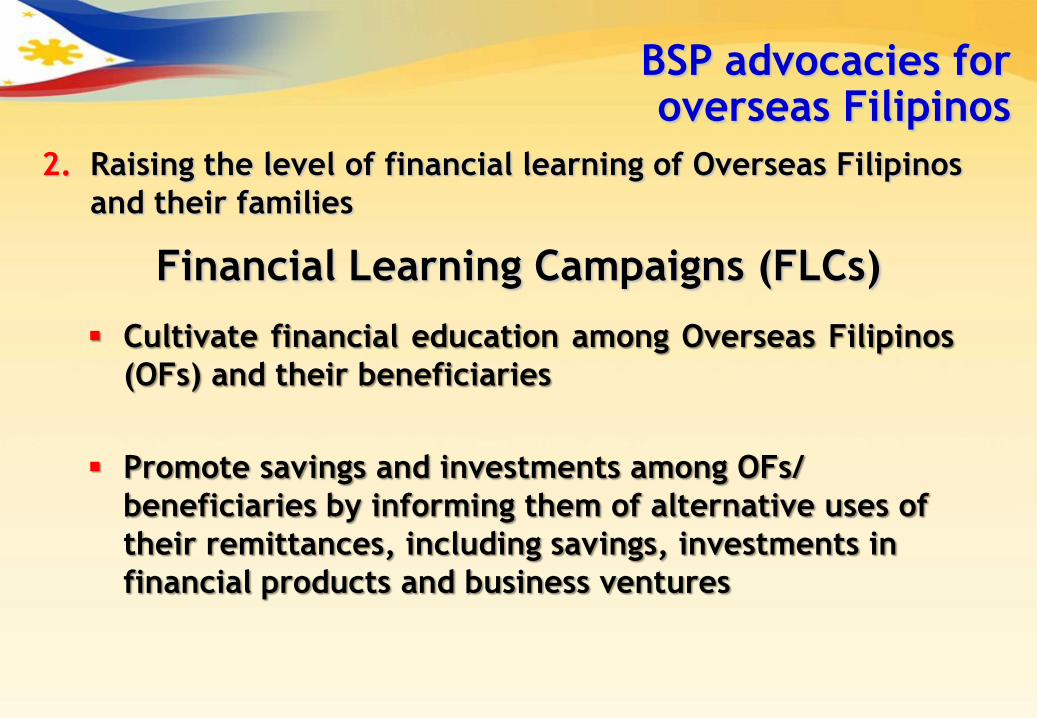
Financial Learning Campaigns (FLCs)
Cultivate financial education among Overseas Filipinos
(OFs) and their beneficiaries
Promote savings and investments among OFs/
beneficiaries by informing them of alternative uses of
their remittances, including savings, investments in
financial products and business ventures
2. Raising the level of financial learning of Overseas Filipinos
and their families
BSP advocacies for overseas Filipinos
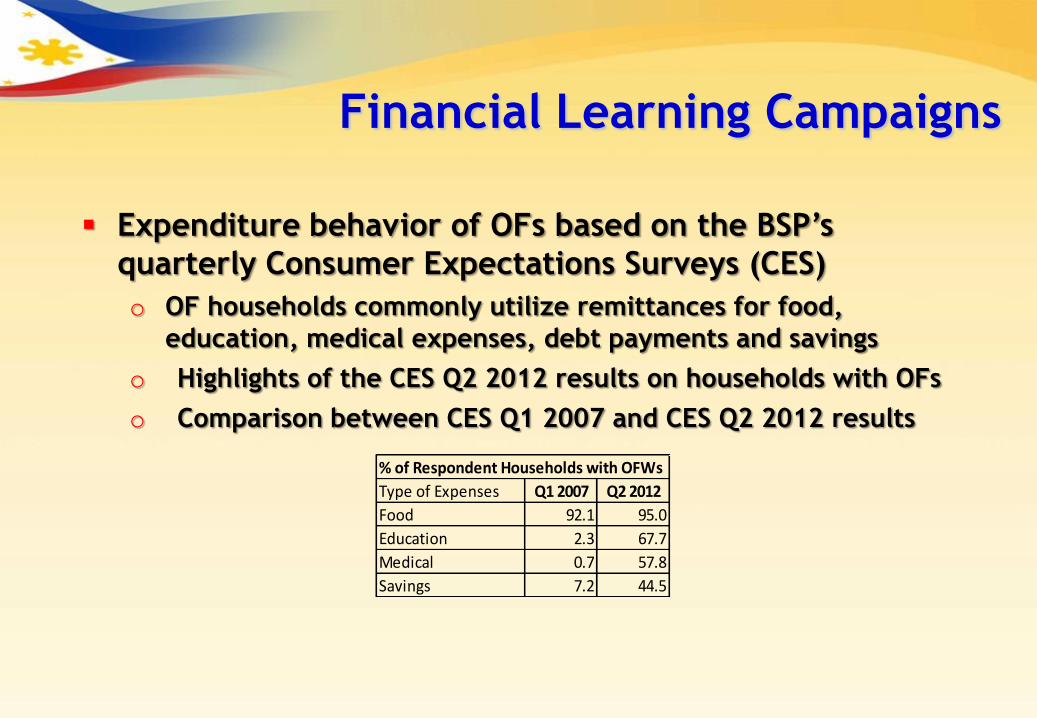
Financial Learning Campaigns
Expenditure behavior of OFs based on the BSP’s
quarterly Consumer Expectations Surveys (CES)
o OF households commonly utilize remittances for food,
education, medical expenses, debt payments and savings
o Highlights of the CES Q2 2012 results on households with OFs
o Comparison between CES Q1 2007 and CES Q2 2012 results
% of Respondent Households with OFWs
Type of Expenses Q1 2007 Q2 2012
Food 92.1 95.0
Education 2.3 67.7
Medical 0.7 57.8
Savings 7.2 44.5
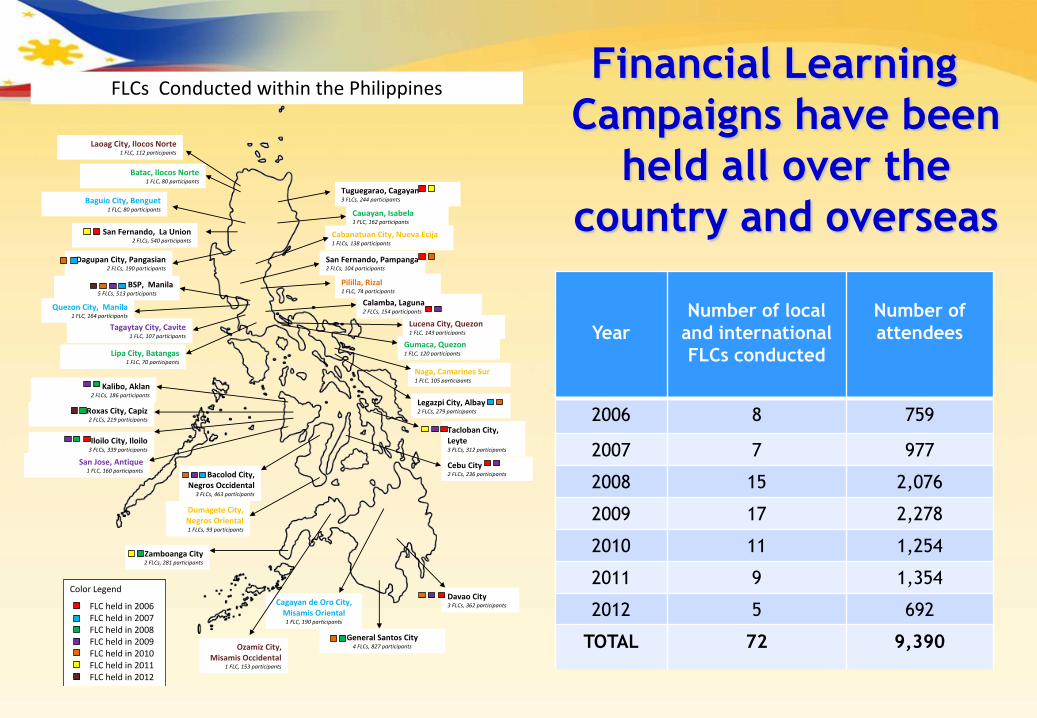
Financial Learning
Campaigns have been
held all over the
country and overseas
Year
Number of local
and international
FLCs conducted
Number of
attendees
2006 8 759
2007 7 977
2008 15 2,076
2009 17 2,278
2010 11 1,254
2011 9 1,354
2012 5 692
TOTAL 72 9,390
Cebu City 2 FLCs, 236 participants
Tuguegarao, Cagayan 3 FLCs, 244 participants
Cauayan, Isabela 1 FLC, 162 participants
Calamba, Laguna 2 FLCs, 154 participants
Gumaca, Quezon 1 FLC, 120 participants
Legazpi City, Albay 2 FLCs, 279 participants
Tacloban City, Leyte 3 FLCs, 312 participants
Davao City 3 FLCs, 362 participants
General Santos City 4 FLCs, 827 participants
Cagayan de Oro City, Misamis Oriental
1 FLC, 190 participants
Zamboanga City 2 FLCs, 281 participants
Bacolod City, Negros Occidental
3 FLCs, 463 participants
San Jose, Antique 1 FLC, 160 participants
Iloilo City, Iloilo 3 FLCs, 339 participants
Roxas City, Capiz 2 FLCs, 219 participants
Kalibo, Aklan 2 FLCs, 186 participants
Lipa City, Batangas 1 FLC, 70 participants
Tagaytay City, Cavite 1 FLC, 107 participants
Quezon City, Manila 1 FLC, 164 participants
BSP, Manila 5 FLCs, 513 participants
San Fernando, Pampanga 2 FLCs, 104 participants
Dagupan City, Pangasian 2 FLCs, 190 participants
San Fernando, La Union 2 FLCs, 540 participants
Baguio City, Benguet 1 FLC, 80 participants
Batac, Ilocos Norte 1 FLC, 80 participants
FLCs Conducted within the Philippines
Color Legend
FLC held in 2006 FLC held in 2007 FLC held in 2008 FLC held in 2009 FLC held in 2010 FLC held in 2011 FLC held in 2012
Pililla, Rizal 1 FLC, 74 participants
Laoag City, Ilocos Norte 1 FLC, 112 participants
Cabanatuan City, Nueva Ecija 1 FLCs, 138 participants
Lucena City, Quezon 1 FLC, 143 participants
Naga, Camarines Sur 1 FLC, 105 participants
Dumagete City, Negros Oriental 1 FLCs, 93 participants
Ozamiz City, Misamis Occidental
1 FLC, 153 participants
