bangladesh capital market review 2017lbamcl.com/wp-content/uploads/2018/07/capital... · bangladesh...
TRANSCRIPT

BangladeshCapital MarketReview 2017
5,277
5,708
5,323
5,757
5,357
5,831
5,819
6,237
5,968
6,245

Bangladesh capital market review 2017
Analyst Team
Zobayed Al Mamun Hasan
+8801777-761260
LankaBangla Securities LimitedA.A. Bhaban (Level-5)23 Motijheel C/ADhaka-1000, BangladeshPhone: +880-2-9513794 (Ext-118)Fax: +880-2-9563902Website: www.lbsbd.com
Quazi Naureen Ahmed
Research Associate
Ahmed Irtiza Research Associate
Mashqurur Rahman
Trainee Research Associate
Salma Yeasmin Xinat
Senior Research Associate
Debashish SutradharSenior Research Associate

Secondary Market Review 2017Benchmark index advanced by 24.00%
Market Cap (BDT) increased by 23.92%Avg. Daily Turnover stood at BDT 8,748.38 mn (USD 105.91mn)

Bangladesh capital market review 2017
DSEX advanced by 24.00%, powered by financial sectors and large-cap stocks
Source: DSE, LBSL Research
0
5
10
15
20
25
30
35
40
4,400
4,600
4,800
5,000
5,200
5,400
5,600
5,800
6,000
6,200
6,400
Jan-17 Feb-17 Mar-17 Apr-17 May-17 Jun-17 Jul-17 Aug-17 Sep-17 Oct-17 Nov-17 Dec-17Turnover (BDT billion) DSEX (LHS)
Market started 2017 positively the indexrally that began in Nov’16 continued tilllate January. There was a 400 pointcorrection from the peak where lowturnover and profit taking was the norm.Index recovered rapidly as earningsstarted coming in, specially in thebanking sector. The financial stockdriven rally continues till April
Prolonged run of the financialssees correction as some 2016some annual profit numbersfail to meet lofty expectationswhile even in solid growthcompanies see fund flow awayfrom the sector. Eventually,the whole index follows suit.
Index takes small diveas seven banks werepunished for over-exposure, limitinginstitutional fund flowin to the market.
A buoyant year closes withtepid index movement anddecreased turnover as lowinstitutional fund injectionpersists ahead of Year endreporting period. Marginloan disbursement wasalso hampered temporarilyas brokers struggled tosource funds from bankswho wanted to tidy up theirbooks. Market participantsare waiting next round ofearnings in the new year.
A multitude of factors have contributed in thesustained investor interest in the financialstocks: strong private sector credit growth,bank company act amendments allowingmore directors from a single family, localbusiness groups targeting ownership interestin banks and bank sponsors sometimesengaging defensive maneuvers for stoppingpotential takeover. Fund flow also increasesto large-cap blue chips from manufacturingsectors as market moved away from mid-yearplateau.
Portfolio rebalancing by Juneending mutual funds andlarge institutional investorskept index consolidatedaround ~5,500 level.
Bangladesh capital market review 2017
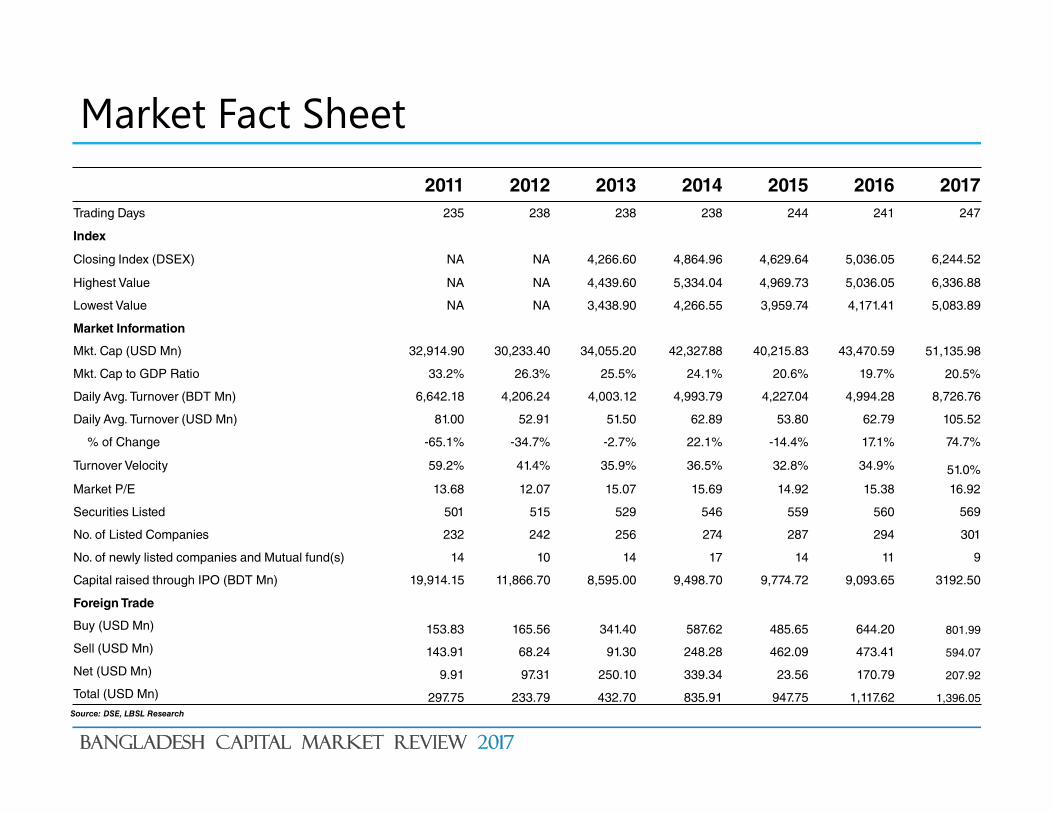
Market Fact Sheet
Source: DSE, LBSL Research
2011 2012 2013 2014 2015 2016 2017Trading Days 235 238 238 238 244 241 247
Index
Closing Index (DSEX) NA NA 4,266.60 4,864.96 4,629.64 5,036.05 6,244.52
Highest Value NA NA 4,439.60 5,334.04 4,969.73 5,036.05 6,336.88
Lowest Value NA NA 3,438.90 4,266.55 3,959.74 4,171.41 5,083.89
Market Information
Mkt. Cap (USD Mn) 32,914.90 30,233.40 34,055.20 42,327.88 40,215.83 43,470.59 51,135.98
Mkt. Cap to GDP Ratio 33.2% 26.3% 25.5% 24.1% 20.6% 19.7% 20.5%
Daily Avg. Turnover (BDT Mn) 6,642.18 4,206.24 4,003.12 4,993.79 4,227.04 4,994.28 8,726.76
Daily Avg. Turnover (USD Mn) 81.00 52.91 51.50 62.89 53.80 62.79 105.52
% of Change -65.1% -34.7% -2.7% 22.1% -14.4% 17.1% 74.7%
Turnover Velocity 59.2% 41.4% 35.9% 36.5% 32.8% 34.9% 51.0%
Market P/E 13.68 12.07 15.07 15.69 14.92 15.38 16.92
Securities Listed 501 515 529 546 559 560 569
No. of Listed Companies 232 242 256 274 287 294 301
No. of newly listed companies and Mutual fund(s) 14 10 14 17 14 11 9
Capital raised through IPO (BDT Mn) 19,914.15 11,866.70 8,595.00 9,498.70 9,774.72 9,093.65 3192.50
Foreign Trade
Buy (USD Mn) 153.83 165.56 341.40 587.62 485.65 644.20 801.99
Sell (USD Mn) 143.91 68.24 91.30 248.28 462.09 473.41 594.07
Net (USD Mn) 9.91 97.31 250.10 339.34 23.56 170.79 207.92
Total (USD Mn) 297.75 233.79 432.70 835.91 947.75 1,117.62 1,396.05

Bangladesh capital market review 2017
Total turnover increased by 82.08%
Source: LBSL Research Source: LBSL Research
6,046.31
16,434.07
6,642.18
4,206.24 4,003.12
4,993.794,227.04
4,944.28
8,748.38
0
2,000
4,000
6,000
8,000
10,000
12,000
14,000
16,000
18,000
2009 2010 2011 2012 2013 2014 2015 2016 2017
Chart : Daily Avg. Turnover (BDT mn)
89.1%
128.7%
59.2%
41.4%35.9% 36.5%
32.8% 34.9%
51.30%
0.0%
20.0%
40.0%
60.0%
80.0%
100.0%
120.0%
140.0%
2009 2010 2011 2012 2013 2014 2015 2016 2017
Chart: Velocity Ratio

Bangladesh capital market review 2017
Market cap increased by 23.92%
Source: LBSL Research Source: LBSL Research
25.65
29.16
13.6812.07
15.07 15.69 14.92 15.3816.92
0
5
10
15
20
25
30
35
2009 2010 2011 2012 2013 2014 2015 2016 2017
Chart: Market P/E
31.0%
50.7%
33.2%
26.3% 25.5% 24.1%20.6% 19.7% 20.5%
0.0%
10.0%
20.0%
30.0%
40.0%
50.0%
60.0%
2009 2010 2011 2012 2013 2014 2015 2016 2017
Chart: Mkt. Cap to GDP Ratio
Bangladesh capital market review 2017
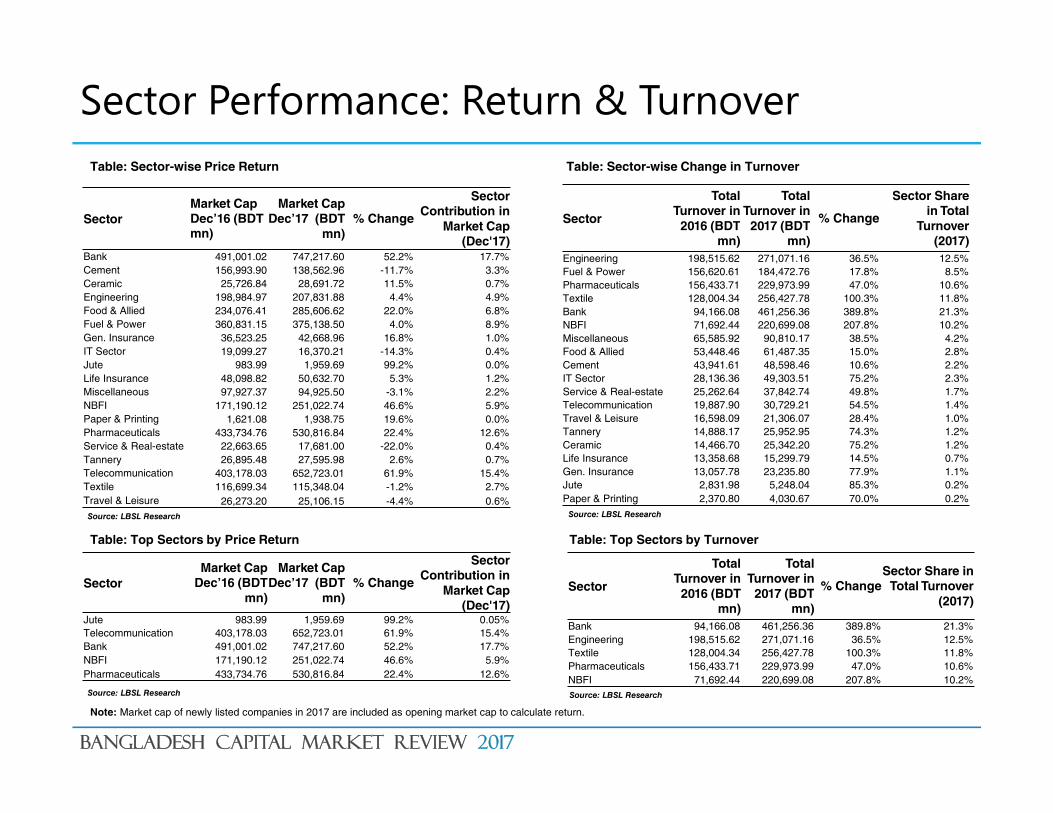
Sector Performance: Return & Turnover
Note: Market cap of newly listed companies in 2017 are included as opening market cap to calculate return.
Source: LBSL Research Source: LBSL Research
Table: Sector-wise Price Return Table: Sector-wise Change in Turnover
Table: Top Sectors by Price Return Table: Top Sectors by Turnover
SectorMarket Cap Dec’16 (BDT mn)
Market Cap Dec’17 (BDT
mn)% Change
Sector Contribution in
Market Cap (Dec'17)
Bank 491,001.02 747,217.60 52.2% 17.7%Cement 156,993.90 138,562.96 -11.7% 3.3%Ceramic 25,726.84 28,691.72 11.5% 0.7%Engineering 198,984.97 207,831.88 4.4% 4.9%Food & Allied 234,076.41 285,606.62 22.0% 6.8%Fuel & Power 360,831.15 375,138.50 4.0% 8.9%Gen. Insurance 36,523.25 42,668.96 16.8% 1.0%IT Sector 19,099.27 16,370.21 -14.3% 0.4%Jute 983.99 1,959.69 99.2% 0.0%Life Insurance 48,098.82 50,632.70 5.3% 1.2%Miscellaneous 97,927.37 94,925.50 -3.1% 2.2%NBFI 171,190.12 251,022.74 46.6% 5.9%Paper & Printing 1,621.08 1,938.75 19.6% 0.0%Pharmaceuticals 433,734.76 530,816.84 22.4% 12.6%Service & Real-estate 22,663.65 17,681.00 -22.0% 0.4%Tannery 26,895.48 27,595.98 2.6% 0.7%Telecommunication 403,178.03 652,723.01 61.9% 15.4%Textile 116,699.34 115,348.04 -1.2% 2.7%Travel & Leisure 26,273.20 25,106.15 -4.4% 0.6%
SectorMarket Cap
Dec’16 (BDT mn)
Market Cap Dec’17 (BDT
mn)% Change
Sector Contribution in
Market Cap (Dec'17)
Jute 983.99 1,959.69 99.2% 0.05%Telecommunication 403,178.03 652,723.01 61.9% 15.4%Bank 491,001.02 747,217.60 52.2% 17.7%NBFI 171,190.12 251,022.74 46.6% 5.9%Pharmaceuticals 433,734.76 530,816.84 22.4% 12.6%
Sector
Total Turnover in
2016 (BDT mn)
Total Turnover in
2017 (BDT mn)
% ChangeSector Share in
Total Turnover (2017)
Bank 94,166.08 461,256.36 389.8% 21.3%Engineering 198,515.62 271,071.16 36.5% 12.5%Textile 128,004.34 256,427.78 100.3% 11.8%Pharmaceuticals 156,433.71 229,973.99 47.0% 10.6%NBFI 71,692.44 220,699.08 207.8% 10.2%
Sector
Total Turnover in
2016 (BDT mn)
Total Turnover in
2017 (BDT mn)
% Change
Sector Share in Total
Turnover (2017)
Engineering 198,515.62 271,071.16 36.5% 12.5%Fuel & Power 156,620.61 184,472.76 17.8% 8.5%Pharmaceuticals 156,433.71 229,973.99 47.0% 10.6%Textile 128,004.34 256,427.78 100.3% 11.8%Bank 94,166.08 461,256.36 389.8% 21.3%NBFI 71,692.44 220,699.08 207.8% 10.2%Miscellaneous 65,585.92 90,810.17 38.5% 4.2%Food & Allied 53,448.46 61,487.35 15.0% 2.8%Cement 43,941.61 48,598.46 10.6% 2.2%IT Sector 28,136.36 49,303.51 75.2% 2.3%Service & Real-estate 25,262.64 37,842.74 49.8% 1.7%Telecommunication 19,887.90 30,729.21 54.5% 1.4%Travel & Leisure 16,598.09 21,306.07 28.4% 1.0%Tannery 14,888.17 25,952.95 74.3% 1.2%Ceramic 14,466.70 25,342.20 75.2% 1.2%Life Insurance 13,358.68 15,299.79 14.5% 0.7%Gen. Insurance 13,057.78 23,235.80 77.9% 1.1%Jute 2,831.98 5,248.04 85.3% 0.2%Paper & Printing 2,370.80 4,030.67 70.0% 0.2%
Source: LBSL Research Source: LBSL Research

Bangladesh capital market review 2017
The Leaders & The Losers
Top Performer Price Return
KAY&QUE 293.64%
DULAMIACOT 223.17%
NORTHERN 203.90%
SAVAREFR 193.66%
LEGACYFOOT 168.30%
RUPALIBANK 153.69%
PTL 139.06%
MONNOCERA 133.71%
AZIZPIPES 123.50%
SHYAMPSUG 122.38%
Top Loser Price Return
EMERALDOIL -53.81%
MITHUNKNIT -51.87%
GOLDENSON -43.61%
SEMLIBBLSF -42.19%
SHEPHERD -40.96%
CAPMBDBLMF -35.71%
OIMEX -35.68%
SAIFPOWER -34.39%
SAPORTL -33.40%
PDL -31.09%
Source: LBSL ResearchSource: LBSL Research
Like the top losers, top gainers of the year also consist ofsmall-cap stocks that collectively hold merely 0.7% of totalmarket capital and 1.2% of total trade volume in DSE.2017 has seen high levels of activity in mid and small-capstocks, with the market's upward movement in the secondhalf of the year being powered by increased fund flow inmid-cap and newly traded stock. Growth in price of someof the companies (such as KAY&QUE, RUPALIBANK,MONNOCERA) attributed to their growth in earnings anddividend declaration. However, the rest of the companieshave mixed performance in earnings and had pricemovement due to increased trading volume in market.Overall, majority of the companies are being traded athigh P/E ratio.
The top losers of the year consist almost entirely of small-capand mid-cap stocks. Collectively, the ten largest losing stockshold only 0.6% of total market cap of Dhaka Stock Exchange(DSE). SAPORTAL alone stands at 0.18% of total market capand the other nine stocks together make up 0.45%. The priceperformance of all these top losing companies suffered asthey experienced decline in their earnings, financialinefficiency or have regulatory issues. EMERALDOIL, the toplosing company, has been facing financial problem in meetingthe bank loan and operating in he commercial operation insmall scale due to shortage of sufficient working capital. In 89months operation (July’16 to March’17) the posted EPS ofBDT 0.09, which is 97.0% down compare to same period ofprevious year.
Company Total Turnover (BDT mn)
LANKABAFIN 73,332.01
CITYBANK 41,326.45
BEXIMCO 41,106.95
IFADAUTOS 40,900.04
ISLAMIBANK 29,971.66
NBL 29,677.76
SQURPHARMA 28,151.93
BRACBANK 27,617.62
RSRMSTEEL 27,017.07
IDLC 26,638.93
The top ten turnover leaders are large-cap companies,collectively holding 13.3% of total market cap. The topturnover list is mostly populated by large-cap stocks. Large-cap stocks (such as ISLAMIBANK, BRACK,SQURPHARMA) collectively holds 12.0% of marketcapitalization. In 2017, top ten highly traded stocksaccounted for 16.9% of the total market turnover comparedto 17.5% in 2016 which indicates that large-cap stocksupheld there position in market demand in terms of turnovervalue. Looking at the price return of the top turnovergenerating companies, diverse patterns could be found.Stocks like LANKABAFIN, CITYBANK, IFADAUTO gaveprice returns in line with strong earning growths. The yearalso saw high amounts of event driven turnover, CITYBANKand BRACBANK for example.
Source: LBSL Research
Note: Annual Returns for newly listed stocks have been calculated based on the closing price of the first trading day

Foreign Turnover in 2017Foreign turnover increased by 25.3%
Net investment for the year stood at USD 207.92 mnForeign Investment focused in Pharmaceuticals, Food & Allied and Bank sectors

Bangladesh capital market review 2017
Foreign turnover increased by 25.3%
Source: DSE, LBSL Research
Source: DSE, LBSL Research
• For the fifth consecutive year, 2017 brought to Bangladesh the highest amount of foreigntrade in history. Total foreign turnover stood at USD 1,396.05 mn in 2017 registering 25.3%growth YoY. The growth was even higher in BDT terms(30.5%). The increased turnover cameequally from from increased foreign buys and sells, with total buy in foreign holdingsincreasing by 24.9% YoY compared to a 25.9% increase in total sells.
• Total buy and sell by the foreign investors hit the all time highs in 2016. As well taking freshpositions, there was some profit taking too as the bullish market saw a lot of the large capstocks give a significant price return..
• In 2017, net foreign investment saw a good 22.1% YOY increase, from USD 170.3mn to USD207.9mn. The increase is largely due to high level of activity and price return among the largecap, good fundamental stocks during the year. In the historical context, fresh foreign fund flowwas at a moderate level as overall net investment is still lower compared to 2013 and 2014.
• Turnover from foreign sources amounted to 5.3% of the total market turnover in 2017,dippngby ~300bps from the 2016 figure, 7.4%. Foreign turnover contribution in the total marketturnover increased between 2010 and 2016, as market turnover levels remained mostly staticand foreign turnover improved. 2017 saw turnover levels increase by ~75% amidst bullishmarket sentiment. The degree of increase in foreign turnover was lower than the increase inoverall market turnover and so, the foreign turnover share decreased.
Source: DSE, LBSL Research
Table : DSE Foreign Trade Statistics
Particulars 2010 2011 2012 2013 2014 2015 2016 2017
Buy(USD mn) 151.6 153.8 165.6 341.4 587.6 485.7 642.2 802.0
Sell(USD mn) 246.7 143.9 68.2 91.3 248.3 462.1 472.0 594.1
Total(USD mn) 398.3 297.7 233.8 432.7 835.9 947.8 1114.2 1396.1
Net(USD mn) -95.1 9.9 97.4 250.1 339.3 23.6 170.3 207.9
Market PE 29.2 13.7 12.1 15.1 17.8 14.9 15.4 16.9
-34
-95
10
97
250
339
24
170208
-
5
10
15
20
25
30
35
-150
-100
-50
0
50
100
150
200
250
300
350
400
2009 2010 2011 2012 2013 2014 2015 2016 2017
Chart : Foreign Net Position Vs. Market PE
Net Foreign Turnover (USD Mn) Market P/E (RHS)
433
836 948
1,114
1,396
0.9% 0.7%
1.6%1.9%
3.5%
5.6%
7.2% 7.4%
5.3%
-
200
400
600
800
1,000
1,200
1,400
1,600
0.0%
1.0%
2.0%
3.0%
4.0%
5.0%
6.0%
7.0%
8.0%
2009 2010 2011 2012 2013 2014 2015 2016 2017
Chart: Foregn Turnover in Bangladesh (USD mn)
Total Foreign Turnover (USD Mn)
Total Foreign Turnover to Market Total Turnover

Bangladesh capital market review 2017
Foreign investments focused in large-cap stocks from Pharma, Food & Allied, Bank sectors
Source: DSE, LBSL Research
Note: All figures based on latest available shareholding pattern ( November 30) and market capitalization data (December 28)
• Total foreign exposure in Bangladesh equity market stands at BDT 163,363.93 mn, accounting for 7.4% of the market capitalization.
• In terms of sector exposure, the largest amount of foreign investment are seen in stocks from the Pharmaceuticals and Chemicals sector with BDT 82.11 bilion worth of foreign holding. ~30%of total foreign exposure can be seen in this sector. SQURPHARMA, RENATA and BXPHARMA occupy three of the top seven spots in terms of stocks with largest foreign investment,indicating foreign interest in established pharma manufacturers. Banks and Food & Allied are the two next largest sectors attracting foreign investment. Among the large cap sectors, Banksector saw its foreign holdings go up by ~380bp, and pharmaceuticals by ~290bps.
• Adjusting for size, the most lucrative sector for foreign investment in Bangladesh capital market seems to be the Food & Allied sector. Foreign investors hold 19.7% of the sector’s total marketcap and 50.6% of the sector’s free float. High foreign ownership in OLYMPIC and BATBC mostly accounts for the large investments. BRACBANK has the largest foreign ownership of freefloat shares, with 72.3% of the free float being owned by foreign investors. BRACBANK also accounts for more than 70% of foreign holdings in the Bank sector.
• Looking at most preferred stocks for foreign investment, we see mostly large-cap stocks. An abundance of manufacturing stocks can also be observed.
Table :Stocks with largest foreign investment
Stock
Market Capitalization of
Foreign Holdings (BDT mn)
Foreign ownership
Foreign ownership in
Free Float
2017 pricereturn
1. SQURPHARMA 42,884.35 19.27% 29.39% 30.24%2. BRACBANK 37,220.95 40.15% 72.26% 103.57%3. BATBC 31,287.92 15.33% 57.96% 37.00%4. OLYMPIC 24,786.22 43.00% 60.50% -6.37%5. GP 22,250.24 3.50% 35.00% 65.72%6. BXPHARMA 17,781.67 42.24% 48.67% 28.47%7. RENATA 17,147.15 21.78% 44.59% 19.10%8. ISLAMIBANK 15,786.18 26.79% 48.38% 23.23%9. CITYBANK 7,179.90 15.41% 22.09% 95.59%10. DBH 6,820.97 41.16% 84.55% 33.07%11. BSRMLTD 5,803.32 27.37% 46.34% -14.83%12. IDLC 3,676.17 11.43% 26.37% 49.65%13. BEXIMCO 2,230.86 9.90% 12.40% 9.04%14. MARICO 2,142.79 6.15% 61.50% 19.81%15. MERCANBANK 1,674.28 8.58% 13.72% 74.83%16. SOUTHEASTB 1,414.76 6.95% 10.26% 18.72%17. SUMITPOWER 1,399.29 3.65% 8.41% -2.97%18. SINGERBD 1,290.96 8.61% 20.02% 1.56%19. ONEBANKLTD 1,243.97 7.10% 10.15% 44.26%20. NBL 1,100.13 3.57% 4.95% 52.94%
Source: DSE, LBSL Research
Table : Foreign Holdings in Different Sectors
Sector
Market Capitalization of
Foreign Holdings (BDT mn)
Total Market Capitalization
(BDT mn)
Foreign ownership
Foreign ownership in
Free Float
Pharmaceuticals 82,113.20 530,816.84 15.5% 27.3%Bank 72,172.21 747,217.60 9.7% 16.7%Food&Allied 56,305.95 285,606.62 19.7% 50.6%Telecommunication 22,591.98 652,723.01 3.5% 33.2%NBFI 12,565.98 251,022.74 5.0% 15.8%Engineering 8,408.39 207,831.88 4.0% 8.0%Fuel&Power 4,598.82 375,138.50 1.2% 3.9%Miscellaneous 3,317.50 94,925.50 3.5% 10.5%Textile 2,668.93 115,348.04 2.3% 4.1%Cement 1,374.00 138,562.96 1.0% 2.5%ITSector 860.74 16,370.21 5.3% 8.0%Travel&Leisure 769.44 25,106.15 3.1% 5.8%Gen. Insurance 432.53 42,668.96 1.0% 1.8%Tannery 329.20 27,595.98 1.2% 2.6%Service&RealEstate 300.33 17,681.00 1.7% 3.4%MutualFund 208.05 42,724.97 0.5% 0.6%Life Insurance 138.27 50,632.70 0.3% 0.5%Ceramic 27.78 28,691.72 0.1% 0.3%Jute - 1,959.69 0.0% 0.0%Paper&Printing - 1,938.75 0.0% 0.0%

Primary Market Performance 20179 new securities got listed with total offer size of BDT 3192.50 mn
Only one stock listed through book building process73.2% of the fund raised to be spent on BMRE and other operating activities
Newly listed companies performed poorly in the market after opening high

Bangladesh capital market review 2017
9 new securities got listed with total offer size ofBDT 3,192.50 mn
Source: DSE, LBSL Research
Source: DSE, LBSL Research
The amount of equity raised through IPOs in 2017 has reduced by almost 65% compared to 2016. Thissubstantial reduction is due to the introduction of new regulations for the book building method whichrequires a company to go through a comparatively lengthy process in order to issues shares with apremium. This figure is expected to pick up in the next year as some companies are already going throughthe book building process which is scheduled to finish by next year.
IPO shares return on the first trading day has increased considerably to 272.3% which is higher than thetotal of the previous three years. Engineering sector mostly contributed to this return. The weightedaverage return (calculated from the offer price of IPO and the first trading day’s closing price) was 70.4%,78.1% and 118.0% in 2016, 2015 and 2014 consecutively. Source: DSE, LBSL Research
19,914.2
11,866.7 10,534.0 9,893.7 10,374.7
9,093.7
3,192.5
0
5,000
10,000
15,000
20,000
25,000
2011 2012 2013 2014 2015 2016 2017
Chart: Total Amount Raised through IPO (BDT mn)Table: Companies listed in 2017
Company SectorPublic Offer Size
(BDT mn)
Nahee Aluminum Composite Panel Ltd. (NAHEEACP) Engineering 150.00
Oimex Electrode Limited (OIMEX) Engineering 150.00
ICB AMCL First Agrani Bank Mutual Fund (ICBAGRANI1) Mutual Fund 500.00
BBS Cables Limited (BBSCABLES) Engineering 200.00
Nurani Dyeing & Sweater Limited (NURANI) Textile 430.00
Shepherd Industries Limited (SHEPHERD) Textile 200.00
SEML IBBL Shariah Fund (SEMLIBBLSF) Mutual Fund 250.00
Pacific Denims Limited (PDL) Textile 750.00
Aamra Networks Limited IT 562.50
Total money raised from IPO 3192.50
118.0%78.1% 70.4%
272.3%
0%
50%
100%
150%
200%
250%
300%
2014 2015 2016 2017
Chart: Weighted Avg. 1st Day Return of IPO Stocks
Note: Weights have been assigned based on public offer size

Bangladesh capital market review 2017
73.2% of the fund raised to be spent on BMRE and other operating activities
Source: DSE, LBSL Research
Source: DSE, LBSL Research
A total of BDT 3192.40 mn was raised through IPO by 9 companies of which BDT 728.39 mn (22.8%) was scheduled to repaydebts, mostly long term loans. Another BDT 1585.51 mn was scheduled for different capital projects of which 19.1% (BDT611.03 mn) was to be used to buy new plant and machineries and BDT 974.48 mn was to be used for expansion projectsprimarily for building new premises.
IPO expenses were 4% (BDT 128.61 mn) of the total proceeds.
In 2016 only 2.5% of the fund was planned to be used to repay loans whereas the figure rose to 22.8% in 2017
Textile sector has raised the most funds in 2017. Pacific Denim Ltd itself raised almost 23% of the total. Companies of thissector planned to use most of the fund for expansion projects.
Two mutual funds ICB AMCL First Agrani Bank Mutual Fund (ICBAGRANI1) and SEML IBBL Shariah Fund (SEMLIBBLSF)raised in total of BDT 750 mn (23.5% of the total fund raised).
Aamra Networks Limited is the only company which issued shares with premium through book building method. It raised17.3% of the total fund raised and has planned to use 61.7% of the fund to develop different IT expansion projects.
Expansion & Others54%Loan
Repayment23%
Plant & Machinery Acquisition
19%
IPO Expenses
4%
Chart: Usage of IPO FundsTable: IPO Proceeds Usage 2017 (BDT mn)Sector Loan Repayment Plant & Machinery
AcquisitionExpansion & Other IPO Expenses Total
Engineering 130.00 270.76 54.61 44.63 500.00
IT 185.92 0.00 346.87 29.70 562.50
Mutual Fund 0.00 0.00 750.00 0.00 750.00
Textile 412.46 340.27 572.99 54.28 1380.00
Total 728.39 611.03 1724.48 128.61 3192.50

Bangladesh capital market review 2017
Newly listed companies performed poorly after opening high
In 2017, a total of 9 companies came to the market. Among them,only 1 company offered premium to their par value and theremaining 8 companies offered par value to get listed in thesecondary market. On the other hand, in 2016, 11 companies gotlisted among which 9 companies offered premium to their par valueand 2 companies offered par value for getting listed in thesecondary market.
Source: DSE & LBSL Research
Source: DSE & LBSL Research
Note: Return till year end has been calculated based on the closing price of the first trading day*Cut off price has been used to calculate the first day return of Aamra Network Limited
9
5
9 8
8
9 2
1
0
2
4
6
8
10
12
14
16
18
2014 2015 2016 2017
Chart: Par vs. Premium Issue
Par Premium
Table: Price return of IPO 2017
Company 1st day return Return till year end
Nahee Aluminum Composite Panel Ltd. (NAHEEACP) 796.7% -10.0%
Oimex Electrode Limited (OIMEX) 1042.0% -42.9%
ICB AMCL First Agrani Bank Mutual Fund (ICBAGRANI1) -11.0% -9.0%
BBS Cables Limited (BBSCABLES) 803.0% 34.6%
Nurani Dyeing & Sweater Limited (NURANI) 108.0% -1.1%
Shepherd Industries Limited (SHEPHERD) 382.7%-41.0%
SEML IBBL Shariah Fund (SEMLIBBLSF) 28.0%-42.2%
Pacific Denims Limited (PDL) 220.0% -31.1%
Aamra Networks Limited* 254.9% -29.4%
Price Return
Engineering sector gave the most return on the first day of the trading followed by Textile while one mutualfund gave negative return. Despite having a greatly increased first trading day return of 272.3% in 2017compared to only 70.4% in 2016, IPO shares performed poorly by providing a weighted average return inthe year end of -20.2% compared to -12.4% in 2016. Only one stock (BBS Cables Limited) maintained apositive position till the year end.

Peer market review 2017Regional peer indexes gave mostly positive return in 2017, but in varying degrees
Frontier peers’ performance consistent with positive year for Asian EquitiesBangladesh capital market gave middle-of-the-park returns with valuations at the peers’ average level

Bangladesh capital market review 2017
Regional peer indexes gave mixed returns in 2017
Source: Bloomberg, LBSL Research
2.3%
39.9%
24.0%
35.9%
-9.3%
Sri Lanka Vietnam Bangladesh India Pakistan
Chart: Index Return in peer markets
Source: Bloomberg, LBSL Research
Table: Peer Market Performance
Dec‘16 Dec‘17
Particulars Country Index P/E P/B D/YIndex
return in 2016
Index P/E P/B D/YIndex
return in 2017
S&P BSE 500 Index India 11,036.44 23.12 2.39 1.4% 3.8% 15,002.73 27.02 3.00 1.1% 35.9%
KSE All Share Index Pakistan 32,842.43 15.71 2.41 3.6% 43.2% 29,774.24 11.42 1.98 4.6% -9.3%
Ho Chi Minh Stock Index Vietnam 664.87 15.91 1.97 3.0% 14.8% 930.17 17.05 2.21 2.1% 39.9%
CSE All Share Index Sri Lanka 6,228.26 11.80 1.35 3.0% -9.7% 6369.26 10.53 1.28 3.2% 2.3%
DSEX Index Bangladesh 5,036.05 15.38 2.00 3.0% 8.8% 6,244.52 16.92 2.46 3.1% 24.0%

closed end mutual funds 2017Closed end funds (CEFs) under-performed the benchmark index by 1.4% in 2017
CEFs traded at 35% discount; only one fund traded at premiumTotal cash dividend distributed by CEFs in 2017 stood at BDT 2,278.14 mn, 30.8% higher than that in 2016
Dividend yield for closed end funds was a healthy 5.36% at 2017 end

Bangladesh capital market review 2017
Closed End Funds’ (CEFs) NAV increased by 22.6%
Source: DSE, LBSL Research
Source: DSE, LBSL Research
Performance of Fund Managers in 2017
• Closed end funds registered a portfolio gain of 22.6% in 2017 whereas broad market gave return of 24.0%.
The industry under-performed the benchmark return this year.
• Among the fund managers, VIPB was the top performer in terms of portfolio return as NAV of funds
managed by VIPB increased by 31.9%. The second performer was AIMS, achieving portfolio return of
26.1%, followed by ATC 25.8%, RACE 25.3%, LR GLOBAL 20.4%, VANGUARD 18.5%, ICB AMCL 16.3%,
CAPM 10.0% and SEML 6.6%.
• Among the asset managers, top asset manager in terms of Assets Under Management (AUM) is RACE,
having 51.0% market share in the industry, followed by LR GLOBAL, ICB AMCL, AIMS, VANGUARD, VIPB,
ATC, SEML and CAPM.
• VIPB, AIMS, ATC and RACE had beaten the market by 7.9%, 2.1%, 1.8%, and 1.3% respectively. Whereas,
LR GLOBAL, VANGUARD, ICB AMCL, CAPM and SEML under-performed by 3.6%, 5.5%, 7.7%, 14.0%,
and 17.4%.
• One fund of ICB AMCL was liquidated this year.
Source: DSE, LBSL Research
Table : Overall Performance of the CEFs
Particulars Dec-16 Dec-17 Change
NAV of CEFs (BDT mn) 55,800.18 68,402.94 22.6%
DSEX (Broad Market) 5,036.05 6,244.52 24.0%
Price to NAV of all CEFs 0.67 0.65 -3.5%
Note:
*To calculate the portfolio return of funds (and asset managers), the year end net asset value of funds are adjusted for cash dividend .
* Beginning NAV of newly added funds have been considered in industry NAV of 2016 to calculate the industry return.
* The funds which have been liquidated during 2017 have been deducted from total NAV of CEFs in 2016 as well.
Table: Fund Managers’ Performance
AMCPortfolio
ReturnOver/ (Under) performance
VIPB 31.9% 7.9%AIMS 26.1% 2.1%ATC 25.8% 1.8%RACE 25.3% 1.3%LR GLOBAL 20.4% -3.6%VANGUARD 18.5% -5.5%ICB AMCL 16.3% -7.7%CAPM 10.0% -14.0%SEML 6.6% -17.4%
RACE51.0%
LR GLOBAL16.5%
ICB AMCL12.2%
AIMS6.9%
VANGUARD5.1%
VIPB3.8%
ATC1.3%
SEML2.3%
CAPM0.8%
Chart: Market Share of Closed End Funds in 2017

Bangladesh capital market review 2017
Total cash dividend distributed is BDT 2,278.14 mn
Source: DSE, LBSL Research
Source: DSE, LBSL Research
Chart : Portfolio Return of Mutual Funds in 2017
Source: DSE, LBSL Research
Table: Total Cash Dividends Paid by AMCs 2017
AMC Dividend in 2017 (BDT mn)
RACE 636.34
ICB AMCL 513.75
LR GLOBAL 377.64
AIMS 265.16
VIPB 210.21
VANGUARD 104.32
ATC 95.77
SEML 74.95
CAPM 10.03
Total 2,278.14
Table : Cash Dividends Declared by Mutual Funds in 2017
Fund nameCash Dividend Per
Share (BDT)Dividend
Yield
ATCSLGF 1.55 12.9%NLI1STMF 1.50 9.9%SEBL1STMF 1.35 9.5%ICB2NDNRB 1.20 11.3%GRAMEENS2 1.10 7.1%RELIANCE1 1.00 9.1%SEMLLECMF 1.00 13.3%VAMLBDMF1 1.00 10.5%IFILISLMF1 0.90 12.0%LRGLOBMF1 0.78 9.4%ICBSONALI1 0.75 8.9%PRIME1ICBA 0.70 9.5%ICBEPMF1S1 0.65 9.2%ICBAMCL2ND 0.60 7.3%DBH1STMF 0.50 5.3%GREENDELMF 0.50 5.4%ICB3RDNRB 0.50 7.8%PF1STMF 0.50 7.1%POPULAR1MF 0.35 5.6%ABB1STMF 0.30 4.5%PHPMF1 0.25 3.9%SEMLIBBLSF 0.25 3.4%1JANATAMF 0.20 3.1%CAPMBDBLMF 0.20 2.5%EBL1STMF 0.20 2.1%EBLNRBMF 0.20 3.0%EXIM1STMF 0.20 2.9%FBFIF 0.20 3.5%IFIC1STMF 0.20 3.3%TRUSTB1MF 0.20 3.0%
1STPRIMFMF, AIBL1STIMF, ICBAGRANI1, MBL1STMF,NCCBLMF1, VAMLRBBF did not announce any cashdividend during 2017
-4.1%
2.7%
7.7%
10.0%
14.0%
14.3%
14.4%
14.6%
16.7%
17.2%
18.3%
18.4%
19.5%
21.0%
21.1%
22.0%
22.2%
22.3%
23.0%
23.1%
24.3%
24.5%
24.6%
25.4%
25.8%
25.8%
26.0%
26.1%
26.1%
26.7%
27.0%
27.1%
27.8%
28.9%
31.7%
32.2%
ICBAGRANI1
SEMLIBBLSF
AIBL1STIMF
CAPMBDBLMF
IFILISLMF1
1STPRIMFMF
SEMLLECMF
VAMLBDMF1
MBL1STMF
ICBEPMF1S1
ICB3RDNRB
NCCBLMF1
PF1STMF
ICBSONALI1
VAMLRBBF
ICB2NDNRB
FBFIF
RELIANCE1
LRGLOBMF1
ICBAMCL2ND
GREENDELMF
1JANATAMF
DBH1STMF
PRIME1ICBA
IFIC1STMF
ATCSLGF
EBL1STMF
EBLNRBMF
ABB1STMF
POPULAR1MF
TRUSTB1MF
GRAMEENS2
PHPMF1
EXIM1STMF
SEBL1STMF
NLI1STMF

Bangladesh capital market review 2017
Closed End Funds traded at 35% discount
Chart : Price to NAV Ratio of Closed End Mutual Funds
Source: DSE, LBSL Research
Source: DSE, LBSL Research
• Among the 36 closed end funds, only one fund were trading at a premium and all otherfunds were trading at discount. The industry’s current price to NAV ratio stands at 0.65which means the closed end funds of Bangladesh is being traded at 35% discount to itsNAV. So, the industry exhibits undervaluation relative to its asset value which is attractive forthe value investors. The top five most discounted funds in this industry are trading on anaverage 49% discount to their NAV.
• The top five discounted funds relative to their NAV had under-performed the benchmarkindex in terms of return. Of the top five most discounted funds, POPULAR1MF exhibited thehighest portfolio return (26.7%) with a price to NAV ratio of 0.52.
• Among the AMCs, RACE’s Price to NAV is poor regardless of being the highest dividenddistributer of the year.
Table : Analysis of Top Five Discounted Mutual Funds
Top 5 Discounted Price/Nav Dec’17 Portfolio Return Asset Manager
FBFIF 0.47 22.2% RACEIFIC1STMF 0.51 25.8% RACEPOPULAR1MF 0.52 26.7% RACEABB1STMF 0.52 26.1% RACE1JANATAMF 0.53 24.5% RACE
1.16
0.88
0.88
0.87
0.86
0.82
0.81
0.81
0.79
0.78
0.78
0.78
0.77
0.77
0.77
0.77
0.76
0.75
0.75
0.73
0.73
0.72
0.72
0.71
0.70
0.70
0.68
0.55
0.55
0.54
0.54
0.53
0.52
0.52
1STPRIMFMF
ICB2NDNRB
SEBL1STMF
NLI1STMF
ATCSLGF
ICBSONALI1
ICBEPMF1S1
EBL1STMF
ICBAMCL2ND
VAMLBDMF1
ICBAGRANI1
GRAMEENS2
PRIME1ICBA
RELIANCE1
PF1STMF
VAMLRBBF
IFILISLMF1
DBH1STMF
CAPMBDBLMF
ICB3RDNRB
GREENDELMF
SEMLIBBLSF
MBL1STMF
SEMLLECMF
NCCBLMF1
LRGLOBMF1
AIBL1STIMF
EBLNRBMF
EXIM1STMF
PHPMF1
TRUSTB1MF
1JANATAMF
ABB1STMF
POPULAR1MF

Regulatory Changes 2017

Bangladesh capital market review 2017
Regulatory Changes Changes in eligibility criteria for raising fund from capital market
Under the fixed price method, listing companies would require net profit after tax and positivenet operating cash flow in the immediate preceding one year instead of the net profit andpositive cash flow in the immediate preceding three years. Profit and cash flow requirements forcompanies listing under book building process have been left unchanged. There have alsobeen changes in paid-up capital and IPO offer size requirements for potential listings.
For companies listing under fixed price method, offer size will have to be at least an amountequivalent to 10% (ten percent) of its paid-up capital (including intended offer) or BDT 150million at par value, whichever is higher with pre-IPO paid up capital of BDT 150 million. Forcompanies listing under book building method, offer size will have to be BDT 500 million alongwith pre-IPO paid-up capital of BDT 300 million.
Banking Companies (Amendment) Act-2017
Major changes to the Bank Company Act 1991 has been approved by the cabinet committeealthough they have not yet been formally made into law. Two major amendments of the act dealwith directors’ tenure and number of directors allowed from same family. Firstly, up to fourmembers of a family may be appointed as board of directors for a bank, while the law currentlypermits only two members from one family. Secondly, the tenure of the board of directors of aprivate bank has been extended from six years to nine years. Also, elected chairman,directors and the managing director of a private bank will require the consent of BangladeshBank prior to assuming office. In the current law they have to seek permission from BangladeshBank before participating in the election.
Trading facility on negative equity accounts extended till 2018
Curently, brokerage houses enjoys the suppression of a provision that bars share transaction ofthe portfolios suffering from negative equity problem. The facility has been extended tillDecember 2018. The brokerage houses with margin loan exposures will have to submit workplan on quarterly basis (within one week after the completion of each quarter) to handlenegative equity accounts and to ensure compliance with the Margin Rule, 1999 by December31, 2018. The stock bourses will also have to submit a consolidated summary statement on thebrokerage houses’ work plan and on the quarterly progress report within two weeks aftergetting reports from the stockbrokers.
Cap decreased for Eligible Investors in bidding under book building method
Eligible investors would be allowed to offer highest 2% of a company’s total instead of existingprovision that allows an entity to offer highest 10%. The rule change has been implemented tocurb syndication of IPO cut-off price under book-building method as previously only 10 bids ofeligible institutional investors could exhaust full offer size of an entity.
Changes in Market makers’ capital requirements
The minimum capital requirement for becoming a market maker has been lowered to BDT 100million from BDT 500 million. A market marker with a paid-up capital only BDT 100 million cantengange in market making for only one listed securities. An entity with BDT 500 million capitalwould be allowed to act as market marker for three authorized securities. An entity would beallowed to be market maker for highest five authorized securities at a time.
A market maker has also been allowed to make highest 20% short selling of its total sales on aparticular securities in a day. For short selling, the sale prices cannot be less than the bestcurrent asking price on the exchange.
Regulations for bond and debenture investment tightened
Bangladesh Bank lowered the investment limit in a single company’s bond or debenture by half,in a move to reduce the banks’ risky investments. The reduced limit of investment is 5% againstcurrent 10% from the banks’ total amount of paid-up capital, share premium, statutory reservesand retained earnings. Also, Bangladesh Securities and Exchange Commission will have toapprove the bond or debenture investment. The sub-debt instruments of banks and companieswill not be counted in the 5% limit.
Stricter requirements introduced for changing IPO/right share proceeds utilization plan
Instead of getting approval from the company’s sponsors/directors, a company has to gainapproval from the majority shareholders (51% or more) before changing the previouslydisclosed plan of IPO or, right shares proceed utilization plan. After gaining majorityshareholder approval, companies will have to take approval from the Bangladesh Securitiesand Exchange Commission. The company will also have to publish the decision of changinguse of proceeds as price sensitive information with detailed description and reasons for suchdecision.
Restrictions lifted for Eligible Investors holding Closed-end Mutual Fund shares
While floating a mutual fund, none of the institutional investors were allowed to hold more than10 per cent stake of a mutual fund from the allocated shares for the eligible investors. Underthe latest decision, the regulator would not impose any such condition that would limitinstitutional investors’ holding of securities in a mutual fund, meaning an institutional investorwould get chance to hold entire securities of a mutual fund which would be allocated for all theeligible investors.

Bangladesh capital market review 2017
Regulatory Changes Guideline Issued for Agent Banking
Bangladesh Bank (BB) issued a new guideline titled “Prudential Guidelines for Agent BankingOperation in Bangladesh”. Banks intending to start agent banking operation shall conduct aprior study and shall apply for approval to Banking Regulation and Policy Department (BRPD),Bangladesh Bank. Banks will have to outline activities which can be carried out by an agent aswell as provide a framework for offering branchless banking services and serve as a set ofminimum standards of data and network security, customer protection and risk management tobe adhered to the branchless banking services. Also, banks having license for Islamic Shariahbased banking services will be allowed to provide Islamic Shariah based banking servicesthrough their agent network.
Central bank sets service charges for CMSME loans
The central bank issued a circular to all banks asking them not to impose any early settlementfees on the clients’ cottage, micro, small and medium enterprise (CMSME) sector. BangladeshBank also set a BDT 200 limit for the loan application fee. The banks will have to imposedocumentation fee, CIB charge, legal and valuation fee, and stamp charge on the clients in linewith their (banks) actual spending. The banks will not be allowed to impose any other chargeson the CMSME entrepreneurs.
Credit card, consumer loan limits increased
Bangladesh Bank has doubled the credit card limit and extended the personal loan ceiling.Banks can now disburse up to BDT 1 million, up from BDT 500,000, in loans against unsecuredlimits on credit card. Banks will be allowed to disburse up to BDT 2.5 million in loans undercredit card schemes, provided the amount in excess of BDT 1 million is secured against liquidsecurities.
Banks can give up to BDT 500,000, up from the previous BDT 300,000 in loans without anysecurities. Against liquid securities, the ceiling for personal loans, including those forpurchasing consumer durables has been increased to BDT 2 million from BDT 1 million.
Credit Card interest rate decreased
The central bank has directed commercial banks not to charge more than 5 percent on top ofthe highest interest rate of a consumer loan for credit card use. It’s estimated that on averageinterest rate for credit cards would come down to around 20 percent as consequence of thenew regulation compared to 30 percent plus figure previously.
Provisioning requirement decreased for credit card loans, short term agricultural andmicro credit
The banks will now need to maintain 2 percent general provisioning against all unclassifiedcredit card loans under consumer financing, down from 5 percent previously. Also, short termagricultural and micro credit loans will now require 1 percent provisions compared to the 2.5percent requirements beforehand.
Deadline extended for bourses to find strategic investors
Bangladesh Securities and Exchange Commission has extended time for the two stockexchanges till March 2018 to find strategic investors as the bourses could not pick suchinvestors within the initially established timeframe of December 2017.
MNC fund-raising regulations relaxed
Foreign companies operating in Bangladesh would be allowed to collect long-term fund fromlocal banks, corporate groups, non-bank financial institutions and individuals by issuing takabond without taking prior approval from the central bank. Previously, taking prior approval fromcentral bank was mandatory before collecting long-term financing.

Capital market outlook 2018

Bangladesh capital market review 2017
7.2%
9.9%
6.7%7.3%
8.8%
10.6%
7.7%
6.8%7.4%
6.4%5.9%
5.4% 5.6%
FY07 FY08 FY09 FY10 FY11 FY12 FY13 FY14 FY15 FY16 FY17 Oct'17
Chart: Infation (12 months avg.)
Old Base New Base
Economic Outlook Bangladesh achieved the highest GDP growth rate in the South Asian region in 2017, and one of the highest GDP growth rates among major economies in the world. Bangladesh achieved
GDP growth rate of 7.28% for FY17, beating the target of 7.2%. Average GDP growth rate for the past 10 years now stands at 6.26%. The government has set a GDP growth target of7.40% for the 2018 fiscal year, which is achievable given the stable political climate, investments in power and transport infrastructure and the high private sector credit growth rates. Givencurrent trends, GDP growth is likely to cross 8% in a few years.
Inflation was kept under control until the end of 2016, reaching a low of 5.04% in December, before massive floods caused a loss of the import Boro rice crop in the fertile northern regions.This caused food inflation to spike up sharply from the start of 2017, which was countered by the government repealing import duties on rice and undertaking efforts to import rice fromabroad. These steps managed to stem the spike in inflation, stabilizing it around the 6% level. The inflation level is still higher than the MPS target of 5.5%. There is a likelihood of oil pricesrising in the international market due to strong global economic growth, and this could lead to higher non-food inflation. However, once subsequent rice crops are harvested, food inflation isexpected to come back down.
We project export growth to pick up from the current level of 1.8%. Export growth suffered due to a number of reasons, including work stoppages due to factory relocation and remediationwork in textile factories after the Rana plaza disaster. Since the remediation work is almost over, and the BDT has depreciated against the USD, the time is ripe for a reversal of the decliningexport trend. Remittances continued the declining trend since 2015 fiscal year, declined 14% in FY17 due to a combination of poor economic conditions in the Middle East and usage ofinformal channels (hundi) by workers to send back remittances due to stringent AML/CFT compliance by financial institutions. New overseas employment, however, has continued to grow,with the 2017 growth standing at 10% over the previous fiscal year. The increased number of overseas workers, combined with a possible turnaround in oil prices could lead to remittancesbouncing back.
The current account balance went into deficit in FY17, finishing at a level of -1.48 bn USD against ta surplus of 3.7 bn USD in FY16. The current account deficit was a result of strong growthof imports coupled with a very weak growth in exports and a continuing slide in remittances. Going forward, we expect export growth to pick up and current account deficit to start to reversedirection.
The forex reserves hit a record 33.5 bn USD at the end of FY17. This is enough to meet 8.95 months of import bills. The current account deficit will pose a challenge in further growth of theforeign exchange reserve, since Bangladesh Bank will have to defend the BDT exchange rate using its reserves to try to stem its depreciation. We project that the foreign exchange reservesshall decline until the current account deficit is reversed. Due to the record current account deficit, we expect the BDT to continue to depreciate until such a time as exports pick up and thecurrent account deficit stabilizes. The depreciation of the BDT is expected to spur export growth.
FDI inflows reached a record level of USD 2.2 bn in 2016. A third line of credit worth USD 4.5 bn was signed with India, following two earlier lines worth USD 1 bn and 2 bn. Bangladesh isalso planning to increase power imports from 660MW to 1,500MW. Deals worth USD 24.5 bn were signed with China in 2017 during the visit of the Chinese PM Xi Jinping. Along with astable political outlook, these developments are expected to usher in a new era in FDI inflows in Bangladesh.
Huge public spending on infrastructure along with record levels of private sector credit growth, coupled with increased inflation is likely to cause interest rates to stop their declining trend andconsolidate before possibly reversing direction.
27
7.06%
6.01%
5.05%
5.57%
6.46%6.52%
6.01%6.06%
6.55%
7.11%7.28%
4.00%
4.50%
5.00%
5.50%
6.00%
6.50%
7.00%
7.50%
FY07 FY09 FY11 FY13 FY15 FY17
Chart: Real GDP Growth
Real GDP growth 10yr Average
0
3000
6000
9000
12000
15000
18000
0%
10%
20%
30%
40%
50%
FY07 FY08 FY09 FY10 FY11 FY12 FY13 FY14 FY15 FY16 FY17
Chart: External Sector
Remittance (USD mn, RHS) Import (FOB) Growth Export Growth

Bangladesh capital market review 2017
• Bangladesh Stock Market Passed a stellar 2017. The index rally that started in November 2016 has lasted more or less twelve months with a few peaks and troughs in the middle, overallmoving in the anticipated upward trajectory. A year with a strong index return was overdue tor the Bangladeshi equities as the broad index return had been disappointing before this year,despite decent profit growth particularly from the large-cap stocks. The rally has been primarily powered by financial stocks, banks in particular. A multitude of factors have contributed in thesustained investor interest in the financial stocks: undervalued status in the earlier phases of the rally, strong private sector credit growth and investment income delivering handsome profitgrowths, Bank company act‘s four directors from same family (in place of two) amendment causing elevated interest from potential directors and a few local business groups taking interest inbank ownership. Selective large-cap stocks from non-financial sectors also gave healthy price returns as the overall multiple levels of the market underwent some upward revisions and a lot ofgains made in the financial stocks were stored in to these dependable, non-cyclic stocks.
• The rally has played out in two major phases: the carryover from last year which eventually saw some correction and consolidation around ~5,300-5,400 levels and the sustained rallybeginning in late June and lasting till late September taking the index to ~6200 levels. The year closed with index at ~6,250 levels and 24% annual index return. Average turnover for the yearwas BDT 8.76 billion (~USD 106 million). The expectation for 2018 is moderate index return, with manufacturing stocks like pharma and FMCG coming to the forefront. Valuation wise banksare no longer massively undervalued, with trailing P/E of 10.26x and P/B of 1.40x. We expect stronger performance from the banks which have made strides in terms of asset quality andensuring good governance.
• Overall interest rates have been on a downtrend since the 4th Quarter of 2012 and by the mid 2017, rates have come down to historical low levels. The weighted average bank deposit rate asof Jun’16 was 4.84%, which is well below inflation level. Banks’ lending rates have come down and persisted in the single digit. Call money rates declined to only 3.32% in Dec’17. Rates doseem to have reached the bottom with deposit rates seeing a small increase and rising to 4.89% in October’17. Healthy private sector credit growth has pushed the Advance-to-Deposits ratioof some banks close to regulatory threshold and overall demand for funds in the financial system appears to be growing. Consequently. both borrowing and lending rates may see someupward revision, but overall low interest climate is expected to persist with changes coming in small increments. We think the possibility of fresh fund flow into the capital market from theinstitutional investors is likely to continue in 2018. A few banks are close to their limits in terms of capital market exposure but most have room to inject new funds and overall balance sheetgrowth of the sector means a naturally increasing celling for capital market exposure.
• Private credit growth has picked up which is a boon for the banks and NBFIs but more importantly, it’s a prerequisite for sustainable economic growth. The Bangladeshis’ income level hasbeen rising steadily. Companies making and selling consumer goods have been benefiting from the demographic dividend and it’s expected to continue in 2017. The commodity upcycle in theglobal market, coupled with BDT devaluation against USD have put pressure import reliant, highly commoditized businesses like steel and cement. BDT stabilizing at a higher rate woulddecrease the pressure on these companies’ margins. Also, the new currency situation would also be conducive to export oriented industries like RMG and textile.
• Bangladesh stock market has been getting more and more attention from international investors who are looking for lucrative investment opportunities in the frontier markets. In 201, totalforeign turnover was USD 1,396.05 mn against USD 1,114.21 mn in 2016 recording 25.3% growth YoY. Our resilient economic growth, a good 2017, sustained healthy return from selectlarge-cap stocks, and historically stable currency will attract increased foreign portfolio investment (FPI) in the coming years. We are expecting that, foreign involvement in Bangladesh equitieswill remain significant, with sizable presence in large-cap, blue chip stocks
• Even after a year with 24% index return, Bangladesh stock market still offers quite attractive valuations with trailing P/E multiple of 16.92x and P/B multiple of 2.46x. Cash dividend yield at theend of 2017 was 3.06%. Moreover, we are expecting corporate profitability in major sectors like Pharma, Telco, Food & Allied, Bank, NBFI Fuel & Power, etc., which occupy ~80% of totalmarket capitalization. So, even if the market provides above average returns in the next 2-3 years horizon, the valuation level is unlikely to deviate to wildly from current levels.
28
Capital Market Outlook
*2016 number is year-end calculated P/E
0
5
10
15
20
25
30
35
40
45
50
4000
4500
5000
5500
6000
6500
Jan-
17
Jan-
17
Feb
-17
Mar
-17
Mar
-17
Apr
-17
May
-17
May
-17
Jun-
17
Jul-1
7
Jul-1
7
Aug
-17
Sep
-17
Oct
-17
Oct
-17
Nov
-17
Dec
-17
Dec
-17
DSEX in 2017
Turnover (BDT mn, RHS) DSEX Index0
2,000
4,000
6,000
8,000
10,000
12,000
14,000
16,000
18,000
2009 2010 2011 2012 2013 2014 2015 2016 2017
Chart : Daily Avg. Turnover (BDT mn)
25.7
29.2
13.712.115.1 15.7 14.9 15.4
16.9
0
5
10
15
20
25
30
35
2009 2010 2011 2012 2013 2014 2015 2016 2017
Chart: Market P/E

Bangladesh capital market review 2017
Banks
Bank is the integral part of our financial system. With 57scheduled banks in the country, majority of our financialactivities are carried out through banks. Still our bankpenetration rate is very low compared to the peers, whichindicates huge potential for future growth. Bangladesh in one ofthe fastest growing economies in the world with last 5 years’average real GDP growth of 6.59%. This growth momentum isexpected to continue for the next decade. This kind of sustainedgrowth must be backed by continuous investments. During2011-2016, loans and advances of the listed banks grew at15.3% CAGR. During FY’16, loans and advances grew by17.1% YoY against private sector credit growth of 15.7% YoYduring the same period. Due to political instability, a depressedinvestment scenario was present in the economy for the lastfew years. As a result, huge amount of excess liquidityaccumulated in the banking system (BDT 922 bn as of Sep’17).Market interest rates have fallen to very low level and areexpected to remain low in the coming years. The inflation levelhas also come down within a fairly comfortable range. This is avery investment friendly situation. After 3 subdued years,private credit growth picked up again in 2016. We can safelyexpect private credit growth to hover around 15% level duringthe next decade. As the biggest source of financing, banks willcapitalize on this growth potential. Profitability of the sector hasbeen low for the past three years. However, in 2016, profitabilityin the sector has shown some growth. ROE of listed banks in2016 was 12.68% which was 10.92% in 2015. The majorreason for such improvement is the growth in stock market.Capital market has passed a year of tremendous growth in2017, which is expected to improve Bank’s profitability evenfurther for FY’17. Also, increasing popularity in MFS and agentbanking is also going to play a key role in profitability growth ofthis sector.
The low interest rates are also expected to help in achievinghigher growth and better asset quality. Once the NPL problemis sorted out, the bank sector will surely get back to its feet. 30of the 57 banks are listed in the stock exchange. Valuation wisebanks are no longer massively undervalued, with trailing P/E of10.26x and P/B of 1.40x. We believe there is still lucrative returnpotential in most stocks in this sector in 2018. We expectstronger performance from the banks which are at acomparatively better position in terms of asset quality as well ascore business activities.
NBFI
Non-Banking Financial Institutions (NBFIs) are playing a crucialrole by providing additional financial services that cannot bealways provided by the banks. The NBFIs, with moremultifaceted products and services have taken their place in thecompetitive financial market to satisfy the changing demands ofcustomers. NBFIs also play an important role in the capitalmarket as well as in real estate sector of Bangladesh. NBFIs inBangladesh usually comes up with special products that cannotbe always provided by banks. Their agility in providing supportand specialization in specific business arenas allows them toreinforce business growth. However, due to recent economicdownturn and array of new banks driving in to the economy,NBFIs presently facing stiff competition. Average borrowing rateof the NBFIs stood at 8.33% (Aug-17) while lending rate 11.6%(Aug-17). The spread narrowed to 3.26% (Aug-17) which was3.99% just a year ago. Average spread of the banking industryduring the period stood at 4.53%. Banks had a key advantageover the NBFIs due to their access to low cost funding.Profitability of listed NBFIs depressed during the year due totighter money market scenario. ROA & ROE of listed NBFIswas down to 0.98% & 6.7% respectively (Sep-17) from 1.2% &8.2% (Dec-16). Net profit margin of the listed NBFIs stood at15.3% in first nine months of 2017 as against 16.7% in 2016 &25.5% in 2012. However, like the banking industry NBFIs arealso burdened with bad loans which is deteriorating profitabilityof the industry to a greater extent. As on 2016 NPL (%) of theNBFI industry stood at 9% which was 8.9% in 2015 & 5.3% in2014. Though the prime concern regards to asset quality wasmainly attributable to three listed NBFIs, the industry wassubdued with a substantial classified loan. The better part isprivate sector credit growth scenario is improving which mightimprovise NBFIs to expand their loan basket more. However,surge in the capital market contributed heavily in the totalincome for the NBFIs in 2017. NBFIs invested 136% of theirtotal equity as on Sep-17. Approximately 31% of their (listedNBFIs) total income was generated from capital marketoperations (Sep-17). The key index DSEX manifested a 22.8%YTD return in 2017. Any major plunge in the capital marketmight drive down the profitability of the NBFIs substantially.Despite the recent concern regarding few NBFIs asset qualityand head to head rivalry with banks, NBFIs with sound assetquality & better corporate governance practice substantiates aprospective investment destination.
Telecommunication
Cellular Telephone Service industry contains four playerscurrently: Grameenphone, Robi Axiata, Banglalink and thestate-owned Teletalk. The total revenue size in 2017 wasapproximately BDT 220 bn (USD 2.7bn). Currently, there is141.68mn subscribers with 86.0% voice penetration and 45.1%data penetration according to BTRC. Mobile data subscribersare increasing exponentially due to massive increase in use ofmobile internet at the retail level. The number of datasubscribers in Bangladesh increased by 44.5% since the end of2015. Introduction of 3G internet services back in 2012contributed significantly in the increasing usage and decreasingunit costs of mobile internet services. 4G spectrum allocationprocess is close to completion. It has been declared that 4Gspectrums will be handed over within February, 2018. Datarevenue has only started to come to fore as a significantrevenue source for the local telco operators. Even in 2013,only~2% of telcos’ total service revenues came from datarevenues. In 2016, the contribution was up to 12.5%. Althoughdata revenue is seeing rapid growth for telcos, there is stillmuch room to grow. Compared to peer countries, datarevenue’s contribution to overall service revenue is at the lowestlevels compared to other Asian countries. In Bangladesh, thecontribution is ~15% whereas more developed economies likeThailand and Malaysia sees 45-50% contribution from datarevenue. In 2017, Robi and Airtel merger was finalized. Airtelwas the fourth largest player in the segment. The Merger wasthe largest in the country’s history. Citycell, the first cellulartelephone service provider in the country’s history, wentbankrupt this year.
2017 saw Grameenphone pass an outstanding year in thecapital market, yielding 65% price return. The movement wasbacked up by strong increase in profitability powered by sharpincreases in data revenue and healthier subscriber growth. 4Grollout will be an important catalyst in ensuring growth of datarevenue contribution. The second largest player, Robi hadbegun the listing process but their merger has ceased thatprocess. The company would require two consecutive years ofprofits before listing so no progress in that regard is expected in2018. The business outlook for the mobile telecom serviceproviders remain positive over the next two to three years.
29
Industry Outlook

Bangladesh capital market review 2017
Pharmaceuticals
Pharmaceutical industry is one of the fastest growingmanufacturing sectors in Bangladesh with an annualaverage growth rate consistently in the high double digits.As of June 2017, the Bangladeshi pharma market sizestands at BDT 187.56bn (USD 2.28bn). The industrygrowth is largely derived from the growing local demand.Increasing health consciousness among the people, moreinvestment in healthcare infrastructures, shifting diseaseprofile to non-communicable, chronic diseases and positivedemographic changes are the major facilitators for theincreasing demand in this industry. Over the last ten years(2006-2016), the industry has grown at CAGR of 16.5%.Despite experiencing significant growth in the recent past,there is certainly room to grow still. Bangladeshpharmaceutical industry is still less penetrated as thehealthcare expenditure consists only 3.7% of GDP (in2013), whereas world average is 8.6%. Even thepopulation size and enhancing social indicators are cueingthat the future growth of the industry will continue atreasonably higher pace. Between FY06 and FY16, thenominal GDP grew at a 13.6% CAGR. The local pharmaindustry grew at a 13.5% CAGR between 2005 and 2015,fully capturing the economic growth. we expect pharmaindustry growth will outpace economic growth over theshort to medium term and industry will reach ~BDT 389bnin 2022, with a 14.0% CAGR.
Pharmaceuticals passed a significant year in 2017, both inthe capital market and in operational terms. Two moreUSFDA drug approvals were received. Exports began tomore than ten new market, including Canada. Exports inFY17 was BDT 89.17mn, showing 8.6% YOY growth.Although lower than previsou year, the growth number isstill formidable as overall export growth was only 1.7%. Interms of profitability, upwards movement in oil prices anddevaluation of BDT against USD could potentially put somepressure on margins. Established pharma players enjoyhigher than average pricing power, which is likely to offsetincreases in cost. Historically, margins have not slumpedduring adverse commodity or, currency situations and wedo not expect margins taking any significant hit during2018. Robust industry demand and high pricing powerunderpins our strongly positive views on the sector. Largepharma manufacturers have displayed strong growth inboth revenue and profitability in 2017, yet the price return
was not seen amongst all the large-cap manufacturers. Asa result, valuations of several large cap companies havereached attractive levels compared to historical trend andoverall market valuation levels.
Consumer Goods
Fast Moving Consumer Goods (FMCG) industry of Bangladeshreplicates its own characteristics – ‘fast moving’ in terms ofgrowth. According to AC Nielsen data, the annual size ofBangladesh FMCG industry is estimated to be at BDT 243 bnin 2016. Bangladesh has a growing middle and affluent class.Middle and affluent class population of Bangladesh isincreasing rapidly by an average 10.5% annually. FMCGsector has high penetration in urban areas due to highspending propensity of the residents. In last 5 years,population growth rate of the country hovered around 1.2%whereas urban population growth rate was around 3.5%. Theurban population growth rate is higher than that of India(2.4%), Myanmar (2.5%), China (2.8%), Vietnam (3.1%) andPakistan (3.3%). In addition to this, by the end of 2016, around61.1% of the population are estimated to be in the age range of15 to 64, which is the working age group of the population, asign that the income generation in the economy will be boostedin the coming years. Moreover, with the development of ruralareas, rural population is also expected to have greaterpurchasing power. As of 2017, the annual per capita incomestands at USD 1610, which was $1,466 in the last fiscal year,and has grown at 10.4% on average over the last ten years inUSD terms. The rising income levels of the nation’s populationis another sign of the growing purchasing power of thecountry’s large population
A closer look at important consumer goods segments listed inthe capital market reveals that segment wise outlook is quite inline with FMCG outlook. For biscuit industry, the brandedbiscuit industry is growing at 8 to 9% annually. Annual size ofthis industry in 2017 is estimated at BDT 39 bn which grew8.3% from last year with an estimated annual production of~400,000 MT products. We expect the industry to grow at 12-15% in next 5 years.Focusing on cigarettes, low end tobaccoproducts are losing market shares to branded cigarettes due togovernment pricing policies and continued migration from bidiand gul. The cigarette industry had marginal volume growthlast year as the consumers’ preference are moving from bidi tocigarette while the whole tobacco industry is facing a decline.This growth is being driven by the low segment cigarettesowing to increasing purchasing power, suitable demographicsand government’s policies against low end tobacco products.
Proceeding to the growing sector of locally produced orassembled consumer electronics, a significant consumptionshift towards locally produced or assembled electronic goodshas become evident in Bangladesh. With the rising incomelevel, the standard of living is leveling up causing purchases ofappliances that offer more convenience to life is on the rise aswell. Moreover, Bangladesh’s Household final expenditure, anindication of households’ extent of consumption was 69.1% ofits GDP in 2016, whereas it is 59.4% in India, 80.1% inPakistan, 64.4% in Vietnam, 55.0% in Malaysia and around58.03% in the overall world. Due to the supply of cheaper yetquality alternative products, the demand of locally produced orassembled consumer electronics and home appliances hasbeen increasing recently in our country.
Construction Materials
Infrastructure spending by the govt. has driven volumes evenas the real estate market has remained stagnant. However, theconstruction materials industry is unlikely to see buoyancy indemand unless real estate makes an unexpectedrecovery. This will be especially significant as 2018 will see anational election and private sector construction is likely to bedeferred from the resulting uncertainty. Thus the outlook forMS Electrodes remains positive but less so than 2017.
The decorative paint industry has grown between 8-10% in thelast five years and current market size is estimated to be BDT25bn. As the industry is reliant on petroleum derivatives as rawmaterials, margins are likely to reduce in the upcoming yearwith fuel prices surging in the international market. Meanwhile,rising per capita incomes and changing lifestyles will contributeto the growth in volume of decorative paints.
Meanwhile the ceramics industry has seen increased scope foroptimism with hopes for a dispersion of its fuel uncertainties.Local ceramic manufacturers were faced by an acute gas crisisand increased competition from Chinese products leading todifficult times. With the national strategy focusing on divertinggas to manufacturing industries, the crisis is expected torecede while a reduction in duties on imported raw materials inBudget FY2017-18 will increase competitiveness of domesticproducts. Budgetary changes will also benefit local aluminummanufacturers with increased duties set on imported aluminumbars and fittings.
Industry Outlooks

Bangladesh capital market review 2017
Fuel Distribution
Bangladesh Petroleum Corporation (BPC), a govt. agencyregulates fuel imports in the country. BPC imports crude oil,refined oil (kerosene, diesel, petrol, and octane) and furnaceoil. The exceptions to BPC’s monopoly on fuel imports ismarket for lubricants and the imported furnace oil for privatesector power plants. 2.90mn tons of fuel was imported throughBPC in the first half of 2017, a sharp rise from 2.42mn tonesduring the same period of the last year. Traditionally, much ofthe country’s required fuel is imported in the first half with arare exception seen in 2016. As a result, the import figures atthe end of the year are only expected to be slightly higher thanthose for 2016. With the govt. promoting LPG as primary fuelfor households and with LNG imports expected to start in 2019,the market for traditional fuels will only continue to growslightly.
The fuel imported by BPC is distributed through threecompanies with majority state ownership- Padma, Meghna &Jamuna which receive distribution commission on the volumeof oil sold. The companies make fixed deposits in banks fromtheir collection of receipts with interest income providing amajor source of revenue. As private sector credit growth in thecountry surged past target levels and with tighter inflationtargets in 2018, deposit rates are likely to increase, therebyincreasing the revenue of these companies.
Electricity Generation
The power sector is expected to continue its robust growth in2018 led by a significant number of private sector power plantsset to be implemented during the year. As of September 2017,the country had a total installed power generation capacity of13,621MW, an increase of 1,256MW from the beginning of theyear. Long term outlook also remains positive. Increasedaccess to electricity among unreached population, higherpower consumption led by rising per capita income andincreasing industrialization means that demand for power willcontinue to rise sharply. The Power System Master Plan(PSMP) 2016 estimates that the country’s power demand willreach 52,000MW by 2041 and determines that approximately57,000MW power needs to be generated. The electricitygeneration capacity has increased at a CAGR of 12.7%between 2010 and September 2017, a much accelerated ratefrom previous periods. While private sector involvement was avital factor in Bangladesh’s surge in power generation, largegovt. projects are also underway to reach the power generationgoals of 2041. The fuel composition of this sector is also likely
to see dramatic changes with increased focus on coal andimported LNG as domestic gas reserves needs to be divertedto the nation’s manufacturing industries. The business modelfor the country’s private power sector remains attractive withguaranteed capacity payments if the plants remain operationaland heavy subsidies on imported furnace oil. Several privatesector firms which were awarded contracts for power plants tobe implemented in the upcoming year will witness steep rise inearnings.
Steel
The rise in steel demand in the country is spearheaded byheavy spending on infrastructure which contribute to roughly40% of steel demand the country. Large steelmakerscontinued to add billet production capacity to improve bottomlines but their efforts were largely offset by rising scrap prices.Ability to pass on prices to consumers was largely eroded tosignificant overcapacity prevailing in the industry. Despite theadverse impact on margins, government spending will continueto drive volume thus providing a much needed boon to theindustry. However, the real estate market which accounts for60% of the demand for steel remains largely static. As a result,the situation for steel companies is unlikely to witnesssignificant change in 2018 unless billet and scrap pricesreduce.
Cement
Demand for cement has registered a robust CAGR of 12.67%over the last five years, significantly higher than the country’sGDP growth. Large government infrastructure projects havesustained the growth in cement demand amid a slow realestate recovery. Years of consolidation has resulted in anoligopolistic market structure. Despite the presence of 34major players in the market, the top ten companies own 81%market share. The estimated market size in 2016 is around200 Billion BDT in terms of value and 25 million Metric Tons interms of volume. The total installed capacity of cementproduction in Bangladesh is about 35 million metric tons peryear and the effective capacity is around 25 million metric tonsper year. Due to seasonality of the sector sales are higher inDecember-May. Extreme over capacity compared to demand,price hike of raw materials, heavy dependency on the import ofraw material, depreciation of local currency, low remittanceinflow, inadequate supply of gas and electricity and intensecompetition among too many makers have hit the Cementindustry hard in the outgoing year.
Textile
Bangladesh RMG sector is the largest export oriented sector ofBangladesh which shares around 81.23% of the country’s totalexport earnings as and accounts for 12.76% of GDP of thisgrowing economy as of FY17. RMG exports is flourishing andsees growth in volume in future as the products enjoypreferential export facilities under Generalized System ofPreference (GSP) and EBA scheme with EU by means oftrade concessions, Trade and Investment Corporation ForumAgreement (TICFA) with US and duty free access to India,China and South Korea.
One of the major competitive advantages that Bangladeshretains in attracting foreign investments and export orientedindustries is low labor costs. Though in 2013, Government ofBangladesh set the minimum wage of USD 69 per month.Adding to this, Cambodia and Vietnam, the closest competitorof Bangladesh in apparel exporting market, have decided toincrease minimum wages, which will come into effect fromJanuary, 2018. So Bangladesh RMG product is expected tohave competitive advantage in terms of price in internationalmarket.
Bangladesh is gaining its market share in global apparelmarket thanks to diversion of order from competing countriesand rise in China price. China market share in US market was36.43% in 2014 which came down to 34.60% in 2016 and33.93% in first nine months of 2017. Whereas, Bangladeshgained 6.57% market share in US market in 2016 which was5.91% in 2014. This potential decrease in Chinese exportpresents a huge opportunity for Bangladesh. During the FY18,to encourage the country’s export trade, export subsidies orcash incentives have given for some export items which hasbecome effective from 1 July 2017 to 1 June 2018. So, RMGexport is expected to see strong volume growth in future.
31
Industry Outlook

Bangladesh capital market review 2017
Disclaimer
This document (“the Report”) is published by LankaBangla Securities Ltd (“LBSL”) for information only of its clients. All information and analysis in this Report have been compiled from and analyzed on the basis of LBSL’s own research ofpublicly available documentation and information. LBSL has prepared the Report solely for informational purposes and consistent with Rules and regulations of SEC. The information provided in the Report is not intended to, and does notencompass all the factors to be considered in a best execution analysis and related order routing determinations. LBSL does not represent, warrant, or guarantee that the Report is accurate. LBSL disclaims liability for any direct, indirect,punitive, special, consequential, or incidental damages related to the Reports or the use of the Report. The information and analysis provided in the Report may be impacted by market data system outages or errors, both internal andexternal, and affected by frequent movement of market and events. Certain assumptions have been made in preparing the Report, and changes to the assumptions may have a material impact on results. The Report does not endorse orrecommend any particular security or market participant. LBSL, its analysts and officers confirm that they have not received and will not receive any direct or indirect compensation in exchange for expressing any specific recommendation,opinion or views in its Report. The information and data provided herein is the exclusive property of LBSL and cannot be redistributed in any form or manner without the prior written consent of LBSL. This disclaimer applies to the Report intheir entirety, irrespective of whether the Report is used or viewed in whole or in part.
LBSL’s research reports are also available on
Bloomberg LANB <GO>
http://lankabd.com
LankaBangla Securities Limited
Capital Market Research Department
Corporate Office
A.A. Bhaban (Level-5)
23 Motijheel C/A
Dhaka-1000, Bangladesh
Phone: +880-2-9513794 (Ext-118)
Fax: +880-2-9563902
Website: www.lbsbd.com
LBSL Capital Market Research Department
Institutional & Foreign Trade Department
Salma Yeasmin Xinat Senior Research Associate [email protected]
Debashish Sutradhar Senior Research Associate [email protected]
Quazi Naureen Ahmed Research Associate [email protected]
Ahmed Irtiza Research Associate [email protected]
Mashqurur Rahman Trainee Research Associate [email protected]
Rehan Muhammad Head of Business [email protected]/[email protected]