bank analysis.xls
DESCRIPTION
jlk';k';'; kkl;k';TRANSCRIPT
Balance Sheet of State Bank of Mysore ------------------- in Rs. Cr. -------------------Mar '13 Mar '12 Mar '11 Mar '10 Mar '09
12 mths 12 mths 12 mths 12 mths 12 mths
Capital and Liabilities:Total Share Capital 46.8 46.8 46.8 36 36Equity Share Capital 46.8 46.8 46.8 36 36Share Application Money 0 0 0 0 0Preference Share Capital 0 0 0 0 0Reserves 4,285.73 3,365.92 3,052.67 2,037.40 1,635.11Revaluation Reserves 0 575.81 583.85 591.89 599.93Net Worth 4,332.53 3,988.53 3,683.32 2,665.29 2,271.04Deposits 56,969.04 50,186.30 43,225.47 38,880.00 32,915.77Borrowings 3,854.20 4,425.59 3,307.95 2,274.01 2,762.08Total Debt 60,823.24 54,611.89 46,533.42 41,154.01 35,677.85Other Liabilities & Provisions 2,076.98 1,803.15 1,815.73 1,589.64 2,536.89Total Liabilities 67,232.75 60,403.57 52,032.47 45,408.94 40,485.78
Mar '13 Mar '12 Mar '11 Mar '10 Mar '09
12 mths 12 mths 12 mths 12 mths 12 mths
AssetsCash & Balances with RBI 2,404.67 3,025.85 2,705.68 2,765.62 1,735.05Balance with Banks, Money at Call 1,100.09 336.86 234.6 213.85 407.66Advances 44,932.57 39,835.31 34,029.81 29,535.86 25,616.05Investments 16,774.58 14,732.70 12,927.14 11,494.41 11,377.96Gross Block 2,020.85 1,192.02 1,127.62 1,107.10 1,060.28Accumulated Depreciation 0 442.6 402.62 374.11 328.91Net Block 2,020.85 749.42 725 732.99 731.37Capital Work In Progress 0 0 0 0 0Other Assets 0 1,723.44 1,410.23 666.2 617.7Total Assets 67,232.76 60,403.58 52,032.46 45,408.93 40,485.79
Contingent Liabilities 13,026.14 13,641.75 13,333.64 20,057.35 17,073.90Bills for collection 4,754.94 4,649.42 4,099.18 51.6 2,935.50Book Value (Rs) 925.76 729.22 662.28 575.94 464.2
Key Financial Ratios of State Bank of Mysore
Mar '13 Mar '12 Mar '11 Mar '10 Mar '09
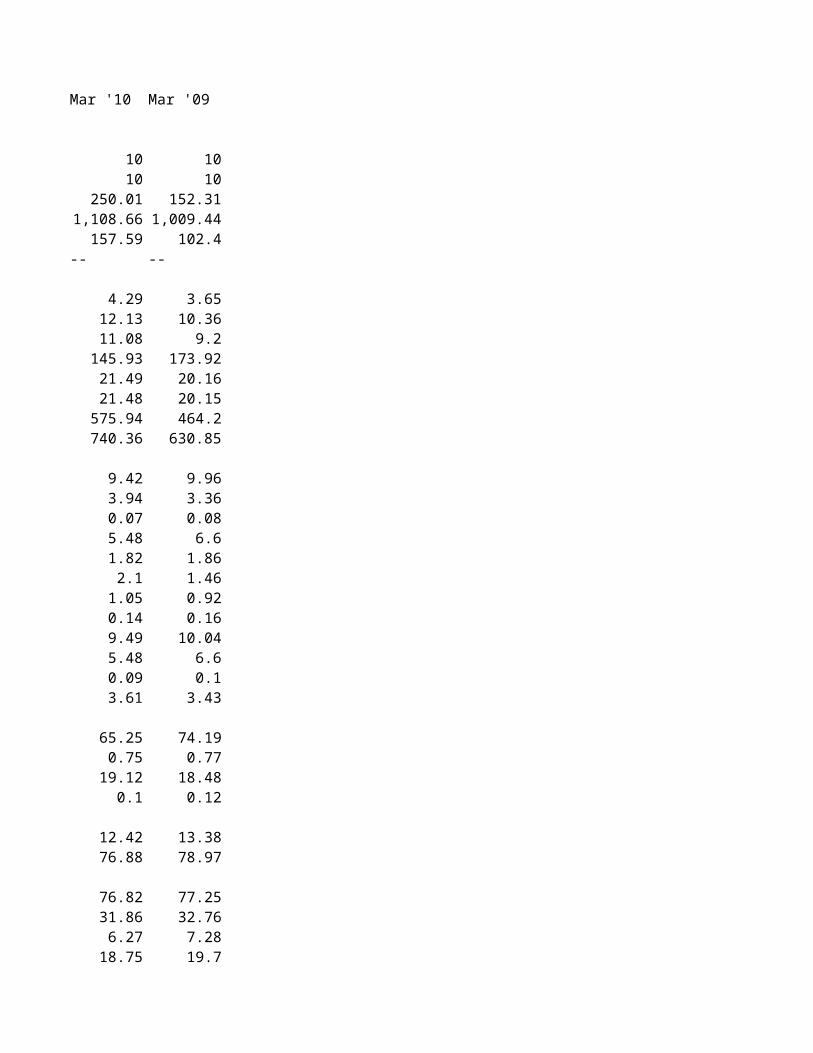
Investment Valuation RatiosFace Value 10 10 10 10 10Dividend Per Share 11.5 10 10 10 10Operating Profit Per Share (Rs) 167.2 110.47 156.22 250.01 152.31Net Operating Profit Per Share (Rs) 1,274.68 1,176.49 961.09 1,108.66 1,009.44Free Reserves Per Share (Rs) -- 339.47 301.44 157.59 102.4Bonus in Equity Capital -- -- -- -- --Profitability RatiosInterest Spread -- 4.36 4.77 4.29 3.65Adjusted Cash Margin(%) 7.05 7.54 12.17 12.13 10.36Net Profit Margin 6.34 6.64 11.06 11.08 9.2Return on Long Term Fund(%) 111.25 115.78 102.75 145.93 173.92Return on Net Worth(%) 9.6 10.81 16.15 21.49 20.16Adjusted Return on Net Worth(%) 9.6 10.81 16.17 21.48 20.15Return on Assets Excluding Revaluations 925.76 729.22 662.28 575.94 464.2Return on Assets Including Revaluations 925.76 852.25 787.04 740.36 630.85Management Efficiency RatiosInterest Income / Total Funds 9.39 9.9 9.34 9.42 9.96Net Interest Income / Total Funds 2.9 3.62 4.27 3.94 3.36Non Interest Income / Total Funds 0.94 0.08 0.06 0.07 0.08Interest Expended / Total Funds 6.49 6.28 5.08 5.48 6.6Operating Expense / Total Funds 1.66 2.69 2.75 1.82 1.86Profit Before Provisions / Total Funds 2.1 0.92 1.47 2.1 1.46Net Profit / Total Funds 0.66 0.66 1.04 1.05 0.92Loans Turnover 0.3 0.15 0.14 0.14 0.16Total Income / Capital Employed(%) 10.33 9.98 9.4 9.49 10.04Interest Expended / Capital Employed(%) 6.49 6.28 5.08 5.48 6.6Total Assets Turnover Ratios 0.09 0.1 0.09 0.09 0.1Asset Turnover Ratio 0.1 0.1 3.99 3.61 3.43Profit And Loss Account RatiosInterest Expended / Interest Earned 69.18 68.8 59.89 65.25 74.19Other Income / Total Income 9.08 0.82 0.59 0.75 0.77Operating Expense / Total Income 16.12 26.93 29.25 19.12 18.48Selling Distribution Cost Composition -- 0.11 0.13 0.1 0.12Balance Sheet RatiosCapital Adequacy Ratio 11.79 12.55 13.76 12.42 13.38Advances / Loans Funds(%) -- 78.77 77.62 76.88 78.97Debt Coverage RatiosCredit Deposit Ratio 37.18 79.07 77.42 76.82 77.25Investment Deposit Ratio 29.4 29.61 29.74 31.86 32.76Cash Deposit Ratio 5.07 6.14 6.66 6.27 7.28Total Debt to Owners Fund 13.15 14.71 13.95 18.75 19.7
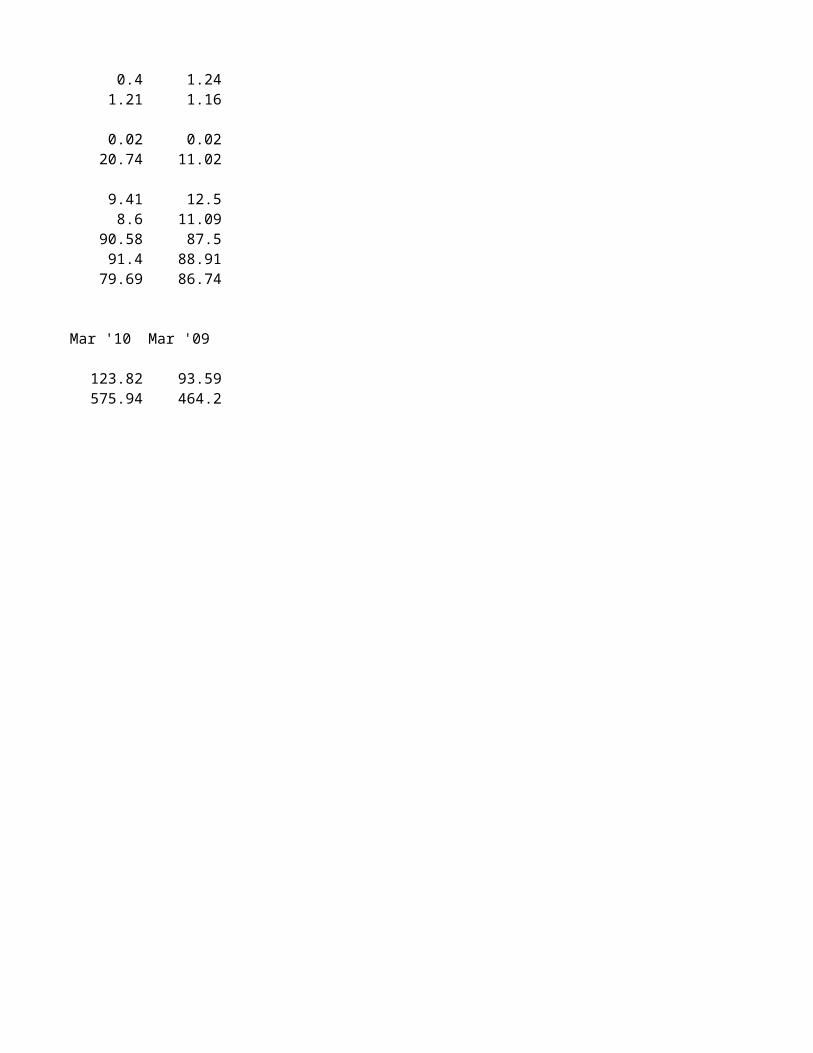
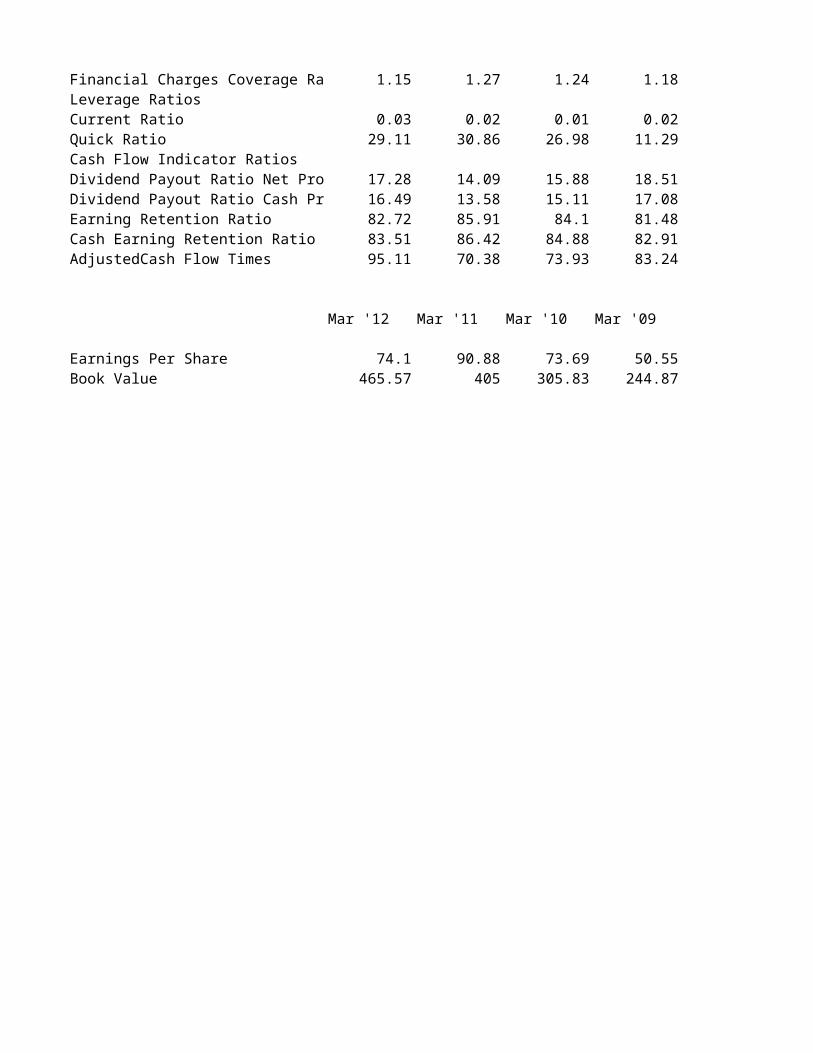
Financial Charges Coverage Ratio 0.33 0.16 0.31 0.4 1.24Financial Charges Coverage Ratio Post Tax 1.11 1.12 1.23 1.21 1.16Leverage RatiosCurrent Ratio 0.76 0.03 0.03 0.02 0.02Quick Ratio 22.79 24.73 21.01 20.74 11.02Cash Flow Indicator RatiosDividend Payout Ratio Net Profit 12.93 14.73 10.86 9.41 12.5Dividend Payout Ratio Cash Profit 11.62 12.97 9.88 8.6 11.09Earning Retention Ratio 87.07 85.27 89.16 90.58 87.5Cash Earning Retention Ratio 88.38 87.03 90.13 91.4 88.91AdjustedCash Flow Times 123.01 119.74 78.46 79.69 86.74
Mar '13 Mar '12 Mar '11 Mar '10 Mar '09
Earnings Per Share 88.91 78.88 107.18 123.82 93.59Book Value 925.76 729.22 662.28 575.94 464.2
Profit & Loss account of State Bank of Mysore ------------------- in Rs. Cr. -------------------Mar '13 Mar '12 Mar '11 Mar '10 Mar '09
12 mths 12 mths 12 mths 12 mths 12 mths
IncomeInterest Earned 5,962.85 5,078.43 4,079.08 3,558.92 3,247.28Other Income 598.22 516.39 455.18 425.72 480.36Total Income 6,561.07 5,594.82 4,534.26 3,984.64 3,727.64ExpenditureInterest expended 4,125.28 3,494.14 2,443.08 2,322.36 2,409.02Employee Cost 640.24 620.58 548.37 418.26 384.55Selling and Admin Expenses 0 679.24 613.19 218.66 175.23Depreciation 47.04 50.04 49.52 42.35 42.6Miscellaneous Expenses 1,332.41 381.67 378.52 537.24 379.32Preoperative Exp Capitalised 0 0 0 0 0Operating Expenses 1,104.75 1,544.81 1,373.23 811.13 719.25Provisions & Contingencies 914.94 186.72 216.37 405.38 262.45Total Expenses 6,144.97 5,225.67 4,032.68 3,538.87 3,390.72
Mar '13 Mar '12 Mar '11 Mar '10 Mar '09
12 mths 12 mths 12 mths 12 mths 12 mths
Net Profit for the Year 416.1 369.15 501.59 445.77 336.91Extraordionary Items 0 0 -0.97 0 0Profit brought forward 0 0 0 0 0Total 416.1 369.15 500.62 445.77 336.91Preference Dividend 0 0 0 0 0Equity Dividend 53.82 46.8 46.8 36 36Corporate Dividend Tax 0 7.59 7.59 5.98 6.12Per share data (annualised)Earning Per Share (Rs) 88.91 78.88 107.18 123.82 93.59Equity Dividend (%) 115 100 100 100 100Book Value (Rs) 925.76 729.22 662.28 575.94 464.2AppropriationsTransfer to Statutory Reserves 362.28 314.75 446.23 403.79 294.8Transfer to Other Reserves 0 0.01 0 0 -0.01Proposed Dividend/Transfer to Govt 53.82 54.39 54.39 41.98 42.12Balance c/f to Balance Sheet 0 0 0 0 0Total 416.1 369.15 500.62 445.77 336.91
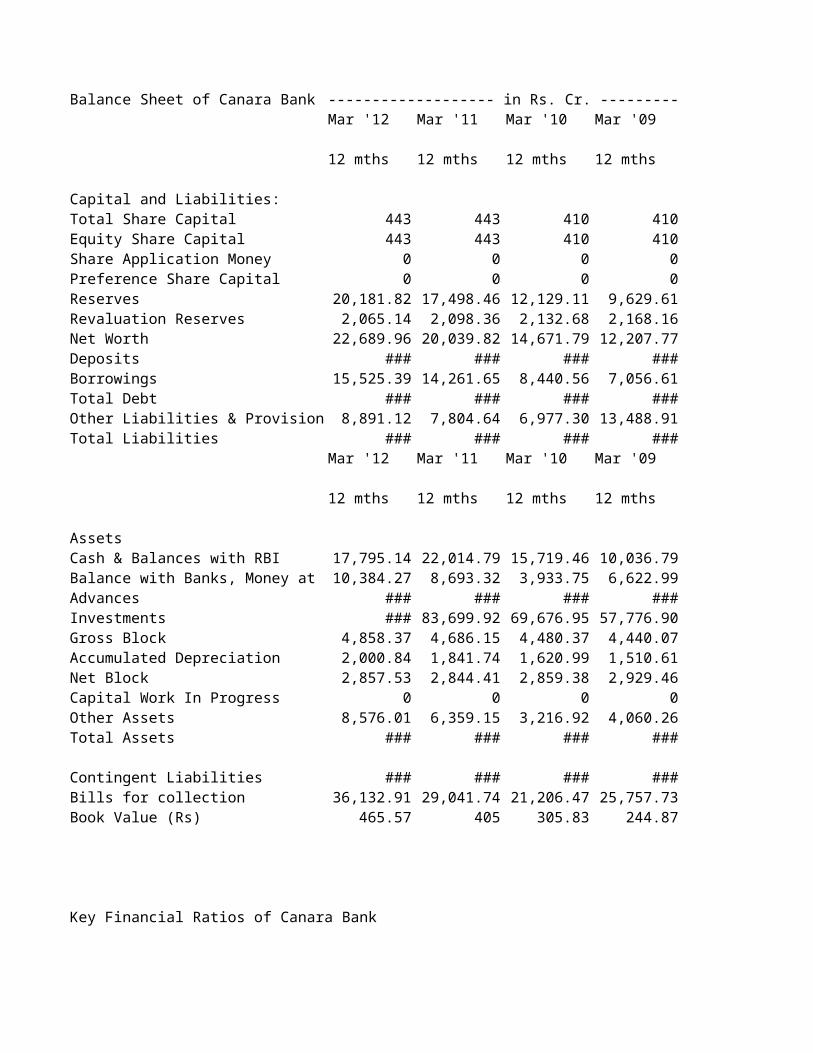
Balance Sheet of Canara Bank ------------------- in Rs. Cr. -------------------Mar '12 Mar '11 Mar '10 Mar '09 Mar '08
12 mths 12 mths 12 mths 12 mths 12 mths
Capital and Liabilities:Total Share Capital 443 443 410 410 410Equity Share Capital 443 443 410 410 410Share Application Money 0 0 0 0 0Preference Share Capital 0 0 0 0 0Reserves 20,181.82 17,498.46 12,129.11 9,629.61 7,885.63Revaluation Reserves 2,065.14 2,098.36 2,132.68 2,168.16 2,204.86Net Worth 22,689.96 20,039.82 14,671.79 12,207.77 10,500.49Deposits 327,053.73 293,972.65 234,651.44 186,892.51 154,072.42Borrowings 15,525.39 14,261.65 8,440.56 7,056.61 2,517.23Total Debt 342,579.12 308,234.30 243,092.00 193,949.12 156,589.65Other Liabilities & Provisions 8,891.12 7,804.64 6,977.30 13,488.91 13,438.55Total Liabilities 374,160.20 336,078.76 264,741.09 219,645.80 180,528.69
Mar '12 Mar '11 Mar '10 Mar '09 Mar '08
12 mths 12 mths 12 mths 12 mths 12 mths
AssetsCash & Balances with RBI 17,795.14 22,014.79 15,719.46 10,036.79 13,364.79Balance with Banks, Money at Call 10,384.27 8,693.32 3,933.75 6,622.99 4,513.25Advances 232,489.82 212,467.17 169,334.63 138,219.40 107,238.04Investments 102,057.43 83,699.92 69,676.95 57,776.90 49,811.57Gross Block 4,858.37 4,686.15 4,480.37 4,440.07 4,254.33Accumulated Depreciation 2,000.84 1,841.74 1,620.99 1,510.61 1,337.46Net Block 2,857.53 2,844.41 2,859.38 2,929.46 2,916.87Capital Work In Progress 0 0 0 0 0Other Assets 8,576.01 6,359.15 3,216.92 4,060.26 2,684.17Total Assets 374,160.20 336,078.76 264,741.09 219,645.80 180,528.69
Contingent Liabilities 166,419.96 111,805.73 110,627.02 136,851.39 95,710.87Bills for collection 36,132.91 29,041.74 21,206.47 25,757.73 25,299.63Book Value (Rs) 465.57 405 305.83 244.87 202.33
Key Financial Ratios of Canara Bank
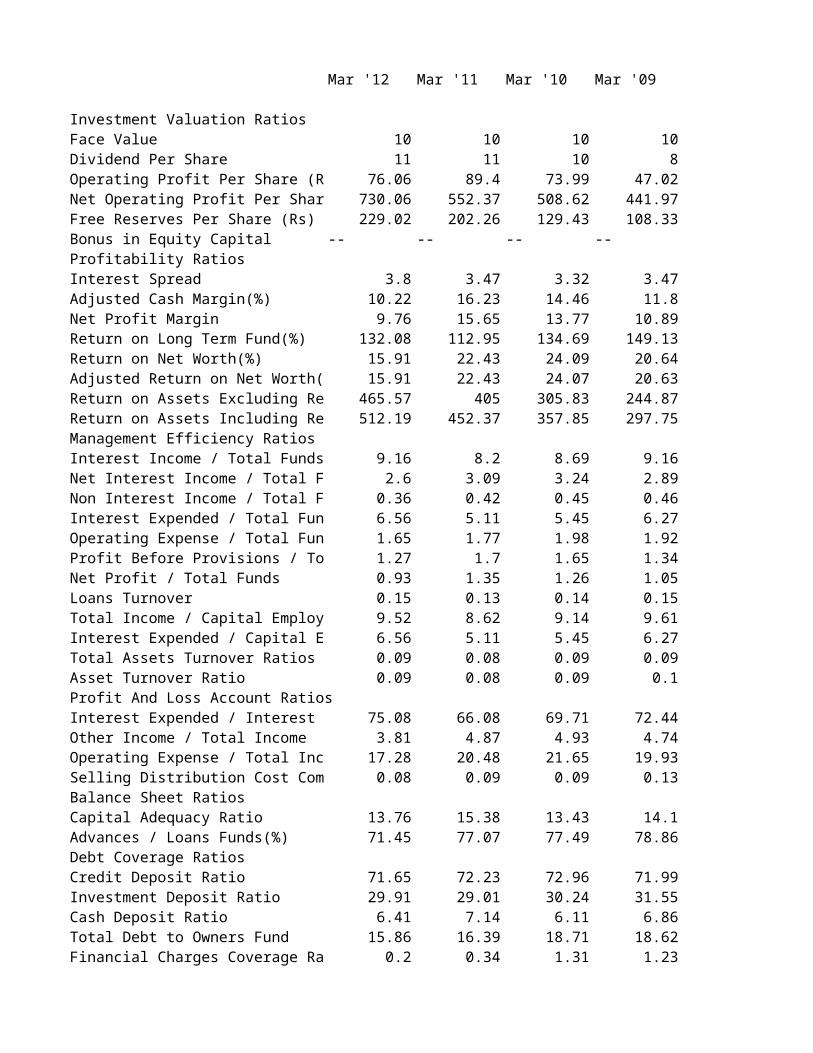
Mar '12 Mar '11 Mar '10 Mar '09 Mar '08
Investment Valuation Ratios
Face Value 10 10 10 10 10Dividend Per Share 11 11 10 8 8Operating Profit Per Share (Rs) 76.06 89.4 73.99 47.02 33.29Net Operating Profit Per Share (Rs) 730.06 552.37 508.62 441.97 378.64Free Reserves Per Share (Rs) 229.02 202.26 129.43 108.33 103.94Bonus in Equity Capital -- -- -- -- --Profitability RatiosInterest Spread 3.8 3.47 3.32 3.47 3.47Adjusted Cash Margin(%) 10.22 16.23 14.46 11.8 10.65Net Profit Margin 9.76 15.65 13.77 10.89 9.61Return on Long Term Fund(%) 132.08 112.95 134.69 149.13 151.48Return on Net Worth(%) 15.91 22.43 24.09 20.64 18.86Adjusted Return on Net Worth(%) 15.91 22.43 24.07 20.63 18.85Return on Assets Excluding Revaluat 465.57 405 305.83 244.87 202.33Return on Assets Including Revaluat 512.19 452.37 357.85 297.75 256.11Management Efficiency RatiosInterest Income / Total Funds 9.16 8.2 8.69 9.16 9.08Net Interest Income / Total Funds 2.6 3.09 3.24 2.89 2.84Non Interest Income / Total Funds 0.36 0.42 0.45 0.46 0.44Interest Expended / Total Funds 6.56 5.11 5.45 6.27 6.23Operating Expense / Total Funds 1.65 1.77 1.98 1.92 2.04Profit Before Provisions / Total Fund 1.27 1.7 1.65 1.34 1.14Net Profit / Total Funds 0.93 1.35 1.26 1.05 0.92Loans Turnover 0.15 0.13 0.14 0.15 0.15Total Income / Capital Employed(%) 9.52 8.62 9.14 9.61 9.52Interest Expended / Capital Employ 6.56 5.11 5.45 6.27 6.23Total Assets Turnover Ratios 0.09 0.08 0.09 0.09 0.09Asset Turnover Ratio 0.09 0.08 0.09 0.1 3.65Profit And Loss Account RatiosInterest Expended / Interest Earned 75.08 66.08 69.71 72.44 75.09Other Income / Total Income 3.81 4.87 4.93 4.74 4.61Operating Expense / Total Income 17.28 20.48 21.65 19.93 21.48Selling Distribution Cost Compositio 0.08 0.09 0.09 0.13 0.29Balance Sheet RatiosCapital Adequacy Ratio 13.76 15.38 13.43 14.1 13.25Advances / Loans Funds(%) 71.45 77.07 77.49 78.86 71.36Debt Coverage RatiosCredit Deposit Ratio 71.65 72.23 72.96 71.99 69.4Investment Deposit Ratio 29.91 29.01 30.24 31.55 32.06Cash Deposit Ratio 6.41 7.14 6.11 6.86 7.58Total Debt to Owners Fund 15.86 16.39 18.71 18.62 18.57Financial Charges Coverage Ratio 0.2 0.34 1.31 1.23 0.2Financial Charges Coverage Ratio Po 1.15 1.27 1.24 1.18 1.16Leverage RatiosCurrent Ratio 0.03 0.02 0.01 0.02 0.02Quick Ratio 29.11 30.86 26.98 11.29 9.17Cash Flow Indicator RatiosDividend Payout Ratio Net Profit 17.28 14.09 15.88 18.51 24.53

Dividend Payout Ratio Cash Profit 16.49 13.58 15.11 17.08 22.13Earning Retention Ratio 82.72 85.91 84.1 81.48 75.45Cash Earning Retention Ratio 83.51 86.42 84.88 82.91 77.86AdjustedCash Flow Times 95.11 70.38 73.93 83.24 88.86
Mar '12 Mar '11 Mar '10 Mar '09 Mar '08
Earnings Per Share 74.1 90.88 73.69 50.55 38.17Book Value 465.57 405 305.83 244.87 202.33
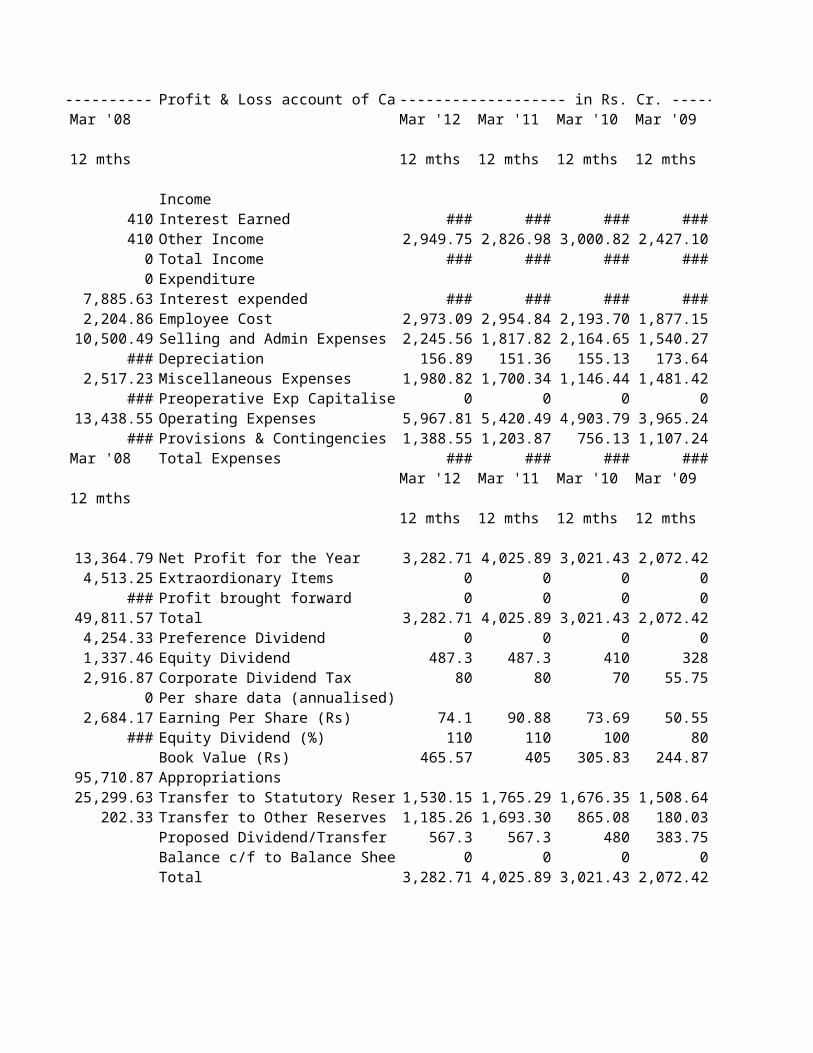
Profit & Loss account of Canara B ------------------- in Rs. Cr. -------------------Mar '12 Mar '11 Mar '10 Mar '09 Mar '08
12 mths 12 mths 12 mths 12 mths 12 mths
IncomeInterest Earned 30,850.62 23,064.01 18,751.96 17,119.05 14,200.74Other Income 2,949.75 2,826.98 3,000.82 2,427.10 2,308.31Total Income 33,800.37 25,890.99 21,752.78 19,546.15 16,509.05ExpenditureInterest expended 23,161.31 15,240.74 13,071.43 12,401.25 10,662.94Employee Cost 2,973.09 2,954.84 2,193.70 1,877.15 1,661.28Selling and Admin Expenses 2,245.56 1,817.82 2,164.65 1,540.27 1,491.09Depreciation 156.89 151.36 155.13 173.64 169.97Miscellaneous Expenses 1,980.82 1,700.34 1,146.44 1,481.42 958.76Preoperative Exp Capitalised 0 0 0 0 0Operating Expenses 5,967.81 5,420.49 4,903.79 3,965.24 3,666.30Provisions & Contingencies 1,388.55 1,203.87 756.13 1,107.24 614.8Total Expenses 30,517.67 21,865.10 18,731.35 17,473.73 14,944.04
Mar '12 Mar '11 Mar '10 Mar '09 Mar '08
12 mths 12 mths 12 mths 12 mths 12 mths
Net Profit for the Year 3,282.71 4,025.89 3,021.43 2,072.42 1,565.01Extraordionary Items 0 0 0 0 0Profit brought forward 0 0 0 0 0Total 3,282.71 4,025.89 3,021.43 2,072.42 1,565.01Preference Dividend 0 0 0 0 0Equity Dividend 487.3 487.3 410 328 328Corporate Dividend Tax 80 80 70 55.75 56Per share data (annualised)Earning Per Share (Rs) 74.1 90.88 73.69 50.55 38.17Equity Dividend (%) 110 110 100 80 80Book Value (Rs) 465.57 405 305.83 244.87 202.33AppropriationsTransfer to Statutory Reserves 1,530.15 1,765.29 1,676.35 1,508.64 802Transfer to Other Reserves 1,185.26 1,693.30 865.08 180.03 379.01Proposed Dividend/Transfer to Go 567.3 567.3 480 383.75 384Balance c/f to Balance Sheet 0 0 0 0 0Total 3,282.71 4,025.89 3,021.43 2,072.42 1,565.01
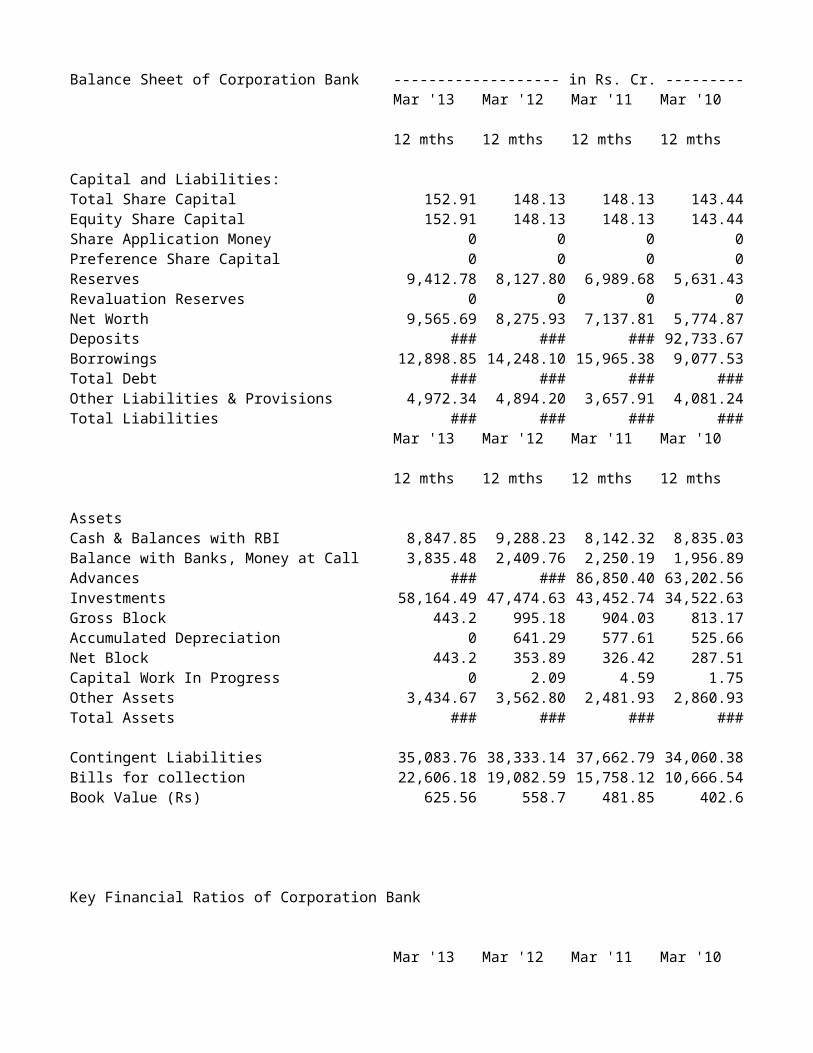
Balance Sheet of Corporation Bank ------------------- in Rs. Cr. -------------------Mar '13 Mar '12 Mar '11 Mar '10 Mar '09
12 mths 12 mths 12 mths 12 mths 12 mths
Capital and Liabilities:Total Share Capital 152.91 148.13 148.13 143.44 143.44Equity Share Capital 152.91 148.13 148.13 143.44 143.44Share Application Money 0 0 0 0 0Preference Share Capital 0 0 0 0 0Reserves 9,412.78 8,127.80 6,989.68 5,631.43 4,753.07Revaluation Reserves 0 0 0 0 0Net Worth 9,565.69 8,275.93 7,137.81 5,774.87 4,896.51Deposits 166,005.45 136,142.20 116,747.50 92,733.67 73,983.91Borrowings 12,898.85 14,248.10 15,965.38 9,077.53 2,072.40Total Debt 178,904.30 150,390.30 132,712.88 101,811.20 76,056.31Other Liabilities & Provisions 4,972.34 4,894.20 3,657.91 4,081.24 5,952.99Total Liabilities 193,442.33 163,560.43 143,508.60 111,667.31 86,905.81
Mar '13 Mar '12 Mar '11 Mar '10 Mar '09
12 mths 12 mths 12 mths 12 mths 12 mths
AssetsCash & Balances with RBI 8,847.85 9,288.23 8,142.32 8,835.03 5,590.60Balance with Banks, Money at Call 3,835.48 2,409.76 2,250.19 1,956.89 4,949.09Advances 118,716.65 100,469.02 86,850.40 63,202.56 48,512.16Investments 58,164.49 47,474.63 43,452.74 34,522.63 24,937.77Gross Block 443.2 995.18 904.03 813.17 775.86Accumulated Depreciation 0 641.29 577.61 525.66 476.94Net Block 443.2 353.89 326.42 287.51 298.92Capital Work In Progress 0 2.09 4.59 1.75 0Other Assets 3,434.67 3,562.80 2,481.93 2,860.93 2,617.26Total Assets 193,442.34 163,560.42 143,508.59 111,667.30 86,905.80
Contingent Liabilities 35,083.76 38,333.14 37,662.79 34,060.38 34,493.33Bills for collection 22,606.18 19,082.59 15,758.12 10,666.54 9,146.68Book Value (Rs) 625.56 558.7 481.85 402.6 341.36
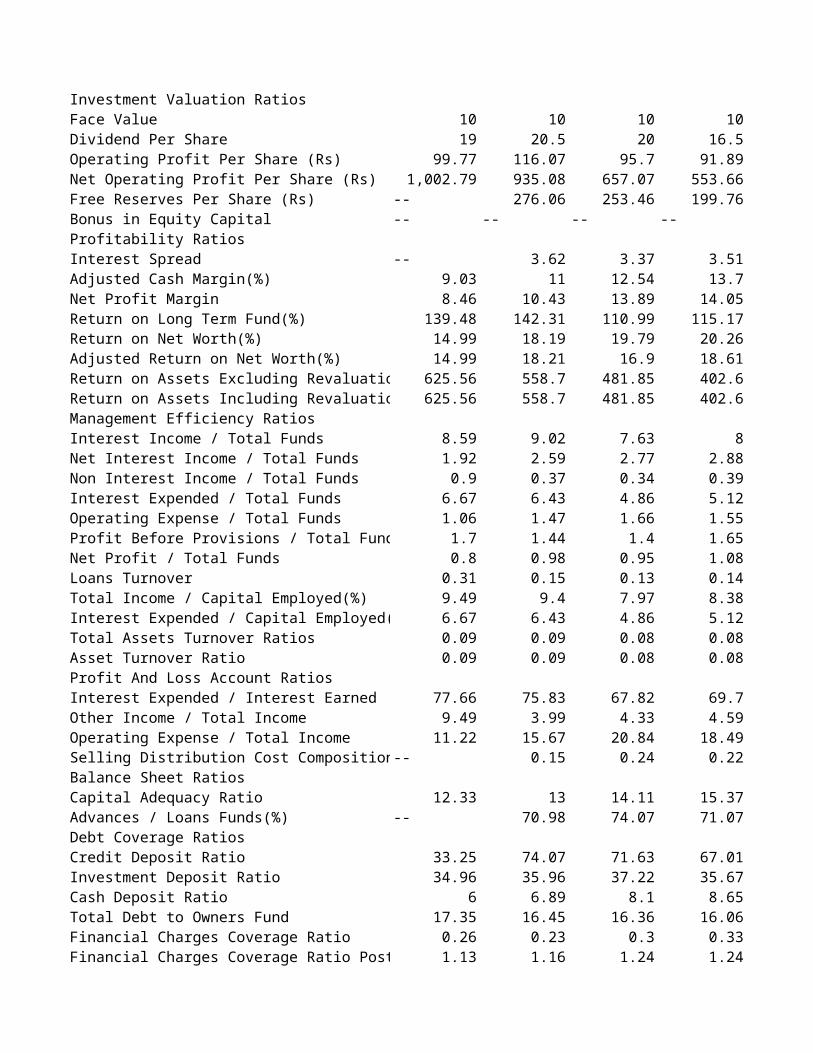
Key Financial Ratios of Corporation Bank
Mar '13 Mar '12 Mar '11 Mar '10 Mar '09
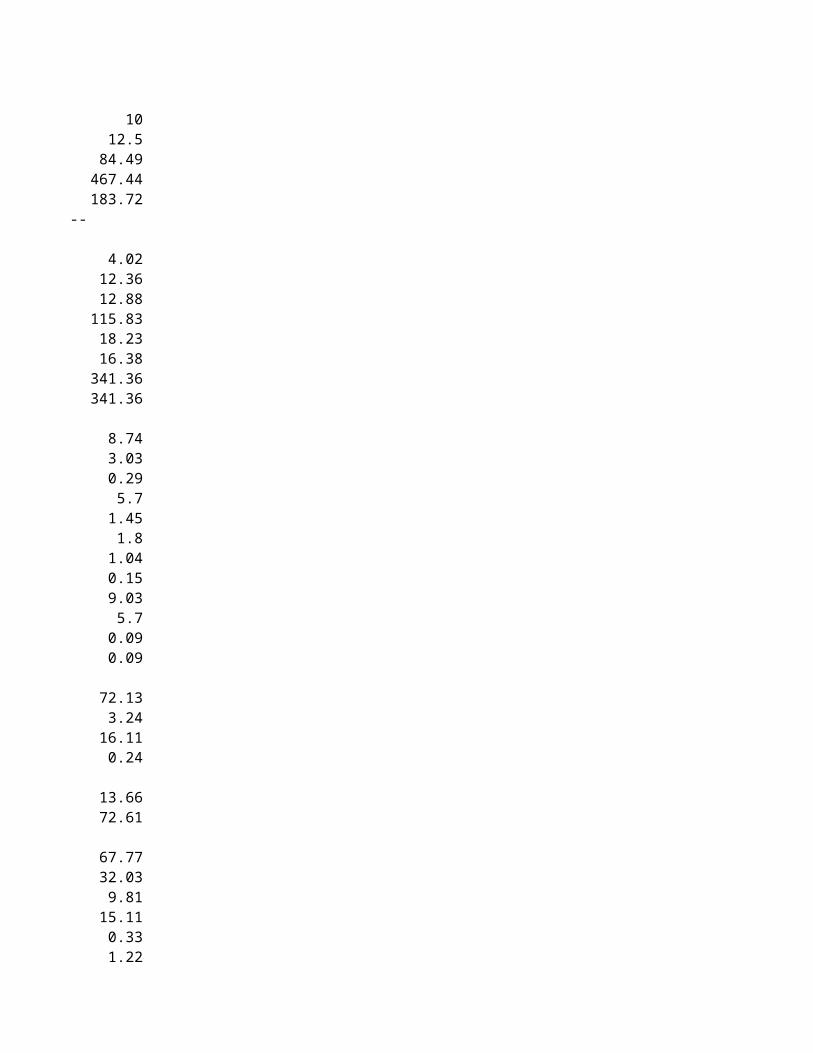
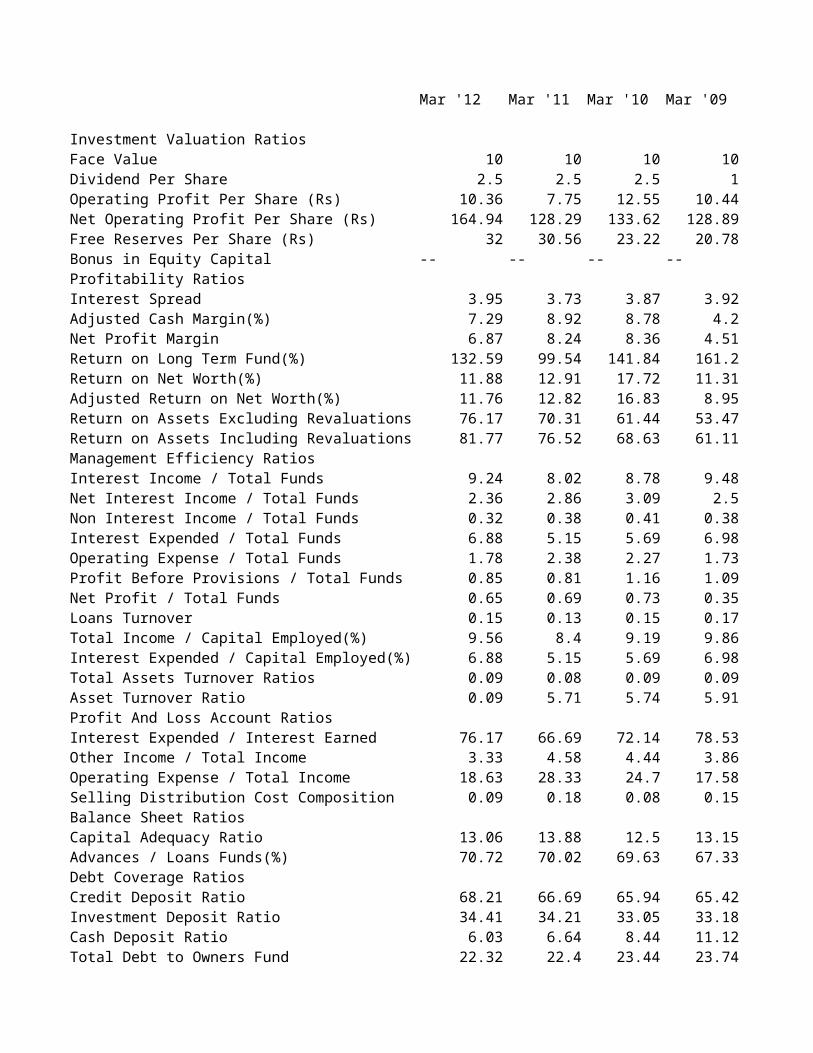
Investment Valuation RatiosFace Value 10 10 10 10 10
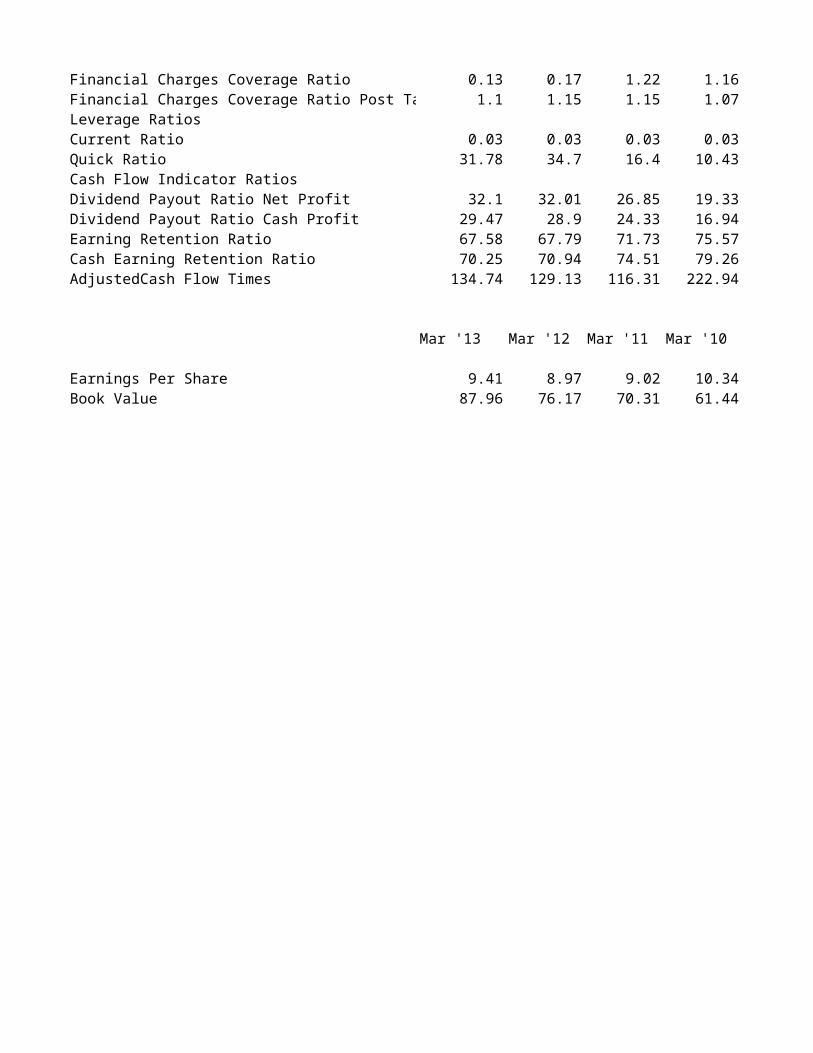
Dividend Per Share 19 20.5 20 16.5 12.5Operating Profit Per Share (Rs) 99.77 116.07 95.7 91.89 84.49Net Operating Profit Per Share (Rs) 1,002.79 935.08 657.07 553.66 467.44Free Reserves Per Share (Rs) -- 276.06 253.46 199.76 183.72Bonus in Equity Capital -- -- -- -- --Profitability RatiosInterest Spread -- 3.62 3.37 3.51 4.02Adjusted Cash Margin(%) 9.03 11 12.54 13.7 12.36Net Profit Margin 8.46 10.43 13.89 14.05 12.88Return on Long Term Fund(%) 139.48 142.31 110.99 115.17 115.83Return on Net Worth(%) 14.99 18.19 19.79 20.26 18.23Adjusted Return on Net Worth(%) 14.99 18.21 16.9 18.61 16.38Return on Assets Excluding Revaluations 625.56 558.7 481.85 402.6 341.36Return on Assets Including Revaluations 625.56 558.7 481.85 402.6 341.36Management Efficiency RatiosInterest Income / Total Funds 8.59 9.02 7.63 8 8.74Net Interest Income / Total Funds 1.92 2.59 2.77 2.88 3.03Non Interest Income / Total Funds 0.9 0.37 0.34 0.39 0.29Interest Expended / Total Funds 6.67 6.43 4.86 5.12 5.7Operating Expense / Total Funds 1.06 1.47 1.66 1.55 1.45Profit Before Provisions / Total Funds 1.7 1.44 1.4 1.65 1.8Net Profit / Total Funds 0.8 0.98 0.95 1.08 1.04Loans Turnover 0.31 0.15 0.13 0.14 0.15Total Income / Capital Employed(%) 9.49 9.4 7.97 8.38 9.03Interest Expended / Capital Employed(%) 6.67 6.43 4.86 5.12 5.7Total Assets Turnover Ratios 0.09 0.09 0.08 0.08 0.09Asset Turnover Ratio 0.09 0.09 0.08 0.08 0.09Profit And Loss Account RatiosInterest Expended / Interest Earned 77.66 75.83 67.82 69.7 72.13Other Income / Total Income 9.49 3.99 4.33 4.59 3.24Operating Expense / Total Income 11.22 15.67 20.84 18.49 16.11Selling Distribution Cost Composition -- 0.15 0.24 0.22 0.24Balance Sheet RatiosCapital Adequacy Ratio 12.33 13 14.11 15.37 13.66Advances / Loans Funds(%) -- 70.98 74.07 71.07 72.61Debt Coverage RatiosCredit Deposit Ratio 33.25 74.07 71.63 67.01 67.77Investment Deposit Ratio 34.96 35.96 37.22 35.67 32.03Cash Deposit Ratio 6 6.89 8.1 8.65 9.81Total Debt to Owners Fund 17.35 16.45 16.36 16.06 15.11Financial Charges Coverage Ratio 0.26 0.23 0.3 0.33 0.33Financial Charges Coverage Ratio Post Tax 1.13 1.16 1.24 1.24 1.22Leverage RatiosCurrent Ratio 0.71 0.03 0.02 0.03 0.03Quick Ratio 26.35 23.15 26.65 18.35 9.53Cash Flow Indicator RatiosDividend Payout Ratio Net Profit 23.27 23.43 24.36 23.66 23.49Dividend Payout Ratio Cash Profit 21.8 22.25 23.22 22.39 22.13
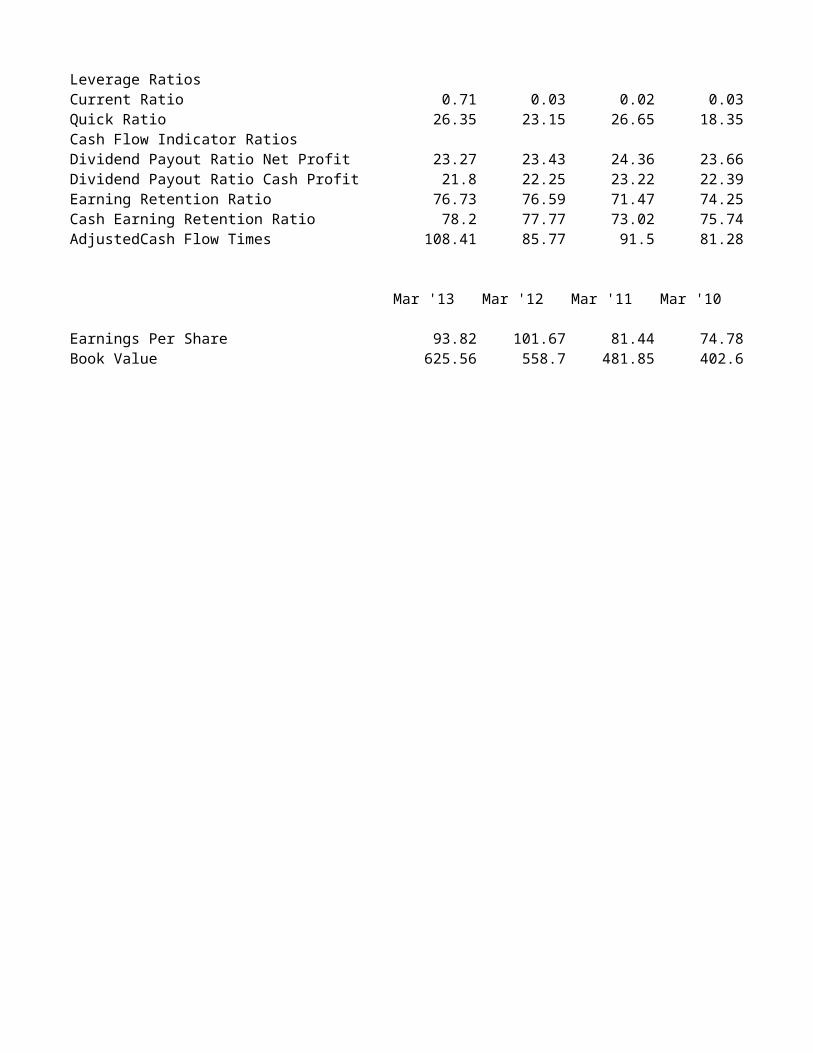
Earning Retention Ratio 76.73 76.59 71.47 74.25 73.86Cash Earning Retention Ratio 78.2 77.77 73.02 75.74 75.53AdjustedCash Flow Times 108.41 85.77 91.5 81.28 86.31
Mar '13 Mar '12 Mar '11 Mar '10 Mar '09
Earnings Per Share 93.82 101.67 81.44 74.78 55.87Book Value 625.56 558.7 481.85 402.6 341.36

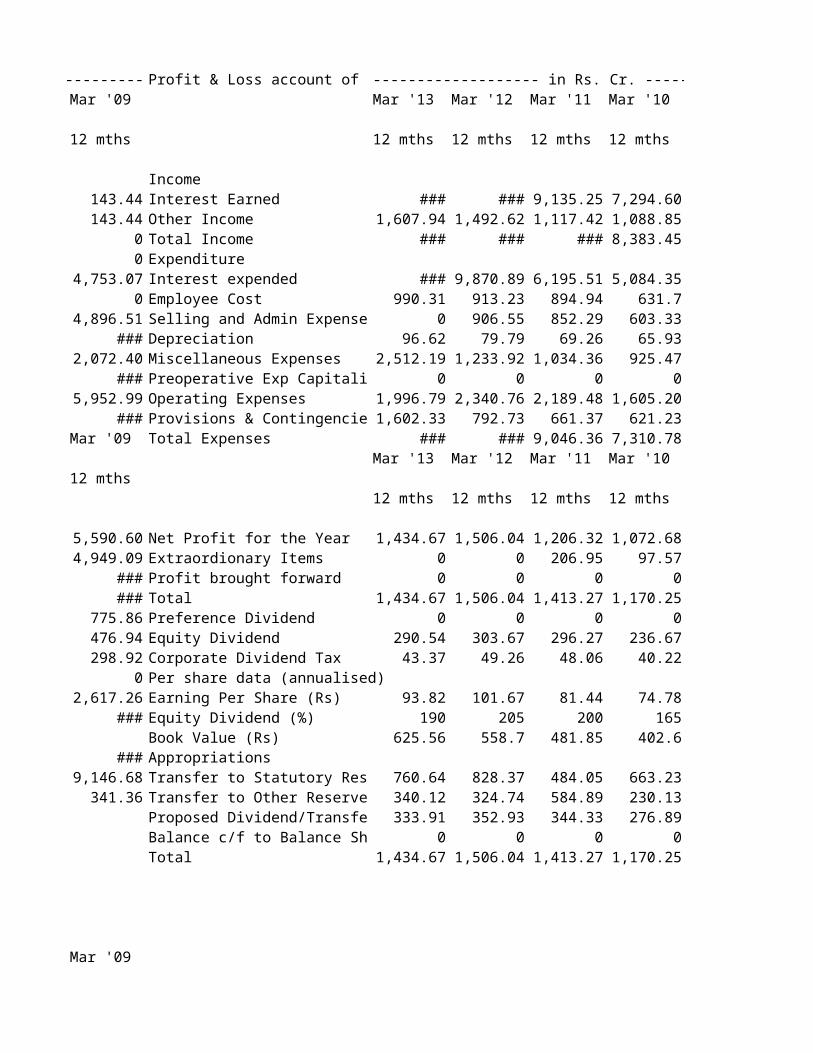
Profit & Loss account of Corpor ------------------- in Rs. Cr. -------------------Mar '13 Mar '12 Mar '11 Mar '10 Mar '09
12 mths 12 mths 12 mths 12 mths 12 mths
IncomeInterest Earned 15,334.08 13,017.78 9,135.25 7,294.60 6,067.35Other Income 1,607.94 1,492.62 1,117.42 1,088.85 1,015.81Total Income 16,942.02 14,510.40 10,252.67 8,383.45 7,083.16ExpenditureInterest expended 11,908.23 9,870.89 6,195.51 5,084.35 4,376.37Employee Cost 990.31 913.23 894.94 631.7 467.97Selling and Admin Expenses 0 906.55 852.29 603.33 393.33Depreciation 96.62 79.79 69.26 65.93 54.96Miscellaneous Expenses 2,512.19 1,233.92 1,034.36 925.47 989.16Preoperative Exp Capitalised 0 0 0 0 0Operating Expenses 1,996.79 2,340.76 2,189.48 1,605.20 1,171.57Provisions & Contingencies 1,602.33 792.73 661.37 621.23 733.85Total Expenses 15,507.35 13,004.38 9,046.36 7,310.78 6,281.79
Mar '13 Mar '12 Mar '11 Mar '10 Mar '09
12 mths 12 mths 12 mths 12 mths 12 mths
Net Profit for the Year 1,434.67 1,506.04 1,206.32 1,072.68 801.37Extraordionary Items 0 0 206.95 97.57 91.4Profit brought forward 0 0 0 0 0Total 1,434.67 1,506.04 1,413.27 1,170.25 892.77Preference Dividend 0 0 0 0 0Equity Dividend 290.54 303.67 296.27 236.67 179.3Corporate Dividend Tax 43.37 49.26 48.06 40.22 30.47Per share data (annualised)Earning Per Share (Rs) 93.82 101.67 81.44 74.78 55.87Equity Dividend (%) 190 205 200 165 125Book Value (Rs) 625.56 558.7 481.85 402.6 341.36AppropriationsTransfer to Statutory Reserves 760.64 828.37 484.05 663.23 682.59Transfer to Other Reserves 340.12 324.74 584.89 230.13 0.41Proposed Dividend/Transfer to 333.91 352.93 344.33 276.89 209.77Balance c/f to Balance Sheet 0 0 0 0 0Total 1,434.67 1,506.04 1,413.27 1,170.25 892.77
Balance Sheet of Vijaya Bank ------------------- in Rs. Cr. -------------------Mar '13 Mar '12 Mar '11 Mar '10 Mar '09
12 mths 12 mths 12 mths 12 mths 12 mths
Capital and Liabilities:Total Share Capital 1,695.54 1,695.54 1,672.67 933.52 933.52Equity Share Capital 495.54 495.54 472.67 433.52 433.52Share Application Money 0 0 0 0 0Preference Share Capital 1,200.00 1,200.00 1,200.00 500 500Reserves 3,863.11 3,279.15 2,850.50 2,229.96 1,884.55Revaluation Reserves 0 277.53 293.83 311.68 331.22Net Worth 5,558.65 5,252.22 4,817.00 3,475.16 3,149.29Deposits 97,017.24 83,055.51 73,248.32 61,931.75 54,535.42Borrowings 6,391.82 5,418.40 2,025.37 1,938.56 619.24Total Debt 103,409.06 88,473.91 75,273.69 63,870.31 55,154.66Other Liabilities & Provisions 2,014.05 2,037.88 1,599.93 2,876.63 4,078.64Total Liabilities 110,981.76 95,764.01 81,690.62 70,222.10 62,382.59
Mar '13 Mar '12 Mar '11 Mar '10 Mar '09
12 mths 12 mths 12 mths 12 mths 12 mths
AssetsCash & Balances with RBI 3,917.70 4,542.53 4,881.84 4,099.58 5,730.41Balance with Banks, Money at Call 2,727.05 1,860.32 541.73 1,449.68 1,941.78Advances 69,765.76 57,903.74 48,718.63 41,521.72 35,468.11Investments 31,284.97 28,643.80 25,138.58 21,107.45 17,387.70Gross Block 476.74 1,089.06 1,061.78 1,008.88 944.71Accumulated Depreciation 0 602.11 575.78 515.72 451.46Net Block 476.74 486.95 486 493.16 493.25Capital Work In Progress 0 0 0 0 0Other Assets 2,809.54 2,326.66 1,923.85 1,550.50 1,361.36Total Assets 110,981.76 95,764.00 81,690.63 70,222.09 62,382.61
Contingent Liabilities 13,519.90 13,864.09 12,700.25 9,654.29 10,804.62Bills for collection 3,477.18 3,630.44 2,677.49 2,295.90 2,414.95Book Value (Rs) 87.96 76.17 70.31 61.44 53.47
Key Financial Ratios of Vijaya Bank
Mar '12 Mar '11 Mar '10 Mar '09 Mar '08
Investment Valuation RatiosFace Value 10 10 10 10 10Dividend Per Share 2.5 2.5 2.5 1 2Operating Profit Per Share (Rs) 10.36 7.75 12.55 10.44 3.52Net Operating Profit Per Share (Rs) 164.94 128.29 133.62 128.89 91.86Free Reserves Per Share (Rs) 32 30.56 23.22 20.78 20.79Bonus in Equity Capital -- -- -- -- --Profitability RatiosInterest Spread 3.95 3.73 3.87 3.92 3.06Adjusted Cash Margin(%) 7.29 8.92 8.78 4.2 9.12Net Profit Margin 6.87 8.24 8.36 4.51 8.65Return on Long Term Fund(%) 132.59 99.54 141.84 161.2 163.48Return on Net Worth(%) 11.88 12.91 17.72 11.31 17.15Adjusted Return on Net Worth(%) 11.76 12.82 16.83 8.95 16.61Return on Assets Excluding Revaluations 76.17 70.31 61.44 53.47 48.59Return on Assets Including Revaluations 81.77 76.52 68.63 61.11 56.72Management Efficiency RatiosInterest Income / Total Funds 9.24 8.02 8.78 9.48 8.11Net Interest Income / Total Funds 2.36 2.86 3.09 2.5 1.88Non Interest Income / Total Funds 0.32 0.38 0.41 0.38 0.39Interest Expended / Total Funds 6.88 5.15 5.69 6.98 6.23Operating Expense / Total Funds 1.78 2.38 2.27 1.73 1.57Profit Before Provisions / Total Funds 0.85 0.81 1.16 1.09 0.64Net Profit / Total Funds 0.65 0.69 0.73 0.35 0.73Loans Turnover 0.15 0.13 0.15 0.17 0.14Total Income / Capital Employed(%) 9.56 8.4 9.19 9.86 8.5Interest Expended / Capital Employed(%) 6.88 5.15 5.69 6.98 6.23Total Assets Turnover Ratios 0.09 0.08 0.09 0.09 0.08Asset Turnover Ratio 0.09 5.71 5.74 5.91 4.39Profit And Loss Account RatiosInterest Expended / Interest Earned 76.17 66.69 72.14 78.53 76.78Other Income / Total Income 3.33 4.58 4.44 3.86 4.56Operating Expense / Total Income 18.63 28.33 24.7 17.58 18.48Selling Distribution Cost Composition 0.09 0.18 0.08 0.15 0.29Balance Sheet RatiosCapital Adequacy Ratio 13.06 13.88 12.5 13.15 11.22Advances / Loans Funds(%) 70.72 70.02 69.63 67.33 72.29Debt Coverage RatiosCredit Deposit Ratio 68.21 66.69 65.94 65.42 65.35Investment Deposit Ratio 34.41 34.21 33.05 33.18 33.47Cash Deposit Ratio 6.03 6.64 8.44 11.12 10.59Total Debt to Owners Fund 22.32 22.4 23.44 23.74 22.76Financial Charges Coverage Ratio 0.13 0.17 1.22 1.16 1.11Financial Charges Coverage Ratio Post Tax 1.1 1.15 1.15 1.07 1.13Leverage RatiosCurrent Ratio 0.03 0.03 0.03 0.03 0.02Quick Ratio 31.78 34.7 16.4 10.43 10.02Cash Flow Indicator Ratios
Dividend Payout Ratio Net Profit 32.1 32.01 26.85 19.33 28.07Dividend Payout Ratio Cash Profit 29.47 28.9 24.33 16.94 25.87Earning Retention Ratio 67.58 67.79 71.73 75.57 71.02Cash Earning Retention Ratio 70.25 70.94 74.51 79.26 73.36AdjustedCash Flow Times 134.74 129.13 116.31 222.94 125.95
Mar '13 Mar '12 Mar '11 Mar '10 Mar '09
Earnings Per Share 9.41 8.97 9.02 10.34 4.79Book Value 87.96 76.17 70.31 61.44 53.47
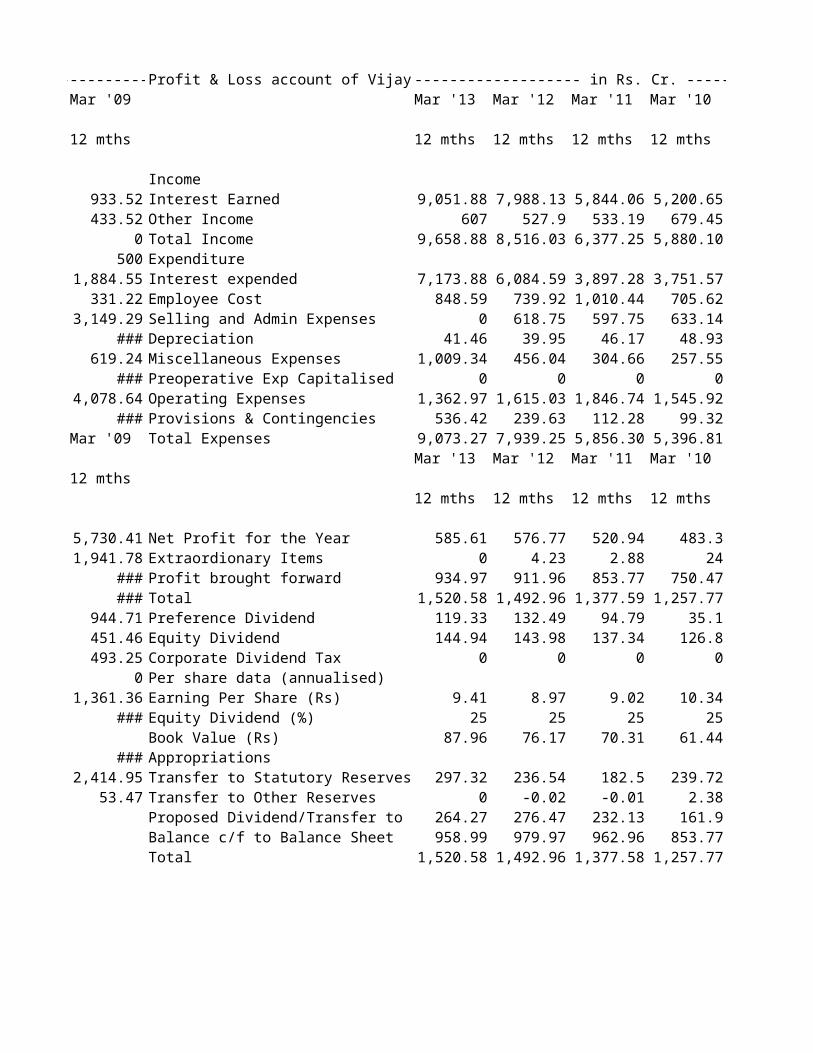
Profit & Loss account of Vijaya Bank ------------------- in Rs. Cr. -------------------Mar '13 Mar '12 Mar '11 Mar '10 Mar '09
12 mths 12 mths 12 mths 12 mths 12 mths
IncomeInterest Earned 9,051.88 7,988.13 5,844.06 5,200.65 5,237.83Other Income 607 527.9 533.19 679.45 698.81Total Income 9,658.88 8,516.03 6,377.25 5,880.10 5,936.64ExpenditureInterest expended 7,173.88 6,084.59 3,897.28 3,751.57 4,113.02Employee Cost 848.59 739.92 1,010.44 705.62 597.47Selling and Admin Expenses 0 618.75 597.75 633.14 283.94Depreciation 41.46 39.95 46.17 48.93 36.98Miscellaneous Expenses 1,009.34 456.04 304.66 257.55 697.35Preoperative Exp Capitalised 0 0 0 0 0Operating Expenses 1,362.97 1,615.03 1,846.74 1,545.92 1,058.94Provisions & Contingencies 536.42 239.63 112.28 99.32 556.8Total Expenses 9,073.27 7,939.25 5,856.30 5,396.81 5,728.76
Mar '13 Mar '12 Mar '11 Mar '10 Mar '09
12 mths 12 mths 12 mths 12 mths 12 mths
Net Profit for the Year 585.61 576.77 520.94 483.3 207.87Extraordionary Items 0 4.23 2.88 24 54.61Profit brought forward 934.97 911.96 853.77 750.47 750.69Total 1,520.58 1,492.96 1,377.59 1,257.77 1,013.17Preference Dividend 119.33 132.49 94.79 35.1 0.1Equity Dividend 144.94 143.98 137.34 126.8 50.72Corporate Dividend Tax 0 0 0 0 0Per share data (annualised)Earning Per Share (Rs) 9.41 8.97 9.02 10.34 4.79Equity Dividend (%) 25 25 25 25 10Book Value (Rs) 87.96 76.17 70.31 61.44 53.47AppropriationsTransfer to Statutory Reserves 297.32 236.54 182.5 239.72 211.9Transfer to Other Reserves 0 -0.02 -0.01 2.38 -0.01Proposed Dividend/Transfer to Govt 264.27 276.47 232.13 161.9 50.82Balance c/f to Balance Sheet 958.99 979.97 962.96 853.77 750.47Total 1,520.58 1,492.96 1,377.58 1,257.77 1,013.18
Balance Sheet of Syndicate Bank ------------------- in Rs. Cr. -------------------Mar '13 Mar '12 Mar '11 Mar '10 Mar '09
12 mths 12 mths 12 mths 12 mths 12 mths
Capital and Liabilities:Total Share Capital 601.95 601.95 573.29 521.97 521.97Equity Share Capital 601.95 601.95 573.29 521.97 521.97Share Application Money 0 0 0 0 0Preference Share Capital 0 0 0 0 0Reserves 9,939.39 7,433.79 6,083.66 4,700.89 4,073.10Revaluation Reserves 0 1,005.41 393.9 404.19 414.95Net Worth 10,541.34 9,041.15 7,050.85 5,627.05 5,010.02Deposits 185,355.89 157,941.06 135,596.08 117,025.79 115,885.14Borrowings 12,813.80 10,589.91 9,527.64 12,172.69 2,190.48Total Debt 198,169.69 168,530.97 145,123.72 129,198.48 118,075.62Other Liabilities & Provisions 6,411.30 4,895.95 4,364.22 4,225.42 7,170.03Total Liabilities 215,122.33 182,468.07 156,538.79 139,050.95 130,255.67
Mar '13 Mar '12 Mar '11 Mar '10 Mar '09
12 mths 12 mths 12 mths 12 mths 12 mths
AssetsCash & Balances with RBI 8,095.31 8,808.63 10,443.12 7,189.12 12,543.23Balance with Banks, Money at Call 8,488.93 5,075.64 1,522.53 5,544.73 1,861.18Advances 147,569.02 123,620.18 106,781.92 90,406.36 81,532.27Investments 45,647.66 40,815.06 35,067.62 33,010.93 30,537.23Gross Block 2,255.32 2,075.30 1,347.77 1,279.20 1,225.00Accumulated Depreciation 847.94 747.46 670.73 596.72 504.84Net Block 1,407.38 1,327.84 677.04 682.48 720.16Capital Work In Progress 26.58 23.74 15.69 18.95 21.87Other Assets 3,887.44 2,796.97 2,030.87 2,198.37 3,039.73Total Assets 215,122.32 182,468.06 156,538.79 139,050.94 130,255.67
Contingent Liabilities 78,034.82 52,188.20 49,111.58 49,817.68 72,889.02Bills for collection 4,252.33 6,533.86 5,449.74 4,993.24 5,493.69Book Value (Rs) 175.12 133.5 116.12 100.06 88.03
Key Financial Ratios of Syndicate Bank
Mar '13 Mar '12 Mar '11 Mar '10 Mar '09
Investment Valuation RatiosFace Value 10 10 10 10 10
Dividend Per Share 6.7 3.8 3.7 3 3Operating Profit Per Share (Rs) 39.47 26.82 25.58 20.12 17.73Net Operating Profit Per Share (Rs) 284.42 265.68 209.2 207.66 191.2Free Reserves Per Share (Rs) -- 77.63 67.26 54.5 49.72Bonus in Equity Capital -- -- -- -- --Profitability RatiosInterest Spread -- 4.2 3.91 3.06 3.48Adjusted Cash Margin(%) 11.5 8.46 9.07 8 9.92Net Profit Margin 10.95 8.05 8.5 7.22 8.83Return on Long Term Fund(%) 125.5 144.48 125.48 162.39 174.39Return on Net Worth(%) 19.01 16.34 15.74 15.57 19.86Adjusted Return on Net Worth(%) 19.01 16.34 15.74 15.57 19.86Return on Assets Excluding Revaluations 175.12 133.5 116.12 100.06 88.03Return on Assets Including Revaluations 175.12 150.2 122.99 107.8 95.98Management Efficiency RatiosInterest Income / Total Funds 8.63 9.47 8.14 8.07 8.44Net Interest Income / Total Funds 2.75 3.44 3.34 2.63 2.54Non Interest Income / Total Funds 0.59 0.19 0.23 0.31 0.3Interest Expended / Total Funds 5.88 6.03 4.8 5.44 5.9Operating Expense / Total Funds 1.55 2.48 2.35 1.85 1.76Profit Before Provisions / Total Funds 1.74 1.1 1.17 1.03 0.99Net Profit / Total Funds 1.01 0.78 0.71 0.61 0.77Loans Turnover 0.28 0.14 0.12 0.13 0.14Total Income / Capital Employed(%) 9.23 9.66 8.36 8.39 8.74Interest Expended / Capital Employed(%) 5.88 6.03 4.8 5.44 5.9Total Assets Turnover Ratios 0.09 0.09 0.08 0.08 0.08Asset Turnover Ratio 0.09 0.1 0.08 0.08 0.09Profit And Loss Account RatiosInterest Expended / Interest Earned 68.14 66.7 61.73 72.73 72.84Other Income / Total Income 6.42 1.92 2.71 3.73 3.43Operating Expense / Total Income 16.83 25.72 28.05 22.04 20.1Selling Distribution Cost Composition -- 0.09 0.58 0.58 0.22Balance Sheet RatiosCapital Adequacy Ratio 12.59 12.24 13.04 12.7 11.37Advances / Loans Funds(%) -- 78.83 77.85 73.12 76Debt Coverage RatiosCredit Deposit Ratio 36.01 78.49 78.06 73.82 68.98Investment Deposit Ratio 25.19 25.85 26.95 27.28 27.77Cash Deposit Ratio 4.92 6.56 6.98 8.47 10.86Total Debt to Owners Fund 17.58 19.65 20.37 22.41 25.22Financial Charges Coverage Ratio 0.3 0.19 0.25 0.2 0.18Financial Charges Coverage Ratio Post Tax 1.18 1.14 1.16 1.12 1.15Leverage RatiosCurrent Ratio 0.79 0.02 0.01 0.02 0.02Quick Ratio 24.89 27.62 27.33 23.62 13.54Cash Flow Indicator RatiosDividend Payout Ratio Net Profit 23.54 20.24 23.52 22.45 20.07Dividend Payout Ratio Cash Profit 22.41 19.27 22.03 20.25 17.85
Earning Retention Ratio 76.46 79.77 76.49 77.55 79.93Cash Earning Retention Ratio 77.59 80.74 77.98 79.75 82.14AdjustedCash Flow Times 88.05 114.48 121.16 129.81 112.98
Mar '13 Mar '12 Mar '11 Mar '10 Mar '09
Earnings Per Share 33.3 21.82 18.28 15.58 17.49Book Value 175.12 133.5 116.12 100.06 88.03

Profit & Loss account of Syndicate Bank ------------------- in Rs. Cr. -------------------Mar '13 Mar '12 Mar '11 Mar '10 Mar '09
12 mths 12 mths 12 mths 12 mths 12 mths
IncomeInterest Earned 17,120.69 15,268.35 11,450.86 10,047.18 9,579.64Other Income 1,174.36 1,075.88 915.12 1,167.46 908.2Total Income 18,295.05 16,344.23 12,365.98 11,214.64 10,487.84ExpenditureInterest expended 11,666.63 10,183.32 7,068.10 7,307.37 6,977.60Employee Cost 2,179.21 1,891.50 1,773.31 1,337.76 1,045.16Selling and Admin Expenses 0 1,894.18 1,409.41 931.26 808.66Depreciation 100.66 66.04 70.96 88.17 113.02Miscellaneous Expenses 2,344.12 995.81 996.25 736.75 630.58Preoperative Exp Capitalised 0 0 0 0 0Operating Expenses 3,178.83 4,260.61 3,529.38 2,569.57 2,190.01Provisions & Contingencies 1,445.16 586.92 720.55 524.37 407.41Total Expenses 16,290.62 15,030.85 11,318.03 10,401.31 9,575.02
Mar '13 Mar '12 Mar '11 Mar '10 Mar '09
12 mths 12 mths 12 mths 12 mths 12 mths
Net Profit for the Year 2,004.42 1,313.39 1,047.95 813.32 912.82Extraordionary Items 0 0 0 0 0Profit brought forward 0 0 0 0 0Total 2,004.42 1,313.39 1,047.95 813.32 912.82Preference Dividend 0 0 0 0 0Equity Dividend 403.31 228.74 212.12 156.59 156.58Corporate Dividend Tax 68.54 37.11 34.41 26.01 26.62Per share data (annualised)Earning Per Share (Rs) 33.3 21.82 18.28 15.58 17.49Equity Dividend (%) 67 38 37 30 30Book Value (Rs) 175.12 133.5 116.12 100.06 88.03AppropriationsTransfer to Statutory Reserves 720.71 528.63 371.99 381.11 356.34Transfer to Other Reserves 811.86 518.91 429.43 249.61 373.28Proposed Dividend/Transfer to Govt 471.85 265.85 246.53 182.6 183.2Balance c/f to Balance Sheet 0 0 0 0 0Total 2,004.42 1,313.39 1,047.95 813.32 912.82

Mar '13 Mar '12 Mar '11 Mar '10 Mar '09
Profitability Ratios Syndicate Bank Interest Spread -- 4.2 3.91 3.06 3.48Adjusted Cash Margin(%) 11.5 8.46 9.07 8 9.92Net Profit Margin 10.95 8.05 8.5 7.22 8.83Return on Long Term Fund(%) 125.5 144.48 125.48 162.39 174.39Return on Net Worth(%) 19.01 16.34 15.74 15.57 19.86Adjusted Return on Net Worth(%) 19.01 16.34 15.74 15.57 19.86Return on Assets Excluding Revaluations 175.12 133.5 116.12 100.06 88.03Return on Assets Including Revaluations 175.12 150.2 122.99 107.8 95.98
VIJAYA BANKInterest Spread 3.95 3.73 3.87 3.92 3.06Adjusted Cash Margin(%) 7.29 8.92 8.78 4.2 9.12Net Profit Margin 6.87 8.24 8.36 4.51 8.65Return on Long Term Fund(%) 132.59 99.54 141.84 161.2 163.48Return on Net Worth(%) 11.88 12.91 17.72 11.31 17.15Adjusted Return on Net Worth(%) 11.76 12.82 16.83 8.95 16.61Return on Assets Excluding Revaluations 76.17 70.31 61.44 53.47 48.59Return on Assets Including Revaluations 81.77 76.52 68.63 61.11 56.72
CORPORATION BANKInterest Spread -- 3.62 3.37 3.51 4.02Adjusted Cash Margin(%) 9.03 11 12.54 13.7 12.36Net Profit Margin 8.46 10.43 13.89 14.05 12.88Return on Long Term Fund(%) 139.48 142.31 110.99 115.17 115.83Return on Net Worth(%) 14.99 18.19 19.79 20.26 18.23Adjusted Return on Net Worth(%) 14.99 18.21 16.9 18.61 16.38Return on Assets Excluding Revaluations 625.56 558.7 481.85 402.6 341.36Return on Assets Including Revaluations 625.56 558.7 481.85 402.6 341.36
CANARA BANKInterest Spread 3.8 3.47 3.32 3.47 3.47Adjusted Cash Margin(%) 10.22 16.23 14.46 11.8 10.65Net Profit Margin 9.76 15.65 13.77 10.89 9.61Return on Long Term Fund(%) 132.08 112.95 134.69 149.13 151.48Return on Net Worth(%) 15.91 22.43 24.09 20.64 18.86Adjusted Return on Net Worth(%) 15.91 22.43 24.07 20.63 18.85Return on Assets Excluding Revaluations 465.57 405 305.83 244.87 202.33Return on Assets Including Revaluations 512.19 452.37 357.85 297.75 256.11
STATE BANK OF MYSORE Interest Spread -- 4.36 4.77 4.29 3.65Adjusted Cash Margin(%) 7.05 7.54 12.17 12.13 10.36Net Profit Margin 6.34 6.64 11.06 11.08 9.2Return on Long Term Fund(%) 111.25 115.78 102.75 145.93 173.92Return on Net Worth(%) 9.6 10.81 16.15 21.49 20.16

Adjusted Return on Net Worth(%) 9.6 10.81 16.17 21.48 20.15Return on Assets Excluding Revaluations 925.76 729.22 662.28 575.94 464.2Return on Assets Including Revaluations 925.76 852.25 787.04 740.36 630.85
AVERARE OF 5 YEARS
Profitability Ratios SYD BANK CORP BAN VIJAYA CANARA SBM
Adjusted Cash Margin(%) 9.39 11.726 7.662 12.672 10.3625Net Profit Margin 8.71 11.942 7.326 11.936 9.9785Return on Long Term Fund(%) 146.448 124.756 139.73 136.066 136.75Return on Net Worth(%) 17.304 18.292 14.194 20.386 17.544Adjusted Return on Net Worth(%) 17.304 17.018 13.394 20.378 17.0235Return on Assets Excluding Revaluations 122.566 482.014 61.996 324.72 247.824Return on Assets Including Revaluations 130.418 482.014 68.95 375.254 264.159
AVERAGE PERCENT OF GROWTH
9.39 -13.739138.71 -19.36073
146.448 38.9561817.304 4.47133117.304 4.471331
122.566 -49.73161130.418 -45.19187
#VALUE!3.706 -22.531657.662 25.102887.326 25.90975
139.73 23.2973814.194 44.3602713.394 41.241561.996 -36.20848
68.95 -30.63471
3.6311.726 36.8770811.942 52.24586
124.756 -16.9558418.292 21.6144117.018 9.272849
482.014 -45.43129482.014 -45.43129
3.506 CAN BAN 1 1 1 1 112.672 SYD BAN 0.939032 0.833092 0.878054 0.790179 0.75706611.936 VB 0.604071 0.698247 0.529857 0.545749 0.553608
136.066 COR BAN 0.997644 0.997505 0.986011 0.969805 0.95587120.386 SBM 0.99227 0.997016 0.981089 0.967732 0.96447220.378324.72
375.254
4.2675 SBM 1 1 1 1 19.85 SYD BAN 0.898156 0.790485 0.769315 0.610366 0.557889
8.864 VB 0.512841 0.64388 0.355865 0.31823 0.315798129.926 COR BAN 0.997159 0.992469 0.992474 0.987139 0.982096
15.642 CAN BAN 0.99227 0.997016 0.981089 0.967732 0.964472
15.642671.48
787.252
CORRELATION OF PROFITABILITY RATIO
CO EFFICIENT FACTORS OF CORRELATION BETWEEN SYD BANK TO OTHER BANKS
Mar '13 Mar '12 Mar '11 Mar '10 Mar '09SB 1 1 1 1 1VB 0.837447 0.977507 0.868906 0.94348 0.961839 CCB 0.928723 0.832838 0.808319 0.645256 0.567688CAB 0.939032 0.833092 0.878054 0.790179 0.757066SBM 0.898156 0.790485 0.769315 0.610366 0.557889
CO EFFICIENT FACTORS OF CORRELATION BETWEEN VIJAYA BANK TO OTHER BANKS
Mar '13 Mar '12 Mar '11 Mar '10 Mar '09VB 1 1 1 1 1SB 0.837447 0.977507 0.868906 0.94348 0.961839CB 0.575959 0.70007 0.411065 0.356165 0.321181CNB 0.604071 0.698247 0.529857 0.545749 0.553608SBM 0.512841 0.64388 0.355865 0.31823 0.315798
CO EFFICIENT FACTORS OF CORRELATION BETWEEN CORPORATION BANK TO OTHER BANKS
Mar '13 Mar '12 Mar '11 Mar '10 Mar '09CB 1 1 1 1 1SYD BAN 0.928723 0.832838 0.808319 0.645256 0.567688VB 0.575959 0.70007 0.411065 0.356165 0.321181CAN BAN 0.997644 0.997505 0.986011 0.969805 0.955871SBM 0.997159 0.992469 0.992474 0.987139 0.982096
CO EFFICIENT OF CORRELATION FACTORS BETWEEN CANARA BANK TO OTHER BANKS Mar '13 Mar '12 Mar '11 Mar '10 Mar '09
CAN BAN 1 1 1 1 1SYD BAN 0.939032 0.833092 0.878054 0.790179 0.757066VB 0.604071 0.698247 0.529857 0.545749 0.553608COR BAN 0.997644 0.997505 0.986011 0.969805 0.955871SBM 0.99227 0.997016 0.981089 0.967732 0.964472
CO EFFICIENT OF CORRELATION FACTORS BETWEEN SBM TO OTHER BANKS Mar '13 Mar '12 Mar '11 Mar '10 Mar '09
SBM 1 1 1 1 1SYD BAN 0.898156 0.790485 0.769315 0.610366 0.557889VB 0.512841 0.64388 0.355865 0.31823 0.315798COR BAN 0.997159 0.992469 0.992474 0.987139 0.982096CAN BAN 0.99227 0.997016 0.981089 0.967732 0.964472

CO EFFICIENT FACTORS OF CORRELATION BETWEEN CORPORATION BANK TO OTHER BANKS