bank competition and bank liquidity creation€¦ · bank competition and bank liquidity creation*...
TRANSCRIPT

Bank Competition and Bank Liquidity Creation*
Seungho Choi**
University of New South Wales
First Draft: December 2014
This Draft: October 2017
Abstract: Using comprehensive measures of bank liquidity creation by Berger and Bouwman
(2009), I investigate empirically whether bank competition affects bank liquidity creation among
16367 banks from 1984 to 2007. I find that bank-level competition affects bank’s liquidity creation
strategy. Using bank-level competition measure, I find that banks create less liquidity when the
market is more competitive. Exploiting intra- and interstate bank deregulations and interstate bank
branching deregulation, I find that banks create less liquidity as interstate branching restrictions
release but banks do not significantly respond to intra- and interstate banking deregulation.
Different from bank-level analysis, state-level analysis shows that bank deregulation events do not
significantly affect state-level bank liquidity creation on average. The results highlight the role of
proper regulation to encourage depressed credit market in the United States.
Keywords: Bank Competition, Bank Liquidity Creation, Deregulation, Government Regulation
JEL Classification: G21, G28, G32
* Preliminary draft, please do not circulate. The first draft of this paper was written in December 2014. Comments
and suggestions are welcome. I would like to thank Renee Adams, Allen Berger, Christa Bouwman, Chang-Mo
Kang, and Eliza Wu for helpful advice and comments. I also thank conference participants at Conference on
Competition in Banking and Finance and 7th Annual FIRN Conference. All remaining errors are my own. ** UNSW Australia Business School at University of New South Wales, College Rd, Sydney NSW 2033
Mobile: 0402 560 267 E-mail: [email protected].

1
1. Introduction
The two central roles that banks play in the economy are risk transformation and liquidity creation.
Since banks have the advantage of economies of scale, they can transform risk by issuing riskless
deposits to finance risky loans. This risk transformation may coincide with liquidity creation. As
these two main roles are crucially important in the economy, there are many previous studies of
them. However, the past literature mostly leans toward the banks’ role as risk transformers, even
though their role as liquidity creators is an essential part of banking, and interest in bank liquidity
creation increases after the recent financial crisis (e.g., Ivashina and Scharfstein, 2010).
The reason why empirical studies examining theoretical views of bank liquidity creation
are rare is the absence of a comprehensive measure of bank liquidity creation. However, Berger
and Bouwman (2009) provide comprehensive bank liquidity creation measures that allow us to
investigate empirical research questions about a bank’s role as a liquidity creator. They classify
balance sheet activities as liquid, semi-liquid, or illiquid. Once all of the balance sheet activities
are classified, the authors assign weights, which are ranged from -0.5 to 0.5, and calculated the
measures by summing all weighed activities. The specifications classify all items except loans by
combining information on both product category and maturity, while loans are classified based
purely on either category or maturity (i.e., “cat” or “mat” measures) because of the lack of data
availability. In addition, off-balance-sheet items are either included or excluded (i.e., “fat” or
“nonfat” measures).
Bank competition is a popular issue in banking research: both theoretical and empirical
literature on the topic has emerged. The previous literature about bank competition mostly focuses
on its impact on financial stability, risk-taking, access to credit, and bank failure. Two views of
competition—“competition-fragility” and “competition-stability”—are posited in the literature.
Even though some studies find empirical evidence for each view, the findings of the empirical
research that explores the links between competition and risk are rather mixed and still
inconclusive. For example, Berger, Klapper, and Turk-Ariss (2009) find limited support for both
the competition-fragility and the competition-stability views. However, there has not been enough

2
discussion about the effect of bank competition on bank liquidity creation. Thus, in this paper, I
examine whether bank competition affects bank liquidity creation, using a panel dataset of U.S.
banks from 1984 to 2007.
Like bank competition literature, the empirical results of my research could also have
mixed evidence. On the one hand, I expect a positive relationship between bank competition and
bank liquidity creation. For example, less bank competition (i.e., more market power) may induce
banks to raise lending interest rates and, thus, firms to have lower demands for borrowing money
from banks, because the banks with a higher level of market power dominate the market. Also, the
banks may raise loan rates and lower deposit rates when the market becomes less competitive,
which means that banks would have more market power to increase their charter value. From this
point of view, large banks are likely to create less liquidity in the market when their market power
is significant. Compared to smaller banks, large banks have a more secured buffer for overcoming
unexpected financial shocks, because they have several different branches, and each branch would
have different market conditions. These variations among different branches of the large banks
could be considered as a way of hedging against risk. That is why the large banks could pursue a
strategy creating less liquidity, which is an aggressive strategy for maximizing their profit when
they dominate the market. Thus, banks in a less competitive market might create less liquidity, and
banks in a more competitive market would create more liquidity.
On the other hand, I expect a negative relationship between bank competition and bank
liquidity creation. Less bank competition might induce banks to provide more liquidity. For
instance, banks supply more loans when the market becomes more concentrated, because the banks
are likely to take on more risk when they have more market power. Also, banks in a less
competitive market may provide more liquidity because they can supply more loans through
relationship banking while taking more deposits. Banks focusing on relationship banking could
create more liquidity to keep the relationship with their borrowers. From this point of view, banks
would create more liquidity in the market when they have more market power (i.e., when they are
less competitive).

3
To test these hypotheses, I construct a panel dataset for the sample period between 1984
and 2007. The data covers almost all the commercial banks in the United States. I collect the data
from various sources such as Call Reports, DealScan, Summary of Deposits surveys, the Federal
Housing Finance Agency, the U.S. Census Bureau, the U.S. Department of the Treasury, and
Christa Bouwman's personal website.
Following previous studies regarding bank competition (e.g., Fernandez de Guevara,
Maudos, and Perex, 2005; Berger, Klapper, and Turk-Ariss, 2009; Koetter, Kolari, and Spierdijk,
2012; Jimenez, Lopez, and Saurina, 2013; and Berger and Roman, 2015), I use the Lerner Index
for gross total assets (GTA), which is calculated as the observed price-cost margin divided by
price, as a proxy for bank competition, which is a key independent variable in this research. The
value of the Lerner Index ranges from 0 to 1. A 0 value on the Lerner Index means perfect
competition, and when the value of Lerner Index is equal to 1, a monopoly is considered to exist.
Thus, banks with any degree of market power except the two extremes have a positive Lerner
Index value. In addition, I exploit the U.S. banking deregulation events, including intra- and
interstate deregulation and interstate branching deregulation, as exogenous shocks on bank
competition (e.g., Johnson and Strahan, 2008; Rice and Strahan, 2009; Koetter, Kolari, and
Spierdijk, 2012; Chava, Oettl, Subramanian, and Subramanian, 2013; Krishnan, Nandy, and Puri,
2014; Cornaggia, Mao, Tian, and Wolfe, 2015).
Based on Berger and Bouwman (2009), I choose the most comprehensive bank liquidity
creation measure, “catfat,” among four different bank liquidity creation proxies to measure bank
liquidity creation. This is a key dependent variable among the various specifications in this paper.
In addition, there could be endogeneity issues such as reverse causality and omitted variables. For
example, banks that create more liquidity may have higher market power. Also, it is possible that
many other factors affecting both bank liquidity creation and bank competition are unobservable.
Thus, I used multiple empirical approaches, including a fixed-effects model and difference-in-
differences estimation, to mitigate these endogeneity problems.

4
Using the panel dataset that includes all sample banks, I find that reverse relationship
between bank competition and bank liquidity creation. In other words, banks with a higher level
of market power create more liquidity in the market. At this stage, I could not check whether this
result is caused by reaping monopolistic rents or maintaining a relationship with borrowers. To
disentangle these effects, I split the sample into large, medium-sized, and small banks and test
whether the negative relationship exists for every size class of banks or only for specific size
classes. Through the subsample analysis by bank size, I find that only small-sized banks
significantly create more liquidity in the market as bank competition decreases. However, I do not
claim causal relation because of endogeneity concerns.
Following previous studies exploiting U.S. intra- and interstate banking deregulation and
interstate branching deregulation as exogenous shocks on bank competition (e.g., Johnson and
Strahan, 2008; Rice and Strahan, 2009; Koetter, Kolari, and Spierdijk, 2012; Chava, Oettl,
Subramanian, and Subramanian, 2013; Krishnan, Nandy, and Puri, 2014; Cornaggia, Mao, Tian,
and Wolfe, 2015), I exploit the exogenous variation in bank competition using the U.S. banking
deregulation events. Intrastate deregulation allows banks to merge or acquire other banks inside
the market where they are located. In contrast, interstate deregulation allows banks to acquire a
commercial bank in deregulated states. More importantly, interstate branching deregulation allows
out-of-state banks to acquire a branch in the deregulated states and the level of openness varies
over time.
The results of analysis using the deregulation events are consistent with the results of
analysis using the Lerner Index as a bank competition measure. Exploiting intra- and interstate
bank deregulations, I find that banks do not significantly respond to both intra- and interstate
banking deregulation. However, exploiting interstate bank branching deregulation, I find that
interstate bank branching deregulation leads to reduction in bank liquidity creation. To be specific,
banks create more liquidity as the level of interstate branching regulation in their home state
increases. I also find that small banks create more liquidity than medium/large banks as branching
restrictions release.

5
The results make sense because interstate deregulation requires much higher fixed costs to
invest in deregulated states. Only sizable banks are able to acquire and/or establish a charter in a
state outside the main bank's home state. On the other hand, small banks would not compete with
the sizable competitors. That is why these two effects could offset each other. In addition, existing
large banks in the deregulated state could have chance to invest in the other deregulated states.
This could also affect the insignificant effects of interstate deregulation.
Interstate branching deregulation lowers fixed costs to invest in the deregulated states.
Different from interstate bank deregulation, interstate branching deregulation allows banks to
acquire a branch. For example, banks in highly restrictive states would be secured than banks in
highly open states in terms of the outside threat. In addition, they have much lower fixed costs to
enter the new market after interstate branching deregulation. Thus, they have incentives to acquire
or establish a new branch in the neighboring states, where the level of restrictiveness is lower than
their home state. In this situation, large banks would create less liquidity to enjoy monopolistic
rents and small banks would create less liquidity to avoid default risks. In a relative sense, smaller
banks would create more liquidity than large banks to keep their relationship banking. This means
that the negative effect of bank competition on bank liquidity creation is weaker for smaller banks.
Investigating bank-level relation between bank competition and bank liquidity creation is
interesting and important. However, my results suggest that economic magnitude of bank-level
analysis is not significant. Causal effects of interstate bank branching deregulation on bank-level
liquidity creation suggest that completely open states generate a total of 1.82% less liquidity
creation post branching deregulation than the most restrictive states.
In addition, for the perspective of regulators, bank-level analysis would not be important
than aggregate state-level analysis because policy makers do care about local market economy. To
derive policy implication concerning bank competition and bank liquidity creation, I examine
state-level analysis.
Following Berger and Sedunov (2017), I test whether state-level bank competition affects
state-level bank liquidity creation. To construct state-level liquidity creation and control variables,
I rely on each bank’s state deposit market shares as a proxy for weights on states where they operate

6
branches. Interestingly, state-level analysis shows that bank deregulation events do not affect state-
level bank liquidity creation on average. This result suggests that intra- and interstate bank
deregulation and interstate branching deregulation do not really stimulate the depressed capital
market. Based on both bank-level and state-level results, the key policy implication is that a policy
to encourage bank competition would be more efficient if the policy applies to banks depending
on banks’ heterogeneity, such as bank size and bank market share, and markets’ heterogeneity,
such as market demand and supply-side competition status prior to the policy implementation.
My paper contributes the literature that investigates the effects of banking deregulation.
Even though Jayaratne and Strahan (1996) find that interstate deregulation results in economic
growth in local markets, results of my paper suggest that the effects might not be driven by banking
activities because bank liquidity creation would be crucial bank-side activity to encourage local
market growth.
Second, my paper contributes to the literature on bank liquidity creation. Because of lack
of comprehensive bank liquidity creation measures, there is few empirical studies examining the
determinants of bank liquidity creation and/or the effects of bank liquidity creation before Berger
and Bouwman (2009) provide the comprehensive measure, which is catfat. This literature shows
relations between liquidity creation and equity ratio (Berger and Bouwman, 2009), corporate
governance (Diaz and Huang, 2017), and real economic output (Berger and Sedunov, 2017).
I am aware of a contemporaneous study by Jiang, Levine, and Lin (2016), which also
examine the relationship between bank competition and bank liquidity creation. Based on interstate
bank deregulation, they construct distance-weighted bank competition measures, which are
continuous bank-level measures. Their measure considers the distance between each bank in the
deregulated state and capital city of the other states as a factor of bank competition. Using the
bank-level distance-weighted interstate deregulation measures, they find that regulatory-induced
competition has a negative effect on bank liquidity creation.
Different from this study, I focus on both state-level and bank-level analyses that examine
the effects of bank competition on bank liquidity creation. State-level analysis allows me to
generate policy implications on bank competition. In addition, I exploit interstate bank branching

7
deregulation, which would be more important on bank liquidity creation because decisions about
loan and deposit contracts are made by branch managers. Same as Chava, Oettl, Subramanian, and
Subramanian (2013) and Cornaggia, Mao, Tian, and Wolfe (2015), my paper and Jiang, Levine,
and Lin (2016) suggest two different perspectives of bank deregulation.
The remainder of this paper is organized as follows. I first review the existing literatures
on bank competition and bank liquidity creation. In Section 3, I develop testable hypotheses.
Section 4 describes data and methodologies. Section 5 provides empirical results and Section 6
concludes.
2. Literature Review
2.1 Bank Competition
The deregulation of banking activities has drawn much attention of researchers and regulators on
the role of competition in the banking industry. Previous literature about bank competition mostly
focused on the impact of bank competition on financial stability, risk-taking, access to credit, and
bank failure. However, there is not enough discussion about the effect of bank competition on bank
liquidity creation.
There are two strands of literature on bank competition: “competition-fragility” and
“competition-stability.” The “competition-fragility” view suggests that enhanced bank
competition results in reduced profit margins and franchise value, and this induce banks to take
excessive risk. According to past literature on the view, profit margins play as a safeguard in the
event of financial distress so banks try to recover their profit margins by taking excessive risk even
though the projects are high risk projects (e.g., Repullo, 2004). In addition, banks tend to protect
their franchise value when the market is more concentrated by taking less risk because high
franchise value implies high opportunity costs of bank failure (e.g., Keeley, 1990; Hellmann,
Murdock, and Stiglitz, 2000). Thus, the “competition-fragility” view supports the argument that
higher level of bank competition would result in more fragility.

8
The second view of bank competition is the “competition-stability” view. This view argues
that bank competition makes financial system more stable. That is, more concentrated market
power could lead to higher bank risk and/or higher probability of bank failure. Past literature
supporting the “competition-stability” argues that the more bank market power, the more bank risk
exposure. This is because the dominant banks enjoy monopolistic rents, such as higher interest
rates and lower deposit rates, through their market power and it could lead to adverse selection and
risk shifting (e.g., Stiglitz and Weiss, 1981). Boyd and De Nicolo (2005) and Schaeck, Cihak, and
Wolfe (2009) also support the “competition-stability” view. These studies suggest that the more
market power, the less stable financial system. Different from previous studies, Boyd and De
Nicolo (2005) construct models that allow bank competition for both deposit and loan markets,
and they suggest the reverse relation between bank competition and bank failure. Less bank
competition means more concentrated market power, and less bank competition could lead to
higher loan rates and lower deposit rates because banks with higher level of market power have
incentives to pursue monopolistic rents. Reduced bank competition could lead to either a more
stable credit market, which is an intended result of government policy, or a highly dominated and
limited credit market, which is an unexpected incident. Using 45 countries international data,
Scaheck, Cihak, and Wolfe (2009) also support this view. They find that enhanced bank
competition tends to be more stable and tend not to suffer systemic crisis.
However, Berger, Klapper, and Turk-Ariss (2009) take a moderate position because they
find mixed empirical results about the effects of bank competition on financial stability. Berger,
Klapper, and Turk-Ariss (2009) find that market power increases credit risk, but banks with more
market power face less risk overall, using a variety of risk and competition measures derived from
a dataset of banks located in 23 countries. Thus, the paper suggests limited support to both the
competition-fragility and the competition-stability views. These mixed results suggest that the
effects of bank competition on bank activities could also be mixed under heterogeneous
circumstances.

9
2.2 Bank Liquidity Creation
There are many past studies that suggests the reason why banks exist is to create liquidity to
borrowers and lenders (e.g., Bryant, 1980; Diamond and Dybvig, 1983; Gorton and Pennacchi,
1990; Holmstrom and Tirole, 1996; Kashyap, Rajan, and Stein, 2002; Gatev and Strahan, 2006).
Banks create liquidity because they grant long-term and illiquid loans to borrowers by using short-
term and liquid deposits. Bryant (1980) and Diamond and Dybvig (1983) argue that banks create
liquidity on the balance sheet by financing relatively illiquid assets with relatively liquid liabilities.
Also, Holmstrom and Tirole (1998) and Kashyap, Rajan, and Stein (2002) suggest that banks also
create liquidity in form of loan commitments or credit lines. This means that banks create liquidity
off the balance sheet as well. Loan commitments can give a borrower the option to draw down
them on demand during the period of the contract. These withdrawals are uncertain to the bank.
From the perspectives of customers, loan commitments provide liquidity whenever they require
liquidity unexpectedly.
Empirical studies concerning about bank liquidity creation are relatively insufficient
because of the absence of comprehensive measure of bank liquidity creation. Deep and Schaefer
(2004) develop Liquidity Transformation gap as a measure of liquidity creation, but it is not
comprehensive measure. Berger and Bouwman (2009) provide four measures of liquidity creation
and argue that catfat measure is better than other measures including Liquidity Transformation
gap, which is similar to mat nonfat measure of Berger and Bouwman (2009). Different from
Liquidity Transformation gap, catfat liquidity creation measure classifies loans by category, rather
than by maturity. This measure treats business loans as illiquid regardless of their maturity because
banks generally cannot easily dispose of them to meet liquidity needs, but this measure treats
residential mortgages and consumer loans as semiliquid because these loans can often be
securitized and sold to meet demands for liquid funds. Also, catfat includes off-balance sheet
activities as well as on-balance sheet activities. Thus, catfat measure is advanced and more
comprehensive measure of liquidity creation.
Berger and Bouwman (2009) construct a comprehensive measure of bank liquidity creation
by including off-balance sheet items and by considering categories rather than maturities. There is

10
three-step procedure to construct the liquidity creation measures. In Step 1, all balance sheet and
off-balance sheets activities are classified as liquid, semi-liquid, or illiquid. The classification is
based on the ease, cost, and time for customers to obtain liquid funds from the bank, and the ease
cost, and time for banks to dispose of their obligations to meet these liquidity demands. The
balance sheet items are classified by product category and maturity. In Step 2, weights are assigned
to the items classified in Step 1. In Step 3, liquidity creation is measured by combining the items
as classified in Step 1 and as weighted in Step 2.
Using virtually all U.S. commercial banks from 1993 to 2003, they find that the U.S.
banking industry creates $2.84 trillion in liquidity in 2003, which is equivalent to $4.56 of liquidity
creation per $1 of bank equity capital, and liquidity creation has grown substantially over the
sample period by using catfat measure. They also report that the liquidity creation differs
considerably among banks by different size. Banks categorized as large banks, about 2 percent of
their sample, account for 81 percent of the bank liquidity creation. In addition, off-balance sheet
items played a significant role in generating liquidity for banks of all sizes.
There are not enough studies examining the relationship between bank competition and
bank liquidity creation. Three exceptions are Joh and Kim (2008), Horvath, Seidler, and Weill
(2013), and Jiang, Lin, and Levine (2016). Different from my paper, first two papers use non-U.S.
data to investigate the effects of bank competition on bank liquidity creation. Horvath, Seidler, and
Weill (2013) investigate this research question but their dataset is from the Czech banking industry.
They analyze the impact of bank competition on liquidity creation, using a dataset of Czech banks
from 2002 to 2010. They find that enhanced competition reduces liquidity creation and suggest
that pro-competitive policies in the banking industry can reduce liquidity provision by banks.
However, they do not use catfat measure because of a lack of information about components of
catfat measure. According to Berger and Bouwman (2009), catfat measure is the most
comprehensive measure among the four liquidity creation measures because it includes off-balance
sheet liquidity creation and classification for loans is based on category. Joh and Kim (2008) use
an international data covering 25 OECD countries. They use catfat measure following Berger and
Bouwman (2009) but they control for size and market shares even though the key explanatory

11
variable is Lerner Index, which is strongly related to those variables. This could lead to biased
results.
Different from these papers, my paper investigates the relationship between bank
competition and bank liquidity creation, using the U.S. banking industry dataset. Also, I exploit
exogenous variation in bank competition through the U. S. banking deregulation events, including
intra- and interstate bank deregulation and interstate branching deregulation, and stick to use catfat
measure using sufficient datasets.
3. Hypothesis Development
This section details my hypotheses. By examining these hypotheses, I figure out how bank
competition affects banks’ liquidity creation strategies in a variety of circumstances.
The first testable hypothesis is that the relationship between bank competition and bank
liquidity creation is negative. In other words, I expect the positive effect of bank market power on
bank liquidity creation. The basic idea behind this hypothesis is that, in the more competitive
market, banks would suffer severe default risk and bank run risk. This is because many banks in
the competitive market try to survive by reducing their risk exposure if their resources are
concentrated on the market and they have no alternative market to move. By doing this, banks
could keep a certain amount of cash holdings, which acts as a buffer against bank default risk and
bank run risk. Thus, banks in the competitive market would create less liquidity in the market to
avoid bank failure. From a perspective of bank market power, banks with higher level of market
power would have enough sources of financing borrowers and have relatively sound internal
stability to respond to unexpected financial shocks. This argument is in line with Petersen and
Rajan (1995), suggesting that banks are less likely to supply credit when markets are more
competitive (i.e. less concentrated). They argue it is difficult for banks to internalize the benefits
of assisting the firms, so banks are less likely to grant credit to firms that do not have long-term
relationship with the banks. In other words, banks have much worse accessibility to information
on borrowers in the competitive market than in the concentrated market. Thus, banks have no

12
incentive to create liquidity for new customers without reliable information about them. Banks
could utilize their own cumulative information about existing long-term customers to evaluate
underlying risks to create more liquidity in the market. From these two perspectives, I expect that
the relationship between bank competition and liquidity creation is negative.
Hypothesis 1A: The relationship between bank competition and bank liquidity creation is negative
As I discuss in the previous section, two different views on bank competition, which are
“competition-fragility” and “competition-stability” views, could raise a possibility to have mixed
empirical results about the effects of bank competition on bank liquidity creation. The first
hypothesis is based on “competition-fragility” view. From the perspective of “competition-
stability” view, it would be possible that the impact of bank competition on bank liquidity creation
is positive.
Bank competition condition could affect banks’ decision on loan pricing and deposit rate.
To be specific, banks in more competitive market may reduce loan rates and increase deposit rate
to increase demand for both loans and deposits (e.g., Carbo-Valverde, Rodriguez-Fernandez and
Udell, 2009; Love and Martinez Peria, 2012). Also, on the other hand, less bank competition may
induce banks to raise lending interest rates and thus firms have lower demands to borrow money
from banks. In addition, Beck, Demirgüc-Kunt and Maksimovic (2004) suggest that keen
competition increases demand for loans by alleviating financing obstacles, such as collateral, to
dominate the market. This leads to higher liquidity creation. This could be a case for large banks.
Because large banks have sufficient resources to compete with the other banks in the competitive
market, they would tend to dominate the market when bank competition is severe. From the
perspective of market power, the large banks with substantial market power would tend not to
create liquidity with favorable terms because they have less default risk and bank run risk by
possessing sufficient funds in several different markets. This mechanism would allow them to
pursue monopolistic gains, such as higher loan rate and lower deposit rate. Thus, the effects of
bank competition on bank liquidity creation would be not inverse but direct.

13
Hypothesis 1B: The relationship between bank competition and bank liquidity creation is positive
Using proprietary data, Peterson and Rajan (1994) investigate the effects of relationship
banking between banks and small firms on the availability and cost of financing. They find that
relationship banking positively affects financing availability of the borrowers. They also find that
a wide and shallow relationship with multiple lenders would result in both increase in costs and
decrease in the availability of financing. These results suggest that bank competition condition
affect the efficiency of relationship banking. In highly competitive market, there are many banks
in the market to compete. In this case, borrowers have many different alternatives to finance. This
would aggravate existing lender’s private information about borrowers because new lenders can
verify the private information. On the other hand, in less competitive market (i.e. more
concentrated market), the existing lender could enjoy its informational monopoly because
possibility that the private information is verified is quite low in this case. This would lead to
availability of funds for the firms involving the relationship.
Peterson and Rajan (1995) also examine the effects of competition on relationship banking.
Results of this paper suggest that creditors are more likely to finance credit-constrained firms when
bank competition is less competitive because banks could internalize the benefits from the
relationship banking more easily in the concentrated market. This suggests that banks would want
to keep this information advantage in the concentrated market. Different from large banks, small
banks with the long-term lending relationships would create more liquidity in the less competitive
market. Because they do not have strong capabilities to build multiple deep relationships with
borrowers, they would tend to utilize their own private information and try to maximize their
profits under the constrained circumstance. From the view of bank competition, these small banks
would not create liquidity aggressively to stand a chance in competition with the other banks
because they have significant default risk and bank run risk in the highly competitive market. Thus,
in this case, they would keep their liquidity to protect themselves against the risks.

14
Enhanced bank competition could either increase or decrease bank-level liquidity creation.
In the competitive market, large banks would increase bank liquidity creation to dominate the
market. On the other hand, large banks would not increase liquidity creation to enjoy monopolistic
gains. Small banks would increase bank liquidity creation to keep their relationship banking but it
could be also possible that small banks would decrease liquidity creation to avoid the default risk
in the competitive market.
Based on arguments that the market is segmented and that banks could react to bank
competition differently, I expect that the effects of bank competition on bank-level liquidity
creation could offset each other at state-level.
Hypothesis 2: The effects of bank competition on bank-level bank liquidity creation would be offset
at the state-level.
Previous studies exploit the U.S. banking deregulation as exogenous shocks on bank
competition (e.g., Johnson and Strahan, 2008; Rice and Strahan, 2009; Koetter, Kolari, and
Spierdijk, 2012; Chava, Oettl, Subramanian, and Subramanian, 2013; Krishnan, Nandy, and Puri,
2014; Cornaggia, Mao, Tian, and Wolfe, 2015). These studies use the exogenous variation in bank
competition after the banking deregulation. Theoretically, banking deregulation could increase
bank competition, bank efficiency, and M&A activities. Also, this could improve local market
macroeconomic condition (e.g., Jayaratne and Strahan, 1996). These studies suggest that intrastate
banking deregulation and intrastate banking deregulation have different effects on banks. Intrastate
deregulation enhances market concentration because number of competitions is fixed within the
state. On the other hand, interstate deregulation leads to more competitive market because out-of-
state banks can enter the deregulated states.
Based on arguments above, the effects of intrastate deregulation could be mixed. Generally,
banks in the concentrated market through intrastate deregulation would create less liquidity
because dominant players would want to exploit monopolistic rents. However, if the dominant

15
players focus on relationship banking, then they could create more liquidity in the market to keep
their relationship with borrowers.
The effects of interstate deregulation could be also mixed. This is because of relatively
high fixed costs for acquiring and/or establishing a charter in deregulated states. Interstate bank
deregulation does not allow out-of-state banks to acquire or establish a branch in the deregulated
state. The deregulation only allows them to acquire or establish a chartered bank in the deregulated
state. This means that the newcomers are more likely to be aggressive in terms of liquidity creation.
Existing dominant banks in the state would also create more liquidity to compete with the incoming
competitors if they have sufficient resources and there is no other investment option. If they have
other investment opportunities, such as investment in the other deregulated states, they could create
less liquidity in the home state and create more liquidity in the new market. In addition, smaller
banks would create less liquidity creation to avoid default risks in the competitive market. Thus, I
expect that the effects of interstate bank deregulation on bank liquidity creation would offset.
Interstate bank branching deregulation would have different effects on bank liquidity
creation. Different from intra- and interstate bank deregulation, interstate branching deregulation
lowers fixed costs to enter the deregulated markets. Banks in more restrictive states would be more
secured than bank in more open states. Because the level of restrictiveness varies over time and
the fixed cost acquiring a branch is much lower than the fixed cost acquiring a commercial bank,
banks in relatively restrictive states could invest in a branch of the contiguous states, where the
level of restrictiveness in terms of bank branching is lower than the bank’s home state. Thus, I
expect that interstate deregulation and interstate bank branching deregulation would have
contrasting effects on bank liquidity creation and that the more restrictive interstate bank branching
regulation would lead to more bank liquidity creation.
Hypothesis 3: The effects of intrastate bank deregulation on bank liquidity creation would be
mixed.
Hypothesis 4: The effects of interstate bank deregulation on bank liquidity creation would be
mixed.

16
Hypothesis 5: The effects of interstate bank branching deregulation on bank liquidity creation
would be negative.
4. Data and Methodology
4.1 Data
To investigate the effect of bank competition on bank liquidity creation, I construct a panel dataset
during the sample period between 1984 and 2007. I collect the data from various sources such as
Call Reports, Summary of Deposits, DealScan, Federal Housing Finance Agency, United States
Census Bureau, the U.S. Department of the Treasury, and Christa Bouwman's personal website.
Most importantly, I collect the quarterly bank liquidity creation data from Christa
Bouwman’s personal website (http://faculty.weatherhead.case.edu/bouwman/data.html). The
website provides four different quarterly bank liquidity creation measures, such as catfat, cat
nonfat, mat fat, and mat nonfat, for almost all commercial banks in the United States. To construct
another key variable that proxies for bank competition, Lerner Index, I collect the bank-level
financial data that is required to calculate subcomponents of Lerner Index from Call Reports.
4.2 Key Dependent Variables and Independent Variables
In light of the foregoing discussion of previous literatures, I study several factors that affect my
key variables. I use catfat measure as a key dependent variable. According to Berger and Bouwman
(2009), the ability to securitize loans is closer to product category concept than the time until self-
liquidation, and the authors also argue that off-balance sheet activities provide liquidity in
functionally similar ways to on-balance sheet items. They find the empirical evidence to support
their argument. Thus, the seminal paper of bank liquidity creation suggests that catfat is better
measure than three other liquidity creation measures.
My key independent variables are proxies for bank competition. To indicate bank
competition, I use the Lerner index, which is an individual measure of competition for each bank
and each period. The Lerner index is commonly used in recent studies of bank competition (e.g.,

17
Fernandez de Guevara, Maudos, and Perex, 2005; Berger, Klapper, and Turk-Ariss, 2009;
Jimenez, Lopez, and Saurina, 2013; Berger and Roman, 2014).
The Lerner index is defined as the difference between price and marginal cost, divided by
price, i.e., it measures the market power of a bank to set a price above marginal cost. Thus, high
values of the Lerner index are associated with significant market power.
𝐿𝑒𝑟𝑛𝑒𝑟𝑖𝑡 =𝑃𝑟𝑖𝑐𝑒𝑖𝑡 −𝑀𝐶𝑖𝑡
𝑃𝑟𝑖𝑐𝑒𝑖𝑡
Following the methodological approach of Fernandez de Guevara, Maudos, and Perex
(2005), Berger, Klapper, and Turk-Ariss (2009), and Berger and Roman (2014), I consider 𝑃𝑟𝑖𝑐𝑒𝑖𝑡
as the price of GTA proxied by the ratio of total revenues to GTA for bank i at time t and 𝑀𝐶𝑖𝑡 as
the marginal cost of total assets for a bank i at time t. To compute 𝑀𝐶𝑖𝑡 for each bank for each
time period, I take the derivative from the following estimated translog cost function:
ln(𝐶𝑜𝑠𝑡𝑖𝑡) = 𝜃0 + 𝜃1 ln 𝐺𝑇𝐴𝑖𝑡 +𝜃22ln𝐺𝑇𝐴𝑖𝑡
2 +∑𝛾𝑘 ln𝑊𝑘,𝑖𝑡
3
𝑘=1
+∑∅𝑘 ln 𝐺𝑇𝐴𝑖𝑡
3
𝑘=1
ln𝑊𝑘,𝑖𝑡
+∑∑𝛾𝑘𝑗 ln𝑊𝑘,𝑖𝑡 ln𝑊𝑗,𝑖𝑡 + 𝜃3𝑇𝑖𝑚𝑒𝑡 + 𝜇𝑖𝑡
3
𝑗=1
3
𝑘=1
where i represents banks, t represents time in quarters, 𝐶𝑜𝑠𝑡𝑖𝑡 is total operating plus financial costs,
𝐺𝑇𝐴𝑖𝑡 is gross total assets, 𝑊𝑘,𝑖𝑡 represents input prices, 𝑊1,𝑖𝑡 is the ratio of personnel expenses to
GTA, which is proxy for input price of labor, 𝑊2,𝑖𝑡 is the ratio of interest expenses to total deposits
and money market funding, which is proxy for input price of all funds, 𝑊3,𝑖𝑡 is the ratio of other
operating and administrative expenses to GTA, which is proxy for input price of fixed capital, and
𝑇𝑖𝑚𝑒𝑡 is a vector of time fixed effects. The estimated coefficients of the cost function are then
used to compute the marginal cost for GTA:

18
𝑀𝐶𝑖𝑡 =𝐶𝑜𝑠𝑡𝑖𝑡𝐺𝑇𝐴𝑖𝑡
[𝜃1̂ + 𝜃2̂ ln 𝐺𝑇𝐴𝑖𝑡 +∑∅�̂� ln𝑊𝑘,𝑖𝑡
3
𝑘=1
]
I also use bank-level Herfindahl index as an alternative proxy for bank competition for the
robustness check. To measure the bank-level HHI, I establish the Herfindahl index of the markets
in which the bank has deposits and then weight these market indices by the proportion of the bank’s
deposits in each of these markets. I use the natural logarithm of the HHI to avoid distorting the
regression analyses due to large values. This measure is the most commonly used proxy for the
level of market concentration in the banking industry.
More importantly, to mitigate endogeneity concerns, I exploit exogenous variations in
bank competition through bank deregulation events, such as intra- and interstate bank deregulation
and interstate bank branching deregulation. Following previous studies exploiting bank
deregulation events (e.g., Jayaratne and Strahan, 1996; Black and Strahan, 2002; Johnson and Rice,
2008; Rice and Strahan, 2010; Krishnan, Nandy, and Puri, 2014), I construct intra- and interstate
deregulation indicator variables, Rice-Strahan index, and Krishnan-Nandy-Puri index.
The intra- and interstate deregulation indicator variables take the value of one from the
year of deregulation onward and zero prior to the deregulation. Rice-Strahan index of interstate
banking deregulation ranges from zero (deregulated) to four (highly regulated) based on regulation
changes in a state. On the other hand, Krishnan-Nandy-Puri index ranges from one (highly
regulated) to five (deregulated).
4.3 Control variables
To investigate clear relations between bank competition and bank liquidity creation, I include some
control variables that influence bank liquidity created by banks. Following Berger and Bouwman
(2009), I include a group of bank-level variables. To capture the risk, I include equity capital ratio,
which is the ratio of equity to GTA, and Z-Score, which is the distance to default that measured as

19
the bank’s return on assets plus the equity capital/GTA ratio divided by the standard deviation of
the return on assets, as a proxy for credit risk. In addition to the ZSCORE, I include earnings
volatility, which is measured as the standard deviation of the bank's return on assets over the
previous twelve (minimum: eight) quarters. I also control for the bank's multibank holding
company (MBHC) status because banks of multibank holding company could have much more
sufficient resources that can potentially affect bank liquidity creation strategy. Furthermore, I
control for the bank's merger and acquisition history because banks often substantially alter their
lending behavior following mergers and acquisitions.
Different from Berger and Bouwman (2009), I do not use size, market share, and a bank-
level Herfindahl index as control variables because these variables are strongly related to Lerner
index, which is an indicator for bank competition. However, I control for bank size when I use
bank deregulation variables as a proxy for bank competition.
To control for macroeconomic condition of local markets, I control for natural logarithm
of state population, inflation, Housing Price Index (HPI), natural logarithm of personal income,
and GDP per capita.
Lastly, I include year fixed effects, firm fixed effects, state fixed effects, and state-year
fixed effects in various specifications in this paper to control for time-specific effects, individual
firm specific effects, state-specific effects, and state-level trends, respectively. In this paper, I do
not report results including state-fixed effects because state fixed effects are almost nested within
bank fixed effects and the results are consistent with specifications including bank fixed effects.
4.4 Models
To investigate the impact of bank competition on bank liquidity creation and test hypotheses, I
estimate following equations:
Liquidityijt = αi + αt+ β0 + β1Lernerijt-1 + γControlijt-1 + 휀ijt (1)

20
where i indexes banks, j indexes state of the banks, t indexes year, and αi and αt are bank fixed
and year fixed effects, respectively.
As I discussed in 4.3, the key dependent variable is the dollar amount of liquidity a bank
has created normalized by GTA, using catfat measure from Berger and Bouwman (2009) and the
key explanatory variable is the lagged Lerner Index, which is a popular proxy for market power,
and control variables that could affect the bank liquidity creation are included. I use the lagged
values for independent variables and employ the fixed effects model to mitigate the endogeneity
of the measures of bank competition and to avoid biased results because fixed effect model control
a problem that biased results might be yielded because of unobserved individual characteristics if
I regress without fixed effect model and the fixed effect model is more robust to endogeneity. Year
fixed effects control for the time trend such as a set of macroeconomic condition including inflation.
In the equation, µi means each bank’s individual specific effect, and vt means that time specific
effect. Liquidityit is the dollar amount of liquidity a bank has created normalized by GTA, Lernerit-
1 is the lagged Lerner Index, 𝐶𝑜𝑛𝑡𝑟𝑜𝑙𝑖𝑡−1 is a set of control variables, and 휀it is an error term,
which assumes that E(휀it)=0 and Var(휀it)=𝜎2. All regressions are estimated with robust standard
errors, clustered by bank, to control for heteroskedasticity, as well as possible correlation among
observations of the same bank in different years.
To mitigate the endogeneity concerns, I also employ a difference-in-differences estimator.
Using the proportion of state-level bank liquidity creation, we investigate whether banks
differently react to change in bank competition. Banks would decide their liquidity creation
decisions strategically in response to different level of supply-side competition in different states.
Some banks would prefer to focus on less competitive market to easily dominate the market as
early as possible and to enjoy the stable life. However, the other banks would prefer to compete in
competitive market to keep their competitive positions in the market and to expand their territories.
Bank deregulation ignites bank competition and reallocates assets to more competitive
banks. Thus, it affects bank competition at the beginning of the deregulation. As Jayaratne and
Strahan (1997) suggest that banking deregulation affects not credit supply but bank competition,

21
using the staggered banking deregulation events as exogenous shocks allows us to exploit the
exogenous variation in bank competition. It mitigates potential endogeneity concerns. Following
several previous studies using the bank deregulation (e.g., Johnson and Rice, 2008; Rice and
Strahan, 2010; Koetter, Kolari, and Spierdijk, 2012; Chava, Oettl, Subramanian, and Subramanian,
2013; Krishnan, Nandy, and Puri, 2014; Cornaggia, Mao, Tian, and Wolfe, 2015), I use a
difference-in-differences approach to examine a causal effect of bank competition on bank
liquidity creation after a change in bank branching regulation.
Liquidity𝑖𝑗𝑡 =αi + αt + γControl𝑖𝑗𝑡 + 𝛿𝐷𝑒𝑟𝑒𝑔𝑢𝑙𝑎𝑡𝑖𝑜𝑛𝑗𝑡 + 휀𝑖𝑗𝑡 (2)
where i indexes banks, j indexes state of the banks, t indexes year, Liquidityit is the key dependent
variable of interest, and αi and αt are firm fixed and year fixed effects, respectively. 𝐶𝑜𝑛𝑡𝑟𝑜𝑙𝑖𝑗𝑡 is
a set of control variables, and 휀it is an error term, which assumes that E(휀it)=0 and Var(휀it)=𝜎2.
𝐷𝑒𝑟𝑒𝑔𝑢𝑙𝑎𝑡𝑖𝑜𝑛𝑗𝑡 includes intra- and interstate bank deregulation indicator variables and interstate
bank branching deregulation variables. This methodology fully controls for fixed differences
between treated and control banks via the bank fixed effects. Also, year fixed effects for aggregate
fluctuations. 𝛿 is estimate of the banking deregulation effects. All regressions are estimated with
robust standard errors, clustered by bank, to control for heteroskedasticity, as well as possible
correlation among observations of the same bank in different years.
To examine the effects of state-level bank competition on state-level bank liquidity creation,
I estimate a following equation:
StateLiquidity𝑗𝑡 =αj + αt + γControl𝑗𝑡 + 𝛿𝐷𝑒𝑟𝑒𝑔𝑢𝑙𝑎𝑡𝑖𝑜𝑛𝑗𝑡 + 휀𝑗𝑡 (2)
where j indexes state, t indexes year, State Liquidityjt is the key dependent variable of interest, and
αj and αt are state fixed and year fixed effects, respectively. 𝐶𝑜𝑛𝑡𝑟𝑜𝑙𝑗𝑡 is a set of state-level
macroeconomic variables, and 휀it is an error term, which assumes that E(휀it)=0 and Var(휀it)=𝜎2.

22
𝐷𝑒𝑟𝑒𝑔𝑢𝑙𝑎𝑡𝑖𝑜𝑛𝑗𝑡 includes intra- and interstate bank deregulation indicator variables and interstate
bank branching deregulation variables.
[Table 1: Summary Statistics]
Panels A and B of Table 1 report summary statistics for all sample banks, large banks,
small banks, and the difference in summary statistics between large banks and small banks. I divide
sample banks into three groups by size. I define a bank as a large bank if its gross total assets
(GTA) exceed $3 billion. If a bank’s GTA is between $1 billion and $3 billion, then I define the
bank as a medium bank. Lastly, the other sample banks whose GTA is up to $1 billion are
considered as small banks. I have 16,367 unique sample banks for the sample period between 1984
and 2007. Among the sample banks, numbers of banks that are categorized as large banks and
medium banks at least once are only 563 and 1,184 respectively. It is only 10% of total sample
banks. This means that approximately 90% of the sample banks are small banks in this setting.
From Panel B of Table 1, we can also see that there are highly statistically significant
differences between small banks and medium/large banks for all liquidity creation behavior and
bank characteristic variables. This suggests that there is substantial heterogeneity between small
banks and medium/large banks for the perspective of both liquidity creation behaviors and bank
characteristics.
5. Empirical Results
5.1 The effect of bank competition on bank liquidity creation
This section describes the effect of bank competition on bank liquidity creation. In this section, I
examine the relationship between bank competition and bank liquidity creation. Using Lerner
index as a proxy for bank competition and catfat measure, which is scaled by gross total assets, as

23
a proxy for bank-level liquidity creation, I investigate how bank-level strategy for liquidity
creation is affected by the ex-ante extent of bank competition. My analysis includes controls for a
wide range of variables that could affect bank liquidity creation as mentioned in Section 4.
[Table 2: Base regressions]
Table 2 presents ordinary least squares (OLS) estimates of the relationship between bank
competition and bank liquidity creation. All independent variables are lagged. Columns (1) and
(3) of Table 2 include both bank fixed effects and time fixed effects, and Columns (2) and (4)
include both bank fixed effects and state-specific time trend fixed effects. Also, all specifications
are estimated with robust standard errors, clustered by bank, to control for heteroskedasticity, as
well as possible correlation among observations of the same bank in different years.
In Table 2, I find a statistically and economically significant inverse relationship between
bank competition and bank liquidity creation. Because higher value of Lerner Index implies greater
market power, this means that banks with greater market power would create more liquidity in the
market. The result remains significant even after I control for bank characteristics and state-level
macroeconomic conditions. This shows that an increase of one standard deviation in Lerner Index
results in 7.98% increase of a standard deviation in bank liquidity creation. To control for state-
specific time trend, such as regulatory changes, I include state-year fixed effects instead of year
fixed effects in Columns (2) and (4). The inverse relation between bank competition and liquidity
creation is still held. However, the results from Table 2 do not explain what types of banks
dominate this effect and which component of bank liquidity creation is more affected by the bank
competition.
Now, to investigate these parts, I present the findings for different categories of banks. First
sub-sample analysis is for small, medium, and large banks. Second sub-sample analysis is for sub-
components of liquidity creation, such as asset-side liquidity creation, liability-side liquidity
creation, and off-balance sheet liquidity creation.

24
[Table 3: Sub-sample regressions (Size)]
In Table 3, which contains sub-sample analyses by bank size, I find that small banks and
medium and large banks react differently as Lerner Index increases. Columns (1) and (2) show the
results for small banks, Columns (3) and (4) show the results for medium banks, and Columns (5)
and (6) show the results for large banks. Columns (1), (3), and (5) include bank fixed effects and
year fixed effects. On the other hand, Columns (2), (4), and (6) control for time invariant bank
specific characteristics and state-specific time trend. Table 3 shows that statistically significant
and positive coefficients on Lerner Index in Table 2 are strongly driven by small banks. The
coefficients on Lerner Index for medium and large banks are statistically insignificant. That is, I
find that only small banks create more liquidity in the market as bank competition decreases. The
results show that medium and large banks’ liquidity creation strategies would not be affected
significantly by bank competition.
As I discuss in section 2, these results suggest that small banks create more liquidity when
the market is concentrated because their resources are relatively focusing on the market and they
do want to utilize their own private information about their customers by keeping the relationship
with the borrowers. On the other hand, in the concentrated market, large banks would prefer to
pursue monopolistic gains, such as higher interest rate and lower deposit rate. Since they have
sufficient resources to overcome reduced demand of borrowers and unexpected financial shocks
for a while until the borrowers inevitably take the bad deals, they could respond to bank
competition differently. In Columns (2), (4), and (6) of Table 3, we can see that the coefficients
on Lerner Index is quite similar to the coefficients on Lerner Index when I control for bank fixed
effects and year fixed effects. This means that differential time trends in bank liquidity creation
across states are correlated with bank competition but the omitted variable bias regarding state-
specific time trend is not significant.
[Table 4: Sub-sample regressions (Components of BLC)]

25
In Table 4, I examine the effects of bank competition on three different components of
bank liquidity creation, including asset-side, liability-side, and off-balance sheet liquidity creation.
Table 4 shows that positive and statistically significant relation between Lerner Index and bank
liquidity creation is only driven by asset-side liquidity creation. For the perspective economic
significance, the result in Column (3) means that an increase of one standard deviation in Lerner
Index causes 2.7% increase of a standard deviation in asset-side liquidity creation. The results
suggest that banks in less competitive market create more liquidity only through asset-side, such
as commercial and industrial loans, real estate loans, and so on. The specifications in Columns (2),
(4), (6), (8), (10), and (12) include state-time trend fixed effects. From the columns containing
state-time trend, we can see that the estimates are not affected by state-specific trends because the
coefficients remain stable.
5.2 The effects of bank deregulation on bank liquidity creation
In this section, I examine the effects of bank deregulation on bank liquidity creation. Previous
studies suggest that bank deregulation facilitates bank competition and reallocates assets to more
competitive banks. Thus, as Jayaratne and Strahan (1996) suggest that banking deregulation affects
not credit supply but bank competition, using the staggered banking deregulation events as
exogenous shocks allows us to exploit the exogenous variation in bank competition. It mitigates
potential endogeneity concerns. Following several previous studies using the bank deregulation
(e.g., Koetter, Kolari, and Spierdijk, 2012; Chava, Oettl, Subramanian, and Subramanian, 2013), I
use a difference-in-differences style approach to examine a causal effect of bank competition on
bank liquidity creation after a change in both intra- and interstate bank regulation. Table 5 shows
base regressions examining the effects of intra- and interstate banking deregulation events on bank
liquidity creation.
[Table 5: Effects of Bank Deregulation on Bank Liquidity Creation]

26
Using both intrastate and interstate bank deregulation events as exogenous shocks, I find
that exogenous variations in bank competition after both intra- and interstate deregulation events
do not significantly affect bank liquidity creation. The results are not consistent with the results in
This could be because of fixed costs to invest in deregulated states. Because interstate deregulation
requires much higher fixed costs to invest in deregulated states, only sizable banks are able to
acquire and/or establish a charter in a state outside the main bank's home state. On the other hand,
small banks would not compete with the sizable competitors. That is why these two effects could
offset each other. In addition, existing large banks in the deregulated state could have chance to
invest in the other deregulated states. This could also affect the insignificant effects of interstate
deregulation.
Different from previous studies examining the effects of bank deregulation, results in Table
5 show that intrastate deregulation and interstate deregulation have resembling effects on bank
liquidity creation on average. To disentangle the effects, I examine sub-sample analysis by bank
size in Table 6.
[Table 6: Effects of Bank Deregulation on Bank Liquidity Creation: Size]
Columns (1) – (3) show the results of sub-sample analysis and Columns (4) – (6) show the
results of specifications including interaction terms between bank size dummy variables and bank
deregulation variables. In Column (1), I find positive but insignificant effects of interstate
deregulation on bank liquidity creation. We can see that the result in Column (1) of Table 5 is
driven by small banks and fixed cost channel. From Columns (2) and (3), we can see that there are
positive and slightly significant effects of interstate deregulation on medium and large banks’
liquidity creation.
To identify relative effects of bank size, I include interaction terms in Column (4) – (6).
Consistent with previous studies, I find that intrastate deregulation and interstate deregulation have
contrasting effects on bank liquidity creation. Small banks in states that passed intrastate bank
deregulation create more liquidity in the market but the small banks in states that passed interstate

27
bank deregulation create less liquidity in the market than the other sized banks. On the other hand,
large banks create less liquidity after intrastate deregulation but create more liquidity after
interstate deregulation. This is because of characteristics of competitors.
For the intrastate competition, competitors are limited and banks are aware of their
intrastate competitors. That is why small banks could create more liquidity to keep their
relationship with current customers and large banks could create less liquidity to enjoy
monopolistic rents. However, for the interstate competition, banks in the deregulated states would
not have sufficient information about potential competitors. Small banks would not have ample
resources to compete with incoming out-of-state banks but large banks would have sufficient
resources to dominate the market even after interstate deregulation. That is why small banks would
create relatively less liquidity creation in the market than larger banks to avoid default risk and
larger banks would create more liquidity to dominate the market.
For the perspective of out-of-state banks, they would not want to compete with large banks
operating in the deregulated states because there is little chance to dominate the market over the
large local banks. That is why large banks might not need to create more liquidity after interstate
deregulation on average. This could explain positive but statistically insignificant coefficient on
interaction term between large bank dummy and interstate deregulation.
5.3 The effects of interstate branching deregulation on bank liquidity creation
In this section, to mitigate endogeneity concerns, I exploit the staggered interstate bank branching
deregulation. In 1994, the Interstate Banking and Branching Efficiency Act (IBBEA) is passed and
the IBBEA is implemented in 1997 to allow interstate branching. However, the U.S. government
gives state governments authorities to regulate interstate branching. State governments can either
create or relax interstate bank branching restrictions.
As Johnson and Rice (2008) and Rice and Strahan (2010) state, interstate bank branching
deregulation is more important than intra- and interstate bank deregulation regarding bank
competition and credit supply. This is because loan contracts and deposit contracts are
accomplished at the branch-level. To measure interstate branching deregulation, I follow previous

28
seminal papers, such as Johnson and Rice (2008), Rice and Strahan (2010), and Krishnan, Nandy,
and Puri (2014). I mainly use Rice and Strahan Index and use Krishnan, Nandy, and Puri Index for
the robustness checks.
The Interstate Banking and Branching Efficiency Act (IBBEA) allows state governments
to erect barriers to entry. According to Johnson and Rice (2008) and Rice and Strahan (2010), there
are four specific restriction on interstate bank branching. Based on the four restrictions, they
construct Rice and Strahan Index (RSI, thereafter). I add one to the RSI when a state adds any of
barriers to entry. Thus, maximum value of RSI is four, which indicates the states are the most
restrictive to interstate bank branching and minimum value of RSI is zero, which indicates the
states are the most open to interstate bank branching. First restriction is the minimum age of the
target banks. States could impose a minimum age of 3 or more years on target banks of interstate
branch acquirers. A maximum age restriction is 5 years. Second restriction is de novo interstate
branching. I add one to RSI if states do not allow de novo interstate branching. Third restriction is
the acquisition of individual branches. To weaken excessive external acquisitions, deregulated
states could require an out-of-state bidder bank to acquire all branches of its target bank. I add one
to RSI if states do not allow individual branch acquisition. Last restriction is a statewide deposit
cap. The IBBEA has a provision about deposit concentration, which is 30%. However, state
governments still have authorities to build a higher or lower entry barrier regarding deposit cap,
which is the maximum amount of deposits that a single bank can hold. Thus, I add one if states set
the deposit cap less than 30%.
Krishnan, Nandy, and Puri (2014) add one more restriction to RSI. Krishnan, Nandy, and
Puri Index (KNP, thereafter) includes four restrictions that RSI already has and an additional
restriction, which is reciprocal requirement. This requirement means that interstate branching is
allowed only if a state where an out-of-state bank want to enter and a home state of the out-of-state
bank permit the same level of interstate branching. Different from RSI, value of KNP index
increases as the state relax restrictions. Thus, maximum value of KNP index is five, which
indicates the states are the most open to interstate bank branching. This index takes the value zero
for all years before the implementation of interstate bank branching deregulation.

29
[Table 7: Effects of Interstate Branching Deregulation on Liquidity Creation]
[Table 8: Effects of Interstate Branching Deregulation on Liquidity Creation by bank size]
Table 7 reports the results of fixed effects regressions examining the effects of interstate
branching deregulation on bank liquidity creation. The coefficient estimates of RSI are positive
and significant at the 1% level on average. This finding suggests that an increase in banking
competition due to bank branching deregulation (i.e., a decrease in RSI) leads to a decrease in bank
liquidity creation. To be specific, based on the coefficient of RSI in column (3) of Table 7, states
that are completely open to interstate branching generated a total of 1.64% (=4×0.00411) less
liquidity creation after interstate bank branching deregulation than states with the most restrictions
on interstate branching after deregulation. I find robust evidence when I use KNP index instead of
RSI index. The results suggest that interstate bank branching deregulation causes statistically
significant effects on bank-level liquidity creation but economic significance is not substantial.
The results in Table 7 are surprising. This is because I find contrasting effects of interstate
bank deregulation on bank liquidity creation. Both interstate deregulation and interstate branching
deregulation exogenously increase bank competition but the effects are different. This could be
explained by
Interstate deregulation allows out-of-state banks to acquire banks in deregulated states but
interstate branching deregulation allows out-of-state banks to acquire branches in deregulated
states. This means that there will be much higher fixed costs that incoming banks must pay in the
case of interstate deregulation. The higher fixed costs could be a role of an entry barrier, so
relatively large banks are more likely to enter the new market, which is the deregulated state. Thus,
both newcomers and existing medium and large banks in the deregulated banks would create more
liquidity to compete each other.
However, interstate branching deregulation lowers the fixed costs to enter new markets.
That is why existing banks in the most restrictive states could choose to invest in the other open
markets. For example, a bank in the most restrictive states could establish or acquire a branch at

30
neighboring states if the fixed cost for setting up a new branch in the adjacent states is much lower
than expected returns of the investment and/or the fixed cost for expanding a business within its
home state. This could be possible explanation about the conflicting effects of interstate
deregulation and interstate branching deregulation.
Table 8 reports the results of subsample analysis by bank size. This examines whether the
effects of interstate branching deregulation on liquidity creation vary in different bank size.
Consistent with previous results, small banks tend to reduce their liquidity creation to avoid bank
failure and large banks are less likely to increase their liquidity creation because they are more
likely to be a dominant player in the market and they prefer to enjoy monopolistic rents. These
results are robust to controlling for bank characteristics, macroeconomic conditions, banking
deregulatory events that precede the IBBEA, bank fixed effects, and year fixed effects.
5.4 The effects of bank deregulation on state-level bank liquidity creation
In previous sections, I examine the effects of bank competition on bank-level liquidity creation.
Understanding the effects of bank competition on bank-level liquidity creation is interesting and
important but the effects state-level bank competition on aggregate state-level bank liquidity
creation would be much more important because government policies are generally established at
the state-level. In this section, using bank deregulation events, including intra- and interstate bank
deregulation and interstate bank branching deregulation, I examine whether state-level bank
competition affects state-level bank liquidity creation.
Following Berger and Sedunov (2017), I define state-level bank liquidity creation as
aggregate deposit of the state normalized by population of the state. To estimate state-level catfat
measure, I firstly construct each bank’s bank-state level market share using state-level deposit data
from FDIC. By multiplying the bank-state level market share by each bank’s liquidity creation
measures, I can estimate bank-state level liquidity creation. For example, suppose Bank of
America’s total deposit in 2006 is $35 million and Florida branches have $10 million of deposit,
South Carolina branches have $5 million of deposit, and Texas branches have $20 million of
deposit. We can see that Bank of America’s market share in Florida is 28.57% (= $10 million/$35

31
million). If the value of catfat for Bank of America in 2006 is $100 million, then we can assume
that Bank of America creates $28.57 million in Florida at that time. After calculating the bank-
state level liquidity creation, I combine all bank-state level liquidity creation by state. Lastly, I
normalize the aggregate state-level bank liquidity creation by state population, which is collected
from the U.S. Bureau of Economic Analysis (BEA).
State-level control variables are collected from Call Report, U.S. Bureau of Economic
Analysis (BEA), and Federal Housing Finance Agency (FHFA). State-level control variables
include natural logarithm of state population, GDP per capita, state personal income per capita,
house price index (HPI), total state deposit per capita, state book equity per capita, and inflation.
Also, state and year fixed effects are included in all specifications.
[Table 9: Effects of Intra- and Interstate Deregulation on State-level Liquidity Creation]
Table 9 reports the results of regressions examining the effects of intra- and interstate bank
deregulation on state-bank liquidity creation per capita. I find that there is no statistically
significant empirical evidence that intra- and interstate bank deregulation events affect state-level
bank liquidity creation. Because bank deregulation stimulates bank competition and its objective
is to enhance financing condition of the market, this result is meaningful. The results suggest that
intra- and interstate bank deregulation policy did not play an appropriate role to encourage banks’
liquidity creation incentives. Based on empirical results in previous tables, one possible
explanation is that the effects of bank deregulation events on large banks and on small banks offset
each other. This suggests that the policy, that is applied to all heterogenous banks in the same way,
does not fit all.
[Table 10: Effects of Intra- and Interstate Deregulation on State-level Liquidity Creation by Size]
Berger and Sedunov (2017) find that small bank liquidity creation is more important than
large bank liquidity creation for the perspective of per dollar effects. This could be because small

32
banks are more focused on small firm finance, which is important to local market growth, than
large banks. Different from small-sized borrowers, large firms have more options to raise funds
and they would prefer large lenders because of large banks have much sufficient resources and
have much lower default risk than small banks.
In Table 10, I examine whether bank deregulation events affect state-level small bank
liquidity creation and large bank liquidity creation differently. I find no statistically significant
evidence that bank deregulation events affect state-level small bank and/or large bank liquidity
creation. In Columns (4) – (6) and (10) – (12) of Table 10, I also find that the results are robust to
including state-level macroeconomic variables.
As I discussed in section 5.3, interstate bank branching deregulation would be much more
important in bank liquidity creation than bank deregulation events occurred in 1970s and 1980s.
Because loan and deposit decisions, which are major drivers of on-balance sheet liquidity creation,
are generally made at branch-level, interstate bank branching deregulation would have more direct
and significant effects on bank liquidity creation.
[Table 11: Effects of Bank Branching Deregulation on State-Level Bank Liquidity Creation]
Table 11 presents the results of state-level analysis examining the effects of interstate
branching deregulation on aggregate state-level liquidity creation per capita. Consistent with
previous results of intra- and interstate bank deregulation, I find no significant empirical evidence.
This suggests that, on average, even interstate bank branching deregulation does not affect state-
level bank liquidity creation per capita. The result is robust to a variety of alternative proxies for
interstate bank branching deregulation, such as KNP Index.
[Table 12: Effects of Bank Branching Deregulation on State-Level Small/Large Bank LC]
However, different from analyses using intra- and interstate bank deregulation, I find
significantly different effects of interstate bank branching deregulation on small bank and large

33
bank liquidity creation. Table 12 reports that enhanced bank competition caused by interstate bank
branching deregulation leads to less liquidity per capita created by small banks in the market.
Based on the coefficient of RS Index in Column (2) of Table 12, we can see that the result is
economically significant as well. On the other hand, I find no significant effects on large bank
liquidity creation. Because large banks create more liquidity in terms of dollar values and small
banks are reluctant to create liquidity in the competitive market, the results support the view that
large banks enjoy monopolistic rents if they are dominant players. The results are robust if I use
alternative measures of interstate bank branching deregulation. The results suggest that interstate
bank branching deregulation result in even worse local market liquidity condition because small
bank liquidity creation is crucial channel for local market growth (e.g., Berger and Sedunov, 2017).
The results of state-level analyses provide an important policy implication. The objective
of bank deregulation is to encourage local market economy and a crucial channel that banks can
contribute to local market economic growth is bank liquidity creation. Even though Jayaratne and
Strahan (1996) find that the relaxation of bank branching restrictions positively affects local
market economic growth, my results suggest that the positive effects might not be driven by bank-
oriented effects, which is bank liquidity creation. Thus, the policy implication of the state-level
results is that the government policy regarding bank competition need to consider banks’
heterogeneity, such as bank size and bank market share, and markets’ heterogeneity, such as
market demand and supply-side competition status.
5.5 Additional robustness tests
In Table 13, I examine whether pre-existence of dominant players in deregulated state affect state-
level bank liquidity creation. I use two different definitions for dominant players. First measure is
Dominant dummy, which is equal to 1 if there is at least one bank whose deposit market share is
above 10% of total deposit of the state. I also construct Dominant dummy using lower reference
points, such as 5% and 1% of total deposit of the state. In these reference points, the indicator
variable is equal to 1 if the ratio of dominant players in the state is higher than median (third
quartile). To test the effects of pre-existing dominant players on state-level bank liquidity creation,

34
I assume interstate bank deregulation year as an event year and only include observations in [-1,
1] window. Different from previous state-level analyses, I exclude state fixed effects in all
specifications in Table 13 and 16 because pre-existence of dominant players is state-specific
characteristic.
From columns (2) and (4), we can see that states where at least one dominant player existed
prior to deregulation year create less liquidity than states where there is no dominant player prior
to deregulation year. The results show that out-of-state competitors tend not to start their
businesses in the deregulated states if dominant players exist in the deregulated state. Even though
bank deregulation leads to enhanced bank competition on average, the results suggest that the
effects of bank deregulation is significantly diminished in the market, where is already dominated
by some banks. However, the results are not robust when I use lower reference points to define
dominant player variables. This could be explained that the effects of dominant players are driven
by a few extremely dominant banks and/or large banks.
[Table 13: State-level analysis – Dominant Player Channel]
[Table 14: State-level analysis – Dominant Player Channel by Size]
To differentiate the effects of pre-existing dominant players having different sizes, I
construct indicator variables based on both banks’ deposit market share in the state and banks’ size.
Table 8 shows that states where at least one small (small & medium) dominant players existed
prior to deregulation year create more liquidity than states where there is no small (small &
medium) dominant player prior to deregulation year. In addition, column (6) of Table 14 shows
that states where at least one large dominant player existed prior to deregulation year create less
liquidity than states where there is no large dominant player prior to deregulation year. The results
suggest that pre-existing small and medium-sized dominant banks have positive effects on state-
level bank liquidity creation and that pre-existing large-sized dominant banks have negative effects
on state-level bank liquidity creation.

35
Results in state-level analyses support the previous implication that a policy to encourage
bank competition would be more efficient if the policy applies to banks depending on banks’
heterogeneity, such as bank size and bank market share, and markets’ heterogeneity, such as
market demand and supply-side competition status prior to the policy implementation.
One concern about state-level analysis is a definition of state-level bank liquidity creation.
Because there is no available branch-level financial and accounting data except branch-level
deposit data, I only rely on deposit market share to calculate weights for each state when I construct
state-level liquidity creation. Deposit market share would be closely related to bank’s
concentration on the market but there is a potential measurement error issue. To mitigate this
concern, I use DealScan data to construct a partial measure of state-level bank liquidity creation.
DealScan data provides information about borrower’s location and total loan amount so I use the
information to calculate more accurate state-level liquidity creation weights. Even though loan
creation is a part of bank liquidity creation, which is a part of asset-side liquidity creation, using
DealScan data allows me to identify correct weights for each state where a bank operates. Table
15 shows results of state-level analyses using DealScan data are consistent with previous results
using state-level bank liquidity creation relying on deposit market shares. This suggests that main
state-level liquidity creation measures in this paper are valid.
In untabulated tests, I conduct several additional robustness checks. Firstly, to resolve a
concern about any potential bias on bank competition measure, I run identical tests using different
explanatory variables. As I mentioned in previous sections, one of key independent variables of
this paper is Lerner Index, which is a proxy for bank competition (i.e. bank market power). As
banking literature widely uses Herfindahl-Hirschman Index as one of the proxy for bank
competition or bank concentration, I explore same specification with Herfindahl-Hirschman Index
instead of Lerner Index. Results are generally consistent with the results using Lerner Index.
In addition, I use a different comprehensive liquidity creation measure, mat fat, instead of
catfat. As I discuss in Section 2, only difference between catfat and mat fat measures is a way to
classify loans. Catfat measure classifies loans by category but mat fat measure classifies loans by
maturity. It will be ideal if I can consider both category and maturity when I classify the loans.

36
Unfortunately, lack of available data does not allow us to consider both ways. Because category-
based classification captures loan-specific characteristics, Berger and Bouwman (2009) suggest
that catfat measure is the most comprehensive measure of bank liquidity creation among their four
liquidity creation measures. However, maturity-based classification would be essential when I
compare same kinds of loans. Thus, there is a possibility that maturity-based classification has a
merit to evaluate loan-side liquidity creation. Thus, I run the identical tests using the mat fat
measure as a robustness check. The results are still consistent.
6. Conclusion and Discussion
Using comprehensive measures of bank liquidity creation by Berger and Bouwman (2009), I
investigate empirically whether bank competition affects bank liquidity creation among 16367
banks from 1984 to 2007. I find that bank-level competition affects bank’s liquidity creation
strategy. Using bank-level competition measure, I find that banks create less liquidity when the
market is more competitive. Exploiting intra- and interstate bank deregulations and interstate bank
branching deregulation, I find that banks create less liquidity as interstate branching restrictions
release but banks do not significantly respond to intra- and interstate banking deregulation.
Different from bank-level analysis, state-level analysis shows that bank deregulation events do not
significantly affect state-level bank liquidity creation on average. The results highlight the role of
proper regulation to encourage depressed credit market in the United States.
There are some points I can develop deeper. Firstly, the U.S. government implemented
TARP program after the recent financial crisis to encourage credit supply, so it will be interesting
to use TARP as an exogenous shock on market power. Even though this is not purely random, it
is worth to exploit the exogenous variation in market power.
According to Bayazitova and Shivdasani (2012) and Duchin and Sosyura (2014), there are
some banks that received TARP fund offer but withdrew the offer. Collecting data for these
qualified but non-TARP recipients would allow me cleaner tests. Even though it would be quite
small sample analysis, comparing this group with TARP recipients would be cleaner test than

37
comparing TARP recipients and non-recipients. This further analysis could provide additional
evidence whether government achieved its expected results of the government intervention or bank
managers took excessive risks at the expense of the government, following theoretical models of
bank risk-taking.

38
REFERENCES
Beck, T., Demirguc-Kunt, A., & Maksimovic, V. (2004). Bank competition and access to
finance: International evidence. Journal of Money, Credit, and Banking, 36(3), 627-648.
Berger, A. N., & Bouwman, C. H. (2009). Bank liquidity creation. Review of Financial
Studies, 22(9), 3779-3837.
Berger, A. N., Klapper, L. F., & Turk-Ariss, R. (2009). Bank competition and financial stability.
Journal of Financial Services Research, 35(2), 99-118.
Berger, A. N., & Roman, R. A. (2013). Did TARP banks get competitive advantages? University
of South Carolina working paper.
Berger, A. N., & Sedunov, J. (2017). Bank liquidity creation and real economic output. Journal
of Banking & Finance, 81, 1-19.
Boyd, J. H., & De Nicolo, G. (2005). The theory of bank risk taking and competition
revisited. The Journal of finance, 60(3), 1329-1343.
Boyd, J. H., De Nicolò, G., & Jalal, A. M. (2006). Bank risk-taking and competition revisited
[electronic resource]: new theory and new evidence. International Monetary Fund.
Boyd, J. H., De Nicolò, G., & Jalal, A. M. (2009). Bank competition, risk and asset
allocations (No. 2009-2143). International Monetary Fund.
Bryant, J. (1980). A model of reserves, bank runs, and deposit insurance. Journal of Banking &
Finance, 4(4), 335-344.
Carbó-Valverde, S., Rodriguez-Fernandez, F., & Udell, G. F. (2009). Bank Market Power and
SME Financing Constraints*. Review of Finance, 13(2), 309-340.
De Guevara, J. F., Maudos, J., & Perez, F. (2005). Market power in European banking sectors.
Journal of Financial Services Research, 27(2), 109-137.
Deep, A., & Schaefer, G. (2004). Are banks liquidity transformers? (No. rwp04-022).
Diamond, D. W., & Dybvig, P. H. (1983). Bank runs, deposit insurance, and liquidity. The
journal of political economy, 401-419.
Gatev, E., & Strahan, P. E. (2006). Banks' advantage in hedging liquidity risk: Theory and
evidence from the commercial paper market. The Journal of Finance, 61(2), 867-892.

39
Gorton, G., & Pennacchi, G. (1990). Financial intermediaries and liquidity creation. The Journal
of Finance, 45(1), 49-71.
Hellmann, T. F., Murdock, K. C., & Stiglitz, J. E. (2000). Liberalization, moral hazard in
banking, and prudential regulation: Are capital requirements enough? American
economic review, 147-165.
Holmstrom, B., & Tirole, J. (1996). Private and public supply of liquidity (No. w5817). National
Bureau of Economic Research.
Horvath, R., Seidler, J., & Weill, L. (2013). How bank competition influence liquidity
creation (No. 16/2013). Bank of Finland, Institute for Economies in Transition
Ivashina, V., & Scharfstein, D. (2010). Bank lending during the financial crisis of 2008. Journal
of Financial economics, 97(3), 319-338.
Jayaratne, J., & Strahan, P. E. (1996). The finance-growth nexus: Evidence from bank branch
deregulation. The Quarterly Journal of Economics, 111(3), 639-670.
Jiang, L., Levine, R., & Lin, C. (2016). Competition and bank liquidity creation (No. w22195).
National Bureau of Economic Research.
Joh, S. W., & Kim, J. (2008). Does Competition Affect the Role of Banks as Liquidity
Providers? Seoul National University.
Jiménez, G., Lopez, J. A., & Saurina, J. (2013). How does competition affect bank risk-taking?
Journal of Financial Stability, 9(2), 185-195.
Kashyap, A. K., Rajan, R., & Stein, J. C. (2002). Banks as liquidity providers: An explanation
for the coexistence of lending and deposit‐taking. The Journal of Finance, 57(1), 33-73.
Keeley, M. C. (1990). Deposit insurance, risk, and market power in banking. American economic
review, 80(5), 1183-1200.
Love, I., & Martínez Peria, M. S. (2012). How bank competition affects firms' access to finance.
Marcus, A. J. (1984). Deregulation and bank financial policy. Journal of Banking &
Finance, 8(4), 557-565.
Nicoló, D., De Nicol, G., & Loukoianova, E. (2007). Bank ownership, market structure and risk.
International Monetary Fund.
Petersen, M. A., & Rajan, R. G. (1994). The benefits of lending relationships: Evidence from
small business data. The journal of finance, 49(1), 3-37.

40
Petersen, M. A., & Rajan, R. G. (1995). The effect of credit market competition on lending
relationships. The Quarterly Journal of Economics, 110(2), 407-443.
Repullo, R. (2004). Capital requirements, market power, and risk-taking in banking. Journal of
financial Intermediation, 13(2), 156-182.
Schaeck, K., Cihak, M., & Wolfe, S. (2009). Are competitive banking systems more
stable? Journal of Money, Credit and Banking, 41(4), 711-734.

41
Table 1: Summary Statistics
This table contains summary statistics for all sample banks and contains summary statistics that compare small banks with
medium/large banks. A bank is classified as a large bank if its gross total assets (GTA) are exceeding $3 billion, as a medium bank
if its gross total assets (GTA) are between $1 billion and $3 billion, and as a small bank if its gross total assets (GTA) are below
$1 billion. All financial values are measured in real 2007 dollars using the implicit GDP price deflator. The table reports number
of observations, sample means, and standard deviations.
Panel A: Summary Statistics (Bank-level)
N Mean SD
Liquidity Creation Variables
catfat 206,198 267,479 4,728,000
catnonfat 206,198 130,205 1,728,000
Asset-side Liquidity Creation 206,198 27,485 667,700
Liability-side Liquidity Creation 206,198 102,720 1,388,000
Off-the-balance sheet Liquidity Creation 206,198 137,274 3,576,000
catfat_gta 206,198 0.201 0.194
catnonfat_gta 206,198 0.160 0.150
lc_a_gta 206,198 -0.0151 0.138
lc_l_gta 206,198 0.175 0.0651
lc_obs_gta 206,198 0.0406 0.0958
Bank-level Variables
Lerner Index 203,711 0.315 0.109
Equity Ratio 205,097 0.0939 0.0421
Gross Total Assets 205,100 537,878 7,602,000
Bank Size 205,315 11.61 1.150
Earnings Volatility 203,011 0.00448 0.00360
ZSCORE 193,588 47.68 53.39
Small Bank 206,198 0.953 0.212
Medium Bank 206,198 0.0269 0.162
Large Bank 206,198 0.0201 0.140
Multi-BHC 206,198 0.254 0.435
Acquisitions 206,198 0.0777 0.268
State-level Bank Deregulation Variables
INTRA 206,198 0.779 0.415
INTER 206,198 0.837 0.369
RS Index (4 Restrictions) 206,198 3.423 1.152
KNP Index (5 Restrictions) 206,198 1.231 1.704
KNP Index (4 Restrictions) 206,198 0.968 1.506

42
Table 1: Summary Statistics
Panel B: t-test (Small Banks vs. Large/Medium Banks)
Small Banks Large and Medium Banks t-test
N Mean SD N Mean SD Difference p-value
Liquidity Creation Variables
catfat 196,500 34,426 63,416 9,698 4,990,000 21,260,000 4,955,574 0.0000
catnonfat 196,500 27,381 48,484 9,698 2,214,000 7,676,000 2,186,619 0.0000
lc_a 196,500 1,068 29,556 9,698 562,751 3,027,000 561,683 0.0000
lc_l 196,500 26,313 34,310 9,698 1,651,000 6,200,000 1,624,687 0.0000
lc_obs 196,500 7,045 23,319 9,698 2,776,000 16,270,000 2,768,955 0.0000
catfat_gta 196,500 0.191 0.175 9,698 0.404 0.375 0.213 0.0000
catnonfat_gta 196,500 0.156 0.150 9,698 0.252 0.125 0.096 0.0000
lc_a_gta 196,500 -0.0180 0.139 9,698 0.0440 0.122 0.062 0.0000
lc_l_gta 196,500 0.174 0.0643 9,698 0.208 0.0711 0.034 0.0000
lc_obs_gta 196,500 0.0350 0.0473 9,698 0.152 0.370 0.117 0.0000
Bank-level Variables
Lerner Index 194,064 0.317 0.107 9,647 0.271 0.134 -0.046 0.0000
Equity Ratio 195,431 0.0947 0.0425 9,666 0.0772 0.0308 -0.018 0.0000
Gross Total Assets 195,433 133,000 144,298 9,667 8,723,000 33,990,000 8,590,000 0.0000
Bank Size 195,633 11.44 0.853 9,682 15.00 1.128 3.560 0.0000
Earnings Volatility 193,388 0.00450 0.00362 9,623 0.00406 0.00313 0.000 0.0000
ZSCORE 184,173 47.83 53.57 9,415 44.70 49.71 -3.130 0.0000
Multi-BHC 196,500 0.236 0.425 9,698 0.614 0.487 0.378 0.0000
Acquisitions 196,500 0.0589 0.235 9,698 0.459 0.498 0.400 0.0000

43
Table 1: Summary Statistics
Panel C: Summary Statistics (State-level)
N Mean Median Q1 Q3 SD
State-level Bank Deregulation Variables
INTRA 1,166 0.894 1 1 1 0.308
INTER 1,166 0.886 1 1 1 0.318
RS Index (4 Restrictions) 1,166 3.032 4 3 4 1.425
KNP Index (5 Restrictions) 1,166 1.467 0 0 2 1.803
KNP Index (4 Restrictions) 1,166 1.774 0 0 3 1.984
State Liquidity Creation Variables
Liquidity Creation per Capita 1,166 7.465 6.597 4.332 9.399 4.707
Small Bank Liquidity Creation per Capita 1,164 1.414 1.051 0.634 1.917 1.132
Medium Bank Liquidity Creation per Capita 1,106 0.742 0.573 0.332 0.928 0.666
Large Bank Liquidity Creation per Capita 1,047 5.958 4.827 2.877 7.722 4.833
Small/Medium Bank Liquidity Creation per Capita 1,165 2.116 1.665 1.082 2.745 1.500
Asset-side Liquidity Creation per Capita 1,166 0.762 0.595 -0.181 1.624 1.316
Liability-side Liquidity Creation per Capita 1,166 3.660 3.525 2.969 4.178 1.181
Off-balance sheet Liquidity Creation per Capita 1,166 3.042 2.191 1.243 3.719 3.437
State-level Variables
State-level Deposit per Capita 1,117 8.489 7.962 6.506 10.20 2.925
State-level Equity per Capita 1,117 1.294 1.180 0.933 1.558 0.556
GDP per Capita 1,166 28,053 25,657 19,280 34,035 13,470
Personal Income per Capita 1,166 23.12 22.00 16.54 28.58 8.181
LN(Population) 1,166 15.04 15.13 14.31 15.64 0.995
Inflation 1,146 0.796 0.799 0.670 0.886 0.129
HPI 1,166 205.5 186.9 135.3 241.6 94.82
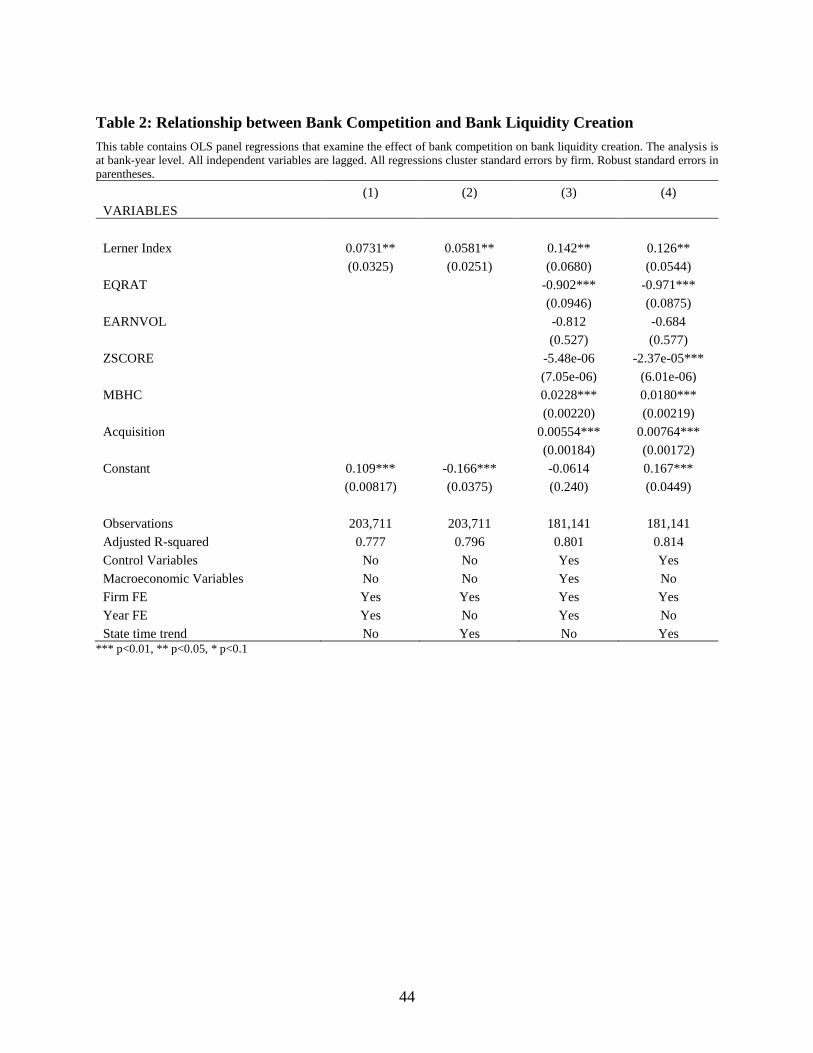
44
Table 2: Relationship between Bank Competition and Bank Liquidity Creation
This table contains OLS panel regressions that examine the effect of bank competition on bank liquidity creation. The analysis is
at bank-year level. All independent variables are lagged. All regressions cluster standard errors by firm. Robust standard errors in
parentheses.
(1) (2) (3) (4)
VARIABLES
Lerner Index 0.0731** 0.0581** 0.142** 0.126**
(0.0325) (0.0251) (0.0680) (0.0544)
EQRAT -0.902*** -0.971***
(0.0946) (0.0875)
EARNVOL -0.812 -0.684
(0.527) (0.577)
ZSCORE -5.48e-06 -2.37e-05***
(7.05e-06) (6.01e-06)
MBHC 0.0228*** 0.0180***
(0.00220) (0.00219)
Acquisition 0.00554*** 0.00764***
(0.00184) (0.00172)
Constant 0.109*** -0.166*** -0.0614 0.167***
(0.00817) (0.0375) (0.240) (0.0449)
Observations 203,711 203,711 181,141 181,141
Adjusted R-squared 0.777 0.796 0.801 0.814
Control Variables No No Yes Yes
Macroeconomic Variables No No Yes No
Firm FE Yes Yes Yes Yes
Year FE Yes No Yes No
State time trend No Yes No Yes *** p<0.01, ** p<0.05, * p<0.1

45
Table 3: Relationship between Bank Competition and Bank Liquidity Creation: Sub-sample analysis by bank size
This table contains OLS panel regressions that examine the effect of bank competition on bank liquidity creation. The analysis is at bank-year level. All independent variables are lagged. All regressions
cluster standard errors by firm. Robust standard errors in parentheses.
(1) (2) (3) (4) (5) (6)
VARIABLES Small Bank Small Bank Medium Bank Medium Bank Large Bank Large Bank
Lerner Index 0.0748*** 0.0717*** 0.0934 0.0746 0.268 0.195
(0.0189) (0.0190) (0.105) (0.0731) (0.391) (0.395)
EQRAT -0.893*** -0.957*** -0.167 -0.633 1.428 1.733
(0.0458) (0.0456) (0.453) (0.419) (1.440) (1.702)
EARNVOL -0.0167 0.221 -2.357 1.489 -25.77* -26.06*
(0.188) (0.187) (2.208) (1.491) (14.51) (14.29)
ZSCORE -1.56e-06 -2.07e-05*** 1.27e-05 3.01e-05 2.31e-05 -3.44e-05
(5.70e-06) (5.51e-06) (3.06e-05) (3.63e-05) (0.000102) (0.000105)
MBHC 0.0254*** 0.0212*** 0.00485 -0.00771 -0.0179 -0.0273
(0.00203) (0.00199) (0.00928) (0.0103) (0.0177) (0.0292)
Acquisition 0.00640*** 0.00817*** -0.000464 0.00994* -0.00237 -0.000531
(0.00172) (0.00167) (0.00486) (0.00587) (0.0101) (0.0120)
Constant 0.0749 0.401*** -4.760 0.355*** 0.972 0.391***
(0.253) (0.0153) (3.907) (0.0313) (1.769) (0.109)
Observations 171,097 171,097 5,787 5,787 4,257 4,257
Adjusted R-squared 0.801 0.813 0.678 0.774 0.826 0.836
Control Variables Yes Yes Yes Yes Yes Yes
Macroeconomic Variables Yes No Yes No Yes No
Firm FE Yes Yes Yes Yes Yes Yes
Year FE Yes No Yes No Yes No
State time trend No Yes No Yes No Yes
*** p<0.01, ** p<0.05, * p<0.1

46
Table 4: Relationship between Bank Competition and Bank Liquidity Creation: Sub-sample analysis by liquidity creation components
This table contains OLS panel regressions that examine the effect of bank competition on bank liquidity creation. The analysis is at bank-year level. All independent variables are lagged. All regressions
cluster standard errors by firm. Robust standard errors in parentheses.
(1) (2) (3) (4) (5) (6) (7) (8) (9) (10) (11) (12)
VARIABLES
Asset-side
liquidity
creation
Asset-side
liquidity
creation
Asset-side
liquidity
creation
Asset-side
liquidity
creation
Liability-
side
liquidity creation
Liability-
side
liquidity creation
Liability-side
liquidity
creation
Liability-
side
liquidity creation
Off-balance
sheet
liquidity creation
("fat")
Off-balance
sheet
liquidity creation
("fat")
Off-balance
sheet
liquidity creation
("fat")
Off-balance
sheet
liquidity creation
("fat")
Lerner Index 0.0315*** 0.0285*** 0.0381*** 0.0450*** 0.000384 0.000347 -0.000164 -0.00503 0.0412 0.0293 0.104 0.0858
(0.00463) (0.00425) (0.0113) (0.0115) (0.00212) (0.00199) (0.00524) (0.00364) (0.0351) (0.0264) (0.0793) (0.0631)
EQRAT -0.277*** -0.355*** -0.535*** -0.512*** -0.0905 -0.104
(0.0392) (0.0392) (0.0147) (0.0137) (0.0991) (0.0899)
EARNVOL 0.0306 0.222 -0.104 -0.0286 -0.739 -0.878
(0.156) (0.150) (0.0785) (0.0757) (0.519) (0.575)
ZSCORE 2.46e-06 -1.58e-05*** 6.07e-06*** 4.81e-06** -1.40e-05*** -1.27e-05***
(4.94e-06) (4.72e-06) (2.04e-06) (1.96e-06) (5.03e-06) (3.29e-06)
MBHC 0.0218*** 0.0173*** -0.00182*** -0.00112* 0.00277** 0.00186
(0.00172) (0.00166) (0.000668) (0.000647) (0.00125) (0.00133)
Acquisition 0.00475*** 0.00694*** -0.00269*** -0.00262*** 0.00348*** 0.00331***
(0.00126) (0.00118) (0.000509) (0.000495) (0.00126) (0.00115)
Constant -0.0574*** -0.473*** -0.0991 -0.0822** 0.163*** 0.217*** -0.0852 0.197*** 0.00360 0.0896*** 0.123 0.0526***
(0.00152) (0.0325) (0.209) (0.0356) (0.000661) (0.0108) (0.0650) (0.0139) (0.00874) (0.0146) (0.0936) (0.0202)
Observations 203,711 203,711 181,141 181,141 203,711 203,711 181,141 181,141 203,711 203,711 181,141 181,141
Adjusted R-squared 0.741 0.767 0.759 0.778 0.772 0.792 0.801 0.815 0.715 0.750 0.754 0.774
Control Variables No No Yes Yes No No Yes Yes No No Yes Yes
Macroeconomic Variables No No Yes No No No Yes No No No Yes No
Firm FE Yes Yes Yes Yes Yes Yes Yes Yes Yes Yes Yes Yes
Year FE Yes No Yes No Yes No Yes No Yes No Yes No
State time trend No Yes No Yes No Yes No Yes No Yes No Yes
*** p<0.01, ** p<0.05, * p<0.1
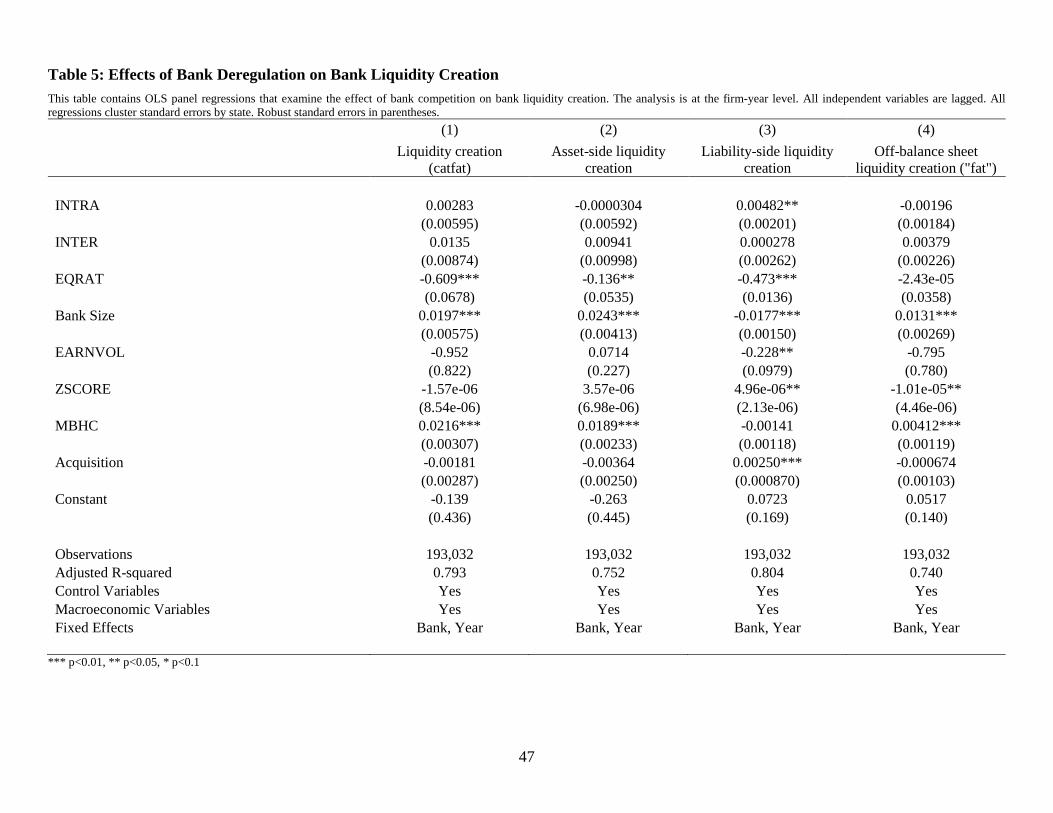
47
Table 5: Effects of Bank Deregulation on Bank Liquidity Creation
This table contains OLS panel regressions that examine the effect of bank competition on bank liquidity creation. The analysis is at the firm-year level. All independent variables are lagged. All
regressions cluster standard errors by state. Robust standard errors in parentheses.
(1) (2) (3) (4)
Liquidity creation
(catfat)
Asset-side liquidity
creation
Liability-side liquidity
creation
Off-balance sheet
liquidity creation ("fat")
INTRA 0.00283 -0.0000304 0.00482** -0.00196
(0.00595) (0.00592) (0.00201) (0.00184)
INTER 0.0135 0.00941 0.000278 0.00379
(0.00874) (0.00998) (0.00262) (0.00226)
EQRAT -0.609*** -0.136** -0.473*** -2.43e-05
(0.0678) (0.0535) (0.0136) (0.0358)
Bank Size 0.0197*** 0.0243*** -0.0177*** 0.0131***
(0.00575) (0.00413) (0.00150) (0.00269)
EARNVOL -0.952 0.0714 -0.228** -0.795
(0.822) (0.227) (0.0979) (0.780)
ZSCORE -1.57e-06 3.57e-06 4.96e-06** -1.01e-05**
(8.54e-06) (6.98e-06) (2.13e-06) (4.46e-06)
MBHC 0.0216*** 0.0189*** -0.00141 0.00412***
(0.00307) (0.00233) (0.00118) (0.00119)
Acquisition -0.00181 -0.00364 0.00250*** -0.000674
(0.00287) (0.00250) (0.000870) (0.00103)
Constant -0.139 -0.263 0.0723 0.0517
(0.436) (0.445) (0.169) (0.140)
Observations 193,032 193,032 193,032 193,032
Adjusted R-squared 0.793 0.752 0.804 0.740
Control Variables Yes Yes Yes Yes
Macroeconomic Variables Yes Yes Yes Yes
Fixed Effects Bank, Year Bank, Year Bank, Year Bank, Year
*** p<0.01, ** p<0.05, * p<0.1

48
Table 6: Effects of Bank Deregulation on Bank Liquidity Creation: Sub-sample analysis by bank size
This table contains OLS panel regressions that examine the effect of bank competition on bank liquidity creation. The analysis is at the firm-year level. All independent variables are lagged. All
regressions cluster standard errors by firm. Robust standard errors in parentheses.
(1) (2) (3) (4) (5) (6)
Small Bank Medium Bank Large Bank Small Bank Medium Bank Large Bank
INTRA 0.00359 -0.0289 -0.0391 -0.0195 0.00321 0.00322
(0.00571) (0.0237) (0.0284) (0.0159) (0.00590) (0.00589)
INTER 0.0114 0.0380* 0.0670* 0.0615** 0.0126 0.0130
(0.00884) (0.0225) (0.0346) (0.0303) (0.00867) (0.00877)
Small Bank 0.0393*
(0.0213) Small Bank * INTRA 0.0231
(0.0152) Small Bank * INTER -0.0495*
(0.0288) Medium Bank -0.0425
(0.0269) Medium Bank * INTRA -0.0142
(0.0180) Medium Bank * INTER 0.0506*
(0.0300) Large Bank -0.0155
(0.0192)
Large Bank * INTRA -0.0359**
(0.0157)
Large Bank * INTER 0.0432
(0.0297)
Constant -0.00417 -3.614 1.575 -0.175 -0.136 -0.136
(0.445) (3.691) (2.049) (0.438) (0.438) (0.436)
Observations 183,627 5,372 4,033 193,032 193,032 193,032
Adjusted R-squared 0.793 0.684 0.830 0.793 0.793 0.793
Control Variables Yes Yes Yes Yes Yes Yes
Macroeconomic Variables Yes Yes Yes Yes Yes Yes
Fixed Effects Bank, Year Bank, Year Bank, Year Bank, Year Bank, Year Bank, Year
*** p<0.01, ** p<0.05, * p<0.1

49
Table 7: Effects of Interstate Branching Deregulation on Bank Liquidity Creation
This table contains OLS panel regressions that examine the effect of bank competition on bank liquidity creation. The analysis is at the firm-year level. All independent variables are lagged. All
regressions cluster standard errors by firm. Robust t-statistics in parentheses.
(1) (2) (3) (4) (5) (6)
RS Index 0.00455** 0.00388*
(0.00206) (0.00229) KNP4 Index -0.00451** -0.00366*
(0.00177) (0.00196) KNP5 Index -0.00415** -0.00376**
(0.00182) (0.00173)
INTRA 0.000685 0.000722 0.000992
(0.00602) (0.00604) (0.00598)
INTER 0.0116 0.0118 0.0121
(0.00793) (0.00803) (0.00819)
EQRAT -0.608*** -0.608*** -0.608***
(0.0676) (0.0677) (0.0676)
Bank Size 0.0198*** 0.0198*** 0.0198***
(0.00569) (0.00570) (0.00571)
EARNVOL -0.940 -0.940 -0.935
(0.821) (0.821) (0.820)
ZSCORE -2.87e-06 -2.82e-06 -2.71e-06
(8.39e-06) (8.37e-06) (8.35e-06)
MBHC 0.0214*** 0.0214*** 0.0214***
(0.00310) (0.00310) (0.00307)
Acquisition -0.00164 -0.00165 -0.00167
(0.00289) (0.00289) (0.00288)
Constant 0.108*** -0.119 0.126*** -0.104 0.126*** -0.0960
(0.0148) (0.417) (0.00980) (0.417) (0.00989) (0.420)
Observations 206,198 193,032 206,198 193,032 206,198 193,032
Adjusted R-squared 0.773 0.793 0.773 0.793 0.773 0.793
Control Variables No Yes No Yes No Yes
Macroeconomic Variables No Yes No Yes No Yes
Fixed Effects Bank, Year Bank, Year Bank, Year Bank, Year Bank, Year Bank, Year
*** p<0.01, ** p<0.05, * p<0.1

50
Table 8: Effects of Interstate Branching Deregulation on Bank Liquidity Creation: Sub-sample analysis by bank size
This table contains OLS panel regressions that examine the effect of bank competition on bank liquidity creation. The analysis is at the firm-year level. All independent variables are lagged. All
regressions cluster standard errors by firm. Robust t-statistics in parentheses.
(1) (2) (3) (4) (5) (6)
VARIABLES Small Bank Medium Bank Large Bank Small Bank Medium Bank Large Bank
RSI 0.00288 0.00393 0.0158 0.00886*** 0.00374 0.00355
(0.00223) (0.00449) (0.0109) (0.00294) (0.00228) (0.00231)
INTRA 0.00203 -0.0297 -0.0463 0.000594 0.000681 0.000630
(0.00566) (0.0237) (0.0311) (0.00599) (0.00599) (0.00597)
INTER 0.0101 0.0376 0.0640* 0.0117 0.0116 0.0117
(0.00807) (0.0225) (0.0342) (0.00792) (0.00793) (0.00793)
Small Bank 0.0271***
(0.00909) Small Bank X RS Index -0.00546**
(0.00253) Medium Bank -0.0154
(0.0100) Medium Bank X RS Index 0.00267
(0.00307) Large Bank -0.0303
(0.0220)
Large Bank X RS Index 0.00871*
(0.00438)
Constant 0.00672 -3.452 1.709 -0.141 -0.120 -0.107
(0.431) (3.612) (2.067) (0.420) (0.417) (0.419)
Observations 183,627 5,372 4,033 193,032 193,032 193,032
Adjusted R-squared 0.793 0.684 0.830 0.793 0.793 0.793
Control Variables Yes Yes Yes Yes Yes Yes
Macroeconomic Variables Yes Yes Yes Yes Yes Yes
Fixed Effects Bank, Year Bank, Year Bank, Year Bank, Year Bank, Year Bank, Year
*** p<0.01, ** p<0.05, * p<0.1

51
Table 9: Effects of Bank Deregulation on State-Level Bank Liquidity Creation
This table contains OLS panel regressions that examine the effect of bank deregulation on state-level bank liquidity creation. The analysis is at the state-year level. All independent variables in columns
(4) – (6) and (10) – (12) are lagged. All regressions cluster standard errors by state. Robust standard errors are in parentheses.
(1) (2) (3) (4) (5) (6)
State catfat per
capita
State catfat per
capita
State catfat per
capita
State catfat per
capita
State catfat per
capita
State catfat per
capita
INTRA -1.706** -1.530** -0.671 -0.688
(0.717) (0.626) (0.484) (0.471)
INTER -1.189 -0.802 -0.0224 0.0997
(0.847) (0.744) (0.522) (0.496)
LN(Population) 8.686*** 8.905*** 8.739***
(3.010) (2.979) (3.006)
HPI -0.0186*** -0.0186*** -0.0187***
(0.00615) (0.00617) (0.00615)
Number of Borrowers 0.00348 0.00396 0.00349
(0.00334) (0.00339) (0.00338)
Number of Competitors 0.00293 0.00358* 0.00294
(0.00223) (0.00206) (0.00224)
Deposit per capita 0.0859 0.0831 0.0866
(0.185) (0.188) (0.187)
Equity per capita 2.822*** 2.839*** 2.821***
(0.806) (0.813) (0.810)
GDP per capita 0.000268*** 0.000266*** 0.000268***
(4.42e-05) (4.48e-05) (4.43e-05)
Personal Income per
capita -0.0467 -0.0282 -0.0433
(0.130) (0.136) (0.132)
Constant 0.766** 0.194 0.818** -132.5*** -136.6*** -133.4***
(0.312) (0.311) (0.318) (45.14) (44.63) (45.19)
Observations 1,176 1,176 1,176 1,127 1,127 1,127
Adjusted R-squared 0.739 0.736 0.739 0.826 0.826 0.826
Control Variables No No No Yes Yes Yes
Fixed Effects State, Year State, Year State, Year State, Year State, Year State, Year
Robust standard errors in parentheses *** p<0.01, ** p<0.05, * p<0.1

52
Table 10: Effects of Bank Deregulation on State-Level Bank Liquidity Creation by Small and Large Banks
This table contains OLS panel regressions that examine the effect of bank deregulation on state-level bank liquidity creation. The analysis is at the state-year level. All independent variables in columns
(4) – (6) and (10) – (12) are lagged. All regressions cluster standard errors by state. Robust standard errors are in parentheses.
(1) (2) (3) (4) (5) (6) (7) (8) (9) (10) (11) (12)
VARIABLES
State catfat
per capita
(Small Bank)
State catfat
per capita
(Small Bank)
State catfat
per capita
(Small Bank)
State catfat
per capita
(Small Bank)
State catfat
per capita
(Small Bank)
State catfat
per capita
(Small Bank)
State catfat
per capita
(Large Bank)
State catfat
per capita
(Large Bank)
State catfat
per capita
(Large Bank)
State catfat
per capita
(Large Bank)
State catfat
per capita
(Large Bank)
State catfat
per capita
(Large Bank)
INTRA 0.279 0.196 0.118 0.0781 -0.233 -0.0889 0.0385 0.0748
(0.207) (0.208) (0.209) (0.213) (0.523) (0.514) (0.443) (0.425)
INTER 0.457* 0.412 0.296 0.283 -0.909 -0.888 -0.252 -0.267
(0.270) (0.269) (0.228) (0.230) (0.557) (0.550) (0.402) (0.369)
LN(Population) -0.777 -0.639 -0.607 8.686 8.585 8.616
(1.020) (0.907) (0.934) (5.182) (5.200) (5.205)
HPI -0.00228 -0.00237 -0.00234 -0.0126** -0.0126** -0.0125**
(0.00150) (0.00150) (0.00149) (0.00557) (0.00562) (0.00560)
Deposit per capita 0.166*** 0.166*** 0.166*** 0.525** 0.522** 0.521**
(0.0404) (0.0395) (0.0400) (0.218) (0.217) (0.217)
Equity per capita -0.493** -0.488*** -0.483** -0.173 -0.173 -0.166
(0.184) (0.181) (0.183) (1.777) (1.770) (1.777)
GDP per capita 9.67e-06 8.78e-06 7.99e-06 0.000256*** 0.000258*** 0.000257***
(3.05e-05) (3.11e-05) (3.05e-05) (7.93e-05) (7.97e-05) (7.96e-05)
Personal Income per capita -0.0617 -0.0525 -0.0501 -0.0870 -0.0963 -0.0947
(0.0680) (0.0699) (0.0698) (0.155) (0.154) (0.155)
Inflation 1.225 1.434 1.433 -0.642 -0.843 -0.874
(1.929) (1.919) (1.924) (12.38) (12.46) (12.46)
Constant 1.158*** 1.204*** 1.126*** 12.58 10.24 9.705 2.910*** 2.946*** 2.987*** -130.8 -128.9 -129.4
(0.149) (0.117) (0.161) (14.97) (13.26) (13.70) (0.316) (0.354) (0.311) (79.10) (79.45) (79.56)
Observations 1,164 1,164 1,164 1,096 1,096 1,096 1,047 1,047 1,047 992 992 992
R-squared 0.751 0.755 0.757 0.800 0.802 0.802 0.627 0.628 0.628 0.688 0.689 0.689
Control Variables State FE Yes Yes Yes Yes Yes Yes Yes Yes Yes Yes Yes Yes
Year FE Yes Yes Yes Yes Yes Yes Yes Yes Yes Yes Yes Yes
Robust standard errors in parentheses *** p<0.01, ** p<0.05, * p<0.1

53
Table 11: Effects of Bank Branching Deregulation on State-Level Bank Liquidity Creation
(1) (2) (3) (4) (5) (6)
VARIABLES
State catfat per
capita
State catfat per
capita
State catfat per
capita
State catfat per
capita
State catfat per
capita
State catfat per
capita
RS Index 0.299 0.250
(0.224) (0.175) KNP4 Index -0.267 -0.224
(0.203) (0.151) KNP5 Index -0.247 -0.245
(0.220) (0.161)
INTRA -0.0236 -0.00827 0.00924
(0.498) (0.492) (0.481)
INTER 0.610 0.626 0.657
(0.580) (0.584) (0.578)
LN(Population) 6.227 6.305 6.384
(5.683) (5.640) (5.677)
HPI -0.0169*** -0.0169*** -0.0168***
(0.00536) (0.00537) (0.00542)
Deposit per capita 0.753*** 0.755*** 0.758***
(0.233) (0.232) (0.232)
Equity per capita -0.716 -0.727 -0.728
(1.794) (1.788) (1.791)
GDP per capita 0.000210*** 0.000210*** 0.000208***
(6.17e-05) (6.21e-05) (6.39e-05)
Personal Income per capita -0.0423 -0.0448 -0.0421
(0.136) (0.136) (0.140)
Inflation -1.352 -1.125 -0.984
(13.46) (13.32) (13.29)
Constant 3.190*** -92.72 4.384*** -93.01 4.385*** -94.32
(1.039) (85.55) (0.319) (85.12) (0.318) (85.60)
Observations 1,166 1,097 1,166 1,097 1,166 1,097
R-squared 0.596 0.686 0.595 0.686 0.595 0.686
Control Variables No Yes No Yes No Yes
State FE Yes Yes Yes Yes Yes Yes
Year FE Yes Yes Yes Yes Yes Yes
Robust standard errors in parentheses *** p<0.01, ** p<0.05, * p<0.1

54
Table 12: Effects of Bank Branching Deregulation on State-Level Bank Liquidity Creation by Small and Large Banks
(1) (2) (3) (4) (5) (6) (7) (8) (9) (10) (11) (12)
VARIABLES
State catfat per capita
(Small
Bank)
State catfat per capita
(Small
Bank)
State catfat per capita
(Small
Bank)
State catfat per capita
(Small
Bank)
State catfat per capita
(Small
Bank)
State catfat per capita
(Small
Bank)
State catfat per capita
(Large
Bank)
State catfat per capita
(Large
Bank)
State catfat per capita
(Large
Bank)
State catfat per capita
(Large
Bank)
State catfat per capita
(Large
Bank)
State catfat per capita
(Large
Bank)
RS Index 0.200*** 0.174*** 0.0530 -0.00828
(0.0560) (0.0456) (0.204) (0.163) KNP4 Index -0.177*** -0.151*** -0.0600 -0.00542
(0.0505) (0.0403) (0.183) (0.139)
KNP5 Index -0.176*** -0.146*** -0.0547 -0.0298
(0.0459) (0.0364) (0.179) (0.138)
INTRA -0.0615 -0.0469 -0.0219 0.0818 0.0700 0.0524
(0.190) (0.193) (0.202) (0.443) (0.444) (0.438)
INTER 0.192 0.206 0.234 -0.265 -0.268 -0.268
(0.212) (0.214) (0.208) (0.371) (0.372) (0.369)
LN(Population) -1.091 -1.024 -0.928 8.640 8.600 8.541
(0.893) (0.896) (0.931) (5.329) (5.289) (5.299)
HPI -0.00255* -0.00253* -0.00246 -0.0125** -0.0125** -0.0126**
(0.00148) (0.00149) (0.00152) (0.00559) (0.00558) (0.00559)
Deposit per capita 0.145*** 0.147*** 0.151*** 0.522** 0.521** 0.519**
(0.0345) (0.0351) (0.0363) (0.220) (0.219) (0.218)
Equity per capita -0.384** -0.394** -0.405** -0.169 -0.164 -0.154
(0.144) (0.148) (0.159) (1.791) (1.783) (1.782)
GDP per capita 3.23e-06 3.30e-06 2.67e-06 0.000257*** 0.000257*** 0.000256***
(2.91e-05) (2.92e-05) (2.92e-05) (8.05e-05) (8.06e-05) (8.15e-05)
Personal Income per capita -0.0273 -0.0297 -0.0305 -0.0958 -0.0940 -0.0907
(0.0648) (0.0653) (0.0674) (0.158) (0.158) (0.161)
Inflation 2.149 2.281 2.266 -0.909 -0.842 -0.695
(1.726) (1.718) (1.782) (12.41) (12.38) (12.35)
Constant 0.485* 15.75 1.284*** 15.38 1.285*** 13.94 2.577** -129.7 2.789*** -129.2 2.790*** -128.4
(0.252) (13.08) (0.0968) (13.12) (0.0966) (13.62) (0.996) (81.12) (0.365) (80.72) (0.363) (80.84)
Observations 1,164 1,096 1,164 1,096 1,164 1,096 1,047 992 1,047 992 1,047 992
R-squared 0.768 0.815 0.766 0.813 0.763 0.811 0.627 0.689 0.627 0.689 0.627 0.689
Control Variables No Yes No Yes No Yes No Yes No Yes No Yes
State FE Yes Yes Yes Yes Yes Yes Yes Yes Yes Yes Yes Yes
Year FE Yes Yes Yes Yes Yes Yes Yes Yes Yes Yes Yes Yes
Robust standard errors in parentheses *** p<0.01, ** p<0.05, * p<0.1

55
Table 13: Effects of Bank Deregulation on State-Level Bank Liquidity Creation (Dominant Player Channel)
This table contains OLS panel regressions that examine the effect of bank deregulation on state-level bank liquidity creation. The analysis is at the state-year level. All independent variables in columns
(4) – (6) and (10) – (12) are lagged. All regressions cluster standard errors by state. Robust standard errors are in parentheses.
(1) (2) (3) (4) (5) (6) (7) (8) (9) (10) (11) (12) (13) (14) (15) (16)
INTER 0.095 0.317 0.571** 0.583** 0.0877 0.0954 0.136 0.082 0.0841 -0.114 0.135 0.0595 0.0527 -0.0942 0.135 0.0268
-0.204 -0.209 (0.280) (0.290) -0.164 -0.228 -0.133 -0.176 -0.138 -0.225 -0.131 -0.187 -0.177 -0.281 -0.149 -0.235 Dominant (10%) 2.303** 2.067***
-0.951 -0.549
INTER x Dominant (10%) 0.00252 -0.506**
-0.258 -0.248
Large Bank 2.323*** 0.422
(0.874) (0.818)
INTER x Large Bank -0.668** -0.672*
(0.310) (0.375)
Dominant (10%, Median) 1.44 1.510** -1.259 -0.747 INTER x Dominant (10%, Median) 0.112 -0.0455
-0.214 -0.287 Dominant (10%, Q4) 3.058 2.338***
-2.213 -0.737 INTER x Dominant (10%, Q4) -0.255 -0.758 -0.273 -0.469 Dominant (5%, Median) 0.567 0.857
-1.296 -0.641 INTER x Dominant (5%, Median) 0.113 0.27
-0.222 -0.255 Dominant (5%, Q4) 2.937 2.509*** -2.21 -0.722 INTER x Dominant (5%, Q4) -0.149 -0.546
-0.3 -0.392 Dominant (1%, Median) 0.167 0.718
-1.265 -0.85 INTER x Dominant (1%, Median) 0.172 0.327 -0.211 -0.288 Dominant (1%, Q4) 1.684 0.466
-2.321 -1.056
INTER x Dominant (1%, Q4) -0.0153 0.18
-0.308 -0.336 Observations 123 114 123 114 123 114 123 114 123 114 123 114 123 114 123 114
Control Variables No Yes No Yes No Yes No Yes No Yes No Yes No Yes No Yes
State FE No No No No No No No No No No No No No No No No Year FE Yes Yes Yes Yes Yes Yes Yes Yes Yes Yes Yes Yes Yes Yes Yes Yes

56
Table 14: Effects of Bank Deregulation on State-Level Bank Liquidity Creation (Dominant Player Channel
by Size)
This table contains OLS panel regressions that examine the effect of bank deregulation on state-level bank liquidity creation. The analysis is at the
state-year level. All independent variables in columns (4) – (6) and (10) – (12) are lagged. All regressions cluster standard errors by state. Robust
standard errors are in parentheses.
(1) (2) (3) (4) (5) (6)
INTER -0.0843 -0.434 -1.328** -0.662*** 0.571** 0.583**
(0.296) (0.363) (0.668) (0.235) (0.280) (0.290)
Dominant (Small) -2.103* -2.123**
(1.153) (0.978)
INTER x Dominant (Small) 0.227 0.630*
(0.370) (0.376)
Dominant (Small & Medium) -3.945** -3.610**
(1.677) (1.540)
INTER x Dominant (Small & Medium) 1.552** 0.859***
(0.735) (0.247)
Dominant (Large) 2.323*** 0.422
(0.874) (0.818)
INTER x Dominant (Large) -0.668** -0.672*
(0.310) (0.375)
LN(Population) 0.212 0.360 0.701
(0.426) (0.364) (0.486)
HPI 0.0144 0.0131 0.00992
(0.00916) (0.00909) (0.0101)
State Deposit per capita -1.083* -1.141* -1.076*
(0.628) (0.618) (0.594)
Equity per capita 9.690*** 10.05*** 9.873***
(3.223) (3.210) (3.157)
GDP per capita 3.65e-05 -2.90e-05 3.77e-05
(0.000172) (0.000141) (0.000141)
Personal Income per capita 0.439** 0.563*** 0.500**
(0.210) (0.200) (0.198)
Inflation -16.58* -19.89** -17.97**
(8.550) (9.071) (7.967)
Constant 5.613*** 5.757 7.862*** 7.035 1.990*** -3.136
(0.841) (10.36) (1.445) (10.17) (0.663) (8.654)
Observations 123 114 123 114 123 114
State FE No No No No No No
Year FE Yes Yes Yes Yes Yes Yes
Standard errors in parentheses
*** p<0.01, ** p<0.05, * p<0.1

57
Table 15: Effects of Deregulation on Local Loan Creation
This table contains results examining the effect of bank deregulation on state-level loan creation. The analysis is at the state-year level. All independent are lagged. All regressions cluster standard errors
by state. Robust standard errors are in parentheses.
(1) (2) (3) (4)
1988 - 2007 1988 - 2007 1988 - 2007 1988 - 2007
State Loan per capita ln(State Loan per borrowers) State Loan per capita ln(State Loan per borrowers)
RSI -82.55 -0.00149
(81.32) (0.0280)
INTRA 34.28 0.245 129.8 0.246
(434.4) (0.226) (420.1) (0.218)
INTER -447.4 -0.158 -386.8 -0.157
(427.8) (0.412) (441.1) (0.417)
Constant -56,458* 12.37 -60,057* 12.30
(30,542) (8.765) (30,504) (8.987)
Observations 951 951 951 951
Adjusted R-squared 0.769 0.665 0.769 0.665
Control Variables Yes Yes Yes Yes
Fixed Effects State, Year State, Year State, Year State, Year