bank credit and productivity: evidence from mexican firms · bank credit and productivity: evidence...
TRANSCRIPT

Banco de México
Documentos de Investigación
Banco de México
Working Papers
N° 2015-06
Bank Credit and Productivi ty: Evidence from Mexican
Firms
March 2015
La serie de Documentos de Investigación del Banco de México divulga resultados preliminares de
trabajos de investigación económica realizados en el Banco de México con la finalidad de propiciar elintercambio y debate de ideas. El contenido de los Documentos de Investigación, así como lasconclusiones que de ellos se derivan, son responsabilidad exclusiva de los autores y no reflejannecesariamente las del Banco de México.
The Working Papers series of Banco de México disseminates preliminary results of economicresearch conducted at Banco de México in order to promote the exchange and debate of ideas. Theviews and conclusions presented in the Working Papers are exclusively the responsibility of the authorsand do not necessarily reflect those of Banco de México.
Mario Vi l la lpando B.Banco de México

Bank Credi t and Product ivi ty: Evidence from MexicanFirms*
Abstract: Based on a survey of Mexican firms, this paper provides evidence of the positive effect ofbank credit on firms' productivity. This effect is larger for those firms with access to bank credit andinvestment opportunities than for firms that only have either investment perspectives or bank credit. Thepotential problem of endogeneity in the empirical estimates is addressed by using instruments -collateraland expenses on energy and telecommunications- for the main explanatory variables. The relevantparameters indicating a positive effect of bank credit to productivity are consistent between estimationtechniques.Keywords: Bank credit; labor productivity.JEL Classification: D220; D240.
Resumen: Con base en una encuesta de empresas mexicanas, en este artículo se proporcionaevidencia del efecto positivo del crédito bancario sobre la productividad de las empresas. Este efecto esmayor para las empresas con acceso al crédito bancario y con oportunidades de inversión que para lasempresas que sólo tienen oportunidades de inversión o sólo tienen crédito bancario. El problemapotencial de endogeneidad en las estimaciones empíricas se resuelve utilizando instrumentos (garantías ygastos en energía y telecomunicaciones) para las principales variables explicativas. Los parámetrosrelevantes que indican el efecto positivo del crédito bancario en la productividad son consistentes entretécnicas de estimación.Palabras Clave: Crédito bancario; productividad laboral.
Documento de Investigación2015-06
Working Paper2015-06
Mario Vi l l a lpando B. yBanco de México
*The author thanks the opinions and suggestions of participants at the 18th. Annual LACEA meeting in MexicoCity, 2013. Also, the author received valuable comments from J.L. Negrin, D. Garces, R. Guerrero and twoanonymous referees. y Dirección General de Asuntos del Sistema Financiero. Email: [email protected].

1
1. Introduction
The productivity of firms in Mexico and other developing countries is low compared to
industrialized countries.1 A main reason of low productivity is the abundance of small firms
and Mexico has an overabundance of small firms (around 95 percent of all establishments
have less than 11 employees)2. At a Latin American level, Pages (2010) mentions that
reducing the number of micro firms and increasing the participation of medium firms so as
to replicate the structure in the U.S., would have the effect of doubling the level of
productivity of the region.
Multiple studies have studied the factors that explain the level and growth of firms’
productivity.3 Among those factors, however, the access of firms to finance and, in particular
their access to bank credit, has been scarcely analyzed, especially among small-sized firms.4
Many productive firms cannot expand or make the technological improvements and
investments needed to increase their productivity because they have no access to bank credit
(Aghion 2007; Bloom, et. al. 2010; Lora y Pages 2011). At the aggregate level, some articles
have found that financial development —measured by the level of credit and the size of the
stock market— is a good predictor of growth over next 10 to 30 years (King and Levine
1993; Levine 2005). This observation, however, may be biased because financial
development can be a leading indicator rather than a causal factor of growth (Rajan and
Zingales 1998).
One way to make progress on causality is to focus on the theoretical mechanisms through
which bank credit promotes productivity, which in turn provides a bridge between financial
development and growth (Fazzari, et. al. 1988; King and Levine 1993; Butler and Cornaggia
1 According to OECD statistics, productivity in Mexico and Chile, measured as GDP per hour worked, is 30
and 43 percent that of the United States, respectively.
(http://stats.oecd.org/Index.aspx?DatasetCode=LEVEL). 2 National Institute of Statistics and Geography (INEGI), Economic Census, 2009. 3 See Bartelsman and Doms (2000) and Syverson (2011) for a review of such studies. 4 Some papers addressing the effect of financial access on productivity are Butler and Corgaggia (2007) and
Gatti and Love (2006).
2
2007). In this context, this paper contributes offering empirical evidence on the effect of bank
credit on productivity.
As a matter of policy analysis, the potential impact of bank credit on firms’ productivity is
relevant in Mexico. Recent reforms to the financial regulatory framework have as a main
objective to promote firms’ access to bank credit at favorable terms, especially small-and-
medium enterprises (SME).5 These reforms are based on the presumption that bank credit
favors economic growth.
Figures from several sources provide evidence on the lack of bank credit among firms in
Mexico, particularly small-ones. Only 36 percent of firms with up to 100 employees have
any type of bank credit and just 50 percent of firms with more than 100 employees have this
kind of financing.6 This scarcity of bank credit is more critical among micro firms. Only 9.3
percent of firms with 6 to 10 employees (CNBV-BID 2009) and just 4.2 percent of firms with
less than 10 employees have bank credit (INEGI, Economic Census 2009).
There are compelling reasons to believe, however, that credit per se is not a sufficient
ingredient to promote firms’ productivity. Firms with credit access but without profitable
opportunities will use borrowed funds for non-investment purposes, such as the financing of
daily operations, or not to apply for investment loans (Ghani and Suri 1999; Butler and
Cornaggia 2007). Thus, credit without investment opportunities may be inefficient in terms
of productivity enhancement. The channel of transmission from credit to productivity is its
efficiency rather than its volume (De Gregorio and Guidotti 1995). This observation is the
basis of the empirical test implemented in this paper. Bank credit will have a greater favorable
effect on productivity on firms with investment perspectives.
The outline of this paper is as follows. The next section provides some arguments that relate
firms’ bank credit access to their productivity levels. Section 3 describes the data and the
5 The mentioned Reforms were published January 10, 2014 in the Official Gazette. 6 Banco de Mexico, Survey on the Short-Term Situation of the Loan Market (Encuesta de Evaluación
Coyuntural del Mercado Crediticio), January-March 2014.

3
determinants of productivity. This includes a description of the control variables. The fourth
section describes the methodology including a discussion on the variables used to select the
firms with investment opportunities. This section also contains the empirical results and
explains how some methodological issues are addressed, such as the potential problem of
endogeneity in the estimates. Section 5 includes the conclusions. Finally, the appendix
describes the definitions and sources of the variables used in the study.
2. The Link between Bank Credit and Productivity
This section attempts to provide causal arguments that relate firms’ bank credit access to their
productivity levels. Different rates of return and productivity exist for different sources of
finance.7 Firms have a preference ordering for the relevant finance where access to it is
dictated by its costs. Initially, firms prefer to use internal finance for making investments to
avoid paying a premium for external finance (Myers 1984).
Firms using only internal sources of finance, however, might be expected to earn lower rates
of return on this source of finance compared to those using external sources. Credit allows
firms to invest what their internal funds cannot support (Keasey and McGuinness 1990).
External finance is costly because there are fixed costs of external suppliers derived from
informational asymmetries, which means that differences in borrower quality cannot be
easily observed. One such information asymmetry relates to the problem of gauging firms’
investment returns especially where there is no history of previous investments. This problem
is more notorious for small- or new firms.
Another problem derived from informational asymmetries relates to the vigilance of external
financiers. After granting a loan, the suppliers of credit will have enough incentives to
monitor the borrower. This activity brings a positive effect on agency costs so funds are used
7 This statement is based on the view that internal and external capital are not perfect substitutes (see Fazzari,
et. al. 1988), and that producer profits are a positive monotonic function of productivity, so selection on
profits is equivalent to selection on productivity (Foster, et. al. 2008).

4
in a more efficient manner. For this reason, external finance will be closely related with the
best projects.
The mentioned informational asymmetry problems mean that the returns to investment and
productivity when financed by external rather than internal finance will need to be higher to
compensate for such costs (Keasey and McGuiness 1990). For this reason, firms with
investment perspectives with access to bank credit will be able to overcome financial
restrictions and make technological improvements to increase their productivity
(Schiantarelli and Jaramillo 1999; Gatti and Love 2006).
The aforementioned reasons of causality from bank credit to improvements in productivity
and returns were proved empirically by Banerjee and Duflo (2004). They found that credit
constrained firms that received bank lending increased their revenues after receiving
subsidized credit.
Banks have advantages over alternative suppliers of credits. Banks have better information
than other credit suppliers resulting from economies of scale and the comparative advantages
of information gathering. Based on their cost and informational advantage, banks can offer
better contract terms to firms than other available sources of financing (Berger and Udell
1995; Rajan and Zingales 2003; Pages 2010).8
In this regard, Keasey and McGuinness (1990) found that “small new firms are more efficient
in their use of funds when they are answerable to, and are monitored by, private sector
banks”. A more efficient use of bank credit leads to higher returns and productivity levels.
Projects financed with other sources of funds, such as government loans and trade credit, are
expected to have lower returns than those financed with bank credit. Government loans are
8 Alternative suppliers of credit may not monitor efficiently the use of loans extended to them. For instance,
trade credit is not usually granted to maximize a firms’ return, but as a matter of exchange custom and to
secure customer loyalty (Keasey and McGuinness 1990).

5
not necessarily granted to maximize firms’ returns or enhance their productivity and trade
credit is granted mainly to assure customer loyalty and its maturity is very short.
3. Data Description and Determinants of Productivity
The data used in this study come from the Survey of Enterprises on Competitiveness,
Financing and Use of Financial Services9 (ENAFIN) conducted by the National Banking
Commission and Inter-American Development Bank (2009). The survey collects information
of sources and terms of financing and use of financial services, including data on firm profiles
and characteristics of ownership, as well as measures of competitiveness.
The survey includes information of 986 non-financial firms with more than 5 employees in
localities with at least 50 thousand inhabitants. Firms are grouped in four size categories
(micro, small, medium and large) according to the number of employees (see Appendix for
more information).
a. Labor productivity
The analysis is based on labor productivity (LP) measured as the output (y) to labor ratio (l):
𝐿𝑃 =𝑦
𝑙
(1)
Labor is measured as the number of employees per firm. Output is computed as firm’s total
income weighted by an aggregate output price index at the sector level (industry, trade and
services).10
LP is used for several reasons. LP is i) an informative measure of firms’ unit labor cost, which
is employed by entrepreneurs to make decisions on profitable opportunities, ii) a well-known
9 “Encuesta Nacional de Competitividad, Fuentes de Financiamiento y Uso de Servicios Financieros de las
Empresas”. 10 Theoretically the use of an aggregate price index may bias LP measures when there is not perfect competition.
Deviations form a single price bias LP for firms with higher prices. On this respect, Bartelsman and Doms
(2000) reviewed several studies and found that the use of an aggregate price index do not change the
qualitative results. These authors also found that TFP measurements are also affected by the use of aggregate
indexes when the input prices differ from their marginal products.

6
variable for evaluating firms’ efficiency and c) highly correlated with total factor productivity
measures (TFP). In a time series analysis, LP may be a misleading measure of productivity
because LP growth may be derived from changes in the capital-labor ratio. In a cross-section
analysis, however, this problem is absent because such capital-labor ratio is constant across
firms.11 Finally, both, LP and TFP, are the main productivity variables used for empirical
research (Bartelsman and Doms 2000; Baily, et. al. 2001; Baily and Solow 2001; Easterly
2001).
Figure 1 shows the firm-level distribution of productivity.12 LP dispersion is wide. This result
is found in other countries (Bartelsman and Doms 2000). There is a positive relationship
between firm size and productivity. As can be seen in Table 1, medium- and large-size
enterprises have higher productivity levels than smaller ones (Leung, et. al. 2008). A small-
sized firm is 52 percent less productive than a large-sized firm. The observed labor dispersion
suggests resource allocation problems, so an efficient allocation would improve the aggregate
productivity (Hsieh and Klenow 2009). The relationship between firm size and productivity
also varies among economic sectors as seen in Figure 2 (Rajan and Zingales 1998).
b. Determinants of productivity
Besides that industries are collections of heterogeneous-productivity producers, businesses’
measured productivity levels are persistent and vary significantly within industries,
suggesting that productivity has an inherent idiosyncratic element (Alfaro, et. al. 2008). For
this reason, the identification of the effect of bank credit on productivity requires to control
for such factors. These selected factors constitute the main objects of study in the specialized
literature (Bartelsman and Doms 2000 and Pages 2010).
Competition is the main driver of productivity. In this paper, this element is measured by
firms’ foreign sales. A key prediction of some international trade models is that only the most
11 For a cross-section analysis, the form of the production function is also not relevant because the technology
is constant across firms. 12 Data limitations allow the estimation of LP for a total of 369 firms.
7
productive firms succeed in exporting while the least productive firms survive entirely on
their sales in the domestic market (Tybout and Roberts 1997; Melitz 2003 and Bernard, et.
al. 2003). Table 2 shows evidence that export-oriented firms —defined as firms with export
sales that exceed 50 percent of total revenue— have higher levels of productivity than other
types of firms.
Human capital is regarded also as one of the main factors affecting productivity. Some studies
based on firm-level data have found that the best human resources are concentrated in capital-
intensive industries, which are usually large-sized firms, while low-skill workers are located
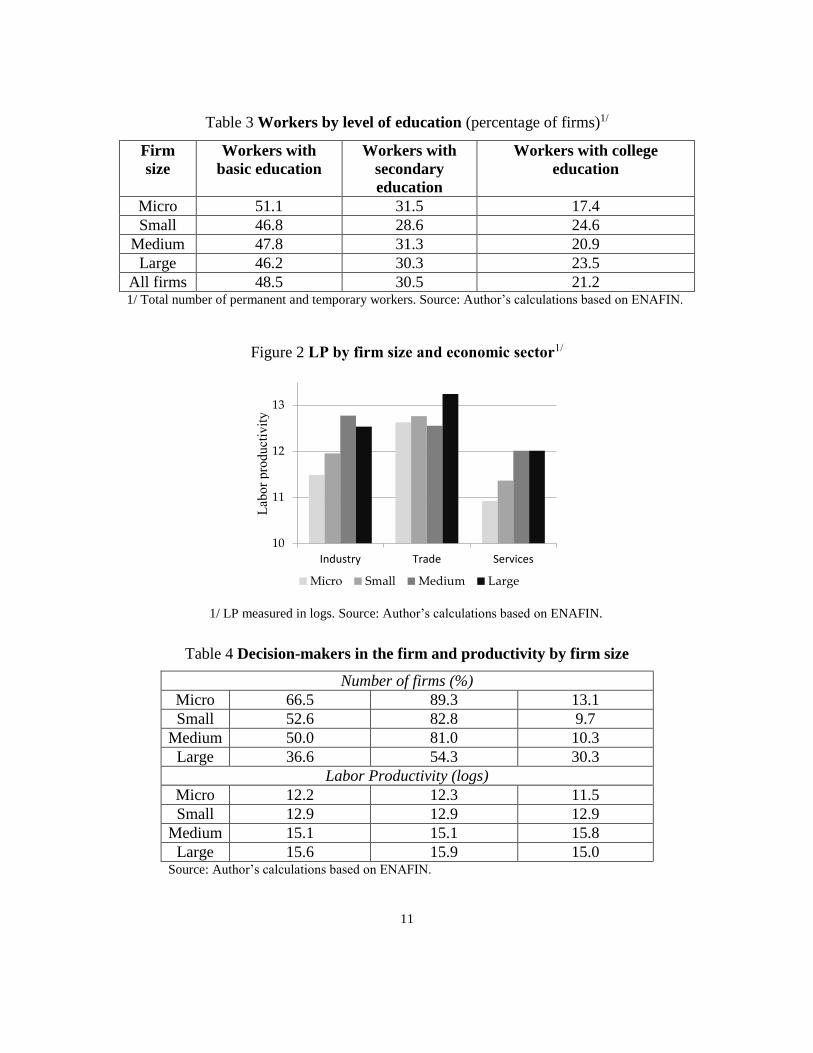
in micro and small sized firms (Abowd, et. al. 2002). Table 3 shows similar patterns in
Mexican firms. Workers with more years of education are concentrated in medium- and
large-sized firms.
Decision-making in the firm also affects productivity. In developing countries, there is an
abundance of family owned firms, where family members control the business and make the
important decisions. In some family firms, owners are not entrepreneurs. Lack of
entrepreneurship explains why some low-productivity firms remain in some "natural" small
scale industries.13 Small business owners have "little desire to grow big or to innovate in any
observable way" and may pursue non-pecuniary benefits (Hurst and Pugsley 2011).
In family firms, because entrepreneurial ability is not necessarily related to family ties,
directors do not always make the best decisions, thus reducing the firm’s efficiency (Bloom,
et. al. 2010).
Also, badly managed firms and entrepreneurs pursuing non-pecuniary benefits combined
with a “natural” small scale of some industries explain why some firms do not grow and
maintain low levels of productivity.
13 Some examples of small-scale industries are plumbers, electricians, contractors, painters, skilled
professionals, insurance and real estate agents and small shopkeepers.
8
At odds with small-sized firms, Maury (2006) found that in large firms active family control
is associated with higher profitability compared to non-family firms because family control
reduces the agency problem between owners and managers. For these reasons, the final
verdict on the relation between family-owned firms and their productivity is an empirical
matter.
Three variables are included in the empirical estimate for the factors associated with family
enterprises. One variable indicates that if directors are relatives of owners, the second one
indicates when the owner is the general manager and the third one is a measure of external
control –where external shareholders own 50 per cent or more of the firm’s capital. Table 4
shows that a larger proportion of micro and small sized firms are family-owned with active
family control and scarce external participation. More than half of large firms are family
controlled. The bottom part of Table 4 shows firms´ LP and selected measures of internal
decision making. The data show no significant differences in productivity among family-
owned firms, firms where the owner is the general manager and firms with external control.
The prevalence of a large informal sector also helps to explain firms’ productivity. Pages
(2010) showed that a complex taxation system negatively affects firms’ productivity. At the
firm level, ill-designed taxes are an incentive for firms to dedicate time and money to avoid
them, diverting resources from more productive uses. At the same time, some public policies
to promote job creation favor small and medium enterprises (SME) whatever their
productivity levels, shifting employment away from large firms in an inefficient manner.
There are also compelling reasons for the small entrepreneur to join the tax net. For SME,
participation in the tax regime brings a firm into the formal sector, allowing it to access
formal credit markets, government procurement, and access to markets including those for
export.

9
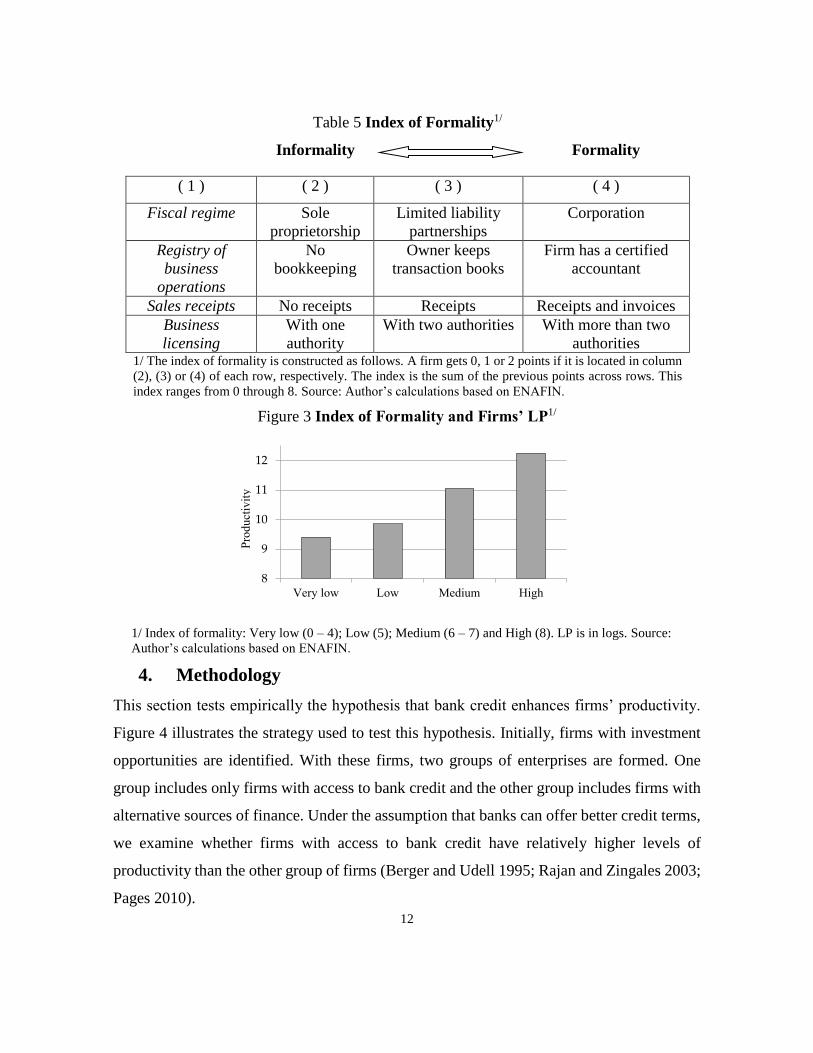
Given the relevance of formality on productivity, the empirical estimate includes an index of
formality14 based on the following variables:
1. Fiscal regime: a) sole proprietorship, b) limited liability partnerships or c)
corporations.15
2. Registry of business operations: a) no bookkeeping, b) owner keeps transaction
books, c) the firm has a certified accountant to keep the books or the firm has a
certified cash register (SHCP).
3. Sales receipts: a) no receipts, b) only receipts, d) receipts and invoices.16
4. Business licensing. Firm is registered with the IRS, county, ministry of economy,
secretary of health, etc.
5. Based on the above variables an index of formality is constructed. This index has
a range of 0 to 8 with 8 being a firm inside the formal system (Table 5). Figure 3
suggest a positive relationship between the degree of formality and productivity.
A plausible explanation of this finding is that the more productive firms have more
incentives to be formal.
In the empirical estimate, the above-mentioned factors are included in an attempt to control
their effect on productivity with the following expected results.
1. A positive relationship between firm size and productivity.
2. The existence of idiosyncratic differences among economic sectors.
3. Firms with a larger proportion of foreign sales are expected to have higher levels of
productivity.
4. Concentration of skilled workers in large-sized firms with higher levels of productivity.
5. Formal firms are more productive than informal ones.
14 The meaning of this index of formality is independent of official definitions. For instance, INEGI considers
informal those firms where the owner and firm’s assets are not separated and their operations are outside of
their legal framework. 15 These terms correspond roughly to the following Spanish terms: a) persona física sin actividad empresarial,
b) persona física con actividad empresarial and c) persona moral. 16 These terms correspond roughly to the following Spanish terms: a) no emite recibos ni facturas, b) sólo emite
recibos and c) emite facturas y recibos o cuenta con caja registradora de SHCP.

10
Figure 1 Distribution of firm-level labor productivity (logs)
Note: Labor productivity measured in logs. Source: Author’s calculations based on ENAFIN.
Table 2 LP of export and non-export oriented firms1/
Firm size Export-oriented firms2/ Non export-oriented
firms
Micro 12.4 11.4
Small 12.7 11.8
Medium 14.0 12.5
Large 12.6 12.5
All firms 12.1 11.7 1/ LP in logs. The difference between export-oriented and non-export-oriented firms is statistically
significant at 5 percent level. 2/ Firms with export sales that exceed 50 percent of total revenue. Source:
Author’s calculations based on ENAFIN.
05
10
15
Pe
rcen
t
6 8 10 12 14 16Labor productivity (logs)
Table 1 Descriptive statistics of LP and LP relative index by firm size
Firm size Average Standard Deviation Number of
observations
Relative Index
Micro 11.47 1.62 138 62.6
Small 11.83 1.62 111 52.1
Medium 12.68 1.57 52 122.5
Large 12.48 1.43 68 100.0
All firms 11.93 1.64 369 n.a. Notes: LP measured in logs; the relative index is constructed as the LP for each firm size with respect
to large firms, in other words, this index measures firms’ LP with respect to large firms. Source:
Author’s calculations based on ENAFIN.
11
Table 3 Workers by level of education (percentage of firms)1/
Firm
size
Workers with
basic education
Workers with
secondary
education
Workers with college
education
Micro 51.1 31.5 17.4
Small 46.8 28.6 24.6
Medium 47.8 31.3 20.9
Large 46.2 30.3 23.5
All firms 48.5 30.5 21.2 1/ Total number of permanent and temporary workers. Source: Author’s calculations based on ENAFIN.
Figure 2 LP by firm size and economic sector1/
1/ LP measured in logs. Source: Author’s calculations based on ENAFIN.
Table 4 Decision-makers in the firm and productivity by firm size
Number of firms (%)
Micro 66.5 89.3 13.1
Small 52.6 82.8 9.7
Medium 50.0 81.0 10.3
Large 36.6 54.3 30.3
Labor Productivity (logs)
Micro 12.2 12.3 11.5
Small 12.9 12.9 12.9
Medium 15.1 15.1 15.8
Large 15.6 15.9 15.0 Source: Author’s calculations based on ENAFIN.
10
11
12
13
Industry Trade Services
Micro Small Medium Large
Lab
or
pro
du
ctiv
ity
12
Table 5 Index of Formality1/
Informality Formality
( 1 ) ( 2 ) ( 3 ) ( 4 )
Fiscal regime Sole
proprietorship
Limited liability
partnerships
Corporation
Registry of
business
operations
No
bookkeeping
Owner keeps
transaction books
Firm has a certified
accountant
Sales receipts No receipts Receipts Receipts and invoices
Business
licensing
With one
authority
With two authorities With more than two
authorities 1/ The index of formality is constructed as follows. A firm gets 0, 1 or 2 points if it is located in column
(2), (3) or (4) of each row, respectively. The index is the sum of the previous points across rows. This
index ranges from 0 through 8. Source: Author’s calculations based on ENAFIN.
Figure 3 Index of Formality and Firms’ LP1/
1/ Index of formality: Very low (0 – 4); Low (5); Medium (6 – 7) and High (8). LP is in logs. Source:
Author’s calculations based on ENAFIN.
4. Methodology
This section tests empirically the hypothesis that bank credit enhances firms’ productivity.
Figure 4 illustrates the strategy used to test this hypothesis. Initially, firms with investment
opportunities are identified. With these firms, two groups of enterprises are formed. One
group includes only firms with access to bank credit and the other group includes firms with
alternative sources of finance. Under the assumption that banks can offer better credit terms,
we examine whether firms with access to bank credit have relatively higher levels of
productivity than the other group of firms (Berger and Udell 1995; Rajan and Zingales 2003;
Pages 2010).
8
9
10
11
12
Very low Low Medium High
Pro
duct
ivit
y

13
Figure 4 The Relationship between Bank Credit and Productivity
Firms with investment
opportunities
Firms without
investment
opportunities
Use credit to
finance daily
operations
Firms with access
to bank credit
Firms without
bank credit
Increase their
productivity levels
Increase their
productivity less
than firms with
bank credit
Firms with access
to bank credit
Firms without
bank credit
Divert funds from investment
Obtain credit from
non-bank lenders or
use internal funds
Obtain better loan
terms
Obtain credit from
non-bank lenders
or use internal
funds

14
a. The Basic Test
Econometrically, the hypothesis is tested using the following model17:
Labor productivity i = Constant + ∑ (γs Control variables i )
+ β (Investment opportunities i ∙ Bank credit i) + εi
(2)
Productivity is measured in logs for each firm indexed by i. The Greek letters β and γ
represent parameters and ε is an error term with the usual properties. The control variables
(indexed by s) are the following.
1. Firm size and firm age attempt to control for productivity dispersion and heterogeneity.
Size and age are positively related to productivity levels, so positive coefficients on
these variables are expected.
2. Economic sector. Data show that capital intensive firms have higher productivity
levels. There could be a technological reason why some firms are more capital-
intensive than others. The initial project scale, the gestation period and the cash harvest
period are different among sectors.
3. Workers’ years of education, as a proxy of human capital.
4. Export-oriented firms. Firms with larger foreign sales also have higher levels of
productivity.
5. Decision-maker. As discussed in the previous section, whether the owner or some other
person is the key decision-maker for investment choices affects productivity. In this
17 This model is used for several reasons. First, it is simple and based on the interaction of two dummy variables.
“By looking at interaction effects … rather than direct effects, we reduce the number of variables that we rely
on…” (Rajan and Zingales 1998, p. 584). As stated in the hypothesis, a positive and significant parameter of
the interaction term will indicate that firms with both investment opportunities and bank credit have larger
productivity levels than other type of firms. Second, this specification is based on the assumption that firms
with bank credit can reach higher levels of productivity given a set of control variables. This means that bank
credit access allows firms to be more productive independent of their size, age, economic sector, and other
factors.

15
regard, three variables are considered. In a family-owned firm, the owner is the general
manager of the firm.
6. The firm’s degree of formality. Firms operating in the informal sector have limited
capital, low technology and less-skilled workers, so their productivity level is below
the industry average.
The hypothesis that bank credit enhances the productivity of firms with investment
opportunities is tested through the interaction of two dichotomous variables (0,1): i)
investment opportunities and ii) bank credit. The significance of parameter β will indicate
that bank credit promotes productivity.
b. The Proxy for Firms with Investment Opportunities
Firms with investment opportunities are selected by means of a question on managers’
expectations for investment plans in the next two years.18 Here, it is assumed that there is a
relationship between investment opportunities and the need to buy capital. The relevance of
this question and its relationship with bank credit is analyzed in the upper half of Table 6.
As can be seen, more than 60 percent of total firms answered planning to invest in
machinery/equipment over the next two years. With respect to credit availability, of all firms
only one fifth has a bank loan. Access to bank credit increases with firm size.
The bottom part of Table 6 provides evidence on a positive relationship between productivity
and access to bank credit. Firms with both investment opportunities and bank credit are more
productive than firms with investment opportunities and without bank credit.19 Those
productivity differences are larger and significant for small and micro firms. This finding
suggests that bank credit has a larger impact on the productivity of firms with fewer credit
alternatives.
18 Question number 9.24 on the ENAFIN questionnaire asks the following: “Is the firm planning to buy
machinery/equipment in the next two years?” A caveat regarding this question is that entrepreneurs are
expressing their expectations, so labor productivity is measured before any investment takes place. 19 Statistically significant at 1-percent level.

16
Table 6 Productivity of firms with plans to buy machinery/equipment in the next 2
years with and without bank credit1/ Variable Micro Small Medium Large All
Percentage of Firms
Firms with plans to buy machinery /equipment in the next 2 years 59.2 62.2 57.8 66.2 61.0
Firms with bank credit 9.3 23.5 30.4 32.2 20.5
Firms with bank credit and plans to buy machinery/equipment in the next 2 years 6.1 16.4 17.0 23.9 13.7
Productivity (logs)
Firms with bank credit and plans to buy machinery/equipment in the next 2 years 13.3 12.4 13.0 12.6 12.7
Firms without bank credit and plans to buy machinery/equipment in the next 2 years
11.4 11.6 12.6 12.4 11.8
1/ See Appendix for definitions and source of variables. Source: Author’s calculations based on ENAFIN.
c. Results of the Basic Test
Table 7 reports the final estimates of specification (2). The specification controls for firm
characteristics and factors that affect productivity as described in the previous section. In all
estimates, labor productivity is the dependent variable. There are 369 available observations
for which there are non-missing data. Details of the econometric estimate are described at
the bottom of Table 7.
Equations (1) to (3) were estimated by OLS, identifying firms with investment opportunities
as those firms with plans to buy machinery/equipment in the next two years. Firms with bank
credit have loans, revolving facilities, or both. As can be seen in Table 7, the coefficient
estimate for the interaction term is positive and statistically significant at the 1-percent level
(in all estimates, the reported standard errors are robust to heteroscedasticity). This result
supports the hypothesis that bank credit enhances the productivity of firms with investment
opportunities.

17
The relevance of this result may be questioned, because the parameter may be biased due to
an endogeneity problem. Banks may grant loans to the more productive firms, so bank credit
flows to more productive firms not enhancing productivity. To address this issue, a variable
indicating firms that pledge collateral is used as an instrument for firms with bank credit. The
correlation between firms with collateral and bank credit is high (85 percent), but the
correlation between firms with collateral and their productivity level is not statistically
significant. This is particularly true for small-sized and new firms, where their productivity
has no relation with their lack of available properties or assets to pledge against loans.
Furthermore, lack of collateral is as a well-known small businesses owners’ reason to explain
their lack of interest in applying for bank loans (Kon and Storey 2003; Chakravarty and Xiang
2009). Collateral is correlated with bank credit, but not otherwise correlated with
productivity; this variable seems to be an adequate instrument for firms with bank credit.
The result that bank credit enhances productivity may also be questioned because firms with
investment opportunities are not being correctly identified. An alternative way to identify
firms with investment opportunities is through their consumption of energy and use of
communication services. Firms with prospects of an increase in demand are likely to increase
their consumption of electricity and make more phone calls. On the contrary, a firm with a
lack of investment opportunities would save on utility costs. Firm spending on utilities is
used as an instrument for investment opportunities.20 The correlation between utility costs
and investment opportunities is 82 percent and with productivity 23 percent.
Table 7 shows the estimated parameters of specification (2) using firms with collateral and
firms’ utility costs as instruments for bank credit and investment opportunities, respectively.21
As can be seen, the results coincide with OLS estimates. The coefficient estimate for the
interaction term is positive and statistically significant at the 1-percent level. These results
20 Utilities include consumption of electricity, telephone and internet service and rent of business space. 21 The applied methodology utilized in this paper follows Rajan and Zingales (1998). These authors mentioned
that “our methodology may have wider applications, such as testing the existing of channels through which
human capital can affect growth.” (p. 584). This paper follows their advice.

18
confirm that firms with access to bank credit and investment opportunities are more
productive than other firms.
d. Decomposition of the Effect of Bank Credit on Productivity
A second specification is used as an alternative test of the effect of bank credit on
productivity.22 The alternative specification is the following:
Labor productivity i = Constant + ∑ (γ s Control variables i )
+ β1 (Investment opportunities i) +
+ β2 (Bank credit i)
+ β3 (Investment opportunities i ∙ Bank credit i) + εi
(3)
Equation (3) is estimated by OLS in four steps. In all steps, the control variables are included
and the dependent variable is the log of labor productivity. In the first step corresponding to
column (1), only the dummy variable that indicates firms with investment opportunities is
introduced. As can be seen in Table 8, the coefficient estimate of the dummy variable is
positive and statistically significant at the 1-percent level. As in the previous table, all
standard errors are robust to heteroscedasticity and are reported in parenthesis. Column (2)
reports the estimated coefficient of bank credit measured as a dummy variable. Its sign is
positive and statistically significant at the 10-percent level. In column (3), both variables, the
one indicating investment opportunities and the other indicating bank credit, are included at
the same time.
22 The author thanks an anonymous referee for the suggestion to include this alternative test.

19
Table 7 Estimate Results of Specification (2)
*** Significant at the 1 percent level; ** at the 5 percent level; * at the 10 percent level.
Standard errors are in parentheses. Notes: labor productivity is measured as the log of output
per employee; output is equal to sales income deflated by its respective sector producer price
index; the formality index has a range of 0 to 8, where 8 is totally formal; investment
opportunities refers to question number 9.24 on the ENAFIN questionnaire that asks the
following: “Is the firm planning to buy machinery/equipment in the next two years?”; bank
credit is a dichotomous (0,1) variable where 1 indicates the firm has a loan or a revolving credit
facility from a commercial bank; firm age is measured as the log of years of the firm in the
market; firm size is defined by the number of employees; family-owned businesses are firms
where owners or their relatives are general managers; export-oriented firms are those with 50
percent or more of their sales abroad; industry and trade sectors are dichotomous variables
(1,0); regressions (1) to (3) are estimated with OLS; regressions (4) and (5) are estimated with
instrumental variables; workers’ years of educations were highly correlated with firm size, so
this was omitted from the final estimates; instrumental variables are bank credit and firms that
have investment opportunities with firms with guarantees and utility expenses, respectively;
the validity of these instruments is corroborated by implementing the Hausman test; in all
estimates the errors are heteroscedasticity-robust standard errors; there are 343—359 available
observations for which data are not missing. Regressions are estimated with unweighted sample
observations because the interest lay in the relationship between the independent and dependent
variables (Cameron and Trivedi 2005; Aronow and Samii 2014). Source: Author’s calculations
based on ENAFIN.
( 1 ) ( 2 ) ( 3 ) ( 4 ) ( 5 )
0.444*** 0.465*** 0.400** 0.804*** 0.618***
( 0.178 ) ( 0.182 ) ( 0.165 ) ( 0.233 ) ( 0.216 )
0.896*** 0.830*** 0.781*** 0.797*** 0.761***
( 0.077 ) ( 0.088 ) ( 0.091 ) ( 0.088 ) ( 0.090 )
0.010* 0.008 0.010* 0.008( 0.006 ) ( 0.006 ) ( 0.006 ) ( 0.006 )
-0.117 -0.047 -0.106 -0.040( 0.185 ) ( 0.178 ) ( 0.185 ) ( 0.177 )
-0.204 -0.273* -0.260 -0.308**( 0.160 ) ( 0.148 ) ( 0.161 ) ( 0.149 )
Export-oriented firm 0.525** 0.357* 0.529** 0.365*( 0.250 ) ( 0.227 ) ( 0.252 ) ( 0.223 )
Industry 0.325** 0.307*( 0.154 ) ( 0.153 )
Trade 1.095*** 1.080***
( 0.209 ) ( 0.209 )
Constant 0.444*** 0.525*** 9.112*** 9.332*** 9.165***
( 0.178 ) ( 0.250 ) ( 0.374 ) ( 0.371 ) ( 0.372 )
R2 0.314 0.349 0.408 0.340 0.340Number of observations 359 344 344 343 343
Age
Micro or small firm
Familiy-owned firm
Variable
Dependent variable: labor productivity
OLS IV
Interaction term (investment
opportunities x bank credit)
Formality

20
Table 8 Estimate Results of Specification (3)
Note: See notes to Table 7.
The estimated parameters of specification (3) do not contradict the results of specification
(2). Firms with plans to buy machinery/equipment in the next two years and have bank credit
are more productive than firms that have either bank credit or investment opportunities. In
addition to this conclusion, specification (3) provides evidence on the impact of bank credit
on the level of productivity of firms. Bank credit, in general, enhances productivity
independently if the firm has investment opportunities. This result agrees with the general
perception among entrepreneurs and policy-makers that credit is good for enterprises.
( 1 ) ( 2 ) ( 3 ) ( 4 )
0.339** 0.320** 0.382**
( 0.149 ) ( 0.148 ) ( 0.177 )
0.436*** 0.390*** 0.596**
( 0.088 ) ( 0.155 ) ( 0.280 )
-0.295
( 0.322 )
0.799*** 0.783*** 0.770*** 0.773***
( 0.091 ) ( 0.088 ) ( 0.090 ) ( 0.090 )
0.007 0.009 0.008 0.008( 0.006 ) ( 0.006 ) ( 0.006 ) ( 0.006 )
-0.072 -0.018 -0.026 -0.013( 0.178 ) ( 0.180 ) ( 0.181 ) ( 0.183 )
-0.227** -0.288** -0.276** -0.263*( 0.144 ) ( 0.148 ) ( 0.146 ) ( 0.147 )
Export-oriented firm 0.381* 0.377* 0.419** 0.437**
( 0.223 ) ( 0.219 ) ( 0.218 ) ( 0.219 )
Industry 0.344** 0.295* 0.304** 0.302**
( 0.153 ) ( 0.153 ) ( 0.154 ) ( 0.154 )
Trade 1.130*** 1.000*** 1.067*** 1.055***
( 0.206 ) ( 0.217 ) ( 0.210 ) ( 0.213 )
8.887*** 9.059*** 8.917*** 8.851***( 0.388 ) ( 0.366 ) ( 0.383 ) ( 0.400 )
R2 0.410 0.409 0.419 0.420
Number of observations 344 347 344 344
Constant
Variable
Dependent variable: labor productivity
Interaction term (investment
opportunities x bank credit)
Formality
Investment opportunities
Bank credit
Age
Micro or small firm
Familiy-owned firm
OLS
21
5. Conclusions
The idea that credit promotes productivity is common sense among entrepreneurs and policy-
makers. Credit allows many productive firms to expand or make technological improvements
and investments needed to increase their productivity beyond what their internal funds can
support. Under these conditions, credit is efficiently assigned. However, the absence of
investment opportunities may lead firms to divert credit to non-investment uses or not to
apply for investment loans. Thus, the channel of transmission from credit to productivity is
efficiency rather than its volume.
Based on a survey of Mexican firms, this paper provides evidence of the positive effect of
bank credit on firms’ productivity. This effect is larger for those firms with access to bank
credit and investment opportunities than other firms included those that only have either
investment perspectives or bank credit. The potential problem of endogeneity in the empirical
estimates is addressed by using instrument –collateral and expenses on energy and
telecommunications- for the main explanatory variables. The relevant parameter indicating a
positive effect of bank credit to productivity is consistent among estimates and estimation
techniques.
6. References
Abowd, J., J. Haltiwanger, R. Jarmin, J. Lane, P. Lengermann, K. McCue, K. McKinney and
K. Sandusky (2002). The Relation among Human Capital, Productivity, and Market
Value: Building Up from Micro Evidence, Technical Paper no. TP-2002-14 US Census
Bureau, LEHD Program, U.S.A.
Aghion P. (2007), “Interaction Effects in the Relationship between Growth and Finance”, in
X. Freixas et al. (eds.), European Financial Markets and Institutions, Oxford: Oxford
University Press.
Aronow, Peter M. and Cyrus Samii (2014), Does Regression Produce Representative
Estimates of Causal Effects? EPSA 2013 Annual General Conference Paper 585, January.
22
Alfaro, L., A. Charlton and F. Kanczuk (2008). Plant-size Distribution and Cross-Country
Income Differences, W.P. number 14060, NBER, U.S.A.
Baily, M. N. and R. M. Solow (2001). International Productivity Comparisons built from the
Firm Level, Journal of Economic Perspectives, 15(3), Summer, pp. 151—172.
Baily, M. N., E. J. Bartelsman and J. Haltiwanger (2001). Labor Productivity: Structural
Change and Cyclical Dynamics, Review of Economics and Statistics, 83(3), august, pp.
420—433.
Banerjee, A, and E. Duflo (2004),”Do Firms Want to Borrow More? Testing Credit
Constraints Using a Directed Lending Program”, BREAD Wor king, Paper 2003-5.
Bartelsman, E. J. and M. Doms (2000). Understanding Productivity: Lessons from
Longitudinal Microdata, Journal of Economic Literature, 38, September, pp. 569—594.
Berger, A. N. and G. F. Udell (1995). Relationship Lending and Lines of Credit in Small
Firm Finance, Journal of Business, 68(3), 351—381.
Bernand, A. B., J. Eaton, J. B. Jensen and S. S. Kortum (2003). Plants and Productivity in
International Trade, American Economic Review, 93(4), pp. 1268—1290.
Bloom, N., A. Mahajan, D. McKenzie and J. Roberts (2010). When Do Firms in Developing
Countries Have Low Productivity, American Economic Review, 100(2), pp. 619—623.
Butler, A. W. and J. Cornaggia (2007), Does Access to Finance Improve Productivity?
Evidence from a Natural Experiment, W.P. University of Texas.
Cameron, A. C. and P. K. Trivedi (2005). Microeconometrics. Methods and Applications,
Cambridge University Press, U.K.
Chakravarty, S. and M. Xiang (2009). What Discourages Small Businesses from Asking for
Loans? The International Evidence on Borrower Discouragement, W.P., Purdue
University.
Comisión Nacional Bancaria y de Valores (CNBV) and Banco Interamericano de Desarrollo
(BID) (2009). Encuesta Nacional de Competitividad, Fuentes de Financiamiento y Uso
de Servicios Financieros de las Empresas.

23
De Gregorio, J. and P. E. Guidotti (1995). Financial Development and Economic Growth,
World Development, 23(3), pp. 433-448.
Easterly, W. (2001). The Elusive Quest for Growth, World Bank, U.S.A.
Fazzari, S. M. and R. G. Hubbard and B. C. Petersen (1988), Financing Constraints and
Corporate Investment, Brookings Papers on Economic Activity, 1, pp. 141—206.
Foster, L. and J. Haltiwanger, and C. Syverson (2008), Reallocation, Firm Turnover, and
Efficiency: Selection on Productivity or Profitability?” American Economic Review,
98(1), pp. 394—425.
Ghani, E. and V. Suri (1999). Productivity Growth, Capital Accumulation, and the
Banking Sector: Some Lessons from Malaysia, W.P. number 2252, World Bank.
Gatti, R. and I. Love (2006). Does Access to Credit Improve productivity? Evidence from
Bulgarian firms, W.P. No. 3921, World Bank.
Hsieh, C. and P. J. Klenow (2009). Misallocation and Manufacturing TFP in China and India,
Quarterly Journal of Economics, 124(4), November, pp. 1403—1448.
Hurst, E. and B. Wild Pugsley (2011). What Do Small Businesses Do? W.P. 17041, NBER,
U.S.A.
Keasey, K. and P. McGuinness (1990). Small New Firms and the Return to Alternative
Sources of Finance, Small Business Economics, 2, pp. 213—222.
King, R. G. and R. Levine (1993), Finance and Growth: Schumpeter Might Be Right,
Quarterly Journal of Economics, 108(3), pp. 717—737.
Kon, Y. and D. Storey (2003). A Theory of Discouraged Borrowers, Small Business
Economics, 21(1), pp. 37—49.
Leff, N. H. (1979). Entrepreneurship and Economic Development: The Problem Revisited,
Journal of Economic Literature, 17, March, pp. 46—64.
Leung, D., C. Meh and Y. Terajima (2008). Firm Size and Productivity, W.P. Number 45,
Bank of Canada, Canada.
Levine, R. (2005), “Finance and Growth: Theory and Evidence,” in Handbook of Economic
Growth, P. Aghion and S. Durlauf (eds.), The Netherlands: Elsevier Science.

24
Lora, E. and C. Pagés (2011), Face-to-Face with Productivity, Finance & Development,
48(1), march.
Melitz, M. J. (2003). The Impact of Trade on Intra-Industry Reallocations and Aggregate
Industry Productivity, Econometrica, 71(6), pp. 1695—1725.
Maury, B. (2006). Family Ownership and Firm Performance: Empirical Evidence from
Western European Corporations, Journal of Corporate Finance, 12, pp. 321—341.
Myers, S. C. (1984). The Capital Structure Puzzle, Journal of Finance, pp. 575—592.
Pages, C. (ed.) (2010). La Era de la Productividad: Cómo Transformar las Economías desde
sus Cimientos, Banco Interamericano de Desarrollo, México.
Rajan, R. G. and L. Zingales (1998). Financial Dependence and Growth, American Economic
Review, 88(3), June, pp. 559—586.
Rajan, R. G. and L. Zingales (2003). Saving Capitalism from the Capitalists. Unleashing the
Power of Financial Markets to Create Wealth and Spread Opportunity, Crown Business,
New York, U.S.A.
Schiantarelli, F. and F. Jaramillo (1999). Access to Long-Term Debt and Effects on Firms'
Performance: Lessons from Ecuador,” W.P. number 1725, World Bank.
Syverson, C. (2011), What Determines Productivity?, Journal of Economic Literature, June,
49(2), pp. 326—365.
Tybout, J. and M. Roberts (1997). The Decision to Export in Colombia: An Empirical Model
of Entry with Sunk Costs, American Economic Review, 87(4), pp. 545—563.
7. Appendix
The data used in the current study comes from the Survey of Enterprises on Competitiveness,
Financing and Use of Financial Services23 (ENAFIN) (Encuesta Nacional de Competitividad,
23 “Encuesta Nacional de Competitividad, Fuentes de Financiamiento y Uso de Servicios Financieros de las
Empresas”.

25
Fuentes de Financiamiento y Uso de Servicios Financieros de las Empresas)24 conducted by
the Banking and Securities Supervisory Agency (Comisión Nacional Bancaria y de Valores)
and the International Development Bank (IDB) with respect to information on firms’
financing sources. The survey collected information for 2009 on 986 non-financial firms with
more than 5 employees in localities with at least 50 thousand inhabitants. The ENAFIN
collected information on firms’ characteristics on age, formality compliance, decision-
makers in the firm, business income and expenses; financing sources and terms, and access
and use of financial services. Firms are grouped in four size-categories (micro, small,
medium and large) according to the number of employees (Table 7).
Table 9 Firm Size Categories by Number of Employees and Number of
Firms included in the ENAFIN
Firm size Number of employees Total number of
firms Trade Services Industry
Micro 6 to 10 6 to 10 6 to 10 367
Small 11 to 30 11 to 50 11 to 50 328
Medium 31 to 100 51 to 100 51 to 250 148
Large 101 or more 101 or more 251 or more 143
Total number of firms 986
Table 10 Dummy variables utilized in the empirical specifications
Source: ENAFIN.
24 Data is available at the following internet address:
http://www.cnbv.gob.mx/Prensa/Estudios/Base%20ENAFIN_website_.dta
Dummy variables utilized in the empirical
specifications
No. of non-
missing
observations
Observations
with value = 0
Observations
with value = 1
% of
observations
with value = 1
Firm with bank loans 986 784 202 20.5
Firms with investment opportunities 975 380 595 61.0
Family-owned firm 984 442 542 55.1
Export-oriented firm 965 916 49 5.1
Firms in the industry sector 986 631 355 36.0
Firms in the trade sector 986 766 220 22.3
Firms with investment opportunities and bank loans 975 841 134 13.7
Firms with collateral 986 739 247 25.1

26
Table 11 Definitions and Source of Variables from ENAFIN
Firm Variables Question number
Number of
employees
Q. 1.01. “En 2009 ¿cuántos empleados tuvo la empresa o negocio
(incluyendo personal administrativo)? Por favor indique cuántos
empleados son permanentes y cuántos temporales en este
establecimiento”.
Sales income Q. 9.02 En 2009, aproximadamente ¿cuál fue el monto de sus ingresos
anuales por ventas?
Output Sales income deflated by producer price indices
Investment
opportunities
Q. 9.24 ¿Planea comprar maquinaria y/o equipo en los próximos 2
años?
Collateral Q. 15.12 ¿Aportó alguna garantía por esta línea de crédito?
Q. 16.13 ¿Aportó alguna garantía por este crédito de largo plazo además
del bien que adquirió?
Utilities expense Q. 9.11 En 2009, ¿aproximadamente, cuánto pagó la empresa en un mes
promedio por…? 3. Pagos recurrentes como luz, renta, teléfono,
internet, televisión de paga, etc.
Age Q. 2.07. ¿Cuántos años tiene esta empresa (negocio) operando en su
actividad principal?
Family-owned Q. 2.02 ¿Es esta una empresa (negocio) familiar?
Owner is general
manager
Q. 2.03 ¿El director de esta empresa (negocio) es también el dueño
principal o socio de la misma?
External
participation
Q. 2.05 ¿Otra compañía o grupo económico es dueña de más del 50%
de esta empresa (negocio)?
Fiscal regime Q. 2.01 ¿Esta empresa (negocio) está registrada como una…? 1.
Persona física sin actividad empresarial, 2. Persona física con actividad
empresarial, 3. Persona moral.
Registry of
business
Operations
Q. 2.08 2.08 ¿Esta empresa (negocio)…?
1. No lleva ningún registro contable
2. El dueño lleva sus cuentas personalmente
3. Acude o cuenta con los servicios de un contador o profesional para
llevar las cuentas 4. Utiliza la caja registradora de la Secretaría de
Hacienda.
Sales receipts Q. 2.09 ¿Qué tipo de comprobantes expide esta empresa (negocio) a sus
clientes?1. Facturas, 2. Recibos 3. Facturas y recibos, 4.
Ninguno de los anteriores.

27
Firm Variables Question number
Business licensing Q. 2.10 ¿Esta empresa está registrada en…? 1.
Servicio de Administración Tributaria, 2. Municipio o delegación, 3.
Secretaría de Economía, 4. Secretaría de Salud5. IMSS, 6. Ninguna de
las anteriores.
Foreign sales Q. 9.03 En 2009, ¿qué porcentaje de sus ingresos por venta de
productos o servicios se destinó a mercados en el extranjero?
Bank credit Questions 15.01, 15.02, 16.01 and 16.02.
15.01 Al cierre de 2009, ¿cuál fue el saldo total de deuda de la empresa
en todas las líneas de crédito vigentes?
15.02 Durante el período 2005-2009, ¿cuántas líneas de crédito
revolvente obtuvo la empresa?
16.01 Al cierre de 2009, ¿cuál el saldo total de deuda de la empresa en
todos sus créditos simples de corto plazo?
16.02 Al cierre de 2009, ¿cuál el saldo total de deuda de la empresa en
todos sus créditos simples de largo plazo?