bank efficiency, ownership and market structure why...
TRANSCRIPT
Bank Efficiency, Ownership and Market Structure
Why are Interest Spreads so High in Uganda?
Thorsten Beck and Heiko Hesse*
This draft: September 2006
Abstract: Using a unique bank-level dataset on the Ugandan banking system over the period 1999 to 2005, we explore the factors behind consistently high interest rate spreads and margins. While foreign banks charge lower interest rate spreads, we do not find a robust and economically significant relationship between privatization, foreign bank entry, market structure and banking efficiency. Similarly, macroeconomic variables can explain little of the over-time variation in bank spreads. Bank-level characteristics, on the other hand, such as bank size, operating costs, and composition of loan portfolio, explain a large proportion of cross-bank, cross-time variation in spreads and margins. However, time-invariant bank-level fixed effects explain the largest part of bank-variation in spreads and margins. Further, we find tentative evidence that banks targeting the low-end of the market incur higher costs and therefore higher margins. JEL Classifications: G21, G30, O16 Keywords: Foreign Bank Entry; Financial Sector Reform; Bank Efficiency; Financial Intermediation; Uganda * Beck: World Bank, [email protected]. Hesse: Nuffield College, University of Oxford, [email protected]. We would like to thank Alexander Al-Haschimi, Steve Bond, Martin Cihak, Robert Cull, Michael Fuchs, Dino Merotto, Richard Podpiera, Rachel Sebudde and seminar participants at Oxford for useful comments and suggestions and are grateful to the Bank of Uganda for sharing the data with us and to Edward Al-Hussainy for help with the data. Also, funding from the ESRC under grant number PTA-051-2004-00004 is gratefully acknowledged by Heiko Hesse. This paper’s findings, interpretations, and conclusions are entirely those of the authors and do not necessarily represent the views of the World Bank, its Executive Directors, or the countries they represent.
1
1. Introduction
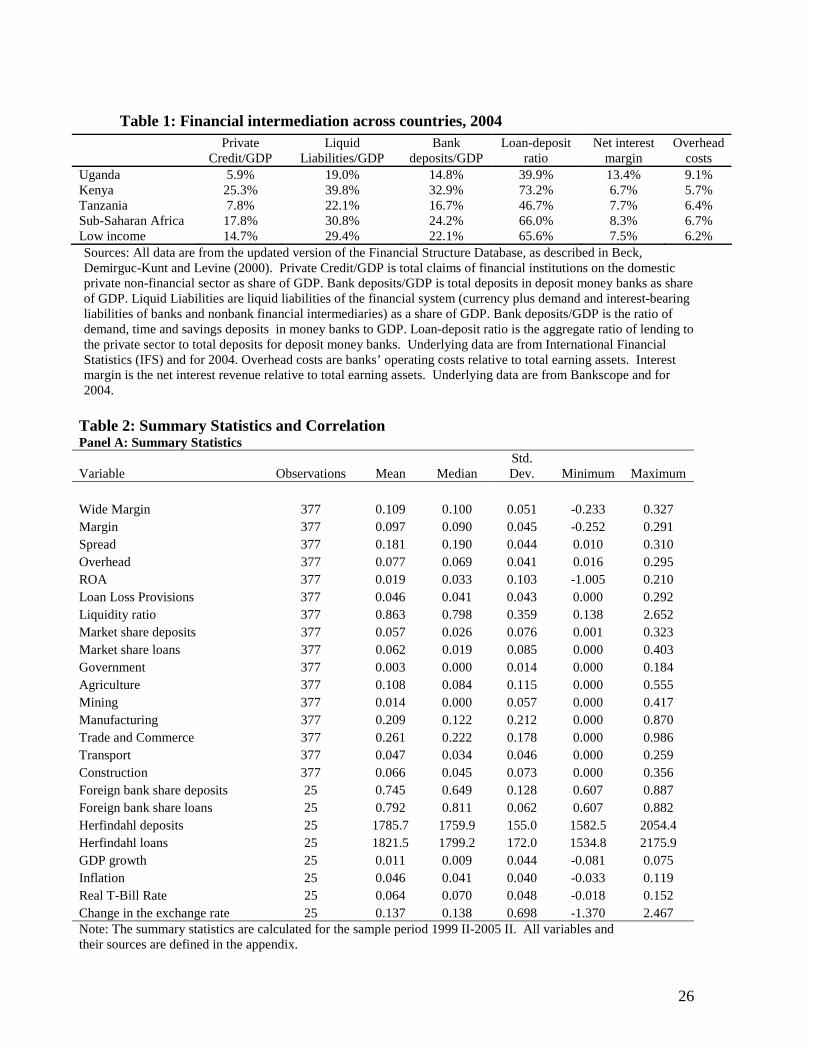
Like in many developing countries, interest rate spreads and margins have been high in
Uganda over the past ten years. In 2004, net interest margins, banks’ net interest revenue as ratio
to total earning assets, were 13.4% in Uganda, compared to 8.3% in the average Sub-Sahara
African country, 7.5% in the average low-income country and higher than in neighboring Kenya
and Tanzania (Table 1). At the same time, the average interest rate spread – the difference
between ex-ante contracted lending and deposit interest rates, hit 20%. During the past decade,
however, the structure of Uganda’s banking system has been undergoing rapid and fundamental
changes. Most importantly, the largest, government-owned bank was successfully privatized to a
foreign bank in 2002, and the share of foreign-owned banks has increased from 62.4% to 86.7%
in the deposit market and 60.7% to 81.9% in the loan market from 1999-2005. At the same time
there was an increase in bank concentration in the deposit, but not in the loan market, mostly due
to the privatization and foreign bank entry. What effect did these structural changes have on
interest rate spreads and margins? What role do bank characteristics, market structure and
macroeconomic factors, such as inflation and exchange rate policies, play in the variation of
interest rate spreads and margins across banks and over time?
Interest rate spreads and margins are often used as proxy variables for intermediation
efficiency. Whereas in the perfect textbook world of no market frictions and transaction costs,
deposit and lending rates are equal, intermediation costs and information asymmetries resulting
in agency costs drive in a spread between the interest rate paid to savers and the interest rate
charged to borrowers, with negative repercussions for financial intermediation.1 Additional to the
contractual and informational framework and the macroeconomic environment, the market
1 Cross-country comparisons show a negative correlation between the level of financial development – as measured by private sector lending to GDP – and interest rate spreads and margins.
2
structure can have an important impact on the incentives for banks to overcome these market
frictions and efficiently intermediate society’s savings to borrowers. A number of recent papers
have explored the relationship between foreign bank entry, market structure and interest rate
spreads and margins (Claessens, Demirguc-Kunt and Huizinga, 2001; Barajas, Steiner and
Salazar, 2000; Demirguc-Kunt, Laeven and Levine, 2004) and find a positive relationship
between foreign bank entry and intermediation efficiency but no robust relationship between
concentration and margins.
This paper explores the effect of bank privatization and foreign bank entry on
intermediation efficiency, as measured by interest margin and spreads, in the Ugandan banking
market over the period 1999 to 2005. We use a unique bank-level data set that not only includes
income statement and balance sheet information, but also information on ex-ante contracted
lending and deposit interest rates, loan portfolio composition and branch network. The
privatization of the largest and last government-owned bank, UCB, to the South African Stanbic
in 2002 not only implied a large increase in foreign ownership in the banking system but was
also accompanied by an increase in concentration in the deposit market. Uganda thus offers a
unique setting for studying the effects of financial market reform and market structure on interest
rate spreads and margins in a low-income Sub-Saharan African economy. Further, these changes
allow us to test and distinguish between two hypotheses: first, whether foreign-owned banks are
more efficient than government-owned or privately-owned domestic banks, and second, whether
there is a spill-over effect of foreign bank entry on domestic banks, forcing down spreads and
margins of domestic banks.
Interest rate spreads, or the gap between lending and deposit rates, are due to market
frictions such as transaction cost and information asymmetries. Transaction costs associated with
3
screening and monitoring borrowers and processing savings and payment services drive a wedge
between the interest rate paid to depositors and the interest charged to borrowers. These
intermediation costs, however, contain an important fixed cost element, at the client, bank and
even financial system level. Consistent with this, previous authors have found a negative
relationship between the size of banks and financial systems and operating costs and interest
spreads and margins (Bossone et al., 2002). The inability of creditors to diversify risks in a
competitive market due to market failures or non-existing markets results in a risk premium in
the lending interest rate, increasing the lending interest rate beyond the level necessary to cover
the creditor’s marginal cost of funds plus the intermediation costs discussed above. Consistent
with this, banks whose loan portfolios are more exposed to risky and volatile sectors such as
agriculture, have often higher ex-ante interest rate spreads. Finally, the inability of the lender to
perfectly ascertain the creditworthiness of the borrower and her project ex-ante and monitor the
implementation ex-post gives rise to adverse selection and moral hazard, effectively adding
another risk premium to lending interest rates (Stiglitz and Weiss, 1981). However, lack of
possibilities to diversify risks and asymmetric information can also result in higher loan loss
provisions for non-performing loans, which will reduce banks’ ex-post interest margins. Other
bank characteristics – again resulting from market frictions – can explain variation in spreads and
margins. Higher liquidity ratios as protection against sudden withdrawals reduce the share of
deposits that can be used for lending, thus increasing ex-ante spreads (Demirguc-Kunt et al,
2004). More profitable banks might be able to charge lower interest rate spreads or enjoy higher
spreads and margins explaining the higher profitability.
Interest spreads and margins, however, are not only determined by bank characteristics
but also by the market structure. More competitive systems are expected to see more efficient
4
banks with lower spreads and margins. Competition, however, is not necessarily the same as
market structure (Claessens and Laeven, 2004). Demirguc-Kunt, Laeven and Levine (2004) find
no robust association of bank concentration with interest rate margins. The ownership structure
of the banking system might also be associated with differences in efficiency. Claessens,
Demirguc-Kunt and Huizinga (2001) find that countries with higher share of foreign banks
experience lower average margins, consistent with the hypothesis that foreign bank entry
imposes competitive pressure with resulting efficiency gains.2 All these studies, however, are
based on cross-country panels. This paper studies the effect of market concentration and foreign
bank entry for a low-income country’s banking system that has undergone profound changes in
its ownership and market structure.
Our results support the strong role that bank-specific characteristics play in variation of
interest spreads and margins. First, we find more cross-bank than cross-time variation in spreads
and margins. Second, and consistent with the first finding, bank-level variables are the
statistically and economically most significant group of variables in explaining variation in
spreads and margins. Specifically, banks with larger overhead costs, more exposure to
agriculture and less exposure to mining as well as domestically owned banks are associated with
higher spreads. Higher overhead costs are also associated with higher ex-post margins, while
banks with higher share of agricultural lending report lower margins. Larger banks charge lower
spreads, but earn higher margins. Although the Ugandan banking market has undergone
dramatic changes in its market structure, there does not seem a robust relationship between these
changes and variation of spreads or margins over time. Further, we find little evidence that
structural changes such as the privatization of UCB and the subsequent merger with Stanbic
2 Martinez Peria and Mody (2004) find an indirect effect of foreign bank entry on interest margins through lower overhead costs in Latin America, while Barajas, Steiner and Salazar (2000) find a positive effect of foreign bank entry on operational efficiency in Colombia.
5
resulted in significant changes in spreads or margins.3 Finally, using cross-sectional data for
2004, we find tentative evidence that banks with larger branch networks and smaller average
account sizes incur high overhead costs and charge higher spreads, consistent with the hypothesis
that at least part of the high margins is explained by outreach efforts. Overall, our findings
suggest a limited role for market structure in driving bank efficiency, which points to more
structural impediments to lower spreads and margins.
This paper makes several important contributions to the literature on interest spreads and
margins. First, we complement cross-country studies on the effect of foreign bank entry and
bank concentration with an in-depth country study.4 Second, unlike other papers, we study the
factors determining both ex-ante interest rate spreads and ex-post interest rate margins and can
thus compare these results. This comparison leads to interesting findings such that bank size is
positively associated with margins, but negatively with spreads. Third, we contribute to a small
literature on Sub-Saharan Africa financial systems. Most papers studying the efficiency and
market structure of banking systems, have limited data on Sub-Saharan Africa or focus on non-
African countries. Finally, we contribute to a small literature on the effect of financial market
structure and financial liberalization in Uganda (Birungi, 2005; Clarke, Cull and Fuchs, 2006;
Habyarimana, 2005; Hauner and Peiris, 2005; Cull, Haber and Imai, 2006).5
The remainder of this paper is organized as follows. Section 2 gives an overview of the
main developments in the Ugandan banking sector over the past 20 years. Section 3 discusses
3 While there is the possibility that this could reflect transitory patterns, this seems unlikely given that there is more cross-bank than cross-time variation in spread and thus high degree persistence in spreads and margins. 4 Demirguc-Kunt and Huzinga (1999) and Demirguc-Kunt, Laeven and Levine (2004) use large cross-country bank panels, while Martinez Peria and Mody (2004), Brock and Rojas-Suarez (2000) and Saunders and Schumacher (2000) study the factors behind interest margins in the Latin American region. There is a variety of country-level studies on the effect of financial liberalization on margins or spreads, among them, Chirwa and Mlachila (2004) who study the effect of financial liberalization on spreads in Malawi. 5 Only Birungi (2005) considers factors explaining interest rate spreads over the period 1999 to 2005. Unlike this paper, however, he does not have data available on key variables such as operating costs and profitability and his econometric methodology does not account for possible heterogeneity in the panel observations.
6
methodology and data. Section 4 presents the main results. Section 5 discusses robustness tests
and section 6 concludes and provides policy implications of our results.
2. Uganda’s Banking System over the Past 20 Years6
Uganda’s banking system was dominated by three foreign-owned banks (Barclays,
Grindlays, and Standard) until 1965 when the government decided to transform the Uganda
Credit and Savings Society (UCSS) into Uganda Commercial Bank (UCB) in order to expand
credit services to indigenous enterprises. UCB’s aggressive expansion, mostly based on political
rather than commercial grounds, was further fostered during the regime of Idi Amin in the 1970s
when foreign banks were forced to close their upcountry branches or sell them to UCB and all
government business was transferred from foreign banks to UCB. This process of
nationalization of the financial system was part of a larger policy package aiming at a directed
rather than regulated financial system and including interest rate controls and lending quota.
Financial liberalization starting in 1987 brought an influx of new foreign and domestic
banks, but also brought a deep banking crisis with it. Caprio et al (2005) report Uganda as
experiencing a systemic banking crisis from 1994 to 2003 due to lack of bank capital in the
system. 1998 and 1999 saw the closure of several small banks and in 1998 UCB was
recapitalized and privatized to a Malaysian investor. Subsequent insider transactions and
imprudent lending, however, caused deterioration of the bank’s loan portfolio and in 1999 Bank
of Uganda intervened and renationalized UCB. In 2001, the South African Stanbic acquired
80% of UCB’s shares, with the remaining 20% held by the government for UCB employees. As
part of the sales agreement, Stanbic has maintained almost completely the branch network, even
6 For more detail, see Clarke, Cull and Fuchs (2006) and Kasakende (2001).
7
in more remote rural areas and has recently expanded lending after a credit crunch (Clarke, Cull
and Fuchs, 2006).
Following the crisis in the late 1990s, the Ugandan authorities have significantly
strengthened bank regulation and supervision, tightening loan classification and provisioning
standards. The closure of Cooperative Bank, Greenland Bank, ICB and Trust Bank in 1998 and
99, the UCB privatization, the introduction of a risk- based approach in the banking supervision
as well as reforms in the regulatory environment have made the Ugandan banking sector less
fragile, resulting in falling loan loss provisions.
Uganda’s banking system is small, both in absolute terms as in relation to its GDP, as we
illustrate using private sector lending. With $200 million of liquid liabilities, Uganda’s banking
system is smaller than many mid-sized banks in developed economies (Figure 1). With Private
Credit to GDP at 5% in 2004, Uganda is significantly below the average for low-income and
Sub-Saharan African countries and neighboring Kenya and Tanzania (Table 1). Further, Uganda
has a very low loan-deposit ratio, suggesting that the limited resource mobilization by the
banking system is accompanied by even more limited intermediation into private sector loans.
On the other hand, and as reported above, interest margins in Uganda are significantly higher
than in other countries, even than in the average low-income and the average Sub-Saharan
African country.
While Uganda’s banking system is small, it has always had a relatively large number of
banks, even before financial liberalization. As of 2004, there were 15 banks, 12 of them foreign-
owned and the remainder owned by domestic private shareholders. During the sample period of
our empirical analysis, the Ugandan banking system has undergone quite dramatic changes in its
market structure. Take first concentration, as measured by the Herfindahl indices for deposits
8
and loans. While the deposit market has become more concentrated mostly due to the UCB
privatization, there has been no significant change in concentration in the lending market over
the past six years (Figure 2).7 8 Market concentration in Uganda is higher than in the Kenyan and
Tanzanian banking sector as measured by the Herfindahl index in deposits and loans (Cihak and
Podpiera, 2005).9 Further, the Ugandan banking market has experienced a significant increase in
foreign ownership over the past years (Figure 3). While the increase in foreign banks’ market
share in deposits has been mostly due to the privatization of UCB to Stanbic, the increase in
foreign banks’ market share in the lending market has been independent of this event.
While the formal financial system in Uganda contains not only commercial banks (Tier
1), but also bank-like institutions (Tier 2) and since 2004 microfinance deposit-taking institutions
(Tier 3), banks are still the dominating part of the financial system, at least in terms of
intermediated funds. Further, Tier 2 institutions are specialized financial institutions whose
spreads and margins might not be comparable to banks. We will therefore focus on Tier 1 banks
in our empirical analysis.
3. Methodology and Data
We utilize a panel of commercial banks’ interest spreads and margins that allows us to
formally investigate which bank- specific, industry and macroeconomic characteristics are the
main drivers for the persistently high spreads and margins observed in Uganda. Following Ho
7 UCB had to a very large market share in the deposit market but its share in the lending segment was comparatively small so the UCB privatization did not lead to an increase in lending concentration. 8 The Herfindahl index is the sum of squared market shares and varies between zero and 10,000 with higher values indicating more concentrated banking systems. 9 According to Cihak and Podpiera (2005), the Herfindahl indices in loans were 1045 for Kenya, 1169 for Tanzania and 1597 for Uganda in June 2002.
9
and Saunders (1981) and other authors, we estimate a general class of regressions for the spreads
of the form
titttiti MIBSpread ,,, εδγβα ++++=
where i indexes bank i and t indexes time t; tiB , is a vector of bank-specific variables for
bank i and time t such as overhead costs or bank profitability; tI contains time- varying,
industry- specific variables such as measures of concentration and ownership structure in the
banking sector; tM is a vector of time-varying macroeconomic variables, such as real GDP
growth, real T-Bill rate, inflation and nominal exchange rate deprecation; and ti,ε is the residual.
Finally, we control for year and seasonal effects by including yearly dummy variables and
dummy variables for each quarter. The margin specifications are the same as in the above spread
equation. We will estimate the margin and spread equations with both pooled OLS and fixed
effects regressions. In the latter, we control for time-invariant bank-specific effects. 10 For both
the OLS and fixed effects regressions, we will allow for clustered standard errors across
observations of the same bank, i.e. will relax the condition that error terms of observations of the
same bank are independent of each other. Also, in the case of fixed effects regressions, the
coefficients on the dummy variables are approximately the average margin or spread of the
individual banks over the sample period.11 Given the dispersion of data and to control for the
potential effect of outliers, we will use alternative econometric techniques in our robustness
analysis. Specifically, we will use median least square regressions and robust regressions that
both control for the effect of outliers.
10 The problem with pooled OLS is that it is inconsistent if E(xη) ≠ 0, and even if E(xη)=0, it is inefficient because of serial correlation in the error terms ε =η+ v where η captures the unobserved heterogeneity among the observations (i.e. bank-specific effects), v is the error term with the classical standard assumptions and x= (α, B, I, M). 11 The coefficients on the bank dummy variables will not be the exact average margin or spread of the individual banks since other explanatory variables are included into the models.
10
While spreads are the difference between ex-ante contracted loan and deposit interest
rates, margins are the actually received interest (and non-interest) revenue on loans minus the
interest costs on deposits (minus non-interest charges on deposits). The main difference between
spreads and margins are lost interest revenue on non-performing loans, so that spreads are
normally higher than margins. We compute the spread between the weighted average lending
rate and the weighted average deposit rate for each bank and each quarter, where the weights are
the relative amounts of deposits or loans contracted at specific interest rates in the respective
quarter and by the respective bank. While the interest and loan/deposit amount data are available
on a monthly frequency, we average them at quarterly frequency to make them comparable to
financial statement data.
In the academic literature, many definitions for margins exist, and in the following we
will make usage of two commonly used margin expressions. Firstly, we define the variable
margin as the difference between total interest income and expenses over total earning assets.12
Secondly, wide margin is defined as the difference between interest and commission received
over loans and interest paid minus fees over deposits. The latter definition adds interest and fee
charges and can therefore be seen as a more complete measure of the interest rate margin.13
We have bank balance sheet data from the Bank of Uganda for interest margins and
spreads for the period between the second quarter of 1999 and the second quarter of 2005. We
note that this sample period omits the banking crisis in 1998 when four banks were closed.
Further, we do not have spread data for UCB before its privatization; since we are aiming for a
12 Total earnings assets comprise Bank of Uganda bills, dues from commercial banks, other banking institutions and non- banking institutions in and outside Uganda, securities, financing schemes, loans, overdrafts, discounts, administered advances and investments. Total earnings assets do not include cash assets or fixed assets amongst others. 13 See Brock and Rojas- Suarez (2000) as well as Chirwa and Mlachila (2004) for a discussion of different margin definitions
11
consistent sample across the two dependent variables, UCB is thus not included in the sample
before its privatization. In robustness tests for the margin regressions, however, we test the
sensitivity of our findings to this omission. The average interest spread in our sample is
18.1%, while the average wide margin (margin) is 10.9% (9.7%). The variation of spreads and
margins across banks is about three times as large as the variation over time.
Both loan-weighted interest margins and spreads have shown an upward trend over the
past years (Figure 4), although there are sub-periods with no or even a negative trend.14
Regressions of both interest margins and interest rate spreads – averaged across banks and
weighted by the market share of each bank in the loan market - on a time trend yield significantly
positive coefficients. This positive trend is confirmed even when we control for inflation. We
also notice that the margin defined as net interest revenue follows closely the wide margin that
include fees and commissions, although the gap has somewhat opened over the past few quarters,
consistent with claims that banks have substituted interest rate charges with non-interest charges.
We use several bank-specific variables computed from balance sheet and income
statements to explain variation in interest margins and spreads. Table 2 provides summary
statistics and correlations for the employed variables. Overhead costs are the costs for salaries,
motor vehicles, fixed assets etc (depreciation excluded) over total assets and average 7.7% across
banks and over time. Overhead costs for the sector have shown an increasing trend over the
period 1999 to 2005. Banks’ recent investments in physical infrastructure such as increased
outreach efforts and very high costs for power and telecommunication might explain the recent
increase in operating costs; we will explore this issue in more detail below. Return on Assets
(ROA) is defined as profits over total assets and averages 1.9% across banks and over time.
14 While we do not weight the observations in the regressions, we show the weighted interest spreads and margins in Figure 4 as to show the average spread and margin faced by customers.
12
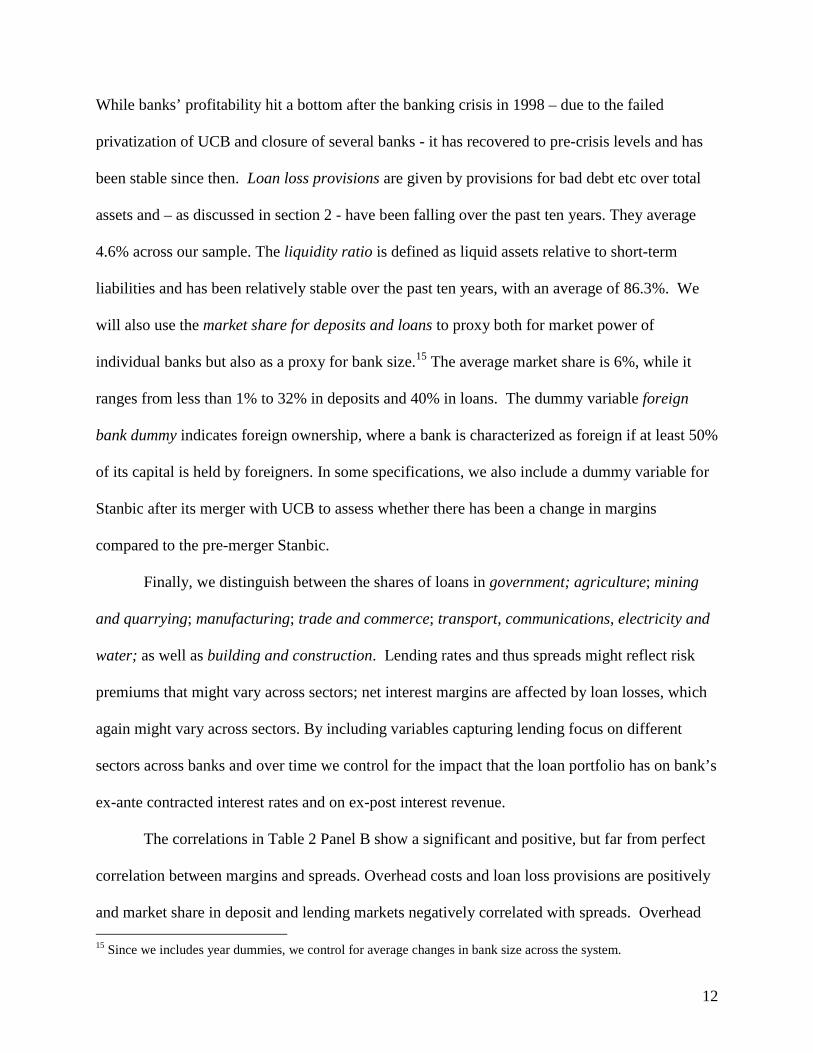
While banks’ profitability hit a bottom after the banking crisis in 1998 – due to the failed
privatization of UCB and closure of several banks - it has recovered to pre-crisis levels and has
been stable since then. Loan loss provisions are given by provisions for bad debt etc over total
assets and – as discussed in section 2 - have been falling over the past ten years. They average
4.6% across our sample. The liquidity ratio is defined as liquid assets relative to short-term
liabilities and has been relatively stable over the past ten years, with an average of 86.3%. We
will also use the market share for deposits and loans to proxy both for market power of
individual banks but also as a proxy for bank size.15 The average market share is 6%, while it
ranges from less than 1% to 32% in deposits and 40% in loans. The dummy variable foreign
bank dummy indicates foreign ownership, where a bank is characterized as foreign if at least 50%
of its capital is held by foreigners. In some specifications, we also include a dummy variable for
Stanbic after its merger with UCB to assess whether there has been a change in margins
compared to the pre-merger Stanbic.
Finally, we distinguish between the shares of loans in government; agriculture; mining
and quarrying; manufacturing; trade and commerce; transport, communications, electricity and
water; as well as building and construction. Lending rates and thus spreads might reflect risk
premiums that might vary across sectors; net interest margins are affected by loan losses, which
again might vary across sectors. By including variables capturing lending focus on different
sectors across banks and over time we control for the impact that the loan portfolio has on bank’s
ex-ante contracted interest rates and on ex-post interest revenue.
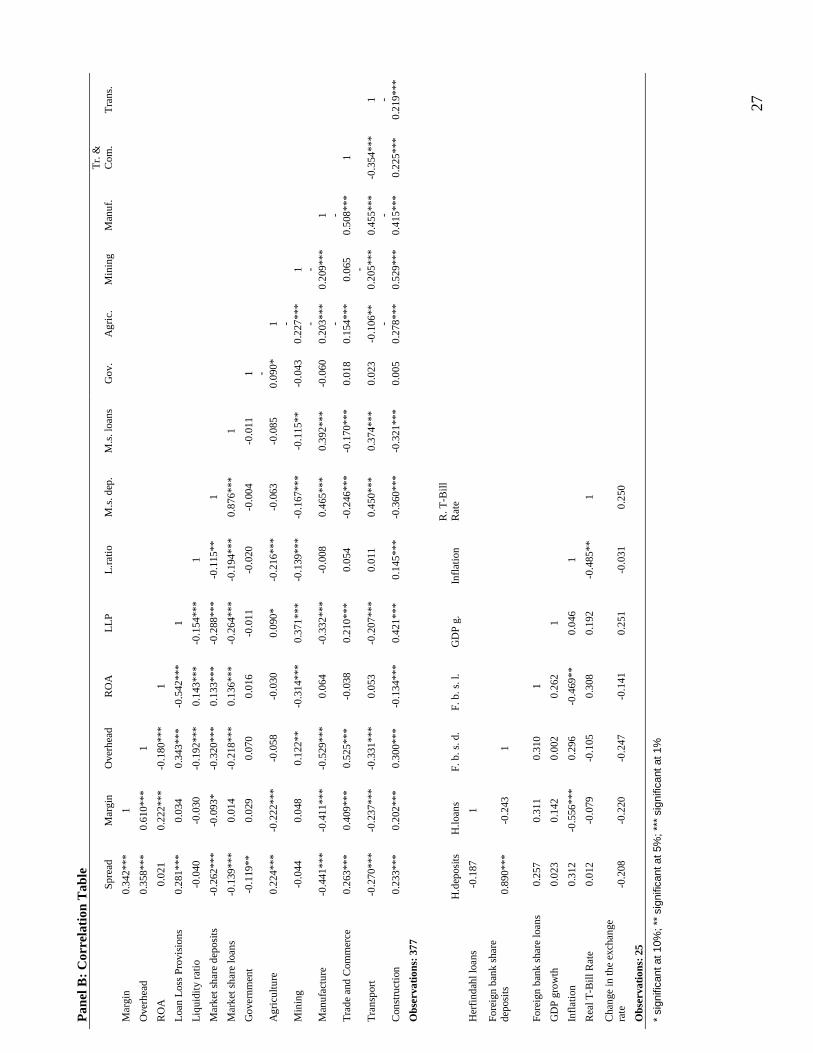
The correlations in Table 2 Panel B show a significant and positive, but far from perfect
correlation between margins and spreads. Overhead costs and loan loss provisions are positively
and market share in deposit and lending markets negatively correlated with spreads. Overhead 15 Since we includes year dummies, we control for average changes in bank size across the system.
13
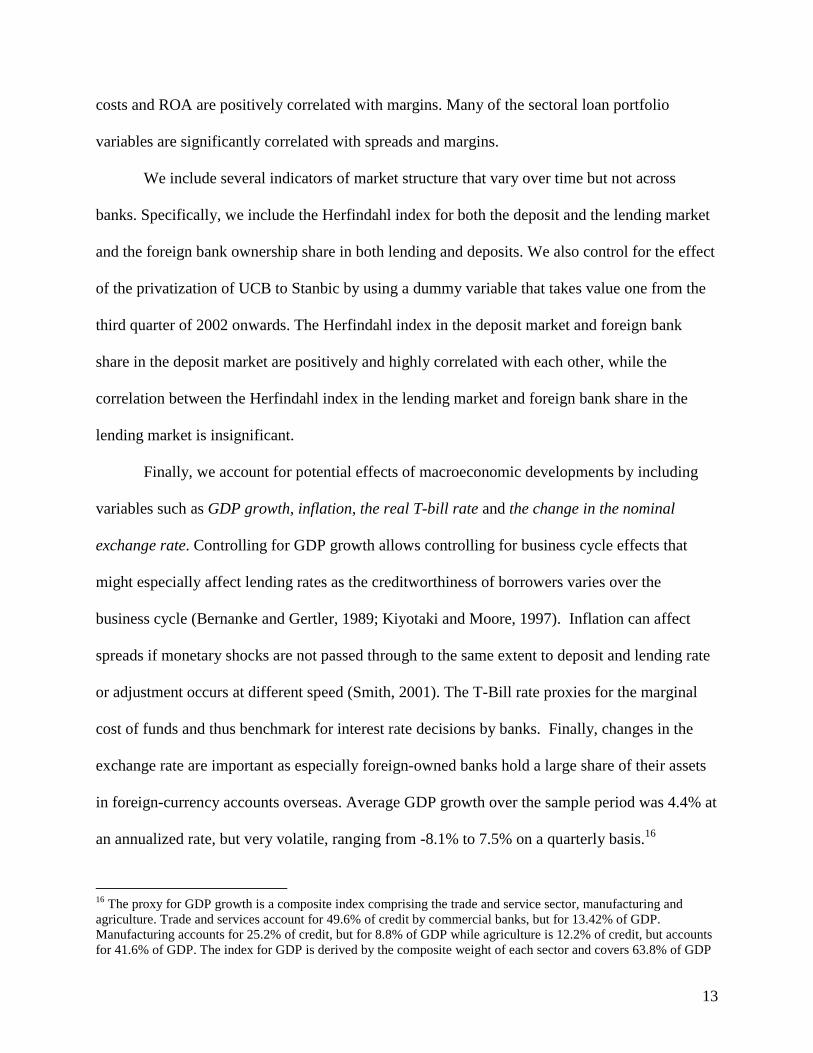
costs and ROA are positively correlated with margins. Many of the sectoral loan portfolio
variables are significantly correlated with spreads and margins.
We include several indicators of market structure that vary over time but not across
banks. Specifically, we include the Herfindahl index for both the deposit and the lending market
and the foreign bank ownership share in both lending and deposits. We also control for the effect
of the privatization of UCB to Stanbic by using a dummy variable that takes value one from the
third quarter of 2002 onwards. The Herfindahl index in the deposit market and foreign bank
share in the deposit market are positively and highly correlated with each other, while the
correlation between the Herfindahl index in the lending market and foreign bank share in the
lending market is insignificant.
Finally, we account for potential effects of macroeconomic developments by including
variables such as GDP growth, inflation, the real T-bill rate and the change in the nominal
exchange rate. Controlling for GDP growth allows controlling for business cycle effects that
might especially affect lending rates as the creditworthiness of borrowers varies over the
business cycle (Bernanke and Gertler, 1989; Kiyotaki and Moore, 1997). Inflation can affect
spreads if monetary shocks are not passed through to the same extent to deposit and lending rate
or adjustment occurs at different speed (Smith, 2001). The T-Bill rate proxies for the marginal
cost of funds and thus benchmark for interest rate decisions by banks. Finally, changes in the
exchange rate are important as especially foreign-owned banks hold a large share of their assets
in foreign-currency accounts overseas. Average GDP growth over the sample period was 4.4% at
an annualized rate, but very volatile, ranging from -8.1% to 7.5% on a quarterly basis.16
16 The proxy for GDP growth is a composite index comprising the trade and service sector, manufacturing and agriculture. Trade and services account for 49.6% of credit by commercial banks, but for 13.42% of GDP. Manufacturing accounts for 25.2% of credit, but for 8.8% of GDP while agriculture is 12.2% of credit, but accounts for 41.6% of GDP. The index for GDP is derived by the composite weight of each sector and covers 63.8% of GDP
14
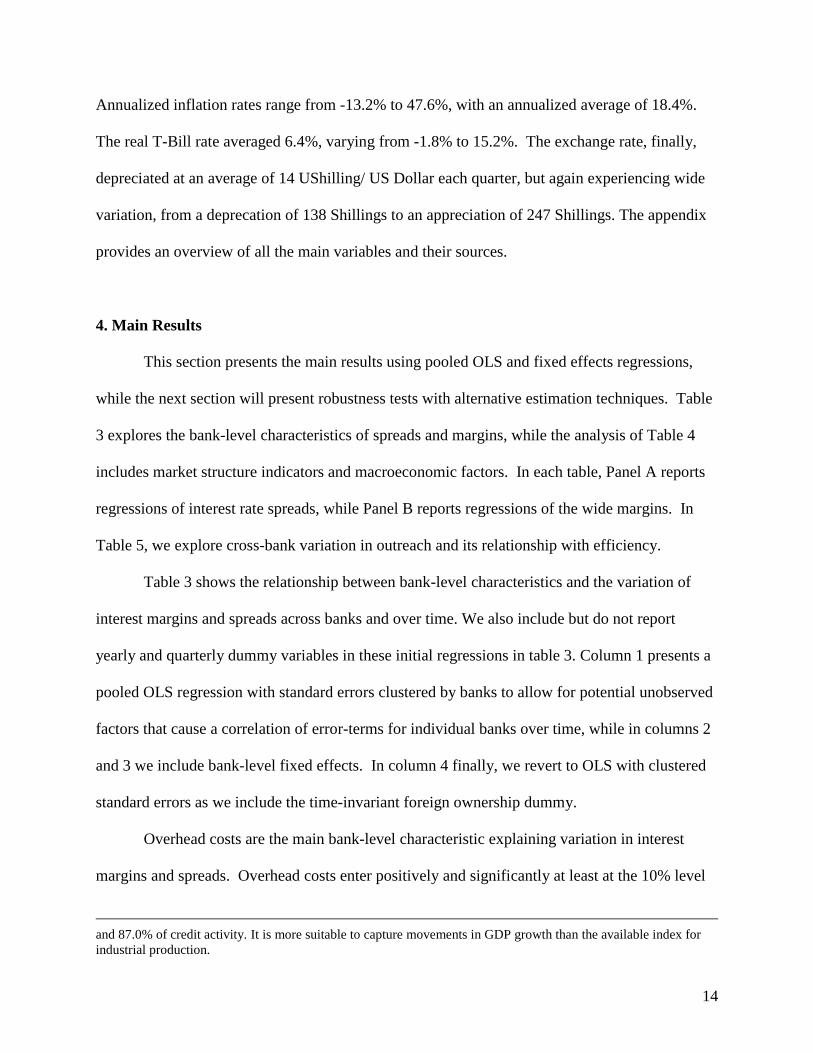
Annualized inflation rates range from -13.2% to 47.6%, with an annualized average of 18.4%.
The real T-Bill rate averaged 6.4%, varying from -1.8% to 15.2%. The exchange rate, finally,
depreciated at an average of 14 UShilling/ US Dollar each quarter, but again experiencing wide
variation, from a deprecation of 138 Shillings to an appreciation of 247 Shillings. The appendix
provides an overview of all the main variables and their sources.
4. Main Results
This section presents the main results using pooled OLS and fixed effects regressions,
while the next section will present robustness tests with alternative estimation techniques. Table
3 explores the bank-level characteristics of spreads and margins, while the analysis of Table 4
includes market structure indicators and macroeconomic factors. In each table, Panel A reports
regressions of interest rate spreads, while Panel B reports regressions of the wide margins. In
Table 5, we explore cross-bank variation in outreach and its relationship with efficiency.
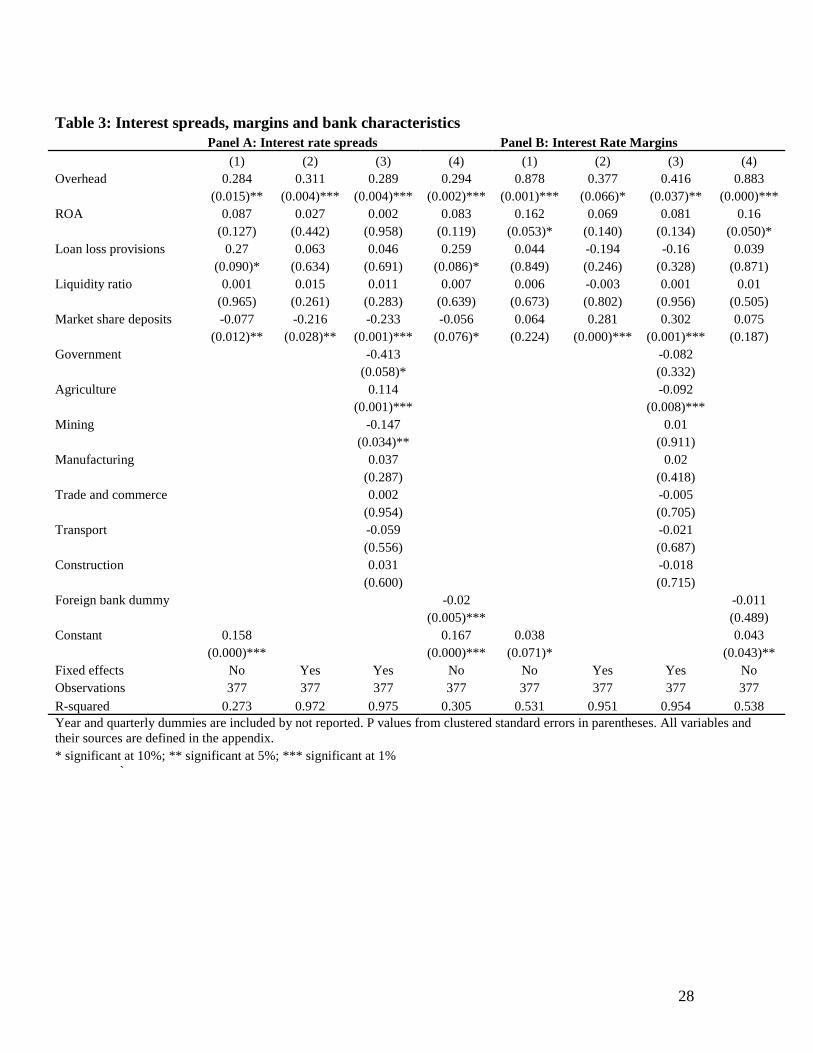
Table 3 shows the relationship between bank-level characteristics and the variation of
interest margins and spreads across banks and over time. We also include but do not report
yearly and quarterly dummy variables in these initial regressions in table 3. Column 1 presents a
pooled OLS regression with standard errors clustered by banks to allow for potential unobserved
factors that cause a correlation of error-terms for individual banks over time, while in columns 2
and 3 we include bank-level fixed effects. In column 4 finally, we revert to OLS with clustered
standard errors as we include the time-invariant foreign ownership dummy.
Overhead costs are the main bank-level characteristic explaining variation in interest
margins and spreads. Overhead costs enter positively and significantly at least at the 10% level
and 87.0% of credit activity. It is more suitable to capture movements in GDP growth than the available index for industrial production.
15
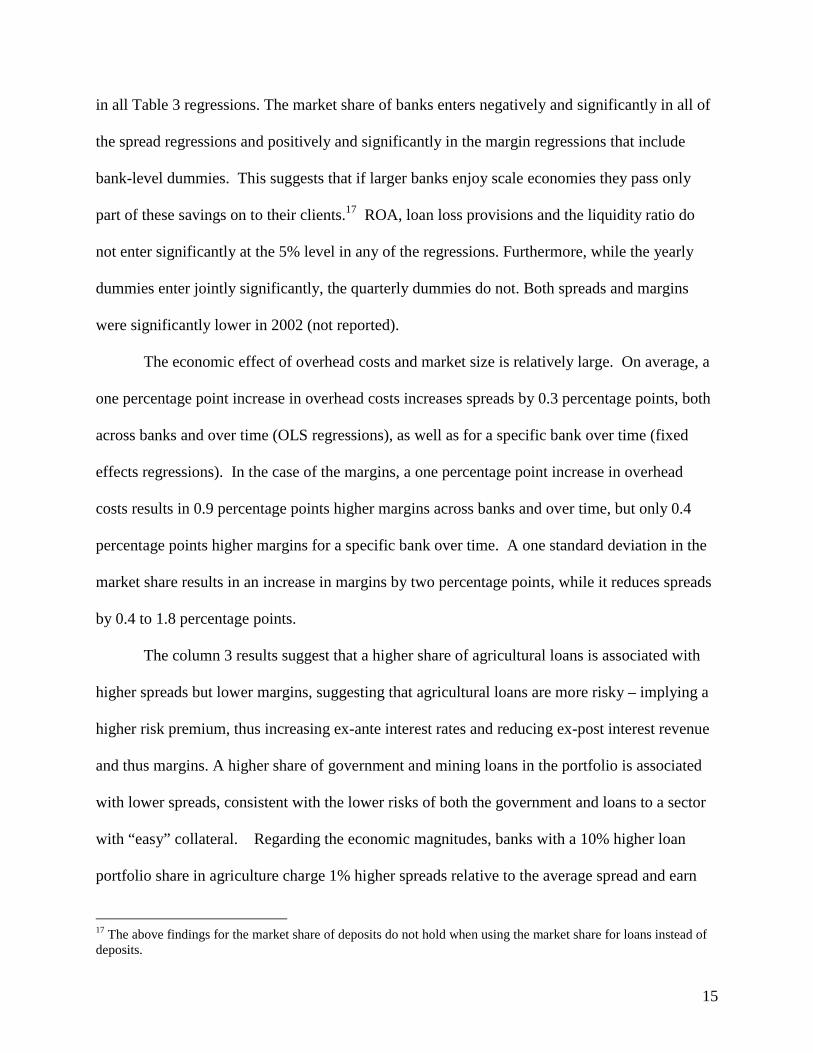
in all Table 3 regressions. The market share of banks enters negatively and significantly in all of
the spread regressions and positively and significantly in the margin regressions that include
bank-level dummies. This suggests that if larger banks enjoy scale economies they pass only
part of these savings on to their clients.17 ROA, loan loss provisions and the liquidity ratio do
not enter significantly at the 5% level in any of the regressions. Furthermore, while the yearly
dummies enter jointly significantly, the quarterly dummies do not. Both spreads and margins
were significantly lower in 2002 (not reported).
The economic effect of overhead costs and market size is relatively large. On average, a
one percentage point increase in overhead costs increases spreads by 0.3 percentage points, both
across banks and over time (OLS regressions), as well as for a specific bank over time (fixed
effects regressions). In the case of the margins, a one percentage point increase in overhead
costs results in 0.9 percentage points higher margins across banks and over time, but only 0.4
percentage points higher margins for a specific bank over time. A one standard deviation in the
market share results in an increase in margins by two percentage points, while it reduces spreads
by 0.4 to 1.8 percentage points.
The column 3 results suggest that a higher share of agricultural loans is associated with
higher spreads but lower margins, suggesting that agricultural loans are more risky – implying a
higher risk premium, thus increasing ex-ante interest rates and reducing ex-post interest revenue
and thus margins. A higher share of government and mining loans in the portfolio is associated
with lower spreads, consistent with the lower risks of both the government and loans to a sector
with “easy” collateral. Regarding the economic magnitudes, banks with a 10% higher loan
portfolio share in agriculture charge 1% higher spreads relative to the average spread and earn
17 The above findings for the market share of deposits do not hold when using the market share for loans instead of deposits.
16
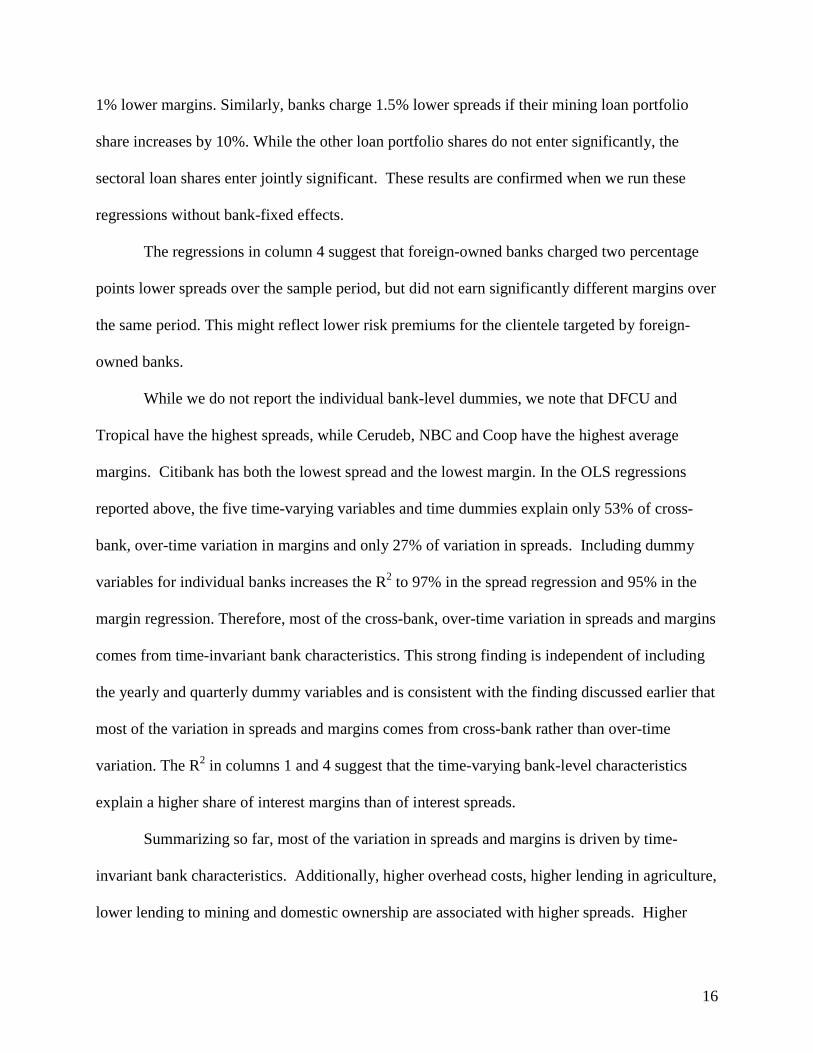
1% lower margins. Similarly, banks charge 1.5% lower spreads if their mining loan portfolio
share increases by 10%. While the other loan portfolio shares do not enter significantly, the
sectoral loan shares enter jointly significant. These results are confirmed when we run these
regressions without bank-fixed effects.
The regressions in column 4 suggest that foreign-owned banks charged two percentage
points lower spreads over the sample period, but did not earn significantly different margins over
the same period. This might reflect lower risk premiums for the clientele targeted by foreign-
owned banks.
While we do not report the individual bank-level dummies, we note that DFCU and
Tropical have the highest spreads, while Cerudeb, NBC and Coop have the highest average
margins. Citibank has both the lowest spread and the lowest margin. In the OLS regressions
reported above, the five time-varying variables and time dummies explain only 53% of cross-
bank, over-time variation in margins and only 27% of variation in spreads. Including dummy
variables for individual banks increases the R2 to 97% in the spread regression and 95% in the
margin regression. Therefore, most of the cross-bank, over-time variation in spreads and margins
comes from time-invariant bank characteristics. This strong finding is independent of including
the yearly and quarterly dummy variables and is consistent with the finding discussed earlier that
most of the variation in spreads and margins comes from cross-bank rather than over-time
variation. The R2 in columns 1 and 4 suggest that the time-varying bank-level characteristics
explain a higher share of interest margins than of interest spreads.
Summarizing so far, most of the variation in spreads and margins is driven by time-
invariant bank characteristics. Additionally, higher overhead costs, higher lending in agriculture,
lower lending to mining and domestic ownership are associated with higher spreads. Higher

17
overhead costs are also associated with higher margins, while more agricultural lending is
associated with lower margins. There is evidence that larger banks charge lower spreads and earn
higher margins.
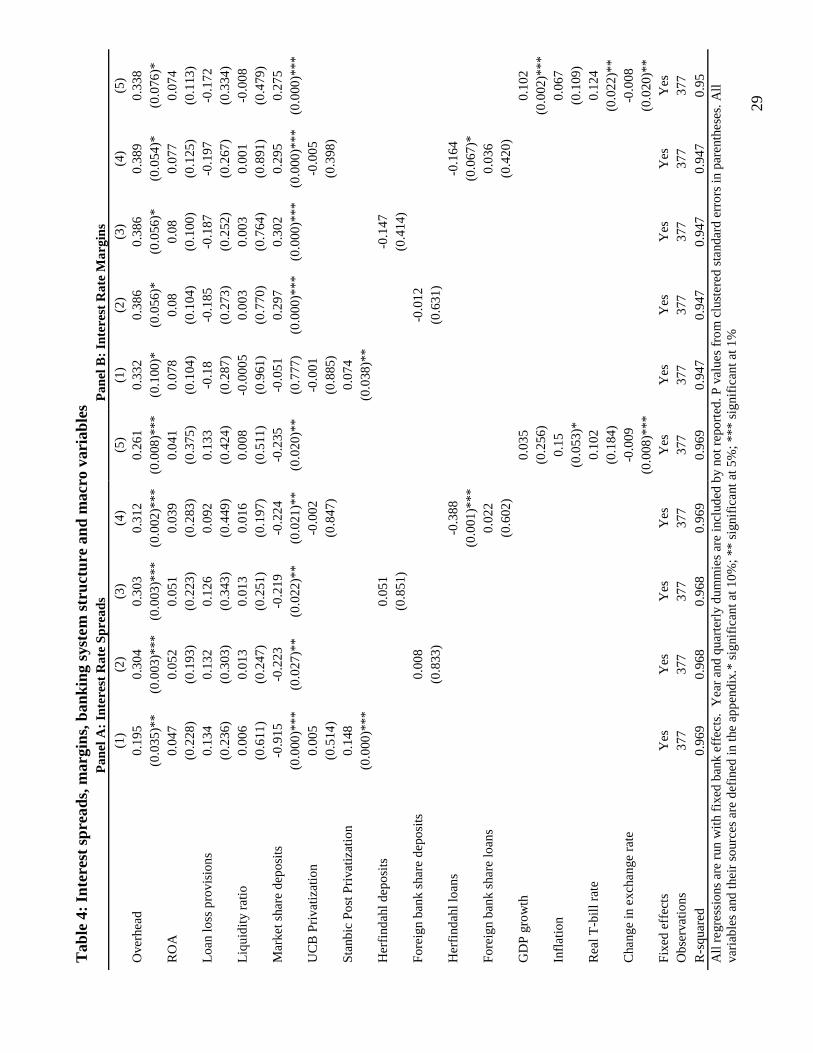
In Table 4, we include market structure and macroeconomic characteristics and run all
regressions with fixed effects. OLS regressions give very similar findings when we include the
foreign bank dummy. Again, we employ clustered standard errors but leave out the yearly and
quarterly dummy variables because of multicollinearity issues.
The privatization of UCB to Stanbic and the resulting increase in market concentration
and foreign ownership in the deposit market have not resulted in changes in spreads and margins
across the banking system, while they have increased spreads and margins for Stanbic. A
dummy variable that takes on value one for Stanbic after the privatization in 2002 is positive and
significant in both spread and margin regressions (column 1), suggesting that Stanbic charged
higher spreads after the merger with UCB and earned higher margins, most likely due to the
riskier loan portfolio it inherited from UCB.18 A dummy variable that takes on value one for all
banks after the second quarter of 2002 when the UCB privatization was completed enters
insignificantly in both the spread and margin regressions (column 1). Similarly, the foreign
market share in deposits (column 2) and the Herfindahl index in the deposit market (column 3)
are insignificant. We note that we do not include the three variables simultaneously as they are
highly correlated with each with correlation coefficients of at least 89%.
Changes in the share of foreign-owned banks in the lending market have resulted in no
significant changes in margins or spreads. In column 4, we include both the foreign market share
in loans and the Herfindahl index in the loan market, as they are not highly correlated with each
other. There is some evidence that a higher loan market concentration has led to lower spreads 18 If we include UCB in the margin regressions, the post-privatization Stanbic variable is insignificant.

18
and lower margins. But its economic effect on spreads is relatively small. A one standard
deviation increase leads to less 0.7 percentage point lower spreads and 0.3 percentage points
lower margins, or 15% of the standard deviation of spreads and 6% of the standard deviation of
margins.
Next, we extend the model specification with four key macroeconomic variables.
Specifically, we include the inflation rate, as measured by the CPI, the 91- days Treasury bill rate
deflated by inflation, the change in the exchange rate to the dollar as well as a proxy for GDP
growth. The results in column 4 indicate that the exchange rate enters negatively and
significantly in the spread regressions, suggesting a widening spread in times of an appreciating
Shilling. Also, higher inflation leads to an increase in the nominal spreads. Margins are higher in
quarters with higher GDP growth, inflation-adjusted T-Bill rates and an appreciating Shilling.
The negative effect of the change in the exchange rate is surprising since the variable
captures expectations of exchange risk, for which we would expect a positive sign. As alternative
measures for exchange rate risk, we used the quarterly standard deviation over the previous 3, 6
and 12 months, respectively. These three measures are all positively influencing the spread
whereas only the 12-month standard deviation is significant in the margin specification,
suggesting that exchange rate volatility results in higher spreads.
But overall the economic effects of the macroeconomic characteristics on the spreads and
margins are small so this does not change our main findings that bank characteristics such as
overhead costs, market share, foreign ownership and loan portfolio composition are the driving
factors of spreads and margins. Take the example of exchange rate depreciation. One standard
deviation in exchange rate changes results in 0.6 percentage points lower spreads and margins.
Similarly, one standard deviation in GDP growth results in 0.4 percentage point higher margins.
19
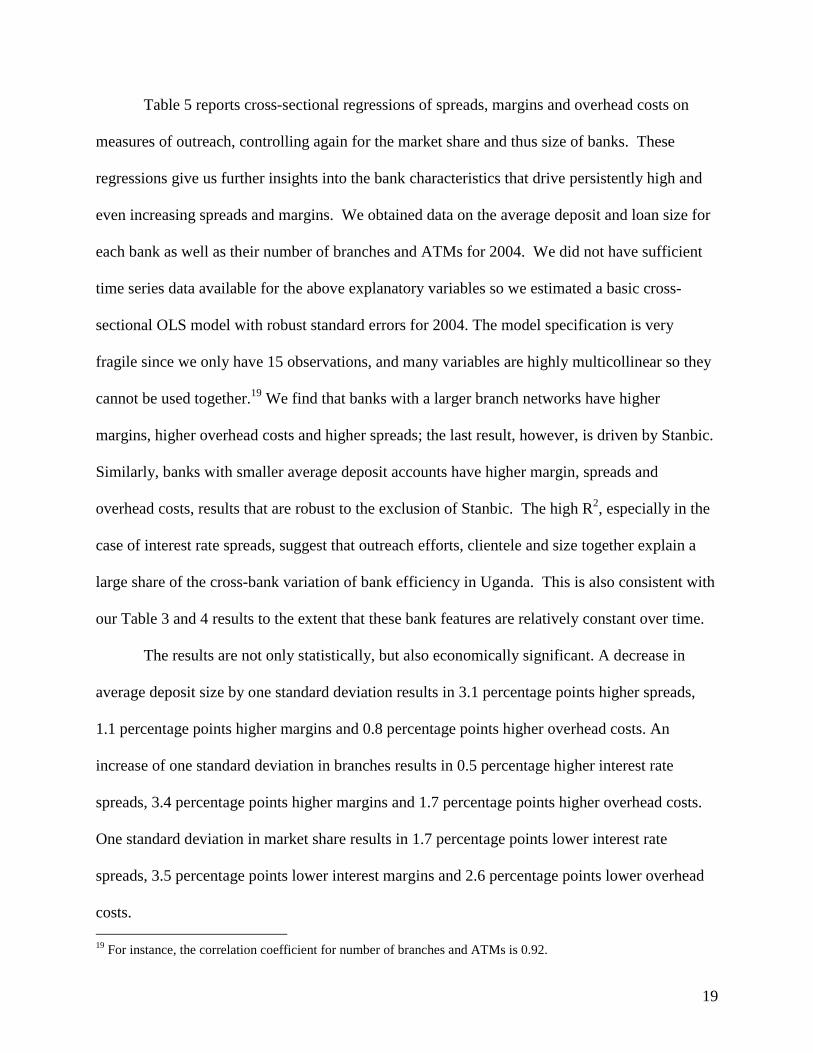
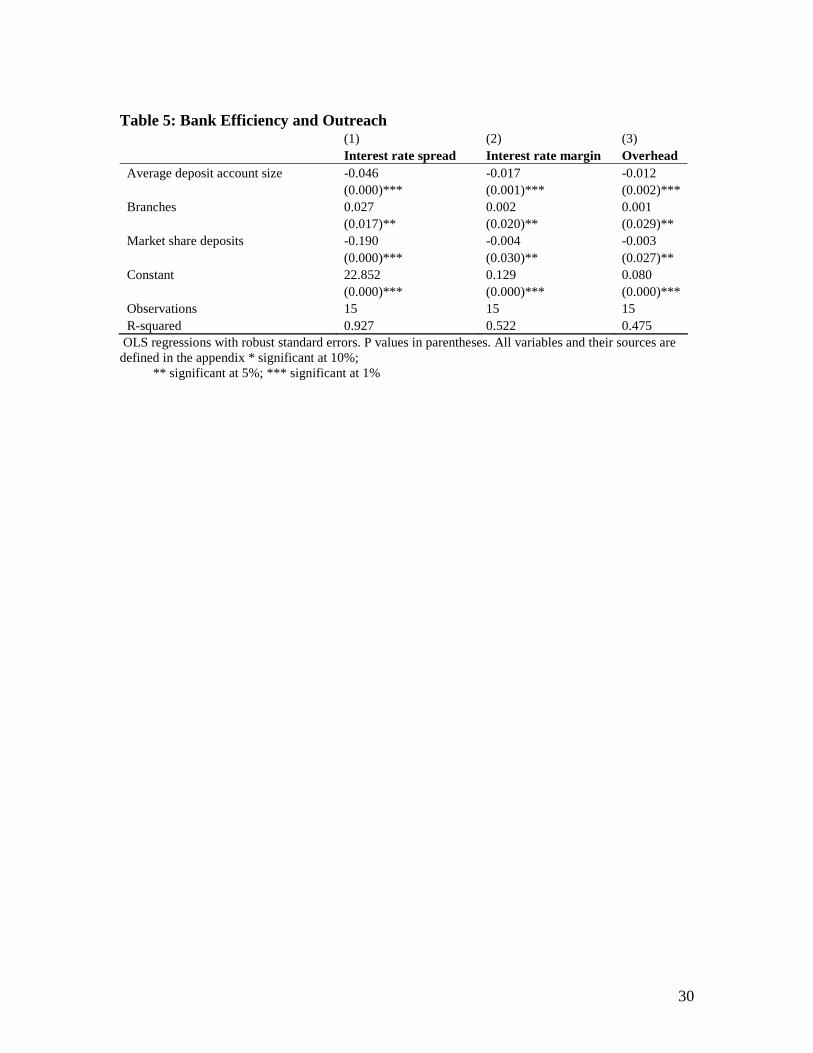
Table 5 reports cross-sectional regressions of spreads, margins and overhead costs on
measures of outreach, controlling again for the market share and thus size of banks. These
regressions give us further insights into the bank characteristics that drive persistently high and
even increasing spreads and margins. We obtained data on the average deposit and loan size for
each bank as well as their number of branches and ATMs for 2004. We did not have sufficient
time series data available for the above explanatory variables so we estimated a basic cross-
sectional OLS model with robust standard errors for 2004. The model specification is very
fragile since we only have 15 observations, and many variables are highly multicollinear so they
cannot be used together.19 We find that banks with a larger branch networks have higher
margins, higher overhead costs and higher spreads; the last result, however, is driven by Stanbic.
Similarly, banks with smaller average deposit accounts have higher margin, spreads and
overhead costs, results that are robust to the exclusion of Stanbic. The high R2, especially in the
case of interest rate spreads, suggest that outreach efforts, clientele and size together explain a
large share of the cross-bank variation of bank efficiency in Uganda. This is also consistent with
our Table 3 and 4 results to the extent that these bank features are relatively constant over time.
The results are not only statistically, but also economically significant. A decrease in
average deposit size by one standard deviation results in 3.1 percentage points higher spreads,
1.1 percentage points higher margins and 0.8 percentage points higher overhead costs. An
increase of one standard deviation in branches results in 0.5 percentage higher interest rate
spreads, 3.4 percentage points higher margins and 1.7 percentage points higher overhead costs.
One standard deviation in market share results in 1.7 percentage points lower interest rate
spreads, 3.5 percentage points lower interest margins and 2.6 percentage points lower overhead
costs. 19 For instance, the correlation coefficient for number of branches and ATMs is 0.92.

20
Together, these results suggest that part of the high overhead and consequent high net
interest margin and spreads in the Ugandan banking system might be driven by efforts to
increase outreach. Larger banks, i.e. banks with a higher market share in the deposit market, have
lower spreads, margins and overhead costs, signaling scale economies.
5. Robustness Tests
In this section, we briefly analyze whether the reported findings from above are robust to
different estimation methods and also to the alternative narrow margin definition that does not
include interest rate fees and charges.
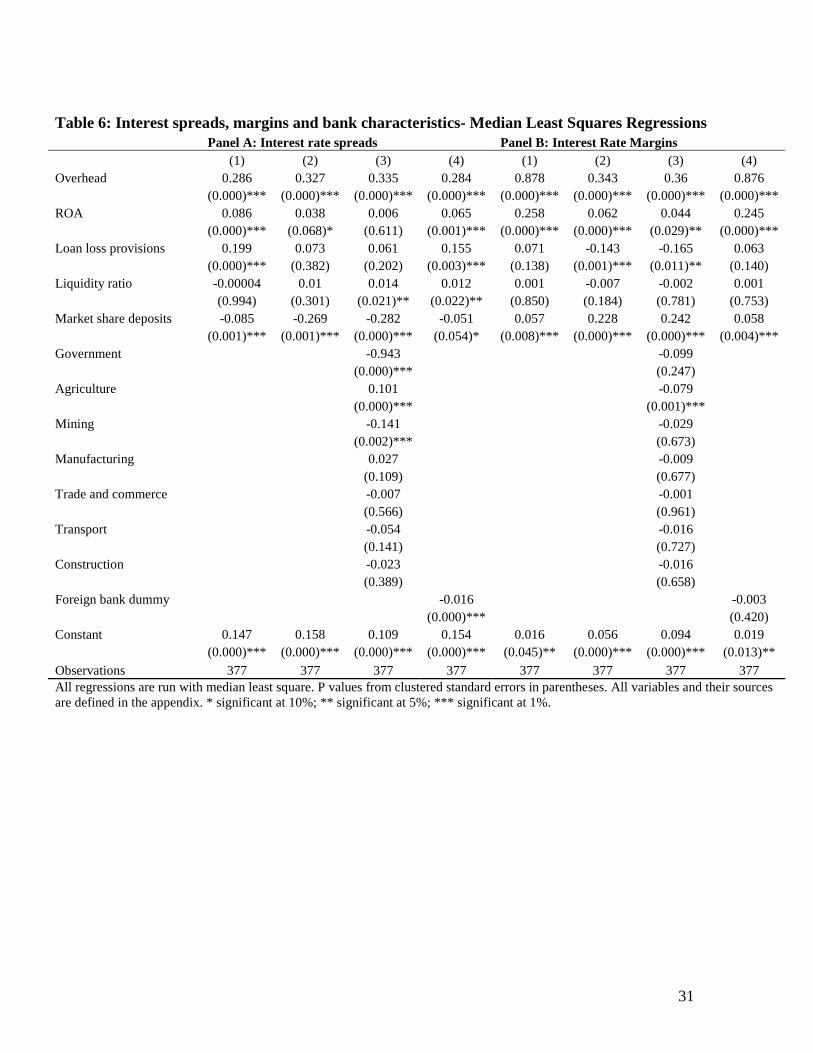
We use two alternative estimation techniques to control for the impact of outliers.
Firstly, the median least squares regressor minimizes the median square of residuals rather than
the average and thus reduces the effect of outliers (Clarke, Cull and Fuchs, 2006). A look at
Table 2 confirms that the median and mean differ quite a lot for many variables. Secondly, the
robust estimation technique uses all observations available, but assigns different weights to avoid
the impact of outliers. Specifically, through an iterative process, observations are weighted based
on the absolute value of their residuals, with observations with large residuals being assigned
smaller weights (Cull, Matesova and Shirley, 2002; Beck, Cull and Jerome, 2005).
Table 6 and 7 report the results for the median least square and robust regressions that
only include bank characteristics as potential determinants of the spreads and margins. Overall,
the previous main findings hold that spreads and margins are positively correlated with overhead
costs; spreads decrease with bank size, a higher loan portfolio share in mining and lower share in
agriculture and foreign-owned banks; similarly, margins increase with bank size and lower
agriculture loan portfolio share. Further, unlike in Table 3, ROA is positive and significant in

21
most regressions, suggesting that more profitable firms also charge higher spreads and earn
higher margins. However, we also acknowledge the possibility of reverse causation, that is,
banks that charge higher spreads and/ or earn higher margins, could be more profitable. But all
our results are the same even if we exclude the ROA variable so the possibility of reverse
causation does not change any of our conclusions.
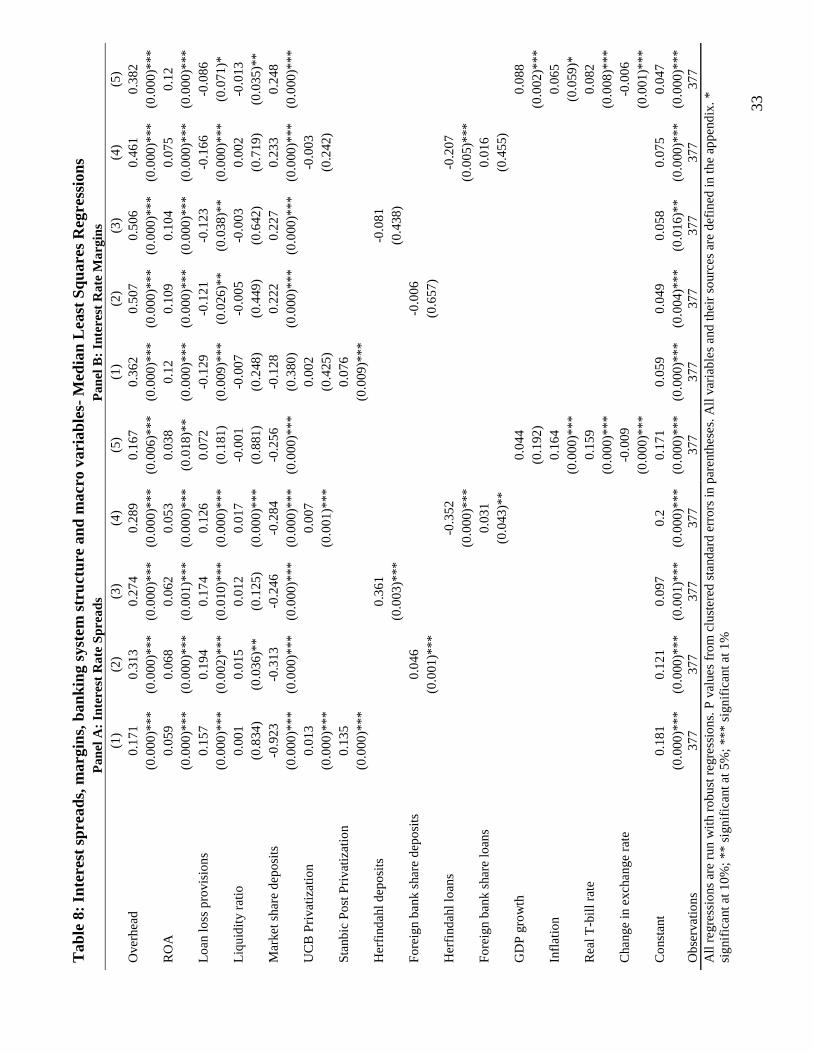
In addition, table 8 and 9 provide the findings for the robustness estimations that contain
both the industry and macroeconomic control variables. As above, in both the median least
squares and robust regressions the Herfindahl index for the loan market is significantly
influencing the spread but the economic effect is negligible. Even though the UCB privatization
dummy and foreign share in deposits are significant in some model specifications, they are not
consistently significant across both the median least squares and robust regressions. We also
obtain some evidence that the findings for the macroeconomic variables are robust to the
alternative estimation methods.
We also estimate all the margin specifications with the narrow margin definition.20 The
results are consistent with the wide margin estimations; that is, overhead costs are the key driver,
larger firms tend to have higher margins, firms with a higher agricultural share earn lower
margins. The findings from the macroeconomic characteristics are also consistent with the
regressions of the wide margin.
6. Conclusions
This paper analyzed the bank-level, banking system and macroeconomic factors
explaining cross-bank, cross-time variation in interest rate margins and spreads for the Ugandan
banking system over the period 1999 to 2005. We find that most of the variation of spreads and 20 Results available on request.
22
margins is driven by bank-level characteristics, mostly constant over time. Further, variation in
overhead costs, size and the composition of the loan portfolio explain variation in spreads and
margins across banks and over time. Foreign banks charge lower spreads but do not earn lower
margins. Changes in market structure and macroeconomic conditions, on the other hand, have
limited explanatory power. Most importantly, the privatization of UCB to Stanbic and the
resulting increase in foreign bank ownership has so far not resulted in any significant change in
spreads or margins.
The insignificant effect of privatization and foreign bank entry on spreads and margins
stands in sharp contrast to cross-country work that has found a positive effect of both on
intermediation efficiency. There are several interpretations of this result. Firstly, it could be the
case that the time frame we are considering is too short for such effects to show. Secondly, the
UCB-Stanbic merger increased the foreign bank share in deposits from over 60% to over 80%,
so from a high level to an even higher level; perhaps positive effects of foreign bank ownership
level off after a certain threshold. Thirdly, while most of the cross-country work is based either
on broad samples or on the Latin American region, it could be that the weak contractual and
informational frameworks in Sub-Saharan Africa do not allow these systems to benefit from
privatization and foreign bank entry as other developing countries. This last interpretation
suggests that more fundamentals characteristics of the Ugandan banking market result in low
competitiveness and that changes in market structure can therefore not affect competitiveness.
The absence of credit information sharing ties borrowers to one institution thus undermining
competition for clients and increasing hurdles for new institutions to come into the market.
Deficiencies in the legal system result in the preferred use of debentures that comprise all of a
debtor’s assets, thus again tying borrowers to a specific lender. Reforms in the contractual and

23
informational frameworks such as the ongoing establishment of a credit bureau can enhance
competitiveness. Broadening the financial system to Tier 2 (bank like institutions) and Tier 3
(microfinance deposit-taking institutions) by including these institutions in the payment system
and efforts to unite banks under one ATM network are other measures that can help enhance
competitiveness and thus efficiency.
The findings that outreach efforts by financial institutions has implications for efficiency
as measured by spreads, margins and overhead costs, also holds important policy measures.
There seems to be a trade-off between reaching out to “smaller” depositors and efficiency. The
lack of competitiveness, however, might again play a role, not sufficiently forcing financial
institutions to “reach out” in the most efficient way. Future research can hopefully use time-
series variation to explore in more detail the relationship between competitiveness, outreach and
intermediation efficiency.
24
References
Barajas, A., R. Steiner and N. Salazar (2000) “The Impact of Liberalization and Foreign Investment in Colombia’s Financial Sector,” Journal of Development Economics, 63(1), 157–96. Bernanke, B and M. Gertler (1989) “Agency Costs, Net Worth, and Business Fluctuations,” American Economic Review, 79, 14-31. Birungi, P. (2005) “Determinants of Interest Rate Spreads in Uganda,” University of Pretoria, South Africa, Mimeo Bossone, B., Honohan, P and Long, M. (2002); Policy for Small Financial Systems, in: Caprio, G., Honohan, P and Vittas, D. (Eds.): Financial Sector Policy for Developing Countries: A Reader, World Bank. Washington, DC Brock, P. L. and L. Rojas-Suarez (2000) “Understanding the Behaviour of Bank Spreads in Latin America,” Journal of Development Economics, 63(1), 113–34. Caprio, G., Klingebiel, D., Laeven, L. and Noguera, G. (2005): "Banking Crisis Database", in: Honohan, P. and Laeven, L. (Eds.): Systemic Financial Crises, Cambridge University Press Chirwa, E.W. and M. Mlachila (2004) “Financial Reforms and Interest Rate Spreads in the Commercial Banking System in Malawi,” IMF Staff Papers, 51(1), 96-122. Cihak, M. and R. Podpiera (2005) “Bank Behavior in Developing Countries: Evidence from East Africa,” IMF Working Paper 05/129 Claessens, S., A., Demirgüç-Kunt and H. Huizinga (2001) “How Does Foreign Entry Affect Domestic Banking Markets?” Journal of Banking and Finance, Vol. 25, pp. 891–911. Claessens, S., A. and L. Laeven (2004) “What Drives Bank Competition? Some International Evidence,” Journal of Money, Credit & Banking, 36 (3) Part 2, 563-583. Clarke, G. Cull, R. and Fuchs, M., 2006 “Bank Privatization in Sub-Saharan Africa: The Case of Uganda Commercial Bank,” World Bank Mimeo Cull, R., S. Haber and M. Imai (2006) “All Bad, All of the Time? Related Lending and Financial Development,” Stanford Center for International Development, Working Paper Cull, R., J. Matesova and M. Shirley (2002) “Ownership Structure and the Temptation to Loot: Evidence from Privatized Firms in the Czech Republic,” Journal of Comparative Economics, 30 (1), 1-24. Demirgüç-Kunt, A. and H. Huizinga (1999) “Determinants of Commercial Bank Interest Margins and Profitability: Some International Evidence,” World Bank Economic Review, 13(2), 379–408.
25
Demirgüç-Kunt, A., L. Laeven and R. Levine (2004) “Regulations, Market Structure, Institutions, and the Cost of Financial Intermediation,” Journal of Money, Credit, and Banking, 36(3), 593-622. Habyarimana, J. (2005) “The Benefits of Banking Relationships: Evidence from Uganda’s Banking Crisis” Georgetown University Mimeo Hannan, T.H. and J. N. Liang (1993) “Inferring Market Power from Time-Series Data: The Case of the Banking Firm,” International Journal of Industrial Organization, 11(2), 205–18. Hauner, D. and S.J. Peiris (2005) “Bank Efficiency and Competition and Low- Income Countries: The Case of Uganda,” IMF Working Paper 05/240 Ho, T. and A. Saunders (1981) “The Determinants of Bank Interest Margins: Theory and Empirical Evidence”, Journal of Financial and Quantitative Analysis, 4, 581-600. Kasekende, L. A., 2001. “Capital Account Liberalisation: The Ugandan Experience.” Development Policy Review, 19(1): 101-120.
Kiyotaki, N. and J. Moore (1997) “Credit Chains,” Journal of Political Economy, 105, 211-248. Laeven, L. and G. Majnoni (2005) “Does judicial efficiency lower the cost of credit?,” Journal of Banking & Finance, 29 (7), 1791-1812. Martinez Peria, M. S. and A. Mody (2004) “How Foreign Participation and Market Concentration Impact Bank Spreads: Evidence from Latin America.” Journal of Money, Credit, and Banking, 36(3), 511-537. Saunders, A. and L. Schumacher (2000) “The Determinants of Bank Interest Rate Margins: An International Study,” Journal of International Money and Finance, 19(6), 813–32. Smith, T. (2001) “Bank Spreads and Business Cycles,” IMF Mimeo Stiglitz, J. and Weiss, A. (1981): Credit Rationing in Markets with Imperfect Information, American Economic Review 71,393-410.
26
Table 1: Financial intermediation across countries, 2004 Private
Credit/GDP Liquid
Liabilities/GDP Bank
deposits/GDP Loan-deposit
ratio Net interest
margin Overhead
costs Uganda 5.9% 19.0% 14.8% 39.9% 13.4% 9.1% Kenya 25.3% 39.8% 32.9% 73.2% 6.7% 5.7% Tanzania 7.8% 22.1% 16.7% 46.7% 7.7% 6.4% Sub-Saharan Africa 17.8% 30.8% 24.2% 66.0% 8.3% 6.7% Low income 14.7% 29.4% 22.1% 65.6% 7.5% 6.2% Sources: All data are from the updated version of the Financial Structure Database, as described in Beck, Demirguc-Kunt and Levine (2000). Private Credit/GDP is total claims of financial institutions on the domestic private non-financial sector as share of GDP. Bank deposits/GDP is total deposits in deposit money banks as share of GDP. Liquid Liabilities are liquid liabilities of the financial system (currency plus demand and interest-bearing liabilities of banks and nonbank financial intermediaries) as a share of GDP. Bank deposits/GDP is the ratio of demand, time and savings deposits in money banks to GDP. Loan-deposit ratio is the aggregate ratio of lending to the private sector to total deposits for deposit money banks. Underlying data are from International Financial Statistics (IFS) and for 2004. Overhead costs are banks’ operating costs relative to total earning assets. Interest margin is the net interest revenue relative to total earning assets. Underlying data are from Bankscope and for 2004.
Table 2: Summary Statistics and Correlation Panel A: Summary Statistics
Variable Observations Mean Median Std. Dev. Minimum Maximum
Wide Margin 377 0.109 0.100 0.051 -0.233 0.327 Margin 377 0.097 0.090 0.045 -0.252 0.291 Spread 377 0.181 0.190 0.044 0.010 0.310 Overhead 377 0.077 0.069 0.041 0.016 0.295 ROA 377 0.019 0.033 0.103 -1.005 0.210 Loan Loss Provisions 377 0.046 0.041 0.043 0.000 0.292 Liquidity ratio 377 0.863 0.798 0.359 0.138 2.652 Market share deposits 377 0.057 0.026 0.076 0.001 0.323 Market share loans 377 0.062 0.019 0.085 0.000 0.403 Government 377 0.003 0.000 0.014 0.000 0.184 Agriculture 377 0.108 0.084 0.115 0.000 0.555 Mining 377 0.014 0.000 0.057 0.000 0.417 Manufacturing 377 0.209 0.122 0.212 0.000 0.870 Trade and Commerce 377 0.261 0.222 0.178 0.000 0.986 Transport 377 0.047 0.034 0.046 0.000 0.259 Construction 377 0.066 0.045 0.073 0.000 0.356 Foreign bank share deposits 25 0.745 0.649 0.128 0.607 0.887 Foreign bank share loans 25 0.792 0.811 0.062 0.607 0.882 Herfindahl deposits 25 1785.7 1759.9 155.0 1582.5 2054.4 Herfindahl loans 25 1821.5 1799.2 172.0 1534.8 2175.9 GDP growth 25 0.011 0.009 0.044 -0.081 0.075 Inflation 25 0.046 0.041 0.040 -0.033 0.119 Real T-Bill Rate 25 0.064 0.070 0.048 -0.018 0.152 Change in the exchange rate 25 0.137 0.138 0.698 -1.370 2.467 Note: The summary statistics are calculated for the sample period 1999 II-2005 II. All variables and their sources are defined in the appendix.
27
Pan
el B
: C
orre
lati
on T
able
Sp
read
M
argi
n O
verh
ead
RO
A
LL
P
L.r
atio
M
.s. d
ep.
M.s
. loa
ns
Gov
. A
gric
. M
inin
g M
anuf
. T
r. &
C
om.
Tra
ns.
Mar
gin
0.34
2***
1
Ove
rhea
d 0.
358*
**
0.61
0***
1
RO
A
0.02
1 0.
222*
**
-0.1
80**
* 1
Loa
n L
oss
Prov
isio
ns
0.28
1***
0.
034
0.34
3***
-0
.542
***
1
Liq
uidi
ty r
atio
-0
.040
-0
.030
-0
.192
***
0.14
3***
-0
.154
***
1
Mar
ket s
hare
dep
osits
-0
.262
***
-0.0
93*
-0.3
20**
* 0.
133*
**
-0.2
88**
* -0
.115
**
1
Mar
ket s
hare
loan
s -0
.139
***
0.01
4 -0
.218
***
0.13
6***
-0
.264
***
-0.1
94**
* 0.
876*
**
1
Gov
ernm
ent
-0.1
19**
0.
029
0.07
0 0.
016
-0.0
11
-0.0
20
-0.0
04
-0.0
11
1
Agr
icul
ture
0.
224*
**
-0.2
22**
* -0
.058
-0
.030
0.
090*
-0
.216
***
-0.0
63
-0.0
85
-0.
090*
1
Min
ing
-0.0
44
0.04
8 0.
122*
* -0
.314
***
0.37
1***
-0
.139
***
-0.1
67**
* -0
.115
**
-0.0
43
-0.
227*
**
1
Man
ufac
ture
-0
.441
***
-0.4
11**
* -0
.529
***
0.06
4 -0
.332
***
-0.0
08
0.46
5***
0.
392*
**
-0.0
60
-0.
203*
**
-0.
209*
**
1
Tra
de a
nd C
omm
erce
0.
263*
**
0.40
9***
0.
525*
**
-0.0
38
0.21
0***
0.
054
-0.2
46**
* -0
.170
***
0.01
8 -
0.15
4***
0.
065
-0.
508*
**
1
Tra
nspo
rt
-0.2
70**
* -0
.237
***
-0.3
31**
* 0.
053
-0.2
07**
* 0.
011
0.45
0***
0.
374*
**
0.02
3 -0
.106
**
-0.
205*
**
0.45
5***
-0
.354
***
1
Con
stru
ctio
n 0.
233*
**
0.20
2***
0.
300*
**
-0.1
34**
* 0.
421*
**
0.14
5***
-0
.360
***
-0.3
21**
* 0.
005
-0.
278*
**
0.52
9***
-
0.41
5***
0.
225*
**
-0.
219*
**
Obs
erva
tion
s: 3
77
H
.dep
osits
H
.loan
s F.
b. s
. d.
F. b
. s. l
. G
DP
g.
Infl
atio
n R
. T-B
ill
Rat
e
Her
find
ahl l
oans
-0
.187
1
Fore
ign
bank
sha
re
depo
sits
0.
890*
**
-0.2
43
1
Fore
ign
bank
sha
re lo
ans
0.25
7 0.
311
0.31
0 1
GD
P gr
owth
0.
023
0.14
2 0.
002
0.26
2 1
Infl
atio
n 0.
312
-0.5
56**
* 0.
296
-0.4
69**
0.
046
1
Rea
l T-B
ill R
ate
0.01
2 -0
.079
-0
.105
0.
308
0.19
2 -0
.485
**
1
Cha
nge
in th
e ex
chan
ge
rate
-0
.208
-0
.220
-0
.247
-0
.141
0.
251
-0.0
31
0.25
0
Obs
erva
tion
s: 2
5
* si
gnifi
cant
at 1
0%; *
* si
gnifi
cant
at 5
%; *
** s
igni
fican
t at 1
%
28
Table 3: Interest spreads, margins and bank characteristics Panel A: Interest rate spreads Panel B: Interest Rate Margins (1) (2) (3) (4) (1) (2) (3) (4) Overhead 0.284 0.311 0.289 0.294 0.878 0.377 0.416 0.883 (0.015)** (0.004)*** (0.004)*** (0.002)*** (0.001)*** (0.066)* (0.037)** (0.000)*** ROA 0.087 0.027 0.002 0.083 0.162 0.069 0.081 0.16 (0.127) (0.442) (0.958) (0.119) (0.053)* (0.140) (0.134) (0.050)* Loan loss provisions 0.27 0.063 0.046 0.259 0.044 -0.194 -0.16 0.039 (0.090)* (0.634) (0.691) (0.086)* (0.849) (0.246) (0.328) (0.871) Liquidity ratio 0.001 0.015 0.011 0.007 0.006 -0.003 0.001 0.01 (0.965) (0.261) (0.283) (0.639) (0.673) (0.802) (0.956) (0.505) Market share deposits -0.077 -0.216 -0.233 -0.056 0.064 0.281 0.302 0.075 (0.012)** (0.028)** (0.001)*** (0.076)* (0.224) (0.000)*** (0.001)*** (0.187) Government -0.413 -0.082 (0.058)* (0.332) Agriculture 0.114 -0.092 (0.001)*** (0.008)*** Mining -0.147 0.01 (0.034)** (0.911) Manufacturing 0.037 0.02 (0.287) (0.418) Trade and commerce 0.002 -0.005 (0.954) (0.705) Transport -0.059 -0.021 (0.556) (0.687) Construction 0.031 -0.018 (0.600) (0.715) Foreign bank dummy -0.02 -0.011 (0.005)*** (0.489) Constant 0.158 0.167 0.038 0.043 (0.000)*** (0.000)*** (0.071)* (0.043)** Fixed effects No Yes Yes No No Yes Yes No Observations 377 377 377 377 377 377 377 377 R-squared 0.273 0.972 0.975 0.305 0.531 0.951 0.954 0.538 Year and quarterly dummies are included by not reported. P values from clustered standard errors in parentheses. All variables and their sources are defined in the appendix. * significant at 10%; ** significant at 5%; *** significant at 1%
`
29
Tab
le 4
: In
tere
st s
prea
ds, m
argi
ns, b
anki
ng s
yste
m s
truc
ture
and
mac
ro v
aria
bles
P
anel
A:
Inte
rest
Rat
e Sp
read
s
P
anel
B:
Inte
rest
Rat
e M
argi
ns
(1
) (2
) (3
) (4
) (5
) (1
) (2
) (3
) (4
) (5
) O
verh
ead
0.19
5 0.
304
0.30
3 0.
312
0.26
1 0.
332
0.38
6 0.
386
0.38
9 0.
338
(0
.035
)**
(0.0
03)*
**
(0.0
03)*
**
(0.0
02)*
**
(0.0
08)*
**
(0.1
00)*
(0
.056
)*
(0.0
56)*
(0
.054
)*
(0.0
76)*
R
OA
0.
047
0.05
2 0.
051
0.03
9 0.
041
0.07
8 0.
08
0.08
0.
077
0.07
4
(0.2
28)
(0.1
93)
(0.2
23)
(0.2
83)
(0.3
75)
(0.1
04)
(0.1
04)
(0.1
00)
(0.1
25)
(0.1
13)
Loa
n lo
ss p
rovi
sion
s 0.
134
0.13
2 0.
126
0.09
2 0.
133
-0.1
8 -0
.185
-0
.187
-0
.197
-0
.172
(0.2
36)
(0.3
03)
(0.3
43)
(0.4
49)
(0.4
24)
(0.2
87)
(0.2
73)
(0.2
52)
(0.2
67)
(0.3
34)
Liq
uidi
ty r
atio
0.
006
0.01
3 0.
013
0.01
6 0.
008
-0.0
005
0.00
3 0.
003
0.00
1 -0
.008
(0.6
11)
(0.2
47)
(0.2
51)
(0.1
97)
(0.5
11)
(0.9
61)
(0.7
70)
(0.7
64)
(0.8
91)
(0.4
79)
Mar
ket s
hare
dep
osits
-0
.915
-0
.223
-0
.219
-0
.224
-0
.235
-0
.051
0.
297
0.30
2 0.
295
0.27
5
(0.0
00)*
**
(0.0
27)*
* (0
.022
)**
(0.0
21)*
* (0
.020
)**
(0.7
77)
(0.0
00)*
**
(0.0
00)*
**
(0.0
00)*
**
(0.0
00)*
**
UC
B P
riva
tizat
ion
0.00
5
-0
.002
-0.0
01
-0.0
05
(0.5
14)
(0.8
47)
(0
.885
)
(0
.398
)
Stan
bic
Pos
t Pri
vatiz
atio
n 0.
148
0.07
4
(0.0
00)*
**
(0.0
38)*
*
H
erfi
ndah
l dep
osits
0.
051
-0.1
47
(0
.851
)
(0
.414
)
Fo
reig
n ba
nk s
hare
dep
osits
0.00
8
-0
.012
(0.8
33)
(0.6
31)
H
erfi
ndah
l loa
ns
-0
.388
-0
.164
(0.0
01)*
**
(0.0
67)*
Fore
ign
bank
sha
re lo
ans
0.
022
0.03
6
(0.6
02)
(0.4
20)
G
DP
gro
wth
0.
035
0.10
2
(0.2
56)
(0.0
02)*
**
Infl
atio
n
0.
15
0.06
7
(0.0
53)*
(0
.109
) R
eal T
-bil
l rat
e
0.
102
0.12
4
(0.1
84)
(0.0
22)*
* C
hang
e in
exc
hang
e ra
te
-0.0
09
-0.0
08
(0
.008
)***
(0
.020
)**
Fixe
d ef
fect
s Y
es
Yes
Y
es
Yes
Y
es
Yes
Y
es
Yes
Y
es
Yes
O
bser
vatio
ns
377
377
377
377
377
377
377
377
377
377
R-s
quar
ed
0.96
9 0.
968
0.96
8 0.
969
0.96
9 0.
947
0.94
7 0.
947
0.94
7 0.
95
All
reg
ress
ions
are
run
wit
h fi
xed
bank
eff
ects
. Y
ear
and
quar
terl
y du
mm
ies
are
incl
uded
by
not r
epor
ted.
P v
alue
s fr
om c
lust
ered
sta
ndar
d er
rors
in p
aren
thes
es. A
ll va
riab
les
and
thei
r so
urce
s ar
e de
fine
d in
the
appe
ndix
.* s
igni
fica
nt a
t 10%
; **
sign
ific
ant a
t 5%
; ***
sig
nifi
cant
at 1
%
30
Table 5: Bank Efficiency and Outreach
(1) (2) (3) Interest rate spread Interest rate margin Overhead Average deposit account size -0.046 -0.017 -0.012 (0.000)*** (0.001)*** (0.002)*** Branches 0.027 0.002 0.001 (0.017)** (0.020)** (0.029)** Market share deposits -0.190 -0.004 -0.003 (0.000)*** (0.030)** (0.027)** Constant 22.852 0.129 0.080 (0.000)*** (0.000)*** (0.000)*** Observations 15 15 15 R-squared 0.927 0.522 0.475
OLS regressions with robust standard errors. P values in parentheses. All variables and their sources are defined in the appendix * significant at 10%; ** significant at 5%; *** significant at 1%
31
Table 6: Interest spreads, margins and bank characteristics- Median Least Squares Regressions Panel A: Interest rate spreads Panel B: Interest Rate Margins (1) (2) (3) (4) (1) (2) (3) (4) Overhead 0.286 0.327 0.335 0.284 0.878 0.343 0.36 0.876 (0.000)*** (0.000)*** (0.000)*** (0.000)*** (0.000)*** (0.000)*** (0.000)*** (0.000)*** ROA 0.086 0.038 0.006 0.065 0.258 0.062 0.044 0.245 (0.000)*** (0.068)* (0.611) (0.001)*** (0.000)*** (0.000)*** (0.029)** (0.000)*** Loan loss provisions 0.199 0.073 0.061 0.155 0.071 -0.143 -0.165 0.063 (0.000)*** (0.382) (0.202) (0.003)*** (0.138) (0.001)*** (0.011)** (0.140) Liquidity ratio -0.00004 0.01 0.014 0.012 0.001 -0.007 -0.002 0.001 (0.994) (0.301) (0.021)** (0.022)** (0.850) (0.184) (0.781) (0.753) Market share deposits -0.085 -0.269 -0.282 -0.051 0.057 0.228 0.242 0.058 (0.001)*** (0.001)*** (0.000)*** (0.054)* (0.008)*** (0.000)*** (0.000)*** (0.004)*** Government -0.943 -0.099 (0.000)*** (0.247) Agriculture 0.101 -0.079 (0.000)*** (0.001)*** Mining -0.141 -0.029 (0.002)*** (0.673) Manufacturing 0.027 -0.009 (0.109) (0.677) Trade and commerce -0.007 -0.001 (0.566) (0.961) Transport -0.054 -0.016 (0.141) (0.727) Construction -0.023 -0.016 (0.389) (0.658) Foreign bank dummy -0.016 -0.003 (0.000)*** (0.420) Constant 0.147 0.158 0.109 0.154 0.016 0.056 0.094 0.019 (0.000)*** (0.000)*** (0.000)*** (0.000)*** (0.045)** (0.000)*** (0.000)*** (0.013)** Observations 377 377 377 377 377 377 377 377 All regressions are run with median least square. P values from clustered standard errors in parentheses. All variables and their sources are defined in the appendix. * significant at 10%; ** significant at 5%; *** significant at 1%.

32
Table 7: Interest spreads, margins and bank characteristics- Robust Regressions Panel A: Interest rate spreads Panel B: Interest Rate Margins (1) (2) (3) (4) (1) (2) (3) (4) Overhead 0.262 0.271 0.297 0.27 0.975 0.483 0.461 0.985 (0.000)*** (0.000)*** (0.000)*** (0.000)*** (0.000)*** (0.000)*** (0.000)*** (0.000)*** ROA 0.073 0.019 -0.003 0.071 0.55 0.027 0.363 0.552 (0.001)*** (0.359) (0.872) (0.001)*** (0.000)*** (0.038)** (0.000)*** (0.000)*** Loan loss provisions 0.186 0.032 0.018 0.191 0.065 -0.145 -0.191 0.055 (0.002)*** (0.652) (0.782) (0.001)*** (0.097)* (0.001)*** (0.000)*** (0.163) Liquidity ratio 0.004 0.011 0.012 0.01 -0.003 -0.02 -0.024 0.001 (0.474) (0.175) (0.151) (0.093)* (0.509) (0.000)*** (0.000)*** (0.748) Market share deposits -0.107 -0.213 -0.258 -0.082 0.041 0.173 0.19 0.051 (0.000)*** (0.001)*** (0.000)*** (0.003)*** (0.027)** (0.000)*** (0.000)*** (0.007)*** Government -0.866 -0.073 (0.000)*** (0.267) Agriculture 0.081 -0.063 (0.001)*** (0.000)*** Mining -0.152 -0.207 (0.023)** (0.000)*** Manufacturing 0.035 -0.019 (0.096)* (0.131) Trade and commerce -0.021 0.007 (0.194) (0.501) Transport -0.108 -0.026 (0.019)** (0.344) Construction -0.005 -0.033 (0.898) (0.120) Foreign bank dummy -0.017 -0.008 (0.000)*** (0.011)** Constant 0.168 0.167 0.174 0.174 0.028 0.14 0.132 0.03 (0.000)*** (0.000)*** (0.000)*** (0.000)*** (0.000)*** (0.000)*** (0.000)*** (0.000)*** Observations 377 377 377 377 377 377 377 377 R-squared 0.28 0.551 0.635 0.301 0.876 0.835 0.927 0.877 All regressions are run with median least square. P values from clustered standard errors in parentheses. All variables and their sources are defined in the appendix. * significant at 10%; ** significant at 5%; *** significant at 1%.
33
Tab
le 8
: In
tere
st s
prea
ds, m
argi
ns, b
anki
ng s
yste
m s
truc
ture
and
mac
ro v
aria
bles
- M
edia
n L
east
Squ
ares
Reg
ress
ions
P
anel
A:
Inte
rest
Rat
e Sp
read
s
P
anel
B:
Inte
rest
Rat
e M
argi
ns
(1
) (2
) (3
) (4
) (5
) (1
) (2
) (3
) (4
) (5
) O
verh
ead
0.17
1 0.
313
0.27
4 0.
289
0.16
7 0.
362
0.50
7 0.
506
0.46
1 0.
382
(0
.000
)***
(0
.000
)***
(0
.000
)***
(0
.000
)***
(0
.006
)***
(0
.000
)***
(0
.000
)***
(0
.000
)***
(0
.000
)***
(0
.000
)***
R
OA
0.
059
0.06
8 0.
062
0.05
3 0.
038
0.12
0.
109
0.10
4 0.
075
0.12
(0.0
00)*
**
(0.0
00)*
**
(0.0
01)*
**
(0.0
00)*
**
(0.0
18)*
* (0
.000
)***
(0
.000
)***
(0
.000
)***
(0
.000
)***
(0
.000
)***
L
oan
loss
pro
visi
ons
0.15
7 0.
194
0.17
4 0.
126
0.07
2 -0
.129
-0
.121
-0
.123
-0
.166
-0
.086
(0.0
00)*
**
(0.0
02)*
**
(0.0
10)*
**
(0.0
00)*
**
(0.1
81)
(0.0
09)*
**
(0.0
26)*
* (0
.038
)**
(0.0
00)*
**
(0.0
71)*
L
iqui
dity
rat
io
0.00
1 0.
015
0.01
2 0.
017
-0.0
01
-0.0
07
-0.0
05
-0.0
03
0.00
2 -0
.013
(0.8
34)
(0.0
36)*
* (0
.125
) (0
.000
)***
(0
.881
) (0
.248
) (0
.449
) (0
.642
) (0
.719
) (0
.035
)**
Mar
ket s
hare
dep
osits
-0
.923
-0
.313
-0
.246
-0
.284
-0
.256
-0
.128
0.
222
0.22
7 0.
233
0.24
8
(0.0
00)*
**
(0.0
00)*
**
(0.0
00)*
**
(0.0
00)*
**
(0.0
00)*
**
(0.3
80)
(0.0
00)*
**
(0.0
00)*
**
(0.0
00)*
**
(0.0
00)*
**
UC
B P
riva
tizat
ion
0.01
3
0.
007
0.
002
-0.0
03
(0.0
00)*
**
(0.0
01)*
**
(0
.425
)
(0
.242
)
Stan
bic
Pos
t Pri
vatiz
atio
n 0.
135
0.07
6
(0.0
00)*
**
(0.0
09)*
**
Her
find
ahl d
epos
its
0.36
1
-0
.081
(0.0
03)*
**
(0.4
38)
Fore
ign
bank
sha
re d
epos
its
0.
046
-0.0
06
(0
.001
)***
(0
.657
)
Her
find
ahl l
oans
-0.3
52
-0.2
07
(0
.000
)***
(0
.005
)***
Fore
ign
bank
sha
re lo
ans
0.
031
0.01
6
(0.0
43)*
*
(0
.455
)
GD
P g
row
th
0.04
4
0.
088
(0
.192
)
(0
.002
)***
In
flat
ion
0.16
4
0.
065
(0
.000
)***
(0
.059
)*
Rea
l T-b
ill r
ate
0.15
9
0.
082
(0
.000
)***
(0
.008
)***
C
hang
e in
exc
hang
e ra
te
-0.0
09
-0.0
06
(0
.000
)***
(0
.001
)***
C
onst
ant
0.18
1 0.
121
0.09
7 0.
2 0.
171
0.05
9 0.
049
0.05
8 0.
075
0.04
7
(0.0
00)*
**
(0.0
00)*
**
(0.0
01)*
**
(0.0
00)*
**
(0.0
00)*
**
(0.0
00)*
**
(0.0
04)*
**
(0.0
16)*
* (0
.000
)***
(0
.000
)***
O
bser
vatio
ns
377
377
377
377
377
377
377
377
377
377
All
regr
essi
ons
are
run
wit
h ro
bust
reg
ress
ions
. P v
alue
s fr
om c
lust
ered
sta
ndar
d er
rors
in p
aren
thes
es. A
ll va
riab
les
and
thei
r so
urce
s ar
e de
fine
d in
the
appe
ndix
. *
sign
ific
ant a
t 10%
; **
sign
ific
ant a
t 5%
; ***
sig
nifi
cant
at 1
%
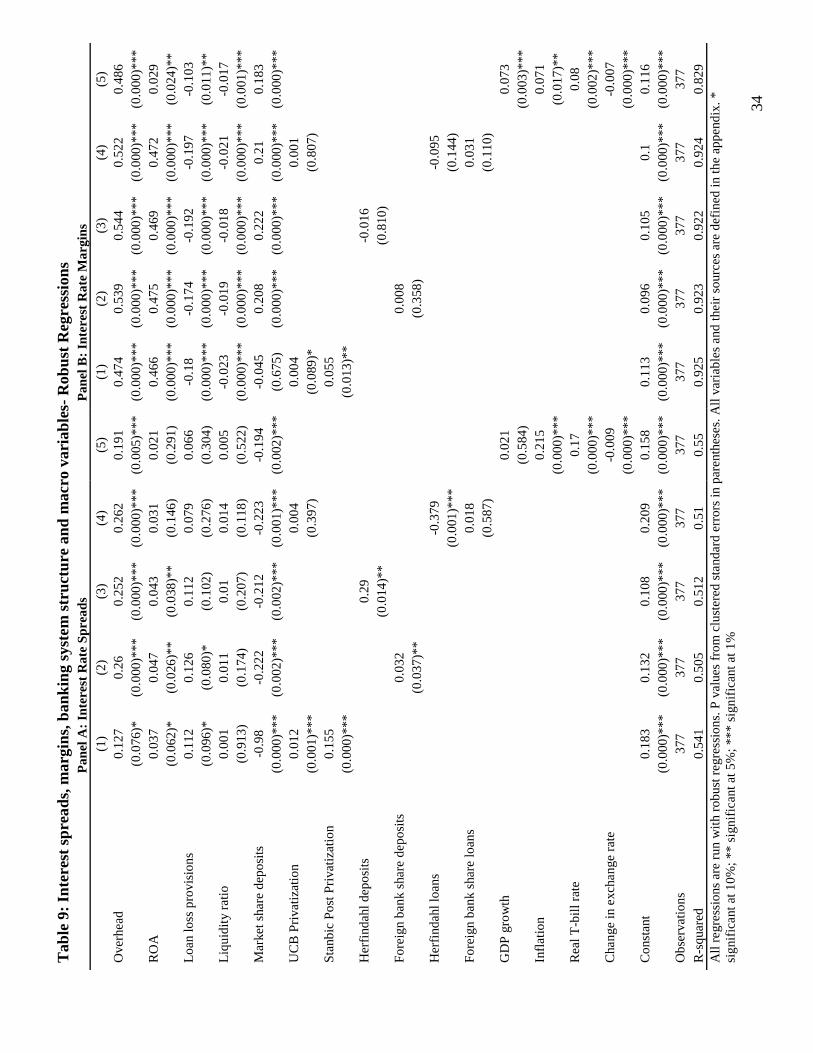
34
Tab
le 9
: In
tere
st s
prea
ds, m
argi
ns, b
anki
ng s
yste
m s
truc
ture
and
mac
ro v
aria
bles
- R
obus
t R
egre
ssio
ns
P
anel
A:
Inte
rest
Rat
e Sp
read
s
P
anel
B:
Inte
rest
Rat
e M
argi
ns
(1
) (2
) (3
) (4
) (5
) (1
) (2
) (3
) (4
) (5
) O
verh
ead
0.12
7 0.
26
0.25
2 0.
262
0.19
1 0.
474
0.53
9 0.
544
0.52
2 0.
486
(0
.076
)*
(0.0
00)*
**
(0.0
00)*
**
(0.0
00)*
**
(0.0
05)*
**
(0.0
00)*
**
(0.0
00)*
**
(0.0
00)*
**
(0.0
00)*
**
(0.0
00)*
**
RO
A
0.03
7 0.
047
0.04
3 0.
031
0.02
1 0.
466
0.47
5 0.
469
0.47
2 0.
029
(0
.062
)*
(0.0
26)*
* (0
.038
)**
(0.1
46)
(0.2
91)
(0.0
00)*
**
(0.0
00)*
**
(0.0
00)*
**
(0.0
00)*
**
(0.0
24)*
* L
oan
loss
pro
visi
ons
0.11
2 0.
126
0.11
2 0.
079
0.06
6 -0
.18
-0.1
74
-0.1
92
-0.1
97
-0.1
03
(0
.096
)*
(0.0
80)*
(0
.102
) (0
.276
) (0
.304
) (0
.000
)***
(0
.000
)***
(0
.000
)***
(0
.000
)***
(0
.011
)**
Liq
uidi
ty r
atio
0.
001
0.01
1 0.
01
0.01
4 0.
005
-0.0
23
-0.0
19
-0.0
18
-0.0
21
-0.0
17
(0
.913
) (0
.174
) (0
.207
) (0
.118
) (0
.522
) (0
.000
)***
(0
.000
)***
(0
.000
)***
(0
.000
)***
(0
.001
)***
M
arke
t sha
re d
epos
its
-0.9
8 -0
.222
-0
.212
-0
.223
-0
.194
-0
.045
0.
208
0.22
2 0.
21
0.18
3
(0.0
00)*
**
(0.0
02)*
**
(0.0
02)*
**
(0.0
01)*
**
(0.0
02)*
**
(0.6
75)
(0.0
00)*
**
(0.0
00)*
**
(0.0
00)*
**
(0.0
00)*
**
UC
B P
riva
tizat
ion
0.01
2
0.
004
0.
004
0.00
1
(0
.001
)***
(0
.397
)
(0.0
89)*
(0
.807
)
Stan
bic
Pos
t Pri
vatiz
atio
n 0.
155
0.05
5
(0.0
00)*
**
(0.0
13)*
*
H
erfi
ndah
l dep
osits
0.
29
-0.0
16
(0
.014
)**
(0.8
10)
Fore
ign
bank
sha
re d
epos
its
0.
032
0.00
8
(0.0
37)*
*
(0
.358
)
Her
find
ahl l
oans
-0.3
79
-0.0
95
(0
.001
)***
(0
.144
)
Fore
ign
bank
sha
re lo
ans
0.
018
0.03
1
(0.5
87)
(0.1
10)
G
DP
gro
wth
0.
021
0.07
3
(0.5
84)
(0.0
03)*
**
Infl
atio
n
0.
215
0.07
1
(0.0
00)*
**
(0.0
17)*
* R
eal T
-bill
rat
e
0.
17
0.08
(0.0
00)*
**
(0.0
02)*
**
Cha
nge
in e
xcha
nge
rate
-0
.009
-0
.007
(0.0
00)*
**
(0.0
00)*
**
Con
stan
t 0.
183
0.13
2 0.
108
0.20
9 0.
158
0.11
3 0.
096
0.10
5 0.
1 0.
116
(0
.000
)***
(0
.000
)***
(0
.000
)***
(0
.000
)***
(0
.000
)***
(0
.000
)***
(0
.000
)***
(0
.000
)***
(0
.000
)***
(0
.000
)***
O
bser
vatio
ns
377
377
377
377
377
377
377
377
377
377
R-s
quar
ed
0.54
1 0.
505
0.51
2 0.
51
0.55
0.
925
0.92
3 0.
922
0.92
4 0.
829
All
regr
essi
ons
are
run
wit
h ro
bust
reg
ress
ions
. P v
alue
s fr
om c
lust
ered
sta
ndar
d er
rors
in p
aren
thes
es. A
ll va
riab
les
and
thei
r so
urce
s ar
e de
fine
d in
the
appe
ndix
. *
sign
ific
ant a
t 10%
; **
sign
ific
ant a
t 5%
; ***
sig
nifi
cant
at 1
%
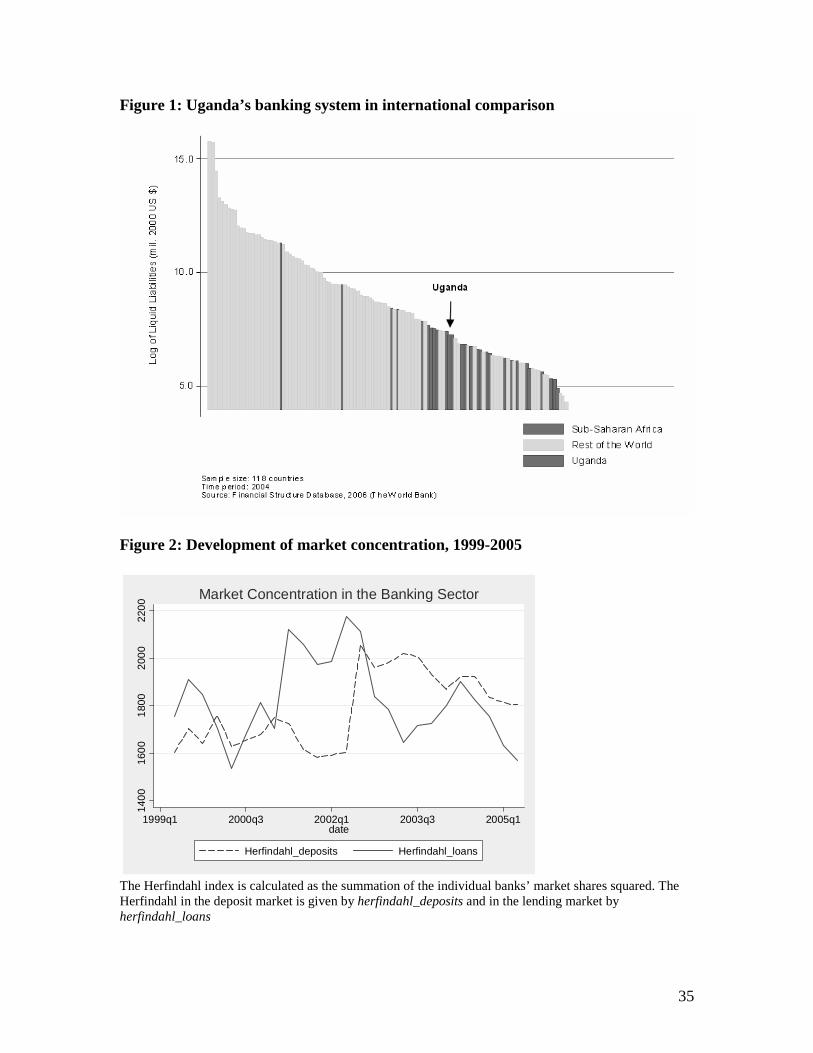
35
Figure 1: Uganda’s banking system in international comparison
Figure 2: Development of market concentration, 1999-2005
140
016
00
180
020
00
220
0
1999q1 2000q3 2002q1 2003q3 2005q1date
Herfindahl_deposits Herfindahl_loans
Market Concentration in the Banking Sector
The Herfindahl index is calculated as the summation of the individual banks’ market shares squared. The Herfindahl in the deposit market is given by herfindahl_deposits and in the lending market by herfindahl_loans
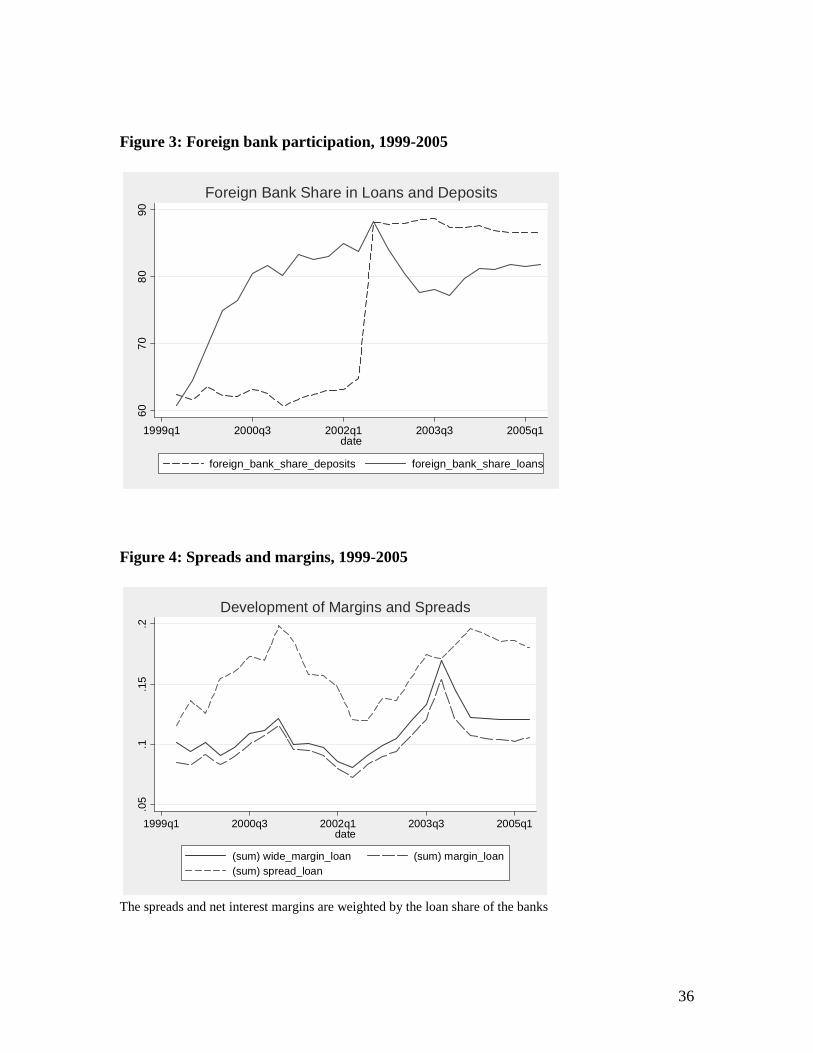
36
Figure 3: Foreign bank participation, 1999-2005
6070
8090
1999q1 2000q3 2002q1 2003q3 2005q1date
foreign_bank_share_deposits foreign_bank_share_loans
Foreign Bank Share in Loans and Deposits
Figure 4: Spreads and margins, 1999-2005
.05
.1.1
5.2
1999q1 2000q3 2002q1 2003q3 2005q1date
(sum) wide_margin_loan (sum) margin_loan(sum) spread_loan
Development of Margins and Spreads
The spreads and net interest margins are weighted by the loan share of the banks

37
Appendix: Variable Definitions and Sources
Variable Name Description Source
Panel Data Variables Wide Margin Difference between interest plus commission received
over loans and interest plus commission paid over deposits
Bank of Uganda (BOU) and authors' calculations
Margin Difference between total interest income and expenses
over total earning assets BOU and authors' calculations
Spread Difference between the weighted average lending rate
and the weighted average deposit rate for each bank and quarter where the weights are the relative amounts of deposits or loans contracted at specific interest rates in the respective quarter and by the respective bank. While the interest and loan/ deposit amount data are available on a monthly frequency, we average them at quarterly frequency to make them comparable to financial statement data.
BOU and authors' calculations
Overhead Costs for salaries, other staff costs, premises & fixed
assets and motor vehicles over total assets BOU and authors' calculations
ROA Profits over total assets BOU and authors' calculations Loan Loss Provisions Provisions for bad debt over total assets BOU and authors' calculations Liquidity Ratio Liquid assets over deposits BOU and authors' calculations Market share deposits/ loans Bank's market share in the deposit or the loan market
segment BOU and authors' calculations
Government Bank's government loans over its total loan portfolio BOU and authors' calculations Agriculture Bank's agriculture loans over its total loan portfolio BOU and authors' calculations Mining Bank's mining and quarrying loans over its total loan
portfolio BOU and authors' calculations
Manufacturing Bank's manufacturing loans over its total loan portfolio BOU and authors' calculations Trade and Commerce Bank's trade and commerce loans over its total loan
portfolio BOU and authors' calculations
Transport Bank's transport, communications, electricity and water
loans over its total loan portfolio BOU and authors' calculations
Construction Bank's building and construction loans over its total
loan portfolio BOU and authors' calculations
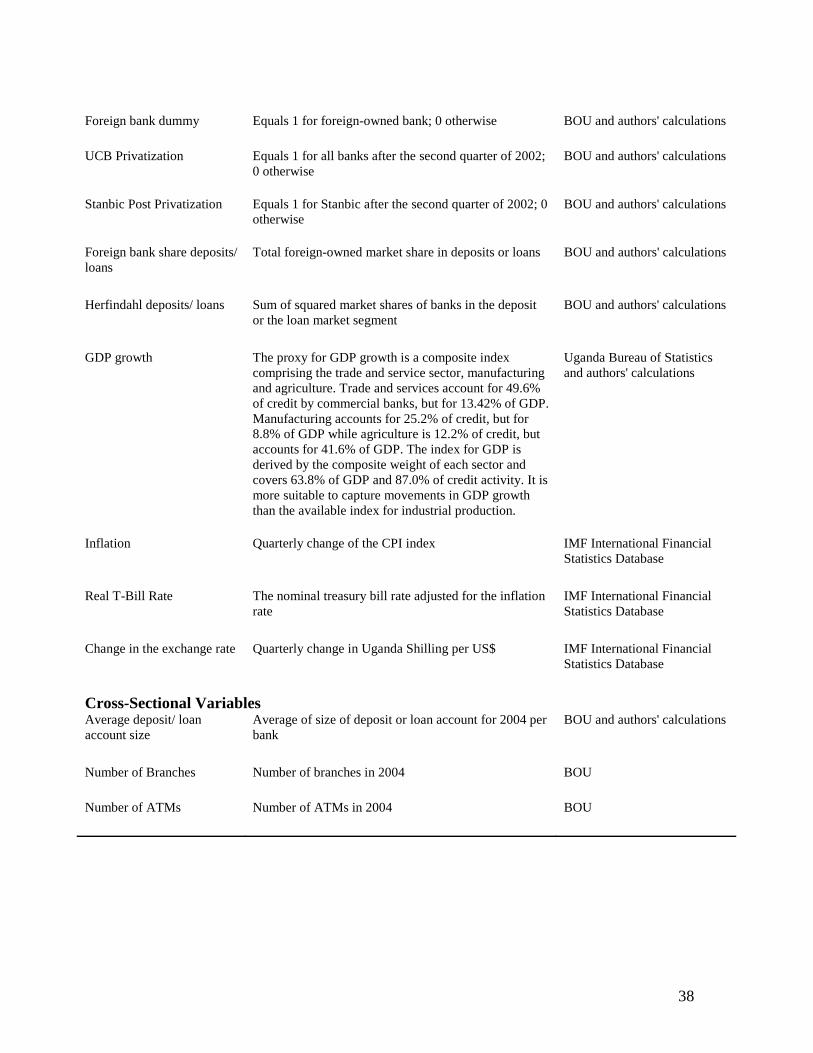
38
Foreign bank dummy Equals 1 for foreign-owned bank; 0 otherwise BOU and authors' calculations UCB Privatization Equals 1 for all banks after the second quarter of 2002;
0 otherwise BOU and authors' calculations
Stanbic Post Privatization Equals 1 for Stanbic after the second quarter of 2002; 0
otherwise BOU and authors' calculations
Foreign bank share deposits/ loans
Total foreign-owned market share in deposits or loans BOU and authors' calculations
Herfindahl deposits/ loans Sum of squared market shares of banks in the deposit
or the loan market segment BOU and authors' calculations
GDP growth The proxy for GDP growth is a composite index
comprising the trade and service sector, manufacturing and agriculture. Trade and services account for 49.6% of credit by commercial banks, but for 13.42% of GDP. Manufacturing accounts for 25.2% of credit, but for 8.8% of GDP while agriculture is 12.2% of credit, but accounts for 41.6% of GDP. The index for GDP is derived by the composite weight of each sector and covers 63.8% of GDP and 87.0% of credit activity. It is more suitable to capture movements in GDP growth than the available index for industrial production.
Uganda Bureau of Statistics and authors' calculations
Inflation Quarterly change of the CPI index IMF International Financial
Statistics Database
Real T-Bill Rate The nominal treasury bill rate adjusted for the inflation
rate IMF International Financial Statistics Database
Change in the exchange rate Quarterly change in Uganda Shilling per US$ IMF International Financial
Statistics Database
Cross-Sectional Variables Average deposit/ loan account size
Average of size of deposit or loan account for 2004 per bank
BOU and authors' calculations
Number of Branches Number of branches in 2004 BOU Number of ATMs Number of ATMs in 2004 BOU