bank group results measurement framework - african
TRANSCRIPT
AFRICAN DEVELOPMENT BANK
AFRICAN DEVELOPMENT FUND
BANK GROUP RESULTS MEASUREMENT FRAMEWORK
Quality Assurance and Results Department

Table of contents
I. Introduction .. . . . . . . . . . . . . . . . . . . . . . . . . . . . . . . . . . . . . . . . . . . . . . . . . . . . . . . . . . . . . . . . . . . . . . . . . . . . . . . . . . 1
II. A ―One Bank‖ Results Measurement Framework . . . . . . . . . . . . . . . . . . . . . . . . . . . . . . 2
III. A Corporate Management Tool .. . . . . . . . . . . . . . . . . . . . . . . . . . . . . . . . . . . . . . . . . . . . . . . . . . . . . 5
IV. A Cohesive View of Bank Processes and Results . . . . . . . . . . . . . . . . . . . . . . . . . . . . 5
Level 1: What Development Progress is Africa Making? ............................................................. 7
Level 2: How Does the AfDB Contribute to Africa’s Development? ........................................... 8
Level 3: Does the AfDB Manage its Operations Effectively? .................................................... 13
Level 4: Does the AfDB Manage Itself Efficiently? ................................................................... 16
V. Streamlining Results Reporting .. . . . . . . . . . . . . . . . . . . . . . . . . . . . . . . . . . . . . . . . . . . . . . . . . . . 17
Results Scorecard (RS) ................................................................................................................ 20
Results Briefs (RB)...................................................................................................................... 21
Results Reporting System (RRS) ................................................................................................ 21
VI. Conclusion .. . . . . . . . . . . . . . . . . . . . . . . . . . . . . . . . . . . . . . . . . . . . . . . . . . . . . . . . . . . . . . . . . . . . . . . . . . . . . . . . 23

Figures, Tables and Boxes
Box 1:Defining and Measuring a Culture of Results… ........................ …………………………..2
Box 2: Setting the Foundations of a Results Reporting System … ........ ………………………….4
Figure 1: AfDB Results Measurement Framework ......................................................................... 6
Table 1: Indicators for Development Outcomes in Africa (Level 1) .............................................. 8
Box 3: Using Sector Department’s Best Judgment on Measuring their own Results ................... 12
Box 4: Enhanced Monitoring and Evaluation in Projects ............................................................... 9
Table 2: Core Sector Indicators for All Sectors (Level 2)............................................................. 10
Table 3: Indicators of the Bank’s Operational Effectiveness (Levels 3) ...................................... 14
Box 5: Assessing Quality-at-Entry ................................................................................................ 16
Table 4: Indicators of the Bank’s Institutional Efficiency (Levels 4) ........................................... 17
Box 6: Helping Managers Manage Better ..................................................................................... 18
Figure 2 : Coverage of ADER ....................................................................................................... 19
Figure 3: Coverage of the Bank’s Results Scorecard .................................................................... 21
Table 5: Objectives of the Results Reporting System ................................................................... 22

Acronyms and Abbreviations
AfDB African Development Bank
ADF African Development Fund
ADER Annual Development Effectiveness Review
COMPAS Common Performance Assessment System
CSI Core Sector Indicator
ESTA Statistics Department
ESW Economic and Sector Work
M&E Monitoring and Evaluation
MDB Multilateral Development Bank
MfDR Managing for Development Results
NTF Nigerian Trust Fund
OPEV Operations Evaluation Department
PCR Project Completion Report
RO Regional Operations
RMC Regional Member Country
RMF Results Measurement Framework
RB Results Brief
RRS Results Reporting System
RS Results Scorecard

BANK GROUP RESULTS MEASUREMENT FRAMEWORK
1
I. INTRODUCTION
1.1. The purpose of this paper is to describe the African Development Bank (AfDB or Bank)
Group’s Results Measurement Framework (RMF) for 2010-2012. The paper proposes a
streamlined results reporting mechanism -the Annual Development Effectiveness Review and
its quarterly summary, the Results Scorecard- designed to give the Bank periodic information
about its performance toward programmed results and create opportunities for timely
corrective action. It also describes the Results Reporting System that will serve as a unified
platform to track progress implementing the RMF.
1.2. The proposed RMF is a corporate tool to monitor progress toward the vision described in the
Bank’s Medium-Term Strategy 2008-2012. The RMF is a flexible tool that can filter
information by variable (financing window, financing instrument, subregion, country, and
sector) to suit the Bank’s internal and external reporting needs. The RMF and its reporting
mechanisms aim to make the Bank’s corporate practices more consistent by:
consolidating and streamlining various reporting frameworks that cover different
dimensions of development effectiveness; and
harmonizing the AfDB’s RMF with the results measurement frameworks of other
multilateral development banks (MDBs).
1.3. The proposed RMF is a device to further Management efforts to spread a results culture
across all levels of the institution. It will focus attention and shed light on key issues, giving
the Bank an additional lens through which it can focus on its strategic priorities. The RMF
will assist Management and Board members alike in carrying out a number of functions:
reviewing progress in improving the quality, performance, and effectiveness of projects at
entry, during implementation and at completion; analyzing trends in performance; exploring
the relationship between enhanced organizational effectiveness and improved development
effectiveness; and identifying areas that appear to underperform.

BANK GROUP RESULTS MEASUREMENT FRAMEWORK
2
Box 1: Defining and Measuring a Culture of Results
In his book “Instruction to Deliver. Fighting to Transform Britain’s Public Services”, Sir Michael Barber
defines a culture of results with five key words: ambition, focus, clarity, urgency and irreversibility.
Ambition: ambition refers to bold ideas, boldly executed. It is the opposite of muddling through. A culture of
results has a constant expectation of success measured by change on the ground, at the frontline.
Focus: delivering results requires sustained prioritization. It demands consistent focus on the targets and the
data that show what progress is being made. But the targets, however good, and the data, however clear, are
only imperfect representations of something even more important: that is, the real-world outcomes that matter
to citizens. The central focus therefore should be on the solutions and on the real-world changes we are
aiming to achieve.
Clarity: refers above all to clarity of diagnosis. How secure is our knowledge? It is about confronting the
brutal facts and making sure that they are indeed facts. And in the search for a solution, identifying where the
best practice is. Management needs to be clear, at any given moment, what impact their strategy is having.
Urgency: is about achieving results now. It is the opposite of incremental and slow. It is about looking for a
means of speeding things up; knowing fast what is going on, and identifying and solving problems as they
arise or preferably before.
Irreversibility: means not giving up until you have achieved your intended results. It requires courage and
determination, integrating delivery and communications, erring on the side of rigor, and, above all, following
through until you delivered results.
Like many other experts, Barber recommends that progress towards a culture of results be initially measured
through qualitative assessments and then, over time, incorporate a set of quantitative indicators that can be
meaningful for a given organizational context.
II. A “ONE BANK” RESULTS MEASUREMENT FRAMEWORK
2.1. Over the past few years, the AfDB Group has made steady improvements in using RMFs to
assess the performance of all three of its financing windows: the AfDB, the African
Development Fund (ADF), and the Nigerian Trust Fund (NTF). Although instrumental for
their own purposes, these RMFs do not account for all the transformations and intermediate
milestones that occur in the process of translating Bank Group inputs into country results.
The ―One Bank‖ RMF presented in this paper is founded on the tenet that planning,
monitoring and assessing results is a continuum across all areas and sectors of the
institution. While retaining the flexibility to report on the results achieved by the Bank’s
different financing windows, this framework recognizes that most of the steps taken in
transforming Bank inputs into country results are common to the institution as a whole.
2.2. Traditionally, MDBs have centered their reporting systems on public sector investment
operations. Investment operations have a clear set of inputs, are implemented through a
planned project cycle, and disbursed against measurable milestones and expenditures.
Furthermore, their outputs actualize before the project ends. Historically, investment
operations have been single-country operations, as opposed to regional operations (ROs),
which have been growing in number in recent years. Programmatic project documents and
evaluation practices were thus initially developed to fit this traditional model of investment
operations. Over the past few years, the Bank and its partners have made significant efforts to
tailor their mechanisms to policy-based operations, ROs and operations that finance the
private sector. Furthering these efforts, the proposed RMF includes indicators to measure
policy-based operations, ROs and private sector operations as part of a single reporting
framework that covers all Bank interventions.

BANK GROUP RESULTS MEASUREMENT FRAMEWORK
3
2.3. The Bank, like other development partners, has centered its reporting on aggregating outputs
across projects and countries.1 This is to date the most accepted practice across all MDBs
because output indicators are straightforward to quantify and easy to aggregate. Aggregating
outputs allows the Bank to give stakeholders an estimate of results that are produced directly
by Bank operations. The proposed RMF goes one step further: it incorporates a set of
intermediate outcomes that can be linked to Bank interventions.2 Aggregating intermediate
outcomes across projects and countries has a significant limitation: most outcome indicators
represent gross program effects, i.e., they do not estimate the net results of Bank
interventions. But they provide a more comprehensive approximation to the real impact
Bank operations can have over time. By combining output and intermediate outcome
reporting in one single framework, the proposed RMF offers a sense of whether the
Bank’s support is ultimately effective at promoting sustained development in regional
member countries (RMC).
2.4. The Bank’s principal instrument for aggregating the outputs and outcomes of its operations is
the Project Completion Report (PCR). PCRs report the main results achieved through Bank
interventions and briefly describe the process that led to those results. Over the past few years
the Bank has made unprecedented improvements in delivering timely completion reporting,
setting the foundations for a solid results reporting system (Box 2). But since PCRs are
produced upon project completion, a significant portion of the results (particularly the
outputs) achieved by the Bank through its ongoing operations is not covered by corporate
reporting. Although operations take five to seven years to complete, many development
outputs are produced at different stages of their implementation. By refocusing
implementation support on assessing progress toward results, and by entrusting sector
departments to proactively track Core Sector Indicators (CSIs), the new RMF reports on
both ongoing and closed operations, providing a more accurate picture of the Bank’s
contributions to results at any point in time.
1 Output indicators measure the quantity of goods and services produced and the efficiency of production (e.g.,
the number of people trained, the time required to open a business).
2 Intermediate outcome (or project outcome) indicators measure the broader results achieved through the
provision of goods and services: they often reflect beneficiaries’ actual use of such goods and services (e.g., the
crop yield in the project area) in the short run. Intermediate outcomes indicators are a subset of outcome
indicators that measure the necessary preconditions, or facilitators, for the successful attainment of ultimate
country outcomes (e.g., increasing growths rates, declining mortality rates). As opposed to country-wide
outcomes, intermediate outcomes refer to results achieved within each project’s geographical area of
intervention.

BANK GROUP RESULTS MEASUREMENT FRAMEWORK
4
Box 2: Setting the Foundations of a Results Reporting System
Comprehensive completion reporting is the AfDB’s basic building block for reporting on the
outputs and outcomes of its operations. It is also the best way for the Bank to learn from
experience and strengthen the design and quality of new operations. Bank policy has long
required that completion reports be prepared for all operations within 6 months of closing.
However, it was only after introducing new guidelines and a results-oriented format in 2008 that
the Bank improved its performance to an unprecedented degree, achieving 100 percent reporting
in the first quarter of 2010.
PCR Coverage (1994-2010)
Valuing reporting as a source of knowledge. Over the years, a persistent backlog of projects
with outstanding Project Completion Reports contributed to the widespread view that PCRs were
resource-intensive and did not add value to the quality of operations. With the introduction of the
new PCR guidelines, the average time required for staff to complete PCRs—from closing to
posting—fell from 24 to 6 months. Reductions in processing times have been accompanied by
reductions in costs.
Deploying field staff regionally to gain efficiency. Field Offices have assumed a leading role in
PCR preparation. The Bank has encouraged transferring the leadership for PCRs to the field and
now expects Field Offices to complete 40 percent of PCRs in any given year. Field staff are in the
unique position of sharing a balanced perspective on results while recognizing the challenges of
implementation. Over the past two years, field staff have been deployed regionally to lead PCR
preparation, bridging technical gaps and encouraging inter-country learning.
Focusing on the outputs and outcomes of Bank operations. Along with the new guidelines, an
innovative 10-page PCR format that focuses primarily on project outputs and outcomes was
introduced. This format has been instrumental in changing descriptive, process-centered
completion reports into analytical assessments of the Bank’s effectiveness at contributing to
country results. The change has allowed the AfDB to quantify and aggregate the outputs and
outcomes of its closed operations across countries and sectors.
2.5. The main purpose of the RMF is to foster flexible decision-making, encourage learning
through adaptation, and better allocate resources throughout the institution. Accomplishing these goals will improve results on the ground. Adapting existing reporting
systems and introducing new features to better trace results are not ends in themselves but are
rather the means to an end: making the Bank more effective at delivering products and
services to its RMCs. The essential change is a change in mindset: from centering on
programming inputs and then analyzing their likely results, to focusing on desired country
outcomes and then identifying the inputs, activities and project outputs needed to produce
those outcomes. As explained in Box 1, fostering a results-mindset or a ―culture of results‖
means creating an environment in which inquiry, candor, evidence and learning are seen as
essential to good management.

BANK GROUP RESULTS MEASUREMENT FRAMEWORK
5
III. A CORPORATE MANAGEMENT TOOL
3.1. The ―One Bank‖ RMF is a management tool to monitor the institution’s progress in executing
its Medium-Term Strategy 2008-2012. The Medium-Term Strategy defines the Bank’s
development goals and objectives, the outcomes necessary to attain them, and the principles
and instruments of engagement. Similarly, the Medium-Term Strategy describes the Bank’s
areas of sectoral focus, which are based on the Bank’s comparative advantage, and specifies
how the Bank can best use its instruments to carry out its mandate. From a results
perspective, the Medium-Term Strategy defines the strategic priorities with which all the
Bank’s operations, systems and business processes must be aligned, and on which all
results planning, management, monitoring and assessment frameworks must explicitly focus.
3.2. The new RMF is a comprehensive tool to understand how all the elements of the Medium-
Term Strategy (priority areas, principles, and instruments) are linked and how the work of
different departments and units transform these elements into a cohesive set of results.
Specifically, the new RMF:
allows users to assess consistency between strategic planning and operations;
permits users to check that operational areas (programs and projects at the regional
and country levels) are matched with the appropriate business processes
(procurement and human resources);
provides information with which staff can proactively monitor and assess
performance at all levels of the results chain; and
encourages the use of information about results to improve decision-making and
foster learning.
3.3. Management will ensure that key results areas at the Complex, Department and Division
levels are closely aligned with AfDB-wide priorities as reflected in the RMF. This will enable
the AfDB to mainstream informed decision making by regularly monitoring data on results
and assessing issues and lessons learned.
3.4. Because information about results informs key Management decisions, it needs to be
accurate. The Bank’s independent evaluation department (OPEV) will increasingly check the
Bank’s reporting at all levels to ensure the consistency and robustness of the data. Through
independent evaluation, OPEV enriches and contextualizes the information captured at all
levels of the RMF. OPEV selectively evaluates individual Bank operations to assess whether
the operations actually produced the intended results, whether the results were achieved
efficiently, and the extent to which the results led to the impacts desired. It also evaluates
operational practices and business processes to highlight areas of successful functioning and
areas in need of solutions.
IV. A COHESIVE VIEW OF BANK PROCESSES AND RESULTS
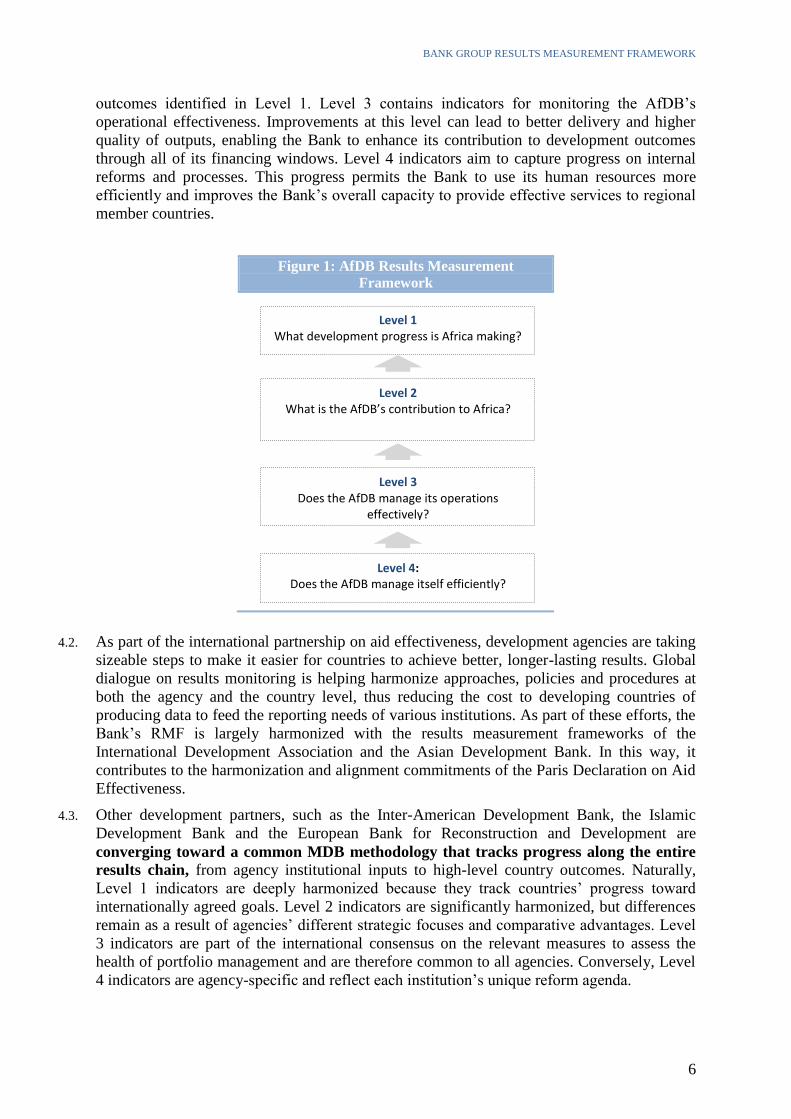
4.1. The RMF is organized into four levels that capture all the stages through which Bank
inputs are transformed into country results (Figure 1). Level 1 consists of indicators that
represent development outcomes to which the Bank is seeking to contribute in countries in
the region. These outcomes cannot be attributed to the AfDB alone; they result from the
collective action of countries and development partners. Tracking the outcomes is important,
however, because the outcomes indicate the development goals to which AfDB operations
aim to contribute. Level 2 contains indicators measuring the AfDB’s key sector outputs and
intermediate outcomes. They represent the AfDB’s tangible contribution to the development
BANK GROUP RESULTS MEASUREMENT FRAMEWORK
6
outcomes identified in Level 1. Level 3 contains indicators for monitoring the AfDB’s
operational effectiveness. Improvements at this level can lead to better delivery and higher
quality of outputs, enabling the Bank to enhance its contribution to development outcomes
through all of its financing windows. Level 4 indicators aim to capture progress on internal
reforms and processes. This progress permits the Bank to use its human resources more
efficiently and improves the Bank’s overall capacity to provide effective services to regional
member countries.
Figure 1: AfDB Results Measurement
Framework
4.2. As part of the international partnership on aid effectiveness, development agencies are taking
sizeable steps to make it easier for countries to achieve better, longer-lasting results. Global
dialogue on results monitoring is helping harmonize approaches, policies and procedures at
both the agency and the country level, thus reducing the cost to developing countries of
producing data to feed the reporting needs of various institutions. As part of these efforts, the
Bank’s RMF is largely harmonized with the results measurement frameworks of the
International Development Association and the Asian Development Bank. In this way, it
contributes to the harmonization and alignment commitments of the Paris Declaration on Aid
Effectiveness.
4.3. Other development partners, such as the Inter-American Development Bank, the Islamic
Development Bank and the European Bank for Reconstruction and Development are
converging toward a common MDB methodology that tracks progress along the entire
results chain, from agency institutional inputs to high-level country outcomes. Naturally,
Level 1 indicators are deeply harmonized because they track countries’ progress toward
internationally agreed goals. Level 2 indicators are significantly harmonized, but differences
remain as a result of agencies’ different strategic focuses and comparative advantages. Level
3 indicators are part of the international consensus on the relevant measures to assess the
health of portfolio management and are therefore common to all agencies. Conversely, Level
4 indicators are agency-specific and reflect each institution’s unique reform agenda.
Level 1
What development progress is Africa making?
Level 2 What is the AfDB’s contribution to Africa?
Level 3 Does the AfDB manage its operations
effectively?
Level 4: Does the AfDB manage itself efficiently?

BANK GROUP RESULTS MEASUREMENT FRAMEWORK
7
Level 1: What Development Progress is Africa Making?
4.4. The first level of the RMF tracks the region’s development progress through selected regional
outcomes to which AfDB contributes. These outcomes cannot be attributed to AfDB alone;
the Bank is one of many development partners that assist national governments in their
journey toward better development outcomes. No evidence suggests that any result achieved
at this level is the direct contribution of any given development partner. Indeed, country
results are undoubtedly in great part the product of a country’s will and determination to
develop. The Bank nevertheless monitors these developments as part of its results framework
because they provide a horizon for assessing the effectiveness of the Bank’s services to
RMCs.
4.5. Twenty-six country outcome indicators were retained to assess RMCs’ progress toward high-
level development results (Table 1). Aligned to the Bank’s current and future operational
priorities as summarized in the Medium-Term Strategy, the indicators cover the following
areas: (i) growth and poverty reduction; (ii) governance and transparency; (iii) regional
integration and trade; (iv) private sector development and the investment climate; (v)
infrastructure development; (vi) gender and human development; (vii) fragile and conflict-
affected countries; and (viii) clean energy. Most indicators are harmonized with the indicators
of the Bank’s development partners, having emerged through consensus within the
international development community.
4.6. Data reported on Level 1 of the RMF are provided by the Bank’s Statistical Department
(ESTA). Country and economy-wide data are usually collected periodically from special
evaluations, surveys and national sources that rely on pre-existing sources of data. Many
development partners specialize in the collection of specific themes or sectors. In the Bank,
ESTA systematizes and classifies these data before storing it in the Bank’s Data Platform.

BANK GROUP RESULTS MEASUREMENT FRAMEWORK
8
Table 1: Indicators for Development Outcomes in Africa (Level 1 of the Results
Measurement Framework)
*Gender-disaggregated data for all relevant indicators will be reported in the first Annual Development
Effectiveness Review (ADER).
Level 2: How Does the AfDB Contribute to Africa’s Development?
4.7. The AfDB contributes to development outcomes on the continent by financing operations and
providing technical assistance that respond to country needs. The Bank assesses its
contribution to country and regional outcomes by aggregating key outputs and intermediate
outcomes delivered to RMCs through its projects in all sectors of intervention.
4.8. In order to systematically track and report on the Bank’s contributions to development
outcomes in core priority areas, the Bank issued in May 2010 its Guidelines for the Use of
Core Sector Indicators, which established core indicators for all the Bank’s areas of
intervention (Table 2): (i) transport, power, and information communications technology; (ii)
I N D I C A T O R S *
B A S E L I N E
Year
African
Countries
of which
ADF
countries
Growth and Poverty Reduction
GDP per capita (2000 constant USD) 2009 896 405
Population living below $1.25/day (PPP) (%) 2005 51.4 53.6
Income Inequality (GINI Index) (%) 2005 42 42.1
Governance and Transparency
Public expenditure & financial assessment score (1 to 7) 2008 3.2 3.1
Worldwide governance indicators avg. score (-2.5 to 2.5) 2008 -0.8 -0.95
Extractive industries transparency index (% compliance) 2009 33.3 40.0
Regional Integration and Trade
Africa’s share of global trade (%) 2008 n.a 3.4
Inter African trade (Dollars billion) 2008 1,015 43
Private Sector Development and Investment Climate
Cost required for business start-up (% of GNI per capita) 2009 107.8 n.a
Time required for business start-up (days) 2009 40.8 n.a
Global competitiveness index ranking (1 to 7) 2009 3.6 3.4
Staple crops yield index (2002 value = 100) 2008 110 108
Infrastructure Development
Access to improved water source (% population) 2008 64.9 57.5
Access to all-season roads (% of rural population) 2006 43 35
Household electrification rate (% of households) 2008 40 28.5
Fixed lines & mobile phone subscribers (per 1,000) 2008 408 283
Internet users (per 1,000)
Access to improved sanitation facilities (% population)
2008
2008
67
41.0
42
28.2
Gender & Human Development
Under-five child mortality (per 1,000 live births) 2009 130 145
Ratio of girls to boys in primary and secondary school (%) 2007 87 86
Primary school completion rate (%)
Employment to population gender indicator (index)
Maternal Mortality (per 100000 live births)
2007
2007
2009
64
n.a.
677
54
0.74
813
Fragile and Conflict-Affected Countries
Average CPIA (Avg. CPIA) 2008 n.a 2.71
Number of Fragile Countries (CPIA<3.2) (countries) 2005 20 20
Clean Energy
Combustible renewable and waste (% of total energy) 2007 41.9 78.8

BANK GROUP RESULTS MEASUREMENT FRAMEWORK
9
water supply and sanitation; (iii) regional integration; (iv) climate change and clean energy;
(v) education, health and social protection; (vi) economic and financial governance; (vii)
private sector operations; and (viii) agriculture.
4.9. A significant number of CSIs will track gender-disaggregated data (see indicators in blue in
Table 2). Over the past few years, the Bank has stepped up its commitment to addressing
issues pertaining to the economic integration and development of women across all areas of
the portfolio. Like the actions of many other development partners, the Bank’s actions on
gender are evolving from focusing mainly on social sectors to considering gender
components in a growing number of areas. Thus, Level 2 gender-disaggregated indicators
span sectors such as transport, water, climate change and private sector development, as well
as the more traditional social sector. More importantly, because CSIs are tracked throughout
the project cycle, they will help mitigate a weakness that is common to the gender programs
of many of the Bank’s development partners: the fact that gender components receive
significantly more attention during the design of an operation than during its implementation
and supervision. Finally, by monitoring these RMF indicators, the Bank will be in a position
to report on its contribution to women’s empowerment by operational sector, subregion
and country of intervention.
4.10. CSIs are standardized indicators used in project logical frameworks (logframes) to measure
the most recurrent outputs and intermediate outcomes achieved through Bank operations.
Drawing upon best practice in comparable institutions, the Bank did not seek to describe all
of its contributions to development results but rather identified a limited number of
indicators. These indicators were selected by Sector Departments because they provide a
snapshot of their actual contributions to higher-level outcomes that they can match with
relevant data within a relatively short period of time, without setting up an array of complex
and resource-intensive data collection systems (Box 3).
Box 3: Using Sector Department’s Best Judgment on Measuring their own Results
CSIs were developed through an extensively participatory approach. Staff reviewed project appraisal reports,
PCRs and sector strategies of the last few years, with a view to compiling a long list of indicators that had
been most frequently used in Bank operations. Based on this list, task teams from each sector proposed a
shorter list of CSIs for Management’s consideration. Each list was then refined, agreed upon and endorsed by
Sector Directors in sectoral workshops in which all sector staff participated. Both the final list of indicators
and the present guidelines also reflect inputs from the Bank Economic Complex and OPEV. The CSIs thus
represent each sector’s best judgment of how to measure progress toward the development objectives of its
operations.
In choosing CSIs, Sector Departments were guided by three main considerations. First, CSIs had to be easy to
measure. Accordingly, CSIs represent a compromise between what the Bank would like to measure and what
the Bank can actually measure. Second, CSIs had to measure results that could be directly linked to concrete
Bank interventions. Finally, CSIs had to measure outputs and outcomes that corresponded to the Bank’s
operational priorities as articulated in its Medium-Term Strategy. The final set of CSIs therefore reflects both
feasibility of measuring and reporting, and each sector’s current strategic focus.
4.11. CSIs are subject to regular monitoring as part of project supervision. They are aggregated
across projects and countries to facilitate corporate reporting. While the Results Reporting
System (see section 5) is not yet operational, Sector Departments are already responsible for
tracking aggregate results at the sector level. They prepare a Sector Note on Results once a
year to compare programmed outputs and outcomes with actual results for all CSIs relevant
to their sector. This note is complemented by a Country Note on Results that is prepared by

BANK GROUP RESULTS MEASUREMENT FRAMEWORK
10
Regional Departments to assess progress toward Country Strategy Papers’ intended results.
Both notes will serve as the basis for reporting on the results of ongoing operations in the
new Annual Development Effectiveness Review described in section 5. They will be
completed with PCRs’ assessments of the results of closed operations.
Table 2: Bank Group Core Sector Indicators Level 2)
Transport, Power and Information Communications Technology
Households, businesses or community
facilities served with access to
modern/improved energy (number)
People that can access all season public
transportation within 2 km of their homes, of
which are female (number, percentage)
Traffic accidents and mortality along the
transport project (number per year)
Households, businesses or community
facilities served with access to information
technology (number)
Household expenditures devoted to energy
(monthly amount)
Household expenditures devoted to transport
(monthly amount)
Household expenditures devoted to
information technology (monthly amount)
Average speed for goods and for passengers
along the transport project, from origin to
end (km/h)
Roads constructed or rehabilitated, of which
are rural (km)
Roads in good and fair condition as a share
of total classified roads (percentage)
National citizens employed in the
construction, operation and maintenance of
the infrastructure project, of which are
female (number per month, percentage per
month)
Broadband networks built or rehabilitated
(km)
Non-renewable power output capacity (mw)
Water Supply & Sanitation
People with access to improved drinking
water sources, of which are female (number,
Percentage)
People with access to improved sanitation,
of which are female (number, Percentage)
Additional potable and non-potable (for
irrigation) water production capacity at a
community water point (liters)
New piped household water connections
(number)
Additional or rehabilitated sewage treatment
capacity (liters)
New household sewer connections (number)
New on-site sanitation measures (individual,
grouped) (number)
People educated through hygiene programs,
of which are female (number, percentage)
New collective bodies (committees,
associations, groups) formed to manage the
use of water responsibly of which include
women as members (number, percentage)
Regional Integration
Cross-border transmission lines constructed
or rehabilitated (number, km)
New telecommunication networks that serve
more than one country (number)
Cross-border railways constructed or
rehabilitated (number, km)
Time spent to clear a truck at the border
(minutes)
Cross-border roads constructed or
rehabilitated (number, km)
Amount of road maintenance needs financed
by the Bank (percentage)
Climate Change and Clean Energy
People trained in climate resilient
agricultural practices, of which are female
(number, percentage)
Agriculture-related climate resilient
interventions (number)
Railways constructed or rehabilitated (km)
Renewable power output capacity installed
(mw)
Surface of Forest protected, reforested or
rehabilitated (ha)
Education, Health and Social Protection
People employed in small scale and artisan
enterprises, of which are female (number,
Classrooms and laboratories constructed,
renovated, and/or equipped (number)

BANK GROUP RESULTS MEASUREMENT FRAMEWORK
11
percentage)
People enrolled in tertiary education, of
which are female (number, percentage)
People trained in basic microfinance and
business skills, of which are female (number,
percentage)
People served by micro-finance institutions,
of which are female (number, percentage)
Teachers trained as a result of project
intervention, of which are female (number,
percentage)
Health workers trained, of which are female
(number, percentage)
Health facilities constructed, renovated,
and/or equipped (number)
Economic & Financial Governance
Time to start a business (number of days)
Share of private sector credit to total credit
provided in the country (percentage)
Time it takes for an enterprise to pay taxes
(number of hours per year)
Time it takes for the Executive to submit the
Budget to the Legislature relative to the start
of the fiscal year (number of days)
Number of contracts awarded on the basis of
open competition as a percentage of all
contracts awarded in a given year (number,
percentage)
Time it takes for the Auditor General to
submit the most recent annual audit report
on the public accounts to the Legislature
(number of months)
Private Sector Operations
Permanent jobs created by the project
(number)
Value of the net financial flows to the
government
Share of female permanent employment
(percentage)
Rate of business success
Agriculture
Crop yield increase (tons/ha)
Land irrigated (hectares)
Post-harvest loss reduction (percentage)
People trained in the agricultural sector, of
which are female (number, percentage)
Crop production increase (tons)
Water mobilized for multi-purpose,
including water for agriculture (cubic
meters)
Note: Indicators in blue are gender-disaggregated
4.12. The increasing focus on results will require changes in the way the Bank approaches the
monitoring of its operations. At the project level, this will require an increase in the amount
of information collected and monitored. Inputs (contracts, disbursements) and outputs will
continue to be critical to project implementation, and the bulk of a Task Manager’s time is
expected to be taken up by traditional project administration. However, TMs are now also
being asked to monitor and track intermediate outcomes and to use that information in
supervision and completion reporting. The stronger focus on intermediate outcomes will
likely change the way monitoring data are collected. As monitoring increasingly focuses on
the changes projects have on beneficiary behavior, implementing agencies may need to turn
to third parties or to different instruments for information. For example, a road agency may
no longer just report on the length of roads being built but may need to monitor the effect the
roads have on potential beneficiaries (such as increases in the use of clinics and other social
services in urban areas). This would require the road agency to commission a survey or work
with other agencies to collect the necessary information. For the Bank, it will require: (i)
developing tighter partnerships with other development partners to ensure that each one
produces data based on comparative advantages; (ii) identifying champions within
Government that are willing to collect and use results information; and (iii) increasing the
level of investment in enhancing country monitoring and evaluation systems (Box 4).

BANK GROUP RESULTS MEASUREMENT FRAMEWORK
12
Box 4: Enhanced Monitoring and Evaluation in Projects
While the Bank is the first multilateral development bank to agree on a list of Core Sector Indicators for all
its sectors, it lags significantly behind other development partners in including solid monitoring and
evaluation (M&E) components in its lending operations. An analysis of 60 random projects approved by the
Board after 1 January 2008 shows that only 15 percent of operations had satisfactory M&E components.
Twenty eight percent of the sample had a budget line devoted to M&E. As part of its efforts to mainstream
results reporting in portfolio management, the Bank is committed to step-up its assistance to regional member
countries to upgrade their M&E capacity to international standards.
4.13. While the links between Levels 1 and 2 of the RMF can only be reported in specific
country settings, we can illustrate the mechanisms by which investments in Bank priority
areas contribute to country outcomes in general terms. Although many outcomes in Level 1
do not appear directly related to sectoral outputs in Level 2, AfDB operations contribute to
them indirectly. For example, AfDB’s water and sanitation and infrastructure interventions,
such as roads, help improve health.
Bank outputs and intermediate outcomes in transport contribute to: (i) improving
access to all-season roads; (ii) increasing inter-Africa trade; (iii) enhancing access to
education, especially for women and disadvantaged groups; and (iv) improving
access to health facilities, contributing, inter alia, to lower maternal and child
mortality.
Bank outputs and intermediate outcomes in energy help: (i) increase working hours
and therefore incomes through rural electrification; (ii) improve the functioning of
education and health facilities and their physical conditions: and (iii) develop clean
energy sources and combat climate change.
Bank outputs and intermediate outcomes in water supply and sanitation contribute
to: (i) improving access to clean water sources; (ii) raising agricultural productivity
and incomes, especially among poor farmers; and (iii) improving hygiene and
health, and helping combat diseases that affect children, thus reducing child
mortality.
Bank outputs and intermediate outcomes in education help: (i) enhance workers’
skills, raising productivity and individual incomes; (ii) reduce gaps in access to and
the quality of education, especially for women and the poor; and (iii) raise awareness
of good health and hygiene practices, especially for the benefit of mothers and their
children.
Bank outputs and intermediate outcomes in private sector development contribute to:
(i) promoting self-employment and micro-enterprises by giving the poor access to
credit; (ii) accelerating private-sector-led growth through better regulatory and legal
frameworks; and (iii) attracting investments to Africa, thus raising the continent’s
share of global trade.
4.14. Analyzing the links between Levels 1 and 2 of the RMF underscores the importance of
strategy: the overall effectiveness of each Bank’s country program will depend on the extent
to which all the projects and activities in its portfolio work together toward meeting the
objectives established in the Country Strategy Paper (CSP). That is, the vertical links between
the projects become operationally critical for the Bank’s effectiveness and must be the focus
of monitoring at the country level. CSPs provide the information required to contextualize
Bank results in order to get an accurate picture of the Bank’s actual contribution to
development in each RMC.

BANK GROUP RESULTS MEASUREMENT FRAMEWORK
13
4.15. Individual Bank operations deliver outputs and intermediate outcomes (or project outcomes)
that contribute to achieve CSPs’ intermediate outcomes (strategic outcomes) which in turn
lead to country outcomes. CSPs’ outcomes are different from country outcomes; technically
they are intermediate outcomes that measure the limited contribution of the Bank’s program
to the country’s long term development. Intermediate outcomes that bridge higher-level
outcomes and results directly produced through Bank interventions are needed both in
individual projects and in CSPs to close the gap often found between broad overall objectives
and specific Bank interventions. Although the list of CSIs presented above shows a limited
number of intermediate outcomes, all Bank operations are required to specify all the
intermediate outcomes that they intend to achieve.
Level 3: Does the AfDB Manage its Operations Effectively?
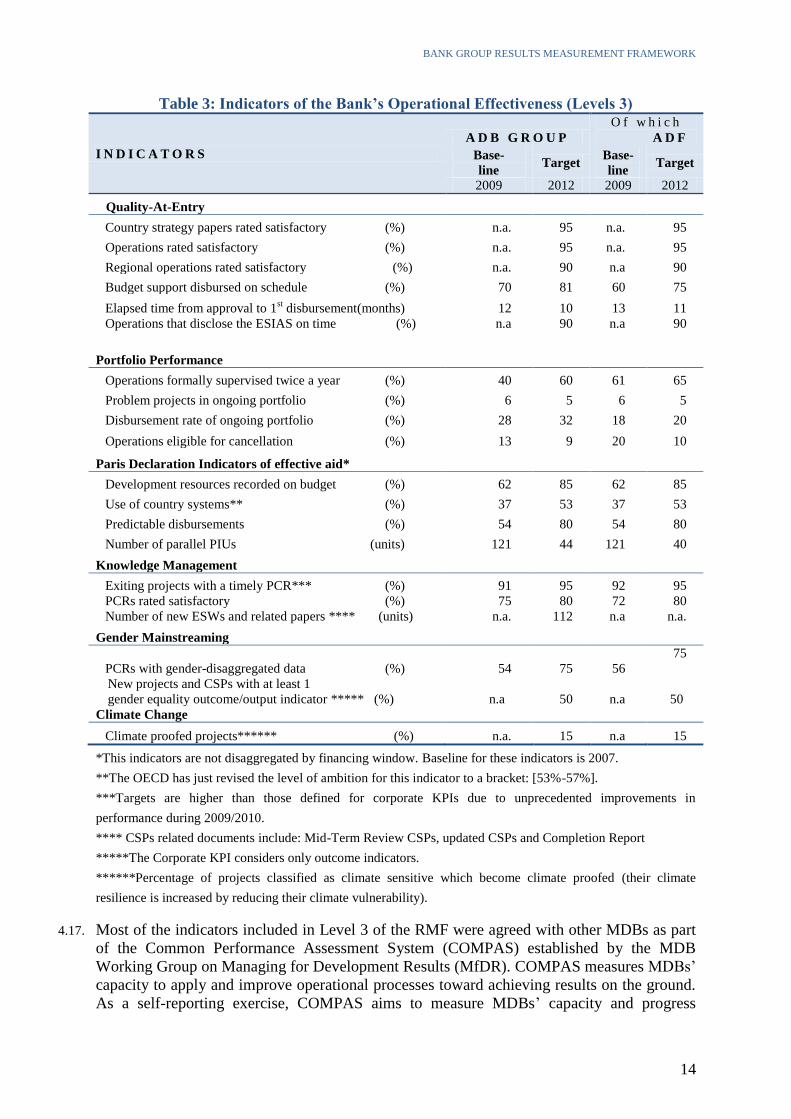
4.16. Measuring the outputs and intermediate outcomes of Bank operations is not enough to paint a
complete picture of the Bank’s contributions to development results. To do that, the RMF
must monitor the AfDB’s evolving capacity to manage for results. Managing operations
effectively is an important milestone in the Bank’s fulfillment of its mission. Adequate
portfolio management boosts the institution’s capacity to contribute to country
outcomes and raises the Bank’s overall development effectiveness. Level 3 of the RMF
measures operational performance through six categories (Table 3): (i) the quality-at-entry of
strategies and operations; (ii) portfolio performance; (iii) aid effectiveness; (iv) knowledge
management; (v) gender mainstreaming; and (vi) climate change. These indicators account
for project quality at time of entry, during implementation and at completion.
BANK GROUP RESULTS MEASUREMENT FRAMEWORK
14
Table 3: Indicators of the Bank’s Operational Effectiveness (Levels 3)
I N D I C A T O R S
A D B G R O U P
O f w h i c h
A D F
Base-
line Target
Base-
line Target
2009 2012 2009 2012
Quality-At-Entry
Country strategy papers rated satisfactory (%) n.a. 95 n.a. 95
Operations rated satisfactory (%) n.a. 95 n.a. 95
Regional operations rated satisfactory (%) n.a. 90 n.a 90
Budget support disbursed on schedule (%) 70 81 60 75
Elapsed time from approval to 1st disbursement(months) 12 10 13 11
Operations that disclose the ESIAS on time (%)
n.a
90
n.a
90
Portfolio Performance
Operations formally supervised twice a year (%) 40 60 61 65
Problem projects in ongoing portfolio (%) 6 5 6 5
Disbursement rate of ongoing portfolio (%) 28 32 18 20
Operations eligible for cancellation (%) 13 9 20 10
Paris Declaration Indicators of effective aid*
Development resources recorded on budget (%) 62 85 62 85
Use of country systems** (%) 37 53 37 53
Predictable disbursements (%) 54 80 54 80
Number of parallel PIUs (units) 121 44 121 40
Knowledge Management
Exiting projects with a timely PCR*** (%) 91 95 92 95
PCRs rated satisfactory (%)
Number of new ESWs and related papers **** (units)
75
n.a.
80
112
72
n.a
80
n.a.
Gender Mainstreaming
PCRs with gender-disaggregated data (%)
New projects and CSPs with at least 1
gender equality outcome/output indicator ***** (%)
Climate Change
54
n.a
75
50
56
n.a
75
50
Climate proofed projects****** (%) n.a. 15 n.a 15
*This indicators are not disaggregated by financing window. Baseline for these indicators is 2007.
**The OECD has just revised the level of ambition for this indicator to a bracket: [53%-57%].
***Targets are higher than those defined for corporate KPIs due to unprecedented improvements in
performance during 2009/2010.
**** CSPs related documents include: Mid-Term Review CSPs, updated CSPs and Completion Report
*****The Corporate KPI considers only outcome indicators.
******Percentage of projects classified as climate sensitive which become climate proofed (their climate
resilience is increased by reducing their climate vulnerability).
4.17. Most of the indicators included in Level 3 of the RMF were agreed with other MDBs as part
of the Common Performance Assessment System (COMPAS) established by the MDB
Working Group on Managing for Development Results (MfDR). COMPAS measures MDBs’
capacity to apply and improve operational processes toward achieving results on the ground.
As a self-reporting exercise, COMPAS aims to measure MDBs’ capacity and progress
BANK GROUP RESULTS MEASUREMENT FRAMEWORK
15
consistently by analyzing key performance indicators consolidated into a concise and
convenient format. COMPAS reports data on eight categories relevant to a given MDB’s
implementation of an improved MfDR agenda: country capacity to manage for development
results, country strategies, allocation of concessional resources, projects, institutional learning
from operational experience, results-focused human resource management, harmonization
among development agencies, and private sector operations. The Bank uses this information
to leverage improvements in its internal capacity and to support dialogue with other MDBs
regarding their MfDR achievements.
4.18. The processes monitored at this level directly affect the quantity and quality of outputs and
intermediate outcomes (Level 2) produced by the Bank and the Bank’s ultimate ability to
contribute to long-term country outcomes (Level 1). A few of these relationships are
described here:
The foundations of a project are laid during preparation, before the project enters the
portfolio. Operations with good quality-at-entry perform better at all stages of
the project cycle. Not only do they have adequate design features such as solid
logframes and clear alignment with Country Strategy Papers, they also tend to have
a strong task team, receive effective guidance and oversight from Regional and
Sector Managers, and benefit from the careful selection of peer reviewers who
provide substantive advice. As the single most important determinant of a project’s
flexibility and responsiveness to changing contexts, good quality-at-entry (Level 3)
significantly improves a project’s ability to deliver sustainable outputs and
intermediate outcomes (Level 2).
Supervision is a continuous process that involves the borrower, key stakeholders and
the Bank over the life of an operation, and plays a significant role in the operations’
ultimate success or failure. In uncertain contexts or in countries with administrative
capacity constraints, proactive supervision (Level 3) can enhance the likelihood
of achieving development objectives (Level 2) by paying timely attention to
contextual dimensions.
While quality-at-entry and supervision are important, they cannot achieve lasting
results on their own. For the Bank’s outputs to contribute to longer-term country
outcomes, individual operations must have synergies with other Bank
operations and the operations of other development partners. As explained
earlier, country outcomes are the collective product of multiple agencies and the
government. By honoring the Paris Declaration commitments (Level 3), such as
using country systems and conducting joint assessments and missions, the Bank
enhances the link of its sectoral results to longer-term country outcomes (Level 1).

BANK GROUP RESULTS MEASUREMENT FRAMEWORK
16
Box 5: Assessing Quality-at-Entry
The Readiness Review is emerging as the Bank’s key instrument for improving the quality-at-entry of its
operations and country strategies. During the pilot phase in 2009, 95 project documents (46 Project Concept
Notes and 49 Project Appraisal Reports) were subjected to Readiness Reviews. Working from the pilot’s
results, the Readiness Review was refined and rolled out to all operations in January 2010. In a similarly
phased approach, a Readiness Review is currently being developed for Country Strategy Papers for
deployment in early 2011.
The purpose of the Readiness Review is twofold. At the corporate level, the Readiness Review aims to report
and monitor quality-at-entry over time, making recommendations for further enhancement. At the level of
individual operations and Country Strategy Papers, the Readiness Review aims to enhance the results focus
and quality-at-entry of projects/programs by providing Country Teams with a structured set of comments and
ratings on each quality dimension. Readiness Reviews are undertaken for both concept and appraisal stages,
and focus on generic quality and design issues, thereby complementing the technical Peer Review.
Level 4: Does the AfDB Manage Itself Efficiently?
4.19. Among the many factors that affect the Bank’s achievement of long-term results at the
country level, internal performance management plays an important role. Strengthening the
monitoring and the management of the AfDB’s internal performance—performance over
which it has direct control and for which it is fully accountable—is fundamental to enhancing
the Bank’s contribution to country-level results. Level 4 monitors indicators in five areas
(Table 4): (i) human resources; (ii) business process and practices; (iii) information
technology; (iv) decentralization; and (v) transparency. These indicators are a tool for
ensuring coherence between the AfDB’s intended contributions to long-term country
outcomes, and its management of its budget, its human resources, and its internal processes
and policies. Baselines and targets for Level 4 are only applicable to the Bank Group as a
whole and do not require disaggregation by financial window.
4.20. These indicators aim at measuring the Bank’s efficiency in its use of its internal resources
and in the reforms considered essential to maintaining the institution’s ability to remain a
relevant, results-oriented institution on the continent. Some of the links between
organizational efficiency and results are illustrated further:
While a motivated and committed workforce is one of the most important
determinants of good institutional performance, it is also important to ensure that
streamlined business processes and quality internal services (Level 4) allow staff to
reduce the time they spend on administrative tasks so that they can focus more on
delivering sectoral outputs (Level 2).
Boosting the Bank’s capacity to deliver outputs and intermediate outcomes (Level 2)
also requires that the right combination of staff is available both at Headquarters and
at the country level (Level 4). According to a 2009 OPEV evaluation, one of the
emerging trends of a strengthened field presence and the progressive shifting of
decision making to Field Offices (Level 4) is better portfolio performance
(Level 3).

BANK GROUP RESULTS MEASUREMENT FRAMEWORK
17
Table 4: Indicators of the Bank’s Institutional Efficiency (Levels 4)
I N D I C A T O R S
B A S E -
L I N E T A R G E T
2009 2012
Human Resources
Staff premature attrition rate (%) 11 6
Share of women in professional staff (%) 26 33
Vacancy rate (%) 12.3 5
Operational professional staff (%)
62
65
Business Processes and Practices
Lapse of time for bidding completion (weeks) 63 40
Lapse of Time for procurement *
(months) 15.9 11
Administrative costs per UA 1 million disbursed (UA thousands)
109
93
Information technology
Time of unavailability of Wide Area Network in Field Offices
(hrs) 175 150
Average time taken to resolve client IT requests (hrs)
5
4.5
Decentralisation
Operations Professional staff based in field offices (%) 26 40
Projects task managed from field offices (%)
16
35
Transparency
Project audits submitted on time
(%)
n.a
80
*Baseline is 2008.
V. STREAMLINING RESULTS REPORTING
5.1 Corporate reporting is critical for informing shareholders and stakeholders about progress on
the agenda and for sustaining Management’s attention and institutional follow-through.
Reporting from numerous sources and at different times does not provide the AfDB’s Board,
Management, staff or stakeholders with a coherent and comprehensive understanding of the
AfDB's development effectiveness. Nor does it allow for timely remedial action when the
active portfolio is not contributing to programmed outputs and outcomes. To unify results
reporting across the institution, Management proposes to prepare a new Annual Development
Effectiveness Review (ADER) to be presented to the Board on an annual basis. A summary
of the ADER, the Results Scorecard, will present cumulative progress toward results to the
Senior Management Coordination Committee on a quarterly basis, with a copy to the Board
for information. In addition, quantitative reporting on operational results will be
complemented with qualitative Results Briefs for areas of growing strategic importance. This
consolidation treats results planning and monitoring as part of a continuum, as described in
paragraph 2.1.

BANK GROUP RESULTS MEASUREMENT FRAMEWORK
18
Box 6: Helping Managers Manage Better
When explaining the role of the Bank’s Results Measurement Framework, it is paramount to stress the
importance of management over reporting. The fundamental goal of the Results Measurement Framework is
to improve the Bank’s development effectiveness, which requires helping managers to manage better.
Tracking progress on the Results Measurement Framework aims at enhancing the cycle of planning,
encouraging periodic performance monitoring and fostering organizational learning. Although still very
important, increasing accountability and improving external reporting are not the central purpose of this
exercise.
5.2 The proposed streamlined reporting mechanisms have the following advantages:
Simplicity, because a single reporting system will monitor the corporate-level results
of operations funded by both the AfDB and the ADF (with regard to monitoring the
ADF, only data related to ADF countries will be presented to ADF Deputies);
Coherence, because the reporting will be organized around the institutional priorities
described in the Medium-Term Strategy and summarized in the RMF;
Logic, because they allow for a more comprehensive explanation of the results chain
that flows from institutional reforms to operational performance and eventually to
country outcomes;
Harmonization, because they adopt the reporting practices of other MDBs and share
a large number of indicators with the Asian Development Bank and the International
Development Association; and
Proactivity, because they focus on early recommendations to correct actions and
deliver outputs in a timely and efficient manner.
Annual Development Effectiveness Review (ADER)
5.3 The ADER will be the AfDB Group’s primary corporate results reporting tool. The ADER
acts as a milestone report on the AfDB’s commitment to managing for development results
and increasing its accountability on results to stakeholders and the public at large. The ADER
will annually assess the AfDB’s operational performance and progress toward results for all
operations financed by the Bank Group in the context of the baselines and targets established
in the Bank’s RMF. At the same time, it will provide a qualitative account of the progress
made in instilling a results culture across the institution.3 Where relevant, it will also illustrate
the significant achievements of a few RMCs in their path toward a better quality of life.
Based on this assessment, the ADER will identify key challenges and possible time-bound,
monitorable solutions. Progress on implementing these solutions is reported on the Results
Scorecard described in paragraphs 5.12 to 5.16.
5.4 The RMF is the centerpiece of the ADER, which analyzes progress in implementing the RMF
(Figure 2). Using the RMF enables Management to focus on results areas that the AfDB and
its shareholders have identified as priorities. The report targets operational performance for
the last calendar year and cumulative outputs and outcomes for the past three calendar years.
Wherever needed, it draws on past trends and the AfDB’s experiences to explain current
performance.
3 Coordination will be pursued with the Staff Survey to ensure that if relevant information is available through
the survey, it will be analyzed and referenced in the ADER.

BANK GROUP RESULTS MEASUREMENT FRAMEWORK
19
5.5 In line with the Bank’s RMF, the ADER begins by reviewing Africa’s progress toward its
key development objectives as a means to contextualize its review of the AfDB’s
performance. The ADER then assesses the AfDB’s contributions to development results by
asking three key questions. First, what are the AfDB’s key operational outputs and
intermediate outcomes and how are they contributing to specific country outcomes? (Level 2
of the RMF). Second, is the AfDB becoming more effective at delivering outputs that result
in specific country outcomes? (Level 3 of the RMF). Finally, is the AfDB becoming more
efficient in managing itself to improve its operational effectiveness? (Level 4 of the RMF).
Figure 2 : Coverage of ADER
5.6 Thirdly, the ADER proposes a set of time-bound, practical and monitorable recommendations
and assigns responsibility for their implementation. ADER recommendations cover all four
levels of the RMF and are the product of extensive consultations with relevant units and
departments.
5.7 Fourth, the ADER proposes enhancements of the RMF when needed, to be incorporated
in the next calendar year. The process of producing the ADER gives the Bank an
opportunity to review the RMF with an eye on improving subsequent reporting. Management
will carefully review the selected indicators at all four levels, as well as assess the realism of
targets, after one year. As the Bank strengthens its data collection practices and increases its
investment in solid M&E frameworks, additional indicators will be considered to provide a
more complete picture of Bank contributions to development. The RMF’s usefulness depends
on its flexibility to provide Management with the relevant information in changing contexts.
5.8 Level 3 of the RMF poses the question of effective operational performance. It will provide a
detailed description of the Bank’s active portfolio, portraying both areas of underperformance
and of significant improvement over previous years. It will analyze the reasons why the Bank
Group’s active portfolio does or does not perform well. To do so, it will be based on deeper
dialogue with Sector and Regional Departments. By treating portfolio performance as one
stop in the journey towards country results, the new ADER will highlight bottlenecks,
strategic misalignments, and implementation shortcomings requiring immediate
Management attention. The new ADER’s main purpose is to make results reporting a tool
Level 1
Country progress on growth, poverty
Level 2 Sector outputs and intermediate outcomes
Level 3 Quality, knowledge, aid effectiveness,
operational management
Level 4: Money, people, processes

BANK GROUP RESULTS MEASUREMENT FRAMEWORK
20
to manage the portfolio better by offering timely solutions to the challenges it identifies.
Careful attention will be given to rationalizing the scope and purpose of the Bank’s different
reporting tools —including the Annual Portfolio Performance Review and the Annual
Report— so as to avoid unnecessary duplication.
5.9 Finally, the ADER will include a summary of external views on Bank performance.
Recent external assessment efforts are the United Kingdom’s Department for International
Development’s Multilateral Effectiveness Framework and the Multilateral Organizations’
Performance Assessment Network (MOPAN). ADER will summarize the main findings of
these reports –when available- and provide a set of time-bound actionable recommendations
to address the main shortcomings identified in Bank performance.4
5.10 The ADER will be prepared by the Quality Assurance and Results Department (ORQR) for
submission to the Board before the Annual Meetings. Prior to submission to the Board, the
ADER will be cleared by the Senior Management Coordination Committee, especially with
regard to endorsing recommendations and changes to the RMF’s structure, indicators or
targets. As described in sections 3 and 4 of this document, OPEV, the Economics Complex,
Sector Departments and Regional Departments will provide and validate the data used for
this annual reporting exercise.
5.11 The Bank will disclose the ADER by posting it on its external website within a week of the
close of the Annual Meetings.
Results Scorecard (RS)
5.12 The Results Scorecard (RS) will be a summary of key management indicators contained in
the RMF that will be produced quarterly for discussion at the Operations Committee and the
Senior Management Coordination Committee. Balanced scorecards are the most widely
applied performance management tool in the development community and beyond. The
usefulness of the tool lies in its ability to enable the Bank to align all levels of MfDR around
a single set of monitoring indicators.
5.13 The RS will use a traffic light system to summarize progress toward achieving the targets of
the RMF. It will provide a quarterly update on Levels 2, 3 and 4 (Figure 3). It neither
elaborates on a specific area of achievement nor does it provide substantial quantitative
updates on each area. The purpose of the RS is to highlight areas of the RMF where the Bank
is not on track so that specific and timely remedial action can be taken. For areas highlighted
as red, the RS succinctly describes challenges and identifies solutions. Remedial actions are
reported on the RS of the following quarter.
5.14 The RS will have four sections. Section 1 consists of a two-paragraph success story that took
place at level 2, 3 or 4 of the RMF (e.g., a significant increase in education outputs, a steady
improvement in the use of country systems, faster hiring). Section 2 uses the traffic light
system to provide an update on Levels 2 to 4 (Figure 3). Section 3 provides explanations and
recommendations of areas requiring immediate action. Section 4 uses a matrix to update
readers on the actions agreed in the previous ADER and the RS.
4 For the publication of the second ADER onwards, the Bank will assess the possibility of carrying-out a client
survey in a selected group of regional member countries.

BANK GROUP RESULTS MEASUREMENT FRAMEWORK
21
Figure 3: Coverage of the Bank’s Results Scorecard
LEVEL LIGHT
Contributions to results
1 Outputs
2 Intermediate outcomes
Operational effectiveness
3 Quality at entry
4 Portfolio performance
5 Aid effectiveness
6 Gender mainstreaming
Operational efficiency
7 Human resources
8 Business processes
9 Decentralization
5.15 The traffic light system shown in Figure 3 is simple and will be piloted with an eye toward
greater sophistication. Each of the three levels and nine sublevels receives a green light when
performance is on track, an amber light when performance requires attention, and a red light
when performance is off track.
5.16 ORQR submits the RS to the Senior Management Coordination Committee by the second
week of each quarter, reporting on the previous quarter. Adequate consultation is pursued
with relevant departments explaining areas of poorer performance.
Results Briefs (RB)
5.17 The reporting mechanisms described above primarily provide quantitative information on
progress towards results. For areas of growing strategic importance, such as governance,
fragile states, climate change, gender, ROs and private sector development, the Bank will
produce Results Briefs (RB) that offer a more qualitative explanation of the link
between Bank deliverables and long-term country results. RBs will use case studies to
illustrate the links between levels 1 and 2 of the results measurement framework. The new
RBs will also address some of the limitations of the output and intermediate outcome
aggregation approach and will paint a more complete and nuanced picture of the results of
Bank operations in selected areas.
5.18 The preparation of results briefs will be coordinated by ORQR. Sector and Regional
departments are responsible for identifying suitable case studies, gathering materials, drafting
key messages and identifying lessons.
Results Reporting System (RRS)
5.19 The Bank intends to implement an automated Results Reporting System (RRS) that will link
expected results (as per the logical frameworks in Project Appraisal Reports) to progress
toward results (as documented in supervision reports) and results achieved (as reported in
Project Completion Reports). As shown in Table 5, the system will provide managers with a
real-time view of their portfolio and their progress toward results.
5.20 The RRS is a unified platform that will provide real-time information on outputs and
intermediate outcomes achieved through Bank operations so that Management can

BANK GROUP RESULTS MEASUREMENT FRAMEWORK
22
periodically assess progress toward programmed results. Operating through a dashboard,
the system allows managers to filter data by variables (financing window, financing
instrument, subregion, country and sector) that fit their information needs. This
flexibility suits the Bank’s reporting needs for different reasons. It allows Senior
Management to generate ADF-only data across relevant levels of the RMF for the purpose of
reporting to ADF deputies. It allows Sector Directors to analyze aggregate sector results and
track strategic sector performance. It allows Regional Directors to both focus on results for
individual countries and have an aggregate view of the region of their competence. Finally, it
allows stakeholders at large to have a simple, aggregate overview of the Bank Group’s main
contributions to development.
Table 5: Objectives of the Results Reporting System
OBJECTIVE
I
USER-FRIENDLY WEB-BASED INTERFACE
1.1. Develop a user-friendly web-based interface that records details of the logical
framework, the Project Supervision Report, and the Project Completion Report
1.2. Record and store information into a database on Core Sector Indicators
throughout the project cycle
OBJECTIVE
II
DASHBOARD REPORTING
1.3. Develop a dashboard to give Task Managers a real-time view on the project
process
1.4. Alert Management to projects that are overrunning their planned dates and
deliverables
OBJECTIVE
III
WORK FLOW AND TRACKING
1.5. Automate the tracking and approval of project documents through a work-flow
system
1.6. Implement various alerting mechanisms to track and reduce timeframes in the
project implementation process
5.21 The RRS does not only coalesce the information necessary to report on all four levels of the
RMF, it also closes an important information gap: it provides information on outputs and
intermediate outcomes achieved through Bank operations that is not stored in any of
the Bank’s existing databases. This is true for most development agencies, which have
collaborated to identify information system solutions with increasing frequency in recent
years. This refinement on the part of the RRS increases the Bank’s ability to track the
performance of specific operations and areas:
Gender. The RRS will be able to disaggregate data on country results (Level 1) and on
the Bank’s contribution to results (Level 2) by gender. Level 2 gender-disaggregated
indicators span sectors such as transport, water, climate change, and private sector
development, as well as the more traditional social sector. These indicators can be further
disaggregated by subregion and country of intervention. In addition, one indicator will be
tracked at Level 4 to monitor the Bank’s own effectiveness in attracting and maintaining a
diversified workforce that includes a significant number of women in professional
positions.
Regional Operations. The RRS will be able to provide data on country results (Level 1),
on the Bank’s contributions to results (Level 2), and on portfolio performance (Level 3),

BANK GROUP RESULTS MEASUREMENT FRAMEWORK
23
both for single country operations and for ROs. While the Bank’s statistical databases
monitor Africa’s progress to greater regional integration through a few key indicators
(Level 1), the Bank’s contribution to this progress has not been systematically recorded
(Level 2). The inclusion of a dedicated set of CSIs for ROs will allow the RRS to isolate
the outputs and outcomes of ROs and generate a better understanding of their
contributions to development. In addition, the RRS will provide more accurate
information about the portfolio performance of ROs. The current version of the Bank’s
SAP system can only track performance for each country participating in a RO, not for
the project as a whole. This deficiency has contributed to inaccurate assessments of these
types of operations and has diminished the impact of Management recommendations to
improve their performance.
Private Sector Operations. Another milestone in the shift toward a single cohesive
measurement and reporting system for all Bank operations is the RRS’s ability to track
the performance of the Bank’s private sector operations. The RRS will be able to generate
reports that describe Africa’s progress toward creating conducive environments for
private sector participation (Level 1), to identify the Bank’s key contributions to that
progress (Level 2), and to measure the effectiveness of the Bank’s private sector portfolio
in delivering outputs and outcomes as planned (Level 3). Although the Bank has selected
a limited number of CSIs to track its contributions to private sector development as part
of the RMF, a more comprehensive set of development outcome indicators are closely
followed by the institution’s ex-ante Additionality and Development Outcome
Assessment. Finally, the RRS will be able to integrate private sector results (Level 2) and
portfolio performance (Level 3) into the rest of the Bank’s statistics, providing a
complete, aggregate description of all Bank-financed operations.
Policy-Based Operations. In line with the features described for private sector
operations, the possibility of both isolating the results of policy-based operations and
subsuming their performance under a more aggregate picture of Bank results is another
attribute of the RMF and the RRS. Because the vast majority of the Bank’s policy-based
operations are delivered to strengthen economic and financial governance, indicators that
track the Bank’s contribution to good governance are a proxy to measure the most
recurrent contribution of policy-based operations to country results. The Bank is the first
MDB to develop dedicated CSIs for Governance, and lessons from its use will help the
Bank and other partners to refine this difficult area of results reporting.
Fragile States. The RMF tracks how the Bank contributes to sector results at the country
level through a variety of lending instruments. Disaggregating results and performance
for a group of countries, such as fragile states, will be possible at all levels of the RMF
once the RRS is operational.
5.22 An early prototype of the RRS was presented to ADF Deputies in October 2009; a fully
functional database will be up and running by 2011.
VI. CONCLUSION
6.1. This paper has described the consolidated Results Measurement Framework of the African
Development Bank Group. The proposed RMF is expected to strengthen operations’ focus on
key results of development effectiveness, culminating in a process that began with the Bank’s
formulation of its Medium-Term Strategy. The RMF’s distinctive inclusion of a
comprehensive set of measures of organizational and operational effectiveness is expected to
promote a stronger culture of results within the institution.

BANK GROUP RESULTS MEASUREMENT FRAMEWORK
24
6.2. The Bank will streamline its results reporting practices to provide a cohesive account of the
institution’s contribution to country level outcomes. The ADER will provide an annual
account of the Bank’s progress at all four levels of the RMF. The Results Scorecard will give
Management summary information on progress toward results on a quarterly basis,
principally monitoring recommendations to improve the Bank’s ability to manage for
development results. The RBs will use case studies to illustrate the links between Bank
deliverables and country results. The inaugural ADER will be published by the end of Q1
2011and launched at the 2011 Annual Meetings. The first RS will be published in Q1 2011.
The inaugural RBs will be published in Q4 2011.