bank of america 4q18 financial results · provision for credit losses. 3.3. 3.4 (3) 3.4 (3) pretax...
TRANSCRIPT
January 16, 2019
Bank of America 4Q18 Financial Results
2018 vs. 2017
% Inc / (Dec)
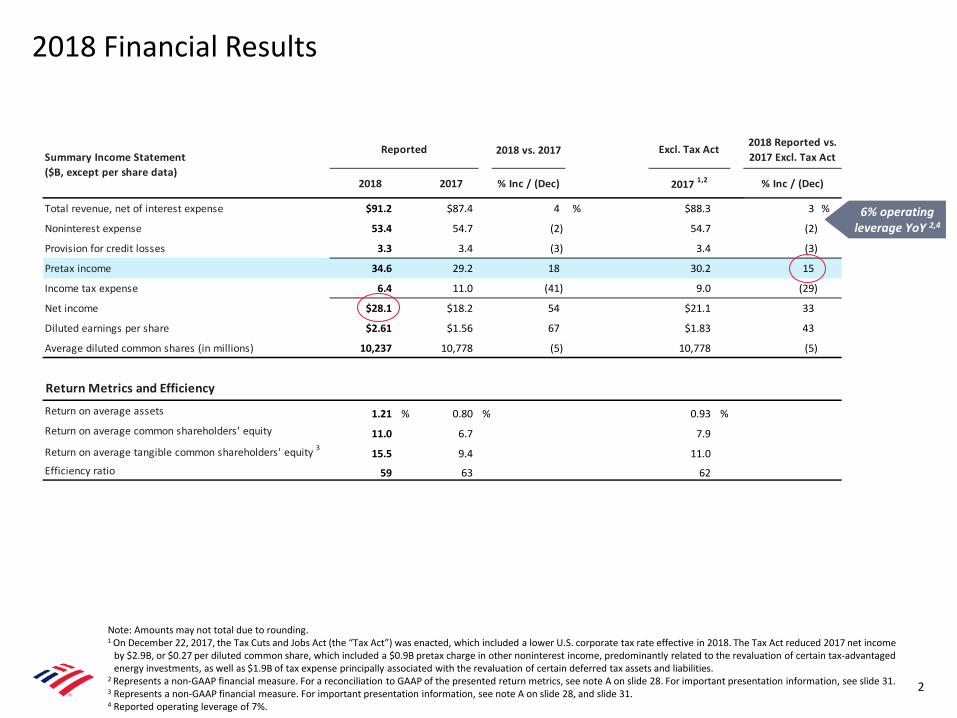
Total revenue, net of interest expense $91.2 $87.4 4 % $88.3 3 %
Noninterest expense 53.4 54.7 (2) 54.7 (2)
Provision for credit losses 3.3 3.4 (3) 3.4 (3)
Pretax income 34.6 29.2 18 30.2 15
Income tax expense 6.4 11.0 (41) 9.0 (29)
Net income $28.1 $18.2 54 $21.1 33
Diluted earnings per share $2.61 $1.56 67 $1.83 43
Average diluted common shares (in millions) 10,237 10,778 (5) 10,778 (5)
Return Metrics and Efficiency
Return on average assets 1.21 % 0.80 % 0.93 %Return on average common shareholders' equity 11.0 6.7 7.9
Return on average tangible common shareholders' equity 3 15.5 9.4 11.0Efficiency ratio 59 63 62
2018 Reported vs. 2017 Excl. Tax ActSummary Income Statement
($B, except per share data)
Reported Excl. Tax Act
2017 1,22018 2017 % Inc / (Dec)
2018 Financial Results
2
Note: Amounts may not total due to rounding.1 On December 22, 2017, the Tax Cuts and Jobs Act (the “Tax Act”) was enacted, which included a lower U.S. corporate tax rate effective in 2018. The Tax Act reduced 2017 net income
by $2.9B, or $0.27 per diluted common share, which included a $0.9B pretax charge in other noninterest income, predominantly related to the revaluation of certain tax-advantaged energy investments, as well as $1.9B of tax expense principally associated with the revaluation of certain deferred tax assets and liabilities.
2 Represents a non-GAAP financial measure. For a reconciliation to GAAP of the presented return metrics, see note A on slide 28. For important presentation information, see slide 31.3 Represents a non-GAAP financial measure. For important presentation information, see note A on slide 28, and slide 31. 4 Reported operating leverage of 7%.
6% operating leverage YoY 2,4

$7.2
$2.8
$5.7
$3.8
($1.7)
$8.2
$3.1
$7.0
$3.3
($0.4)
$12.0
$4.1
$8.2
$4.0
($0.1)
Consumer Banking GWIM Global Banking Global Markets All Other
2016 2017 2018
Full Year Business Results 1
3
Net Income (Loss) ($B)
FY 2018 Consumer Banking GWIM Global Banking Global Markets
ROAAC 3 33% 28% 20% 11%
Efficiency ratio 47% 71% 44% 67%
Operating leverage 9% 2% (2%) 1%
2
1 All business segments and All Other are presented on a fully-taxable equivalent (FTE) basis throughout this presentation.2 All Other adjusted to exclude the $2.9B charge for the 2017 enactment of the Tax Act. Reported net loss for All Other for FY 2017 was $3.3B.3 ROAAC defined as return on average allocated capital.4 Global Banking revenue and operating leverage were negatively impacted by the Tax Act in 2018. Excluding tax reform impact on revenue in 2018, operating leverage for Global
Banking was 2%.
4
4
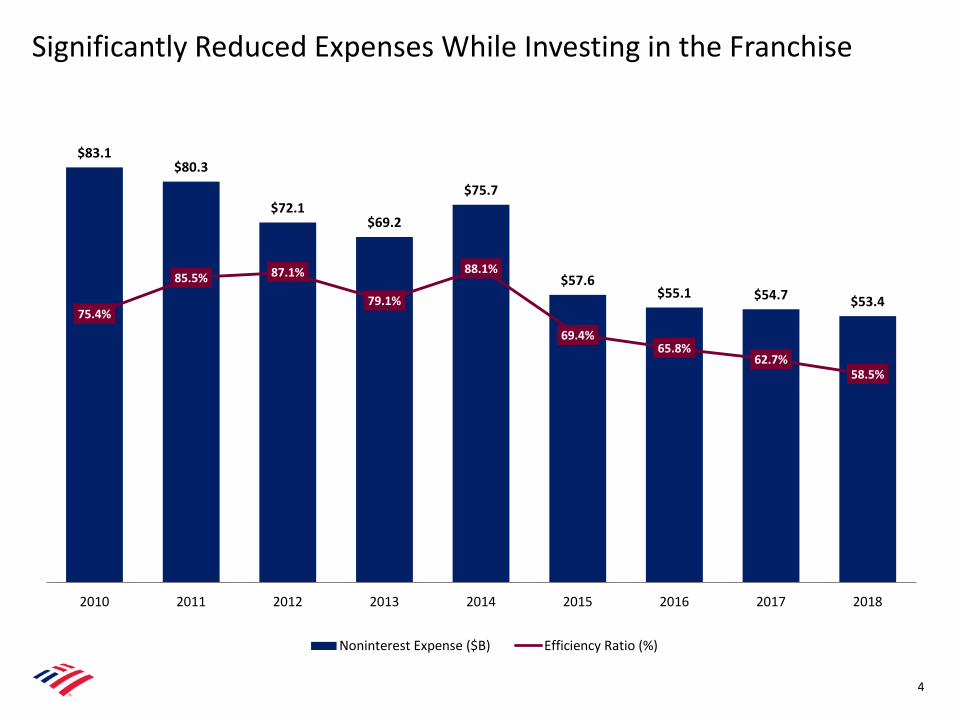
Significantly Reduced Expenses While Investing in the Franchise
$83.1$80.3
$72.1$69.2
$75.7
$57.6$55.1 $54.7 $53.4
75.4%
85.5% 87.1%
79.1%
88.1%
69.4%65.8%
62.7%58.5%
2010 2011 2012 2013 2014 2015 2016 2017 2018
Noninterest Expense ($B) Efficiency Ratio (%)

5
Delivered Positive Operating Leverage for 16 Consecutive Quarters
Note: Amounts may not total due to rounding.1 Operating leverage calculated as the year-over-year percentage change in revenue, net of interest expense, less the percentage change in noninterest expense. Quarterly expense
for 2017 and 2016 has been restated to reflect the accounting change for retirement-eligible equity incentives adopted in 4Q17; 2015 and 2014 periods are as reported.2 Revenue growth and operating leverage adjusted to exclude the $0.9B noninterest income charge in 4Q17 from the Tax Act; represents a non-GAAP financial measure. For
important presentation information, see slide 8, Note A on slide 28, and slide 31.
(7%)
(5%)
(2%)
1%
(3%)
1%
3%2%
7% 7%
1%
7%
4%
(1%)
4%
6%
(29%)
(25%)
(31%)
(2%)
(10%)
(2%) (1%)
(4%)
(1%)
2%
(2%)(1%) (1%)
(5%)
(2%)(1%)
1Q15 2Q15 3Q15 4Q15 1Q16 2Q16 3Q16 4Q16 1Q17 2Q17 3Q17 4Q17 1Q18 2Q18 3Q18 4Q18
YoY revenue growth (decline) YoY expense growth (decline) Operating leverage
Operating Leverage Trend 1
+22% +21% +29% +3% +8% +3% +5% +6% +8% +6% +3% +8% 2
Reported revenue growth of 2% and
operating leverage of 3%
+5% +4% +7% +7% 2
Reported revenue growth of 11% and operating leverage
of 12%

Quarterly Net Interest Income ($B)
$1,156$1,223
$1,270$1,315
$1,000
$1,200
$1,400
2015 2016 2017 2018
Total Average Deposits ($B)
Growth in NII Driven by Rates as well as Client Activity
6
CAGR+4%
Average Loans and Leases in Business Segments ($B) 1
$732$792
$836$872
$600
$800
$1,000
2015 2016 2017 2018
CAGR+6%
$9.5
$10.0
$10.5
$11.0
$11.5
$12.0
$12.5
1Q 2Q 3Q 4Q
2015 2016 2017 2018
FY18 $47.4B
FY17 $44.7B
FY16 $41.1B
FY15 $39.0B
Note: Amounts may not total due to rounding. 1 Loans in Business Segments exclude loan balances in All Other of $61B, $82B, $109B and $145B for 2018, 2017, 2016 and 2015, respectively. Total loans and leases were $933B,
$919B, $900B and $877B for 2018, 2017, 2016 and 2015, respectively.
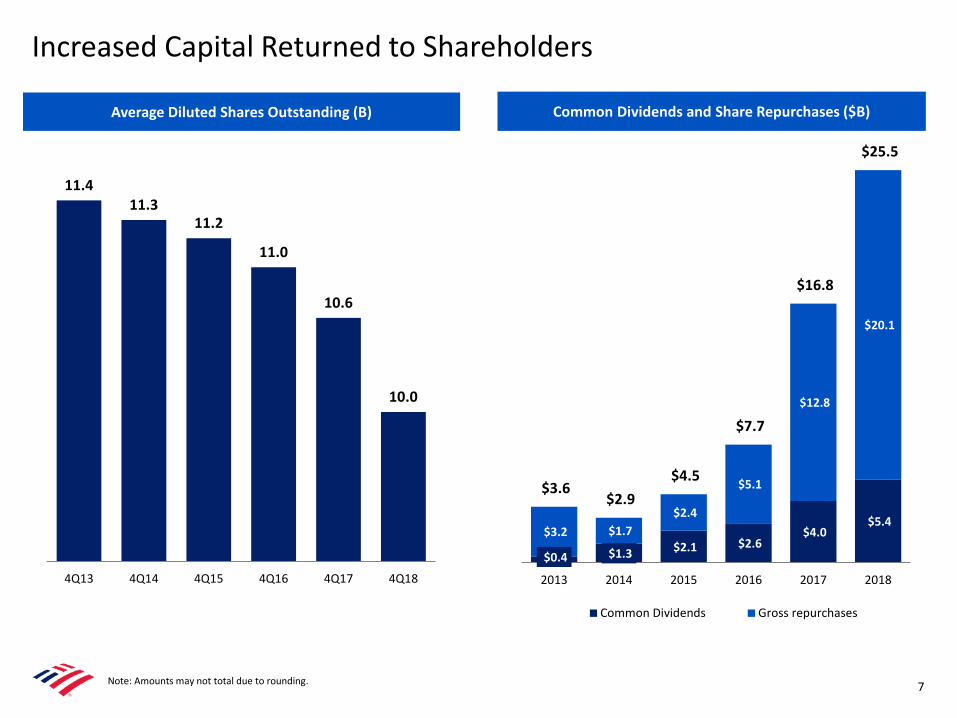
Increased Capital Returned to Shareholders
$0.4 $1.3 $2.1 $2.6 $4.0
$5.4 $3.2 $1.7
$2.4
$5.1
$12.8
$20.1
$3.6 $2.9
$4.5
$7.7
$16.8
$25.5
2013 2014 2015 2016 2017 2018
Common Dividends Gross repurchases
Common Dividends and Share Repurchases ($B)Average Diluted Shares Outstanding (B)
11.411.3
11.2
11.0
10.6
10.0
4Q13 4Q14 4Q15 4Q16 4Q17 4Q18
7Note: Amounts may not total due to rounding.

4Q18 Financial Results
8
4Q18 vs. 4Q17
% Inc / (Dec)
Total revenue, net of interest expense $22.7 $20.4 11 % $21.4 6 %
Noninterest expense 13.1 13.3 (1) 13.3 (1)
Provision for credit losses 0.9 1.0 (10) 1.0 (10)
Pretax income 8.7 6.2 41 7.1 22
Income tax expense 1.4 3.8 (63) 1.9 (24)
Net income $7.3 $2.4 208 $5.3 39
Diluted earnings per share $0.70 $0.20 250 $0.47 49
Average diluted common shares (in millions) 9,996 10,622 (6) 10,622 (6)
Return Metrics and Efficiency
Return on average assets 1.24 % 0.41 % 83 bps 0.90 %Return on average common shareholders' equity 11.6 3.3 828 7.8
Return on average tangible common shareholders' equity 3 16.3 4.6 1,173 10.9Efficiency ratio 58 65 (719) 62
4Q18 Reported vs. 4Q17 Excl. Tax ActSummary Income Statement
($B, except per share data)
Reported Excl. Tax Act
4Q17 1,24Q18 4Q17 % Inc / (Dec)
Note: Amounts may not total due to rounding.1 Enactment of the Tax Act reduced 4Q17 net income by $2.9B, or $0.27 per diluted common share, which included a $0.9B pretax charge recorded in other noninterest income,
predominantly related to the revaluation of certain tax-advantaged energy investments, as well as $1.9B of tax expense principally associated with the revaluation of certain deferred tax assets and liabilities.
2 Represents a non-GAAP financial measure. For a reconciliation to GAAP of the presented return metrics, see note A on slide 28. For important presentation information, see slide 31.3 Represents a non-GAAP financial measure. For important presentation information, see Note A on slide 28, and slide 31. 4 Reported operating leverage of 12%.
7% operating leverage YoY 2,4

Fourth Quarter 2018 Highlights (% comparisons are to 4Q17 adjusted for enactment of Tax Act)
9
1 Represent non-GAAP financial measures which exclude 4Q17 charge for enactment of the Tax Act. See slide 31 for important presentation information. In addition, for the non-GAAPfinancial measures under the “Earnings” section, see slide 8 for the percentages calculated using GAAP financial measures along with reconciliations. For the non-GAAP financialmeasures under “Returns and Efficiency”, see slide 8 for the percentages calculated using GAAP financial measures and note A on slide 28 for reconciliations.
2 Return on average tangible common shareholders’ equity is a non-GAAP financial measure. See slide 8 for additional information.3 Regulatory capital ratios at December 31, 2018 are preliminary. The Company reports regulatory capital ratios under both the Standardized and Advanced approaches. The approach
that yields the lower ratio is used to assess capital adequacy, which for CET1 is the Standardized approach for 4Q18.4 See note B on slide 28 for definition of Global Liquidity Sources.
Earnings Returns and Efficiency
Client Balances Capital and Liquidity
• Diluted earnings per share of $0.70, up 49% 1
• Record net income of $7.3B, up 39% 1
• Pretax income of $8.7B, up 22% 1
• Total revenue of $22.7B, up 6% 1
• Noninterest expense of $13.1B, down 1%
• Net charge-off ratio of 0.39%, down 14 bps
• Return on average assets of 1.24% improved 34 bps 1
• Return on average common shareholders’ equity of 11.6% increased 373 bps 1
• Return on average tangible common shareholders’ equity of 16.3% improved 543 bps 1,2
• Efficiency ratio of 58% improved 432 bps 1
• $167B of Common Equity Tier 1 Capital (CET1) and CET1 ratio of 11.6% 3
• $544B of average Global Liquidity Sources 4
• Capital returned to shareholders
‒ Repurchased $20.1B of common shares and paid $5.4B in common dividends in 2018; returned 96% of net income available to common shareholders
• Average loans and leases in business segments grew 3%
– Consumer up 4% and commercial up 2%
• Average deposits increased 4%
• Full year Merrill Edge client flows of $25B
• Full year total client balance flows within Global Wealth & Investment Management of $56B
Balance Sheet, Liquidity and Capital(EOP basis unless noted)
10
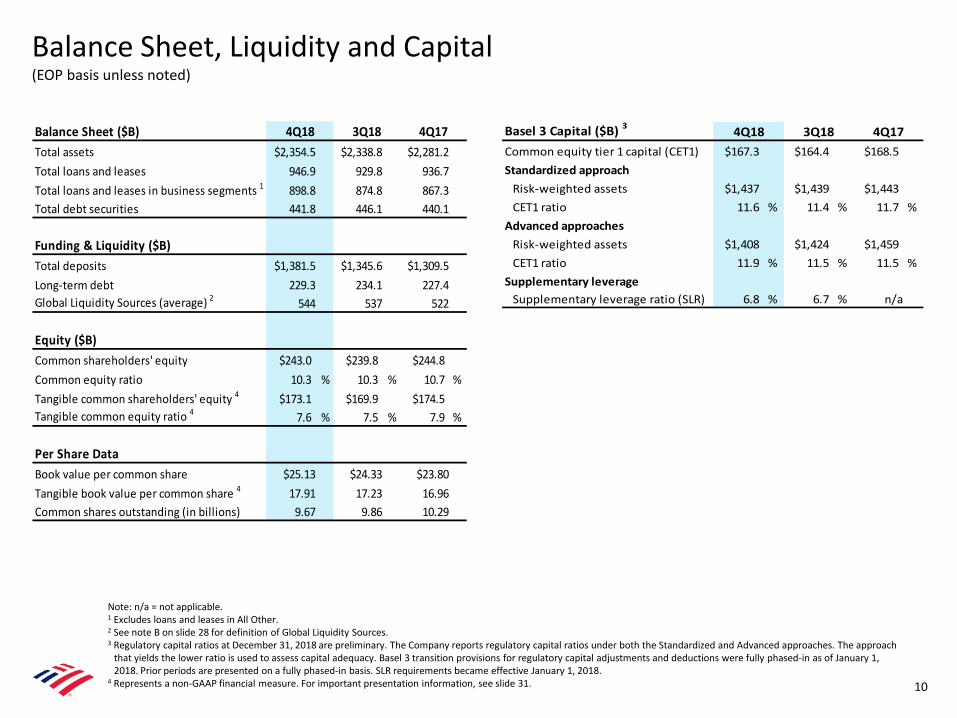
Balance Sheet ($B) Total assets $2,354.5 $2,338.8 $2,281.2Total loans and leases 946.9 929.8 936.7Total loans and leases in business segments 1 898.8 874.8 867.3Total debt securities 441.8 446.1 440.1
Funding & Liquidity ($B)Total deposits $1,381.5 $1,345.6 $1,309.5Long-term debt 229.3 234.1 227.4Global Liquidity Sources (average) 2 544 537 522
Equity ($B)Common shareholders' equity $243.0 $239.8 $244.8Common equity ratio 10.3 % 10.3 % 10.7 %Tangible common shareholders' equity 4 $173.1 $169.9 $174.5Tangible common equity ratio 4 7.6 % 7.5 % 7.9 %
Per Share Data Book value per common share $25.13 $24.33 $23.80Tangible book value per common share 4 17.91 17.23 16.96Common shares outstanding (in billions) 9.67 9.86 10.29
4Q18 3Q18 4Q17 Basel 3 Capital ($B) 3
Common equity tier 1 capital (CET1) $167.3 $164.4 $168.5Standardized approach
Risk-weighted assets $1,437 $1,439 $1,443CET1 ratio 11.6 % 11.4 % 11.7 %
Advanced approachesRisk-weighted assets $1,408 $1,424 $1,459CET1 ratio 11.9 % 11.5 % 11.5 %
Supplementary leverage Supplementary leverage ratio (SLR) 6.8 % 6.7 % n/a
4Q18 3Q18 4Q17
Note: n/a = not applicable. 1 Excludes loans and leases in All Other. 2 See note B on slide 28 for definition of Global Liquidity Sources. 3 Regulatory capital ratios at December 31, 2018 are preliminary. The Company reports regulatory capital ratios under both the Standardized and Advanced approaches. The approach
that yields the lower ratio is used to assess capital adequacy. Basel 3 transition provisions for regulatory capital adjustments and deductions were fully phased-in as of January 1, 2018. Prior periods are presented on a fully phased-in basis. SLR requirements became effective January 1, 2018.
4 Represents a non-GAAP financial measure. For important presentation information, see slide 31.

Consumer Banking ($B)
GWIM ($B)
Note: Amounts may not total due to rounding. Total corporation includes Global Markets & All Other.1 Based on June 30, 2018 FDIC deposit data. 11
Global Banking ($B)
234 239 223 231
18 1717 16
$251 $257$240 $247
$0
$50
$100
$150
$200
$250
$300
4Q15 4Q16 4Q17 4Q18
Interest-bearing Noninterest-bearing
66 73 107 163
242 242 223
196
$308 $315 $330$360
$0
$100
$200
$300
$400
4Q15 4Q16 4Q17 4Q18
Interest-bearing Noninterest-bearing
Total Corporation ($B)
748 801 852 923
438 450 442 422
$1,186 $1,251 $1,294 $1,345
$0
$500
$1,000
$1,500
4Q15 4Q16 4Q17 4Q18Interest-bearing Noninterest-bearing
YoY+4%
(5%)
+8%
YoY+3%
+6%
(0%)
YoY+3%
(5%)
+4%
YoY+9%
(12%)
+53%
Average Deposits Bank of America Ranked #1 in U.S. Deposit Market Share 1
287 309 328 327
122 140 154 165 155 169 183 194
$564$618
$666 $687
$0
$200
$400
$600
$800
4Q15 4Q16 4Q17 4Q18Money market, Savings, CD/IRA Interest checking Noninterest-bearing
+7%

Total Loans and Leases ($B)
$928 $932 $935 $931 $935
$0
$200
$400
$600
$800
$1,000
4Q17 1Q18 2Q18 3Q18 4Q18
Total Loans and Leases in All Other ($B)
58 55 51 48 43
14 13 12 12 10
$71 $68 $63 $60 $53
$0
$25
$50
$75
$100
4Q17 1Q18 2Q18 3Q18 4Q18Residential mortgage Home equity
Note: Amounts may not total due to rounding.
Loans and Leases in Business Segments ($B)
276 280 281 285 290
157 159 161 162 164
350 352 355 353 357
74 74 75 71 71$857 $864 $872 $871 $881
$0
$300
$600
$900
4Q17 1Q18 2Q18 3Q18 4Q18Consumer Banking GWIM Global Banking Global Markets
+5%
+4%
+2%
(4%)
Average Loans and Leases
12
YoY+1%
YoY(25%)
YoY+3%
Year-over-Year Growth in Business Segments
7%6%
5% 4%4% 5%
2% 2%
5% 5%
3%3%
0%
2%
4%
6%
8%
1Q18 2Q18 3Q18 4Q18Consumer loans Commercial loans Total in business segments
2018 includes $10B in sales, primarily non-core consumer real estate loans

Net Interest Income
13
• Net interest income of $12.3B ($12.5B FTE 1)
– Increased $0.8B from 4Q17, reflecting the benefits from higher interest rates as well as loan and deposit growth, modestly offset by loan spread compression and higher funding costs in Global Markets
– Increased $0.4B from 3Q18, driven by benefits from higher interest rates, loan and deposit growth, and lower long-term debt costs
• Net interest yield of 2.48% increased 9 bps from 4Q17
– Excluding Global Markets, the net interest yield was 3.03%, up 14 bps from 4Q17 1
• Interest rate sensitivity as of December 31, 2018 2
– Remain positioned for NII to benefit as rates move higher
– +100 bps parallel shift in interest rate yield curve is estimated to benefit NII by $2.7B over the next 12 months, driven primarily by sensitivity to short-end interest rates
• 1Q19 will be negatively impacted by approximately $200MM for two fewer interest accrual days than 4Q18
Notes: FTE stands for fully taxable-equivalent basis. GM stands for Global Markets. 1 Represent non-GAAP financial measures. Net interest yield adjusted to exclude Global Markets NII of $746MM, $754MM, $801MM, $870MM and $932MM, and average earning
assets of $458B, $459B, $490B, $486B and $464B for 4Q18, 3Q18, 2Q18, 1Q18 and 4Q17, respectively. The Company believes the presentation of net interest yield excluding Global Markets provides investors with transparency of NII and net interest yield in core banking activities. For important presentation information, see slide 31.
2 NII asset sensitivity represents banking book positions.
Net Interest Income (FTE, $B) 1
$11.5 $11.6 $11.7 $11.9 $12.3
$11.7 $11.8 $11.8 $12.0 $12.5
$0
$5
$10
$15
4Q17 1Q18 2Q18 3Q18 4Q18
Net interest income (GAAP) FTE adjustment
Net Interest Yield (FTE) 1
2.39% 2.39% 2.38% 2.42% 2.48%
2.89% 2.93% 2.95% 2.96% 3.03%
2.0%
2.5%
3.0%
3.5%
4Q17 1Q18 2Q18 3Q18 4Q18
Reported net interest yield Net interest yield excl. GM
65%60% 59% 57% 58%
30%
40%
50%
60%
70%
4Q17 1Q18 2Q18 3Q18 4Q18
Note: Amounts may not total due to rounding.
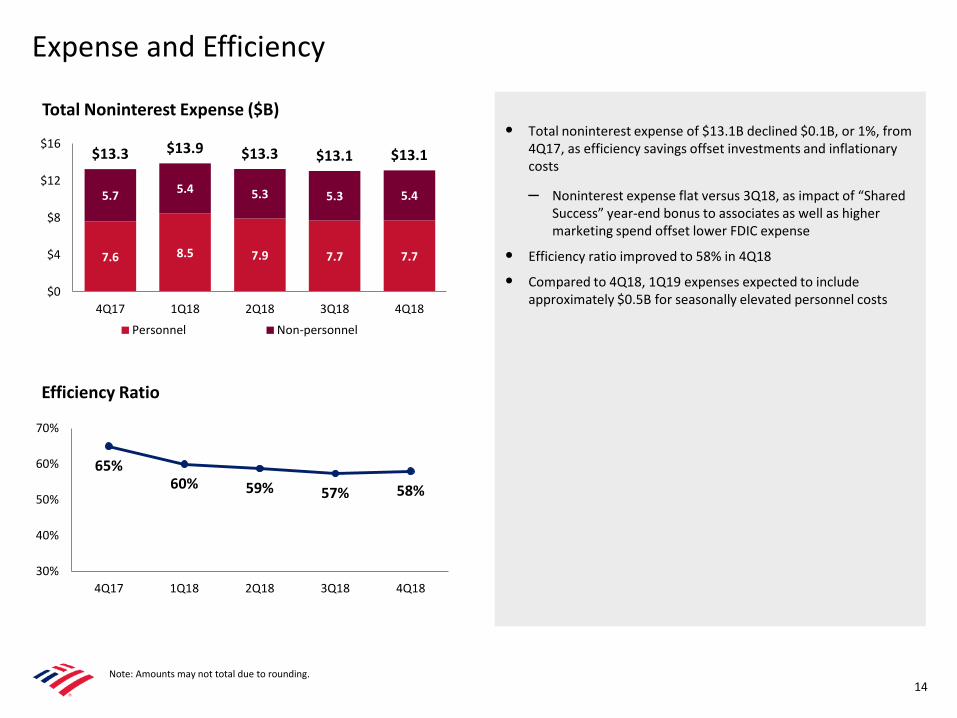
• Total noninterest expense of $13.1B declined $0.1B, or 1%, from 4Q17, as efficiency savings offset investments and inflationary costs
– Noninterest expense flat versus 3Q18, as impact of “Shared Success” year-end bonus to associates as well as higher marketing spend offset lower FDIC expense
• Efficiency ratio improved to 58% in 4Q18
• Compared to 4Q18, 1Q19 expenses expected to include approximately $0.5B for seasonally elevated personnel costs
Total Noninterest Expense ($B)
7.6 8.5 7.9 7.7 7.7
5.7 5.4 5.3 5.3 5.4
$13.3 $13.9 $13.3 $13.1 $13.1
$0
$4
$8
$12
$16
4Q17 1Q18 2Q18 3Q18 4Q18
Personnel Non-personnel
Efficiency Ratio
Expense and Efficiency
14
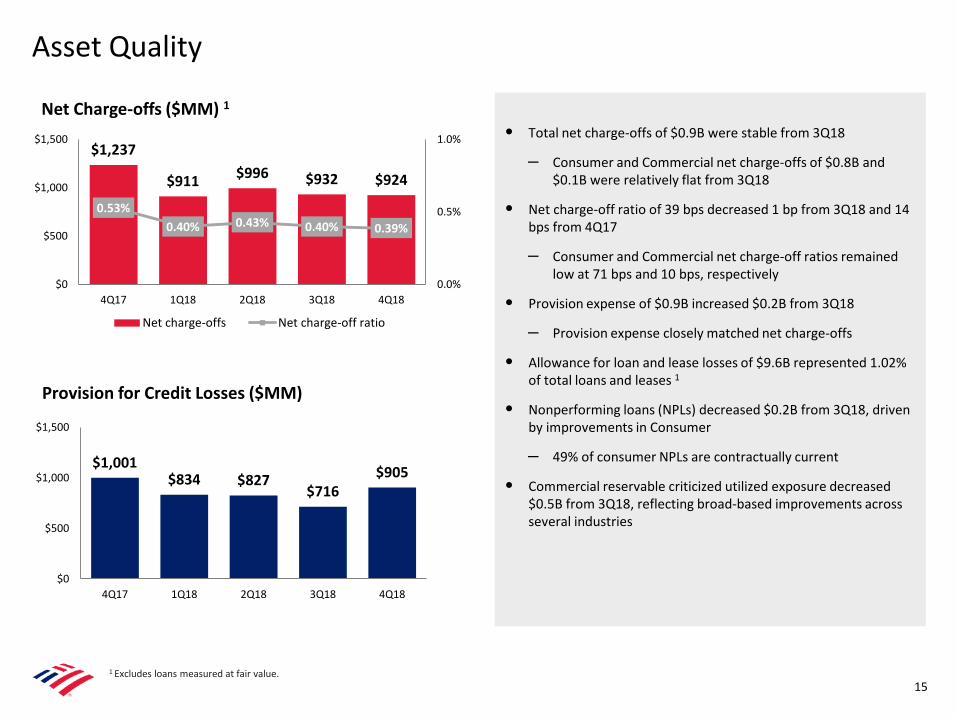
$1,237
$911 $996 $932 $924
0.53%0.40% 0.43% 0.40% 0.39%
0.0%
0.5%
1.0%
$0
$500
$1,000
$1,500
4Q17 1Q18 2Q18 3Q18 4Q18
Net charge-offs Net charge-off ratio
1 Excludes loans measured at fair value.
Asset Quality
15
$1,001$834 $827
$716$905
$0
$500
$1,000
$1,500
4Q17 1Q18 2Q18 3Q18 4Q18
• Total net charge-offs of $0.9B were stable from 3Q18
– Consumer and Commercial net charge-offs of $0.8B and $0.1B were relatively flat from 3Q18
• Net charge-off ratio of 39 bps decreased 1 bp from 3Q18 and 14 bps from 4Q17
– Consumer and Commercial net charge-off ratios remained low at 71 bps and 10 bps, respectively
• Provision expense of $0.9B increased $0.2B from 3Q18
– Provision expense closely matched net charge-offs
• Allowance for loan and lease losses of $9.6B represented 1.02% of total loans and leases 1
• Nonperforming loans (NPLs) decreased $0.2B from 3Q18, driven by improvements in Consumer
– 49% of consumer NPLs are contractually current
• Commercial reservable criticized utilized exposure decreased $0.5B from 3Q18, reflecting broad-based improvements across several industries
Net Charge-offs ($MM) 1
Provision for Credit Losses ($MM)

$468
$81$166 $156 $120
0.39%
0.07% 0.14% 0.13% 0.10%0.0%
0.5%
1.0%
1.5%
2.0%
$0
$250
$500
4Q17 1Q18 2Q18 3Q18 4Q18
C&I Small business and other Commercial NCO ratio
Asset Quality – Consumer and Commercial Portfolios
16
Consumer Net Charge-offs ($MM)
$769 $830 $830 $776 $804
0.68% 0.75% 0.74% 0.69% 0.71%
0.0%
0.5%
1.0%
1.5%
2.0%
$0
$250
$500
$750
$1,000
4Q17 1Q18 2Q18 3Q18 4Q18
Credit card Other Consumer NCO ratio
1 Excludes loans measured at fair value.2 Fully-insured loans are FHA-insured loans and other loans individually insured under long-term standby agreements.
Consumer Metrics ($MM) Provis ion $734 $710 $619
Nonperforming loans and leases 3,842 4,306 5,166
% of loans and leases 1 0.86 % 0.97 % 1.14 %
Consumer 30+ days performing past due $6,741 $7,158 $8,811
Ful ly-insured 2 2,790 3,183 4,466
Non ful ly-insured 3,951 3,975 4,345
Al lowance for loans and leases 4,802 4,980 5,383
% of loans and leases 1 1.08 % 1.12 % 1.18 %
# times annual i zed NCOs 1.51 x 1.62 x 1.76 x
4Q18 3Q18 4Q17
Commercial Net Charge-offs ($MM) Commercial Metrics ($MM) Provis ion $171 $6 $382
Reservable cri tici zed uti l i zed exposure 11,061 11,597 13,563
Nonperforming loans and leases 1,102 848 1,304
% of loans and leases 1 0.22 % 0.18 % 0.27 %
Al lowance for loans and leases $4,799 $4,754 $5,010
% of loans and leases 1 0.97 % 0.99 % 1.05 %
4Q18 3Q18 4Q174Q17 included
$0.3B single-name non-US C&I charge-off

• Net income of $3.3B increased 52% from 4Q17; ROAAC of 36%
– 11% operating leverage and steady credit costs drove results
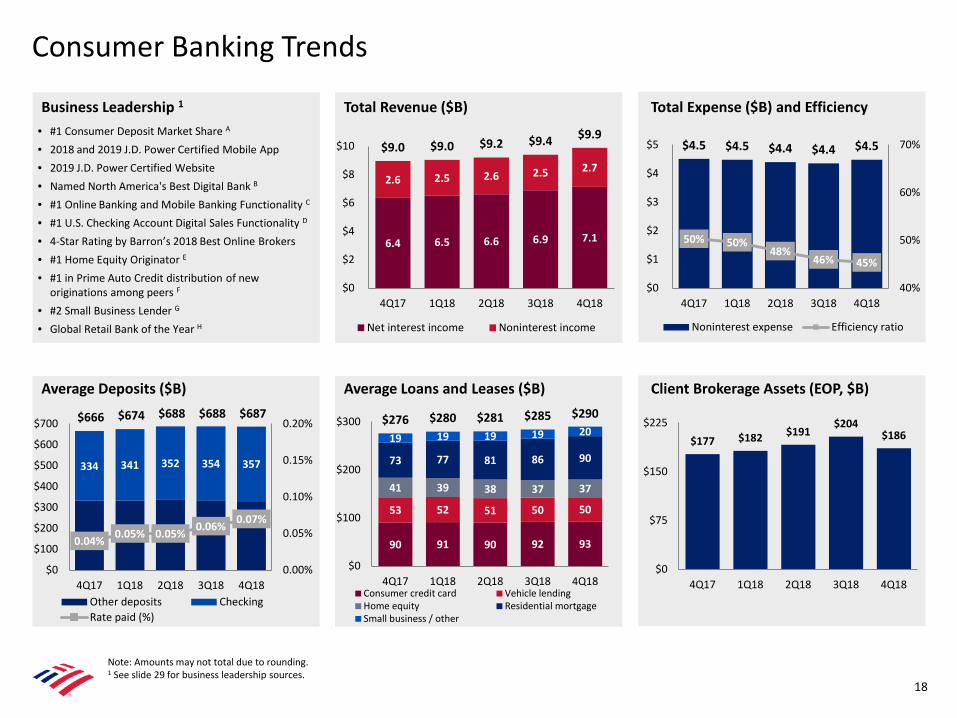
• Revenue of $9.9B increased $0.9B, or 10%, from 4Q17, driven primarily by NII due to higher interest rates and growth in deposits and loans, as well as higher card income and service charges
• Provision increased modestly from 4Q17
– Net charge-offs increased due to credit card portfolio seasoning and loan growth
• Noninterest expense declined 1% from 4Q17, as investments for business growth were more than offset by improved productivity and lower FDIC expense
– Efficiency ratio improved nearly 500 bps to 45%– Continued investment in financial center builds/renovations and
digital capabilities – Active mobile banking users of 26.4MM increased 9% from 4Q17,
and mobile channel usage increased 16% from 4Q17
• Average deposits of $687B grew $21B, or 3%, from 4Q17
– 52% of deposits in checking accounts; 91% primary accounts 4
– Average cost of deposits of 1.52% 2; rate paid of 7 bps• Average loans and leases of $290B increased $14B, or 5%, from 4Q17,
driven by growth in residential mortgage and credit card
• Client brokerage assets of $186B grew $9B, or 5%, from 4Q17
– $25B of strong client flows were partially offset by $16B lower market valuation
• Combined card spend grew 6% from 4Q17
Consumer Banking
17
Note: ROAAC stands for return on average allocated capital.1 Tax expense compared to prior year impacted by a lower U.S. corporate tax rate.2 Cost of deposits calculated as annualized noninterest expense as a percentage of total average deposits within the Deposits subsegment.3 Includes U.S. consumer credit card portfolios in Consumer Banking and GWIM.4 Represents the percentage of consumer checking accounts that are estimated to be the customer’s primary account based on multiple relationship factors (e.g., linked to their direct
deposit).
Summary Income Statement ($MM) 1
Total revenue, net of interest expense $9,877 $474 $922Provision for credit losses 915 45 29Noninterest expense 4,483 129 (26)Pretax income 4,479 300 919Income tax expense 1,141 75 (223)Net income $3,338 $225 $1,142
Key Indicators ($B) Average deposits $686.8 $687.5 $665.5
Rate paid on deposits 0.07 % 0.06 % 0.04 %
Cost of deposits 2 1.52 1.52 1.61 Average loans and leases $289.9 $285.0 $275.7Net charge-off ratio 1.22 % 1.19 % 1.21 %Client brokerage assets $185.9 $203.9 $177.0Active mobile banking users (MM) 26.4 25.9 24.2 % Consumer sales through digital channels 27 % 23 % 24 %Number of financial centers 4,341 4,385 4,477
Combined credit / debit purchase volumes 3 $151.9 $146.4 $143.4
Total consumer credit card risk-adjusted margin 3 8.83 % 8.15 % 8.74 %Return on average allocated capital 36 33 24 Allocated capital $37 $37 $37Efficiency ratio 45 % 46 % 50 %
Inc / (Dec)4Q18 3Q18 4Q17
4Q18 3Q18 4Q17
$4.5 $4.5 $4.4 $4.4 $4.5
50% 50%48%
46% 45%
40%
50%
60%
70%
$0
$1
$2
$3
$4
$5
4Q17 1Q18 2Q18 3Q18 4Q18
Noninterest expense Efficiency ratio
18
• #1 Consumer Deposit Market Share A
• 2018 and 2019 J.D. Power Certified Mobile App• 2019 J.D. Power Certified Website • Named North America's Best Digital Bank B
• #1 Online Banking and Mobile Banking Functionality C
• #1 U.S. Checking Account Digital Sales Functionality D
• 4-Star Rating by Barron’s 2018 Best Online Brokers• #1 Home Equity Originator E
• #1 in Prime Auto Credit distribution of new originations among peers F
• #2 Small Business Lender G
• Global Retail Bank of the Year H
6.4 6.5 6.6 6.9 7.1
2.6 2.5 2.6 2.5 2.7
$9.0 $9.0 $9.2 $9.4 $9.9
$0
$2
$4
$6
$8
$10
4Q17 1Q18 2Q18 3Q18 4Q18
Net interest income Noninterest income
90 91 90 92 93
53 52 51 50 50
41 39 38 37 37
73 77 81 86 90
19 19 19 19 20$276 $280 $281 $285 $290
$0
$100
$200
$300
4Q17 1Q18 2Q18 3Q18 4Q18Consumer credit card Vehicle lendingHome equity Residential mortgageSmall business / other
Average Loans and Leases ($B)
Total Expense ($B) and Efficiency Total Revenue ($B)
Note: Amounts may not total due to rounding. 1 See slide 29 for business leadership sources.
Average Deposits ($B)
Business Leadership 1
$177 $182 $191$204
$186
$0
$75
$150
$225
4Q17 1Q18 2Q18 3Q18 4Q18
Client Brokerage Assets (EOP, $B)
Consumer Banking Trends
334 341 352 354 357
$666 $674 $688 $688 $687
0.04% 0.05% 0.05% 0.06% 0.07%
0.00%
0.05%
0.10%
0.15%
0.20%
$0
$100
$200
$300
$400
$500
$600
$700
4Q17 1Q18 2Q18 3Q18 4Q18Other deposits CheckingRate paid (%)

7.0 11.4
23.1
51.6
$2 $4 $7$14
$0
$20
$40
$60
0
10
20
30
40
50
60
4Q15 4Q16 4Q17 4Q18Transactions (MM) Volume ($B)
19
1 Digital users represent mobile and/or online users in consumer businesses.2 Mobile channel usage represents the total number of application logins using a smartphone or tablet.3 Digital appointments represent the number of appointments made via online, smartphone or tablet.4 Includes Bank of America person-to-person payments sent and/or received through e-mail or mobile identification.
31.0 32.9 34.9 36.3
18.721.6 24.2 26.4
0
10
20
30
40
4Q15 4Q16 4Q17 4Q18Digital banking users Mobile banking users
Active Digital Banking Users (MM)
Consumer Banking Digital Usage Trends 1
67% 77%
33% 23%
0%
20%
40%
60%
80%
100%
4Q15 4Q18
Digital (Mobile/ATM) Financial Center
Digital Deposit Transactions Digital % of Total Sales
791982
1,3151,522
192
317394
490
0
100
200
300
400
500
600
700
0
400
800
1,200
1,600
4Q15 4Q16 4Q17 4Q18Mobile Channel Usage (MM)Digital Appointments (000's)
Mobile Channel Usage 2, 3
4.8MM Erica users since launch in April 2018
288 303 350 392
316 315 324 329
$604 $618$673 $721
$0
$200
$400
$600
$800
4Q15 4Q16 4Q17 4Q18Digital Non-Digital
Total Payments ($B)
+1%
+6%
+11%
CAGR
4.9MM users, up 2.4x since launch in June 2017
Person-to-Person Payments (Zelle) 4
21% 38% 41% 49%
79%62%
59%51%
19% 20%24%
27%
0%
5%
10%
15%
20%
25%
30%
4Q15 4Q16 4Q17 4Q18
Mobile Desktop

Global Wealth & Investment Management
20
1 Tax expense compared to prior year impacted by a lower U.S. corporate tax rate.2 Includes financial advisors in Consumer Banking of 2,722 and 2,402 in 4Q18 and 4Q17.
• Record net income of $1.1B increased 43% from 4Q17; ROAAC of 29%
– Strong pretax margin of 29%
• Revenue of $5.0B increased 7% from 4Q17, driven primarily by higher net interest income and asset management fees, as well as a small gain on sale of a non-core asset, partially offset by lower transactional revenue
– 83% of revenue from asset management fees and net interest income
– Impact of December equity market declines will be reflected in 1Q19 results
• Noninterest expense increased 2% from 4Q17, as higher revenue-related incentives and investment in business growth were largely offset by continued expense discipline
• Client balances of $2.6T, down 5% from 4Q17, as strong flows were more than offset by impact of lower market valuations
– Total client balance flows of $35B in 4Q18 driven by strong deposit and brokerage flows, partially offset by AUM flows of ($6B), reflecting impact of investor sentiment towards cash due to market volatility
• Organic growth in net new Merrill Lynch households in 2018 was more than four times 2017 level
• Average deposits of $247B increased 3% from 4Q17
– Included the impact of some client portfolio rebalancing out of AUM, as well as account structure simplification
• Average loans and leases of $164B increased $6B, or 4%, from 4Q17, driven by residential mortgage and custom lending
• Wealth advisors grew 1% from 4Q17 to 19,459 2
Summary Income Statement ($MM) 1
Total revenue, net of interest expense $4,990 $207 $307Provision for credit losses 23 10 17 Noninterest expense 3,542 128 72Pretax income 1,425 69 218Income tax expense 363 17 (100)Net income $1,062 $52 $318
Key Indicators ($B) Average deposits $247.4 $238.3 $240.1Average loans and leases 163.5 161.9 157.1Net charge-off ratio 0.02 % 0.03 % 0.01 %AUM flows ($6.2) $7.6 $18.2Pretax margin 29 % 28 % 26 %Return on average allocated capital 29 28 21 Allocated capital $14.5 $14.5 $14.0
Inc / (Dec)
4Q18 3Q18 4Q17
4Q18 3Q18 4Q17

21
Business Leadership 1 Average Loans and Leases ($B)Average Deposits ($B)
• #1 U.S. wealth management market position across client assets, deposits and loans I
• #1 in personal trust assets under management J
• #1 in Barron’s U.S. high net worth client assets (2018)
• #1 in Barron’s Top 1,200 ranked Financial Advisors (2018)
• #1 in Forbes’ Top 500 America’s Top Next Generation Advisors (2018)
• #1 in Financial Times Top 401K Retirement Plan Advisers (2018)
• #1 in Barron’s Top 100 Women Advisors (2018)
1,262 1,237 1,254 1,292 1,163
1,081 1,085 1,101 1,1441,021
247 242 234 240269
162 162 165 165168
$2,752 $2,725 $2,754 $2,841$2,621
$0
$500
$1,000
$1,500
$2,000
$2,500
$3,000
4Q17 1Q18 2Q18 3Q18 4Q18
Brokerage / Other AUM Deposits Loans and leases
Client Balances (EOP, $B) 2
75 77 77 79 80
42 42 41 41 40
36 38 39 40 41
$157 $159 $161 $162 $164
$0
$60
$120
$180
4Q17 1Q18 2Q18 3Q18 4Q18
Consumer real estate Securities-based lendingCustom lending Credit card / Other
Note: Amounts may not total due to rounding. 1 See slide 29 for business leadership sources. 2 Loans and leases include margin receivables which are classified in customer and other receivables on the consolidated balance sheet.
1.5 1.6 1.5 1.5 1.6
2.4 2.5 2.5 2.5 2.5
0.7 0.7 0.7 0.7 0.9$4.7 $4.9 $4.7 $4.8 $5.0
$0
$1
$2
$3
$4
$5
4Q17 1Q18 2Q18 3Q18 4Q18
Net interest income Asset management fees Brokerage / Other
Total Revenue ($B)
$240 $243 $236 $238 $247
$0
$50
$100
$150
$200
$250
$300
4Q17 1Q18 2Q18 3Q18 4Q18
Global Wealth & Investment Management Trends

Global Banking
22
1 Tax expense compared to prior year impacted by a lower U.S. corporate tax rate.2 Global Banking and Global Markets share in certain deal economics from investment banking, loan origination activities and sales and trading activities.
• Net income of $2.1B increased 25% from 4Q17; ROAAC of 20%
• Revenue of $5.1B increased 1% from 4Q17
– Reflected higher NII from the benefit of higher interest rates and growth in deposits, partially offset by lower investment banking fees
• Total Corporation investment banking fees of $1.3B (excl. self-led) declined 5% from 4Q17 driven primarily by debt underwriting and advisory fees
• Provision improved $47MM from 4Q17, driven by the absence of prior year’s single-name non-U.S. commercial charge-off 2
• Noninterest expense decreased 2% from 4Q17, reflecting lower FDIC expense, partially offset by continued investment in the business
• Average loans and leases of $357B increased 2% from 4Q17
• Strong average deposit growth of $30B to $360B, or 9%, compared to 4Q17
Summary Income Statement ($MM) 1
Total revenue, net of interest expense 2 $5,050 $312 $31Provision (benefit) for credit losses 85 155 (47)Noninterest expense 2,119 (2) (42)Pretax income 2,846 159 120Income tax expense 740 41 (306)Net income $2,106 $118 $426
Selected Revenue Items ($MM)Total Corporation IB fees (excl. self-led) 2 $1,348 $1,204 $1,418
Global Banking IB fees 2 760 644 811
Business Lending revenue 2,180 2,084 2,262Global Transaction Services revenue 2,055 1,972 1,876
Key Indicators ($B) Average deposits $359.6 $337.7 $329.8
Average loans and leases 357.4 352.7 350.3
Net charge-off ratio 0.06 % 0.10 % 0.30 %
Return on average allocated capital 20 19 17
Allocated capital $41 $41 $40Efficiency ratio 42 % 45 % 43 %
Inc/(Dec)3Q18 4Q174Q18
4Q18 3Q18 4Q17
4Q18 3Q18 4Q17

68% 65% 63% 59% 55%
32% 35% 37% 41% 45%
$330 $324 $323 $338 $360
$0
$100
$200
$300
$400
4Q17 1Q18 2Q18 3Q18 4Q18
Noninterest-bearing Interest-bearing
Global Banking Trends
23
Note: Amounts may not total due to rounding.1 See slide 29 for business leadership sources.2 Global Banking and Global Markets share in certain deal economics from investment banking, loan origination activities and sales and trading activities.3 Advisory includes fees on debt and equity advisory and mergers and acquisitions.
846 827 874 684 699
204 314 290 307 272
429 296 303262 397
(61) (84) (45) (49) (20)
$1,418 $1,353 $1,422$1,204 $1,348
4Q17 1Q18 2Q18 3Q18 4Q18
Debt Equity Advisory Self-led deals
Total Corporation IB Fees ($MM) 2
• North America’s Best Bank for Small to Medium-sized Enterprises B
• Most Innovative Investment Bank of the Year from North America K
• Best Transaction Bank in North America K
• 2018 Quality, Share and Excellence Awards for U.S. Large Corporate Banking and Cash Management L
• Best Global Debt Bank M
• Relationships with 79% of the Global Fortune 500; 94% of the U.S. Fortune 1,000 (2018)
2.7 2.6 2.7 2.7 2.8
0.8 0.7 0.7 0.6 0.80.8 0.8 0.8 0.8 0.70.7 0.8 0.7 0.6 0.7
$5.0 $4.9 $4.9 $4.7 $5.1
$0
$2
$4
$6
4Q17 1Q18 2Q18 3Q18 4Q18
Net interest income IB fees Service charges All other income
Total Revenue ($B) 2
3
171 172 175 174 176
162 162 164 162 166
17 17 17 16 16$350 $352 $355 $353 $357
$0
$100
$200
$300
$400
4Q17 1Q18 2Q18 3Q18 4Q18
Commercial Corporate Business Banking
Average Deposits ($B) Business Leadership 1 Average Loans and Leases ($B)
Global Markets
24
• [ Bullets to come ]
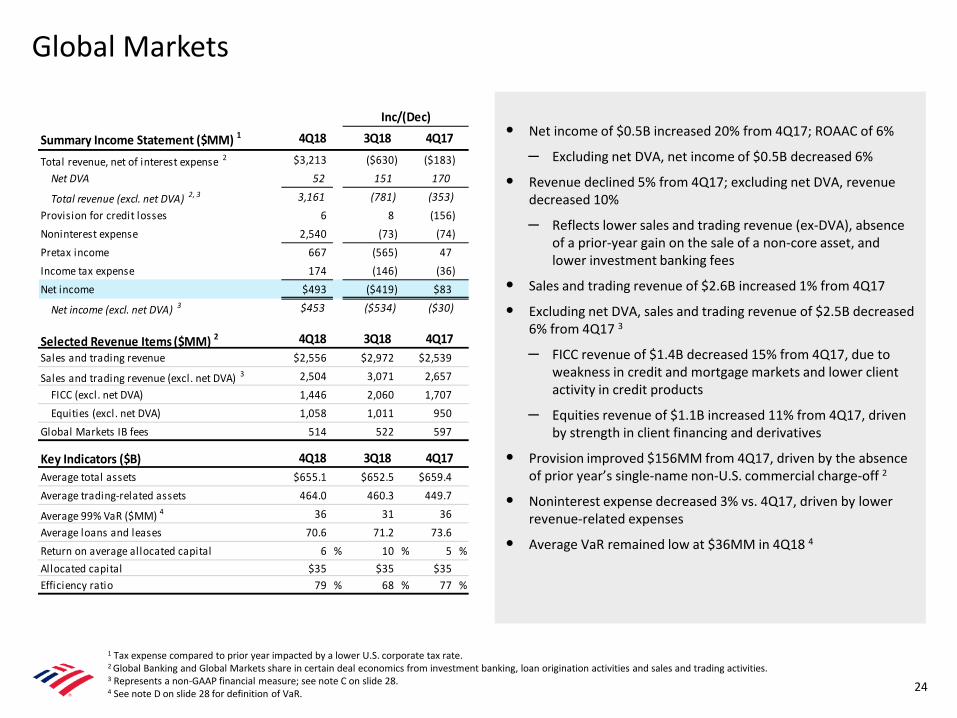
1 Tax expense compared to prior year impacted by a lower U.S. corporate tax rate.2 Global Banking and Global Markets share in certain deal economics from investment banking, loan origination activities and sales and trading activities.3 Represents a non-GAAP financial measure; see note C on slide 28.4 See note D on slide 28 for definition of VaR.
• Net income of $0.5B increased 20% from 4Q17; ROAAC of 6%
– Excluding net DVA, net income of $0.5B decreased 6%
• Revenue declined 5% from 4Q17; excluding net DVA, revenue decreased 10%
– Reflects lower sales and trading revenue (ex-DVA), absence of a prior-year gain on the sale of a non-core asset, and lower investment banking fees
• Sales and trading revenue of $2.6B increased 1% from 4Q17
• Excluding net DVA, sales and trading revenue of $2.5B decreased 6% from 4Q17 3
– FICC revenue of $1.4B decreased 15% from 4Q17, due to weakness in credit and mortgage markets and lower client activity in credit products
– Equities revenue of $1.1B increased 11% from 4Q17, driven by strength in client financing and derivatives
• Provision improved $156MM from 4Q17, driven by the absence of prior year’s single-name non-U.S. commercial charge-off 2
• Noninterest expense decreased 3% vs. 4Q17, driven by lower revenue-related expenses
• Average VaR remained low at $36MM in 4Q18 4
Summary Income Statement ($MM) 1
Total revenue, net of interest expense 2 $3,213 ($630) ($183)Net DVA 52 151 170
Total revenue (excl. net DVA) 2, 3 3,161 (781) (353)Provision for credit losses 6 8 (156)Noninterest expense 2,540 (73) (74)Pretax income 667 (565) 47Income tax expense 174 (146) (36)Net income $493 ($419) $83
Net income (excl. net DVA) 3 $453 ($534) ($30)
Selected Revenue Items ($MM) 2
Sales and trading revenue $2,556 $2,972 $2,539
Sales and trading revenue (excl. net DVA) 3 2,504 3,071 2,657FICC (excl. net DVA) 1,446 2,060 1,707Equities (excl. net DVA) 1,058 1,011 950
Global Markets IB fees 514 522 597
Key Indicators ($B) Average total assets $655.1 $652.5 $659.4Average trading-related assets 464.0 460.3 449.7
Average 99% VaR ($MM) 4 36 31 36Average loans and leases 70.6 71.2 73.6Return on average allocated capital 6 % 10 % 5 %Allocated capital $35 $35 $35Efficiency ratio 79 % 68 % 77 %
Inc/(Dec)4Q18 3Q18 4Q17
4Q18 3Q18 4Q17
4Q18 3Q18 4Q17

$413 $442 $465
$41 $40 $34
$0
$25
$50
$75
$100
$0
$100
$200
$300
$400
$500
2016 2017 2018
Avg. trading-related assets Avg. VaR
9.6 9.1 8.3
4.0 4.2 4.9
$13.6 $13.2 $13.2
$0
$3
$6
$9
$12
$15
2016 2017 2018
FICC Equities
Global Markets Trends and Revenue Mix
25
• #1 Equity Portfolio Trading Share – North American Institutions L
• #1 for U.S. FICC Overall Trading Quality and #1 for U.S. FICC Overall Sales Quality L
• 2018 Quality Leader in Global Top-Tier Foreign Exchange Sales and Corporate FX Sales L
• 2018 Share Leader in U.S. Fixed Income Market Share - #1 Securitized, #2 Emerging Markets L
• #1 Municipal Bonds Underwriter N
• #2 Global Research Firm O
Note: Amounts may not total due to rounding.1 See slide 29 for business leadership sources.2 Represents a non-GAAP financial measure. Reported sales & trading revenue was $13.1B, $12.8B and $13.4B for 2018, 2017 and 2016, respectively. Reported FICC sales & trading revenue was $8.2B, $8.7B
and $9.4B for 2018, 2017 and 2016, respectively. Reported Equities sales & trading revenue was $4.9B, $4.1B and $4.0B for 2018, 2017 and 2016, respectively. See note C on slide 28.3 Macro includes G10 FX, rates and commodities products.4 See note D on slide 28 for definition of VaR.
58%42%
Credit / other Macro
63%
37%
U.S. / Canada International
2018 Total FICC S&T Revenue Mix(excl. net DVA) 2
2018 Global Markets Revenue Mix(excl. net DVA) 2
3
Total Sales & Trading Revenue (excl. net DVA) ($B) 2 Average Trading-related Assets ($B) and VaR ($MM) 4
Business Leadership 1
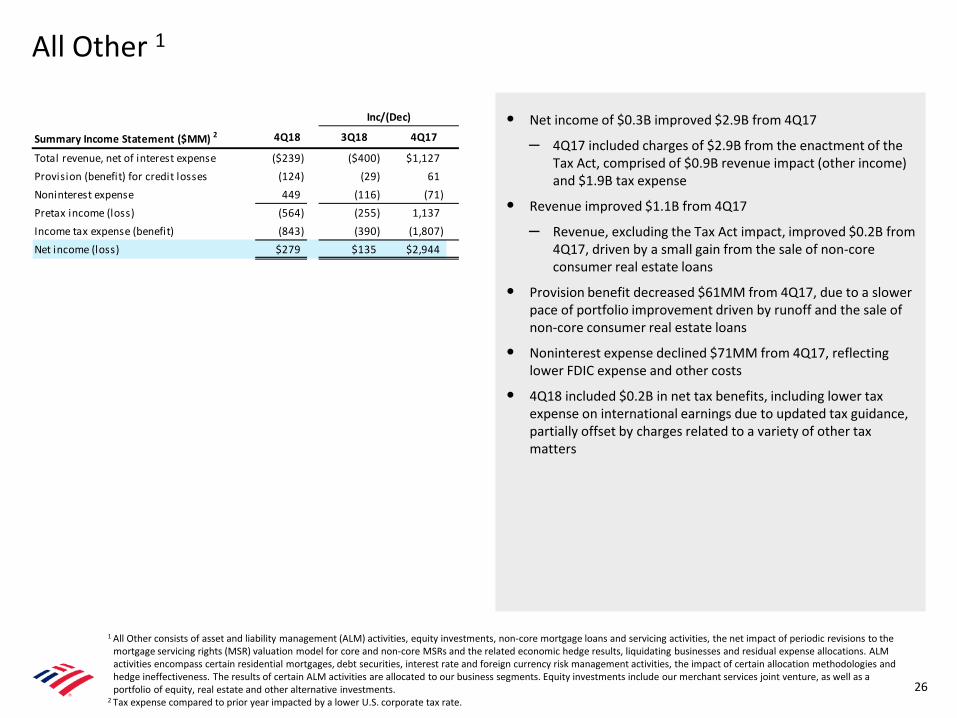
• Net income of $0.3B improved $2.9B from 4Q17
– 4Q17 included charges of $2.9B from the enactment of the Tax Act, comprised of $0.9B revenue impact (other income) and $1.9B tax expense
• Revenue improved $1.1B from 4Q17
– Revenue, excluding the Tax Act impact, improved $0.2B from 4Q17, driven by a small gain from the sale of non-core consumer real estate loans
• Provision benefit decreased $61MM from 4Q17, due to a slower pace of portfolio improvement driven by runoff and the sale of non-core consumer real estate loans
• Noninterest expense declined $71MM from 4Q17, reflecting lower FDIC expense and other costs
• 4Q18 included $0.2B in net tax benefits, including lower tax expense on international earnings due to updated tax guidance, partially offset by charges related to a variety of other tax matters
1 All Other consists of asset and liability management (ALM) activities, equity investments, non-core mortgage loans and servicing activities, the net impact of periodic revisions to the mortgage servicing rights (MSR) valuation model for core and non-core MSRs and the related economic hedge results, liquidating businesses and residual expense allocations. ALM activities encompass certain residential mortgages, debt securities, interest rate and foreign currency risk management activities, the impact of certain allocation methodologies and hedge ineffectiveness. The results of certain ALM activities are allocated to our business segments. Equity investments include our merchant services joint venture, as well as a portfolio of equity, real estate and other alternative investments.
2 Tax expense compared to prior year impacted by a lower U.S. corporate tax rate.26
Summary Income Statement ($MM) 2
Total revenue, net of interest expense ($239) ($400) $1,127Provision (benefit) for credit losses (124) (29) 61Noninterest expense 449 (116) (71)Pretax income (loss) (564) (255) 1,137Income tax expense (benefit) (843) (390) (1,807) Net income (loss) $279 $135 $2,944
Inc/(Dec)
3Q18 4Q174Q18
All Other 1

Appendix

28
A Enactment of the Tax Act reduced 4Q17 and 2017 net income by $2.9B, or $0.27 per diluted common share, which included a $0.9B pretax charge in other noninterest income (which reduced pretax income and revenue, net of interest expense) predominantly related to the revaluation of certain tax-advantaged energy investments, as well as $1.9B of tax expense principally associated with the revaluation of certain deferred tax assets and liabilities. The enactment negatively impacted 4Q17 and 2017 return on average assets by 49 bps and 13 bps, respectively; return on average common shareholders’ equity by 455 bps and 117 bps, respectively; return on average tangible common shareholders’ equity by 630 bps and 162 bps, respectively; and efficiency ratio by 287 bps and 67 bps, respectively. Reported metrics are shown on slide 2 and slide 8.
B Global Liquidity Sources (GLS) include cash and high-quality, liquid, unencumbered securities, limited to U.S. government securities, U.S. agency securities, U.S. agency MBS, and a select group of non-U.S. government and supranational securities, and are readily available to meet funding requirements as they arise. It does not include Federal Reserve Discount Window or Federal Home Loan Bank borrowing capacity. Transfers of liquidity among legal entities may be subject to certain regulatory and other restrictions.
C Revenue for all periods included net debit valuation adjustments (DVA) on derivatives, as well as amortization of own credit portion of purchase discount and realized DVA on structured liabilities. Net DVA gains (losses) were $52MM, ($99MM) and ($118MM) for 4Q18, 3Q18 and 4Q17, respectively, and ($162MM), ($428MM) and ($238MM) for 2018, 2017 and 2016, respectively. Net DVA gains (losses) included in FICC revenue were $45MM, ($80MM) and ($112MM) for 4Q18, 3Q18 and 4Q17, respectively, and ($142MM), ($394MM) and ($238MM) for 2018, 2017 and 2016, respectively. Net DVA gains (losses) included in Equities revenue were $7MM, ($19MM) and ($6MM) for 4Q18, 3Q18 and 4Q17, respectively, and ($20MM), ($34MM) and $0MM for 2018, 2017 and 2016, respectively.
D VaR model uses historical simulation approach based on three years of historical data and an expected shortfall methodology equivalent to a 99% confidence level. Using a 95% confidence level, average VaR was $22MM, $17MM and $17MM for 4Q18, 3Q18 and 4Q17, respectively.
Notes
29
A Estimated retail consumer deposits based on June 30, 2018 FDIC deposit data.B Euromoney, 2018.C Dynatrace 4Q18 Online Banker Scorecard, Javelin 2018 Online Banking Scorecard, Dynatrace 3Q18 Mobile Banking Scorecard, and Javelin 2018 Mobile Banking Scorecard.
D Forrester 2018 Banking Sales Wave: U.S. Mobile Sites.E Inside Mortgage Finance YTD 3Q18.F Largest percentage of 680+ Vantage 3.0 originations among key competitors as of October 2018.G FDIC, 3Q18. H 2018 Global Retail Banking Awards.I U.S.-based full-service wirehouse peers based on 3Q18 earnings releases.J Industry 3Q18 call reports.K The Banker, 2018.L Greenwich, 2018.M Global Finance, 2018.N Thomson Reuters, 2018.O Institutional Investor, 2018.
Sources

Forward-Looking Statements
30
Bank of America Corporation (the “Company”) and its management may make certain statements that constitute “forward-looking statements” within the meaning of the Private Securities Litigation Reform Act of 1995. These statements can be identified by the fact that they do not relate strictly to historical or current facts. Forward-looking statements often use words such as “anticipates,” “targets,” “expects,” “hopes,” “estimates,” “intends,” “plans,” “goals,” “believes,” “continue” and other similar expressions or future or conditional verbs such as “will,” “may,” “might,” “should,” “would” and “could.” Forward-looking statements represent the Company’s current expectations, plans or forecasts of its future results, revenues, expenses, efficiency ratio, capital measures, strategy, and future business and economic conditions more generally, and other future matters. These statements are not guarantees of future results or performance and involve certain known and unknown risks, uncertainties and assumptions that are difficult to predict and are often beyond the Company’s control. Actual outcomes and results may differ materially from those expressed in, or implied by, any of these forward-looking statements.
You should not place undue reliance on any forward-looking statement and should consider the following uncertainties and risks, as well as the risks and uncertainties more fully discussed under Item 1A. Risk Factors of the Company’s 2017 Annual Report on Form 10-K and in any of the Company’s subsequent Securities and Exchange Commission filings: the Company’s potential claims, damages, penalties, fines and reputational damage resulting from pending or future litigation, regulatory proceedings and enforcement actions, and the possibility that amounts may be in excess of the Company’s recorded liability and estimated range of possible loss for litigation and regulatory exposures; the possibility that the Company could face increased servicing, securities, fraud, indemnity, contribution or other claims from one or more counterparties, including trustees, purchasers of loans, underwriters, issuers, other parties involved in securitizations, monolines or private-label and other investors; the possibility that future representations and warranties losses may occur in excess of the Company’s recorded liability and estimated range of possible loss for its representations and warranties exposures; the Company’s ability to resolve representations and warranties repurchase and related claims, including claims brought by investors or trustees seeking to avoid the statute of limitations for repurchase claims; the risks related to the discontinuation of LIBOR and other reference rates, including increased expenses and litigation and the effectiveness of hedging strategies; uncertainties about the financial stability and growth rates of non-U.S. jurisdictions, the risk that those jurisdictions may face difficulties servicing their sovereign debt, and related stresses on financial markets, currencies and trade, and the Company’s exposures to such risks, including direct, indirect and operational; the impact of U.S. and global interest rates, inflation, currency exchange rates, economic conditions, trade policies, including tariffs, and potential geopolitical instability; the impact on the Company’s business, financial condition and results of operations of a potential higher interest rate environment; the possibility that future credit losses may be higher than currently expected due to changes in economic assumptions, customer behavior, adverse developments with respect to U.S. or global economic conditions and other uncertainties; the Company’s ability to achieve its expense targets, net interest income expectations, or other projections; adverse changes to the Company’s credit ratings from the major credit rating agencies; estimates of the fair value of certain of the Company’s assets and liabilities; uncertainty regarding the content, timing and impact of regulatory capital and liquidity requirements; the impact of adverse changes to total loss-absorbing capacity requirements and/or global systemically important bank surcharges; the potential impact of Federal Reserve actions on the Company’s capital plans; the effect of regulations, other guidance or additional information on our estimated impact of the Tax Act; the impact of implementation and compliance with U.S. and international laws, regulations and regulatory interpretations, including, but not limited to, recovery and resolution planning requirements, Federal Deposit Insurance Corporation (FDIC) assessments, the Volcker Rule, fiduciary standards and derivatives regulations; a failure in or breach of the Company’s operational or security systems or infrastructure, or those of third parties, including as a result of cyber-attacks; the impact on the Company’s business, financial condition and results of operations from the planned exit of the United Kingdom from the European Union; the impact of a prolonged federal government shutdown and threats not to increase the federal government’s debt limit; and other similar matters.
Forward-looking statements speak only as of the date they are made, and the Company undertakes no obligation to update any forward-looking statement to reflect the impact of circumstances or events that arise after the date the forward-looking statement was made.

• The information contained herein is preliminary and based on Company data available at the time of the earnings presentation. It speaks only as of the particular date or dates included in the accompanying slides. Bank of America does not undertake an obligation to, and disclaims any duty to, update any of the information provided.
• The Company may present certain key performance indicators and ratios, including year-over-year comparisons of revenue, noninterest expense and pretax income, excluding certain items (e.g., DVA) which result in non-GAAP financial measures. The Company believes the use of these non-GAAP financial measures provides additional clarity in understanding its results of operations and trends. For more information about the non-GAAP financial measures contained herein, please see the presentation of the most directly comparable financial measures calculated in accordance with GAAP and accompanying reconciliations in the earnings press release for the quarter ended December 31, 2018 and other earnings-related information available through the Bank of America Investor Relations website at: http://investor.bankofamerica.com.
• The Company views net interest income and related ratios and analyses on a fully taxable-equivalent (FTE) basis, which when presented on a consolidated basis are non-GAAP financial measures. The Company believes managing the business with net interest income on an FTE basis provides investors with a more accurate picture of the interest margin for comparative purposes. The Company believes that the presentation allows for comparison of amounts from both taxable and tax-exempt sources and is consistent with industry practices. The FTE adjustment was $155MM, $151MM, $154MM, $150MM and $251MM for 4Q18, 3Q18, 2Q18, 1Q18 and 4Q17 respectively.
• The Company allocates capital to its business segments using a methodology that considers the effect of regulatory capital requirements in addition to internal risk-based capital models. The Company's internal risk-based capital models use a risk-adjusted methodology incorporating each segment's credit, market, interest rate, business and operational risk components. Allocated capital is reviewed periodically and refinements are made based on multiple considerations that include, but are not limited to, risk-weighted assets measured under Basel 3 Standardized and Advanced approaches, business segment exposures and risk profile, and strategic plans. As a result of this process, in the first quarter of 2018, the Company adjusted the amount of capital being allocated to its business segments.
Important Presentation Information
31