bank of america merrill lynch - s1.q4cdn.coms1.q4cdn.com/718184649/files/doc_presentations/2013/2013...
TRANSCRIPT
BANK of AMERICA MERRILL LYNCH 2013 Services Conference
May 21, 2013

FORWARD-LOOKING STATEMENTS
This presentation may contain forward-looking statements including, without limitation, statements with respect
management’s expectations regarding student persistence, institutional accreditation, the results of the Company's
initiatives, 2013 outlook, financial results and and related commentary. These statements involve risks and
uncertainties, and the Company's actual performance may differ materially from those expressed in or suggested
by such statements. Risks and uncertainties include, without limitation:
• failure to comply with the extensive regulatory framework applicable to the Company and its
institutions, including Title IV of the Higher Education Act and its regulations, state laws and
regulatory requirements, and accrediting agency requirements;
• adverse regulatory or legislative changes affecting the Company's institutions;
• the imposition of fines or other corrective measures against the Company's institutions;
• competition in the postsecondary education market and its potential impact on the Company's market
share and recruiting costs; and
• reputational and other risks related to potential compliance audits, regulatory actions, negative
publicity or service disruptions.
More information on potential factors that could affect the Company's performance is included from time to time in
the “Risk Factors” and “Management's Discussion and Analysis of Financial Condition and Results of Operations”
sections of the Company's periodic reports filed with the SEC, including the Company's Annual Report on Form
10-K for the year ended December 31, 2012, filed with the SEC on March 12, 2013 and amended on May 17,
2013, and Quarterly Report on Form 10-Q for the quarter ended March 31, 2013, filed with the SEC on May 15,
2013. Forward-looking statements are made on the basis of management's views and assumptions regarding
future events and business performance as of the time the statements are made, and the Company assumes no
obligation to update any forward-looking statements or information, which speak as of their respective dates,
except as required by law.
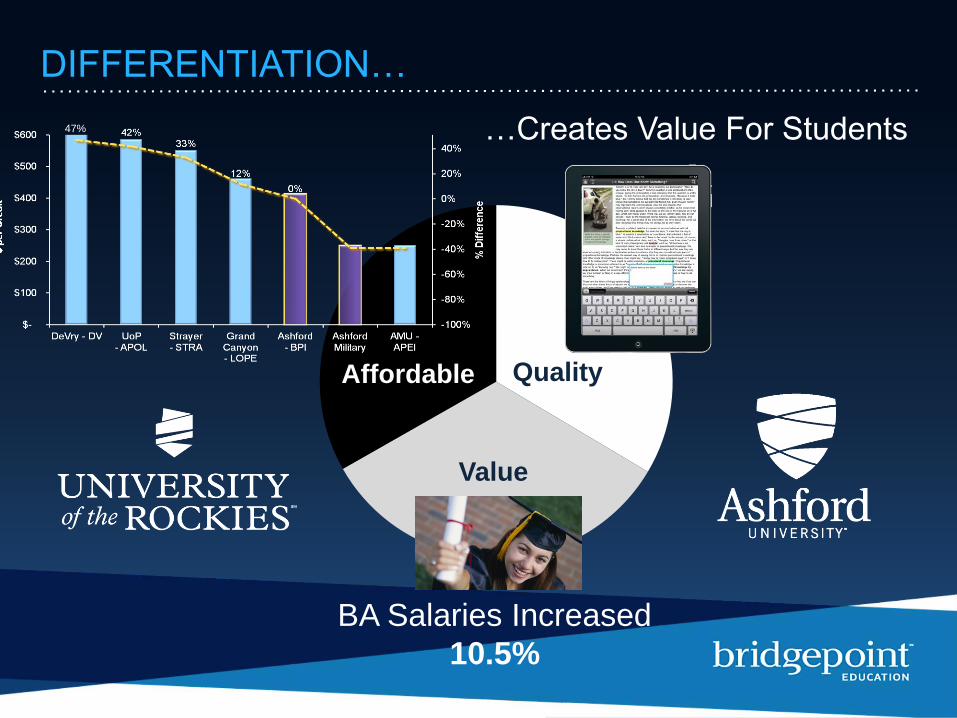
DIFFERENTIATION…
Quality
Value
Affordable
…Creates Value For Students47%
BA Salaries Increased
10.5%

• MA, PsyD, PhD
• Social & Behavioral Sciences
• Colorado Springs Campus
• HLC Accredited
99% Online
71% Female
48% Minority
37 Years Old
University of The RockiesAshford University
• AA, BA, MA, MBA
• 17 NAIA Sports Teams
• Clinton, IA Campus
• HLC Accredited, placed on notice
• WASC application process
RECOGNIZED BRANDS
Bus 39%
Lib Arts;
16%
Edu 21%
Hcare
23%
Non-D
1%
AU Programs
AA, 12%
BA, 74%
MA, 12%
Doc, 1%
AU and UOR Students
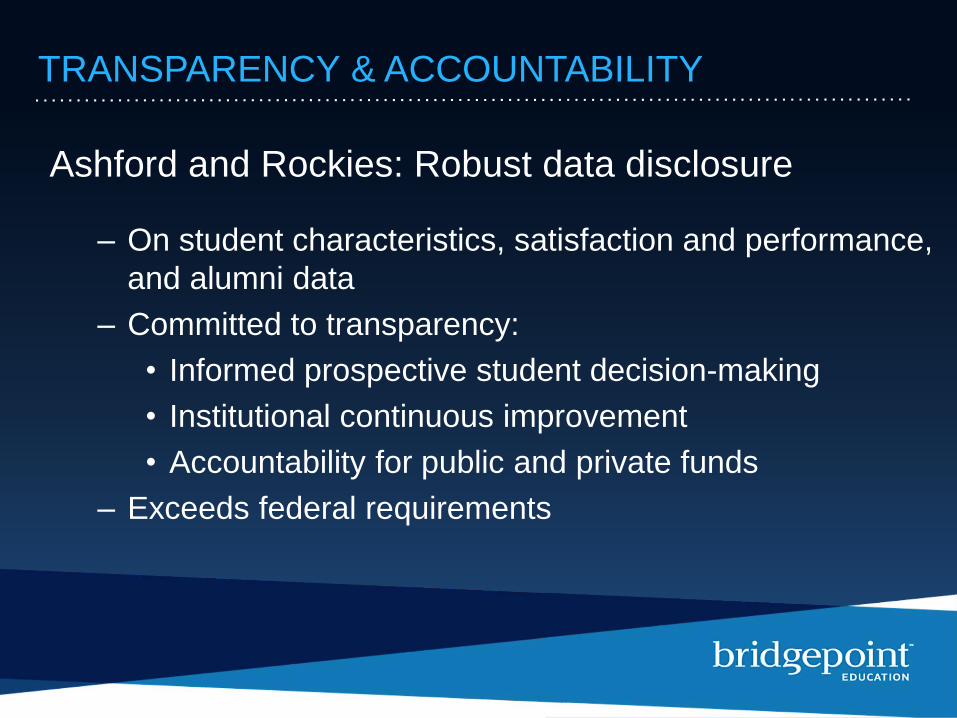
Ashford and Rockies: Robust data disclosure
– On student characteristics, satisfaction and performance,
and alumni data
– Committed to transparency:
• Informed prospective student decision-making
• Institutional continuous improvement
• Accountability for public and private funds
– Exceeds federal requirements
TRANSPARENCY & ACCOUNTABILITY
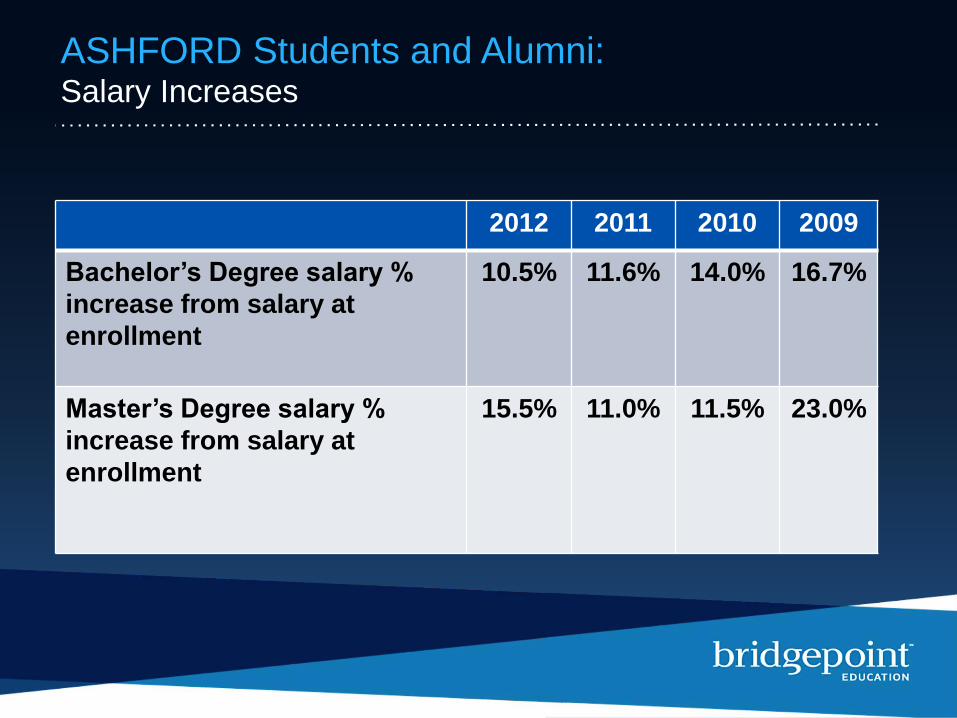
2012 2011 2010 2009
Bachelor’s Degree salary %
increase from salary at
enrollment
10.5% 11.6% 14.0% 16.7%
Master’s Degree salary %
increase from salary at
enrollment
15.5% 11.0% 11.5% 23.0%
ASHFORD Students and Alumni: Salary Increases

Our Approach
to
Quality Education
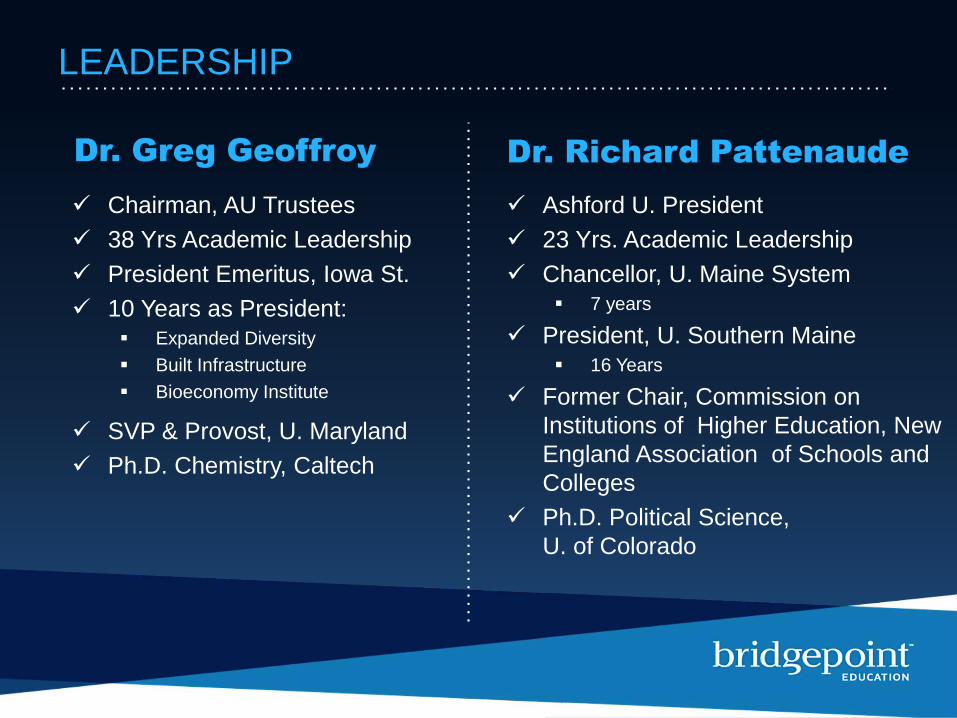
LEADERSHIP
Dr. Greg Geoffroy
Chairman, AU Trustees
38 Yrs Academic Leadership
President Emeritus, Iowa St.
10 Years as President: Expanded Diversity
Built Infrastructure
Bioeconomy Institute
SVP & Provost, U. Maryland
Ph.D. Chemistry, Caltech
Dr. Richard Pattenaude
Ashford U. President
23 Yrs. Academic Leadership
Chancellor, U. Maine System 7 years
President, U. Southern Maine 16 Years
Former Chair, Commission on
Institutions of Higher Education, New
England Association of Schools and
Colleges
Ph.D. Political Science,
U. of Colorado
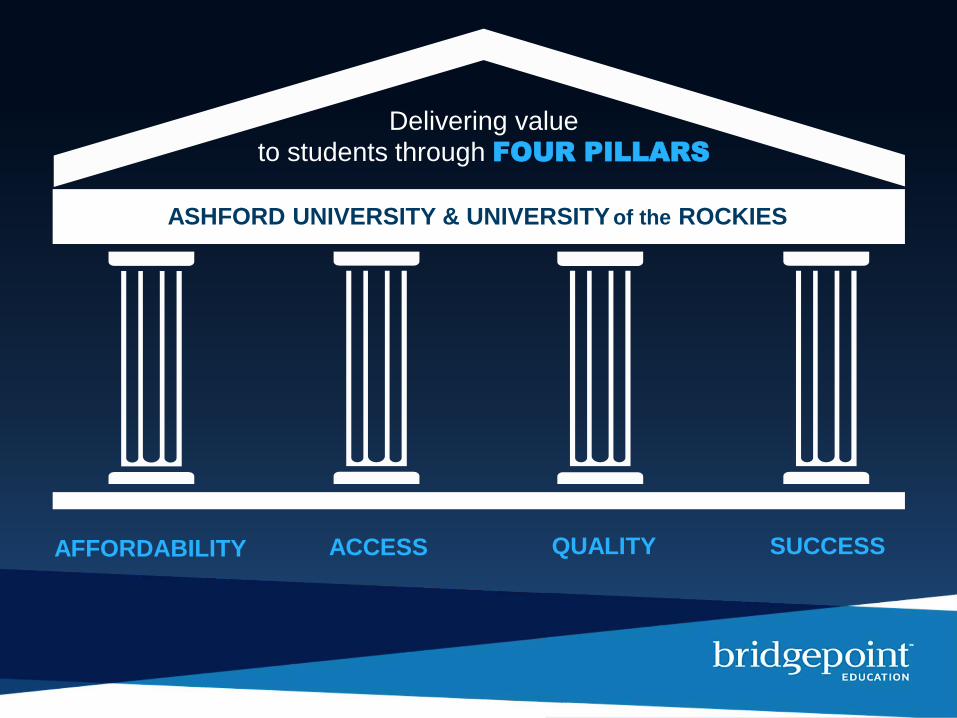
ASHFORD UNIVERSITY & UNIVERSITY of the ROCKIES
AFFORDABILITY ACCESS SUCCESSQUALITY
Delivering value to students through FOUR PILLARS

AFFORDABILITY ACCESS QUALITY SUCCESSAFFORDABILITY
42%33%
12%
0%
-100%
-80%
-60%
-40%
-20%
0%
20%
40%
$-
$100
$200
$300
$400
$500
$600
DeVry - DV UoP -APOL
Strayer -STRA
GrandCanyon -
LOPE
Ashford -BPI
AshfordMilitary
AMU -APEI
% D
iffe
ren
ce
$ p
er
Cre
dit
47%Affordable

AFFORDABILITY ACCESS QUALITY SUCCESSACCESS
• Better Student Benchmarking Data
• Rich Data on Outcomes
• Used By 40 Institutions
• Assessment of Learning Data
Apple™/ Android™
MOBILE ACCESS
• Constellation
• Students
• Grade Book
• Admin
• Classroom
• Faculty
} • More Affordable
• Proprietary Learning Platform
• Rapid uptake
• Patent Pending&
ACCESS through TECHNOLOGY

AFFORDABILITY ACCESS QUALITY SUCCESSQUALITY
Quality Initiatives
Learning
• Additional Full-Time Faculty
• Smaller Class Sizes
• Continued Technology Investment
• InsideTrack
University Advisors
• Extend relationship to 26 wks
• Problem-solving Focus
Student Support
• 2 Advisors thru 4th Course
• Predictive Modeling
• Better Persistence
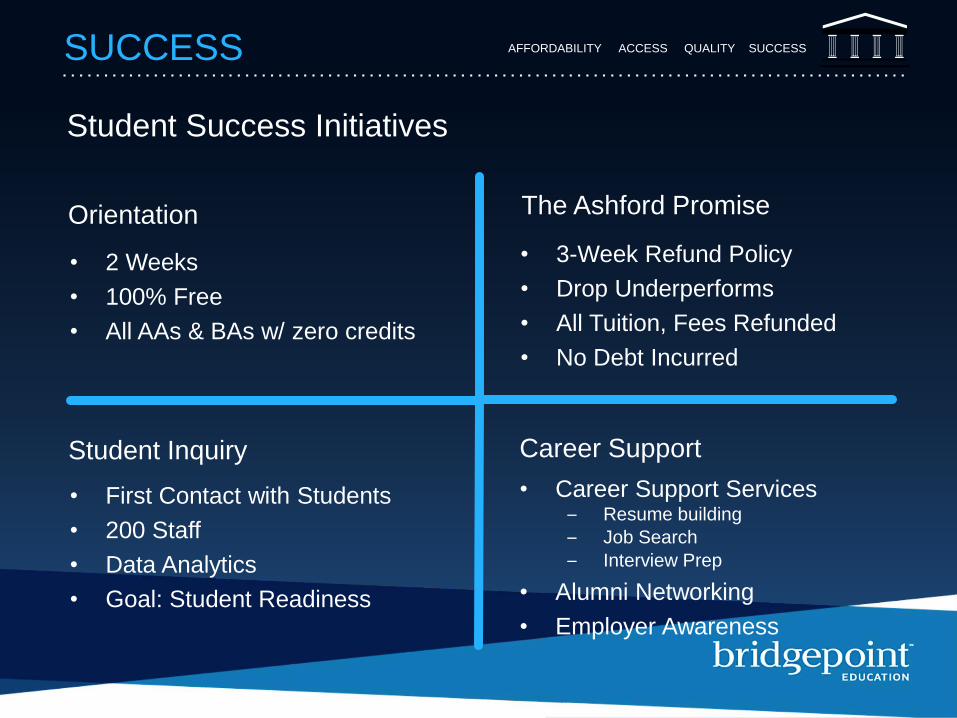
AFFORDABILITY ACCESS QUALITY SUCCESSSUCCESS
Student Inquiry
• First Contact with Students
• 200 Staff
• Data Analytics
• Goal: Student Readiness
Orientation
• 2 Weeks
• 100% Free
• All AAs & BAs w/ zero credits
The Ashford Promise
• 3-Week Refund Policy
• Drop Underperforms
• All Tuition, Fees Refunded
• No Debt Incurred
Career Support
• Career Support Services– Resume building
– Job Search
– Interview Prep
• Alumni Networking
• Employer Awareness
Student Success Initiatives

BRAND
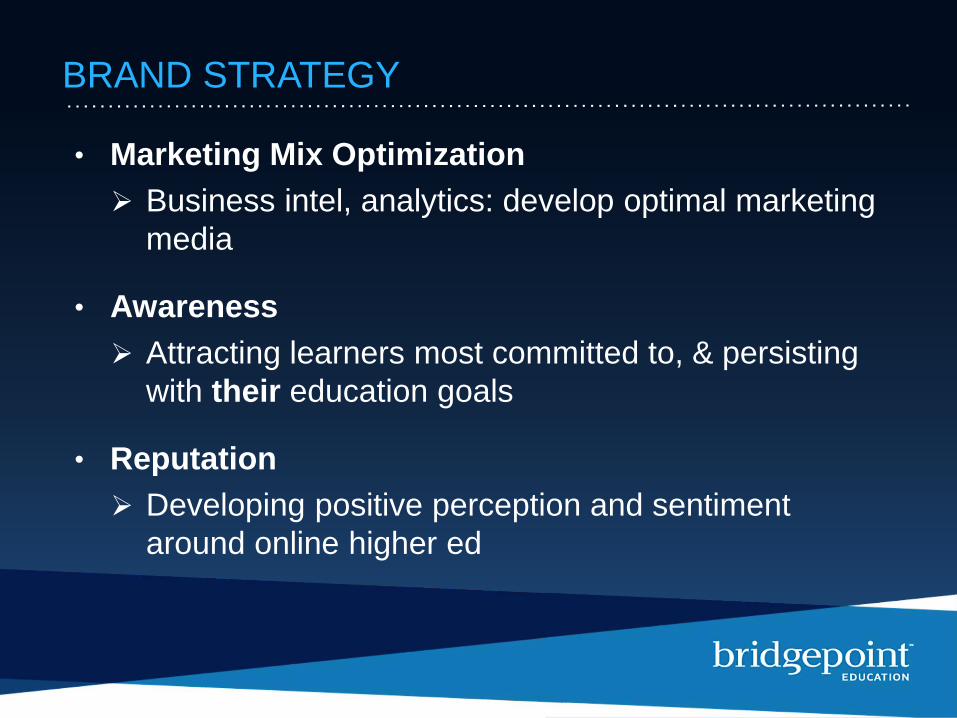
BRAND STRATEGY
• Marketing Mix Optimization
Business intel, analytics: develop optimal marketing
media
• Awareness
Attracting learners most committed to, & persisting
with their education goals
• Reputation
Developing positive perception and sentiment
around online higher ed
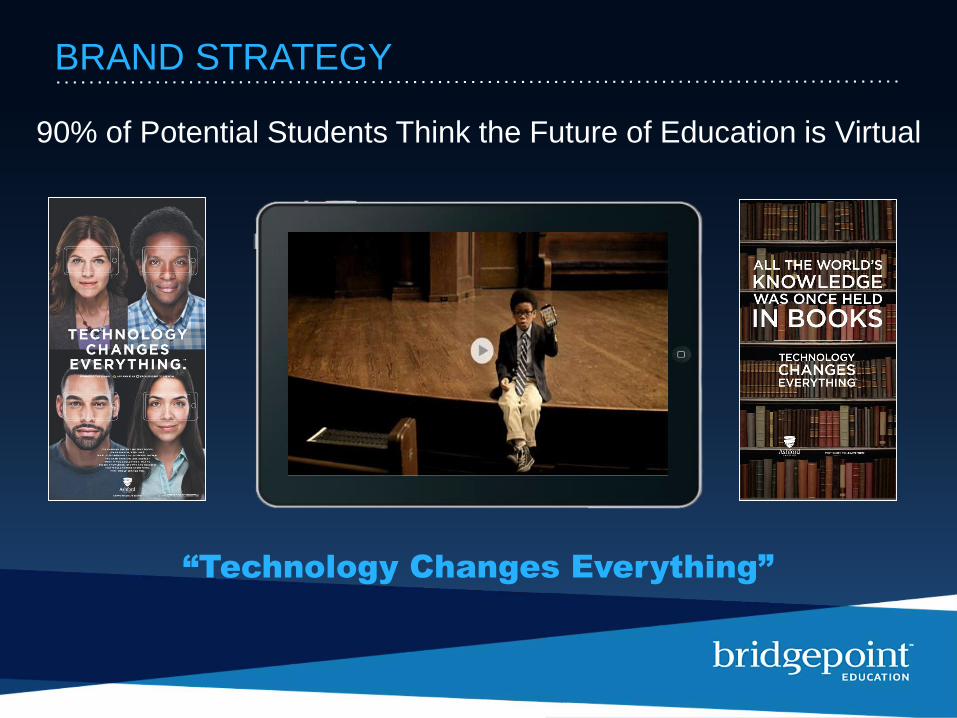
BRAND STRATEGY
“Technology Changes Everything”
90% of Potential Students Think the Future of Education is Virtual
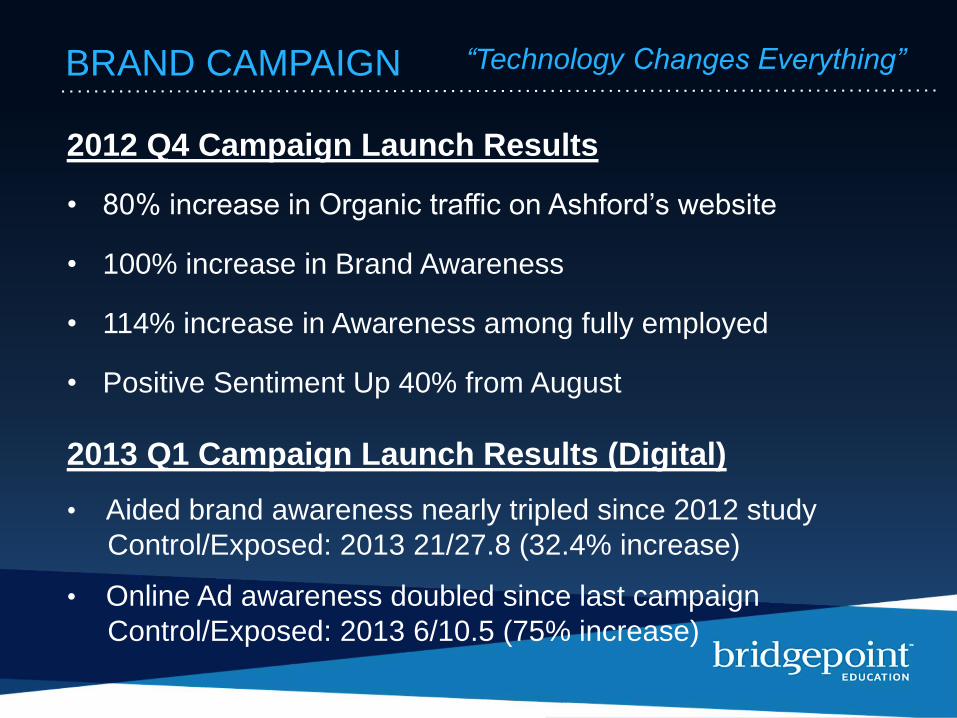
BRAND CAMPAIGN “Technology Changes Everything”
2012 Q4 Campaign Launch Results
• 80% increase in Organic traffic on Ashford’s website
• 100% increase in Brand Awareness
• 114% increase in Awareness among fully employed
• Positive Sentiment Up 40% from August
2013 Q1 Campaign Launch Results (Digital)
• Aided brand awareness nearly tripled since 2012 study
Control/Exposed: 2013 21/27.8 (32.4% increase)
• Online Ad awareness doubled since last campaign
Control/Exposed: 2013 6/10.5 (75% increase)
2013FINANCIAL REVIEW
AFFORDABILITY ACCESS QUALITY SUCCESS
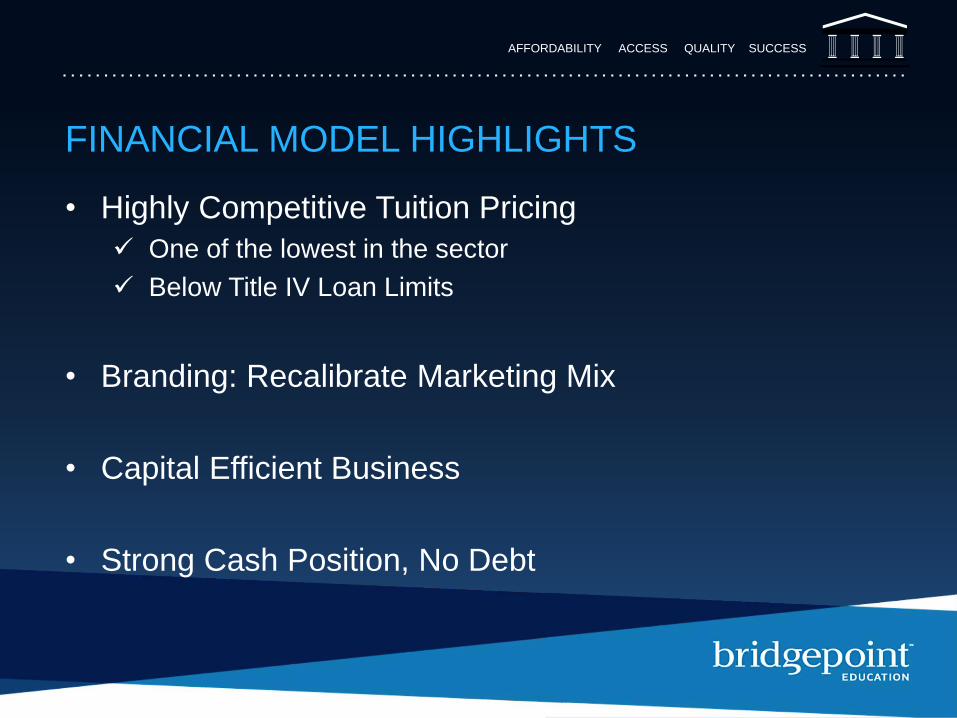
FINANCIAL MODEL HIGHLIGHTS
• Highly Competitive Tuition Pricing
One of the lowest in the sector
Below Title IV Loan Limits
• Branding: Recalibrate Marketing Mix
• Capital Efficient Business
• Strong Cash Position, No Debt

AFFORDABILITY ACCESS QUALITY SUCCESS
CONSISTENT REGULARTORY METRICS
2012 2011 2010 2009
Ashford 2-Yr. CDR --- 10.1%* 10.2% 15.3%
Rockies 2-Yr. CDR --- 4.9%* 4.0% 3.3%
Ashford 3-Yr. CDR --- --- 16.3%* 19.8%
Rockies 3-Yr. CDR --- --- 8.0%* 3.3%
Ashford 90 /10 Ratio 86.4% 86.8% 85.0% 85.5%
Rockies 90 /10 Ratio 87.3% 85.0% 85.9% 84.6%
*draft data
AFFORDABILITY ACCESS QUALITY SUCCESS
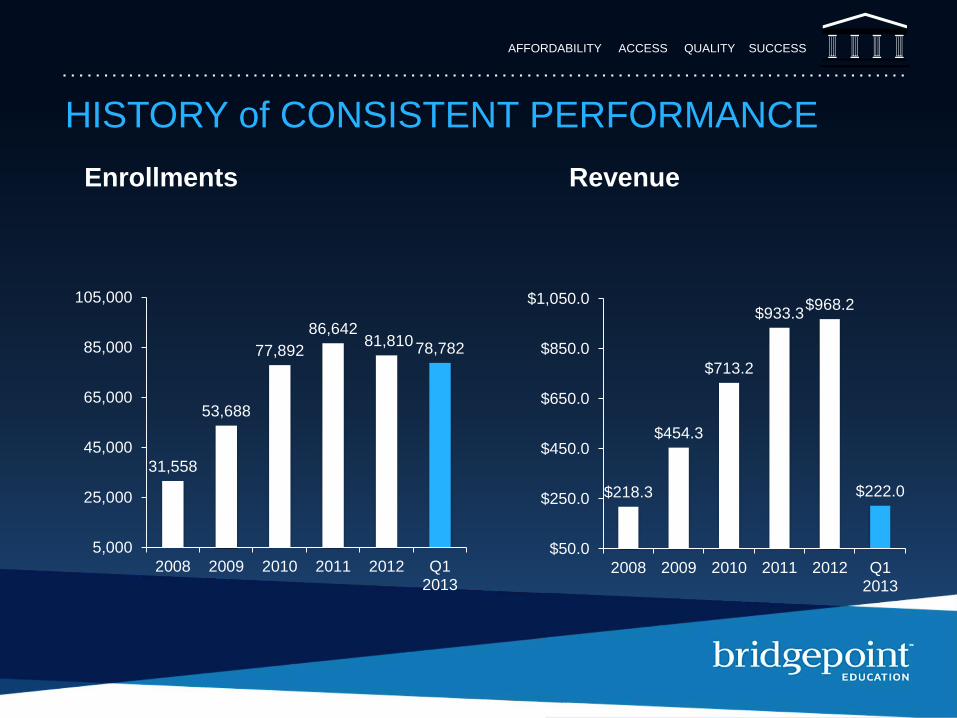
HISTORY of CONSISTENT PERFORMANCE
31,558
53,688
77,892
86,64281,810
78,782
5,000
25,000
45,000
65,000
85,000
105,000
2008 2009 2010 2011 2012 Q12013
Enrollments
$218.3
$454.3
$713.2
$933.3$968.2
$222.0
$50.0
$250.0
$450.0
$650.0
$850.0
$1,050.0
2008 2009 2010 2011 2012 Q12013
Revenue
AFFORDABILITY ACCESS QUALITY SUCCESS
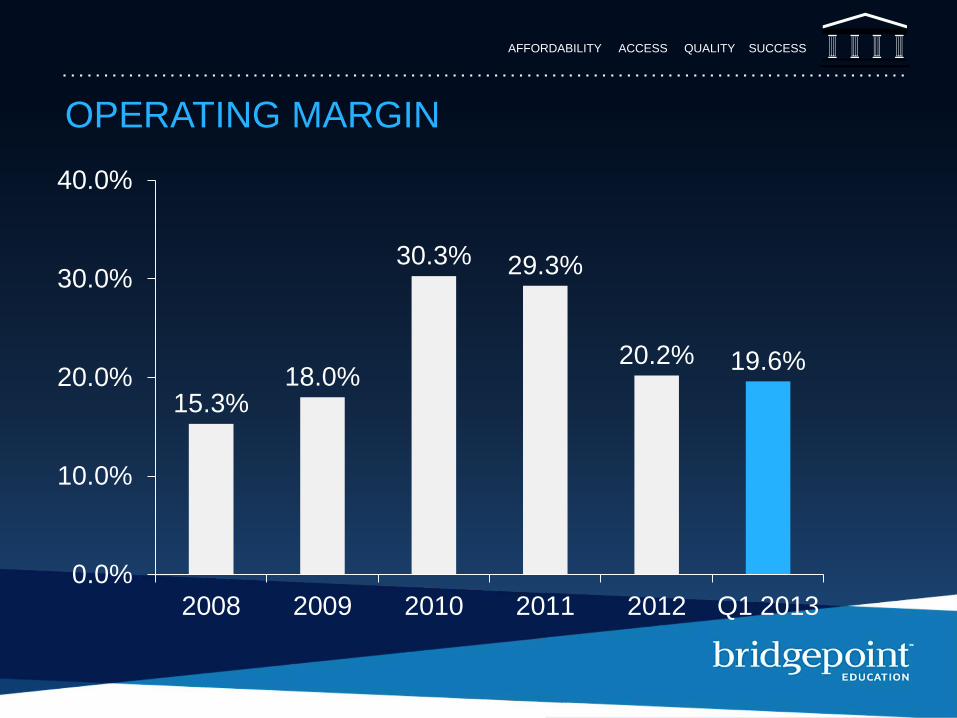
OPERATING MARGIN
15.3%18.0%
30.3% 29.3%
20.2% 19.6%
0.0%
10.0%
20.0%
30.0%
40.0%
2008 2009 2010 2011 2012 Q1 2013
AFFORDABILITY ACCESS QUALITY SUCCESS
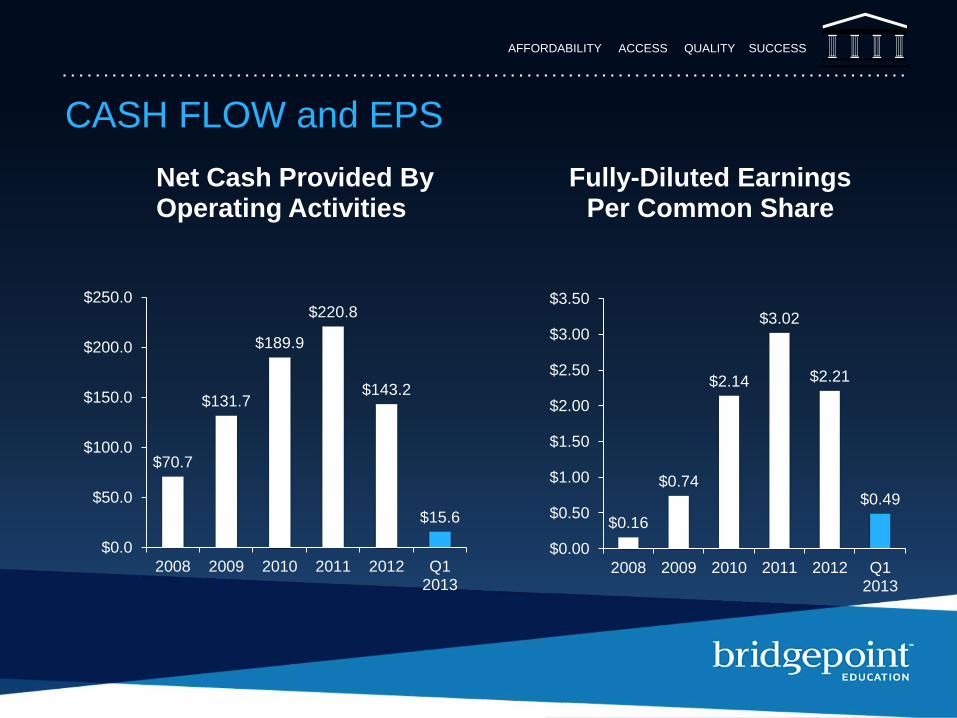
CASH FLOW and EPS
$70.7
$131.7
$189.9
$220.8
$143.2
$15.6
$0.0
$50.0
$100.0
$150.0
$200.0
$250.0
2008 2009 2010 2011 2012 Q12013
Net Cash Provided By Operating Activities
$0.16
$0.74
$2.14
$3.02
$2.21
$0.49
$0.00
$0.50
$1.00
$1.50
$2.00
$2.50
$3.00
$3.50
2008 2009 2010 2011 2012 Q12013
Fully-Diluted Earnings Per Common Share
AFFORDABILITY ACCESS QUALITY SUCCESS
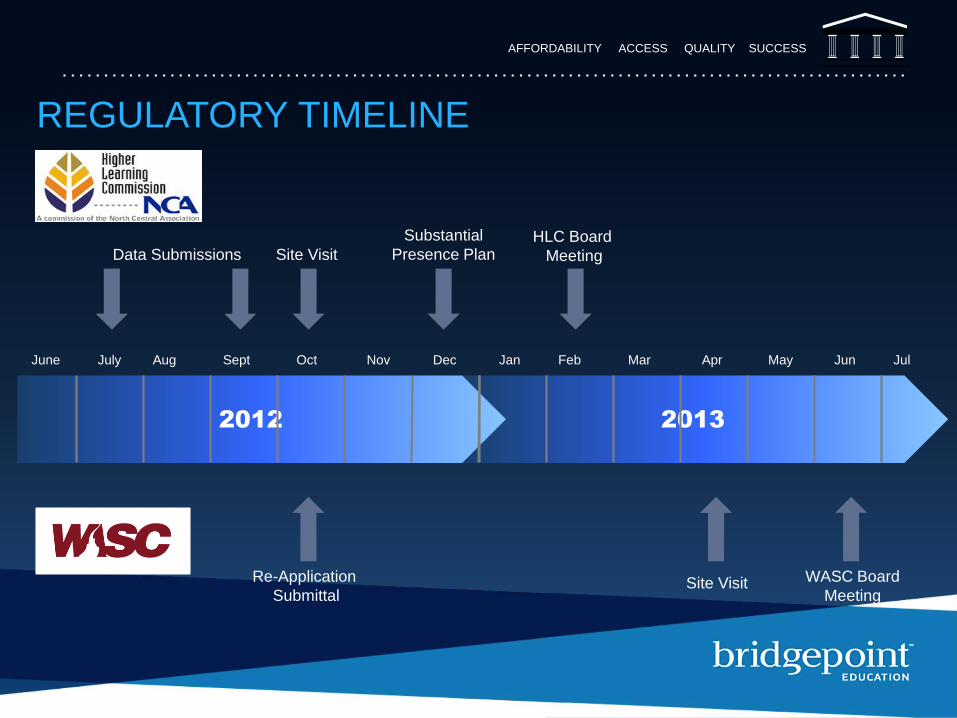
20132012
Data Submissions Site Visit
Substantial
Presence PlanHLC Board
Meeting
Site VisitRe-Application
Submittal
WASC Board
Meeting
June July Aug Sept Oct Nov Dec Jan Feb Mar Apr May Jun Jul
REGULATORY TIMELINE