bank portfolio exposure to emerging markets and its ... portfolio exposure to emerging markets ......
TRANSCRIPT

Bank Portfolio Exposure to Emerging Markets and Its Effects on Bank Market Value
Gary S. Fissel, Senior Financial Economist Division of Research and Statistics
Federal Deposit Insurance Corporation Washington, DC
Email: [email protected]
Lawrence Goldberg, Professor of Finance Department of Finance University of Miami,
Coral Gables, FL 33124 Tel: 305 284-1869
Email: [email protected]
Gerald A. Hanweck, Professor of Finance School of Management
George Mason University 4400 University Drive
Fairfax, VA 22030 and
Visiting Scholar, Division of Insurance and Research, FDIC Tel: 703-993-1855
Email: [email protected]
January, 2005
WORKING PAPER 2005 – 01
We would like to thank the participants in the FDIC Research Seminar Series, the George Mason University School of Management, Finance and Accounting Seminar Series, and the Financial Management Association session. In particular, we would like to thank an FMA discussant, David Carter, and anonymous referees for helpful comments. The views expressed here represent those of the authors and do not necessarily reflect those of the FDIC or its staff.

1
Bank Portfolio Exposure to Emerging
Markets and Its Effects on Bank Market Value
Abstract
This study estimates a model of banking company equity returns taking into consideration book value and market value measures of their exposure to emerging markets debt. In this estimation, general systematic market factors, such as the rate of return on the S&P500 stock index and yields on a constant maturity 5-year Treasury note, are held constant such that the exposure variables are accounting for effects due to banks’ exposure to emerging market debt. The results, although not uniform among banking companies, support the hypothesis that the extent of exposure to emerging market debt are factored into the valuation of banking company equity contemporaneously. The inclusion of a market value indicator adds to the explanation of equity returns of some banks. It is also clear that knowing the extent of the exposure on a book value basis is important information alone that may allow investors to take account of or evaluate the effects of changes in banking company equity valuation from LDC debt exposures. We also perform an event study for three major debt crises to determine whether the market recognizes the effects of these events on bank valuation. The event study results show that there is little information from identifying the time period of the crises on banking company equity returns. Explanations for this are that the information of these possible crises has been embedded in bank changes in exposure and that the market valuation of the emerging market debt is already accounted for by our model.

2
Bank Portfolio Exposure to Emerging Markets and Its Effects on Bank Market Value
I. Introduction Large U.S. banks have been heavily exposed to debt from emerging countries. As these
countries have encountered serious financial problems, the value of emerging country debt has
decreased, with a potential negative impact upon banks. This paper addresses the issue of whether
the market, through the equity price of the banks, fully values these debt valuation changes. Crucial
to the analysis is whether the information about individual country debt holdings of large U.S.
banks is sufficiently transparent so that it can be recognized by investors. Market participants may
only be aware of the total foreign debt exposure of the banks, but not the exposure from individual
countries. The extent of general knowledge about country exposure will affect the degree to which
changes in the value of country debt is reflected in the value of bank equity. This paper examines
whether country debt valuation is reflected in bank stock prices overall and during the periods of
financial crises.
The devaluation by Mexico of the peso on December 20, 1994, the rapid depreciation of the
Thai baht and Indonesian rupiah in the Fall of 1997, and the Russian ruble devaluation by over 60
percent in 2 weeks in August 1998, followed by massive infusions of capital by the IMF to avert an
international monetary crisis, serve as a reminder of the financial and political instability of many of
the lesser developed countries and emerging markets. As a consequence, lenders and investors to
Mexico, Russia. Indonesia, the Philippines, or other emerging nations, must rely upon the
timeliness and willingness of international organizations, central bankers of major industrialized

3
countries, and the world’s bankers to provide funding to avert crises and support investor value –
bank or nonbank.
The experience of the less developed country (LDC) debt crises of the 1980s provides
substantial evidence that few, if any, long term solutions are viable. The swap of bank loans for
security debt under the Brady plan – so-called Brady bonds – is a solution applied to a special case.
During the period beginning with the 1982 Mexican default to about 1990 with the institution of the
Brady Plan, U.S. banks with large exposures reserved for large LDC losses, showed poor
profitability relative to others in the industry, and were the subject of intense supervisory scrutiny
and capital adequacy forbearance by bank supervisors. Based on this experience, U.S. and global
banks may be unwilling to accept large emerging markets risk exposures again without substantial
guarantees beforehand. With the extensive growth of capital markets in many nations, the vehicle
for investment has expanded as have the risks arising from the fragility of emerging markets
countries.1 In other words, the growth of these markets may compound the problem if several
nations suffer economic set backs simultaneously as happened during the 1980s, 1994, 1997 and
1998.
The unexpected component of the devaluations in emerging markets economies’ currencies,
which began in July 1997 with the run on the Thai baht, to the more recent devaluation of the
Russian ruble in August 1998 took a considerable toll on commercial and investment banking
companies' market valuations. Although the initial impact of the Asian crisis did not seem to have a
major impact on large bank valuation (see Figure 1), these banking companies suffered considerable
losses in market value triggered by the Russian devaluation, declared default on former Soviet
Union debt, Russian financial system collapse, and the uncertainty of possible spillover to Latin
1 For a useful summary, see the Wall Street Journal supplement, p. R6, January 2, 1997.

4
American emerging markets (e.g., Brazil in particular). The exact path of causation is not clear, but
by early October 1998, money center bank stock prices had fallen 37 percent from their highs in
early July 1998 (see the S&P Money Center Bank Stock index Figure 1) and 10 to 30 percent for
some banks in the 2 weeks following the suspension of the conversion of the ruble.2 Some banks
(e.g., Bankers Trust, Citigroup, BankAmerica and J.P. Morgan) were trading at or below their
previous 12-month lows several weeks after the Russian financial system collapse. Although, most
U.S. banking companies had manageable direct exposures to Russia, they had considerable
exposure to other banks that did have considerably greater direct exposure to Russia (e.g., German
banks). At the same time, these banks experienced a considerable fall in trading operation volumes
and revenue because of the global market turmoil. Furthermore, data on the debt of emerging
markets countries showed a doubling of the spread over comparable U.S. Treasury securities,
doubling and in some cases tripling after the Russians announced suspension on their foreign debt
on August 17, 1998 (Russian debt spreads went from 300 bp three months before to over 10,000 bp
after the announcement). This evidence clearly suggests a very close relationship between major
banking company market values and the events in emerging markets.
Casual observation of the data makes it appear that crises have had a significant impact on
valuation. The banking company market value response to the unexpected part of the Russian
default and devaluation was considerably greater than for the previous currency crises. For
example, the Mexican peso devaluation in December 1994 was associated with a roughly 16
percent decline in the market value of large banking companies over several months. However,
market values quickly recovered (see Figure 1). The Asian crisis witnessed a larger absolute
market value decline, but about the same 16 percent as the Mexican peso crisis in 1994-1995.
2 The S&P Money Center Bank Stock Index (SBKMC from Bloomberg) and the Wall Street Journal, "Financial Firms

5
Again, however, bank stock values recovered quickly, reaching previous highs within six months
(Figure 1). In contrast, bank stock values significantly faltered after the August 1998 Russian
events and had not reached previous highs by 2002. In addition, spreads on subordinated debt
widened rapidly in 1998 and continued to be high for major banks (Figure 2) during the period of
our analysis.
This study systematically analyzes these relationships using current period and historical
data on individual bank exposure to LDC and emerging markets debt in the 1990s. The study is
limited by data availability and covers the period from 1991Q1 to 1998Q4. The bank exposure data
are available quarterly, but since they are confidential, bank exposure to individual countries may
not be widely recognized by the markets. The data period ends in 1998 because of the numerous
mergers that occurred after 1998 that reduced significantly the number of banks that could be
analyzed and because our foreign bond data sources were not available for later periods. Even with
these limitations, this period encompasses four major currency and financial markets crises related
to emerging markets and a severe period of bank financial distress in the early 1990s arising from
the real estate speculation of the 1980s. This is followed by a period of record bank profitability
and market valuation increases from 1995 to mid-1998. Although only three phases of a single
business cycle are covered by this period, there are numerous important financial and emerging
market events that have occurred. As a consequence, it provides a good test of the major hypothesis
of this paper that the securitization of emerging markets debt permits information to be generated
that improves the valuation of such debt and the equity value of those banking companies lending to
these countries.
Lose $8 billion So Far," p. A2, September 3, 1998.

6
The next section provides a literature review and description of the model used in the study.
The third section describes the empirical methods and results. The final section concludes. As
discussed there, the results of the paper demonstrate that for most of the ten bank holding
companies in the empirical analysis, changes in the market value of emerging market debt are
reflected in changes in the market value of the banks exposed to that debt. The effect of the market
value change from a change in LDC debt values depends on the degree of exposure and the
composition of that exposure to various countries. An alternative hypothesis is that investors may
be willing to accept changes in LDC debt exposure if they are convinced that banks are able to
manage the risk better because of the secondary markets in this debt, while at the same time
knowing that LDC debt is more risky than many other types of bank debt.
II. The Study and Literature Review
This paper estimates the changes in bank market value resulting from bank exposure to LDC
and emerging markets debt. The market value of emerging market debt and the extent of exposure
provide an opportunity to estimate the impact this exposure would have on bank market values.
The primary hypothesis is that bank credit exposures to emerging markets’ risks may be reflected
over time in the value of the bank stock. A second related hypothesis is that the effect will be
recognized to a larger extent at the times of severe financial crises. Alternatively, the market may
not reflect the effects of exposure to individual countries because market participants are not
sufficiently aware of the extent of country exposure of individual banks. Overall bank exposure to
LDC debt may be more transparent and will be reflected in bank stock prices.
There is a large literature on the effects of LDC debt crises on bank stock valuation – all
using event study methodologies. The earliest studies examined the response to the Mexican debt

7
crisis of 1982. Schoder and Vankudre (1986) found a negative and insignificant relationship to this
crisis, while other studies (Cornell and Shapiro [1986], Smirlock and Kaufold [1987], Bruner and
Simms [1987], and Kyle and Wirick [1990]) found negative and significant relationships with
banks’ financial market valuations. In addition, Musumeci and Sinkey (1990) and Karafiath, Mynatt
and Smith (1991) document negative and significant market value effects from the Brazilian debt
moratorium of 1987. Finally, Slovin and Jayanati (1993) found similar significant and negative
effects from Latin American debt moratoriums.
In contrast to much of the previous literature, our study can avoid the pitfalls of the event
study methodology by using emerging markets debt market valuations, in terms of the change in
debt prices, to account for the timing of events.3 Fundamentally, we measure events by the level
and changes in value of emerging markets debt. When these values are coupled with book value
estimates of the extent of bank exposure to emerging markets debt, a more complete picture
emerges of the extent of the effect an event will have on banking company equity values. We use in
this regard a three-stage-least squares estimation procedure to gain the system-wide effects on bank
valuation from changes in emerging markets debt values. In a second empirical analysis we also
include a dummy variable for the events in order to estimate the effects of the events as has been
done in the previous studies.
The Model4
The impact of emerging markets debt exposure on a banking company's market value should
reflect both the extent of the exposure and the size of the change in market values of the emerging
market debt, with all other factors held constant. Thus, a change in the banking company's market
3 These data could also be used in an event study framework by analyzing the cross-sectional differences in abnormal returns. However, the more continuous nature of the methodology used in the present study need not attempt to identify specific dates or date ranges of events, but only the effect of the events on debt market values.

8
value should equal the change in the value of the emerging market debt if this were the only factor
changing:
∆MV = ∆MVEmg (1)
Alternatively, in proportional changes:
tt MV
MVEmgMVMV ∆
=∆ (2)
These changes include both the default risk component and the general interest rate change
component of market value changes in MVEmg.
Unfortunately, this simple relationship does not have a practical empirical equivalent
because the market value of all emerging market debt held by a banking company is unobservable.
What are observable are book value exposures and some emerging market bond values for bonds
that are traded. One way to incorporate this information into the model is to use the approach
adopted by Kyle and Wirick (p. 765, 1990). They assume that changes in the book value of
emerging market debt are zero or small from one period to another (in our study from quarter to
quarter). Expanding equation (2) to reflect this assumption and multiplying each term by the book
value of emerging market debt (BVEmg) over the book value of emerging market debt,
BVEmgt/BVEmgt for each time index, t:
t
t
t
t
t
t
t
t
t MVMVEmg
BVEmgBVEmg
MVMVEmg
BVEmgBVEmg
MVMV
−=∆ +
+
+ 1
1
1 (3)
Defining a variable γt as the market to book value of emerging market debt for each t:
γt = MVEmgt/BVEmgt, for all t, (4)
4 The model developed in this paper is similar to that of Kyle and Wirick (1990) in their study of the 1982 Mexican debt suspension.

9
and using the assumption that the book value of debt changes imperceptibly from quarter to quarter
so that BVEmgt+1 ≈ BVEmgt, equation (3) simplifies to:
( )t
ttt
t MVBVEmg
MVMV γγ −=
∆+1 (5)
From equation (5), the proportional change in market value is now related to a measure of
the initial period exposure rate in terms of the book value of emerging markets debt to the initial
market values of the bank and a term, γt+1 - γt, that measures the change in the unobserved emerging
markets debt value to its book value. To empirically proxy for this variable, some indicator of the
emerging markets debt market values must be used. In this study, we use data on emerging
markets' bond prices, primarily Brady Bonds, which are publicly traded. Specifically, the
proportional change in the bond prices is used to proxy for γt+1 - γt. This approach is unique in
research analyzing bank market value responses to changes in debt values because debt values have
not been available until recently.
To account for systematic factors in the markets for bank equity, we postulate a two-factor
CAPM into the model. The factors are a proxy for the market return using the return on the
S&P500 index, SPRET, and an interest rate factor, the yield to maturity on the constant maturity 5-
year Treasury note from the H.15 Release of the Federal Reserve Board. Previous studies have
indicated that an interest rate factor is important for banking companies since these companies are
subject to considerable interest rate risk that may not be reflected in the market return proxy. The
precise relationship will depend on an individual bank’s duration and maturity repricing structure of
assets versus liabilities. If the bank were long fixed rate assets funded by short-term liabilities, we
would expect that an inverse relationship should exist. If the opposite were to occur, then a direct
relationship should be found. If a balanced portfolio is the case, then no relationship could result. A
10
term structure variable, defined as the difference between the yield on the 5-year Treasury note and
the 3-month Treasury bill yields (properly adjusting for the discount to coupon yield for Treasury
bills), was tried, but not reported in this paper. This term structure proxy proved to add nothing to
the performance of the estimation.
The model to be estimated has the following form:
tjtjjtjj
tjjtjjtjtjjtj
BDPRCCHGEXPMVBDPRCCHG
EXPMVTEXPSTNOTESPRETChngMV
,,,6,,5
,,4,,3,2,1,
_
_
εββ
ββββα
+++
++++= (6)
where SPRET is the market return proxy, TNOTE is the yield to maturity of a constant maturity 5-
year Treasury note, S_TEXPCB is the total foreign debt exposure to total assets, EXPMV is the
book value of emerging market dept exposure to the market value of the firm, BDPRCCHG is the
unweighted, proportional change in emerging market debt prices at annual rates,
EXPMV_BDPRCCHG is the interaction of debt price changes and EXPMV, j indicates a bank and
t indicates the time period. Each variable is defined more extensively in Table 1 along with the
means and standard deviations for all the banks pooled.5
This model allows for independent effects of unweighted bond price changes, BDPRCCHG.
Weighted bond price changes where the weights are the proportion of the book value of exposure
for each bank was tried but added nothing and the results are not included. The interaction of bond
price changes and exposure to banking company market value, EXPMV_BDPRCCHG, is a direct
result of the model developed above. Narrowly, this structure does not follow directly from the
model presented in equation (5), but is an attempt to achieve an approximation accounting for the
market value changes of emerging markets debt. However, it must be recognized that the indicator
of market value effects of emerging market debt are basically indices of these value changes so that
5 For reasons of confidentiality, individual bank means and standard deviations can not be presented.

11
having different variables trying to establish this effect may be more empirically sound than
following the model explicitly.
The expected sign of the relationship of the change in market value of a bank with SPRET,
β1,j, will be positive for most banks since systematic risk of the market influences banking company
market value returns in a positive direction. Since banks may not have uniform interest sensitive
portfolios, lesser or greater interest rate risk may be associated with a rise in interest rates so that we
expect that β2,j may take on positive or negative values depending on the interest rate repricing and
maturity structure of a banking company's assets and liabilities. It is also possible that banks with
balanced asset and liability repricing and maturity structures will show no effect of interest rate
changes on market values.
In terms of the variables used as proxies for banking company's emerging markets
exposure, we expect that usually greater exposure in combination with changes or levels of credit
risk valuation will have a negative impact on banking company stock returns as these variables
increase. In some cases the markets may believe that banks can absorb and monitor these risks such
that added exposures will increase market value. So that we expect that coefficients β3,j and β4,j
should be negative for most banking companies, but could have positive values in some cases. In
particular, an increase in LDC debt exposure to total assets, S_TEXP, implies an increase in
exposure to historically risky debt relative to all assets and will depress returns on bank equity. A
similar effect is expected for the exposure relative to the market value of the banking company,
EXPMV.
To proxy for changes in the market value of LDC debt we use two variables: a proportional
change in Brady bond prices (at annual rates) for emerging markets countries, BDPRCCHG, and
the interaction of this variable with the total exposure relative to market value,
12
EXPMV_BDPRCCHG. The respective estimated coefficients, β5 and β6, are expected to have
positive signs. That is, a decrease in LDC debt prices will decrease the bank’s market value and the
effect of a change in LDC debt prices will be greater the larger the bank’s exposure. However, a
negative sign might occur for the relationship with EXPMV depending upon the dominance of the
LDC debt value change and the level of exposure since the effect of the level of exposure is
expected to be negative.
III. Data and Results Individual Bank Results Using Bond Price Changes to Indicate Changes in Risk The model in equation (6) was estimated for ten large banking companies separately, using
3SLS methods, over the period 1991Q1 through 1998Q4 using quarterly data that maintained
investment in emerging markets. The study employs individual bank data collected by the Board of
Governors of the Federal Reserve System for ten large banking companies on exposure to major
emerging markets countries on a quarterly basis from 1991 through 1998. These data have never
been used in this form in any studies of bank market value and also, importantly, are not available
to the general public. These data are combined with information on the market value of securitized
LDC debt, primarily Brady Bonds, Institutional Investor Country Credit Ratings, and information
from banking holding company, BHC, quarterly reports of Income and Condition (FRY9 Reports),
in order to identify the factors affecting the market value of banks. The frequency of the
observations was limited to quarterly because of the reporting frequency of the debt exposure in the
Federal Reserve Board’s Country Exposure Report and other financial statement data from the
Bank Holding Company quarterly FRY9 reports. Only a limited number of U.S. banks have
significant exposure to emerging country debt. In recent years there have been a number of mergers
among these banks and this has greatly reduced the number of banks that we could analyze. None

13
of the large banks failed during this time period so we do not suffer from biases due to poorly
behaving institutions disappearing. We end the analysis in 1998 because if we expanded the time
period we would lose through mergers Bankers Trust to Deutsche Bank, the Bank Boston to Fleet
and JP Morgan to JP Morgan/Chase from our sample.
The results for equation (6) are the only ones reported because they are more extensive and
proved to be of considerably greater explanatory power than those of other models. This is an
important finding in itself since it demonstrates that both the changes in LDC debt prices, when
coupled with the level of exposure, are together important factors in affecting market values of
banking companies.
The banking companies used in this study reported foreign debt exposure for all of the
periods used. They also are likely to be affected by similar economic events since they are all large
money center and global banking companies. In order to account for these system-wide effects, we
use a three-stage-least squares estimating procedure where each bank is entered as a separate
equation. The second model equation that is used for each bank develops an instrumental variable
for total book value LDC debt exposure relative to total assets, S_TEXP. Since the 3SLS results do
not have goodness of fit statistics, the statistics for the 2SLS results are used. In particular,
estimated equations for each bank are highly significant at better than the 1 percent level with
adjusted R2 of between 0.25 and 0.64 (Table 2). When we compared the first stage regression
results with the final 3SLS regression results, there was clear evidence that there are efficiency
gains by using a system estimation approach. This result confirms that there are common factors
among the banks in our sample. The entire system R2 for the 3SLS estimates is 0.89.6
6 The degree of multicollinearity is slight among the explanatory variables. The largest correlation coefficient of 0.22 is between TNOTE and EXPMV, with all others being absolutely less than 0.07.

14
The 3SLS regression results are presented in Table 2 along with corresponding t-statistics.
For each BHC, the coefficients for the market return, SPRET, has the hypothesized positive sign
and is statistically significant at the 1 percent level or better. For six BHCs, the 5-year constant
maturity yield, TNOTE, had a positive sign and was statistically significant at least at the 5 percent
level and usually better (Table 2). For two other banks, the coefficient was statistically significant at
least at the 10 percent level with a negative sign. Both of these results for market variables, along
with the wide variation in the size of coefficients for SPRET and the sign for TNOTE, indicate that
there are considerable differences among bank portfolios giving rise to differences in their
relationships and responses to contemporaneous general market conditions.
For nine of the ten banking companies, the coefficients for at least one of the exposure
variables, S_TEXP and EXPMV, was statistically significant and five of these had a negative sign
and was statistically significant at least at the 10 percent level and usually better. Only in one case,
Citicorp, were both coefficients positive and statistically significant and in one case, JPM, only one
of these variables was significant, but with a positive sign. For five of the banking companies, the
partial derivative of the change in equity market return with respect to a change in exposure was
negative and significant, while in three cases there was a positive and significant relationship. These
results support that the market relates increasing LDC debt exposure with market valuation.
The second principal focus of this paper is on the effect of LDC debt values on banking
company market values. Note that the information on bank exposure to debt for individual countries
is confidential, and market participants may not be adequately apprised of the country holdings of
the major banks. This lack of knowledge may prevent changes in LDC debt values from having a
significant impact on the market price of the bank. In fact, the impact of changes in debt values
may only be observable around heavily publicized and significant events that affect the value of the

15
debt of an emerging markets country. We test for the effect of identifiable emerging market crisis
events in the last part of this section.
For three banking companies, the unweighted average LDC bond price change variable,
BDPRCCHG, or the variable measuring the interaction of this variable with exposure to market
value, EXPMV_BDPRCCHG, is positive, as hypothesized, and statistically significant at least at
the 10 percent level. These banking companies are BAC, BT and CMB. Using these two variables
jointly provides a more complete interpretation of the effect on the changes in the market value of
LDC debt, ceteris paribus, for the three banking companies where at least one of these variables is
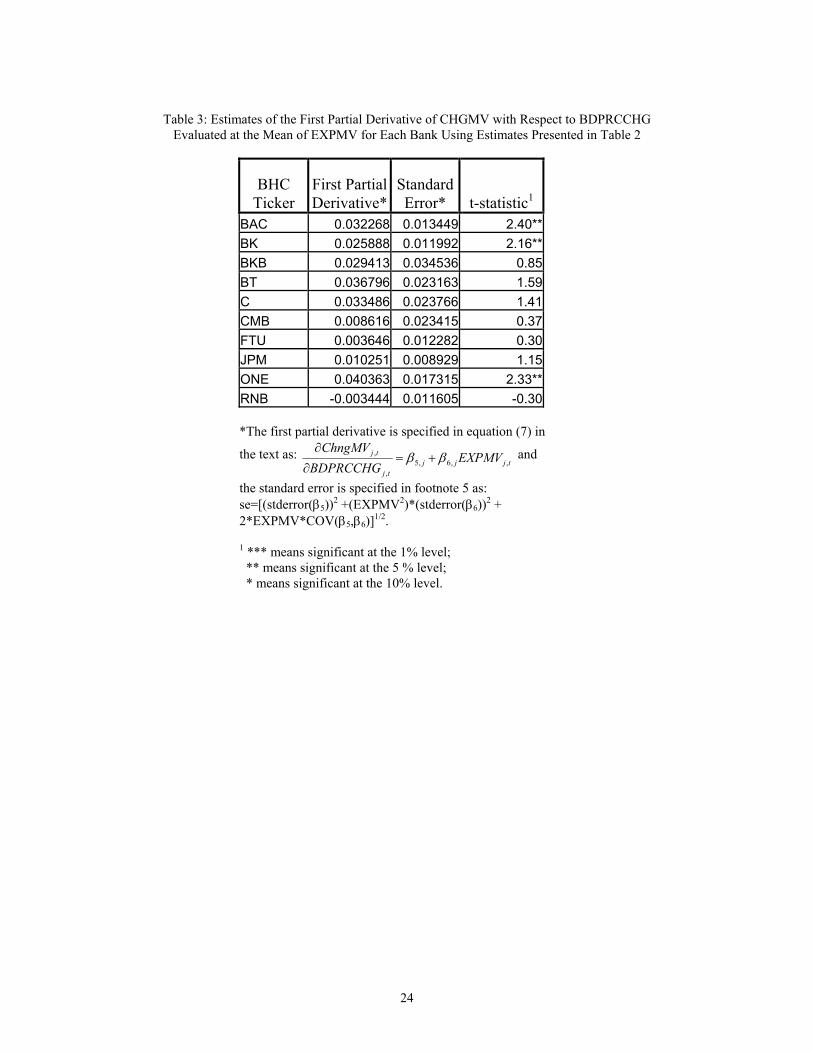
significant. This entails taking the first partial derivative of the proportional change in market value
with respect to a change in bond price changes. This relationship is shown below in equation (7):
tjjjtj
tj EXPMVBDPRCCHG
ChngMV,,6,5
,
, ββ +=∂
∂ (7)
The values for this relationship, evaluated at the mean value of EXPMV for each of the ten banks,
along with an estimate of their standard errors, are shown in Table 3.7 In the case of three banks, the
partial derivative was positive, as hypothesized, and statistically significant. The banks are BAC,
BK and ONE. In no case were any of these derivative values statistically significant and of a
negative sign. Furthermore, with the exception of RNB, all of the partial derivatives had a positive
sign. These results suggest that, after controlling for the exposure of the bank to LDC debt, there is
a significant positive relationship between the change in the market value of LDC debt and the
equity returns at the means for these large banking companies.
In summary, although varying substantially among banks in coefficient value, these results
indicate that, for 8 of the 10 major banking companies, there is a statistically significant relationship

16
between the changes in the market value of these banking companies and the extent of the value of
their exposures to emerging markets. Furthermore, for 5 of these the sign was negative indicating
that LDC debt exposure is recognized by the markets to add to a bank’s credit and market risk. One
interpretation of these results is that, in order to properly evaluate the return on banking company
equity, the exposure of a significant portion of a company’s portfolio to emerging markets must be
incorporated into the standard two-factor model and, more generally, into the analysis. Furthermore,
the inclusion of a market value indicator of this debt exposure adds significantly to the explanation
of changes in equity returns of these companies in an interactive way with debt exposure. This
specification was indicated by the model and proved, for at least three banks, to be positive and
statistically significant. On its face, this result may support the validity of this model and suggests
several interpretations. Investors may be willing to accept changes in LDC debt values knowing that
banks are able to manage the risk while at the same time recognizing that LDC debt is more risky
than many other types of bank investments. Additionally, investors may not be able to incorporate
changes in the market value of bank foreign lending, except for certain banks that may make it
known to the market, into the market value of the bank because exposure data are confidential and
LDC bond values are not readily available. In cases where they are, the market may take these
jointly into account and price the banks equity accordingly.
Event Studies
As discussed earlier, changes in the value of LDC debt may impact the value of banks only
in cases where there is a major change in the value of the debt, such as in the financial crises that
we have discussed. Only in these cases may investors in the stock of the large banks or their
holding companies have sufficient information to react. In order to test this possibility, we have
7 The standard error of the derivative is approximated by: se=[(stderror(β5))2 +(EXPMV2)*(stderror(β6))2 +

17
performed event studies on the bank stocks for three events discussed earlier, Latin America
(Argentina, Mexico, and Venezuela), Asian (Philippines), and Russian.
The 3SLS results of each of the event studies are presented in Tables 4, 5 and 6. We run
two equations for each of the ten banks with sufficient data to be included in the analysis. The
model used is the same as that used above with the addition of a dichotomous variable, CRISIS, for
the crisis window in each of the sets of equations for each of the separate crises. This variable is
constructed as dichotomous variable with a 1 for each of the two quarters preceding the crisis
quarter, the crisis quarter and two quarters following the crisis quarter and zero otherwise.8
Since the crises should have a negative impact upon bank market value, we would expect a
negative coefficient for the CRISIS variables if the crises had an immediate impact. For the Latin
American crisis six of the ten banks have negative signs on the coefficient of the dummy variable,
but none are significant at least at the 10 percent level (Table 4). However, one bank, BAC, has a
positive and significant coefficient indicating an increase in returns from the occurrence of the Latin
American crisis. One explanation might be that, with BAC’s historical exposure to Latin America,
investors considered BAC well positioned to manage its exposure and were not surprised by the
crisis.
For the Asian crisis, six banks have negative coefficients for CRISIS with only one
statistically significant at the 10 percent level, RNB. This is modest evidence that a financial crisis
impacted bank value, at least in one instance.
The Russian crisis followed closely on the heels of the Asian crisis with at least one quarter
overlap in the construction of our dichotomous variable. Five coefficients for the CRISIS variable
2*EXPMV*COV(β5,β6)]1/2.

18
are negative and none are significant. In addition, none of the banks with a positive CRISIS
coefficient are statistically significant either. These results are somewhat surprising given the
considerable debt market impact that followed this crisis (see Figure 2).
Overall, we only find limited evidence, using quarterly data, that the major financial crises
impacted the equity market value of the large U.S. banking immediately around the crisis dates.
One explanation for these results is that investors had already discounted the debt of the emerging
market countries leading up to the crisis period and this is reflected in the variable BDPRCCHG
and its interaction with EXPMV.
IV. Conclusions
This study estimates a 3SLS model of banking company equity returns taking into
consideration book value and market value measures of their exposure to emerging markets debt.
The 3SLS model is used to account for the interrelationships among banking companies in the study
and found that this approach gave more consistent estimates than OLS for each bank. In this
estimation, general systematic market factors, such as the rate of return on the S&P500 stock index
and yields on constant maturity 5-year Treasury note, are held constant such that the exposure
variables are accounting for effects arising from emerging market debt conditions. The results,
although not uniform among banking companies, support the hypothesis that the extent of exposure
to emerging market debt is factored into the valuation of banking company equity
contemporaneously. Furthermore, the inclusion of a market value indicator of this debt exposure
provides some additional explanatory power of changes in equity returns for some banks. It is also
8 This has been found to be reliable methodology for conducting an event study where banks are treated as homogeneous entities (see Goldberg, Hanweck and Sugrue, 1992, for the application of this approach to interstate banking).

19
clear that knowing the extent of the exposure on a book value basis is important information alone
that may allow investors to take account of or evaluate the effects of changes in banking company
equity valuation from LDC debt exposures. These results provide limited support for the contention
that securitizing emerging market debt and having the financial markets value it provides liquidity
for this debt and valuable information to all market participants.
Since many of the factors determining bank market value among banks are correlated, more
efficient estimates were made using the 3SLS methodology compared with simple pooling of cross-
section and time series or individual company time series estimation. The estimates were made for
each bank over the period from 1991Q1 to 1998Q4 using quarterly data. From these estimates it
was concluded that there is considerable variation in the reaction of the equity returns of these
companies to similar market factors. By taking advantage of the data that was assembled for this
study, an event-type of analysis was performed to more closely identify the effects of LDC crises on
individual bank equity returns. To accomplish this, a methodology used by two of the authors in
other studies was employed. The approach identifies the date of the crisis event and enters them as
dichotomous variables around the event date – two quarters before and after the crisis event quarter.
This has been found to be considerably more reliable than the typical event study where banks are
treated as homogeneous. Additionally, a more comprehensive analysis was done of each crisis over
the sample period. This allowed for identification of those types of crises that had the greatest
effect on bank market values and a comparison of the sensitivity of individual banks to changes in
LDC debt values. However, these extensions revealed only limited results beyond those excluding
the identification of crisis events. From one perspective, the lack of significance of crisis event
identification qualitative variables provides support for the hypotheses that the value of the
development of a market for emerging market debt can be used to avoid surprises from emerging

20
market crises and, with greater public knowledge of banking company book value of emerging
market exposures, provide investors with better information to make decisions on the effects of
these exposures on bank equity market values.

21
Table 1: Variable Definitions and Average Values*
Variable Name Variable Description Average
Values for all banks
Standard Deviation for all banks
CHNGMV Proportional change in market values on a quarterly frequency at an annual rate. 0.2794 0.6197
SPRET Market Return: Proportional rate of change of the S&P500 Index on a quarterly frequency at an annual rate. 0.1773 0.2661
TNOTE Yield to maturity on the 5-year constant maturity U.S. Treasury note from the Federal Reserve H.15 Release at annual rate. 0.0607 0.0087
S_TEXP** Total book value of foreign debt exposure to the sample emerging markets countries to total assets for each bank in percent using the Federal Reserve Country Exposure Report. 3.0659 0.8813
EXPMV Total book value of emerging markets debt exposure to the market value of each bank using the Federal Reserve Country Exposure Report. 0.4025 0.3108
BDPRCCHG Unweighted average emerging markets’ debt price proportional changes. 0.1570 1.2385
EXPMV_BDPRCCHG Interaction of the unweighted average debt price changes, BDPRCCHG, and EXPMV 0.1041 0.7454
N Number of observations 337 *Quarterly values are from 1991Q1 to 1998Q4. The banking companies are: BankAmerica (BAC), Bankers Trust (BT), Chase Manhattan (CMB), Citicorp (C), J.P. Morgan (JPM), Bank One (First Chicago/NBD) (ONE), First Union (FTU), Bank Boston (BKB), Republic (RNB) and Bank of New York (BK). ** The emerging markets countries included in the analysis are: Argentina, Brazil, Bulgaria, Costa Rica, Dominican Republic, Ecuador, Mexico, Morocco, Nigeria, Panama, Peru, Philippines, Poland, Russia and Venezuela.

23
Table 2: 3SLS Regression Results by Banking Company of CHGMV (Quarterly, 1991Q1 to 1998Q4)(Parameter estimates and t values)1
BAC Bank of America BK Bank of New York BKB Bank Boston
Variable Parameter Variable Parameter Variable ParameterName Estimate t Value Name Estimate t Value Name Estimate t Value
Intercept -1.7629*** -14.07 Intercept -0.0042 -0.04 Intercept -1.2324*** -4.93SPret_BAC 1.3398*** 20.58 SPret_BK 1.3549*** 22.32 SPret_BKB 1.0158*** 7.87Tnote_BAC 14.9875*** 6.54 Tnote_BK 10.6236*** 5.69 Tnote_BKB 27.5402*** 7.07S_Texp_BAC 0.2989*** 11.30 S_Texp_BK -0.2158*** -11.25 S_Texp_BKB -0.0241* -1.94ExpMV_BAC -0.0701 -1.25 ExpMV_BK 0.3617*** 3.10 ExpMV_BKB -0.1746** -2.45BDprcchg_BAC 0.0736*** 3.61 BDprcchg_BK 0.0330 1.47 BDprcchg_BKB 0.1218 1.56ExpMV_BDprcchg_BAC -0.1250*** -3.31 ExpMV_BDprcchg_BK -0.0424 -0.48 ExpMV_BDprcchg_BKB -0.1258* -1.84Adj. R2 = 0.5931; F value = 82.61*** Adj. R2 = 0.6103; F value = 88.71*** Adj. R2 = 0.2532; F value = 19.98***
BT Bankers Trust C Citicorp CMB Chase Manhattan
Variable Parameter Variable Parameter Variable ParameterName Estimate t Value Name Estimate t Value Name Estimate t Value
Intercept 0.2715 1.33 Intercept 0.0604 0.29 Intercept -1.3772*** -6.18SPret_BT 1.3395*** 11.43 SPret_C 1.5740*** 16.81 SPret_CMB 1.8171*** 15.23Tnote_BT -6.0976* -1.73 Tnote_C -15.4639*** -4.80 Tnote_CMB 24.0557*** 6.58S_Texp_BT 0.0102 0.44 S_Texp_C 0.1950*** 5.84 S_Texp_CMB -0.0231* -1.75ExpMV_BT -0.0165 -0.21 ExpMV_C 0.1815*** 4.21 ExpMV_CMB 0.0646* 1.87BDprcchg_BT 0.0917** 2.07 BDprcchg_C 0.0824 1.58 BDprcchg_CMB -0.0217 -0.71ExpMV_BDprcchg_BT -0.1128** -1.97 ExpMV_BDprcchg_C -0.0534 -1.46 ExpMV_BDprcchg_CMB 0.0479* 1.87Adj. R2 = 0.3003; F value = 25.04*** Adj. R2 = 0.4597; F value = 48.65*** Adj. R2 = 0.4381; F value = 44.66***
FTU First Union JPM JP Morgan ONE Bank One
Variable Parameter Variable Parameter Variable ParameterName Estimate t Value Name Estimate t Value Name Estimate t Value
Intercept -0.5820*** -5.10 Intercept -0.1487 -1.63 Intercept -0.2556* -1.67SPret_FTU 0.9532*** 15.72 SPret_JPM 1.2236*** 25.85 SPret_ONE 2.3498*** 27.42Tnote_FTU 15.3718*** 8.52 Tnote_JPM -0.7912 -0.54 Tnote_ONE -2.3368 -0.90S_Texp_FTU -0.5621*** -6.93 S_Texp_JPM 0.0013 0.11 S_Texp_ONE 0.4164*** 5.42ExpMV_FTU -2.9008*** -3.48 ExpMV_JPM 0.2383*** 8.35 ExpMV_ONE -1.9538** -2.39BDprcchg_FTU 0.0089 0.57 BDprcchg_JPM 0.0050 0.37 BDprcchg_ONE 0.0216 0.65ExpMV_BDprcchg_FTU -0.3503 -0.48 ExpMV_BDprcchg_JPM 0.0139 0.57 ExpMV_BDprcchg_ONE 0.5868 0.82Adj. R2 = 0.4711; F value = 50.88*** Adj. R2 = 0.6399; F value = 100.51*** Adj. R2 = 0.6323; F value = 97.30***
RNB Republic New York3SLS regression results using equation 6 in the text for the entire sample of 336 observations.
Variable ParameterName Estimate t Value
Intercept -0.9453*** -8.82 (6)SPret_RNB 1.1975*** 22.26Tnote_RNB 12.6772*** 7.66S_Texp_RNB 0.0564*** 2.91ExpMV_RNB -0.1074 -0.97 1 '***' means significant at the 1% level; BDprcchg_RNB 0.0521 1.46 '**' means significant at the 5 % level;ExpMV_BDprcchg_RNB -0.1670* -1.93 '*' means significant at the 10% level.Adj. R2 = 0.5586; F value = 71.86*** System Weighted R2=0.8906
tjtjjtjj
tjjtjjtjtjjtj
BDPRCCHGEXPMVBDPRCCHG
EXPMVTEXPSTNOTESPRETChngMV
,,,6,,5
,,4,,3,2,1,
_
_
εββ
ββββα
+++
++++=
24
Table 3: Estimates of the First Partial Derivative of CHGMV with Respect to BDPRCCHG
Evaluated at the Mean of EXPMV for Each Bank Using Estimates Presented in Table 2
BHC Ticker
First Partial Derivative*
Standard Error* t-statistic1
BAC 0.032268 0.013449 2.40**BK 0.025888 0.011992 2.16**BKB 0.029413 0.034536 0.85 BT 0.036796 0.023163 1.59C 0.033486 0.023766 1.41CMB 0.008616 0.023415 0.37FTU 0.003646 0.012282 0.30JPM 0.010251 0.008929 1.15ONE 0.040363 0.017315 2.33**RNB -0.003444 0.011605 -0.30
*The first partial derivative is specified in equation (7) in
the text as: tjjj
tj
tj EXPMVBDPRCCHG
ChngMV,,6,5
,
, ββ +=∂
∂ and
the standard error is specified in footnote 5 as: se=[(stderror(β5))2 +(EXPMV2)*(stderror(β6))2 + 2*EXPMV*COV(β5,β6)]1/2. 1 *** means significant at the 1% level; ** means significant at the 5 % level; * means significant at the 10% level.

25
Table 4: 3SLS Regression Results by Banking Company of CHGMV (Quarterly, 1991Q1 to 1998Q4)-- Latin American Crisis Event
(Parameter estimates and t values)1
BAC Bank of America BK Bank of New York BKB Bank Boston
Variable Parameter Variable Parameter Variable ParameterName Estimate t Value Name Estimate t Value Name Estimate t Value
Intercept -1.5452*** -9.81 Intercept -0.0681 -0.44 Intercept -1.1791*** -4.07SPret_BAC 1.2105*** 15.36 SPret_BK 1.5505*** 19.46 SPret_BKB 0.9724*** 6.37Tnote_BAC 21.6655*** 7.87 Tnote_BK 4.3204* 1.67 Tnote_BKB 27.1677*** 5.79S_Texp_BAC 0.7505*** 5.10 S_Texp_BK -0.5112** -2.55 S_Texp_BKB -0.5528*** -4.27ExpMV_BAC -0.0710 -0.84 ExpMV_BK 0.4447*** 2.87 ExpMV_BKB -0.1339 -1.44BDprcchg_BAC 0.0961*** 3.59 BDprcchg_BK 0.0443 1.30 BDprcchg_BKB 0.3277*** 3.48ExpMV_BDprcchg_BAC -0.1959*** -3.81 ExpMV_BDprcchg_BK -0.1372 -1.01 ExpMV_BDprcchg_BKB -0.3235*** -3.92Crisis 0.1860** 2.12 Crisis -0.1098 -1.25 Crisis 0.0308 0.19Adj. R2 = 0.4744; F value = 39.43*** Adj. R2 = 0.5834; F value = 60.61*** Adj. R2 = 0.2079; F value = 12.17***
BT Bankers Trust C Citicorp CMB Chase Manhattan
Variable Parameter Variable Parameter Variable ParameterName Estimate t Value Name Estimate t Value Name Estimate t Value
Intercept -0.1923 -0.72 Intercept 0.5102** 2.44 Intercept -1.3785*** -5.22SPret_BT 1.5525*** 10.81 SPret_C 1.4884*** 13.92 SPret_CMB 2.0663*** 15.10Tnote_BT 1.9986 0.43 Tnote_C -8.3725** -2.29 Tnote_CMB 20.0797*** 4.56S_Texp_BT 0.3731* 1.95 S_Texp_C 0.3331** 2.10 S_Texp_CMB 0.5080*** 4.91ExpMV_BT -0.3234*** -2.75 ExpMV_C 0.0636 1.43 ExpMV_CMB -0.1151*** -2.79BDprcchg_BT 0.0844 1.35 BDprcchg_C 0.1883*** 3.10 BDprcchg_CMB 0.0113 0.31ExpMV_BDprcchg_BT -0.0567 -0.71 ExpMV_BDprcchg_C -0.1185*** -2.80 ExpMV_BDprcchg_CMB 0.0195 0.64Crisis 0.1105 0.68 Crisis -0.0401 -0.34 Crisis -0.0647 -0.42Adj. R2 = 0.3156; F value = 20.63*** Adj. R2 = 0.4295; F value = 33.05*** Adj. R2 = 0.4275; F value = 32.79***
FTU First Union JPM JP Morgan ONE Bank One
Variable Parameter Variable Parameter Variable ParameterName Estimate t Value Name Estimate t Value Name Estimate t Value
Intercept -0.4434*** -3.26 Intercept -0.0507 -0.46 Intercept -0.7258*** -3.90SPret_FTU 0.9341*** 13.09 SPret_JPM 1.2662*** 21.94 SPret_ONE 2.1098*** 21.01Tnote_FTU 12.7422*** 5.89 Tnote_JPM -1.8037 -0.95 Tnote_ONE 8.5395*** 2.67S_Texp_FTU -1.3217 -1.22 S_Texp_JPM -0.1660* -1.69 S_Texp_ONE 1.7815*** 2.65ExpMV_FTU -8.7235*** -7.54 ExpMV_JPM 0.2457*** 6.91 ExpMV_ONE -0.5949 -0.56BDprcchg_FTU 0.0140 0.74 BDprcchg_JPM 0.0161 0.92 BDprcchg_ONE 0.0137 0.33ExpMV_BDprcchg_FTU -0.3418 -0.37 ExpMV_BDprcchg_JPM 0.0212 0.72 ExpMV_BDprcchg_ONE 0.7585 0.83Crisis -0.1202 -1.48 Crisis -0.0255 -0.39 Crisis -0.0457 -0.41Adj. R2 = 0.4240; F value = 32.33*** Adj. R2 = 0.6369; F value = 75.67*** Adj. R2 = 0.5851; F value = 61.03***
RNB Republic New York3SLS regression results using equation 8 in the text for the entire sample of 336 observations.
Variable ParameterName Estimate t Value
Intercept -1.1396*** -8.37SPret_RNB 1.0801*** 15.44Tnote_RNB 15.9511*** 7.26S_Texp_RNB 0.8706*** 5.10ExpMV_RNB -0.2213 -1.39 1 '***' means significant at the 1% level; BDprcchg_RNB -0.0264 -0.56 '**' means significant at the 5 % level;ExpMV_BDprcchg_RNB 0.0955 0.83 '*' means significant at the 10% level.Crisis 0.0022 0.03Adj. R2 = 0.4476; F value = 35.49***
tjtjjtjjtjj
tjjtjjtjtjjtj
CRISISBDPRCCHGEXPMVBDPRCCHG
EXPMVTEXPSTNOTESPRETChngMV
,,,7,,6,,5
,,4,,3,2,1,
_
_
εβββ
ββββα
++++
++++=

26
Table 5: 3SLS Regression Results by Banking Company of CHGMV (Quarterly, 1991Q1 to 1998Q4)-- Asian (Philippine) Crisis Event
(Parameter estimates and t values)1
BAC Bank of America BK Bank of New York BKB Bank Boston
Variable Parameter Variable Parameter Variable ParameterName Estimate t Value Name Estimate t Value Name Estimate t Value
Intercept -1.5818*** -10.05 Intercept -0.0606 -0.40 Intercept -1.1772*** -4.08SPret_BAC 1.2013*** 15.18 SPret_BK 1.5640*** 19.62 SPret_BKB 0.9655*** 6.33Tnote_BAC 22.5356*** 8.24 Tnote_BK 3.8061 1.48 Tnote_BKB 26.9697*** 5.77S_Texp_BAC 0.7739*** 5.23 S_Texp_BK -0.4109** -2.04 S_Texp_BKB -0.5519*** -4.28ExpMV_BAC -0.0897 -1.05 ExpMV_BK 0.4261*** 2.74 ExpMV_BKB -0.1206 -1.31BDprcchg_BAC 0.0964*** 3.60 BDprcchg_BK 0.0403 1.18 BDprcchg_BKB 0.3365*** 3.57ExpMV_BDprcchg_BAC -0.2023*** -3.92 ExpMV_BDprcchg_BK -0.1176 -0.86 ExpMV_BDprcchg_BKB -0.3320*** -4.02Crisis -0.1841 -1.17 Crisis 0.2307 -1.46 Crisis 0.1878 0.63Adj. R2 = 0.4645; F value = 37.93*** Adj. R2 = 0.5855; F value = 61.13*** Adj. R2 = 0.2087; F value = 12.22***
BT Bankers Trust C Citicorp CMB Chase Manhattan
Variable Parameter Variable Parameter Variable ParameterName Estimate t Value Name Estimate t Value Name Estimate t Value
Intercept -0.1912 -0.71 Intercept 0.5209** 2.50 Intercept -1.3690*** -5.19SPret_BT 1.5543*** 10.84 SPret_C 1.4928*** 13.97 SPret_CMB 2.0673*** 15.06Tnote_BT 1.8316 0.39 Tnote_C -8.6325** -2.38 Tnote_CMB 19.8763*** 4.55S_Texp_BT 0.3225* 1.68 S_Texp_C 0.3302** 2.08 S_Texp_CMB 0.5167*** 4.97ExpMV_BT -0.2694** -2.33 ExpMV_C 0.0677 1.51 ExpMV_CMB -0.1170*** -2.82BDprcchg_BT 0.0976 1.56 BDprcchg_C 0.1843*** 3.02 BDprcchg_CMB 0.0087 0.24ExpMV_BDprcchg_BT -0.0740 -0.93 ExpMV_BDprcchg_C -0.1166*** -2.75 ExpMV_BDprcchg_CMB 0.0213 0.69Crisis 0.1269 0.44 Crisis -0.0321 -0.15 Crisis -0.2077 -0.76Adj. R2 = 0.3203; F value = 21.06*** Adj. R2 = 0.4305; F value = 33.18*** Adj. R2 = 0.4248; F value = 32.44***
FTU First Union JPM JP Morgan ONE Bank One
Variable Parameter Variable Parameter Variable ParameterName Estimate t Value Name Estimate t Value Name Estimate t Value
Intercept -0.4299*** -3.15 Intercept -0.0481 -0.43 Intercept -0.7292*** -3.91SPret_FTU 0.9355*** 13.03 SPret_JPM 1.2652*** 21.95 SPret_ONE 2.1068*** 20.91Tnote_FTU 12.4943*** 5.78 Tnote_JPM -1.8807 -1.00 Tnote_ONE 8.3765*** 2.63S_Texp_FTU -1.1336 -1.04 S_Texp_JPM -0.1578 -1.60 S_Texp_ONE 1.8020*** 2.70ExpMV_FTU -9.3589*** -8.22 ExpMV_JPM 0.2440*** 6.87 ExpMV_ONE -0.3795 -0.36BDprcchg_FTU 0.0143 0.75 BDprcchg_JPM 0.0158 0.90 BDprcchg_ONE 0.0124 0.29ExpMV_BDprcchg_FTU -0.4518 -0.48 ExpMV_BDprcchg_JPM 0.0218 0.74 ExpMV_BDprcchg_ONE 0.7358 0.80Crisis -0.0142 -0.10 Crisis -0.0446 -0.38 Crisis 0.1474 0.74Adj. R2 = 0.4216; F value = 32.03*** Adj. R2 = 0.6382; F value = 76.11*** Adj. R2 = 0.5743; F value = 58.43***
RNB Republic New York3SLS regression results using equation 6 in the text for the entire sample of 336 observations.
Variable ParameterName Estimate t Value
Intercept -1.1391*** -8.39SPret_RNB 1.0815*** 15.47Tnote_RNB 16.0582*** 7.33S_Texp_RNB 0.9073*** 5.30ExpMV_RNB -0.2558 -1.63 1 '***' means significant at the 1% level; BDprcchg_RNB -0.0259 -0.55 '**' means significant at the 5 % level;ExpMV_BDprcchg_RNB 0.0928 0.81 '*' means significant at the 10% level.Crisis -0.2363* -1.73Adj. R2 = 0.4484; F value = 35.61***
tjtjjtjjtjj
tjjtjjtjtjjtj
CRISISBDPRCCHGEXPMVBDPRCCHG
EXPMVTEXPSTNOTESPRETChngMV
,,,7,,6,,5
,,4,,3,2,1,
_
_
εβββ
ββββα
++++
++++=

27
Table 6: 3SLS Regression Results by Banking Company of CHGMV (Quarterly, 1991Q1 to 1998Q4)-- Russian Crisis Event
(Parameter estimates and t values)1
BAC Bank of America BK Bank of New York BKB Bank Boston
Variable Parameter Variable Parameter Variable ParameterName Estimate t Value Name Estimate t Value Name Estimate
Intercept -1.5944*** -10.07 Intercept -0.0655 -0.42 Intercept -1.2084***SPret_BAC 1.2016*** 15.21 SPret_BK 1.5587*** 19.58 SPret_BKB 0.9646***Tnote_BAC 22.6985*** 8.27 Tnote_BK 3.9735 1.54 Tnote_BKB 27.5784***S_Texp_BAC 0.7562*** 5.14 S_Texp_BK -0.4708** -2.35 S_Texp_BKB -0.5432***ExpMV_BAC -0.0809 -0.95 ExpMV_BK 0.4461*** 2.88 ExpMV_BKB -0.1333BDprcchg_BAC 0.0970*** 3.60 BDprcchg_BK 0.0390 1.12 BDprcchg_BKB 0.3439***ExpMV_BDprcchg_BAC -0.2011*** -3.88 ExpMV_BDprcchg_BK -0.1094 -0.79 ExpMV_BDprcchg_BKB -0.3373***Crisis 0.0648 0.41 Crisis 0.0730 0.46 Crisis 0.2070Adj. R2 = 0.4679; F value = 38.43*** Adj. R2 = 0.5847; F value = 60.94*** Adj. R2 = 0.2079; F value = 12.17***
BT Bankers Trust C Citicorp CMB Chase Manhattan
Variable Parameter Variable Parameter Variable ParameterName Estimate t Value Name Estimate t Value Name Estimate
Intercept -0.1429 -0.53 Intercept 0.5249** 2.51 Intercept -1.4058***SPret_BT 1.5525*** 10.83 SPret_C 1.4865*** 13.90 SPret_CMB 2.0640***Tnote_BT 1.1283 0.24 Tnote_C -8.5953** -2.37 Tnote_CMB 20.2776***S_Texp_BT 0.3321* 1.74 S_Texp_C 0.3247** 2.05 S_Texp_CMB 0.5266***ExpMV_BT -0.2678** -2.31 ExpMV_C 0.0655 1.47 ExpMV_CMB -0.1149***BDprcchg_BT 0.0869 1.39 BDprcchg_C 0.1883*** 3.01 BDprcchg_CMB 0.0123ExpMV_BDprcchg_BT -0.0647 -0.81 ExpMV_BDprcchg_C -0.1197*** -2.76 ExpMV_BDprcchg_CMB 0.0193Crisis -0.3695 -1.26 Crisis -0.0674 -0.31 Crisis 0.2254Adj. R2 = 0.3175; F value = 20.80*** Adj. R2 = 0.4278; F value = 32.83*** Adj. R2 = 0.4233; F value = 32.24***
FTU First Union JPM JP Morgan ONE Bank One
Variable Parameter Variable Parameter Variable ParameterName Estimate t Value Name Estimate t Value Name Estimate
Intercept -0.4513*** -3.29 Intercept -0.0277 -0.25 Intercept -0.7174***SPret_FTU 0.9348*** 13.04 SPret_JPM 1.2670*** 21.99 SPret_ONE 2.1038***Tnote_FTU 12.7628*** 5.87 Tnote_JPM -2.1281 -1.13 Tnote_ONE 8.3596***S_Texp_FTU -1.1161 -1.03 S_Texp_JPM -0.1707* -1.74 S_Texp_ONE 1.7825***ExpMV_FTU -9.2111*** -8.08 ExpMV_JPM 0.2438*** 6.86 ExpMV_ONE -0.5037BDprcchg_FTU 0.0146 0.77 BDprcchg_JPM 0.0140 0.79 BDprcchg_ONE 0.0086ExpMV_BDprcchg_FTU -0.3560 -0.38 ExpMV_BDprcchg_JPM 0.0226 0.76 ExpMV_BDprcchg_ONE 0.8031Crisis 0.1375 0.94 Crisis -0.1608 -1.35 Crisis -0.1044Adj. R2 = 0.4224; F value = 32.14*** Adj. R2 = 0.6375; F value = 75.86*** Adj. R2 = 0.5702; F value = 57.48***
RNB3SLS regression results using equation 8 in the text for the entire sample of 298 observations.
Variable ParameterName Estimate t Value
Intercept -1.1138*** -8.16SPret_RNB 1.0796*** 15.46Tnote_RNB 15.5912*** 7.10S_Texp_RNB 0.8565*** 5.04ExpMV_RNB -0.2111 -1.35 1 '***' means significant at the 1% level; BDprcchg_RNB -0.0320 -0.67 '**' means significant at the 5 % level;ExpMV_BDprcchg_RNB 0.1048 0.90 '*' means significant at the 10% level.Crisis -0.2086 -1.53Adj. R2 = 0.4465; F value = 35.34***
tjtjjtjjtjj
tjjtjjtjtjjtj
CRISISBDPRCCHGEXPMVBDPRCCHG
EXPMVTEXPSTNOTESPRETChngMV
,,,7,,6,,5
,,4,,3,2,1,
_
_
εβββ
ββββα
++++
++++=

28
Figure 1
S&P 500 and S&P Money Center Bank Stock Indexes (indexed)(weekly, 1/6/1989 to 1/6/2002)
0
50
100
150
200
250
300
350
400
450
500
550
600
650
1/6/89
5/6/89
9/6/89
1/6/90
5/6/90
9/6/90
1/6/91
5/6/91
9/6/91
1/6/92
5/6/92
9/6/92
1/6/93
5/6/93
9/6/93
1/6/94
5/6/94
9/6/94
1/6/95
5/6/95
9/6/95
1/6/96
5/6/96
9/6/96
1/6/97
5/6/97
9/6/97
1/6/98
5/6/98
9/6/98
1/6/99
5/6/99
9/6/99
1/6/00
5/6/00
9/6/00
1/6/01
5/6/01
9/6/01
1/6/02
Date (mm/dd/yy)
Relative Index Value
S&P Money Center Bank
S&P 500
Mexican Peso Crisis (December 20, 1994)
Asian Crisis October 1997
Russian Devaluation August 1998
Notes: This figure shows that the initial impact of the Asian crisis in the Fall of 1997 did not seem to have a major or lasting impact on large bank valuation. Large banking companies suffered considerable losses in market value in August 1998 triggered by the Russian devaluation, declared default on former Soviet Union debt, Russian financial system collapse, and the uncertainty of possible spillover to Latin American emerging markets (e.g., Brazil in particular). By early October 1998, bank stock prices had fallen 37 percent from their highs in early July 1998 (see the S&P Money Center Bank index in the above figure) and 10 to 30 percent for some banks in the 2 weeks following the suspension of the conversion of the ruble in August 1998. Although a recovery in large bank valuation was underway by early 1999, stock values for these banks did not recover to the highs reached in early 1998.

29
Figure 2
Notes: While bank stock values significantly faltered after the August 1998 Russian events and had not reached previous highs as of mid-October 1999, default spreads on bank subordinated debt widened rapidly in 1998 and continued to be high for major banks (note the spike in the spread after August 1998 in the above figure) until the end of our period of analysis
Average Default PremiumsTop 25 Bank Holding Companies
(January 1997-July 1999)
0.00000
0.00200
0.00400
0.00600
0.00800
0.01000
0.01200
0.01400
0.01600
0.01800
0.02000
1997
0103
1997
0207
1997
0314
1997
0418
1997
0523
1997
0627
1997
0801
1997
0905
1997
1010
1997
1114
1997
1219
1998
0123
1998
0227
1998
0403
1998
0508
1998
0612
1998
0717
1998
0821
1998
0925
1998
1030
1998
1204
1999
0108
1999
0212
1999
0319
1999
0423
1999
0528
1999
0702
Date
Prem
ium
(dec
imal
)

30
References Bruner, Robert F. and John M. Simms, Jr., “The International Debt Crisis and Bank Security Returns
in 1982,” Journal of Money, Credit and Banking 19 (February 1987), 46-55. Cornell, Bradford and Alan C. Shapiro, “The Reaction of Bank Stock Prices to the International Debt
Crisis,” Journal of Banking and Finance 10 (March 1986), 55-73. Curry, Timothy, “Chronology: LDC Debt Crisis,” History of the Eighties: Lessons for the Future,
Division of Research and Statistics, Federal Deposit Insurance Corporation, mimeo draft, February 1996.
Curry, Timothy, Christopher Richardson and Robin Header, "Assessing International Risk Exposures
of U.S. Banks," (1998), FDIC Banking Review, v. 11, December 1998, p. 13-30. Federal Financial Institutions Examination Council (FFIEC), Country Exposure Report, various issues
1979 to 1998. Federal Reserve Board, "Press Release on Revising Risk-based Capital Standards," July 30, 1992. Federal Reserve Board, "Press Release on 'Prompt Corrective Action'," September 18, 1992. Federal Reserve Board, "Press Release on Revising Risk-based Capital Standards," September 14,
1993. Federal Reserve Board, "Press Release Regarding the Basle Committee on Banking Supervision
Proposal for Incorporating Market Risk,” April 12, 1995. Fissel, Gary S., "The Anatomy of the International Debt Crisis," (1991), FDIC Banking Review, v. 4
Spring/Summer 1991, p. 1-14. Goldberg, Lawrence G., Gerald A. Hanweck and Timothy Sugrue, "Differential Impact on Bank
Valuation of Interstate Banking Law Changes," Journal of Banking and Finance, v.16, September 1992, pp. 1143-1158.
Musumeci, James J. and Joseph F. Sinkey, JR., “The International Debt Crisis, Investor Contagion,
and Bank Security Returns in 1987: The Brazilian Experience,” Journal of Money, Credit and Banking Vol. 22, No. 2, May 1990, 209-220.
Karafiath, Imre, Ross Mynatt, and Kenneth L. Smith, “The Brazilian Default Announcement and the
Contagion Effect Hypothesis,” Journal of Banking and Finance 15 (1991), 699-716. Kyle Steven C. and Ronald G. Wirick, "The Impact of Sovereign Risk on the Market Valuation of
U.S. Bank Equities," (1990), Journal of Banking and Finance, v. 14, p. 761-780.

31
Schoder, Stewart and Prashant Vankudre, “The Market for Bank Stocks and Banks’ Disclosure of Cross-Border Exposure: The 1982 Mexican Debt Crisis,” Working Paper, Wharton School of Finance, University of Pennsylvania, 1986.
Slovin, Myron B. and Subbarao V. Jayanti, "Bank Capital Regulation and the Valuation Effects of
Latin American Debt Moratoriums," (1993), Journal of Banking and Finance, v. 17, p. 159-174.
Smirlock, Michael and Howard Kaufold, “Bank Foreign Lending, Mandatory Disclosure Rules, and
Reaction of Bank Stock Prices to the Mexican Debt Crisis,” Journal of Business 60 (July 1987), 347-364.
"Financial Firms Lose $8 billion So Far," The Wall Street Journal, p. A2, September 3, 1998.