banking and transparency: is more information always better?
TRANSCRIPT

2009
-11
Swis
s Na
tion
al B
ank
Wor
king
Pap
ers
Banking and Transparency: Is More InformationAlways Better?Nicole Allenspach
The views expressed in this paper are those of the author(s) and do not necessarily represent those of the Swiss National Bank. Working Papers describe research in progress. Their aim is to elicit comments and to further debate.
Copyright ©The Swiss National Bank (SNB) respects all third-party rights, in particular rights relating to works protectedby copyright (information or data, wordings and depictions, to the extent that these are of an individualcharacter).SNB publications containing a reference to a copyright (© Swiss National Bank/SNB, Zurich/year, or similar) may, under copyright law, only be used (reproduced, used via the internet, etc.) for non-commercial purposes and provided that the source is mentioned. Their use for commercial purposes is only permitted with the prior express consent of the SNB.General information and data published without reference to a copyright may be used without mentioning the source.To the extent that the information and data clearly derive from outside sources, the users of such information and data are obliged to respect any existing copyrights and to obtain the right of use from the relevant outside source themselves.
Limitation of liabilityThe SNB accepts no responsibility for any information it provides. Under no circumstances will it accept any liability for losses or damage which may result from the use of such information. This limitation of liability applies, in particular, to the topicality, accuracy, validity and availability of the information.
ISSN 1660-7716 (printed version)ISSN 1660-7724 (online version)
© 2009 by Swiss National Bank, Börsenstrasse 15, P.O. Box, CH-8022 Zurich

1
Banking and Transparency: Is More InformationAlways Better?
Nicole Allenspach∗†
September 2009
Abstract
This paper shows that transparency in banking can be harmful from a social
planner’s point of view. According to our model, enhancing transparency above
a certain level may lead to the inefficient liquidation of a bank. The reason
lies in the nature of a standard deposit contract: its payoff scheme has limited
upside gains (cap) but leaves the depositor with the downside risk. Accordingly,
depositors will not take into account possible future upside gains of the bank
when deciding whether or not to withdraw their deposits. Our result points
towards a trade-off the regulator faces: while enhancing transparency may be
useful to reduce incentives for excessive risk-taking (moral hazard), it may also
increase the risk of inefficient bank runs.
Keywords: banking, transparency, nancial stability, bank run
∗I thank Robert Bichsel, Urs Birchler, Jürg Blum, Jeannette Henggeler-Müller, Yvan Lengwilerand Hyun Song Shin for helpful comments and discussions. The author also acknowledges commentsand suggestions from an anonymous refree and from seminar participants at the Swiss National Bankand at the INFINITI Conference on International Finance 2008 in Dublin. The opinions expressedherein are my own and not those of the Swiss National Bank.
†Swiss National Bank. E-mail: [email protected].
1
2 3
1 Introduction
Since the Asian crisis in 1998, calls for enhancing transparency in the banking sector
have been prompted regularly. The outburst of the subprime mortgage crisis in mid-
2007 has reignited an interest in transparency as some banks have been severly criticized
for not disclosing all relevant information. Accordingly, one of the lessons often drawn
from this crisis is that banks have to become more transparent to the markets.1 In
other words, transparency is generally regarded as being benecial in enhancing both
the efficiency and the stability of banks and a nancial system as a whole.
However, the actual impact of enhancing transparency may be less evident in the
case of banks. Banks do in fact exist because of inefficiencies. They solve the informa-
tion asymmetry between lenders and borrowers and are therefore opaque by denition.
Hence, due to the existence of market distortions, disclosing information2 to the mar-
ket may be less benecial as often claimed or may–under certain circumstances–even
worsen the overall outcome.3 Furman and Stiglitz (1998) argue that greater trans-
parency could have severly aggravated the savings and loans crisis in the United States
as many banks would have had to shut down, cut their lending to a signicant extent
or receive substantial equity injections. Similarly, De Grauwe (2008) points out that
transparency is not a panacea to prevent nancial crises and may sometimes even be
counterproductive.
The aim of this paper is to contribute to the discussion on transparency in banking
by pointing out a possible drawback of information disclosure to the market. It is
thereby important to note that the paper does not intend to carry out a balanced
analysis of possibly benecial and harmful effects of transparency but rather to provide
an example where being transparent might not always be optimal. In a simple model
where the bank’s investment portfolio is solely exposed to exogenous risk factors such as
macroeconomic shocks or a stock market crash, we show that enhancing transparency
over a certain level may lead to the inefficient liquidation of a bank. The basic idea
behind this is as follows: A bank may temporarily be threatened by a shock but the
institution’s overall outlook is still positive. Disclosing information on that bank while
1See, e.g., Financial Stability Forum (2008).2Disclosing information does not necessarily imply transparency as, e.g., it does not automati-
cally ensure that the information disclosed is also received and correctly understood by the market.Nevertheless, in what follows, these expressions are used interchangeably.
3According to the theory of the second best: When there is more than one imperfection in aneconomy, removing one of them need not improve welfare.
2

2 3
in trouble may lead depositors to run a bank with a positive net present value. At
this stage, allowing for some degree of intransparency–or in some cases even complete
intransparency–may keep depositors from running the bank and may thus prevent the
inefficient liquidation of this bank.
The reason for this inefficient liquidation lies in the very nature of deposit contracts:
the payoff scheme of a standard deposit contract has limited upside gains (cap) but
leaves the depositor with the downside risk. Accordingly, depositors do not take into
account possible future upside gains of the bank when deciding whether to run the
bank or not. Although assumed to be risk neutral, they act as if they were risk averse.4
Inefficient bank runs are often related to the phenomenon of depositor coordination
failure.5 We show that inefficient liquidation might also occur in the absence of a
coordination problem.
There exists a vast literature on various aspects of information disclosure. This
literature, however, is not bank-specic.6 Banks and the banking system as a whole
are fundamentally different from other sectors. First, the part of debt nance is much
higher at banks than at other rms. The incentives of debtholders differ from those of
equityholders. Second, banks are fragile and subject to bank runs and banking crises
as they nance long-term investments with short-term debt. And lastly, the banking
sector is highly regulated compared to other sectors of the economy. Results from
the general information disclosure literature might thus not necessarily be applied to
banks. Moreover, there might be some topics that are only (or especially) relevant for
the analysis of information disclosure in a banking context.
An increasing number of papers concentrate on transparency issues in the context
of banks. There are several theoretical papers that study the effect of transparency
on bank stability via market discipline. These papers address the issue of moral haz-
ard in banking, i.e., the banks’ incentive for excessive risk taking. Transparency may
prevent banks from excessive risk taking and may thus improve their stability by fos-
tering market discipline: providing enough information allows creditors to force the
4This is the counterpart to the literature on moral hazard in banking where banks do not takeinto account possible downside risks due to limited liability. Although assumed to be risk neutral,banks behave as if they were risk loving. Their incentive for excessive risk-taking may result in theinefficient continuation of a bank. In our analysis, however, moral hazard is not an issue as banks areexposed to exogenous risk factors only.
5There is an extensive literature starting with Diamond and Dybvig (1983) that relates inefficientliquidation to the phenomenon of depositor coordination failure.
6For an overview on the theoretical strand of this literature, see Verrecchia (2001); an overview onempirical disclosure literature is provided in Healy and Palepu (2001).
3

4 5
banks to choose the appropriate risk level. The papers thereby concentrate on the
depositors’ investment decision as a channel for market discipline. The consensus is
that transparency indeed reduces risk as it enables depositors to demand adequate
compensation–i.e., deposit rates–for given risk-levels. Examples of this literature are
Boot and Schmeits (2000), Hyytinen and Takalo (2002, 2004) and Cordella and Yeyati
(1998). Some of these papers also account for factors that might dilute the benecial
effect of transparency on bank stability. Hyytinen and Takalo (2002) show how de-
posit insurance and costs associated with information disclosure reduce, offset or even
overcompensate the otherwise benecial effect of enhanced transparency on the banks’
stability.
Recent policy initiatives that call for enhancing transparency in banking–such as
Pillar 3 of the new Basel Capital Accord (Basel II)–are also based on the same ar-
gument that market discipline can be strengthened–and therefore banks’ excessive
risk taking reduced–by greater disclosure. Also from a supervisory perspective, there
seems to be much consensus that, in the context where banks control their risk, en-
hancing transparency may be benecial at best–in that transparency may force banks
to behave more prudently–and simply irrelevant7 at worst.
As mentioned above, this paper concentrates on the impact of transparency when
banks are not able to control their risk exposure. In other words: in contrast to the
above mentioned papers, moral hazard is not an issue. In an extension of their model,
Cordella and Yeyati (1998) additionally study the impact of disclosure on the ex ante
probability of bank failures in the case where the bank’s risk level evolves according
to exogenous risk factors. In this case, bank transparency reduces bank stability as
investors demand higher funding compensation which aggravates the banks’ situation.
The setup in our paper differs from this exogenous risk version of the Cordella and
Yeyati model in the following sense. First, while Cordella and Yeyati compare the
polar cases of complete transparency versus complete intransparency, we allow for
interior solutions. In doing so, we are able to show how the optimal transparency level
varies with the components that determine the exogenous risk. Second, we explicitly
model a standard deposit contract. And third, while Cordella and Yeyati focus on the
relation between transparency and the funding terms, we concentrate additionally on its
7Irrelevant in the sense that although all relevant information is disclosed to the market, marketdiscipline does not work. For an example where market discipline may actually lead to an increase inrisk, see Blum (2002) .
4

4 5
impact on the depositor’s withdrawal decision. In other words, possible consequences
of transparency are analyzed in a bank run model.
The impact of transparency might not be the same for individual banks and for
the banking sector as a whole. In a bank run model with two banks, Chen and Hasan
(2006) show that enhancing transparency of one bank may reduce depositor welfare as
it increases the chance of a (inefficient) contagious run on the other bank. Hence, as
in our model, enhancing transparency may cause inefficient bank runs. In contrast to
our model, however, the result is driven by depositor coordination failure.
In a similar model, Chen and Hasan (2008) illustrate how transparency–the pre-
cision of a public signal on bank assets–and depositors’ expectation concerning the
revelation of the public signal determine whether information-based bank runs improve
depositor welfare. If the signal is precise, information-based bank runs are benecial as
they allow the efficient liquidation of a bank. If the signal is noisy, however, bank runs
will reduce depositor welfare. In this setup, panic runs–i.e., bank runs where deposi-
tors’ expectations about the bank fundamentals have not changed–may occur. These
runs are triggered by changes in depositors’expectation about the actual revelation of
the signal.
The paper is organized as follows. Section 2 describes the setup of the model.
The solutions to the depositor’s investment and withdrawing decisions and the optimal
choice of the bank’s transparency level are presented in section 3. Section 4 discusses
possible extensions of the model and section 5 concludes.
2 The Setup
The optimal transparency decision is analyzed within the framework of a dynamic game
of incomplete information. The setup of the model reects a situation where a bank is
hit by a shock, may thus temporarily fall into a stress situation and faces the threat
of depositors withdrawing their funds. The outlook of the bank’s investment project
is, however, favorable. In other words, even in the case where the bank’s investment
project is hit by a negative shock, its net present value is still positive. The following
subsections describe (i) the agents, their action choices, and the timing of the game,
(ii) the (exogenously given) distribution of the bank’s investment project value and
the corresponding payoffs for the agents, and (iii) the information structure and the
precise denition of bank transparency.
5

6 7
Figure 1: Timeline
t = 0 t = 1 t = 2
• Bank chooses transparency level;
• depositor invests in bank or in the storage technology;
• bank invests in risky project.
• Signal on realization of the interim investment project value;
• depositor decides whether to withdraw or not.
• Realization of the final project value;
• bank solvent?
2.1 Economy, Agents and Timeline
The economy consists of a bank and a depositor. Both are risk neutral. We assume that
the bank is completely nanced by a deposit which is normalized to unity. The bank
invests the deposit in a risky long-term investment project of which the project value
distribution is exogenously given. This project yields a random interim investment
project value V1 at the interim stage and a random nal investment project value V2
at the nal stage (cf. Section 2.2). At the interim stage, the bank has to disclose
information to the market–i.e., to the depositor–on the realization of the interim
project value. The bank’s action choice is its decision on the transparency level v with
respect to the information disclosed. We assume limited liability.
The depositor is thought of as representing a group of large informed investors.
Small, uninformed depositors are irrelevant in our context since this group is not ex-
pected to exert any form of market discipline.8 There is no deposit insurance. The
representative depositor with endowment 1 has two action choices. First, he decides
whether to invest his endowment in the bank at the gross deposit rate RD ≥ 1 or touse the storage technology at the safe gross return of 1. Once invested in the bank,
he decides–second–whether to withdraw his deposit or to leave it in the bank. It is
assumed that the depositor’s withdrawing decision is not contractable.
The depositor decides whether to withdraw or not based on a signal si on the
8Note also that only one depositor is needed in our model, as coordination between depositors isnot an issue.
6

6 7
realization i of the interim project value he receives. The signal can be interpreted as a
nancial statement the bank publishes in response to the realization of the shock. The
transparency level v initially chosen by the bank denes the precision of this signal (cf.
Section 2.3). The transparency level v and the investment project value distribution
are common knowledge. The realization of the interim project value, however, is not
observable to the depositor.
Figure 1 presents the timeline of the model. There are three periods: 0, 1, 2. In
t = 0, the bank chooses its level of transparency v, the depositor decides whether to
invest its endowment in the bank or to use the storage technology. If he invests in the
bank, the bank invests these funds in a risky long-term project.
At the interim stage t = 1, the depositor receives a signal on the realization of the
random interim project value. Based on this signal, he decides whether to withdraw
his deposits or not. If he withdraws, the bank is closed early. Otherwise, the bank
continues to operate until t = 2. In t = 2, the nal project value materializes. The
bank is closed and it pays back the (gross) deposit rate to the depositor in the case of
solvency.
2.2 Investment Project Value Distribution and Payoffs
The investment project value distribution is summarized in gure 2. At the interim
stage t = 1, the interim project value V1 materializes. The project yields a high interim
value V H1 ≥ 1 with probability q and a low value V L
1 < 1 with probability (1− q). As
the bank’s total liabilities amount to 1, the bank is liquid in the case of V H1 but becomes
(temporarily) illiquid in the case of V L1 . For notational and computational simplicity,
V H1 is set equal to 1. If the depositor decides to withdraw in t = 1, he receives either
1 (if V1 = V H1 ≡ 1) or V L
1 (if V1 = V L1 ); the bank gets nothing. Otherwise, the bank
continues to operate until t = 2.
In t = 2, the investment project ends and the nal project value V2 materializes.
The distribution of the investment project’s nal value depends on the state in t = 1.
If, at the interim stage t = 1, a high interim value has occurred, the project yields a high
nal project value V H2 > 1 with probability 1. If a low interim value has materialized,
however, V H2 will only be achieved with probability p. With probability (1 − p), the
investment project yields a low value V L2 < V L
1 . For notational and computational
7
8 9
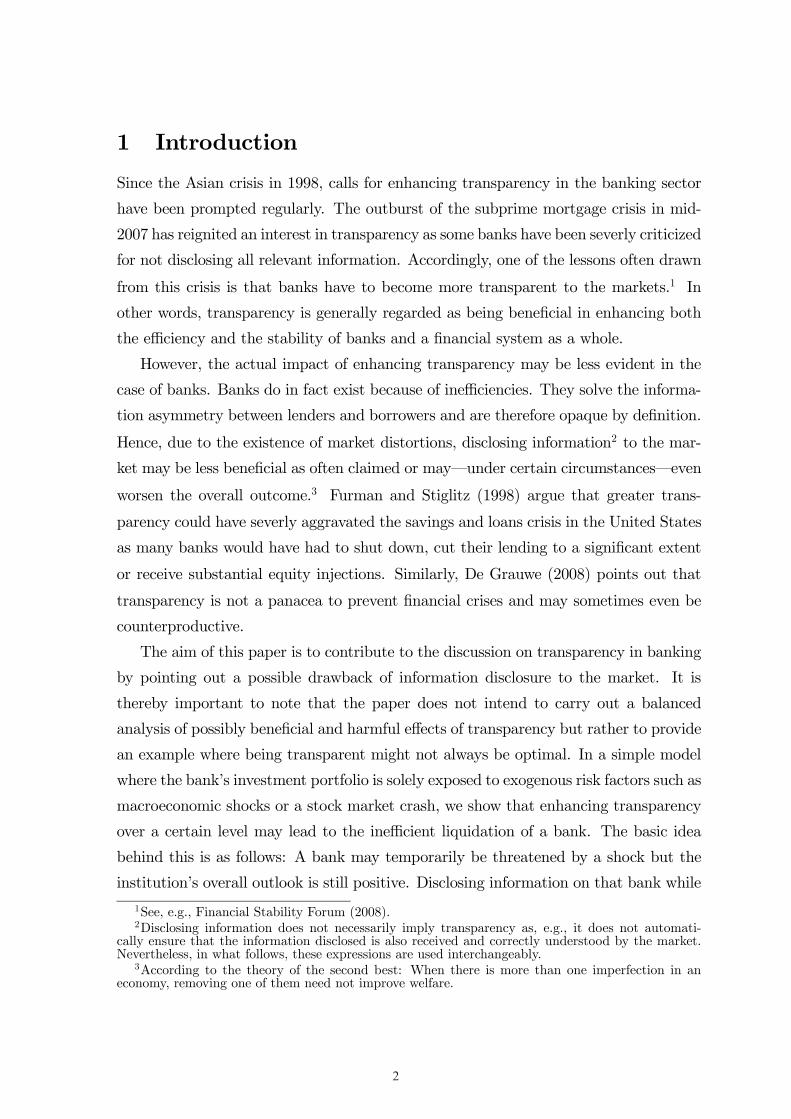
Figure 2: Investment project value distribution
V1H 1
q 1-q
p 1-p
V2H
V1L
V2L 0V2
H
t = 0:
t = 1:
t = 2:
V1H 1V1H 1
q 1-q
p 1-p
V2H
V1L
V2L 0V2L 0V2
H
t = 0:
t = 1:
t = 2:
simplicity, V L2 is set equal to zero.9 It is assumed that p ≤ q. In other words: the
probability of success from the rst technology is equal to or higher than the probability
of success from the second technology. The bank remains solvent if V H2 is realized and
is insolvent otherwise. In other words:
V H2 ≥ RD > 1 > V L
1 > 0 (1)
We assume that the expected investment project value is higher than or equal to
the value from the alternative option, the storage technology:
qV H2 + (1− q)pV H
2 ≥ 1 (2)
Inequality (2) is a necessary condition for the existence of the bank: if the sure payoff
from using the storage technology is higher than the expected payoff from investing
in the risky project, a bank would not exist. We further assume that–given a low
project value in t = 1–the expected nal investment project value from continuing
the investment project is higher than the value from stopping the project and closing
the bank in t = 1:
pV H2 ≥ V L
1 (3)
Inequality (3) implies that the case of efficient liquidation of a bank is ruled out in
this model by assumption.10
9The results do not change qualitatively due to the simplications with respect to V H1 und V L
2 .10For a model where bank runs are efficient, see, e.g., Allen and Gale (1998). Chen and Hasan
(2006) analyze the relation between transparency of banks and the efficiency of bank runs.
8

8 9
Lastly, we assume that–given a low project value in t = 1–the depositor’s payoff
from withdrawing in the bad state is equal or greater than the expected payoff from
not withdrawing in the bad state:
V L1 ≥ pRD (4)
Inequality (4) is assumed to restrict the attention to only those cases where there is a
conict of interest between the bank and the depositor. If inequality (4) did not hold,
the depositor would have no incentive at all to withdraw its deposits.
In the solvency case, the depositor receives his promised deposit rate RD, while
the bank gets the difference between the nal investment project value V H2 and the
deposit rate RD. If the bank becomes insolvent in t = 2, however, neither the bank
nor the depositor receives anything. The distribution of the bank’s and the depositor’s
payoffs–conditional on the realization of the bank’s investment project values and the
depositor’s withdrawal decision–are summarized in Table 1 and Table 2.
Table 1: Payoff structure if bank is closed in period 1Realization of V1:V H1 ≡ 1 V L
1
Bank: 0 0Depositor: 1 V L
1
Table 2: Payoff structure if bank operates until period 2Realization of V2:V H2 V L
2 ≡ 0Bank: V H
2 −RD 0Depositor: RD 0
2.3 Information Structure and Transparency
While the investment project value distribution is common knowledge, the realization
of the interim project value is not observable by the depositor. However, in t = 1,
the bank has to disclose information on the state of the bank to the market. At the
interim stage, thus, the depositor receives a signal si on the realization i of the interim
project value V1, where sH is pointing to a high interim project value V H1 and sL to
9

10 11
a low interim project value V L1 . Given that the distribution of the nal project value
V2 is related to the realization of the interim project value V1, the signal serves as an
indicator of the probability that the bank remains solvent in t = 2.
The level of transparency initially chosen by the bank is dened as the precision of
the signal. Concretely, transparency is dened as the conditional probability of signal
si given the realization i of the random interim project value V1:
v = prob£si | V i
1
¤, i = L,H (5)
(1− v) = prob£si | V j
1
¤, i = L,H; j = L,H; i 6= j
with v ∈ [0.5, 1]. The more transparent the bank, the more precise is the signal onthe actual state of the investment project in t = 1. Or, in other words: the higher the
transparency level, the higher the probability that the depositor receives the correct
signal.11 If the transparency level v is set to 0.5, the signal does not contain any new
information compared to the information available in t = 0. This corresponds to the
case of complete intransparency. If v = 1, then the signal reects the realization of the
interim project value perfectly, i.e., there is complete transparency.
Enhancing transparency, however, is costly for the bank. We assume a convex cost
function c(v) with the following properties:
c(0.5) = 0, (6)
c0(v) ≥ 0, c00(v) > 0, c0(0.5) = 0, c0(1) =∞
Costs may arise because the bank has to produce comprehensive information on its
nancial performance–the state of the investment project in t = 1–and to disclose it
to the depositor. Moreover, costs may also arise because the bank and/or the invest-
ment have to be (re-)organized such as to become transparent. It is assumed that the
higher the transparency level, the more costly it gets to enhance transparency further.
Figure 3 summarizes the game described in Section 2.
11As the recent crisis has shown, there exists various ways to make it hard for investors to get aclear picture of the actual situation of a bank. Examples are disclosing only partial information or“hiding” the relevant pieces of information within a bulk of irrelevant gures.
10

10 11
Figure 3: Game Tree
wnw
deposit storage
1 V1L
v 1-v
V2H
q 1-q
v
10.5
1-v v
sH sH sL
w
sL
nw
0
p 1-p
wnw
0
p 1-p
wnw
Transparency decision:
Investment decision:
Withdrawing decision:
V2H V2
H V2H
wnw
deposit storage
1 V1L
v 1-v
V2H
q 1-q
v
10.5
1-v v
sHsH sHsH sLsL
w
sLsL
nw
0
p 1-p
wnw
0
p 1-p
wnw
Transparency decision:
Investment decision:
Withdrawing decision:
V2H V2
H V2H
3 The Game and Its Equilibria
As a reference point to the Perfect Bayesian Equilibrium to be derived for the game
according to gure 3, the rst-best allocation of the model is presented rst. A rst-
best allocation is characterized by the lack of inefficiencies arising, e.g., from incentive
problems or imperfect information. Hence, the representation of the model in the rst-
best world reduces to the project value distribution given in gure 2. The corresponding
rst-best allocation is presented in proposition 1.
Proposition 1 The rst-best allocation is characterized by (i) the investment in the
project takes place in t = 0 and (ii) the project is not liquidated in t = 1.
Not investing in the project as well as early liquidation of the project is inefficient.
Proof. By assumptions (2) and (3), the expected investment project value is always–
i.e., at any stage in the game–higher or equal than the payoff from the alternative
option.
The following sections derive the solution to the game as described by gure 3 tak-
ing into account imperfect information and the agents’ incentive compatible behavior.
11
12 13
The game has to be solved by backward induction. We start with the depositor’s with-
drawing decision in t = 1. Based on this result, we turn to the depositor’s investment
decision in t = 0. Finally, we analyze the optimal bank transparency decision.
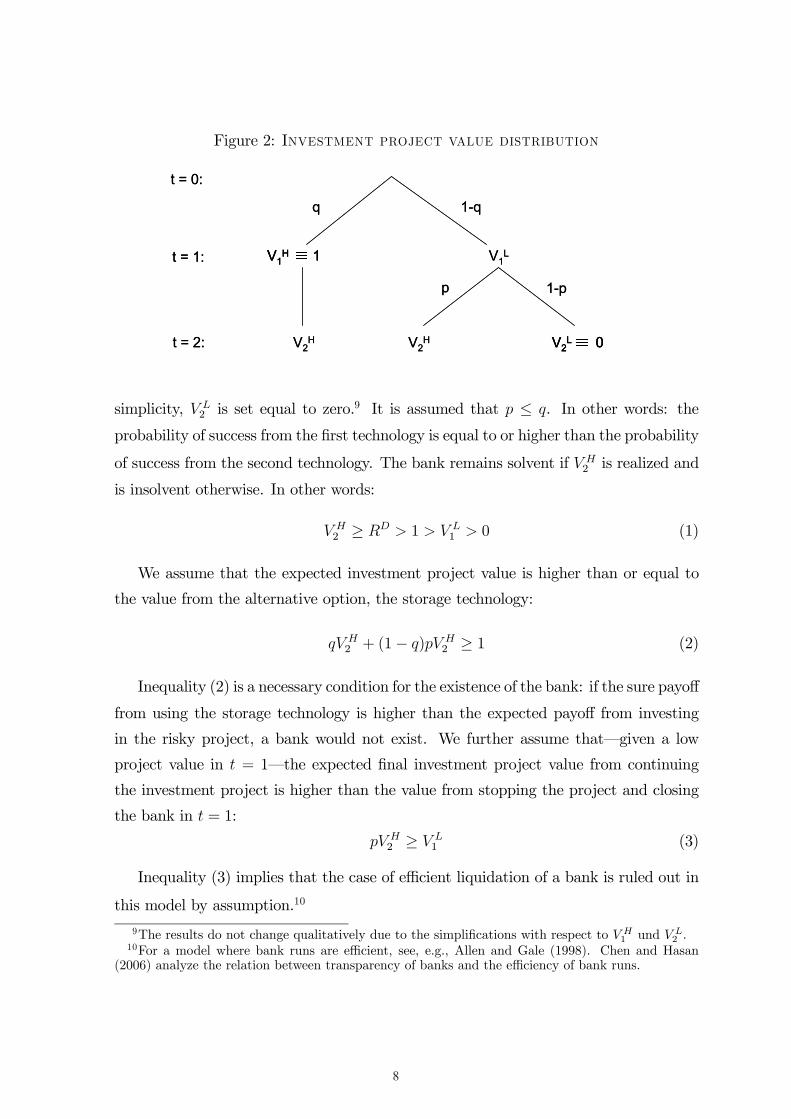
3.1 The Depositor’s Withdrawing Decision
After being hit by a shock in t = 1, the bank has to disclose information on its actual
situation. Based on this information–i.e., the signal si on the realization i of the
interim project value V1– the depositor has to decide whether to withdraw his funds
or to leave them in the bank. According to the two possible outcomes of the signal, we
distinguish between two cases.12
Case 1: If a low signal is observed in t = 1, the depositor withdraws if the expected
payoff from withdrawing
E£PD(w) | sL¤ = prob
£V L1 | sL
¤ · V L1 + prob
£V H1 | sL¤ · 1 (7)
=(1− q)v
(1− q)v + q(1− v)V L1 +
q(1− v)
(1− q)v + q(1− v)
is greater than or equal to the expected payoff from not withdrawing
E£PD(nw) | sL¤ = prob
£V L1 | sL
¤ · pRD + prob£V H1 | sL¤ ·RD (8)
=(1− q)v
(1− q)v + q(1− v)pRD +
q(1− v)
(1− q)v + q(1− v)·RD
Thus, the depositor withdraws in the case of a low signal if
(1− q)(V L1 − pRD)
q(RD − 1) ≥ 1− v
v(9)
Case 2: If a high signal is observed in t = 1, the depositor does not withdraw if the
expected payoff from not withdrawing
E£PD(nw) | sH¤ = prob
£V H1 | sH¤ ·RD + prob
£V L1 | sH
¤ · pRD (10)
=qv
qv + (1− q)(1− v)RD +
(1− q)(1− v)
qv + (1− q)(1− v)pRD
12The derivation of the conditional probabilities of the good and the bad state given a high or alow signal is presented in section 3.2.
12

12 13
is greater than or equal to the expected payoff from withdrawing
E£PD(w) | sH¤ = prob
£V H1 | sH¤ · 1 + prob
£V L1 | sH
¤ · V L1 (11)
=qv
qv + (1− q)(1− v)+
(1− q)(1− v)
qv + (1− q)(1− v)V L1
Thus, the depositor does not withdraw in the case of a high signal if
(1− q)(V L1 − pRD)
q(RD − 1) ≤ v
1− v(12)
In what follows, we assume that inequalities (9) and (12) hold, i.e., we assume
(1− v)
v≤ (1− q)(V L
1 − pRD)
q(RD − 1) ≤ v
(1− v)∀ v ∈ (0.5, 1] (13)
Under assumption (13), the depositor withdraws after receiving a low signal and
does not withdraw after receiving a high signal. This allows us to concentrate on those
cases where the information disclosed to the depositor–and therefore also the bank’s
transparency choice–has an inuence on the depositor’s decision to withdraw. In other
words: assumption (13) describes the conditions under which the signal transmits valu-
able information. If this assumption did not hold, the a priori information on expected
payoffs would completely dominate and the signal would be worthless. Inequality (13),
however, is only assumed to hold for v > 0.5. In the case of complete intransparency,
i.e., for v = 0.5, the signal does not contain any new information compared to the
information available in t = 0. Hence, the depositor will not withdraw provided that
investing in t = 0 has been preferred to using the storage technology (cf. Section 3.2).
The inequalities in assumption (13) relate transparency to the depositor’s payoff
distribution. The fraction in the middle relates (i) the depositor’s expected excess
payoff from withdrawing over not withdrawing in the bad state weighted by the (prior)
probability of being in the bad state (nominator) to (ii) the depositor’s expected excess
payoff from not withdrawing over withdrawing in the good state weighted by the (prior)
probability of being in the good state (denominator). Comparing these two weighted
expected excess payoffs can be interpreted as assessing the opportunity costs arising
from choosing the wrong action. The higher the precision of the signal, i.e., the higher
the transparency level v, the more these expected excess payoffs are allowed to differ
13

14 15
while still fullling condition (13): If–for example–the depositor receives a low signal
sL and is almost sure that a low interim project value V L1 has materialized–i.e., v
is almost 1–he will withdraw even if the prior information on the excess payoffs are
in favour of not withdrawing. Concretely, he will withdraw even if q(RD − 1)–theweighted expected excess payoff from not withdrawing over withdrawing in the good
state–is much higher than (1 − q)(V L1 − pRD)–the weighted expected excess payoff
from withdrawing over not withdrawing in the bad state.
Under condition (13), the depositor always withdraws when he observes a signal
indicating that the fundamentals of the bank are weak. Compared to the efficient
allocation as outlined in proposition 1, however, this solution is inefficient. The efficient
solution would only be achieved if either not withdrawing was the dominant strategy13
or the optimal bank transparency choice would always be complete intransparency
(i.e., v∗ = 0.5), independent of the bank’s risk prole. However, not withdrawing as a
dominant strategy is ruled out by assumption (13) and complete intransparency might
but does not necessarily have to be optimal (see section 3.3).
3.2 The Depositor’s Investment Decision
Based on the transparency level chosen and the interest rate offered by the bank in
t = 0, the depositor decides whether to invest his endowment of 1 in the bank or to
use the storage technology. The depositor invests in the bank if his expected payoff
from investing in the bank, E£PD¤, is greater than or equal to the payoff from storing,
where
E£PD¤= E
£PD | sH¤ · prob(sH) +E
£PD | sL¤ · prob(sL) (14)
The depositor’s expected payoff from investing, E£PD¤, is the sum of (i) his ex-
pected payoff given that a high signal is observed, E£PD | sH¤, weighted by the proba-
bility of observing a high signal, prob(sH), and (ii) his expected payoff given that a low
signal is observed, E£PD | sL¤, weighted by the probability of observing a low signal,
prob(sL). The probability of observing signal si is given by
prob(si) = prob(si | V i1 ) · prob(V i
1 ) + prob(si | V j1 ) · prob(V j
1 ) (15)
13I.e., if the depositor’s payoff distribution was such that even when receiving a bad signal, thedepositor decides not to withdraw.
14

14 15
Thus:
prob(sH) = qv + (1− q)(1− v) (16)
prob(sL) = (1− q)v + q(1− v) (17)
We next turn to the depositor’s expected payoffs conditional on the signal observed.
Under assumption (13), the depositor withdraws after observing a low signal and does
not withdraw after observing a high signal. The depositor’s expected payoff conditional
on observing sL (sH)–E£PD | sL¤ (E £PD | sH¤)–is thus the sum of (i) the payoff
from withdrawing (not withdrawing) in the bad (good) state weighted by the condi-
tional probability of being in the bad (good) state and (ii) the payoff from withdrawing
(not withdrawing) in the good (bad) state weighted by the conditional probability of
being in the good (bad) state:
E£PD | sL¤ = prob(V L
1 | sL) · V L1 + prob
¡1 | sL¢ · 1 (18)
E£PD | sH¤ = prob(1 | sH) ·RD + prob(V L
1 | sH) · pRD (19)
The conditional probabilities of the bad and good state, respectively, are given by
prob(V L1 | sL) =
prob(V L1 ∪ sL)
prob(sL)=
(1− q)v
(1− q)v + q(1− v)(20)
prob(V L1 | sH) =
prob(V L1 ∪ sH)
prob(sH)=
(1− q)(1− v)
qv + (1− q)(1− v)(21)
prob(1 | sL) =prob(1 ∪ sL)prob(sL)
=q(1− v)
(1− q)v + q(1− v)(22)
prob(1 | sH) =prob(1 ∪ sH)prob(sH)
=qv
qv + (1− q)(1− v)(23)
Taking equations (15) to (23) together yields
E£PD¤= qvRD + (1− q)(1− v)pRD + (1− q)vV L
1 + q(1− v) (24)
The depositor invests in the bank if the expected payoff from investing is greater
than or equal to the (sure) payoff from the storage technology, i.e., if
qvRD + (1− q)(1− v)pRD + (1− q)vV L1 + q(1− v) ≥ 1 (25)
15

16 17
or
RD ≥ 1− (1− q)vV L1 − q(1− v)
qv + (1− q)p(1− v)≡ RD
crit(v) (26)
RDcrit(v) (henceforth RD
crit) is the critical value for the deposit rate. It represents
the lower threshold for the deposit rate to which the depositor is indifferent between
investing in the bank and using the storage technology. In other words, inequality (26)
represents the depositor’s participation constraint. The level of RDcrit is a function of the
parameters describing the investment project value distribution–i.e., the bank’s risk
prole–and the transparency level chosen by the bank. As will be shown in section
3.4, this level is strictly decreasing with the project value distribution parameters.
Moreover, the critical deposit rate is also negatively related to the transparency level
v. The less transparent the bank, the more the bank has to pay to the depositor to
attract funding. Hence, while increasing transparency is costly as assumed in equation
(6), it also reduces a component in the bank’s overall cost function, namely the funding
costs.
Proposition 2 The critical value for the deposit rate, RDcrit, is strictly decreasing with
the transparency level v.
Proof. Differentiating the critical value for the deposit rate, RDcrit, with respect to
the transparency level v yields:
∂RDcrit
∂v=(1− q)
£p− q − (1− q)pV L
1
¤
[qv + (1− q)p(1− v)]2< 0 (27)
which is negative given that V L1 < 1 and p ≤ q by assumption. 14
3.3 The Optimal Decision on the Transparency Level
We next turn to the bank’s decision on the optimal transparency level v. The higher
the transparency level v, the higher the precision of the signal si on the realization i
of the interim investment project value V1. The bank chooses the level of transparency
14The assumption p ≤ q is a sufficient but not a necessary condition to ensure that the criticalvalue of the deposit rate RD
crit is decreasing with the transparency level v.
16

16 17
that maximizes its expected payoff, E£PB(v)
¤, subject to the depositor’s participation
constraint (inequality 26)15:
max E£PB(v)
¤= qv
¡V H2 −RD
¢(28)
+(1− q)(1− v)p¡V H2 −RD
¢
−c(v)
s.t. RD ≥ 1− (1− q)vV L1 − q(1− v)
qv + (1− q)p(1− v)(29)
The rst line in equation (28) describes the bank’s expected payoff in the good
state while the second line represents the bank’s expected payoff in the bad state. The
third line corresponds to the (direct) costs associated with the level of transparency as
characterized in equation (6).
Since the depositor’s participation constraint holds as an equality, it can be inserted
into the bank’s expected payoff function. Hence, the bank’s maximization problem can
be restated as:
max E£PB(v)
¤= qvV H
2 + (1− q)(1− v)pV H2 (30)
+(1− q)vV L1 + q(1− v)− 1
−c(v)
The corresponding rst-order condition (FOC) is given by:
∂E£PB(v)
¤∂v
= q(V H2 − 1)− (1− q)(pV H
2 − V L1 )− c0(v) (31)
The FOC relates the expected marginal project value of an additional unit of trans-
parency–the rst term in equation (31)–to the expected marginal costs–the last
two terms in equation (31). The expected marginal costs of an additional unit of
transparency consist of two components: The direct marginal costs–represented by
the last term in equation (31) and stemming from the transparency cost function as
characterized in equation (6)–and the indirect marginal costs.15Note that although the setup of the maximization problem corresponds to the one of a monopoly
bank, the result with respect to the optimal transparency level does not change if the banking sectorwas assumed to be competitive. As will be shown below, the solution to the bank’s maximizationproblem is identical to the socially optimal level of transparency. In other words: the market structurein this setup is irrelevant with respect to the solution for the optimal transparency level. It wouldonly affect the distribution of the surplus.
17

18 19
Proposition 3 If the expected marginal project value of an additional unit of trans-
parency is equal to or lower than the expected indirect marginal costs, i.e., if
q(V H2 − 1) ≤ (1− q)(pV H
2 − V L1 ) (32)
then the optimal level of transparency is v∗ = 0.5, i.e., complete intransparency.
If, however, the expected marginal project value of an additional unit of transparency is
greater than the expected indirect marginal costs–i.e., inequality (32) does not hold–an
interior solution exists for the optimal transparency level v∗.
Proof. If inequality (32) holds, the FOC in equation (31) is negative. Hence, the
optimal transparency level is the lowest possible one which corresponds to v∗ = 0.5,
the case of complete intransparency.
If, however, inequality (32) does not hold, the FOC becomes positive under complete
intransparency (v = 0.5):
∂E£PB(v)
¤∂v
(0.5) = q(V H2 − 1)− (1− q)(pV H
2 − V L1 ) > 0 (33)
It is thus no longer optimal to choose complete intransparency, but a certain positive
level of transparency. Complete transparency is, however, also not optimal as the
bank’s expected payoff function is concave:
∂2E£PB(v)
¤∂v2
= −c00(v) < 0 (34)
Hence: If inequality (32) does not hold, there exists an interior solution for the
transparency level v. The exact solution v∗ depends on the values for the parameters
describing the investment project value distribution.
Ignoring the direct costs for the moment, inequality (32) represents the trade-off
the bank faces with respect to the transparency level. Roughly speaking, both sides
of inequality (32) can be interpreted as opportunity costs of liquidating, either in the
good (left hand side) or in the bad (right hand side) state. The trade-off with respect
to transparency is best illustrated by the project value distribution tree (gure 2). The
left hand side of inequality (32), the expected marginal project value, corresponds to
the left branch of this tree. Precisely, it corresponds to the difference between the
18

18 19
project value from continuing and the project value from liquidating in the good state,
weighted by the probability of being in the good state. In the case of the good state, the
bank prefers transparency to intransparency. In other words, the bank wants the signal
to reect the correct state of the bank to prevent the depositor from withdrawing.
If the bad state has materialized, however, intransparency is preferred to trans-
parency to prevent an inefficient bank run. This preference is reected in the right
hand side of inequality (32) which corresponds to the right branch of the project value
distribution tree (gure 2). It is the difference between the project value from continu-
ing and the project value from liquidating in the bad state, weighted by the probability
of being in the bad state.
The higher the expected project value difference in the bad compared to the one
in the good state, the higher the opportunity costs of liquidating in the bad compared
to the ones in the good state, and therefore the lower the transparency level chosen
by the bank. In the case where the expected project value difference in the bad state
(right hand side of inequality (32)), is higher than the one in the good state (left hand
side of inequality (32)), the bank chooses complete intransparency, i.e., v∗ = 0.5. In
the opposite case, the bank chooses a positive level of transparency of which the exact
level depends on the direct costs as well as on the bank’s risk prole parameters.
Inequality (32) is more likely to be satised (i) the lower the probability q of a
high interim project value, (ii) the higher the probability p of achieving the high nal
project value despite a low interim value and (iii) the lower the value of the low interim
project value V L1 . The lower q and V L
1 are and the higher p is, the more dominant
the indirect marginal costs become compared to the marginal expected project value
of an additional unit of transparency, i.e., the more dominant the right hand side of
the project value distribution tree (gure 2) becomes.
So far, we have derived the optimal solution for the transparency level from the
bank’s point of view. However, calls for enhancing transparency in the banking sec-
tor are based on the assumption that banks are reluctant to disclose information to
investors and depositors and that bank transparency might therefore be too low com-
pared to its socially optimal level. Would social welfare be enhanced in this setup by
increasing the transparency level above the bank’s optimal solution?
Proposition 4 In this setup, deviating from the bank’s solution for the transparency
level is not socially optimal. Enhancing transparency above the level chosen by the bank
19

20 21
decreases social welfare.
Proof. The socially optimal transparency level v∗SW is the level that maximizes
expected social welfare:
max E[SW (v)] = qvV H2 + q(1− v) (35)
+(1− q)(1− v)pV H2 + (1− q)vV L
1
−c(v)
As the corresponding FOC
∂E [SW (v)]
∂v= q(V H
2 − 1)− (1− q)(pV H2 − V L
1 )− c0(v)
coincides with the FOC from the bank’s maximization problem (equation (31)), the
socially optimal transparency level v∗SW equals the bank’s optimal transparency level
v∗. Hence: deviating from the bank’s solution for the transparency level decreases
social welfare in this setup.
According to proposition 4, enhancing transparency above the bank’s solution for
the transparency level is not socially optimal in this setup.16
To summarize, enhancing transparency has the following three effects: On the posi-
tive side, enhancing the transparency level v decreases the probability of an (inefficient)
bank run in the case of a high signal (reected by the rst term in equation (31)). On
the negative side, however, an increase in the transparency level increases (i) the prob-
ability of an (inefficient) bank run in the case of a low signal (reected by the second
term in equation (31)) as well as (ii) the direct costs of transparency (reected by the
last term in equation (31)).
3.4 Comparative Statics Analysis
In what follows, we assume that inequality (32) does not hold. In other words, we
assume that the expected marginal project value of an additional unit of transparency
exceeds the latter’s expected indirect marginal costs. The aim here is to analyze how
the optimal solution for the transparency level v∗ and the critical value for the deposit
16Note that in this setup, many issues inherently linked to banking and transparency are ignored.Section 4 provides a discussion of some of these issues.
20

20 21
rate RDcrit vary with the parameters describing the bank’s risk prole.
17 In fact, both
variables are a function of these parameters. Both values vary with the probability q
of a high interim project value and the probability p of a high nal project value given
a low interim value.18
Proposition 5 If inequality (32) does not hold, the optimal transparency level v∗ is
strictly increasing in the probability q of a high interim project value and strictly de-
creasing in the probability p of a high nal project value given a low interim value has
materialized in t = 1.
Proof. Dene a function F (v∗, q) and a function G(v∗, p) such that
F (v∗, q) ≡∂E
hV2(v)
i
∂v= 0 (36)
and
G(v∗, p) ≡∂E
hV2(v)
i
∂v= 0 (37)
Taking the total differential of F (v∗, q) and G(v∗, p) yields:
∂F
∂vdv∗ +
∂F
∂qdq = 0 (38)
∂G
∂vdv∗ +
∂G
∂pdp = 0 (39)
or
dv∗
dq= −
∂F∂q
∂F∂v
(40)
dv∗
dp= −
∂G∂p
∂G∂v
(41)
According to equations (40) and (41), we obtain the inuence of a unit change in
q and p on the optimal transparency level v∗ by calculating the partial derivatives of
17If inequality (32) does not hold, the optimal transparency level is complete intransparency, re-gardless of the bank’s risk parameters.18In addition to the risk distribution parameters, the critical value for the deposit rate RD
crit is alsoa function of the transparency level v (see proposition 2).
21

22 23
the functions F (v∗, q) and G(v∗, p). We have
∂F
∂v= −c00(v) < 0 (42)
∂F
∂q= V H
2 − 1 + pV H2 − V L
1 > 0 (43)
where ∂F∂q
> 0 given that V L1 ≤ pV H
2 by assumption (3),
and∂G
∂v= −c00(v) < 0 (44)
∂G
∂p= −(1− q)V H
2 < 0 (45)
.Hence: an increase in the probability q of a high interim project value is associated
with an increase in the optimal transparency level v∗, i.e., dv∗dq
> 0. An increase in the
probability p of a high nal project value–given a low interim value has materialized
in t = 1–is, however, associated with a decrease in the optimal transparency level v∗,
i.e., dv∗dp
< 0.
Proposition 5 states that–for a sufficiently small level of the low interim project
value V L1 as is assumed in inequality (3)–the higher the probability q of a high in-
vestment project value in t = 1, the higher the optimal transparency level v∗ chosen
by the bank. The more likely it is that the bank will be in the good state in t = 1,
the more willing the bank shows in t = 0 to disclose the actual state in t = 1 in order
to avoid a run. The condition on the low interim project value V L1 (inequality (3)) is
a sufficient but not a necessary condition to assure that in t = 1, the expected payoff
from continuing is higher than the payoff from liquidating.19 If the low interim project
value is too high, then the probability q of a high interim project value does not play a
role anymore.
19The necessary condition to assure that ∂F∂q > 0 is:
1 + V L1 < V H
2 + pV H2
The left-hand side of the above inequality is the expected payoff from liquidating while the right-hand side corresponds to the expected payoff from continuing.
22

22 23
Proposition 5 also states that the higher the probability p of a high nal project
value–given a low interim value in t = 1–the lower the optimal transparency level v∗
the bank chooses. The higher this probability p, the higher the expected payoff from
continuing becomes compared to the payoff from liquidating in t = 1. Given that a
low interim return has materialized in t = 1, however, continuing becomes more likely
the lower the level of transparency.
Proposition 6 The critical value for the deposit rate, RDcrit, is strictly decreasing with
(i) the probability q of a high interim project value, and (ii) the probability p of a high
nal project value V H2 given a low interim value in t = 1.
Proof. Differentiating the critical value for the deposit rate, RDcrit, with respect to (i)
the probability q of a high interim project value, and (ii) the probability p of a high
nal project value V H2 given a low interim value in t = 1 yields:
∂RDcrit
∂q=
v£vV L
1 + p(1− v)− 1¤
[qv + (1− q)p(1− v)]2< 0 (46)
∂RDcrit
∂p=
(1− q)(1− v)£(1− q)vV L
1 + q(1− v)− 1¤
[qv + (1− q)p(1− v)]2< 0 (47)
which are both negative given that v ∈ [0.5, 1] and p ∈ [0, 1] by denition and V L1 < 1
by assumption.
Proposition 6 states that the critical value for the deposit rate is negatively related
to the probabilities of a high interim project value, q, and a high nal project value p
given a low interim value. The higher these probabilities, the higher the probability
that the bank will remain solvent and the depositor will actually receive the promised
repayment in t = 2, and therefore the lower the repayment the bank has to promise to
get the depositor investing in the bank.
4 Discussion
This section addresses robustness issues and possible extensions of the model presented
in the previous sections.
First, the result in our model is driven by the characteristics of the deposit contract.
The payoff scheme of the deposit contract prevents the implementation of the rst-best
23

24 25
solution. To minimize the probability of a bank run, the optimal solution in our model
is to allow for some degree of intransparency. However, inefficient bank runs could also
be ruled out by allowing for renegotiation. The bank could–in principle–renegotiate
the deposit contract in the case of a bad state at the interim stage by offering a higher
deposit rate. In other words, the bank could compensate the depositor for the risk from
leaving the deposit in the bank until the end of the game, despite the bank’s bad state
in the interim period. If this were possible, no run would occur in our model. However,
renegotiation is not observed in practice and we therefore think that a standard deposit
contract promising a xed return and no possibility for renegotiation is a reasonable
assumption.
Similarly, the bank could also offer a state-contingent deposit contract to avoid a
bank run. In other words, the bank could offer a deposit rate contingent on the state
of the bank at the interim period and the corresponding signal observed, respectively.
However, while there exist deposit rates indexed to variables reecting general economic
conditions, there are–to our knowledge–no deposit rates related to the future risk
prole of a bank.
Second, the model could also be extended to take into account–and assess the
impact of–other possibilities than avoiding or minimizing the probability of a bank
run to prevent the early liquidation of the investment project. For example, the bank
could be given the opportunity of raising money from central banks and interbank
markets in case a bank run occurs. Alternatively, the bank could buy an insurance in
advance which would guarantee liquidity in case of depositor withdrawals.20
Third, as already indicated in the introduction, our model is clearly biased towards
intransparency. Potentially benecial effects of transparency are ignored. A rst of
these potentially benecial effects is the role of transparency in disciplining banks.
By forcing banks to disclose relevant information to the market–so the intention of
various policy initiatives such as Pillar 3 of the new Basel Capital Accord–investors
may be able to discipline the banks’ risk taking behavior. In our model, this potentially
benecial role of transparency in disciplining banks is ruled out by assuming that the
bank’s risk prole is completely determined by exogenous factors. The bank in our
model cannot choose its risk level. While this might appear a very strong assumption
at rst, the recent turmoil in nancial markets showed that even banks that have
not been directly exposed to the troubled markets suffered from the overall loss of
20The author thanks an anonymous refree for raising these points.
24

24 25
condence. Thus, there are circumstances that are out of the control of the banks and
thus can affect also the most prudent institutions.
Another potentially benecial effect of transparency is related to the fact that bank
runs may also be efficient. On the one hand, bank runs may be efficient in that they
serve as a mean to discipline banks. On the other hand, the liquidation of an inefficient
bank also reduces the costs associated with an inefficient continuation of banks, e.g.,
costs due to the fact that banks have an incentive for gambling for resurrection when
they are in trouble. Enhancing transparency may increase the probability that efficient
bank runs indeed occur. Our model completely ignores the possibility of efficient bank
runs. Bank runs in this setup are inefficient by assumption.21
Lastly, transparency in our setup is dened in the sense that information is dis-
closed to the market. It is important to emphasize that we do not analyze the case of
information disclosed to the regulator. This is a further interesting topic to analyze.
5 Conclusion
This paper analyzes the optimal choice of a bank’s transparency level in a simple model
where the bank’s investment portfolio is completely exposed to exogenous risk factors.
Transparency is dened as the precision of a signal on the bank’s state at the interim
stage. At this interim stage, the bank might fall into a stress situation. Nevertheless,
the bank’s outlook is assumed to be favorable. We show that–in this setup–disclosing
transparent information on the interim state of a bank might be harmful. In our model,
enhancing transparency above a certain level may lead to the inefficient liquidation of
a bank. The reason for this inefficient liquidation lies in the the payoff scheme of a
standard deposit contract: this payoff scheme is limited above. Accordingly, depositors
do not take into account possible future upside gains of the bank when deciding if they
run the bank or not. Although assumed to be risk neutral, they act as if they were risk
averse. Allowing for some degree of intransparency–or in some cases even complete
intransparency–may keep depositors from running the bank and may thus avoid the
inefficient liquidation of the bank.
The optimal degree of transparency in this model is determined so as to maximize
the probability that the bank continues to operate until the end of the game. Given
that the bank is completely exposed to exogenous risk factors that materialize in either
21See Chen and Hasan (2006) for a model with both efficient and inefficient bank runs.
25

26 27
a good or a bad state at the interim stage, the bank faces a trade-off with respect to
the transparency level: while in the case of the good state, transparency is preferred
to intransparency, the contrary holds when the bad state occurs. In other words,
the optimal transparency level varies with the parameters describing the bank’s risk
prole. The higher the probability that the bank is in a good state at the interim
stage, the higher the optimal degree of transparency. However, the higher the bank’s
probability of remaining solvent in the end despite an unfavorable situation at the
interim stage, the lower the optimal transparency level for a given relation between
the probability of a good interim state and the (conditional) probability of remaining
solvent in the end. An increase in these two probabilities increases the expected payoff
from continuing compared to the expected payoff from liquidating the bank. The
“continuing” outcome becomes more likely with a high transparency level in the good
state and a low transparency level in the bad state at the interim stage.
Given the sometimes rather uncritical call for imposing transparency requirements
on banks and on other nancial institutions, this paper contributes to the discussion by
emphasizing possible drawbacks of such policy initiatives. In doing so, it questions the
unambiguous benecial role of transparency in banking and calls for a more balanced
discussion of this issue: "Transparency, like sunlight, needs to be looked at carefully."22
22The Economist, 2009.
26

26 27
References
[1] Allen, F. and D. Gale (1998). Optimal Financial Crises. Journal of Finance 53(3),
1245-1284.
[2] Blum, J.M. (2002). Subordinated debt, market discipline, and banks’ risk taking.
Journal of Banking & Finance 26(7), 1427-1441.
[3] Boot, A.W.A., and A. Schmeits (2000). Market Discipline and Incentive Prob-
lems in Conglomerate Firms with Applications to Banking. Journal of Financial
Intermediation 9(3), 240-273.
[4] Chen, Y. and I. Hasan (2006). The transparency of the banking system and the
efficiency of information-based bank runs. Journal of Financial Intermediation
15(3), 307-331.
[5] Chen, Y. and I. Hasan (2008). Why Do Bank Runs Look Like Panic? A New
Explanation. Journal of Money, Credit and Banking 40(2-3), 535-546.
[6] Cordella, T. and E. L. Yeyati (1998). Public Disclosure and Bank Failures. IMF
Staff Papers 45(1).
[7] De Grauwe, P. (2008). "Transparenz hilft nicht immer". Financial Times Deutsch-
land, July 11.
[8] Diamond, D.W., and P.H. Dybvig (1983). Bank runs, deposit insurance, and liq-
uidity. Journal of Political Economy 91(3), 401-419.
[9] Financial Stability Forum (2008). Report of the Financial Stability Forum on
Enhancing Market and Institutional Resilience, April.
[10] Furman, J. and J.E. Stiglitz (1998). Economic Crises: Evidence and Insights from
East Asia. Brookings Papers on Economic Activity 1998(2), 1-135.
[11] Healy, P.M. and K.G. Palepu (2001). Information asymmetry, corporate disclosure,
and the capital markets: A review of the empirical disclosure literature. Journal
of Accounting and Economics 31, 405-440.
27
28
[12] Hyytinen, A. and T. Takalo (2002). Enhancing Bank Transparency: A Re-
Assessment. European Finance Review 6(3), 429-445.
[13] Hyytinen, A. and T. Takalo (2004). Preventing Systemic Crises through Bank
Transparency. Economic Notes 33(2), 257-273.
[14] The Economist (2009). "Full disclosure", February 21.
[15] Verrecchia, R.E. (2001). Essays on disclosure. Journal of Accounting and Eco-
nomics 32, 97-180.
28

28
Swiss National Bank Working Papers published since 2004: 2004-1 Samuel Reynard: Financial Market Participation and the Apparent Instability of
Money Demand 2004-2 Urs W. Birchler and Diana Hancock: What Does the Yield on Subordinated Bank Debt Measure? 2005-1 Hasan Bakhshi, Hashmat Khan and Barbara Rudolf: The Phillips curve under state-dependent pricing 2005-2 Andreas M. Fischer: On the Inadequacy of Newswire Reports for Empirical Research on Foreign Exchange Interventions 2006-1 Andreas M. Fischer: Measuring Income Elasticity for Swiss Money Demand: What do the Cantons say about Financial Innovation? 2006-2 Charlotte Christiansen and Angelo Ranaldo: Realized Bond-Stock Correlation:
Macroeconomic Announcement Effects 2006-3 Martin Brown and Christian Zehnder: Credit Reporting, Relationship Banking, and Loan Repayment 2006-4 Hansjörg Lehmann and Michael Manz: The Exposure of Swiss Banks to
Macroeconomic Shocks – an Empirical Investigation 2006-5 Katrin Assenmacher-Wesche and Stefan Gerlach: Money Growth, Output Gaps and
Inflation at Low and High Frequency: Spectral Estimates for Switzerland 2006-6 Marlene Amstad and Andreas M. Fischer: Time-Varying Pass-Through from Import
Prices to Consumer Prices: Evidence from an Event Study with Real-Time Data 2006-7 Samuel Reynard: Money and the Great Disinflation 2006-8 Urs W. Birchler and Matteo Facchinetti: Can bank supervisors rely on market data?
A critical assessment from a Swiss perspective 2006-9 Petra Gerlach-Kristen: A Two-Pillar Phillips Curve for Switzerland 2006-10 Kevin J. Fox and Mathias Zurlinden: On Understanding Sources of Growth and
Output Gaps for Switzerland 2006-11 Angelo Ranaldo: Intraday Market Dynamics Around Public Information Arrivals 2007-1 Andreas M. Fischer, Gulzina Isakova and Ulan Termechikov: Do FX traders in
Bishkek have similar perceptions to their London colleagues? Survey evidence of market practitioners’ views

2007-2 Ibrahim Chowdhury and Andreas Schabert: Federal Reserve Policy viewed through a Money Supply Lens
2007-3 Angelo Ranaldo: Segmentation and Time-of-Day Patterns in Foreign Exchange
Markets 2007-4 Jürg M. Blum: Why ‘Basel II’ May Need a Leverage Ratio Restriction 2007-5 Samuel Reynard: Maintaining Low Inflation: Money, Interest Rates, and Policy
Stance 2007-6 Rina Rosenblatt-Wisch: Loss Aversion in Aggregate Macroeconomic Time Series 2007-7 Martin Brown, Maria Rueda Maurer, Tamara Pak and Nurlanbek Tynaev: Banking
Sector Reform and Interest Rates in Transition Economies: Bank-Level Evidence from Kyrgyzstan
2007-8 Hans-Jürg Büttler: An Orthogonal Polynomial Approach to Estimate the Term
Structure of Interest Rates 2007-9 Raphael Auer: The Colonial Origins Of Comparative Development: Comment.
A Solution to the Settler Mortality Debate
2007-10 Franziska Bignasca and Enzo Rossi: Applying the Hirose-Kamada filter to Swiss data: Output gap and exchange rate pass-through estimates
2007-11 Angelo Ranaldo and Enzo Rossi: The reaction of asset markets to Swiss National
Bank communication 2007-12 Lukas Burkhard and Andreas M. Fischer: Communicating Policy Options at the Zero
Bound 2007-13 Katrin Assenmacher-Wesche, Stefan Gerlach, and Toshitaka Sekine: Monetary
Factors and Inflation in Japan 2007-14 Jean-Marc Natal and Nicolas Stoffels: Globalization, markups and the natural rate
of interest 2007-15 Martin Brown, Tullio Jappelli and Marco Pagano: Information Sharing and Credit:
Firm-Level Evidence from Transition Countries 2007-16 Andreas M. Fischer, Matthias Lutz and Manuel Wälti: Who Prices Locally? Survey
Evidence of Swiss Exporters 2007-17 Angelo Ranaldo and Paul Söderlind: Safe Haven Currencies

2008-1 Martin Brown and Christian Zehnder: The Emergence of Information Sharing in Credit Markets
2008-2 Yvan Lengwiler and Carlos Lenz: Intelligible Factors for the Yield Curve 2008-3 Katrin Assenmacher-Wesche and M. Hashem Pesaran: Forecasting the Swiss
Economy Using VECX* Models: An Exercise in Forecast Combination Across Models and Observation Windows
2008-4 Maria Clara Rueda Maurer: Foreign bank entry, institutional development and
credit access: firm-level evidence from 22 transition countries 2008-5 Marlene Amstad and Andreas M. Fischer: Are Weekly Inflation Forecasts
Informative? 2008-6 Raphael Auer and Thomas Chaney: Cost Pass Through in a Competitive Model of
Pricing-to-Market 2008-7 Martin Brown, Armin Falk and Ernst Fehr: Competition and Relational Contracts:
The Role of Unemployment as a Disciplinary Device 2008-8 Raphael Auer: The Colonial and Geographic Origins of Comparative Development 2008-9 Andreas M. Fischer and Angelo Ranaldo: Does FOMC News Increase Global FX
Trading? 2008-10 Charlotte Christiansen and Angelo Ranaldo: Extreme Coexceedances in New EU
Member States’ Stock Markets
2008-11 Barbara Rudolf and Mathias Zurlinden: Measuring capital stocks and capital services in Switzerland
2008-12 Philip Sauré: How to Use Industrial Policy to Sustain Trade Agreements 2008-13 Thomas Bolli and Mathias Zurlinden: Measuring growth of labour quality and the
quality-adjusted unemployment rate in Switzerland 2008-14 Samuel Reynard: What Drives the Swiss Franc? 2008-15 Daniel Kaufmann: Price-Setting Behaviour in Switzerland – Evidence from CPI
Micro Data
2008-16 Katrin Assenmacher-Wesche and Stefan Gerlach: Financial Structure and the Impact of Monetary Policy on Asset Prices
2008-17 Ernst Fehr, Martin Brown and Christian Zehnder: On Reputation: A
Microfoundation of Contract Enforcement and Price Rigidity

2008-18 Raphael Auer and Andreas M. Fischer: The Effect of Low-Wage Import Competition on U.S. Inflationary Pressure
2008-19 Christian Beer, Steven Ongena and Marcel Peter: Borrowing in Foreign Currency:
Austrian Households as Carry Traders
2009-1 Thomas Bolli and Mathias Zurlinden: Measurement of labor quality growth caused by unobservable characteristics
2009-2 Martin Brown, Steven Ongena and Pinar Ye,sin: Foreign Currency Borrowing by
Small Firms 2009-3 Matteo Bonato, Massimiliano Caporin and Angelo Ranaldo: Forecasting realized
(co)variances with a block structure Wishart autoregressive model 2009-4 Paul Söderlind: Inflation Risk Premia and Survey Evidence on Macroeconomic
Uncertainty 2009-5 Christian Hott: Explaining House Price Fluctuations 2009-6 Sarah M. Lein and Eva Köberl: Capacity Utilisation, Constraints and Price
Adjustments under the Microscope 2009-7 Philipp Haene and Andy Sturm: Optimal Central Counterparty Risk Management 2009-8 Christian Hott: Banks and Real Estate Prices 2009-9 Terhi Jokipii and Alistair Milne: Bank Capital Buffer and Risk
Adjustment Decisions
2009-10 Philip Sauré: Bounded Love of Variety and Patterns of Trade 2009-11 Nicole Allenspach: Banking and Transparency: Is More Information
Always Better?

Swiss National Bank Working Papers are also available at www.snb.ch, section Publications/ResearchSubscriptions or individual issues can be ordered at Swiss National Bank, Fraumünsterstrasse 8, CH-8022 Zurich, fax +41 44 631 81 14, E-mail [email protected]